Embed Size (px)
Citation preview
J. Space Weather Space Clim. 2 (2012) A02 DOl: 1O.10511swscl2012003 © Owned by the authors, Published by EDP Sciences 2012
swsc
Near-earth solar wind flows and related geomagnetic activity during more than four solar cycles (1963-2011)
Ian G. Richardson'·2 .• , and Hilary V. Cane'
, Code 661, NASA/Goddard Space Flight Cooter, Greenbelt, Maryland 20771, USA ·corresponding author: e-mail: [email protected]
2 CRESST and Department of Astronomy, University of Maryland, College Park, Mary-land 20742, USA 3 School of Mathematics and Physics, University of Tasmania, Hobart, Tasmania, Australia
Received 27 February 2012 / Accepted 29 April 2012
ABSTRACT
h past studies, we classified the near-Earth solar wind into three basic flow types based on inspection of solar wind plasma and magnetic field parameters in the OMNI database and additional data (e.g., geomagnetic indices, energetic particle, and cosmic ray observations). These flow types are: (1) High-speed streams associated with coronal holes at the Sun, (2) Slow, ioterstream solar wind, and (3) Transient flows originating with coronal mass ejections at the Sun, including interplanetary coronal mass ejections and the associated upstream shocks and post-shock regions. The solar wind classification in these previous studies commenced with observations in 1972. In the present study, as well as updating this classification to the end of 2011, we have extended the classification back to 1963, the beginning of near-Earth solar wind observations, thereby encompassing the complete solar cycles 20 to 23 and the ascending phase of cycle 24. We discuss the cycle-to-cycle variations in near-Earth solar wind structures and l1e related geomagnetic activity over more than four solar cycles, updating some of the results of our earlier studies.
Key words. Stream - Solar cycle - Interplanetary Coronal Mass Ejection (CME) - Interplanetary medium
1. Introduction
In past studies (Richardson et aL 2000, 2001 , 2002; Richardson 2006), we divided the near-Earth solar wind since 1972 into three basic flow types in order to assess, for example, the contribution of each type of solar wind flow to long-tenn (> .... olar rotation) averages of geomagnetic indices and the intetplanetary magnetic field, and to detennine the structures driving geomagnetic stonns. The three flow types are:
• Corotating high-speed streams, typically with solar ~d speed v> -450 kIn s-', that originate in coronal holes at the Sun (Krieger et aL 1973; Zirker 1977). The properties of corotating high-speed streams near 1 AU were summarized by Belcher & Davis (1971) and include the formation of a region of compressed plasma, the "corotating interaction region" (CIR), at the leading edge of the stream as it interacts with the preceding slower, cooler, and denser solar wind. Since the source coronal holes may persist for longer than a solar rotation, a given stream may recur at the solar rotation period (-27 days as viewed from Earth).
• Slower, interstream solar wind, typically associated with the streamer belt at the Sun (e.g., Feldman et aL 1981 ); and
• Transient flows originating with coronal mass ejections (CMEs) at the Sun, including intetplanetary coronal mass ejections (lCMEs), the manifestations in the solar wind of CMEs, and the associated upstream shocks and postshock/sheath regions (see Zurbuchen & Richardson 2006 and references therein for discussion of the in-situ Signatures ofiCMEs). We collectively term these "CME-associated" flows.
In recent years, solar wind composition/charge state observations have been used to make a similar classification of flows during solar cycle 23 (Zhao et al. 2009). Unfurtunately, such observations are not generally available for earlier cycles, so other data have to be used. In om studies, the solar wind flow classification is based on inspection of a variety of data These include I-hour averages of near-Earth solar wind parameters obtained from the OMNI2 (formally OMNI) database (http:// omni"eb.gsfc.nasa.govi; King & Papitashvili 2005). The OMNI2 data extend back to 27 November 1963 and are compiled from observations made by various near-Earth spacecraft that have been carefully intercalibrated. OMNI2 data coverage is variable, with significant gaps in the early data, as will be discussed further below, and from 1983 until late 1994, when solar wind observations were predominantly made by IMP 8, which only spent part of each orbit of the Earth outside the Earth's bow shock. The ICME identifications made in om previous studies (e.g., Richardson & Cane 1993; Richardson & Cane 1995; Richardson et al. 1997; Cane & Richardson 2003; Richardson & Cane 2010) have been incOtporated into the solar wind classification. However, because the data required to separate ICMEs from their upstream "sheaths" are not consistently available, in particular in near-Earth observations prior to solar cycle 23, we do not differentiate between these structures when classitying solar wind flows, referring to them collectively as "CME-associated" flows as noted above.
Geomagnetic activity data are also examined since activity may be enhanced during the passage of ICMEs and associated flows (e.g., Burlaga et aL 1981; Wilson 1987, 1998; Tsurutani et al. 1988; Gosling et al. 1991; Tsurutani & Gonzalez 1997;
This is an Open Access article distributed under the terms of creative Commons Attribution-Noncommercial License 3.0
J. Space Weath ... Space Clim. 2 (2012) A02
Richardson et al. 2001 ; Zhang et a1. 2007; Echer et aJ. 2008; Richardson & Cane 2010, 2011a, and references therein), and also during the J'&'S3ge of high-speed streams past the Earth (e.g., Sheeley et a1. 1976, 1977; Richardson 2006; Richardson et a1. 2006; Tsurutani et a1. 2006, and references therein). Examples will be illustrated below. Increased geomagnetic aetivity is associated with enhaneements in the )"Component of the solar wind convective electric field E ~ - V x B, i.e., Ey - VB" where B, is the southward magnetic field component:, which leads to enhanced reconnection between solar wind and magnetospberic magnetic fields and enhanced energy deposition into the magnetosphere (e.g., Dungey 1961; Tsurutani & Gonzalez 1997; O'Brien & McPherrun 2000; Ji et al. 2010, and references therein). In the case of CME-""",ciated flows, the southward magnetic fields may be in the ICME and/or the upstream sheath formed between the ICME and associatlld shock (e.g., Tsurutani et a1. 1988; Huuunen& Koskinen 2004; Zhang et a1. 2007). In high-speed streams, intennittent intervals of southward fields associatlld with Alfveruc ftuctuations moving out fiom the Sun resuh in geomagnetic aetivity that may persist for several days during passage of a stream past the Earth, and recur at the solar rotation period (e.g. , Sheeley et al. 1976, 1977: Burlaga & Lopping 1977; Tsurutani & Gonzalez 1987; Tsurutani et a1. 2(06). Such activity can help to indicate the presence of streams when no solar wind speed observations are available. In addition, geomagnetic stonn sudden commencements (SSCs) can help to identifY the passage of interplanetary shocks at the Earth (Gold 1955), which may be generated ahead of fast ICMEs or CIRs, with the caveat that not all SSCs are caused by shocks (e.g., Gosling et al. 1967; Chao & Lepping 1974; Wang et al. 2006).
Energetic (-D. 1- 100 MeV) particle observations (principally made by Goddard Space Flight Center instruments on various near-Earth spacecraft) are also considered since these can help to indicate the passage of shocks and ICMEs. Solarparticle event intensity time profiles often peak around shock passage, especially at lower eneIgies, and then may fall abroptly as the ICME arrives a few hours after shock passage (e.g., SandelSOn et al. 1990; Cane & Lario 2006; Klecker et al. 2006, and references therein), Modulations in the galactic cosmic ray intensity (i.e., "Forbush decreases"; Forbush 1937) can help to identifY the passage of shocks and ICMEs (e.g., Barnden I 973a, 1973b; Cane et a1. 1993, 1996; Cane 2000; Richardson & Cane 2011b, and references therein) and also corotating streams (Simpson et a1. 1955; Iucci et a1. 1979; Richardson et a1. 1996; Simpson 1998; Richardson 2004, and references therein). We have used cosmic ray observations flum neutron monitors and also fiom spacecmft, in particular the coonting mte of the anti-coincidence gnard of the Goddanl instrument on [MP 8 (e.g., Cane 1993; Richardson et a1. [999). In summary, by combining these various data sets, we have been able to make a reasonably complete classification of the solar wind structures at Earth even when the solar wind data are not always complete.
Since these earlier studies, we have continued to update the solar wind How classification to near-present This has proved to be particularly valuable for studies of the magoetospheric and ionospheric response to differeot types of solar wind structures (e.g., Emery et a1. 2009, 2011 ; Turner et a1. 2009) and is available at the CEDAR workshop web site (bttp '/cedarweb.hao. ucar.edulwiki/index.php,Tools_and_Models:Solar_ Wind_ Structures). We bave also recently extended the solar wind classification fiom 1972 back to 1963. This will be discussed in the next section, and examples of obselVations from this period will be illustrated. We then discuss the solar cycle variation in solar
wind parameters and structures from 1963 to 2011. Section 4 summarizes the results of the paper.
2. Extension of the solar wind classIfIcation back to 19631solar cycle 20
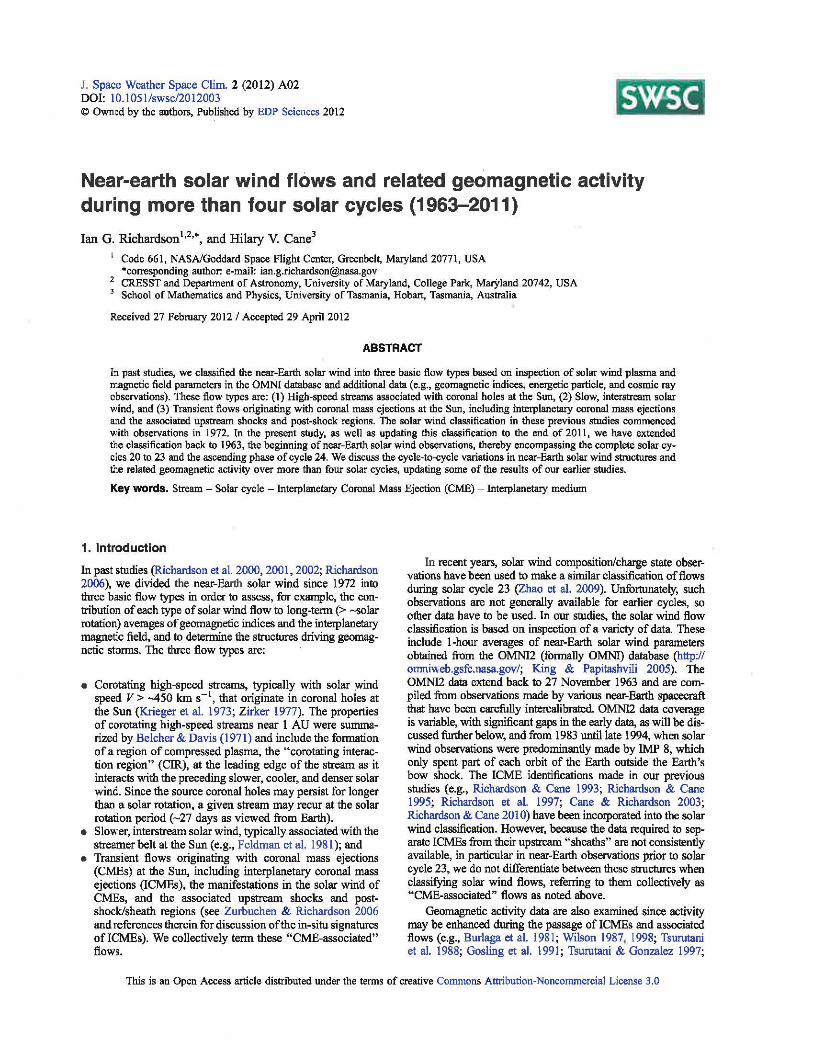
As noted above, solar wind observations incorpomted into the OMNI2 database are available back to 1963 but our previous studies did not consider the period before 1972, when the observations become more complete (at least until 1983). Since these earlier observations encompass sunspot cycle 20, the weakest cycle so far during the space era, and with cycle 24 also expected to be a relatively weak cycle (e.g., http:// www.swpc.noaa.goY·SolarCycl .. ·SC24Iindex.html). we have extended the solar wind flow classification back from 1972 to the beginning of in-situ observations. Figure 1 shows the OMNI2 data covemge each year during 1963-1973 for various solar wind parameters together with the sunspot number, showing solar cycle 20. Data covemge varied greatly during this period and with solar wind parameter. While improving with time until 1967-1968, when coverage was comparable to post-I972 levels, there was a decline in 1969--1971, in particular in the availability of plasma density and temperature observations. Sunspot maximum in cycle 20 occurred in March 1969. Thus, more comprehensive solar wind observations are available in the -2 years before solar maximum than in the similar period following maximum. .
As discussed above. to help inferthe stnlctures present when limited or no solar wind observations are available, we used geomagnetic data (e.g., the aa, Mayaud 1972; Kp, Menvielle & Berthelier 1991; and Dst, Sugiura 1964, indices), energetic particle data (in particular fiom Goddard instnunents on various spacecraft, e.g., Van Hollebeke et a1. 1974 show observations
li; 14(J .0 120 E " 100 z 80 '0 60 Co
" 40 c
" 20
'" 0
90 • B
80
"" ~ 70 " '" i 60
0 50 t)
S 4(J ., C
'" 30 Z ::; 20 0
10
0 1964 t966 1968 1970 1972
Fig. 1. OMNI2 data coverage in 1963-1973 for the interplanetary magnetic field intensity (8), solar wind speed (V), density (n), and proton temperature (1). The top panel shows the SUruipot number, including solar cycle 20.
A02·02

I.G. Richardson and H.V. Cane: Near-earth solar wind flows and related geomagnetic activity
3C
§: 2C
m 1C
0
~ -II<: ,,, m . 0
~ 105
I- 104
i 00 20 10
1,; 0 500
~ ,",0 000 'S 200
,oa
~ 50
0 ec
~ 60
, " ~
20 0
~ -5C ~ -1eo ~ -150
4700 ~ 4600 Z 4500
~ 4400 4300 4200
• ij 2
2 , In
20 26 , 10 20 , D~ J" F.b
'963 1964
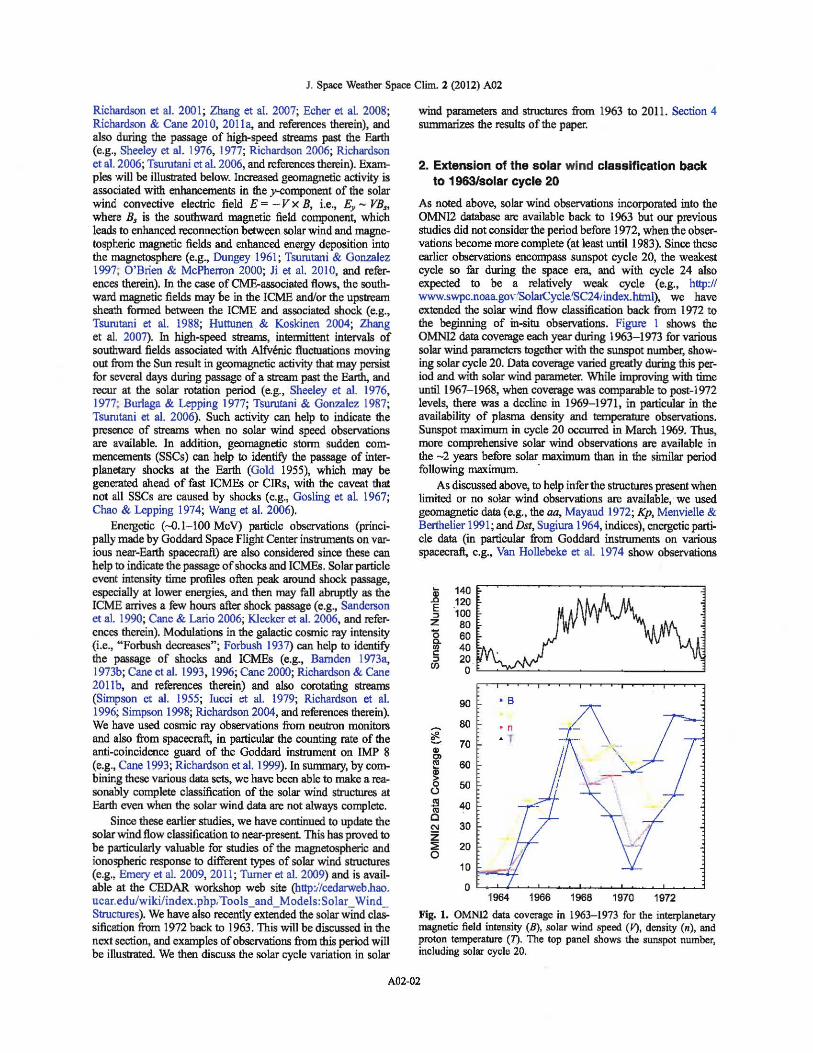
Fig. 2. OMNI2 solar wind parameters, geomagnetic indices, and neutron monitor data for a two solar rotation period in December 1963-February 1964. The panels show: the magnetic field intensity and polar and azimuthal angles (GSE coordinates), solar wind proton temperature (not available for this period), and expected temperature (red graph; see Richardson & Cane 1995 for further details), density, and speed, the geomagnetic aa, Kp x 10, and Dst indices, the Thule neutron monitor counting rate (pressure-corrected) and our assessment of the solar wind structure type, indicated at the beginning of the structure interval, where 2 is a high-speed stream, 3 is slow solar wind, ar.d 0 indicates that the structure type is unclear. Gray shading indicates a series of corotating high-speed streams. Vertical green lines indicate times of SSCs, typically associated during this interval with CIRs.
in 1967-1972 from IMPs 4 and 5) and neutron monitor data. Figure 2 shows an example of OMNI2 solar wind magnetic field and plasma observations (from IMP I) during a 54-day (-2 solar rotation) interval in November 1963-Febmary 1964, close to the beginning of near-Earth solar wind monitoring. Geomagnetic indices (00, Kp x 10, Dst) aod neutron monitor data (from the Thule neutron monitor, http://neutronm.barto1.ude1.edul) are also shown. The bottom panel indicates our assessment of the start times of each type of solar wind flow, where 0 = unclear, 1 =
CME-associated, 2 ~ corotating high-speed stream, and 3 ~ slow solar wind. During this period, observations were fairly complete though no proton temperature (Tp) data are avallable. Gray shaded regions indicate probable corotating streams that, in this case, formed a four stream/four magnetic sector/rotation configuration. (Note that the magnetic field reverses in each successive stream, where qJ B ..... 1350 indicates outward spiral magnetic fields, and 'PB - 135°, Suoward spiral fields, in GSE coordinates.) Corotating interaction regions, indicated by
30
~ 20
in 10
.B' ~o
,,, m
+
;Z 10' ;:!' 10'
;[ 30 20
< 10 0
1; 600 '00 E '00
~ 300
'00 iO'
i 50
0 BO
~ 60 , 40 ~ 20 ~ 0
0
~ ·50 ·'00
~ .,5O • 0 ·200
~ 4250 Z 4200 ~ 4150
~ 4100 4050
• 3
~ 2 In
28 3 11 13 17 19 21 23
Jao Fob
1969
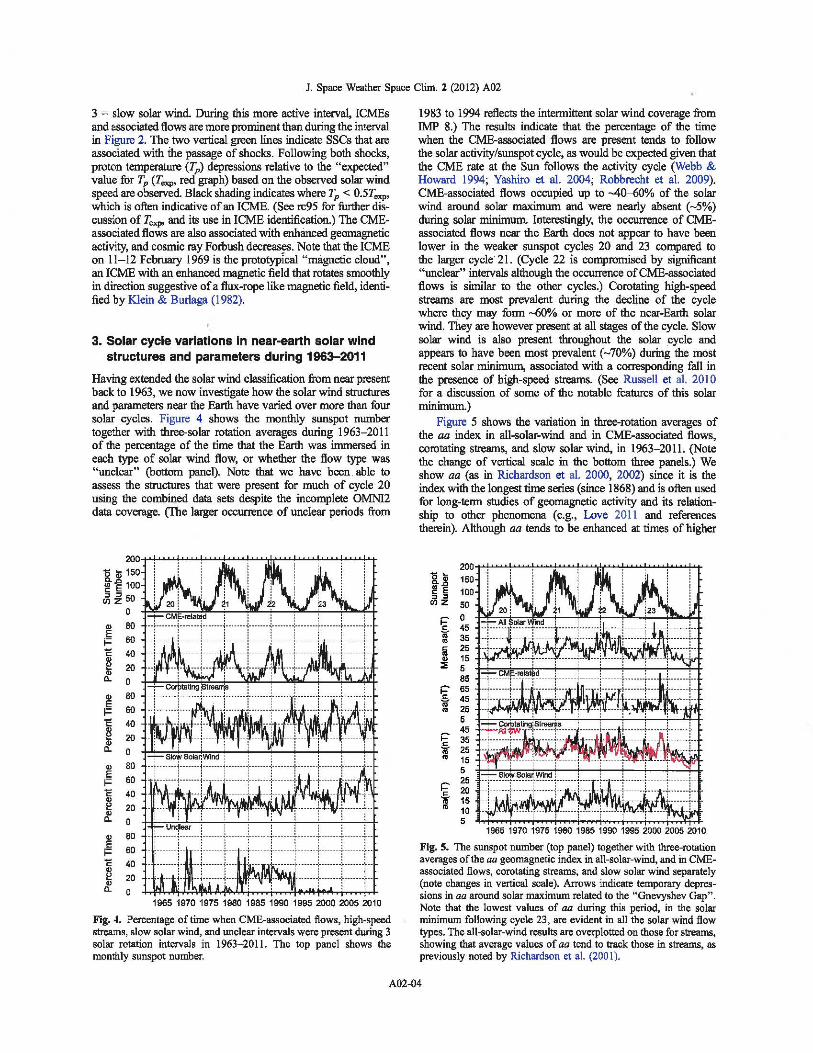
Fig. 3. Observations in a similar fonnat to Figure 2 for a solar rotation period in January-February 1969 (sunspot number = 121). In the bottom panel, 1 = the start of a CME-associated interval.
enhancements in the magnetic field strength and density, encompass the stream leadiog edges. Unshaded regions are predominantly slow solar wind. No CME-associated flows appear to have been present in this intelVal, near solar minimum (sunspot number for January 1964 was 15.3). Note that solar wind speeds in several of the indicated streams are unusually low compared to the usual criterion for a "highwspeed" stream. For example, the observations suggest that the first stream indicated in Figure 2 apparently barely attalned 400 Ian s -I. Nevertheless, the pattern of slower and faster solar wind flows can still be discerned.
Figure 2 also illustrates how geomagnetic activity tends to be enhanced during the passage of high-speed streams, with the highest levels occurring in the vicinity of the CIRs, as is typical (e.g., Tsurutani et al. 2006). As noted above, such observations can help to indicate the presence of high-speed streams when limited solar wind observations are available. Similarly, the cosmic ray intensity may decrease during passage of a stream (Richardson 2004 and references therein) and provide another indication of the presence of a stream, though such decreases are not parti~u1arly clear in the fluctuating Thule data in Figure 2.
Figure 3 shows OMNI2, geomagnetic and cosmic my obserVatiODS during a solar rotation interval in January-February 1969 (sunspot number ~ 121), near solar maximum, in a similar fonnat to Figure 2. The bottom panels again show the estimated start times of each type of solar wind strocture where I ~ CMEassociated flows; 2 = corotating high-speed streams; and
AD2-p3
1. Space Weather Space Clim. 2 (2012) A02
3 ~ slow solar wind. During this more active interval, ICMEs and associated flows are more prominent than during the interval in Figure 2. The two vertical green lines indicate SSCs that are associated with 1he passage of shocks. Following both shocks, proton temperature (Tp) depressions relative to the "expected" value for Tp (T,,,,,, red graph) based on the observed solar wind speed are observed. Black shading indicates where Tp < O.ST exp'
which is often indicative of an ICME. (See rc95 for further discussion of Texp. and its use in ICME identification.) The CMEassociated flows are also associated with enhanced geomagnetic activity, and cosmic ray Forbush decreases. Note that the ICME on 11-12 February 1969 is the prototypical "magnetic cloud", an ICME with an enhanced magnetic field that rotates smoothly in dL",ction suggestive ofa flux-rope like magnetic field, identified by Klein & Burlaga (1982).
3. Solar cycle variations in near-earth solar wind structures and parameters during 1963-2011
Having extended the solar wind classification from near present back to 1963, we now investigate how the solar wind structures and parameters near the Earth have varied over more than four solar cycles. Figure 4 shows the monthly sunspot number toge'.her with three-solar ro1ation averages during 1963-2011 of the percen1age of the time that the Earth was immersed in each type of solar wind flow, or whether the flow type was "unclear" (bottom panel). Note that we have been able to assess the structures that were present for much of cycle 20 using the combined da1a sets despite the incomplete OMNI2 dam coverage. (The larger occurrence of unclear periods from
200
8. ~ 150 ~ ~ 100
~~50 0
m 80 E
80 ;::
" 40 ~ 20 m a. 0
m 80 E
80 ;::
" 40
~ 20 m a. 0
• 80 E
60 ;::
" 40 ~ 20 • a. 0
• 80 E
60 ;::
" • 40
~ 20 a. 0
------~ -- ----~ ------~ ------r ------i--
M'\,. 1111'1 ',' , .... -----~ ------t-------r-------~--------+------i-----+-
1965 1970 1975 1980 1985 1990 1995200020052010
Fig. 4. Percentage of time when CME-associated flows, high-speed streams, slow solar wind, and unclear intervals were present during 3 solar rotation intervals in 1963-2011. The top panel shows the monthly sunspot number.
1983 to 1994 reflects the intermittent solar wind coverage from IMP 8.) The results indicate that the percen1age of the time when the CME-associated flows are present tends to follow the solar activity/sunspot cycle, as would be expected given that the CME rate at the Sun follows the activity cycle (Webb & Howard 1994; Yashiro et aI. 2004; Robbrecht et aJ. 2009). CME-associated flows occupied up to -,!()...{j()% of the solar wind around solar maximum and were nearly absent (-5%) dming solar minimum. Interestingly, the occurrence of CMEassociated flows near the Earth does not appear to have been lower in the weaker sunspot cycles 20 and 23 compared to the larger cycle 21. (Cycle 22 is compromised by sigoificant "unclear" intervals although the occurrence of CME-associated flows is similar to the other cycles.) Coro1ating high-speed streams are most prevalent during the decline of the cycle where they may fonn --60% or more of the near-Earth solar wiud. They are however present at all s1ages of the cycle. Slow solar wind is also present throughout the solar cycle and appears to have been most prevalent (-70%) during the most recent solar minimum, associated with a corresponding fall in the presence of high-speed streams. (See Russell et aJ. 2010 for a discussion of some of the notable features of this solar minimum.)
Figure 5 shows the variation in three-rotation averages of the aa index in all-solar-wiud and in CME-associated flows, coro1aring streams, and slow solar wind, in 1 %3-20 11. (Note the change of vertical scale in the bottom three panels.) We show aa (as in Richardson et aI. 2000, 2002) since it is the index with the longest time series (since 1868) and is often used fur long-tean studies of geomagnetic activity and its relationship to other phenomena (e.g., Love 2011 and references therein). Although aa tends to be enhanced at times of higher
200 i~ 150 ~~ 100 , , <J)Z 50
I=' 0 E- 45 • 35 • 0 25 • 15 • '" 5
85 I=' 65 E- 45 • 25 •
5 45
I=' 35 % 25 • 15
5
I=' 25 20
% 15 • 10 5
1965 1970 1975 1980 1985 1990 1995 2000 2005 2010
Fig. S. The sunspot number (top panel) together with furee-rotation averages of the aa geomagnetic index in all-solar-wind, and in CMEassociated flows, corotating streams, and slow solar wind separately (note changes in vertical scale). Arrows indicate temporary depressions in aa around solar maximwn related to the "Gnevyshev Gap". Note that the lowest values of aa during this period, in the solar minimum following cycle 23, are evident in all the solar wind flow types. The all-solar-wind results are overplotted on fuose for streams, showing that average values of aa tend to track those in streams, as previously noted by Richardson et a1. (200 I),
A02-04
I.G. Richardson and H.Y. Cane: Near-earth solar wind flows and related geomagnetic activity
solar activity, note also the temponuy decreases around solar maximum indicated by arrows, such that some of the lowest levels of geomagnetic activity actually occur close to solar maximum. These features (and others to be discussed below) may be related to the lack of energetic solar phenomena near solar maximum, tenned the "Gnevyshev Gap" by Feminella & Storini 1997 who associate this with the temporary decrease in solar indices often found near sunspot maximum discussed by Gnevyshev (1967) and Gnevyshev (1977). (yVe note though that Kane 2005 has argued that the dip in aa in the Gnevyshev Gap does not strictly follow those in solar indices.) For a recent intelJlret.ation of the Gnevyshev Gap in terms of solar dynamo modelir.g, see Norton & Gallagher (2010).
Another notable feature in Figure 5 is the unusually low values of aa (at least since 1963), in the recent extended minimum following cycle 23 (see also Tsurutani et aJ. 2011 ). These low values are evident in the averages for each solar wind flow type suggesting that they are pervasive throughout the solar wind. The all-solar-wind aa graph is overplotted in red on the stream-associated graph, illustrating how average values of aa tend to track those associated with streams, as previously noted by Richardson et al. (2002). However, average values fall below those in streams in the recent minimum because of the prominent contribution of weak activity in slow solar wind, as illustrated in Figure 6 which shows the contribution of each flow type to the three-rotation aa averages, including the unusually high HiO%) contribution from slow solar wind in 2009 right at solar minimum. Figure 6 also shows the CME-associated flo." contribution to aa that follows the solar activity cycle, and the stream-associated contribution that is most prominent during the declining phase/minimum. Another notable feature is that during the late declining phase of cycle 23, an increase in the '.::ontribution from CME-associated flows occurred in 2004-2006 together with a reduction in the stream-associated contribution that does not appear to have a counterpart in previous cycles.
100 .. 80 .. E 60 " ~ 40 " a. 20
C .. 80 .. E 60 ~ 40 " a. 20
C .. 80 .. E 60
~ 40
" 20 a. C .. 80 ..
E 60 " ~ 40 " a. 20
rclea~
. , ... : .. :. ·:·~~l:~ ~~~~, :~~ .: .. :.: :.::~: :.: ::: :~~:~~l: ~:~~~ t~ :.:.j:: 0
1965197019751980198519901995200020052010
Fig. 6. Percentage of three-rotation averages of aa contributed by each solar wind flow type and by intervals of "unclear" flows.
Previous studies (e.g., Crooker et al. 1977; Crooker & Gringanz 1993) have suggested that aa - V-B .. where B .. the strength of the southward magnetic field componen~ is in tum limited by the magnetic field strength. Figure 7 examines variations in the solar and interplanetary magnetic field strengths and aa during cycles 2()-24. The top panel shows Carrington-rotation averages of the mean solar magnetic field ("Sun as a star") measured by the Wilcox Solar Observatory since 1974. The mean solar field is dominated by the line-of-sight component of photospheric fields within -O.5R, of disk center, and daily measurements show positive and negative (outward and inward) oscillations that are well correlated with the direction of the IMF at Earth aIler allowing for the solar wind transit time to I AU (Scherrer et al. 1977). The root mean square of the daily measured fields is shown here. The second panel shows three-rotation averages of the aa geomagnetic index, while the bottom four panels show the interplanetary magnetic field intensity from 1964 to 2011, in all-solar-wind, CME-related solar wind, corotating high-speed streams, and slow solar wind; the all-solarwind average is overplotted in red in the lower panels. Cycles 21-23 show variations in the solar and interplanetary magnetic fields and the aa index that tend to follow the sunspot cycle. Clear structures that appear in each data set illustrate the close association between solar and interplanetary magnetic fields, and geomagnetic activity. Note in particular the ternponuy
12C~=m~~tR.~~~~~~~~~~~T
90
60 - -- ----- -_.-
30
o ,. 25
15
5
9
7
5
3 1. 12 10 8 6
• 2
9
7
5
3
8
7
5
3
: ~!~Olar Wind
II "~ .
1965 1970 1975 1980 1985 1990 1995 2000 2005 2010
Fig. 7. Carrington-rotation (RMS) averages of the solar "Sun as a star" magnetic field observed by the WilCQx Solar Observatory together with three-rotation averages of the aa geomagnetic index, the interplanetary magnetic field strength in all-solar-wind flows (repeated in red in the lower three panels), and the field strength in CME-associated flows, corotating streams, and slow solar wind. Arrows indicate temporary depressions in all these parnmeters near solar maximum related to the "Gneveshev Gap". .
A02-p5
J. Space Weather Space Clim. 2 (2012) A02
decreases in solar and interplanrouy fields and geomagnetic activity around solar maximum in these cycles, indicated by arrows, in the Gnevyshev Gaps. As has been previously noted (e.g., Hedgecock 1975), cycle 20 did not show a clear increase in th, interplanetary magnetic field intensity (there are no Wil· cox solar magnetic field observations for comparison), and the magnetic fields are relatively weak in all·solar·wind regions. The generally lower values of aa during cycle 20 than in later cycles are also consistent with a weaker IMF.
The unusually low values of geomagnetic activity (fsurutani el al. 2011 ) and magnetic field strength (Smith & Balogh 2008; Connick et al. 2011) in the recent solar minimum are evident in Figure 7 and are observed in both slow solar wind and corotating streams. Field strengths within the few CME-associated flows observed in 200~20 I 0 are also weaker than those found during much of the period in Figure 7, indicating that the weaker fields durir.g this minimum were manifested in both transient and quasi'Slatioruuy solar wind flows. Both the recent minimum and cycle 20 confurm to the pattern previously discussed by Richardson el al. (2000, 2002) in that the mean all·solar·wind [MF field strength closely tracks the mean fields foond in streams and slow solar wind. Our interpret.tion of this pattern, and of the remarkably similar variations in the solar and inter· planetmy magnetic fields, is that the variations in the average lMF intensity are closely related to solar magnetic field varia· tions, and are predominantly manifested in the background, non-transient solar wind. In particular, we emphasize that average fields at I AU, even during higher solar activity levels, are not dominated by the contribution of magnetic fields in transients that pass the observing spacecraft - the solar cycle vanation is essentially unchanged if the average field intensity is calculated using only the slow solar wind and stream intervals.
la 11.0
~ 10.0
9.0
'" o ao ~
"
Cycle 20:: cc · 0.121
'.0 ,!-=:::;:=':;;;-~-;"._*_J 1965-.
Percent Tme CME-Assoclawd Flows
12.0 Cycle 22: IX:" 0.647
11.0 Y .";;......,,...., 1995- • 10.0 -:::--;;-
;:- . ?"x.~ S- 9.0 v~-· . '" 0 . ...---::....-----"' m ~~90- • 0 . • =y-
" ,~
• .0 0 20 40 60 .. Percent Time CME·Assoc1ated Flows
[t has been suggesred, however (Owens & Crooker, 2006), that the solar cycle increases in the lMF strength arise fium closed field lines that are carried oUI by [CMEs to several AUs and are then opened by interchange reconnection. These field lines then arid to the open magnetic flux in the heliosphere, and contribute to (and cannot he distinguished fium) the background solar wind outside of the individual [CMEs thaI pass an observing spacecraft near the Earth. This model, using SOHOILASCO CME rates (http:/'cdaw.gsfc.nasa.gov/CME_list!) as input and a charactetistic time scale for reconnection of 50 days, can account for·the observed variation in the lMF during solar cycle 23 fitirly suc· cessfully. Unfortunately, there are no comparable CME observations to test the model for previous solar cycles, but we suggest thatthe occurrence ofCME-associated flows might provide a reasonable proxy fur the CME rate.
As noted above, the solar cycle variation in the IMF was much weaker in cycle 20 than in cycles 21-23. One possibility to account for this o~ation is that the CME rate was considerably lower in cycle 20 than in later cycles. However, the results in Figure .\ indicate that CMEs and associated flows were observed for similar frnctions of time near the Earth duro ing cycle 20 as in later cycles. This suggests that the CME rate was probably not substantially lower in cycle 20 but rather may have heen comparable to that in later cycles.
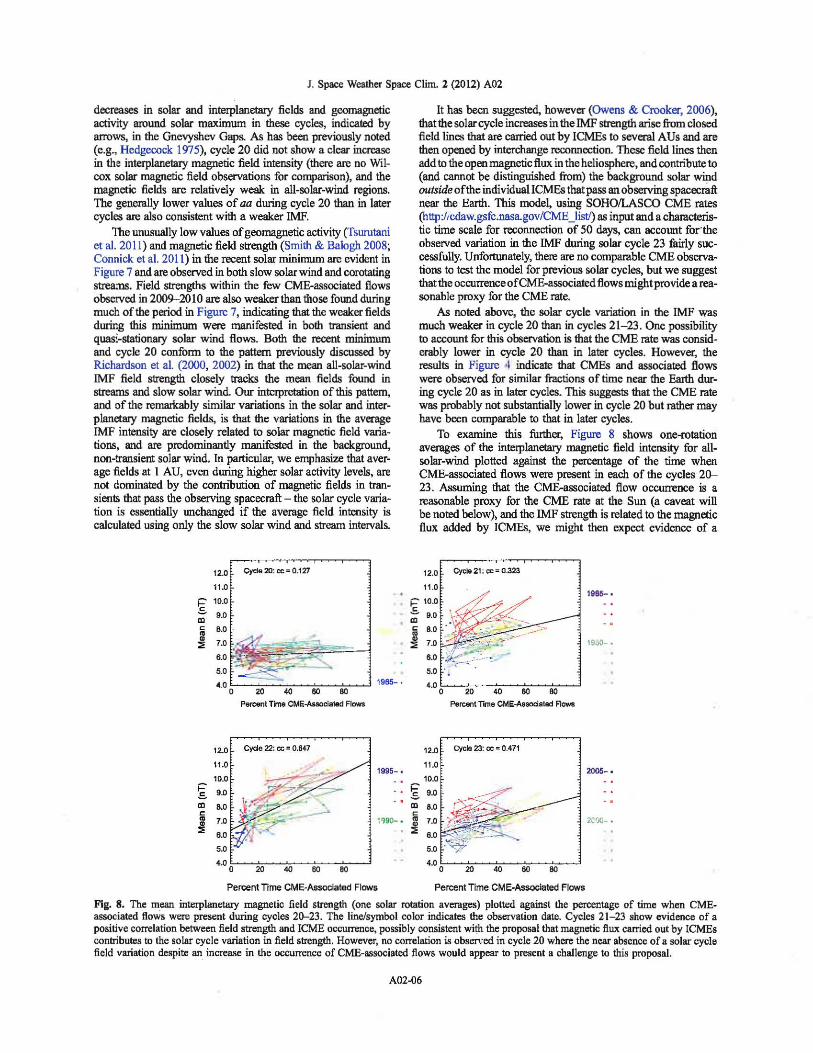
To examine this further. Figure 8 shows one-rotatiori averages of the interplanetary magnetic field intensity for all· solar-wind plotted ageins! the pen:entage of the time when CME-associated flows were present in each of the cycles 20-23. Assuming that the C~ociated flow occurrence is a reasonable proxy for the CME rate al the Sun (a caveat will be noted below), and the lMF strength is related to the magnetic flux added by [CMEs, we might then expect evidence of a
1~85- •
19..,0- •
'.0 '.0 !----,:;;----;;;---;;;-*--'
Percent TIme CME-Associstad Flows
12.0 Cycls 23: CO" 0.471
11.0 200S- •
10.0 ;:-
9.0 S-
'" 0 • 2C'XJ- • o
" 5.0
'.0 0 20 .. 60 80
Percent Time CME-Associated Flows
F'ta. 8. The mean interplanetary magnetic field strength (one solar rotation averages) plotted against the percentage of time when CMEassociated flows were present during cycles 20-23. The line/symbol color indicates the observation date. Cycles 21-23 show evidence of a positive correlation between field strength and ICME occurrence, possibly consistent with the proposal that magnetic flux carried out by ICMEs contributes to tbe solar cycle variation in field strength. However, no correlation is observed in cycle 20 where the near absence of a solar cycle field variation despite an increase in the occurrence of CME-associated flows would appear to present a challenge to this proposal.
AD2·06
LG. Richardson and H.V. ClPle: Near-earth solar wind flows and related geomagnetic activity
positive correlation betwreD the IMF strength and the CM£. associated llow occurrence in each cycle, similar to that found between IMF intensity and LASCO CME rate in cycle 23 by Owens et aI. (2008)(cf. their Fig. I). The color of the line/symbol m each panel in Figure 8 indicates the time of observation. While there is a genernl increase in IMF intensity for increasing CME-associated flow occurrence in cycles 21-23 which may support the Owens & Crooker (2006) model, the distribution of points for cycle 20 is relatively flat because there was little increase in the IMF strength, despite 1he increase in the occur· rence of CME-associated flows, as solar activity levels increased. This observation would appear to pose a challenge to the Owens & Crooker (2006) model.
One possibility is that the ICMEs in cycle 20 carried substantially less magnetic flux than in later cycles. The mean field in CME-associated flows (which include sheath regions as well as ICMEs) was indeed weaker (7.9 nT) during the maximum of cycle 20 compared with 9.1 nT in cycle 21, 10.\ nT in cycle 22, and 8.8 nT in cycle 23, but the difference seems too small to accOlmt for the near absence of a solar cycle field variation in cycle 20. The ICMEs might have had smaller volumes on average, and hence carried less magnetic flux, but presumably this would also have reduced the amount of time when CME-associated flows were presen~ which was not observed. A smaller rec?Mection time constant would contnbute to a smaller mag. nebc cycle (Owens & Crooker 2006), though it is not clear wby this should be a feature only of cycle 20.
A caveat to the results in Figure 8 is that it has been noted that the ICME rate at the Earth during cycle 23 did not track th~ CME rate at the Sun accurately (Riley et aI. 2006), so likeWIse, the occurrence of CME-associated flows during cycle 20 ' may also not fully reflect variations in the CME rate. On the other band, when the CME and ICME rates diverged in cycle 23, the CME rate actually rose more rapidly than the ICME rate. Hence, it is possible that the CME rate in cycle 20 similarly may have mcreased even more rapidly than is indicated by the CMEassociated flow occurrence at I AU, in which case the absence of the solar cycle variation in the IMF intensity is even more puzzling. Thus, in summary, we suggest that the observed increase in the occurrence of near-Earth CME-associated flows during cycle 20, indicative of an increase in the CME rate at the Sun, together with the weak increase in the interplanetary magnetic field strength during this cycle, may pose a challenge to Owens & Crooker (2006) proposal that solar cycle variations in the strength of the interplanetary magnetic field are associated with magnetic flux carried out by ICMEs.
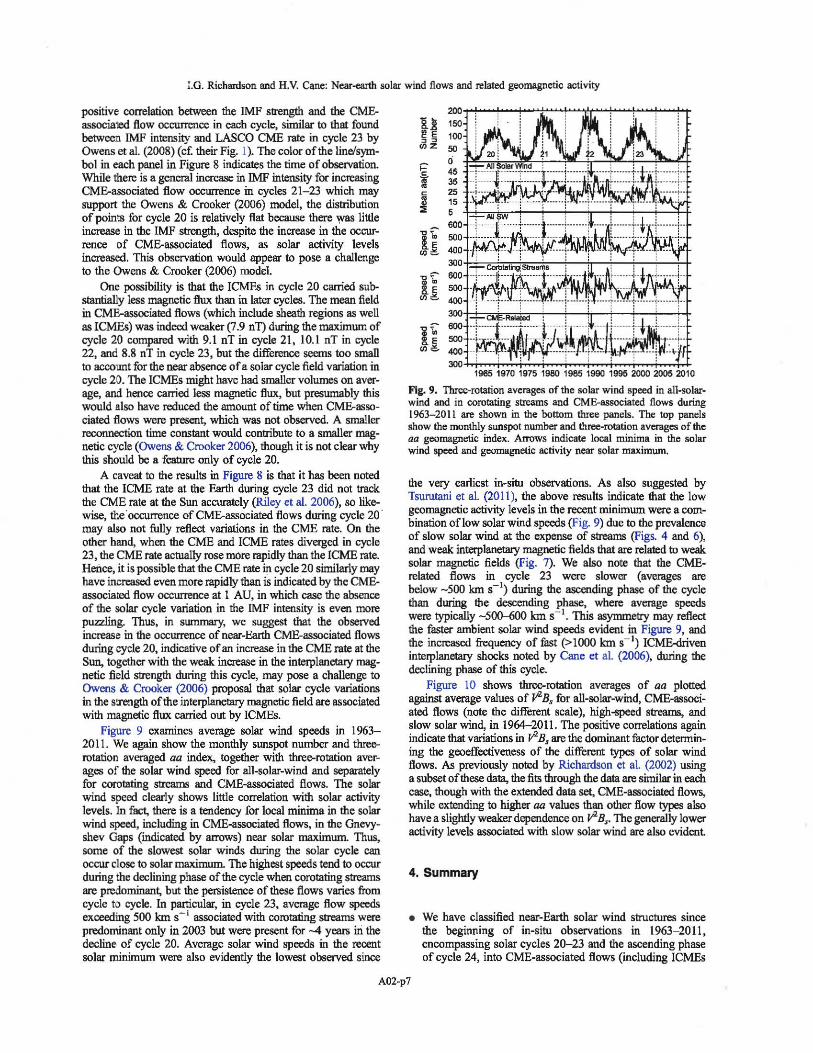
Figure 9 examines average solar wind speeds in 1963-20 II. We again show the monthly sunspot number and threerotation averaged aa index, together with three-rotation aver· ages of the solar wind speed for all-solar-wind and separately for corotating streams and CME-associated flows. The solar wind speed clearly sbows little correlation with solar activity levels. In f~ there is a tendency for local minima in the solar wind speed, including in CME-associated flows, in the Gnevyshev Gaps (mdicated by arrows) near solar maximum. Thus, some of the slowest solar winds during the solar cycle can occur close to solar maximum. The highest speeds teud to occur during the declining phase of the cycle when corotating streams are predominan~ but the persistence of these flows varies from cycle to cycle. In particular, in cycle 23, average flow speeds exceeding 500 kIn s - 1 associated with oorotating streams were predominant only in 2003 but were present for -4 years in the dechne of cycle 20. Average solar wind speeds in the recent solar minimum were also evidently the lowest observed since
200
1" 150 ~f 100 , , "'z 50
'" ri
% 4.
• 35 c 2.
~ 15 5
l~ 600 500
"''' 400 300
n 600 500
400 300
l~ 600 500
"'" 400
~~~~~~~~~~--~~ 1965 1970 1975 1980 1985 1990 1995 2000 2005 2010
Fie:. 9. Three-rotation averages of the solar wind speed in all-solarwind and in corotating streams and CME-associated flows during 1963-20 II are shown in the bottom three panels. 1be top panels show the monthly sunspot number and three-rotation averages of the aageomagnetic index. Arrows indicate local minima in the solar wind speed and geomagnetic activity near solar rnaximwn.
the very. earliest in-situ obselVations. As also suggested by Tsurutaru et aI. (20 11), the above results indicate that the low geomagnetic activity levels in the recent minimum were a com· bination of low solar wind speeds (Fig. 9) due to the prevalence of slow solar wind at the expense of streams (Figs. 4 and 6), and weak interplanetary magnetic fields that are related to weak solar magnetic fields (Fig. 7). We also note that the CMErelated flows in cycle 23 were slower (.verages are below -500 Ian s-') during the ascending phase of the cycle than during the deseending phase, where average speeds were typically -5~ Ian s- '. This asymmetry may reflect the faster ambient solar wind speeds evident in Figure 9 and the increased treqoeney of fast (>\000 Ian s- ') ICME-<!rlven intelJllanetary shocks noted by Cane et aL (2006), during the declining phase of this cycle.
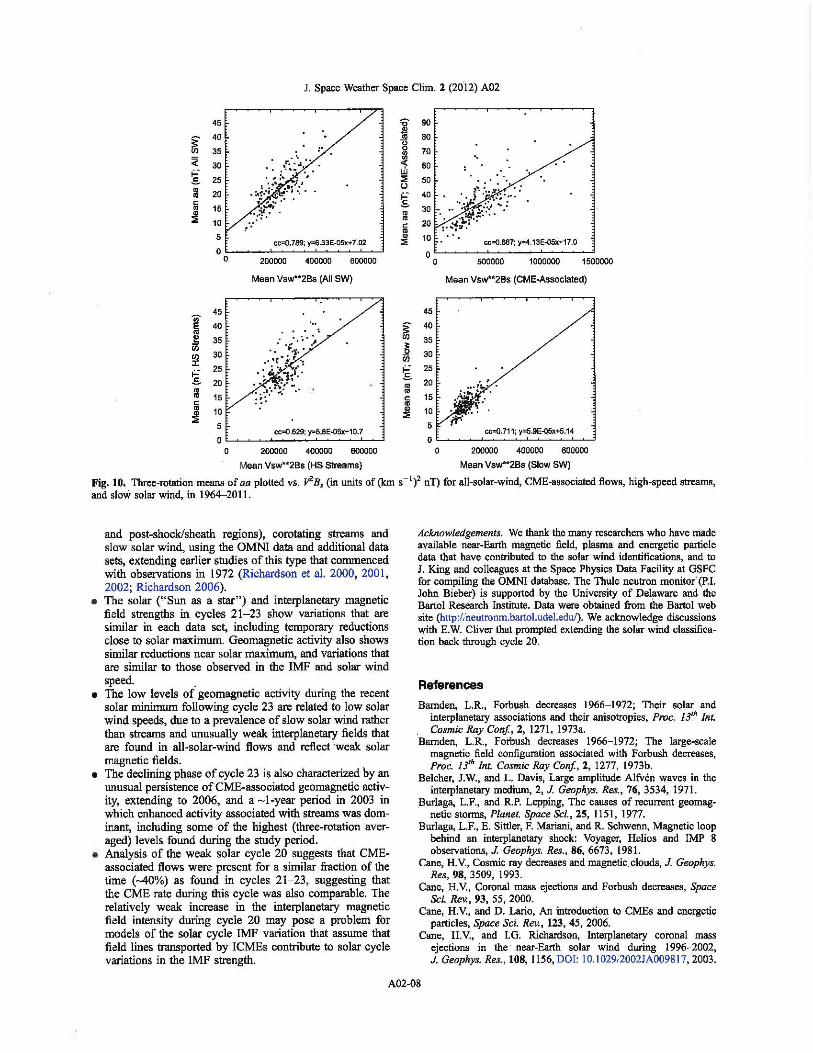
Figure \0 shows three-rotarion averages of aa plotted agamst average values of V'B, for all-solar-wind, CME-associated flows (note the different scale), high~eed streams, and slow solar wind, in 1964-2011. The positive correlations again indicate that variations in V2 Bs are the dominant factor detennin· ing the geoeffectiveness of the different types of solar wind flows. As previously noted by Richardson et a!. (2002) using a subset of these dati, the fits through the data are similar in each case, though with the extended data s1a, CME-associated flows while extending to higher aa values than other flow types a~ have a slightly weaker dependence on V' Br The generally lower activity levels associated with slow solar wind are also evident
4. Summary
• We have classified near-Earth solar wind structures since the beginning of in-situ observations in 1963- 2011 encompassing solar cycles 20-23 and the ascending phas~ of cycle 24, into CME-associated flows (including ICMEs
A02-p7
J. Space Weather Space Clim. 2 (2012) A02
45
- 40 ~ 35
30
~ 25
20
15
10
5
, . cc::O.769; y=6.33E-05x+7.02
°0~----2~00~0-00--~40~0-00-0~-6-0~00-0~0~
30
25
~ 20
15
10
5
Mean Vsw**2Bs (All SW)
' ..
cc=O.629; y=5.6E'()5x+10.7 OL-~~~~~~--~~~
o 200000 400000 600000
Mean Vsw"*2Bs (HS Streams)
10 cc=O.667: y=4.13E-05x+17.0 0L-----~----~~~
o 500000 1000000 1500000
Mean Vsw**2Bs (CME-Associated)
45
~ 40 35
~ en 30
~ 25 20
o 15
~ 10
5 cc=O.711: y=5.9E-oSx+5.14 0L-__ ~~~~~~~
o 200000 400000 600000
Mean Vsw**2Bs (Slow SW)
Fig. 10. Three-rotation means of aa plotted vs. y2 B~ (in units of (km s -linT) for all-solar-wind, CME-associated flows, high-speed streams, and slow solar wind, in 1964--2011.
and post-shock/sheath regions), corotating streams and slow solar wind, using the OMNI data and additional data sets, extending earlier studies of this type that commenced with observations in 1972 (Richardson et a!. 2000, 2001 , 2002; Richardson 2006).
• The solar ("Sun as a star") and interplanetary magnetic field strengths in cycles 21-23 show variations that are similar in each data set, including temporary reductions close to solar maximum. Geomagnetic activity also shows similar reductions near solar maximum, and variations that are similar to those observed in the IMF and solar wind speed.
• The low levels of geomagnetic activity during the recent solar minimum following cycle 23 are related to low solar wind speeds, due to a prevalence of slow solar wind mther than strearos and unusually weak interplanetary fields that are found in all·solar-wind flows and reflect 'weak solar magnetic fields.
• The declining phase of cycle 23 is also characterized by an unusual persistence of CME-associated geomagnetic activity, extending to 2006, and a -I-year period in 2003 in which enhanced activity associated with streams was dominant, including some of the highest (three-rotation averaged) levels found during the study period.
• Analysis of the weak solar cycle 20 suggests that CMEassociated flows were present for a similar fiaction of the time (-40%) as found in cycles 21-23, suggesting that the CME rate during this cycle was also comparable. The relatively weak increase in the interplanetary magnetic field intensity during cycle 20 may pose a problem for models of the solar cycle IMF variation that assume that field lines transported by ICMEs contribute to solar cycle variations in the IMF strength.
Acknowledgements. We thank the many researchers who have made available near-Earth magnetic field, plasma and energetic particle data that have contributed to the solar wind identifications, and to 1. King and colleagues at the Space Physics Data Facility at GSFC for compiling the OMNI database. The Thule neutron monitor' (p.1. John Bieber) i.s supported by the University of Delaware and the Bartol Research Institute. Data were obtained from the Bartol web site (http:/,·neutronm.bartol.ude1.edul). We acknowledge discussions with E.W. Cliver that.prompted extending the solar wind classification back through cycle 20.
References
Bamden, L.R., Forbush decreases 1966-1972; Their solar and interplanetary associations and their anisotropies, Proc. 13th Int. Cosmic RIly Con! , 2, 1271, 1973a.
Bamden, L.R., Forbush decreases 1966-1972; The large-scale magnetic field configuration associated with Forbush decreases, Proc. 13th Int. Cosmic RIly Con!, 2,1277, 1973b.
Belcher, J.W., and L. Davis, Large amplitude Alfven waves in the interplanetary medium, 2, J. Geophys. Res., 76, 3534, 1971.
Burlaga, L.F., and R.P. Lepping, The causes of recurrent geomagnetic stonns, Planet. Space SeL, 25, 1151, 1977.
Burlaga, L.F., E. Sittler, F. Mariani, and R. Schwenn, Magnetic loop behind an interplanetary shock: Voyager, Helios and IMP 8 observations,J. Geophys. Res., 86, 6673,1981.
Cane, H.V., Cosmic ray decreases and magnetic clouds, J. Geophys. Res, 98, 3509, 1993.
Cane, H.v" Coronal mass ejections and Forbush decreases, Space Sci. Rev., 93, 55, 2000.
Cane, H.V., and D. Lario, An introduction to CMEs and energetic particles, Space Sci. Rev., 123, 45, 2006.
Cane, H.V., and I.G. Richardson, Interplanetary coronal mass ejections in the near-Earth solar wind during 1996-2002, J. Geophys. Res., 108, 1156, DOl: 10.1029,2002JA009817, 2003.
A02-08
I.G. Richardson and H.V. Cane: Near-earth solar wind flows and related geomagnetic-activity
Cane, H.Y., I.G. Richardson, and T.T. von Rosenvinge, Cosmic ray decreases and particle acceleration in 1978-1982 and the associated solar wind structures, J. Geophys. Res., 98, 13295, 1993.
Cane, H.Y., I.G. Richardson, and T.T. von Rosenvinge, Cosmic ray decreases: 1964----1994, J. Geophys. Res., 101, 21561 , 1996.
Cane, EV., RA. Mewaldt, C.M.S. Cohen, and T.T. von Rosenvinge, Role of flares anc shocks in determining solar energetic particle abundances, J. Geophys. REs., 111, A06S90, DOl: 10.1029120021A009817, 2006.
Chao, J.K., and R.P. Lepping, A Correlative study of SSC's, interplanetary shocks, and solar activity, J. Geophys. Res., 79, 1799, 1974.
Connick, D.E., C.W. Smith, and N.A Schwadron, Interplanetary magnetic flux depletion during protracted solar minima, Astraphys. J., 727, 8, DOl: 10.1088/0004-637Xn27/l/8, 2011.
Crooke:", N.V., and K.1. Gringauz, On the low correlations between long-term averages of solar wind speed and geomagnetic activity after 1976, J. Geophys. Res., 98, 59, 1993.
Crooke:-, N.V., J. Feynman, and J.T. Gosling, On the high correlation betw~en long-term averages of solar wind speed and geomagnetic activity, J. Geophys. Res., 82, 1933, 1977.
Dungey, J.W., Interplanetary magnetic field and the auroral zones, Phys. Rev. Lett., 6, 47, 1961.
Beher, E., W.O. Gonzalez, B.T. Tsurutani, and AL.C. Gonzalez, Interplanetary conditions causing intense geomagnetic storms (Dst S, -100 nT) during ,olar cycle 23 (1996-2006), J. Geophys. Res., 113, A05221, 2008.
Emery, a.A, LG. Richardson, D.S. Evans, and F.J. Rich, Solar wind structure sources and periodicities of auroral electron power over three solar cycles, J. Atmosph. Solar-Terr. Phys., 71, 1157, DOl: IO.l0l6/j.j.'tp.2008.08.005 , 2009.
Emery, B.A., I.G. Richardson, D.S. Evans, F.J. Rich, and G.R. Wilson, Solar rotational periodicities and the semiannual variation in the solar wind, radiation belt, and aurora, Solar Phys., 274, 399, DOl: 10.\007/,"207-0"-9758-x, 2011.
Feminella, F., and M. Storini, Large scale dynamical phenomena during solar activity cycles, A&A, 322, 311, 1997.
Feldma:l, W.C., J.R. Asbridge, S.J. Barne, RE. Fenimore, and J.T. Gosl!ng, Origin of solar wind interstream flows: Near Equitorial coro;;al streamers, J. Geophys. Res., 86, 5408, 1981.
Forbus::, S.E., On the effects in the cosmic ray intensity observed during the recent magnetic storm, Phys. Rev., 51, 1108, 1937.
Gnevyshev, M.N., On the II-years cycle of solar activity, Sol. Phys., 1, 1('7, 1967.
Gnevystlev, M.N., Essential features of the 11 year solar cycle, Sol. Phys., 51, 175, 1977.
Gold, T., Discussion of shock waves and rarefied gases, in Gas Dynamics of Cosmic Clouds, North-Holland Publishing Co, Amsterdam, 193, 1955.
Gosling, J.T., J.R. Asbridge, S.J. Bame, AH. Hundhausen, and LB. Str01:g, Discontinuities in the solar wind associated with sudden geomagnetic impulses and sudden commencements, J. Geophys. Res., 72, 3357, 1967.
Gosling, J.T., D.J McComas, J.L. Phillips, and S.J. Bame, Geomagnetic activity associated with Earth passage of interplanetary shock disturbances and coronal mass ejections, 96, 7831, 1991.
Hedgec()ck, P.C., Measurements of the interplanetary magnetic field in reiation to the modulation of cosmic rays, Solar Phys., 42, 497, 197~
Huttunen, K., and H. Koskinen, Importance of post-shock streams and ~~eath region as drivers of intense magnetospheric storms and high-latitude activity, Ann. Geophys., 22, 1729, 2004.
lucci, N., M. Parisi, M. Storini, and G. Villoresi, High speed solar wind streams and galactic cosmic ray modulation, Nuovo Cimento, le, 421, 1979.
Ji, E.-Y., Y.-J. Moon, and K.-H. Kim, Statistical comparison of interplanetary conditions causing intense geomagnetic stonns (Dst S, -100 nT), J. Geophys. Res., 115, A10232, DOl: 10.1029;20091,1,015112. 2010.
Kane, R.P., Which one is the "Gnevyshev" gap? Solar Phys., 229, 387,2005 ..
King, J.H., and N.E. Papitashvili, Solar wind spatial scales in and comparisons of hourly wind and ACE plasma and field data, J. Geophys. Res., 110, 2104, 2005.
Klecker, B., H. Kunow, H.V. Cane, S. Dalla, B. Heber, et al., Energetic particle observations, Space Sci. Rev., 123, 217, 2006.
Klein, L. W., and L.F. Burlaga, Interplanetary magnetic clouds at 1 AU, J. Geophys. Res., 87, 613,1982.
Krieger, AS., AF. Timothy, and E.C. Roelof, A coronal hole and its identification as the source of a high velocity solar wind stream, Sol. Phys., 29, 505, 1973.
Love, J.J. , Long-term biases in geomagnetic K and aa indices, Ann. Geophys, 29, 1365, 2011.
Mayaud, P.N., The aa indices: A 100-year series characterising the geomagnetic activity, J. Geophys. Res., 77,6870, 1972.
Menvielle, M., and A Berthelier, The K-derived planetary indices: Description and availability, Rev. Geophys., 29, 415, DOl: 1O.102919IRG00994, 1991.
Norton, AA, and J.C. Gallagher, Solar-cycle characteristics examined in separate hemispheres: Phase, Gnevyshev gap, and length of minimum, Solar Phys., 261, 193,2010.
O'Brien, T.P., and R.L. McPherron, An empirical phase space analysis of ring current dynamics: Solar wind control of injection and decay, J. Geophys. Res., lOS, 7707, 2000.
Owens, M.J., and N.V. Crooker, Coronal mass ejections and magnetic flux buildup in the heliosphere, J. Geophys. Res., 111, A 10 104, DOl: 10.1 029/2006JAO 11641 , 2006.
Owens, M.J., N.V. Crooker, N.A. Schwadron, T.S. Horbury, S. Yashiro, et al., Conservation of open solar magnetic flux and the floor in the heliospheric magnetic field, Geophys. Res. Lett., 35, L20108, DOl: 1O.l029/2008GL035813 , 2008.
Richardson, I.G., Energetic particles and corotating interaction regions in the solar wind, Space Sci. Rev., 111, 267, 2004.
Richardson, IG., The formation ofCIRs at stream-stream interfaces and resultant geomagnetic activity. in Recurrent Magnetic Storms: Corotating Solar Wmd Streams, ed. B. T., Tsurutani et al, AG.U. Geophysical Monograph, 167,· 45 , 2006.
Richardson, IG., and H.V. Cane, Signatures of shock drivers in the solar wind and their dependence on the solar source location, J. Geophys. Res., 98, 15295,1993.
Richardson, I.G., and H.V. Cane, Regions of abnormally low proton temperature in the solar wind (1965-1991) and their association with ejecta, J. Geophys. Res., 100, 23397, 1995.
Richardson, IG., and H.V. Cane, Near-Earth interplanetary coronal mass ejections during solar cycle 23 (1996-2009): Catalog and summary of properties, Solar Phys., 264, 189,2010.
Richardson, I.G., and H.V. Cane, Geoeffectiveness (Dst and Kp) of interplanetary coronal mass ejections during 1995-2009 and implications for storm forecasting, Space Weather, 9, S07005, DOl: 1O.1029120IlSW000670, 2011 •.
Richardson, IG. , and H.Y. Cane, Galactic Cosmic Ray Intensity Response to Interplanetary Coronal Mass EjectionslMagnetic Clouds in 1995-2009, Solar Phys, 270, 609, DOl: 1O.1007/,1I207-011-9774-x, 2011b.
Richardson, I.G., G. Wibberenz, and H.Y. Cane, The relationship between recurring cosmic ray depressions and corotating solar wind streams at ::; 1 AV: iMP 8 and Helios I and 2 anticoincidence guard rate observations, J. Geophys. Res., 101, 13483, 1996.
Richardson, I.G., C.J. Farrugia, and H.Y. Cane, A statistical study of the behavior of the electron temperature in ejecta, J. Geophys. Res., 102,4691, 1997.
Richardson, I.G. , H.V. Cane, and G. Wibberenz, A 22-year dependence in the size of near-ecliptic corotating cosmic ray depressions during five solar minima, J. Geophys. Res., 104, 12549, 1999.
Richardson, IG., E.W. Cliver, and H.V. Cane, Sources of geomagnetic activity over the solar cycle: Relative importance of CMEs, high-speed streams, and slow solar wind, J. Geophys. Res., lOS, 18203,2000.
A02-p9

J. Space Weather Space Cliro. 2 (2012) A02
Richardson, LG., E.W. Cliver, and H.V. Cane, Sources of geomagnetic stonns for solar minimum and maximum conditions during 1972-2000, Geophys. Res. Lett., 28, 2569, 2001.
Richardson, lG., H.V. Cane, and E.W. Cliver, Sources of geomagnetic activity during nearly three solar cycles (1972-2000), J. Geophys. Res., 107, DOl: 1O.10291200lJA000504, 2002.
Richardson, I.G., D.F. Webb, J. "Zhang, D.B. Berdichevsky, D.A. Biesecker, et aI., Major geomagnetic stoImS (Dst ::; -100 nT) generated by corotating interaction regions, J. Geophys. Res., 111, A07S09, DOl: 1O.102912005JA01l476, 2006.
Riley, P., C. Schatzman, H.V. Cane, LG. Richardson, and N. Gopalswamy, On the rates of coronal mass ejections: Remote solar and in situ observations, Astrophys. J., 647, 648, 2006.
Robbrecht, E., D. Berghmans, and R.A.M. Van der Linden, Automated LASCO CME catalog for solar cycle 23: Are CMEs scale invariant? Astrophys. J, 691, 1222, DOl: 1O.1088,'0004-637X/6911211222, 2009.
Russell, C.T. , J.G. Luhmann, and L.K. Iian. How unprecedented a solar minimum? Rev. Geophys., 48, RG2004, DOl: 1O.l029.'2009RG000316, 2010.
Sanderson, T.R., J. Beeck, R.G. Marsden, C. Tranquille, K.-P. Wenzel, R.B. McKibben, and E.J. Smith, A study of the relation between magnetic clouds and Forbush decreases, Proc. 21st Int. Cosmic Ray Can/., 6, 251, 1990.
Scherrer, P.H., J.M. Wilcox, L. Svalgaard, T.L. Duvall Jr., P.H. Dittmer, and E.K. Gustafson, The mean magnetic field of the Sun: Observations at Stanford, Solar Phys., 54, 353, 1977.
Sheeley Jr., N.R., J.W. Harvey, and w.e. Feldman, Coronal holes, solar wind streams, and recurrent geomagnetic disturbances, 1973-1976, Solar Phys., 49, 271, 1976.
Sheeley Jr., N.R., J.S. Asbridge, S.J. Bame, and J.W. Harvey, A pictorial comparison of interplanetary magnetic field polarity, solar wind speed, and geomagnetic disturbance index during the sunspot cycle, Solar Phys., 52, 485 , 1977.
Simpson, J.A, A brief history of recurrent solar modulation of the galactic cosmic-mys, Space Sci. Rev., 83, 169, 1998.
Simpson, J.A, H.W. Babcock, and H.D. Babcock, Association of a "unipolar" magnetic region on the Sun with changes of primary cosmic-ray intensity, Phys. Rev., 98, 1402, 1955.
Smith, E.J., and A Balogh, Decrease in heliospheric magnetic flux in this solar minimum: Recent Ulysses magnetic field observations, Geophys. Res. Lett., 35, L22103, DOl: 10.1029/2008GL035345 . 2008.
Sugiura, M., Hourly values of equatorial Dst for the IGY, Ann. Int. Geophys. Year, 35, 9, 1964.
Tsurutani, B.T., and W.D. Gonzalez, The cause of high intensity long-duration continuous AE activity (HILDCAAs); Interplanetary Alfven wave trains, Planet Space Sci., 35, 405, 1987,
Tsurutani, B.T., EJ. Smith, W.D. Gonzalez, and F. Tang, Origin of interplanetary southward. magnetic fields responsible for major magnetic stanns near solar maximum (1978-1979), 93, 8519, 1988.
Tsurutani, B.T., and W.D. Gonzalez, The interplanetary causes of magnetic stanns: A review, in Magnetic Storms, ed. B.T., Tsurutani, W.D. Gonzalez, Y. Kamide, and J.K. Arballo, AG.U. Geophys. Monogr. Ser., Vol. 98, AGU, Washington, DC, 77,1997.
Tsurutani, B.T., R.L. McPherron, W.D. Gonzalez, G. Lu, N. Gopalswamy, and F.L. Guarnieri, Magnetic stonns caused by corotating solar wind streams, in Recurrent Magnetic Storms: Corotaring Solar Wind Streams, ed. B.T. , Tsurutani, R.L. McPherron, W.D. Gonzalez, G. Lu, J.H.A Sobral, and N. Gopalswamy, A.G.U. Geophysical Monograph, 167, I, 2006.
Tsurutani, B.T., E. Echer, and W.D. Gonzalez, The solar and interplanetary causes of the recent minimum in geomagnetic activity (MGA23): a combination of midlatitude small coronal holes, low IMP BZ variances, low solar wind speeds and low solar magnetic fields, Ann. Geophys., 29, 839, DOl: 10.5194/angeo-29-839-2011 , 2011.
Turner, N.E., W.D. Cramer, S.K. Earles, and B.A Emery, Geoefficiency and energy partitioning in CIR-driven and CME-driven stonns, J. Atmosph. Solar-Terr. Phys., 71, 1023,2009.
Van Hollebeke, M.A., J.R. Wang, and F.B. McDonald, A catalogue o/solar cosmic ray events IMPs IVand V (May 1967-Dec. 1972), NASA Goddard Space Flight Center, X-661-74-27, 1974.
Wang, C., CX. Li, Z.H. Huang, and J.D. Richardson, Effect of interplanetary shock strengths and orientations on stonn sudden commencement rise times, Geophys. Res. Lett., 33, L14104, DOl: 1O.102912006GL025966, 2006.
Webb, D.F., and R.A Howard, The solar cycle variation of coronal mass ejections and the solar wind mass flux, J. Geophys. Res., 99, 4201, 1994.
Wilson, R.M., Geomagnetic response ta magnetic clouds, Planet. Space Sci., 35, 329, 1987.
Wilson, R.M., On the behavior of the Dst geomagnetic index in the vicinity of magnetic cloud passage at Earth, J. Geophys. Res., 95, 215, 1988.
Yashiro, S., N. Gopalswamy, G. Michalek, O.C. St. Cyr, S.-P. Plunkett, N.B. Rich, and R.A Howard, A catalog of white light coronal mass ejections observed by the SOHO spacecraft, J. Geophys. Res., 109, A07105, 2004.
Zhang, J., I.G. Richardson, D.F. Webb, N. Gopalswamy, E. Huttunen, et a1., Solar and interplanetary sources of major geomagnetic storms (Dst :S -100 nT) during 1996-2005, J. Geophys. Res., 112, A12105, DOl: 1O.1029/2007JAOI2332, 2007.
Zhao, L., T.H. Zurbuchen, and L.A Fisk, Global distribution of the solar wind during solar cycle 23: ACE observations, Geophys. Res. Lett., 36,14104, DOl: 10.102912009GL039181 , 2009.
Zirker, J.B., (ed.), Coronal Holes and High Speed Wind Streams, Skylab Solar Workshop, Colorado University Press, Boulder, CO, 1977.
Zurbuchen, T.H., and I.G. Richardson, In-situ solar wind and magnetic field signatures of interplanetary coronal mass ejections, Space Sci. Rev., 123, 31-34, 2006.
A02-010


![ISngal Bamt^ Tasmania. - University of Tasmania · lowingimmediate]}'onthemosttypicalarchaeolithicstagethat isknowntous.Thepresenceoftheaboriginesintheisland necessarily,hethinks,impliesformercontinuouslandbetween](https://img.pdfslide.us/doc/110x75/6103c23b590dde365b4afb68/isngal-bamt-tasmania-university-of-tasmania-lowingimmediateonthemosttypicalarchaeolithicstagethat.jpg)