Embed Size (px)
Citation preview
Tax policy and inequality
Robert Joyce, Institute for Fiscal Studies
Presentation at HMT/HMRC tax policy school
21st September 2016
© Institute for Fiscal Studies
© Institute for Fiscal Studies
Introduction
• Not for economists to specify strength of preference for equality or philosophies of ‘fairness’
– But given these judgements, how should tax policy be made?
• This talk is in broadly two parts:
1. General points about how to make policy, with links to examples
2. Comments on specific parts of tax system
• Political feasibility of suggestions will vary greatly, but:
– What is feasible depends on time horizon
– Need clear benchmark for what a good system looks like before you try to approximate it or move towards it
• See Mirrlees Review: www.ifs.org.uk/publications/mirrleesreview
© Institute for Fiscal Studies
Tax policy and fairness / distribution General points
1. Consider effects of tax and welfare system as a whole
– Much of the redistribution is done by benefits/tax credits
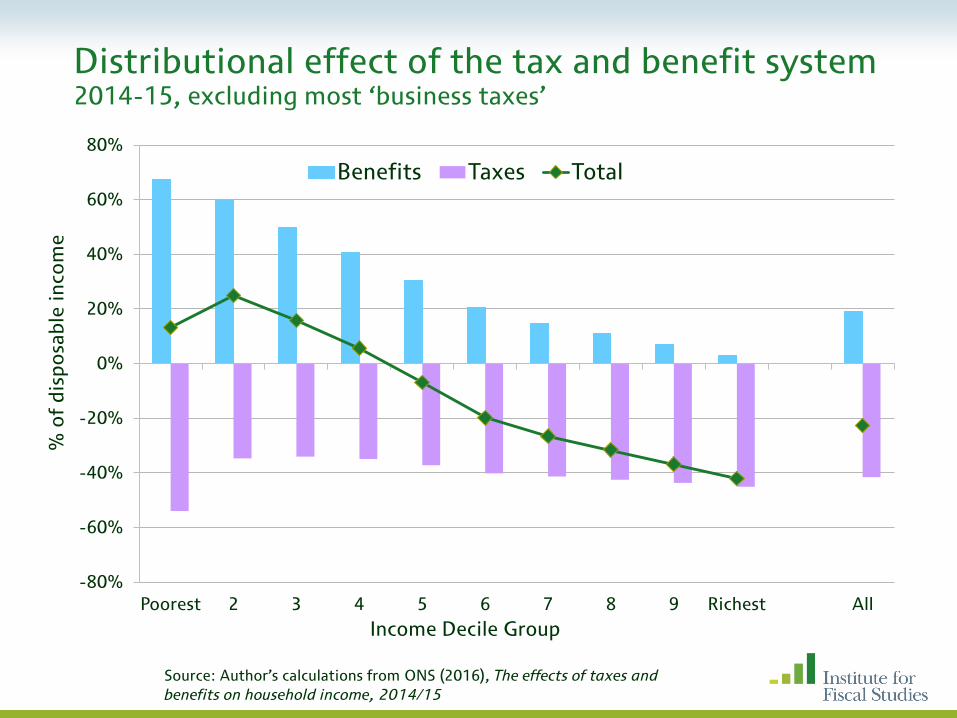
Distributional effect of the tax and benefit system 2014-15, excluding most ‘business taxes’
© Institute for Fiscal Studies
-80%
-60%
-40%
-20%
0%
20%
40%
60%
80%
Poorest 2 3 4 5 6 7 8 9 Richest All
% o
f d
isp
osa
ble
in
com
e
Income Decile Group
Benefits Taxes Total
Source: Author’s calculations from ONS (2016), The effects of taxes and
benefits on household income, 2014/15
© Institute for Fiscal Studies
Tax policy and fairness / distribution General points
1. Consider effects of tax and welfare system as a whole
– Much of the redistribution is done by benefits/tax credits
– Trying to get every part of system to achieve every objective can lead to bad policy, e.g. indirect taxes are ill-suited for use as a means of redistribution (see Mirrlees Review on differential VAT rates)
– Coherence, fairness and avoidance opportunities: is the system treating similar activities similarly?
© Institute for Fiscal Studies
Tax policy and fairness / distribution General points
1. Consider effects of tax and welfare system as a whole
2. Take a long term (ideally lifetime) view of who gets what
© Institute for Fiscal Studies
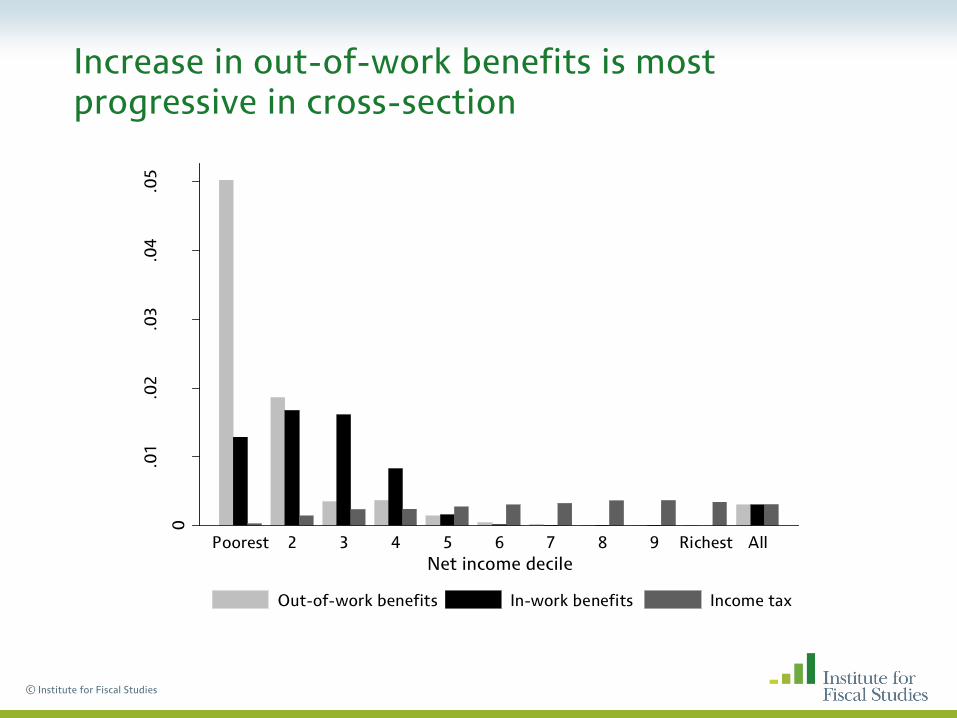
Increase in out-of-work benefits is most progressive in cross-section
0
.01
.02
.03
.04
.05
Pro
po
rtio
na
l ch
an
ge
in
ne
t in
com
e
Poorest 2 3 4 5 6 7 8 9 Richest All
Net income decile
Out-of-work benefits In-work benefits Income tax
© Institute for Fiscal Studies
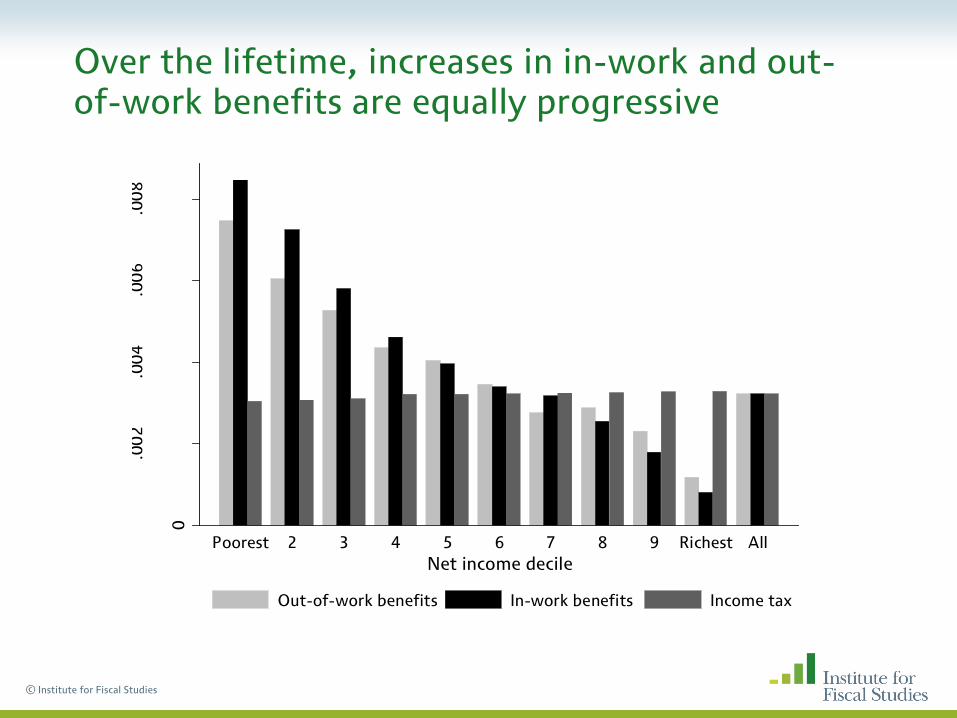
Over the lifetime, increases in in-work and out-of-work benefits are equally progressive
0
.00
2.0
04
.00
6.0
08
Pro
po
rtio
na
l ch
an
ge
in
ne
t in
com
e
Poorest 2 3 4 5 6 7 8 9 Richest All
Net income decile
Out-of-work benefits In-work benefits Income tax
© Institute for Fiscal Studies
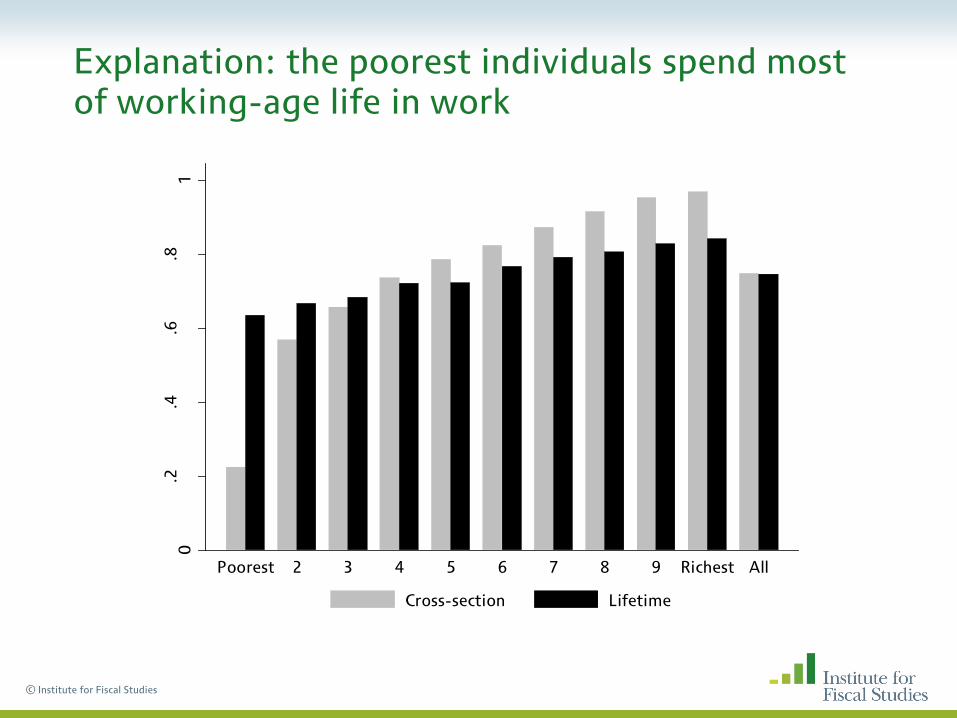
Explanation: the poorest individuals spend most of working-age life in work
0.2
.4.6
.81
Pro
po
rtio
n e
mp
loy
ed
Poorest 2 3 4 5 6 7 8 9 Richest All
Cross-section Lifetime
© Institute for Fiscal Studies
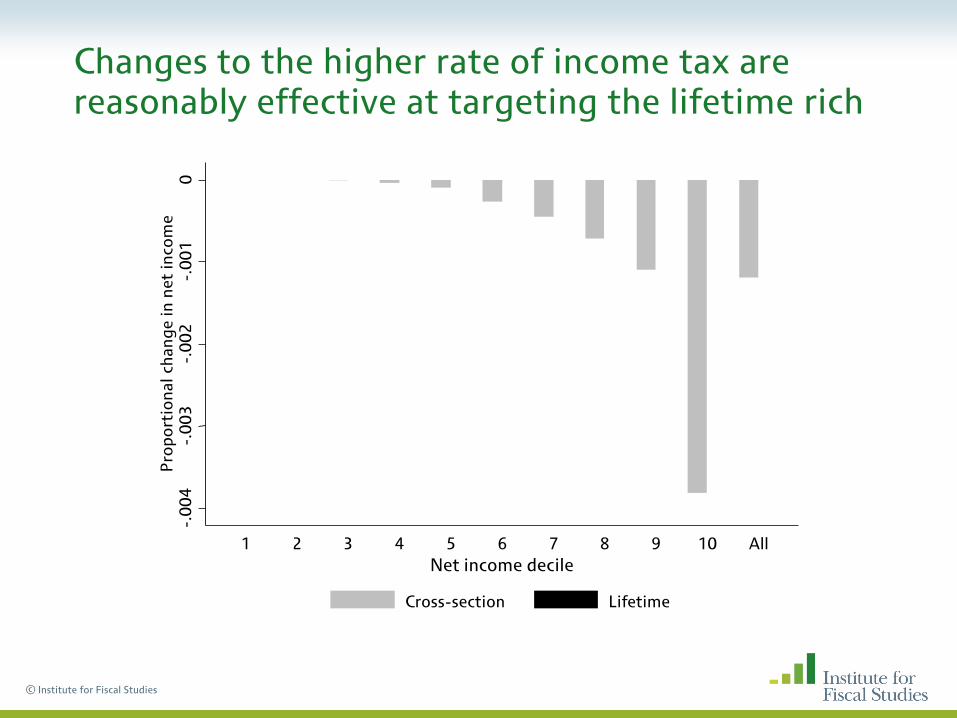
Changes to the higher rate of income tax are reasonably effective at targeting the lifetime rich
-.0
04
-.
00
3
-.0
02
-.
00
1
0
Pro
po
rtio
na
l ch
an
ge
in
ne
t in
com
e
1 2 3 4 5 6 7 8 9 10 All
Net income decile
Cross-section Lifetime
© Institute for Fiscal Studies
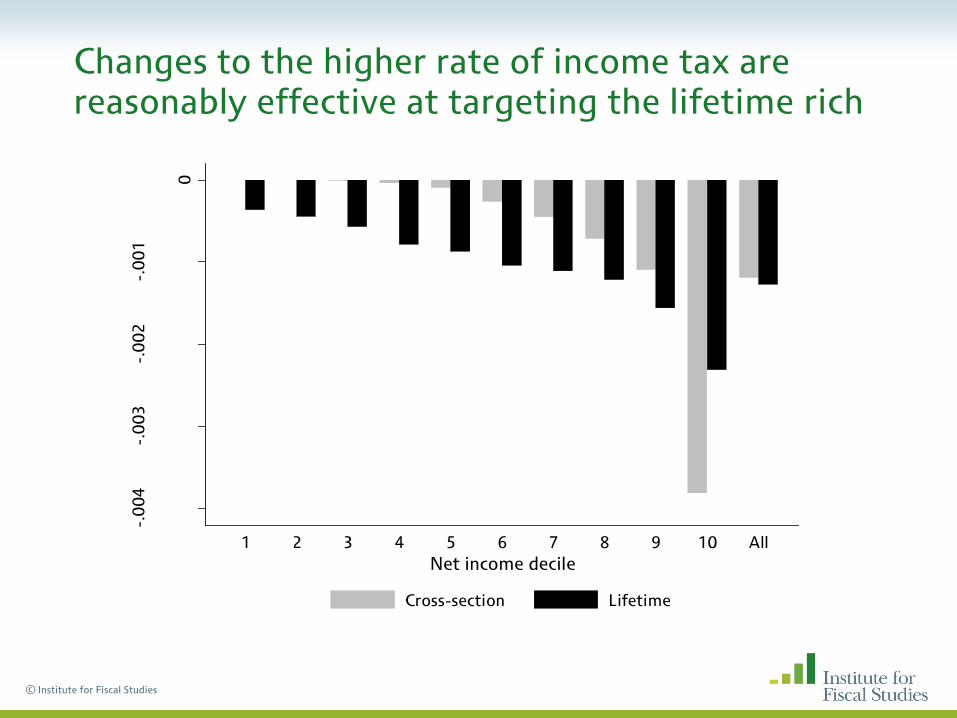
Changes to the higher rate of income tax are reasonably effective at targeting the lifetime rich
-.0
04
-.0
03
-.0
02
-.0
01
0
Pro
po
rtio
na
l ch
an
ge
in
ne
t in
com
e
1 2 3 4 5 6 7 8 9 10 All
Net income decile
Cross-section Lifetime
© Institute for Fiscal Studies
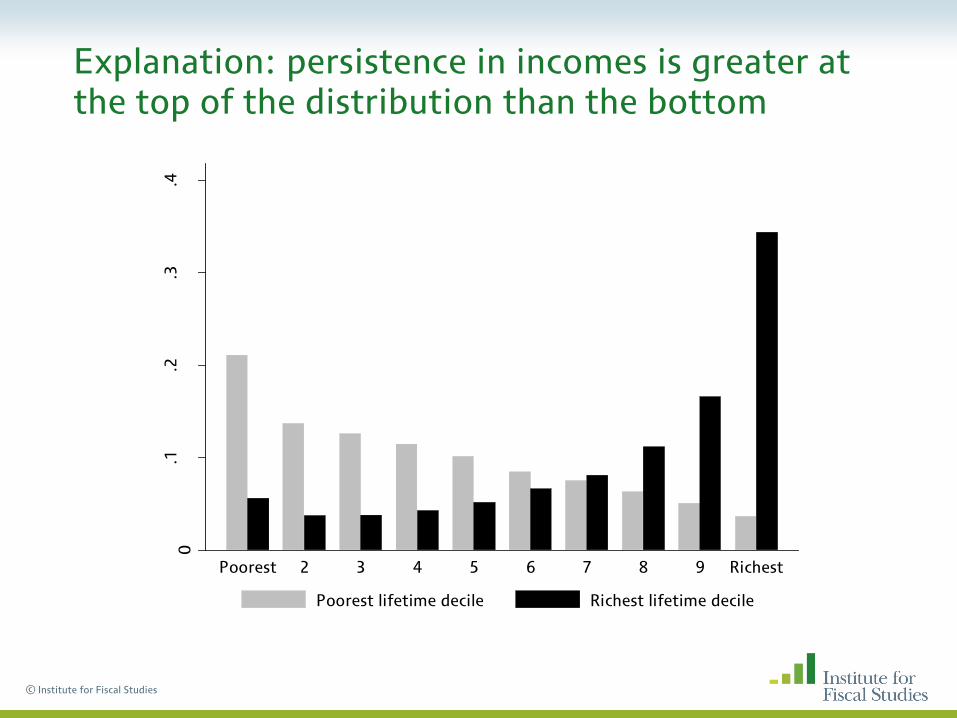
Explanation: persistence in incomes is greater at the top of the distribution than the bottom
0.1
.2.3
.4
Pro
po
rtio
n o
f li
fe i
n e
ach
cro
ss-s
ect
ion
al
de
cile
Poorest 2 3 4 5 6 7 8 9 Richest
Poorest lifetime decile Richest lifetime decile
© Institute for Fiscal Studies
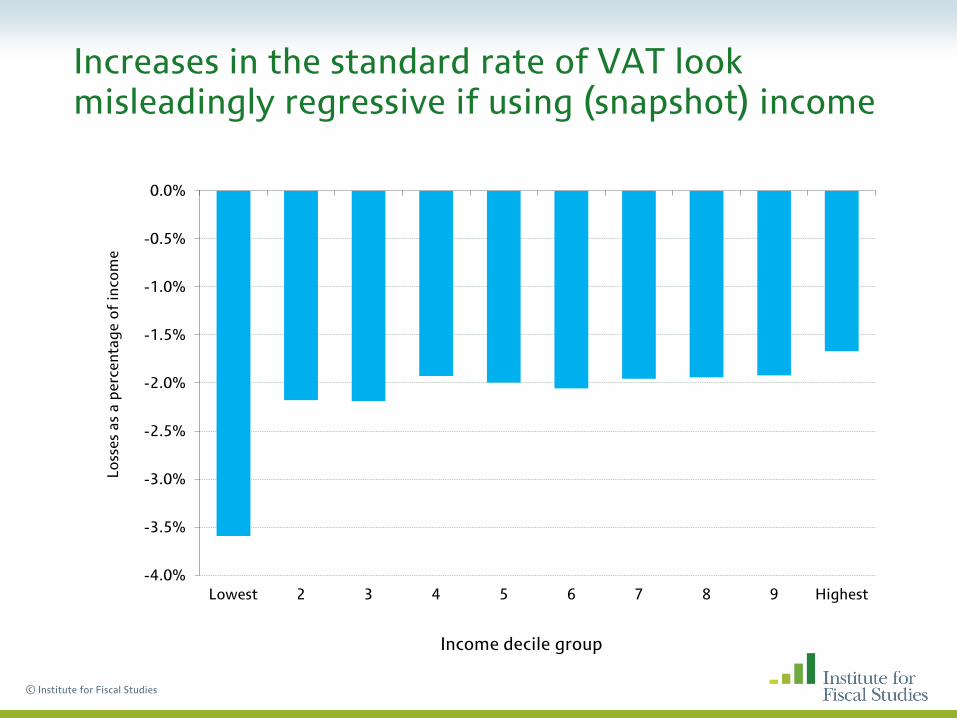
Increases in the standard rate of VAT look misleadingly regressive if using (snapshot) income
-4.0%
-3.5%
-3.0%
-2.5%
-2.0%
-1.5%
-1.0%
-0.5%
0.0%
Lowest 2 3 4 5 6 7 8 9 Highest
Lo
sse
s a
s a
pe
rce
nta
ge
of
inco
me
Income decile group
© Institute for Fiscal Studies
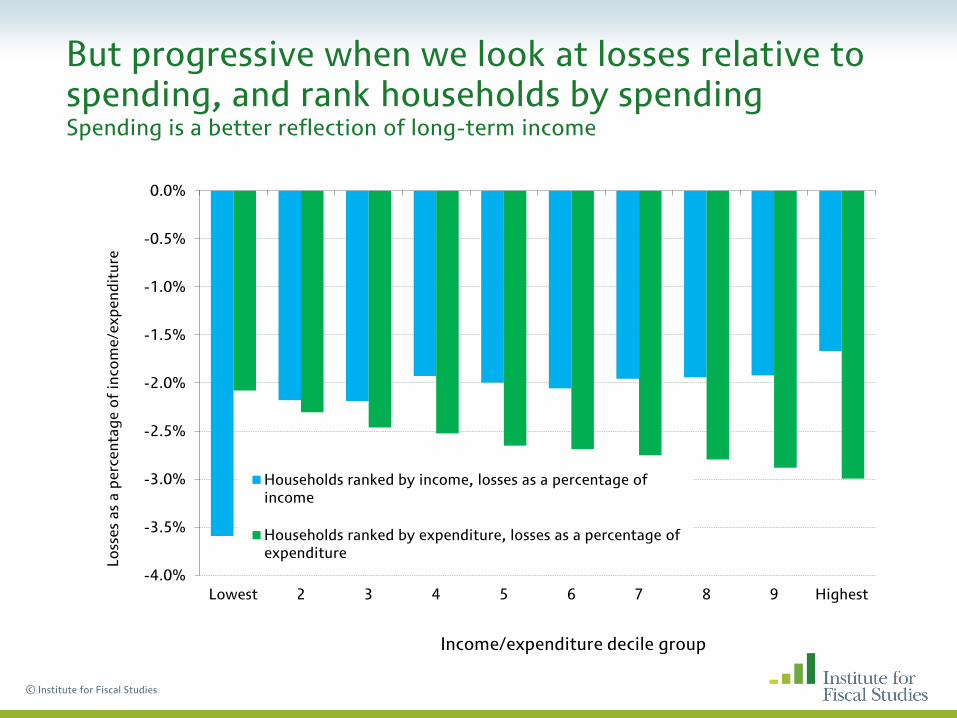
But progressive when we look at losses relative to spending, and rank households by spending Spending is a better reflection of long-term income
-4.0%
-3.5%
-3.0%
-2.5%
-2.0%
-1.5%
-1.0%
-0.5%
0.0%
Lowest 2 3 4 5 6 7 8 9 Highest
Lo
sse
s a
s a
pe
rce
nta
ge
of
inco
me
/exp
en
dit
ure
Income/expenditure decile group
Households ranked by income, losses as a percentage of income
Households ranked by expenditure, losses as a percentage of expenditure
© Institute for Fiscal Studies
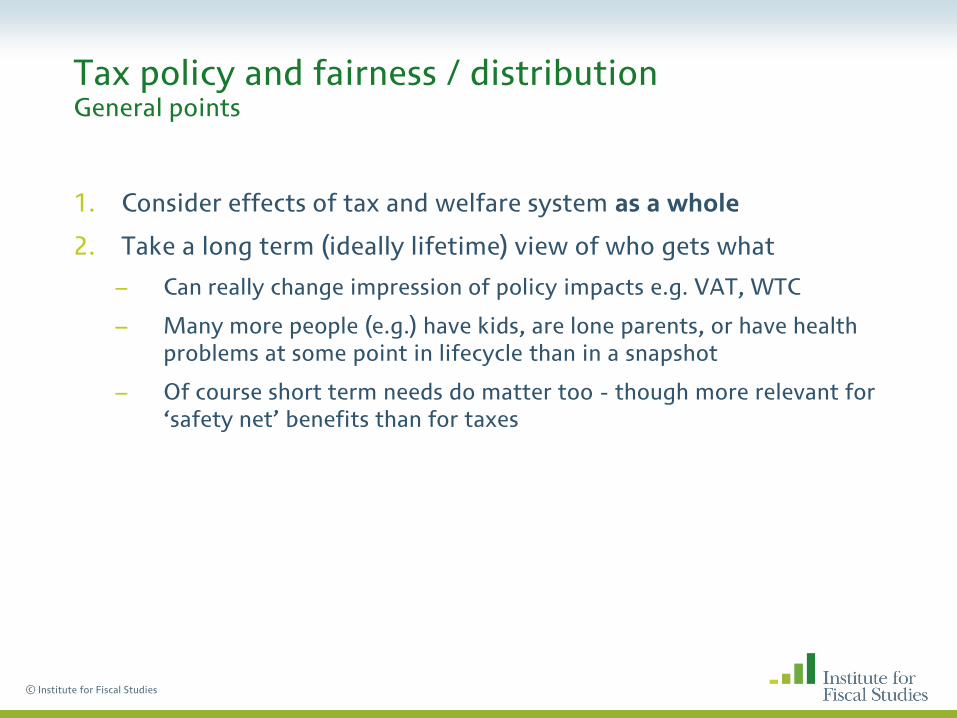
Tax policy and fairness / distribution General points
1. Consider effects of tax and welfare system as a whole
2. Take a long term (ideally lifetime) view of who gets what
– Can really change impression of policy impacts e.g. VAT, WTC
– Many more people (e.g.) have kids, are lone parents, or have health problems at some point in lifecycle than in a snapshot
– Of course short term needs do matter too - though more relevant for ‘safety net’ benefits than for taxes
© Institute for Fiscal Studies
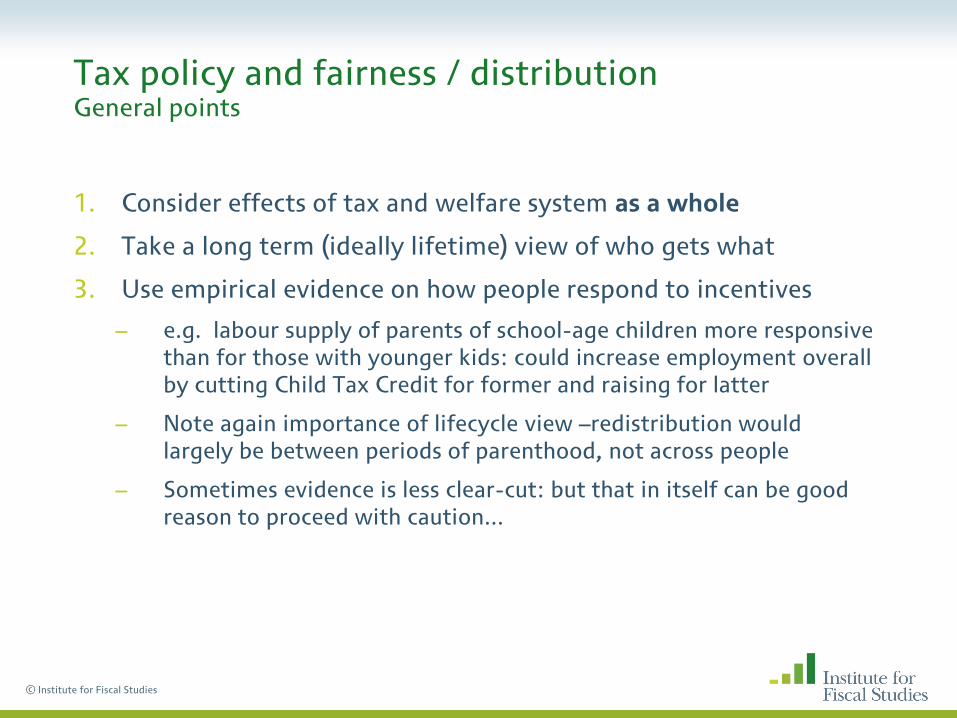
Tax policy and fairness / distribution General points
1. Consider effects of tax and welfare system as a whole
2. Take a long term (ideally lifetime) view of who gets what
3. Use empirical evidence on how people respond to incentives
– e.g. labour supply of parents of school-age children more responsive than for those with younger kids: could increase employment overall by cutting Child Tax Credit for former and raising for latter
– Note again importance of lifecycle view –redistribution would largely be between periods of parenthood, not across people
– Sometimes evidence is less clear-cut: but that in itself can be good reason to proceed with caution...
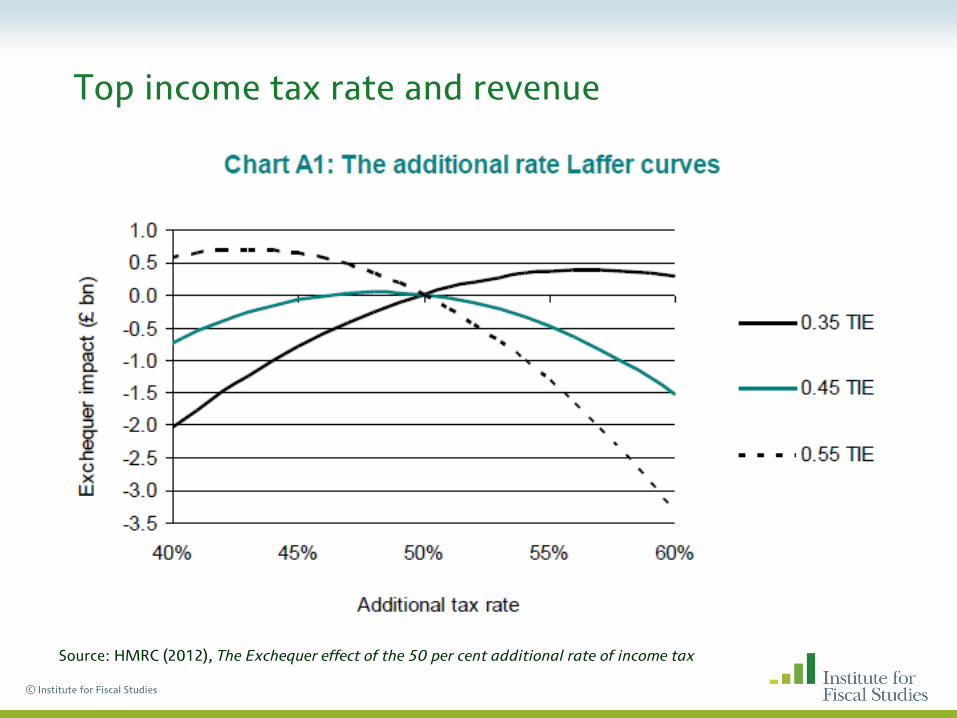
Top income tax rate and revenue
© Institute for Fiscal Studies
Source: HMRC (2012), The Exchequer effect of the 50 per cent additional rate of income tax
© Institute for Fiscal Studies
Direct tax: income tax and NI
• Increasing the IT personal allowance is not progressive and is a very expensive way of helping the lowest earning beneficiaries
– and increasingly so: 43% of adults now have incomes too low to pay income tax, and pensioners now benefit too
• Totemic significance of income tax and relative ability of NI to go ‘under the radar’ seems to lead to policy outcomes that are unintended and/or go against grain of govt policy
– e.g. earnings threshold for NI remained almost untouched while the income tax PA has been massively increased
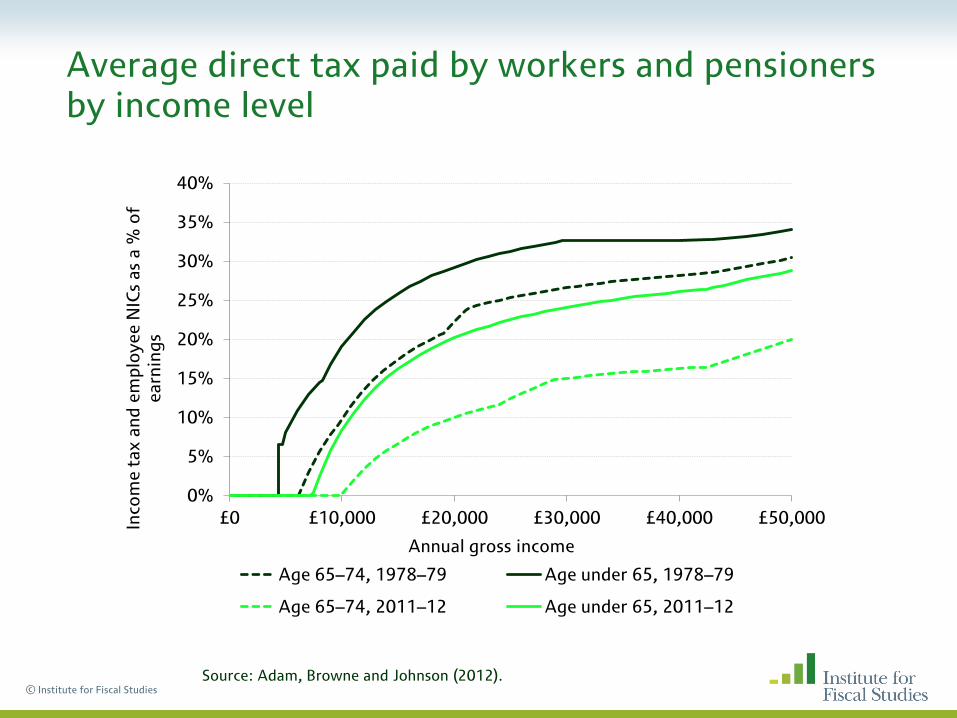
Average direct tax paid by workers and pensioners by income level
© Institute for Fiscal Studies
0%
5%
10%
15%
20%
25%
30%
35%
40%
£0 £10,000 £20,000 £30,000 £40,000 £50,000 Inco
me
tax a
nd
em
plo
ye
e N
ICs
as
a %
of
ea
rnin
gs
Annual gross income
Age 65–74, 1978–79 Age under 65, 1978–79
Age 65–74, 2011–12 Age under 65, 2011–12
Source: Adam, Browne and Johnson (2012).
© Institute for Fiscal Studies
Direct tax: income tax and NI
• Increasing the IT personal allowance is not progressive and is a very expensive way of helping the lowest earning beneficiaries
– and increasingly so: 43% of adults now have incomes too low to pay income tax, and pensioners now benefit too
• Totemic significance of income tax and relative ability of NI to go ‘under the radar’ seems to lead to policy outcomes that are unintended and/or go against grain of govt policy
– e.g. earnings threshold for NI remained untouched while the income tax PA has been massively increased
• (Big issues around top tax rates and tax relief on pension contributions, covered elsewhere)
Property tax
• Perhaps the worst-designed part of the tax system?
• From point of view of equity and fairness, obvious deficiencies in council tax:
– Still based on 1991 property values in England and Scotland
– Wide bands
– Regressive
© Institute for Fiscal Studies
© Institute for Fiscal Studies
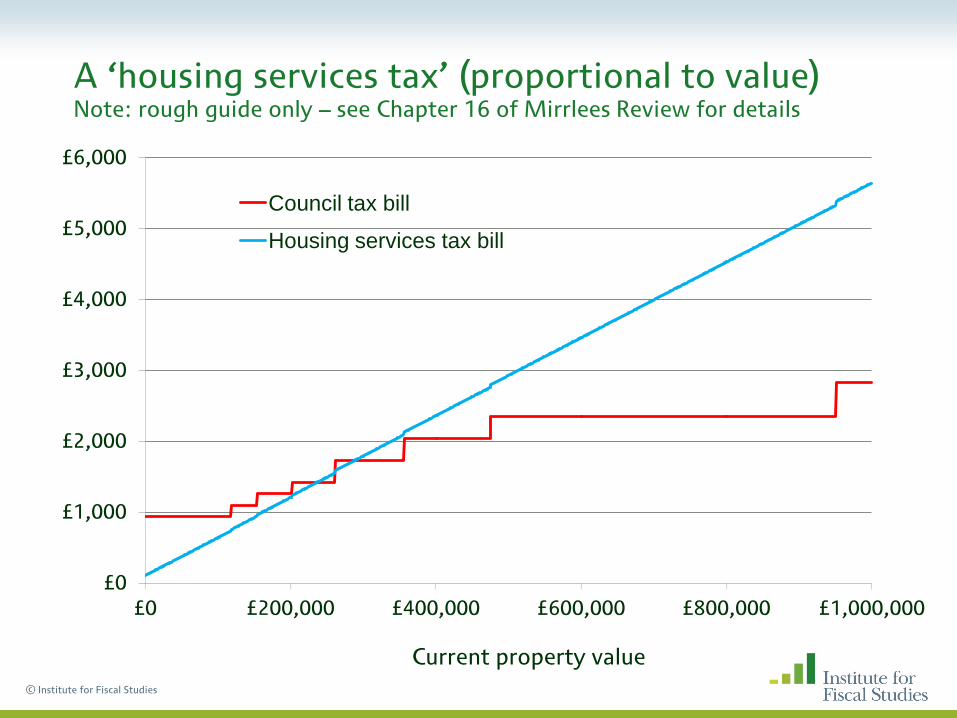
A ‘housing services tax’ (proportional to value) Note: rough guide only – see Chapter 16 of Mirrlees Review for details
£0
£1,000
£2,000
£3,000
£4,000
£5,000
£6,000
£0 £200,000 £400,000 £600,000 £800,000 £1,000,000
Current property value
Council tax bill
Housing services tax bill
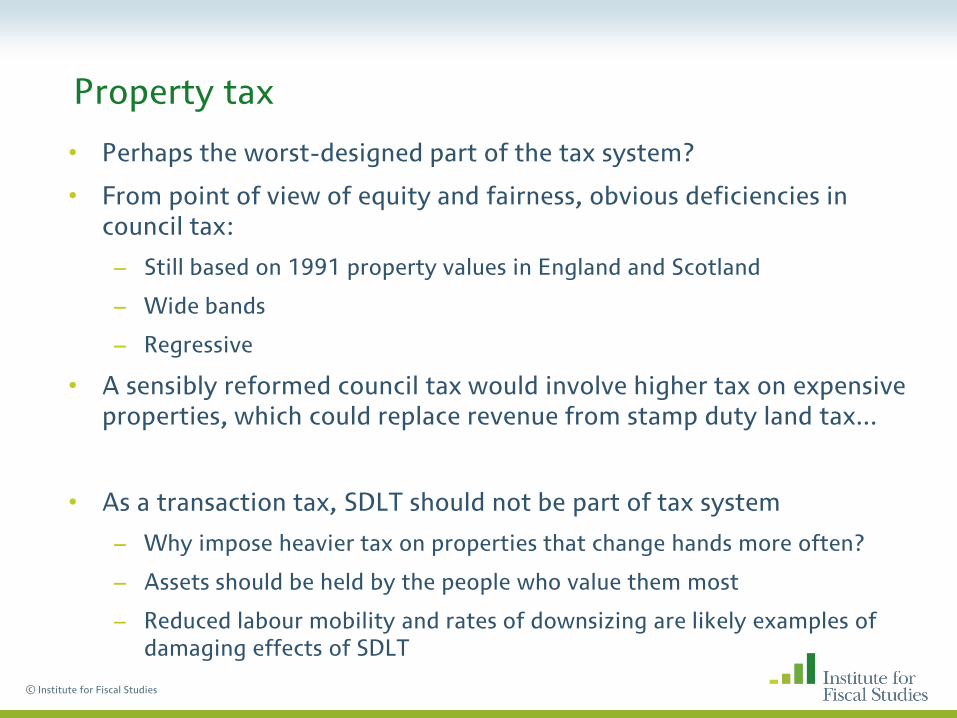
Property tax
• Perhaps the worst-designed part of the tax system?
• From point of view of equity and fairness, obvious deficiencies in council tax:
– Still based on 1991 property values in England and Scotland
– Wide bands
– Regressive
• A sensibly reformed council tax would involve higher tax on expensive properties, which could replace revenue from stamp duty land tax...
• As a transaction tax, SDLT should not be part of tax system
– Why impose heavier tax on properties that change hands more often?
– Assets should be held by the people who value them most
– Reduced labour mobility and rates of downsizing are likely examples of damaging effects of SDLT
© Institute for Fiscal Studies
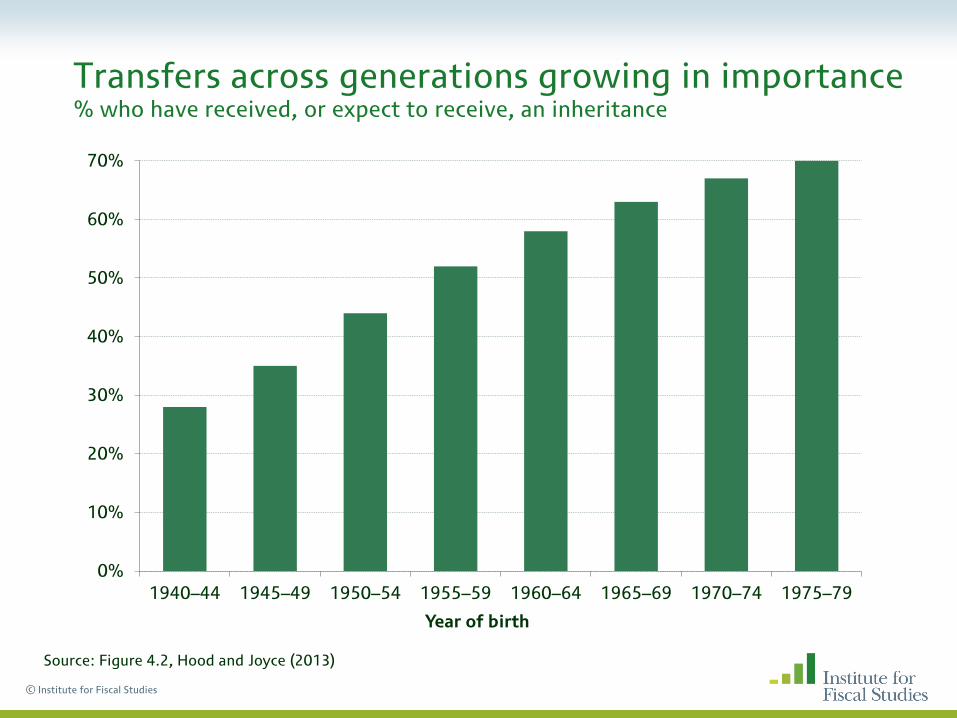
Transfers across generations growing in importance % who have received, or expect to receive, an inheritance
© Institute for Fiscal Studies
0%
10%
20%
30%
40%
50%
60%
70%
1940–44 1945–49 1950–54 1955–59 1960–64 1965–69 1970–74 1975–79
Year of birth
Source: Figure 4.2, Hood and Joyce (2013)
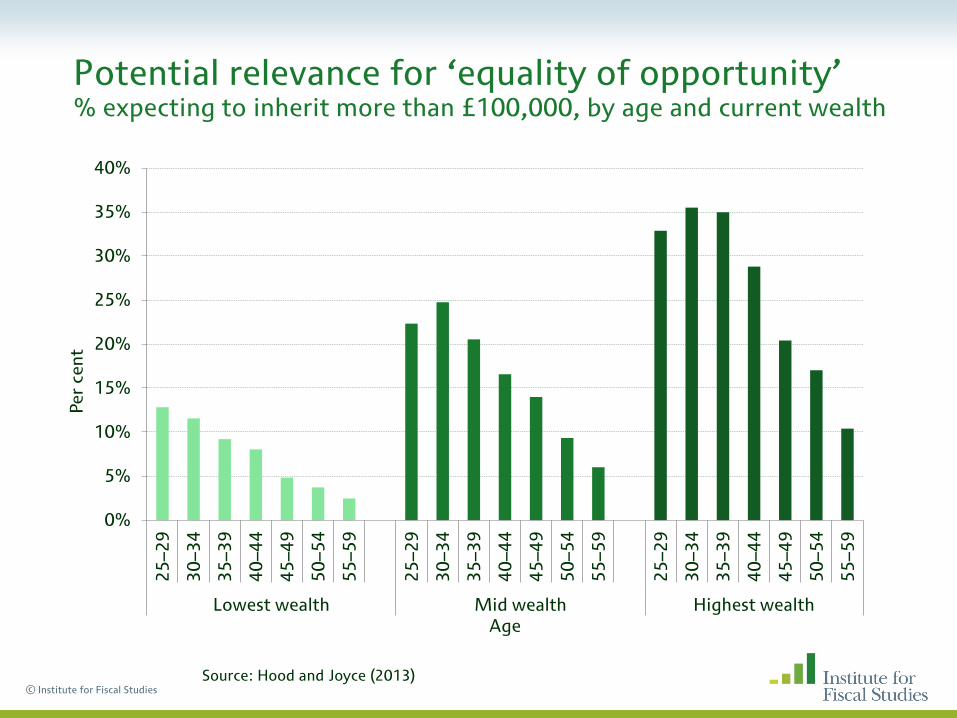
Potential relevance for ‘equality of opportunity’ % expecting to inherit more than £100,000, by age and current wealth
© Institute for Fiscal Studies
0%
5%
10%
15%
20%
25%
30%
35%
40% 2
5–
29
30
–3
4
35
–3
9
40
–4
4
45
–4
9
50
–5
4
55
–5
9
25
–2
9
30
–3
4
35
–3
9
40
–4
4
45
–4
9
50
–5
4
55
–5
9
25
–2
9
30
–3
4
35
–3
9
40
–4
4
45
–4
9
50
–5
4
55
–5
9
Lowest wealth Mid wealth Highest wealth
Pe
r ce
nt
Age
Source: Hood and Joyce (2013)
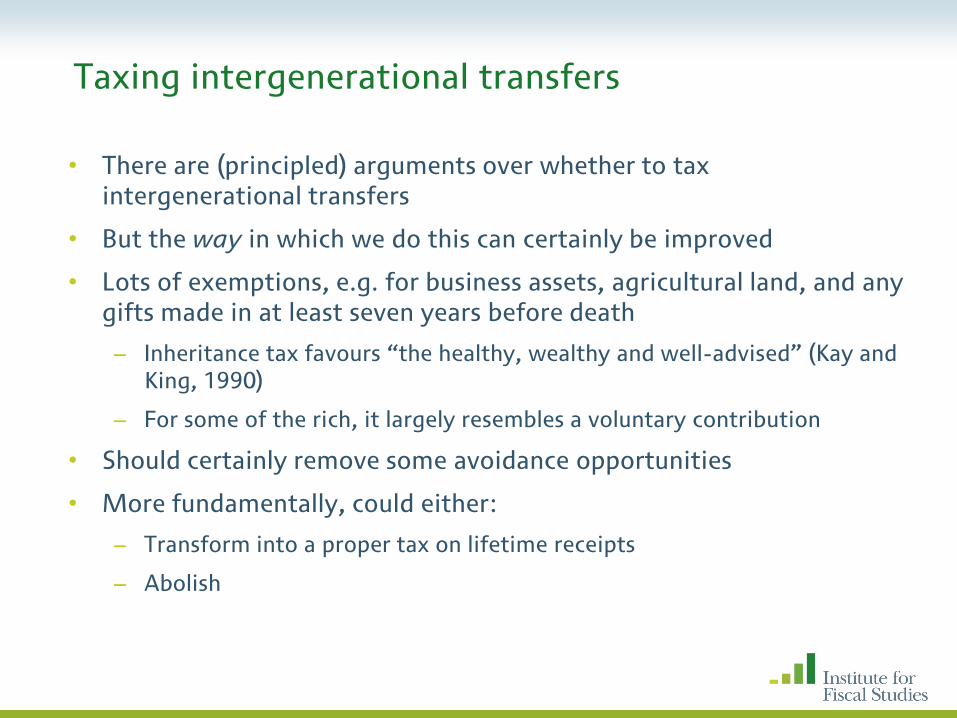
Taxing intergenerational transfers
• There are (principled) arguments over whether to tax intergenerational transfers
• But the way in which we do this can certainly be improved
• Lots of exemptions, e.g. for business assets, agricultural land, and any gifts made in at least seven years before death
– Inheritance tax favours “the healthy, wealthy and well-advised” (Kay and King, 1990)
– For some of the rich, it largely resembles a voluntary contribution
• Should certainly remove some avoidance opportunities
• More fundamentally, could either:
– Transform into a proper tax on lifetime receipts
– Abolish
© Institute for Fiscal Studies
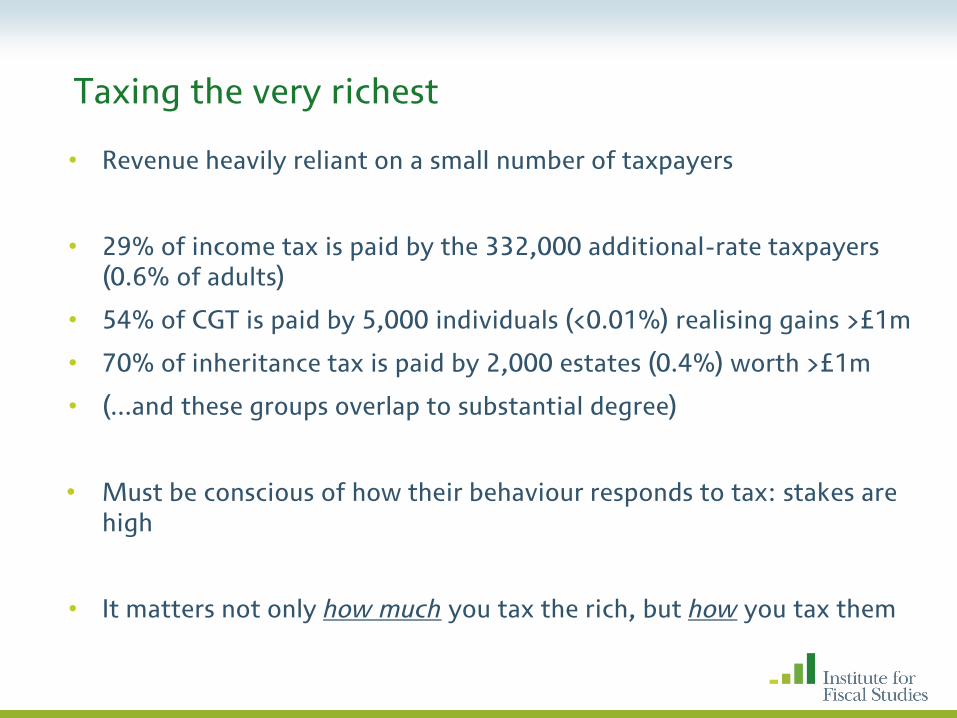
Taxing the very richest
• Revenue heavily reliant on a small number of taxpayers
• 29% of income tax is paid by the 332,000 additional-rate taxpayers (0.6% of adults)
• 54% of CGT is paid by 5,000 individuals (<0.01%) realising gains >£1m
• 70% of inheritance tax is paid by 2,000 estates (0.4%) worth >£1m
• (...and these groups overlap to substantial degree)
• Must be conscious of how their behaviour responds to tax: stakes are high
• It matters not only how much you tax the rich, but how you tax them
© Institute for Fiscal Studies
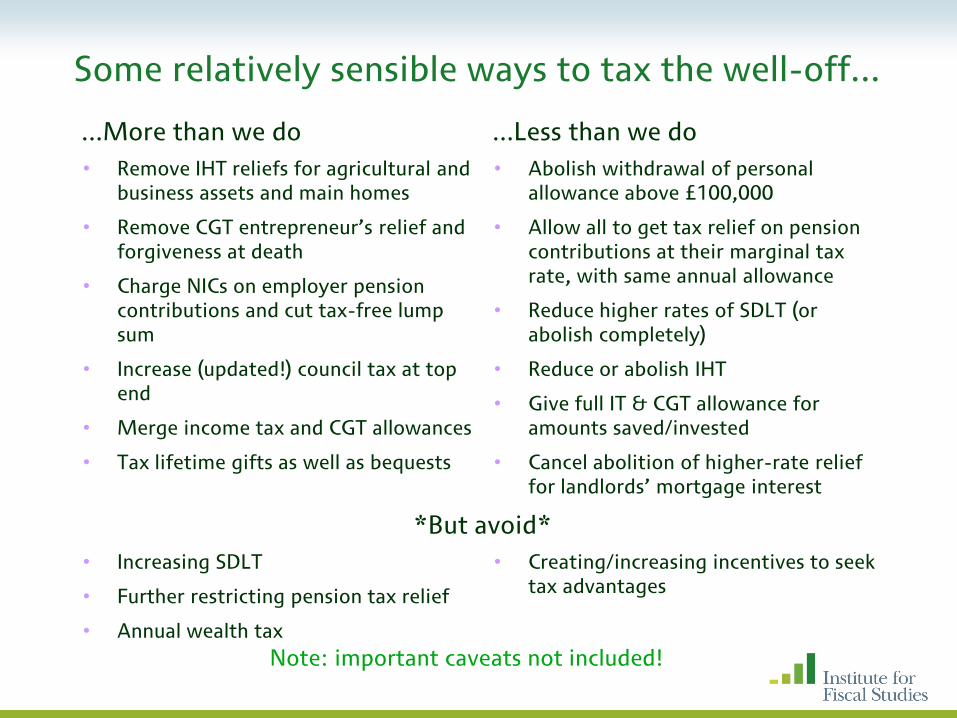
Some relatively sensible ways to tax the well-off...
© Institute for Fiscal Studies
...More than we do ...Less than we do
• Remove IHT reliefs for agricultural and business assets and main homes
• Remove CGT entrepreneur’s relief and forgiveness at death
• Charge NICs on employer pension contributions and cut tax-free lump sum
• Increase (updated!) council tax at top end
• Merge income tax and CGT allowances
• Tax lifetime gifts as well as bequests
• Abolish withdrawal of personal allowance above £100,000
• Allow all to get tax relief on pension contributions at their marginal tax rate, with same annual allowance
• Reduce higher rates of SDLT (or abolish completely)
• Reduce or abolish IHT
• Give full IT & CGT allowance for amounts saved/invested
• Cancel abolition of higher-rate relief
for landlords’ mortgage interest
*But avoid*
• Increasing SDLT
• Further restricting pension tax relief
• Annual wealth tax
• Creating/increasing incentives to seek tax advantages
Note: important caveats not included!
© Institute for Fiscal Studies
Summary
• When assessing impacts on inequalities we should
– Consider system in the round
– Appreciate that people live lifecycles, not snapshots
• Never going to have agreement on what is fair and equitable
• But can achieve a given degree of equity in vastly different ways
– We should choose the least costly ways
– In many cases we have lots of evidence to guide us