Embed Size (px)
Citation preview
Tax Evasion and Inequality∗
Annette Alstadsæter (Norwegian University of Life Sciences)Niels Johannesen (University of Copenhagen)
Gabriel Zucman (UC Berkeley and NBER)
May 28, 2017
Abstract
This paper attempts to estimate the size and distribution of tax evasion in rich coun-tries. We combine stratified random audits—the key source used to study tax evasionso far—with new micro-data leaked from two large offshore financial institutions, HSBCSwitzerland (“Swiss leaks”) and Mossack Fonseca (“Panama Papers”). We match thesedata to population-wide wealth records in Norway, Sweden, and Denmark. We find thattax evasion rises sharply with wealth, a phenomenon that random audits fail to capture.On average about 3% of personal taxes are evaded in Scandinavia, but this figure rises toabout 30% in the top 0.01% of the wealth distribution, a group that includes householdswith more than $40 million in net wealth. A simple model of the supply of tax evasionservices can explain why evasion rises steeply with wealth. Taking tax evasion into accountincreases the rise in inequality seen in tax data since the 1970s markedly, highlighting theneed to move beyond tax data to capture income and wealth at the top, even in countrieswhere tax compliance is generally high. We also find that after reducing tax evasion—byusing tax amnesties—tax evaders do not legally avoid taxes more. This result suggeststhat fighting tax evasion can be an effective way to collect more tax revenue from theultra-wealthy.
∗Annette Alstadsæter: [email protected]; Niels Johannesen: [email protected];Gabriel Zucman: [email protected]. We thank the Scandinavian tax administrations (Skatteetaten, Skat-teverket, and SKAT), Statistics Sweden, and SVT Uppdrag granskning for their goodwill, data deliveries andcooperation. We thank Sigurd Bjørnestad, Petter Lundberg, Søren Pedersen, Gard Thomassen, and UiO Ser-vices for Sensitive Data (TSD) for exceptionally valuable assistance. We are grateful for financial support fromthe Nordic Tax Research Council and the FRIPRO-program of the Research Council of Norway. Johannesenacknowledges financial support from the Danish Council for Independent Research.

1 Introduction
The size and distribution of tax evasion is a source of sustained interest—and controversy—
among the public. Some believe that the bulk of tax evasion is done by the wealthy, a view
fueled recently by high-profile leaks from offshore financial institutions such as the Panama
Papers. Others stress that poorer individuals may be more likely to evade taxes, highlighting
fraud by the self-employed or abuse of refundable tax credits.
Who evades taxes—and how much—matters for economists and policy-makers too. First,
tax evasion redistributes the tax burden and affects the costs of raising taxes, “bread-and-butter
concerns of public economics” (Slemrod, 2016). Second, knowing how tax evasion is distributed
would enable tax authorities to better target their enforcement effort. Last, tax evasion matters
for the study of inequality. Over the last fifteen years, scholars have increasingly relied on
tax data to study distributional issues, especially trends in top income and wealth shares (see
Roine and Waldenstrom, 2015, for a recent survey). This raises an obvious issue: since tax
rates, tax evasion technologies, and tax enforcement strategies differ across countries and have
changed dramatically over time, tax data may paint a distorted picture of the cross-country and
time-series patterns in inequality.
Tax evasion is fundamentally hard to study because there is no single source of information
capturing all of it. The key source used so far in rich countries is stratified random audits. These
audits are a powerful way to uncover unreported self-employment income, abuses of tax credits,
and more broadly all relatively simple forms of tax evasion. Tax authorities rely on random
audits to estimate the tax gap, that is, the total amont of unreported income and unpaid taxes
(e.g., IRS 2016), and academics have fruitfully used them to gains insights on the determinants
of tax evasion (e.g., Kleven et al., 2011). But, as discussed in Section II below, random audits
do not allow to study tax evasion by the very wealthy, both because of insufficient sample sizes,
and because they fail to capture sophisticated forms of evasion involving legal and financial
intermediaries, the detection of which would require much more resources than available to tax
authorities for their random audit programs. This limitation means that random audits need
to be supplemented with other data sources to study tax evasion at the top of the distribution.
Such data, however, have so far proven elusive.
In this paper, we analyze new micro-data that have recently become available and make it
possible to study tax evasion by very rich individuals. These data come from massive leaks
from offshore financial institutions—HSBC Switzerland (“Swiss Leaks”) and Mossack Fonseca
(the “Panama Papers”). We combine these new data with random audits and population-wide
1

administrative income and wealth records in Norway, Sweden, and Denmark to estimate the
size and distribution of total tax evasion. Factoring in this new data source reveals a sharp
gradient in evasion by wealth group. We find that the top 0.01% of the wealth distribution—a
group that includes households with more than $40 million in net wealth—evades about 30%
of its personal income and wealth taxes. This is an order of magnitude more than the average
evasion rate of about 3% (Figure 1).
The main leak used in this research is from HSBC Private Bank Switzerland, the Swiss
subsidiary of the banking giant HSBC. In 2007, an HSBC employee extracted the complete
internal records—including the names and account values—of the more than 30,000 clients of
this bank, a large fraction of whom were evading taxes. This list was subsequently obtained by
the French tax authority who shared it with foreign administrations. The newspaper Le Monde
obtained a version of the tax authority data and shared it with the International Consortium
of Investigative Journalists. ICIJ assembled a global team of journalists and in January 2015
published the results of its investigation, called “Swiss Leaks.” Thanks to a cooperation with
Scandinavian administrations and journalists, we were able to match the leaked HSBC files to
individual tax data in Norway, Sweden, and Denmark.
The leaked HSBC file has four key strengths. First, the leak is not the result of specific
enforcement effort by tax authorities targeted at HSBC; it can be seen as a random event.
Second, it involves a major—and, the available evidence suggests, representative—player in
the offshore wealth management industry. Third, HSBC Switzerland recorded the name of the
beneficial owners of the wealth it managed, even when this wealth was held—as is frequently
the case—through intertwined shell companies incorporated in Panama and similar offshore
havens. This allows us to link wealth to its actual owners. Fourth, while owning bank accounts
in Switzerland is not illegal per se, the leaked file matched to tax returns offers a clear-cut way
to identify illegal tax evasion: taxpayers who reported their HSBC accounts were not evading;
those who did not were. In practice, about 95% of all the individuals on the HSBC list that
could be matched to a tax return did not report their Swiss bank account.
The second leak used in this research is what is known as the “Panama Papers”. This leak
revealed the identity of the shareholders of the shell companies created by the Panamanian firm
Mossack Fonseca. Just like for HSBC, this leak is valuable as it can be seen as a random event
and it involves a prominent provider of offshore financial services. It brings additional evidence
on the extensive use of tax havens at the top of the distribution. The Panama papers, however,
have one drawback: they do not allow us to estimate how much tax was evaded (if any) by the
2
owners of the Mossack Fonseca shell companies. It is not illegal per se to own shell corporations
in Panama or elsewhere.
We also analyze a third source of information, a large sample of Norwegian and Swedish
households who voluntarily disclosed previously hidden wealth in the context of a tax amnesty.
The many data sets used in this article all paint the same picture: the probability to hide
assets rises very sharply with wealth, including within the very top groups. As a result, offshore
wealth turns out to be extremely concentrated. By our estimate, the top 0.01% of the distribu-
tion owns about 50% of it. When combined with estimates of the macro stock of offshore wealth
(from Zucman, 2013), this implies that the top 0.01% hides about 25% of its true wealth. Of
course, there are uncertainties on the macro stock of wealth hidden in tax havens, and therefore
our estimates of evasion rates at the top come with a margin of error. We construct lower and
upper bounds and find we can bound the evasion rate for the top 0.01% at 15% from below—still
five times more than the average tax gap in Scandinavia.
How can we explain the prevalence of tax evasion at the top of the distribution? Existing
models focus on the rational behavior of a tax evader under uncertainty (Allingham and Sandmo,
1972), what can be seen as the demand side for tax evasion services. Evasion is high when the
probability to be detected is low or when penalties are low, and the effect of tax rates is nil or
ambiguous. These models do not provide a direct explanation for the sharp gradient in evasion
with wealth. We argue that to understand this gradient, it is necessary to consider the supply
side of tax evasion services. We introduce such a model. Swiss banks decide on the number of
clients they serve by internalizing the cost of being caught, which rises with the number of clients
served (e.g., because the probability of a leak rises). We derive a closed-form expression for the
fraction of the population served when wealth is Pareto distributed. The higher inequality, the
lower the quantities of evasion services supplied. When inequality is very high, as is the case
for wealth, it is optimal for banks to only supply tax evasion services to the ultra-rich.
We discuss two implications of our results.
First we analyze how accounting for offshore wealth affects measured wealth inequality. We
illustrate this with the case of Norway where high quality, long-run time series of top wealth
shares exist. Because offshore wealth is extremely concentrated, taking it into account lifts top
wealth shares significantly. It increases the top 0.1% wealth share from 8% to 10%. For the top
0.01%—the wealthiest 330 Norwegian households—taking tax evasion into account increases
their reported wealth by a third. Our results highlight the need to move beyond tax records
to capture the income and wealth of the very rich, even in countries where tax compliance is
3

generally high. They also suggest that tax data may significantly under-estimate the rise of
wealth concentration over the last four decades, as the world was less globalized in the 1970s,
it was harder to move assets across borders, and offshore tax havens played a less important
role. Because most Latin American, and many Asian and European economies own much more
wealth offshore than Norway, the results found in Scandinavia are likely to be a lower bound
for most of the world’s countries. Many tax authorities—including the United States’—have
access to random leaks from providers of evasion services; in future work we plan to apply our
methodology to estimate the tax gap and its distribution in as many countries as possible. Our
ultimate goal is to correct global inequality statistics in a systematic way so as to better capture
the very rich.
Last, we consider the implications of our results for public finances. Should tax evasion
become impossible, would wealthy individuals pay significantly more taxes? The answer depends
on how substitutable illegal tax evasion and legal tax avoidance are. To address this question,
we analyze the behavior of a large sample of Norwegians who voluntarily disclosed previously
hidden wealth in the context of a tax amnesty. In an event study design, we find that after
voluntarily reducing tax evasion, tax evaders do not legally avoid taxes more, despite ample
opportunities to do so. This finding suggests that fighting tax evasion can be an effective way
of collecting extra tax revenue from the ultra-wealthy.
2 Related Literature
2.1 Tax Evasion
Our paper first contributes to the literature on tax evasion. The key data source in this literature
is randomized audits, such as the National Research Program (NRP) in the United States.
Audit studies consistently find large rates of tax evasion for self-employment and small business
income, for which the absence of third-party reporting makes tax evasion easy. For instance,
the IRS (2016) estimates that half of the U.S. tax gap owes to unpaid self-employment Social
Security/Medicare taxes plus unpaid taxes on small business profits. Also based on stratified
random audits, Kleven et al. (2011) find that 44.9% of Danish self-employed evade taxes.1
Bishop, Formby, and Lambert (2000) and Johns and Slemrod (2010) use randomized audit
micro-data to study how detected tax evasion affects income inequality in the United States.
1These findings are confirmed by other studies not based on randomized audits (e.g., Pissarides and Weber,1989; Feldman and Slemrod, 2007; Artavanis et al., 2015) which typically find that the true income of self-employed is on average about 1.5 times their reported income.
4

Because tax evasion by self-employed individuals and small businesses is thought to be
reasonably well captured by randomized audits, estimates for this form of evasion are built into
the national accounts: the evaded income—as estimated using random audits—is included in
official GDP statistics.
Random audits, however, are not well designed to capture tax evasion at the top of the
wealth distribution. First, the sample size in these random audit is too small to be able to
analyze the behavior of the very rich, say households with more than $10 million in net wealth,
very few of whom are sampled (if any). Second, and most importantly, audits fail to uncover the
most sophisticated forms of evasion involving legal and financial intermediaries, the detection
of which would require much more resources than available to tax authorities for their random
audit programs. Audits consist of line-by-line information about what the taxpayer reported
and what the examiner concluded was correct. Examiners can check that taxpayers duly report
the capital income earned through domestic financial institutions, because these institutions
automatically and truthfully report data to the tax authority, but they cannot check that they
duly report income earned through offshore financial institutions, because they typically receive
limited information from tax havens, and they cannot possibly audit all the world’s providers
of offshore services. In addition, tax authorities do not systematically analyze bank transfers
(both for practical and legal reasons), and cannot capture transfers of wealth abroad made in
the past, or transfers in cash, diamonds, etc. Our main contribution compared to the previous
literature on tax evasion is that we are able to document tax evasion by the very wealthy.
2.2 Offshore Wealth and Offshore Tax Evasion
There have been attempts at estimating the macroeconomic amount of wealth held in offshore
tax havens. Zucman (2013) estimates that the equivalent of 10% of the world’s GDP is held
in tax havens globally. Pellegrini et al. (2016) have a similar estimate. According to the US
Treasury International Capital statistics, offshore centers manage close to 10% of all the listed
equities of US companies, against less than 1% in the early 1940s (Zucman, 2014). Two US
Senate (2008, 2014) reports found that up to 2008, 85 to 95 percent of US-owned accounts at
UBS and Credit Suisse in Switzerland were undeclared. Roussille (2015) finds that more than
80% of the wealth held by Europeans in Switzerland is undeclared in 2013, and more than 90%
was before 2010. Until recently, however, there was no micro data to study who owns the wealth
hidden offshore.
5
2.3 Long-Run Trends in Inequality
Over the last fifteen years, there has been renewed interest for the long-run evolution of the
distribution of income and wealth. Following the pioneering work of Kuznets (1953) and Atkin-
son and Harrison (1978), a number of studies have used tax data to construct top income and
wealth shares for many countries.2 A key concern raised by the use of tax returns to measure
inequality, and indeed one of the main reasons why tax data have for a long time been viewed
with skepticism, is tax evasion.
The lack of data about tax evasion by the very wealthy is particularly problematic for
inequality studies because most of the cross-country and historical variations in inequality come
from the very top of the distribution. In the United States, the share of wealth owned by the top
0.1% (with more then $20 million in net wealth today) has increased from about 7% in in the
late 1970s to 22% today, while the wealth shares of the groups just below has remained mostly
flat (Saez and Zucman 2016). Similarly, the decline in income concentration seen in France and
most developed countries during the first half of the twentieth century owes to the fall of the
“rentiers,” the top 1%, and not the next 9% (Piketty 2003).
Tax evasion can bias cross-country and time-series comparisons of top income and wealth
shares in multiple directions. Countries with high rates of capital taxation (such as Norway)
may hide more wealth than countries with low rates on capital (such as Japan and the US),
leading to artificially low measured inequality in Europe; but this incentive effect may be offset
by differences in social norms and overall level of compliance. Since 2013, many tax havens
have promised to automatically exchange bank information with foreign tax authorities. This
recent policy change may have led to more reporting and caused measured inequality to increase
spuriously.3
The literature on inequality has discussed the potential problems raised by tax evasion (e.g.,
Piketty 2001; Atkinson, Piketty, Saez, 2011), but until recently there was little data that would
allow to systematically quantify it. Larudee (2016) investigates the extent to which capital
flight to Switzerland can explain the decline in the French top 1% income share between the two
world wars. Roine and Waldenstrom (2009) is the only paper that focuses on the distributional
implications of hidden wealth for the recent period. They use an indirect method—residual
2See, e.g., Piketty 2001, Piketty and Saez 2003, Saez and Zucman 2015; for surveys see Atkinson et al. 2011,Alvaredo et al. 2013. Top income and wealth share series are collected in the World Wealth and Income Database(Alvaredo et al. 2015), http://wid.world.
3However, because foreign banks cannot easily be audited by foreign governments, and because some of themmay still find it profitable to sell tax evasion services, it is unclear how truthful this form of reporting will turnout to be.
6
flows in the balance of payments and financial accounts—to estimate the amount of wealth
hidden by Swedish residents, and assume that this wealth primarily belongs to the top.
3 Tax Evasion by the Wealthy: Evidence from Leaks
In this Section we analyze three new samples of micro-data on high-end tax evasion: the HBSC
leak, the Panama Papers, and a a sample of amnesty participants.
3.1 Scandinavian Wealth Data
In order to rank HSBC account holders, Panama papers individuals, and amnesty participants
in the wealth distribution, we start by constructing the full distribution of household wealth in
Norway, Denmark, and Sweden following a common methodology. All wealth series, computa-
tions, and results are described in a detailed manner in Online Appendix A; here we discuss the
main data sources and conceptual issues.
We compute wealth at the individual level for the entire population by distributing 100%
of the macroeconomic amount of household wealth at market value recorded in the national
accounts. We do so in keeping with international, standardized concepts and guidelines codified
in Alvaredo et al. (2016). This enables us to estimate wealth levels and shares for Scandinavia
that are directly comparable to those estimated in the United States by Saez and Zucman (2016)
and in a growing number of countries that follow similar methods (see Alvaredo et al., 2017).
Wealth includes all the non-financial and financial assets that belong to Scandinavian resident
households, minus debts. It includes in particular all funded pension wealth, and excludes the
present value of future government transfers, as well as consumer durables and valuables.
Our starting point is the population-wide administrative wealth micro-data maintained by
Scandinavian authorities. Although these data are generally of high quality,4 they suffer from
two limitations. First, and most importantly, they disregard funded pension assets. Second,
they do not accurately capture forms of wealth that are not reported by third parties, namely
unlisted corporate equities and non-corporate business assets. We deal with these issues as
follows. First, we impute pension wealth by assuming that 40% belongs to wage-earners and 60%
belongs to retirees; pension wealth allocated to wage-earners is then distributed proportionally
to wage income and pension wealth allocated to retirees proportionally to the income derived
4They have been fruitfully used to study, e.g., retirement saving (Chetty et al., 2011), intergenerational wealthmobility (e.g., Boserup, Kopczuk and Kreiner, 2016) and the accuracy of survey responses (Kreiner, Lassen andLeth-Petersen, 2012).
7

from pension funds.5 Second, we impute unlisted equities by capitalizing dividends earned from
unlisted corporations. The capitalization rate is the ratio of the market value of unlisted firms
(as recorded in the national accounts) by the flow of unlisted dividends reported on tax returns.
Third, we impute non-corporate business assets by capitalizing business income in the same
way. These imputations introduce a small noise at the micro-level, but this noise is irrelevant
for our purposes, for one simple reason. The largest form of wealth missed by the administrative
data is pension wealth, and although this wealth accounts for a large fraction of middle-class
assets, it is negligible at the top of the distribution, the main focus of our analysis. Throughout
the paper, our unit of analysis is the tax unit, defined as either a single person aged 20 or above
or a married couple, with children dependent if any.
Next, we combine Denmark, Norway, and Sweden into a single Scandinavian aggregate as
follows. We collapse each country’s population-wide data into small bins (of as few as 10 tax
units at the top), compute average, minimum, and maximum wealth in each bin, and interpolate
the distribution of wealth within each bin using the generalized Pareto interpolation methods
recently developed by Blanchet et al. (2017). This makes it possible to study the distribution
of wealth and tax evasion in Scandinavia as a whole, in a dataset that is virtually identical to
the one that would exist if the population-wide files of the three Scandinavian countries could
be appended (which is not currently possible). The country distributions turn out to be very
similar to the overall Scandinavian distribution, as reported in the Appendix Table S.1. Norway,
Sweden, and Denmark have inequality levels comparable to those of France (Garbinti, Goupille
and Piketty) and much below those of the United States (Saez and Zucman, 2016). Strikingly,
although average household wealth is the same in Scandinavia and in the United States, the
top 0.1% is twice richer in the United States, and the middle-class (households in between the
median and the 90th percentile) twice poorer.
3.2 HSBC Private Bank Switzerland Leak
In 2007 a systems engineer, Herve Falciani, extracted the internal records of HSBC Private
Bank, the Swiss subsidiary of HSBC. Falciani turned the data over to the French government in
2008 who shared it with foreign administrations. The newspaper Le Monde obtained a version
of the tax authority data and shared it with the International Consortium of Investigative
Journalists. In Denmark and Norway, the data we use are from the version of the HSBC list
5Funded pension wealth has been recorded in Denmark since 2012, and we have checked that our imputationmethod delivers a very accurate distribution of pension wealth. Saez and Zucman (2016) impute pension wealthsimilarly in the United States.
8

shared by the French tax authority with foreign administrations. In Sweden, the data are from
the list obtained by the ICIJ and affiliated journalists.6
The HSBC leak was not the result of specific enforcement effort by tax authorities and can
be seen as a random event. The documents leaked by Falciani include the complete internal
records—including the names and in a majority of cases account values—of the more than
30,000 clients of this Swiss bank in 2006-2007. Importantly, HSBC Switzerland recorded the
name of the beneficial owners of the wealth it managed, even when this wealth was held—as
is frequently the case—through shell companies. Identifying beneficial owners is a requirement
for banks under anti-money laundering regulations and HSBC appears to have been complying
with this rule.
At the time of the leak, HSBC Switzerland was a major actor in the offshore wealth man-
agement industry. As shown by Table 1, it managed about 4% of all the wealth managed by
Swiss banks, US$ 118.4 billion out of US$ 2,475 billion. The US$ 118.4 billion figure is the
official value published by HSBC. The amount of foreign wealth managed by all Swiss banks
(US$ 2,475 billion) is from the official statistics published by the Swiss central bank, which
reports on the stock of wealth managed by Swiss banks on behalf of foreigners on a monthly
basis (see Zucman, 2013, 2014, 2015 for a detailed analysis of this unique, high quality dataset).
The Swiss central bank also provides an annual country-by-country breakdown of this total,
which enables us to estimate the amont of wealth managed by Swiss banks on behalf of Danish,
Swedish, and Norwegian residents. As reported in Table 1, we find that HSBC Private Bank
Switzerland also managed about 4% of all the Swiss wealth belonging to Scandinavians. This
result shows that HSBC was not catering to Scandinavian households in particular.
More generally, the available evidence suggests that HSBC was representative of the overall
Swiss banking industry. A country-by-country breakdown of the wealth managed by HSBC
Switzerland in 2006-2007 based on an exhaustive exploitation of the file leaked by Falciani,
is published by the ICIJ.7 Figure 2 compares the country distribution of the foreign wealth
managed by HSBC Switzerland to the country distribution of all the foreign wealth managed
by all Swiss banks. Some countries are slightly over-represented in the HSBC leak, most notably
Venezuela, the United States, and Brazil. This can be explained as follows. In 1999, HSBC
Switzerland merged with the Republic National Bank of New York and Safra Republic Holdings
6Online Appendix B provides detailed background information about HSBC Switzerland Private Bank andanalyzes the information made public by the ICIJ. A number of high-profile names appearing in the leak havebeen disclosed by ICIJ, but the complete list of HSBC account-holders is not publicly available.
7See http://projects.icij.org/swiss-leaks/.
9

SA, two private wealth management banks with a strong customer base in the United States and
Brazil respectively. In addition, according to the ICIJ, the biggest account at HSBC Switzerland
was a US$ 11.9 billion account registered in the name of Venezuela’s National Treasurer. Despite
these idiosyncrasies, the share of HSBC’s wealth owned by each country i (sHi ) is overall tightly
linked to its share of all Swiss banks’ wealth si. A regression of sHi on si has a slope of 1.00 and
R2 of 0.80.
The top panel of Figure 3 shows how the probability to have an unreported HSBC account
varies with wealth. The sample includes 520 households who held an account at HSBC Switzer-
land, were taxable in Scandinavia in 2006, could be matched to a tax return, and did not report
their HSBC account.8 It excludes 133 Scandinavian account holders whose name could not be
matched to a 2006 tax return; it also excludes all non-resident nationals (who were not taxable).
The probability to evade taxes at HSBC is negligible up to the top 1% threshold. It then rises
very steeply within the top one percent. For the top 0.01%—tax units with more than $44.5
million in net wealth in 20069—we find that close to 1.0% of taxpayers were evading taxes at
HSBC. This is 13 times more than for households in the bottom half of the top 1%, that is in
between percentile 99 ($2 million in net wealth) and 99.5 ($3 million).
Three remarks are in order here. First, the differences in the probabilities to own a hidden
account by wealth group are statistically significant. The first column of Table 2 reports boot-
strapped standard errors for these probabilities. As shown in the second column Table 2, the
probabilities differ from each other at the 5% level. The only exception is for the top 0.01% of
the wealth distribution, where the small sample size does not allow us to reject the null hypoth-
esis that the probability to evade taxes is the same as in the rest of the top 0.1%.10 Second, for
the purpose of ranking HSBC account-holders in the Scandinavian wealth distribution, we add
the hidden HSBC wealth to non-hidden wealth.11 This mechanically moves HSBC evaders up
8One exception is for Sweden where we cannot identify whether the accounts were properly declared or not.In both Denmark and Norway, in between 90% and 95% of all HSBC accounts were not declared, so this datalimitation in Sweden is unlikely to be an important issue.
9All dollar figures given in this paper are at current prices (i.e., $44.5 million is the threshold to be part of thetop 0.01% of the Scandinavian wealth distribution in 2006 at 2006 prices) and using current market exchangerates (i.e., the 2006 year-average exchange rate was used to convert Danish, Swedish, and Norwegian krona intoUS dollars).
10The Online Appendix reports a version of Table 2 where the top 0.01% is lumped together with the next0.04%, i.e., the top 0.1% is split in two equal-size groups, P99.9–99.95 (tax units with between $9.1 million and$14.6 million in net wealth) and P99.95–100 (tax units with more than $14.6 million). The probabilities to ownan HSBC account is statistically different in these two groups at the 10% level.
11The amount hidden at HSBC is observable for 300 household out of 520. As discussed in Appendix B,this mostly reflects the fact that a number of clients held assets in multiple accounts owned by several shellcorporations, trusts, and foundations, such that HSBC Private Bank itself did not have a clear view of theextent of their holdings.
10

the wealth ladder. However, this re-ranking does not drive the sharp gradient in the probability
to evade taxes by wealth group reported in the top panel of Figure 3. In Appendix Figure
S.2, we re-produce this figure but ranking households by their wealth excluding that hidden at
HSBC; the qualitative results are unaffected.12 Last, 50 households (around 10% of the sample)
have less than $100,000 in net wealth (including that hidden at HSBC); half of them have neg-
ative net wealth. It is very likely that we under-estimate the assets of these households: they
may hide assets in other banks, or more generally own non-third-party-reported assets that we
don’t capture, such as closely-held businesses that don’t pay dividends. Whatever the reason,
the implication is that we under-estimate the true probability to evade taxes in the top wealth
groups.
The bottom panel of Figure 3 shows the ratio of the wealth held at HSBC over total ob-
servable wealth in the sample of 300 HSBC evaders with available account values—what can be
called the intensive margin of evasion, in contrast to the extensive margin studied in the top
panel. On average, account holders hid about half of their wealth, with no trend across the
distribution.
3.3 Evidence from the Panama Papers
A body of additional evidence suggests that the probability to use offshore financial institutions—
beyond HSBC Switzerland—in order to conceal assets rises sharply with wealth.
First is another leak—the Panama Papers. In the Spring of 2016, the ICIJ published the
names and addresses of the owners of shell companies created by the Panamanian firm Mossack
Fonseca.13 The leak occurred in 2015—eight years after the HSBC leak. It provides information
on shell corporation that were still active in 2015 despite the increased scrutiny of offshore
evasion after the financial crisis. We matched the names of the shareholders of these shell
12We find it more meaningful to include hidden wealth when ranking households, because doing so deliversthe best estimate of the amount of wealth the HBSC evaders actually own given observable data. Note thatif HSBC account holders own hidden assets in other banks too, then we under-estimate their true wealth. Inthe extreme case where all offshore wealth belongs to the HSBC sample (i.e., these are the same householdswho have unreported accounts at HSBC, UBS, Credit Suisse, etc.), then many HSBC account holders rankedbelow the top 0.01% actually belong to the top 0.01%. Conversely, if all the non-HSBC offshore wealth belongsto other tax evaders (i.e., HSBC account holders do not hide assets elsewhere), then we over-estimate the rankof HSBC account holders in the true Scandinavian wealth distribution. Our computations that add observablehidden wealth to non-hidden assets to rank households reach a middle ground between these two polar cases.With the data at our disposal, we cannot tell whether tax evaders tend to have accounts in numerous banks orin just one.
13Online Appendix C provides background information about the Panama Papers and analyzes the datamade public by the ICIJ. In contrast to the HSBC leak, all the names and corporate structures appearing in theMossack Fonseca files have been disclosed by the ICIJ.
11

companies to individual wealth data in Norway and Sweden (but not Denmark).14 Although
Mossack Fonseca—like HSBC Switzerland—is a major provider of offshore services, the sample
of matched households is smaller than for the HSBC leak (165 vs. 520). Beyond the exclusion
of Denmark, one other factor contributes to the smaller sample size: a large number of shell
companies cannot be linked to their ultimate owner. A company created by Mossack Fonseca
can be owned by another shell created by another incorporation agent, in which case ultimate
owners remain untraceable—while they are usually identifiable at HSBC. A last limitation of
the Panama Papers is that we don’t know whether Scandinavians named in the leak evaded
taxes. There are legal uses of shell companies, and the investigations conducted by the tax
authorities are still ongoing.
Despite these limitations, the Panama Papers provide valuable information. They confirm
that the use of tax havens steeply rises with wealth. The distribution is even more skewed than
in the HSBC leak. As shown in the top panel of Figure 4, the probability to own a Mossack
Fonseca offshore shell company reaches 1.2% in the top 0.01% of the (Norwegian plus Swedish)
wealth distribution, against less than 0.2% for all groups below the top 0.01%. The difference
between the top 0.01% and all other groups is highly statistically significant (Table 2, col. 5).
As shown by Appendix Figure S.10, the picture is similar when one looks at Norway and Sweden
separately.
3.4 Evidence from Tax Amnesties
A number of governments enable tax evaders to declare previously hidden wealth in exchange
for reduced penalties. In Norway and Sweden we can match amnesty participants to their
individual socio-economic characteristics.15 We have access to voluntary disclosures made since
2006. Like for the HSBC leak and the Panama Papers, we match amnesty participants to their
2006 wealth. In the case of Norway, the amnesty program has been in place since 1950 but the
number of participants only picked up significantly in 2009, when G20 countries compelled the
most important tax havens to exchange bank information upon request with foreign authorities
(Johannesen and Zucman, 2014).
A key advantage of the amnesty dataset is the large sample size: 1,422 in Norway; 6,811 in
Sweden. Another key strength is that we know that tax evasion is, by definition, involved.16
14We match the Panama Papers names to 2006 wealth, just like for HSBC. We chose to use 2006 instead of2015 because Sweden abolished its wealth tax in 2007, and although wealth could be estimated post-2007 bycapitalizing income (see Lundberg and Waldenstrom, 2015), this would introduce noise at the micro level.
15Appendix D discusses the specifics of the Norwegian and Swedish amnesties.16In a small number of cases, the tax authority deems the disclosures made by amnesty participants not worth
12

This data source, however, suffers from one limitation: there could in principle be selection into
the amnesty based on wealth. According to the canonical Allingham and Sandmo (1972) model
of tax evasion, tax evaders should continue evading as long as τ , the marginal tax rate they
face, is greater than p× θ, the probability to be detected times the penalty if detected. In 2009,
when the number of households participating in amnesties starts rising, the only parameters
that changes in this equation is the perceived probability to get caught, which increases by dp.
The increase may very well depend on wealth—and the effect could go either way. For instance,
only unsophisticated, moderately rich individuals with inherited offshore accounts might have
felt an increase in p in 2009; the wealthiest evaders may have felt safe and considered they would
always be able to conceal their wealth by using sophisticated combinations of shell companies
and trusts. One can imagine, on the contrary, that the richest evaders might have perceived
a greater increase in p; they might, for instance, have expected governments to focus their
enforcement effort on the few largest potential evasion cases. In the end, whether richer evaders
self-select into amnesties is an empirical issue.
As reported in the bottom panel of Figure 4, the probability to disclose previously hidden
assets rises sharply with wealth, like in the other samples. There are, however, interesting
differences with the HSBC leak. Households between the 95th and the 99.5th percentile—i.e.,
with net wealth between about $1 and $3 million—are relatively over-represented in the amnesty
sample. For that group, the odds of using the amnesty are 32.8 higher than the odds of evading
taxes at HSBC. For the top 0.1%, by contrast, the odds ratio equals 20.4 only. Poorer evaders
were thus more likely to self-select into the amnesty. Despite this, the number of ultra rich
individuals who use the amnesty is impressive—14% of all top 0.01% Norwegian and Swedish
households have used it. Columns 11 and 12 of Table 2 pool HSBC evaders and amnesty
participants, excluding the very small overlap between the two samples. In total 14.8% of top
0.01% households—the smallest group we consider—revealed hiding wealth or were caught in
the HSBC leak, a probability statistically greater than that of the the next 0.04% (11.8%)
(which is itself statistically greater than than of the next 0.05%, etc.). Overall, the samples
we analyze therefore paint a consistent and robust picture: the probability to hide wealth rises
sharply, continuously, and significantly from $3 million in net wealth to $10, $20, and $40 million
plus—levels of wealth that could not be observed in prior studies of tax evasion.17
investigating—either because it considers the amounts involved negligible or because it concludes that no taxevasion has actually been committed. We exclude these cases from the analysis; see Appendix D for a detaileddiscussion.
17Data limitation, however, does not allow us to zoom further within the top 0.01% to see whether evasioncontinues to rise (say, between $40 million and $100 million, $100 million and $500 million, etc.). One would
13

4 The Size and Distribution of Tax Evasion
What are the implications of the tax evasion seen in random leaks? In this section, we combine
the leaked micro data with macro estimates of the stock of offshore wealth to estimate how
much taxes each wealth group evades through the use of tax havens. We then contrast and
combine the results with data from a large, high-quality random audit study to estimate the
size and distribution of total tax evasion.
4.1 Offshore tax evasion
In order to infer the distribution of offshore tax evasion in the Scandinavian population from
leaks, we proceed as follows. We first estimate the amont of wealth held in all the world’s
offshore tax havens by Scandinavian households at the end of 2006, and then distribute this
wealth across households based on how offshore wealth held at HSBC Switzerland and disclosed
in amnesties is distributed. We discuss both steps in turn.
4.1.1 Macro stock of offshore wealth
We are first interested in quantifying the macro stock of financial wealth that Scandinavians
own outside of their country of residence. All macro series, references, computations and results
are described in a detailed manner in Online Appendix F; here we discuss the main data sources
and conceptual issues. While quantifying offshore financial wealth involves a margin of error,
this exercise can actually be conducted fairly rigorously and precisely, for one simple reason:
there exists several official, direct, and publicly available statistics on the wealth held in tax
havens. Some of these data raise difficulties, as we discuss below, but taken together they paint
a consistent picture.
There are three main data sources to measure the amount of offshore financial wealth. First,
a number of tax haven central banks—most importantly the Swiss National Bank—publish
detailed, high-quality statistics on the bank deposits, portfolios of equities, bonds, and mutual
fund shares managed by domestic banks on behalf of foreigners. These statistics cover all
domestic banks, including branches of foreign banks. Second, most tax havens, including Hong
Kong, Singapore, the Cayman Islands, the Bahamas, and Jersey, disclose statistics on foreign
bank deposits (but not on the more important form of offshore wealth, portfolio securities).
Third, we can have a sense of the global amount of offshore portfolio securities by looking at
need larger leaked datasets, in a large, unequal, and wealthy country (say, the United States) to shed light onthis question.
14

specific anomalies in official global investment statistics. The equities, bonds, and mutual fund
shares owned by households on foreign accounts are duly recorded on the liability side of the
international investment positions of countries (the stock equivalent of the balance of payments),
but not on their assets side. Using these anomalies, Zucman (2013) estimates that the equivalent
of 10% of the world’s GDP is held offshore globally. His estimate for 2006 is reported in Table
1 ($6.3 trillion). Switzerland alone manages a large fraction of the world’s offshore wealth ($2.5
trillion, around 40% of the total). The rest is held in the other cross-border wealth management
centers, primarily Singapore, Hong Kong, Luxembourg, the Cayman Islands, the Bahamas, and
Jersey.
In order to allocate the global stock of offshore wealth across countries, we rely on the official
Swiss National Bank country allocation of the Swiss-managed offshore wealth, and on similar
statistics recently released by a number of offshore centers (e.g., Luxembourg, the Channel
Islands, Hong Kong, but not the Cayman Islands or Singapore) through the Bank for Inter-
national Settlements.18 The results are reported in Table 1. Scandinavians appear to use tax
havens less than other countries. That is, by our estimates, the macro stock of wealth hidden
offshore by Scandinavians is equal to 1.8% of their total household wealth, twice as less as the
world average of 3.7%.
4.1.2 The distribution of the stock of offshore wealth
Next, we distribute the 1.8% total based on the observed distribution of offshore wealth at
HSBC and among amnesty participants. The top panel of Figure 5 shows that offshore wealth
is very similarly distributed in the two samples: close to 80% of it belongs to the top 0.1%,
and close to 50% belongs to the 0.01% richest households. To compute the implied amount
of taxes evaded, we assume that tax evaders have the same taxable rate of return as the one
observable on non-hidden wealth in Scandinavia, namely, 3.5%. We then apply the tax law of
each country (income and wealth taxes) to compute how much taxes owed were not paid on the
wealth hidden abroad and the income it generates (dividends, interest, capital gains, under our
3.5% rate of return assumption).
The main source of uncertainty in this computation is the amount of hidden offshore wealth
held in total by Scandinavians in 2006. There is one sure piece of information: the amont of
wealth held in Switzerland, which is based on high-quality official published statistics. Therefore
in our lower bound scenario, we simply assume that Scandinavians do not own any offshore
18See Appendix E for complete methodological details.
15
wealth outside of Switzerland. As the bottom panel of Figure 5 shows, this implies that the
top 0.01% evades at least 10% of its taxes through unreported offshore accounts. In our upper
bound scenario, we assume that Scandinavian countries hide as much wealth offshore as other
other countries, relatively to the size of their economy (i.e., 3.7% of their wealth). If that is
true, then offshore tax evasion rises to close to 60% of taxes owed for the top 0.01%. All of these
figures under-state true tax evasion at the top because they only include tax evasion on wealth
and capital income (dividends, interest, capital gains); they do not take into account any tax
evasion that might have occurred on the principal (e.g., unreported black market activity).
4.2 Tax evasion in Random Audit Data
In order to have a broad view of total evasion, we combine our new estimates of offshore evasion
with the tax evasion detected in random audit studies.
Our baseline measure of detected tax evasion comes from high quality, stratified random
audits conducted by the Danish Tax Authority (SKAT). The first wave of this program, for
tax year 2006, was studied by Kleven et al. (2011); we refer to them for a description of the
Danish institutional context. In this paper, we analyze the three subsequent waves of audits,
which were conducted for tax years 2008, 2010, and 2012. The random audit program works as
follows. Once every two years, SKAT randomly selects a sample of self-employed individuals and
a sample of individuals who are not self-employed (including, e.g., wage-earners and retirees).
The sampling rate is higher for the self-employed (who are relatively more numerous at the top
of the distribution), and in both groups taxpayers with complex tax returns are over-sampled
Our final sample pools tax years 2008, 2010, and 2012 and includes 18,985 randomly audited
taxpayers (6,223 self-employed and 12,762 non self-employed), of which 663 turned out to be in
the top 1% of the wealth distribution.19
As explained in Kleven et al. (2011), the audits are comprehensive and examine every
line item on the tax return using several verification procedures and sources: data available
internally at SKAT; information provided by employers, banks, credit card companies, and other
financial institutions; and supporting documentation requested to the tax-payers themselves.
This procedure enables to detect a wide range of errors, from mistakes in the claiming of
deductions (e.g., for alimony or commuting expenses) to mis-reporting of income that is not
declared by a third party (e.g., taxable fringe benefits). In addition, the tax authority compares
19Overall, 0.15% of the entire adult Danish population is randomly audited each year in the context of thisprogram. The empirical sampling rate is 3.5 times higher for taxpayers in the top 1% of the distribution (0.53%);see Appendix Table S.1.
16

disposable reported income to estimates of consumption and the change in wealth over the tax
year—drawing on high quality administrative wealth records—to attempt to detect unreported
labor market activity. SKAT improved its audit technique after 2006—the first year it conducted
the random audit program—and now detects more errors. While mistakes were found for 10.7%
of all individuals audited in 2006 (Kleven et al., Table 2 col. 2 line 2), the error rate climbed to
12.5% in 2010 and 2012.20 Despite the amount of resources devoted to them, the random audits
do not capture all forms of evasion, however. They entirely miss, in particular, offshore evasion.
In the rare cases when the auditor might suspect such type of evasion, the case is transferred to
a specialized unit within SKAT that has the skills to conduct a specific investigation. Whatever
is found at the end of this long process is not included in the result of the random audit study,
as this would delay the publication of the results for too long.
The analysis reveals three main findings.
First, the audits uncover a lot of evasion: in the top 5%, about 30% of audited taxpayers
are found evading taxes (top panel of Figure 7). Second, the amounts evaded are usually small:
unreported income is around 10% of total income (bottom panel of Figure 7). As a result, the
tax gap estimated in the random audit is small: 2.3% of taxes owed are not paid (Figure 6),
a number that increases slightly to about 4% in the top 5% of the wealth distribution. Even
where evasion is the highest, tax evasion does not exceed 5% of all taxes owed. Evasion appears
to be rising around the 95th percentile of the wealth distribution. and to stabilize within the top
5%. Evasion rates are also higher than average in the bottom decile of the wealth distribution,
which includes tax units with large debts and potentially mis-measured assets (hence artificially
low net wealth). Consistent with the analysis of Kleven et al. (2011), we find that rates of tax
evasion are almost zero for income that is third-party reported, and only become significant for
self-reported income (e.g., from self-employment), which is more common at the top.
4.3 Implications for the Measurement of Inequality
Here we analyze how accounting for offshore wealth affects measured wealth inequality. We
illustrate this with the case of Norway where high quality, long-run time series of top wealth
shares exist. By our estimate about 40% of the Norwegian households in the top 0.1% hid
wealth abroad in the mid-2000s and these tax evaders hid on average about 50% of their assets.
Thus the top 0.1% hid 20% of its total wealth, and including this previously unmeasured wealth
increases the top 0.1% wealth share from 8% to 10%, as reported in the top panel of Figure
20In addition to an improvement in the conduct of audits, part of this increase may reflect a real decline incompliance between 2006 and 2010.
17

8. This correction erases half of the decline in the top 0.1% wealth share observed in tax data
since the 1930s, at a time when offshore wealth was much less important and when, according
to the tax returns of the time, the top 0.1% wealth share was 12%.
For the top 0.01%—the wealthiest 300 or so Norwegian households—taking offshore wealth
into account increases reported wealth by a third (bottom panel of Figure 8). These results
highlight the need to move beyond tax records to capture income and wealth at the very top,
even in countries where tax compliance is generally high. They also suggests that tax data may
significantly under-estimate the rise of wealth concentration over the last four decades, as the
world was less globalized in the 1970s, it was harder to move assets across borders, and offshore
tax havens played a less important role.
5 A Model of Tax Evasion and Inequality
How can we explain the sharp gradient of evasion with wealth that we estimate? In this Section,
we present a model of the supply side of tax evasion services can account for this pattern.
We consider a population of mass one where wealth y is distributed according to some
probability density function f(y). Consider first the case of a monopolistic firm that sells tax
evasion services; think for instance of a Swiss bank (or a cartel of Swiss banks). The bank
charges θ per dollar of wealth that it hides from tax authorities. To simplify the analysis and
focus on the main mechanism at play, we assume the bank faces an infinitely elastic demand,
hence takes θ as given and optimizes on the number of clients it serves. The assumption of a
perfectly elastic demand is irrelevant for our qualitative findings, and any model of the demand
side of evasion services can easily be nested into our model.21 Each of the bank’s client has
a probability λ to be found evading taxes. When the bank offers tax evasion services to the
fraction of the population s = 1−F (y) =∫z>y f(z)dz that has wealth greater than y, it manages
k(s) in wealth hence earns θk(s) in revenue. It also has a probability λ(s) that at least one of
its clients is found evading taxes. When a client is found evading, this reveals that the bank
is breaking the law and triggers a fine. The fine φk(s) is proportional to the amount of wealth
21Assuming a less than perfectly elastic demand would reduce the equilibrium fraction of the population thatevades taxes, reinforcing the main conclusion of the analysis, but it would make the formulas below slightly morecomplicated as θ would now depend on s. Assuming infinitely elastic demand means the bank acts in effect ason a competitive market. The advantage of this simple market structure (as compared to assuming there is acontinuum of banks that acts competitively) is that we do not need to model how banks split customers, andcan instead model the market supply curve directly. More importantly, support for the monopolistic assumptioncomes from the fact that Swiss banks historically had a cartel agreement, the Convention IV of the SwissBankers Association, that strictly regulated fees and prevented non-linear pricing (e.g., banks setting lowerprices for wealthier customers); see Zucman (2015).
18
managed. We assume the bank is risk-neutral, hence it maximizes profits
π(s) = θk(s)− λ(s)φk(s)
An interior optimum for s satisfies the first-order condition dπ/ds = 0, which is θk′(s) =
λ′(s)φk(s) + λ(s)φk′(s).22 Denote by ελ(s) = sλ′(s)/λ(s) the elasticity of the detection proba-
bility with respect to s, and by εk(s) = sk′(s)/k(s) the elasticity of the amount of hidden wealth
managed with respect to s. The first-order condition can be rewritten
θ =
(ελ(s)
εk(s)+ 1
)φλ(s)
The left-hand side is the marginal revenue of servicing an extra percent of the population,
and the right-hand side is the marginal cost. If ελ(s) = 0, i.e., in the simple case where the
probability for the bank to be found breaking the law does not depend on the size of its clientele,
then the marginal cost is simply φλ(s), the probability to be detected times the associated fine.
But in the general case, the probability to be found breaking the law is endogenous and rises
with s, hence the marginal cost is greater than φλ(s).
When λ is small, ελ(s) is equal to 1. Furthermore, in the case where wealth is Pareto
distributed with a Pareto coefficient a > 1, then εk(s) has the remarkable property that it does
not depend on s either; it is equal to one over the inverted Pareto-Lorenz coefficient a/(a−1). A
high a corresponds to a relatively equal distribution of wealth; a low a corresponds to an unequal
distribution; when a→ 1, inequality tends to infinity. Income and wealth tend to follow Pareto
distributions at the top, and a large literature estimates Pareto and inverted Pareto-Lorenz
coefficient over time and across countries (see, e.g., Atkinson, Piketty and Saez 2011, Table 3
and Figures 12, 13, 14 and 15). A typical value of a for the wealth distribution is a = 1.5,
which corresponds to an inverted Pareto-Lorenz coefficient a/(a− 1) equal to 3. When wealth
is Pareto distributed, the supply curve of tax evasion services has thus a simple closed-form
expression.
Proposition 1. When wealth is Pareto-distributed, the supply curve of tax evasion services is:
θ =
(a
a− 1+ 1
)φlog
(1
1− p
)s
22Our formulation of the bank’s problem assumes that the bank starts by servicing the wealthiest individualsand then moves down the wealth distribution up to the point where the marginal revenue equals the expectedmarginal cost. Given that each client has the same probability λ to be found evading taxes but that wealthierclients generate more revenue, this is the optimal sequence for the bank to follow. Second-order condition....
19

Where p = 1−e−λ is the probability that the bank is caught when it serves the full population.
Proof. The probability λ(s) that at least one client is found evading when the bank serves s
clients is 1− e−λs, which is equal to λs when λ is small. Hence ελ(s) = sλ′(s)/λ(s) = 1.
By definition k(s) =∫z>y zf(z)dz and s = 1− F (y) =
∫z>y f(z)dz, therefore k′(s) = y and
ελ(s)
εk(s)=
1
sk′(s)/k(s)=
∫z>y zf(z)dz
(1− F (y))y
When y is Pareto distributed above wealth ymin with Pareto coefficient a, then the probaility
density function is f(y) = ayamin/y1+a, the survival function is 1 − F (y) = (ymin/y)a, and
straightforward integration shows that
∫z>y
zf(z)dz =a
a− 1y(1− F (y))
Therefore:ελ(s)
εk(s)=
a
a− 1
That is, the Pareto distribution has the unique property that εk is constant and equal to
one over the inverted Pareto-Lorenz coefficient a/(a− 1).
Finally, since each client has an instantaneous probability λ to be detected, the probability
that at least one person is detected when the bank services the full population (0, 1) is 1− e−λ.We denote this probability by p, hence λ = log(1/(1− p)) and
λ(s) = λs = log
(1
1− p
)s
The supply curve is upward slopping with s = 1 − F (y). The higher the price charged per
dollar hidden, the greater the fraction of the population covered (i.e., the lower the wealth y of
the marginal client). When the demand for evasion services is infinitely elastic at price θ, the
equilibrium fraction of the population that evades taxes is:
s = 1− F (y) =θ(
aa−1
+ 1)φlog( 1
1−p)
When the probability to be found p tends to 1, the fraction of the population evading taxes
goes to 0. When the fine φ tends to infinity, the fraction s also goes to 0. Most importantly,
when inequality rises (a falls), then s falls; it tends to zero when inequality becomes infinite
(a→ 1). In a very unequal world, banks will tend to service only very few clients. Since wealth
20
is very concentrated, this can explain why evasion is almost zero everywhere except at the very
top of the distribution. The intuition for this result is the following. When inequality is high
(a → 1), a handful of individuals own the bulk of wealth; they generate a lot of revenue for
the bank and are unlikely to be detected. Moving down the distribution would mean reaching
a big mass of the population that would generate only relatively little additional revenue but
would increase the risk of detection a lot; it is not worth it. Conversely, when inequality is low
(a→∞), the bank needs to move down a lot to hit a significant mass of the population.
As a simple calibration of the model, assume that 10% of the population owns more than
$1 million, a threshold above which wealth is Pareto distributed.23 Assume the cartel of banks
charges an annual fee of θ = 1% on the wealth it manages, there is a p = 10% annual chance
that it is caught if it serves all individuals with more than $1 million,24 and if caught it has to
pay a fine equal to φ = 20% of the wealth managed.25 When inequality is low (a = 3), the cartel
serves all the clients with more than $1.7 million in wealth, which corresponds to s = 19% of
the population above $1 million. When inequality is high (a = 1.2), it only serves clients with
more than $9.4 million in wealth, which corresponds to s = 6.8% of the population above $1
million.26 In other words, in the low inequality case the cartel supplies tax evasion services to
the top 2% of the population, and in the high inequality case it serves the top 0.6%.
6 The Interplay Between Tax Avoidance and Evasion
In this section, we consider the implications of our results for public finances. Should tax evasion
become impossible, would wealthy individuals pay significantly more taxes? The answer largely
depends on how substitutable illegal tax evasion and legal tax avoidance are. To address this
question, we analyze the behavior of the large sample of Norwegians who voluntarily disclosed
previously hidden wealth in the context of the tax amnesty described in section 4.3 above.
23In the United States, the threshold for the top 10% of the wealth distribution is about $800,000 today; seeSaez and Zucman (2016).
24The probability that the bank is actually caught is 1− (1− p)s which is less than p.25In 2014, Credit Suisse was fined $2.6 billion for conspiracy to aid and assist U.S. taxpayers in filing false
returns. According to a report by the U.S. Senate (2014), Credit Suisse had about $22,000 U.S. Customers with12 Billion Swiss Francs in assets in 2006 (about 10 billion dollars in 2006), the vast majority of which wereundeclared.
26A Pareto coefficient a = 3 corresponds to an inverted Pareto-Lorenz coefficient equal to 1.5 and a level ofinequality similar to the level of income inequality in the Netherlands today (see Atkinson, Piketty and Saez,2011, Table 6). A Pareto coefficient a = 1.2 corresponds to an inverted Pareto-Lorenz coefficient equal to 6 anda level of inequality greater than global wealth inequality.
21

6.1 Voluntary Disclosers
As we have seen, Norway operates a voluntary disclosure program under which tax payers can
avoid penalties and criminal sanctions relating to past tax evasion. Tax evaders can benefit
from the program under three conditions. First, the information has to be offered voluntarily,
not in connection with investigations by the tax authority. Second, sufficient information has
to be provided in order for the tax administration to assess the correct amount of taxes owed.
Last, information on the origin of the disclosed income or wealth must be provided.
While the voluntary disclosure program was rarely used in the decades following its incep-
tion in 1950, the number of voluntary disclosers surged dramatically around 2007. The surge
coincides with two events that might have led tax payers with hidden offshore wealth to perceive
an increase in the risk of detection. In a scandal widely covered by the media, the mayor of Oslo
had to resign from office in 2007 after his son-in-law revealed that the mayor owned undeclared
bank accounts in Switzerland. At the same time, Norway started signing information exchange
treaties that allowed the Norwegian tax authorities to obtain bank information from a number
of important tax havens in evasion cases.
As Appendix Figure S.17 shows, most disclosures happened in two waves, in 2009 and 2013-
14. The former wave coincides with the G20 tax haven crackdown where the most important tax
havens like Switzerland, Luxembourg and Singapore agreed to exchange bank information upon
request (Johannesen and Zucman 2014) while the latter wave coincides with the commitment
by the same tax havens to exchange bank information automatically.
Panel A of Table 2 compares the disclosers to the rest of the adult population in 2007,
immediately prior to the first wave of disclosures, in terms of demographics, wealth and in-
come. Disclosers are older (58 years old on average) and more likely to be male (63%), married
(57%) and foreign (21%) than non-disclosers. More strikingly, disclosers are extremely wealthy
compared to other Norwegians: they reported more than 100 times more wealth (at tax value)
than non-disclosers and accounting for unreported wealth on offshore accounts, they held more
than 200 times more taxable wealth. The difference in taxable income is much less pronounced,
especially when considering total income including labor income.
Panel B reports statistics on a number of tax avoidance indicators that we will use as
outcomes in the regressions below. First, the introduction of a dividend tax in 2006 made it an
attractive avoidance strategy for owners of closely held firms to pay out all retained earnings as
dividends in 2005: the propensity to maximize dividend payments in 2005 was 7% for disclosers
and 0.7% for non-disclosers. Second, under certain conditions the so-called 80%-rule (abolished
22

in 2009) provided for a rebate in the wealth tax liability if total tax liabilities in a given year
(income tax and wealth tax) exceeded 80% of the tax payer’s income: among disclosers around
7% benefitted from this rebate compared to 0.3% among non-disclosers. Third, a well-known
tax planning technique in the Norwegian context is the holding of unlisted shares. While listed
equities enter the wealth tax base at their market value, unlisted equities are taxed at the tax
value of the underlying business assets and since a sizable fraction of corporate assets, such as
real estate and intellectual property, have a tax value that is only a small fraction of their market
value, unlisted equities generally have a tax value that is much lower than listed equities with
a similar market value.27. Around 30% of disclosers held unlisted securities in 2007 compared
to around 4% of non-disclosers. Fourth, by holding assets in a separate legal entity, owners can
defer personal taxes on the capital income accruing to their assets: among disclosers, 9% owned
a holding company compared to 0.6% among non-disclosers. Finally, we show the propensity
to report zero taxable income, zero capital income, zero wage income, zero taxable wealth and
zero tax liability for disclosers and non-disclosers respectively.
6.2 Estimating Substitution Between Evasion and Avoidance
To investigate how tax evaders change behavior when they disclose offshore assets, we employ an
event study design. With the aim of determining whether the end of evasion sparks an increase
in avoidance, we estimate the change in various measures of reported wealth, income and tax
liabilities around the time of disclosure. Our estimating sample includes all 1,307 disclosers
whose cases have not been dropped as well as a sample of non-disclosers serving to establish a
counterfactual. The control sample includes all non-disclosers in the top 10% of the 2007 wealth
distribution and a randomly selected 10% sample of the of the non-disclosers in the bottom 90%.
The specification includes individual fixed effects that absorb level differences in the outcomes
across tax payers and ensure that the variables of interest are identified only from time variation.
Moreover, we divide the sample of disclosers into ten equally sized groups based on their market
net wealth in 2007 (before the first wave of disclosures), assign non-disclosers to these same
wealth groups, and introduce a separate set of time dummies for each group. This allows time
trends to vary across tax payers with different wealth levels and ensures that we identify from
a comparison of evaders and non-evaders that are similar with respect to their 2007 wealth.
Similarly, we allow time trends to vary across tax payers of different ages (6 age groups) and
with different levels of 2007 total income (10 income groups). Finally, the specification includes
27Concretely, a recent study estimates that the tax rebate to the most liquid unlisted equities is around 70%and exceeded 90% for a set of unlisted equities that were eventually listed (Gobel and Hestdal, 2015)
23
a full set of event time dummies that indicate the year relative to disclosure. Since evaders
disclosing offshore wealth in the beginning of year t can incorporate the disclosed wealth into
the tax return for year t−1, we let year t−2 be the omitted event time category. The event time
dummies, which are the main variables of interest, measure changes in the outcomes relative
to period t− 2 over and above changes in the outcomes of similar non-disclosers over the same
time period.
6.3 Results
Panel A of Figure 10 illustrates the regression results where the outcome is wealth as claimed
by the tax payer on the first tax return before any corrections made by the tax administration
(“claimed taxable wealth”). The trend is almost the same for disclosers and non-disclosers in
the years -5 to -2; however, taxable wealth claimed by disclosers increases sharply by around
60% relative to that claimed by non-disclosers between the years -2 and 0 and remains at a
much higher level through year 4.
In Panels B and in Figure 12, we show results from analogous regressions where the outcome
is claimed income and claimed tax liabilities. In both figures, we see a similar pattern with
relative increases of around 20% in claimed income and around 30% in claimed tax liabilities
between the years -2 and 0.
Further, in Table 3, we check how disclosure affects the a number of tax avoidance out-
comes. In the interest of space, we report results from a modified version of the model that
summarizes the change at disclosure in a single coefficient by effectively comparing averages
before disclosure (years -4 to -2) and after disclosure (years 0 to 2) for disclosers relative to
non-disclosers.28 As a specification check, we show that the modified model generates results
for claimed wealth, income and tax liabilities that are consistent with the fully dynamic results
in Figure 10 (Columns 1-3). There are no signs that tax evaders incorporate holding companies
more frequently after disclosing their offshore accounts (Column 4) nor that they increase the
their holdings of tax favored asset classes such as unlisted equities (Column 5) and real estate
assets (Column 6). It also does not seem to be the case that these results mask heterogeneity
in the form of a tail of aggressive avoiders: tax evaders do not become more likely to report
zero capital income after disclosing offshore assets (Column 7). Finally, it seems that disclosure
makes tax evaders less inclined to emigrate (Column 8).
28This is implemented by omitting the event time dummies for periods -4, -3 and -2, such that these periodsconstitute the pre-disclosure baseline, and replacing the event time dummies for periods 0, 1 and 2 with a singlepost dummy.
24
One may think that the reason why offshore evaders apparently do not increase avoidance
after reducing evasion is that they have already exhausted all available avoidance strategies.
This would be the case if aggressive tax minimizers first search for legal ways to bring down
tax liabilities and subsequently supplement with illegal ways. We test this hypothesis in a
set of cross-sectional regressions for 2007, immediately prior to the first wave of disclosures,
where avoidance outcomes are regressed on a dummy indicating whether the individual discloses
offshore wealth at some point during the period 2008-2016 and a large number of controls: 100
dummies indicating the percentiles of the wealth distribution, 10 dummies indicating the deciles
of the income distribution and 6 dummies indicating age groups. This specification is effectively
asking whether offshore tax evaders were avoiding more or less prior to disclosure than tax
payers who were similar in terms of wealth, income and age.
Table 4, Column 1 shows a specification check: conditional on the covariates, there are no
significant differences in wealth across disclosers and non-disclosers, which ensures that differ-
ences in avoidance outcomes are not driven by wealth differences. Contrary to the hypothesis
that disclosers had already exhausted all available avoidance strategies, we find that disclosers,
prior to disclosure, were less likely to maximize dividend payments from closely held firms in
2005 (Column 2), less likely to own a holding company (Column 3) and less likely to benefit
from the 80% rule (Column 4).
Overall, these results suggest that amnesty programs generate a permanent increase in tax
revenue, which is not eroded by evaders substituting towards tax avoidance, and that the lack of
substitution is not because disclosers were already employing all available avoidance strategies.
7 Conclusion
In this paper, we combine micro-data leaked from financial institutions in offshore tax havens
with randomized audit data and population-wide registry data to study how tax evasion varies
with wealth. Random audit data, the key source used so far to study tax evasion, largely fails
to capture tax evasion at the top of the distribution. While the probability to deliberately
evade taxes found in random audits is generally low and does not rise with wealth past the 95th
percentile, the probability to hide wealth offshore rises very steeply within the top one percent.
Combining random audits and leaks, we estimate that the top 0.01% of the wealth distribution—
a group that includes households with more than $40 million in net wealth—evades about 30%
of its personal income and wealth taxes (Figure 1). This is an order of magnitude more than
the average evasion rate of about 3%.
25

Because the income and wealth that evades taxes is extremely concentrated, tax evasion
turns out to have important implications for the measurement of inequality. In the case of
Norway, accounting for tax evasion leads to an increase of 30% of reported wealth at the top of
the distribution. Our results highlight the need to move beyond tax records to capture income
and wealth at the very top, even in countries where tax compliance is generally high. They
also suggest that tax data may significantly under-estimate the rise of wealth concentration
over the last four decades, as the world was less globalized in the 1970s, it was harder to move
assets across borders, and offshore tax havens played a less important role. Because most
Latin American, and many Asian and European economies own much more wealth offshore
than Norway, the results found in Norway are likely to be lower bound for most of the world’s
countries. Fortunately, many countries have access to leaked data similar to those we exploit in
this paper. Our analysis could thus be implemented by tax authorities and researchers around
the world, including in countries where offshore tax evasion is much more prevalent than in
Scandinavia.
References
Alvaredo, Facundo, Anthony Atkinson, Thomas Piketty, Emmanuel Saez, and Gabriel
Zucman. 2011–2017. The World Wealth and Income Database, http://WID.world.
Atkinson, Anthony, Thomas Piketty, and Emmanuel Saez. 2011. “Top Incomes in the
Long-Run of History”, Journal of Economic Literature, 49(1), 3-71.
Johannesen, Niels, and Gabriel Zucman 2014. The End of Bank Secrecy? An Evaluation
of the G20 Tax Haven Crackdown, American Economic Journal: Economic Policy.
Johns, Andrew and Joel Slemrod. 2010. “The Distribution of Income Tax Noncompliance,”
National Tax Journal 63(3), 397–418.
Kuznets, Simon. 1953. Shares of Upper Income Groups in Income and Savings (New York:
National Bureau of Economic Research).
Lampman, Robert J. 1962. The Share of Top Wealth-Holders in National Wealth, 1922-56,
Princeton, NJ: Princeton University Press.
Larudee, Mehrene 2015. “Did capital go away? Capital flight as an explanation for declining
reported wealth inequality during and after World War I”, working paper
Piketty, Thomas. 2014. Capital in the 21st Century. Cambridge: Harvard University Press.
Piketty, Thomas, and Emmanuel Saez. 2003. “Income Inequality in the United States,
1913-1998,” Quarterly Journal of Economics 118(1), 1-39.
Piketty, Thomas, and Gabriel Zucman. 2014. “Capital is Back: Wealth-Income Ratios in
Rich Countries, 1700-2010,” Quarterly Journal of Economics 129(3), 1255-1310.
Piketty, Thomas, Emmanuel Saez, and Gabriel Zucman. 2016. “Distributional National
Accounts: Methods and Estimates for the United States, 1913-2013,” working paper
Roine, Jesper, and Daniel Waldenstrom. 2015. “Long-run Trends in the Distribution of
Income and Wealth.” In Handbook of Income Distribution. Vol. 2, , ed. Anthony B. Atkinson
and Francois Bourguignon, Chapter 7, 469?592. Elsevier/North Holland.
Saez, Emmanuel and Gabriel Zucman. 2016.“Wealth Inequality in the United States since
1913: Evidence from Capitalized Income Tax Data,” Quarterly Journal of Economics.
Slemrod, Joel. 2007. “The Economics of Tax Evasion,” Journal of Economic Perspectives,
21(1), 25–48.
Slemrod, Joel. 2016. “Caveats to the Research Use of Tax-Return Administrative Data,”
National Tax Journal, 69(4), 1003–1020.
Zucman, Gabriel. 2013. “The Missing Wealth of Nations: Are Europe and the US net
Debtors or net Creditors?” Quarterly Journal of Economics, 128(3), 1321–1364.
Zucman, Gabriel. 2014. “Tax Evasion on Offshore Profits and Wealth ”, Journal of Economic
Perspectives, 28(4), 121—148.
Zucman, Gabriel. 2016. The Hidden Wealth of Nations: The Scourge of Tax Havens, Uni-
versity of Chicago Press.
27

Table 1: The wealth at HSBC Switzerland (2007)
World Scandinavia Sweden Norway Denmark
Wealth held at HSBC Switzerland (2007)
Total wealth ($ million) 118,400 1,203 569 311 324
Number of active clients 30,412 653 393 66 194
Mean wealth per active client ($ million) 3.9 1.8 1.4 4.7 1.7
Offshore wealth in Switzerland (2007)
Total ($ million) 2,475,200 19,500 11,100 4,100 4,300
HSBC Switzerland as % of total Switzerland 4.8% 6.2% 5.1% 7.6% 7.5%
Offshore wealth in all tax havens (2007)
Total ($ million) 6,335,000 54,400 29,400 16,700 8,300
HSBC Switzerland as % of total offshore wealth 1.9% 2.2% 1.9% 1.9% 3.9% Offshore wealth as % of total household wealth 3.7% 1.8% 2.2% 2.6% 0.8%
Notes: The top panel reports estimates of the wealth and number of clients at HSBC Private Bank Switzerland in 2007. The column ”world” is the
official total published by HSBC in 2015. Total wealth for Scandinavian countries is the total wealth on the HSBC list received by Scandinavian tax
authorities, minus the estimated wealth of non-residents. The number of clients removes double-counting among members of the same family. The middle
panel shows estimates of the offshore wealth managed by Swiss banks in 2007 constructed from official statistics published by the Swiss central bank. The
bottom panel shows our estimate of the wealth hidden in all the world’s tax havens (Switzerland plus other tax havens). The estimate for the global amount
of offshore wealth ($6,335 billion) is from Zucman (2013). The estimates for Scandinavian countries are based on our computations using Swiss national
bank data and Bank for International Settlements Statistics; see Appendix A. Source: HSBC, Zucman (2013), and Appendix A.

Table 2: HSBC evaders, Panama papers individuals, & amnesty participants, by wealth group
[1] [2] [3] [4] [5] [6] [7] [8] [9] [10] [11] [12]
Wealth group % of all households Test % of evaders'
wealth Test % of all households Test % of all
households Test % of evaders' wealth Test % of all
households Test
P0-90 0.00 35.08 A 0.00 0.03 0.45 A 0.03(0.00) (9.21) (0.00) (0.00) (0.00)
P90-95 0.01 38.27 A 0.01 A 0.25 0.25 A 0.26(0.00) (4.45) (0.00) (0.01) (0.01)
P95-99 0.03 39.34 A 0.01 A 0.78 0.32 A 0.80(0.00) (3.51) (0.00) (0.02) (0.02)
P99-99.5 0.07 42.32 A 0.04 B 2.83 0.34 A 2.89(0.01) (5.91) (0.01) (0.09) (0.09)
P99.5-99.9 0.19 46.51 A 0.04 B 4.31 0.34 A 4.49(0.02) (3.77) (0.01) (0.12) (0.12)
P99.9-99.95 0.38 A 36.19 A 0.16 B 8.16 0.31 A 8.51(0.08) (5.85) (0.06) (0.45) (0.45)
P99.95-99.99 0.66 A 36.63 A 0.17 B 11.49 A 0.40 A 11.76(0.12) (9.24) (0.07) (0.58) (0.59)
P99.99-100 0.94 A 38.60 A 1.19 13.77 A 0.33 A 14.83(0.30) (9.34) (0.39) (1.25) (1.29)
Number of householdsNumber of tax evaders 8,233
7,547,1701,422
7,547,1708,571520
10,617,167300
7,547,170165
Intensive margin Extensive margin
HSBC + Amn.Amnesty
10,617,167 7,547,170
HSBC Panama papers
Intensive margin Extensive margin Extensive marginExtensive margin
Notes: Cols. 1, 5, 7, and 11 show the fraction of all Scandinavian households who evaded taxes at HSBC Switzerland, who are in the Panama papers, or
who used a tax amnesty to voluntarily disclose hidden wealth, by wealth group. For HSBC, our sample pools Norwegian, Swedish, and Danish households;
therefore wealth groups are defined relative to Scandinavia as a whole (Norway, Sweden, plus Denmark). For the Panama papers and amnesty participants,
our sample pools Norwegian and Swedish households; therefore wealth groups are defined relative to Norway plus Sweden. Col. 3 shows the wealth hidden
at HSBC Switzerland as a fraction of each evader’s own total wealth (including that hidden at HSBC), by wealth group; the sample includes all HSBC
evaders for whom HSBC account values are available. Col. 5 shows the same statistic for the sample of Norwegian amnesty participants. All values are
expressed in percentage points. Robust standard errors are reported in parenthesis. Cols. 2, 4, 6, 6, 8, 10, and 12 show the results of pairwise tests for the
equality of the group means displayed in cols. 1, 3, 5, 7, 9, and 11. Wealth groups sharing a common letter are not significantly different at the 5% level.
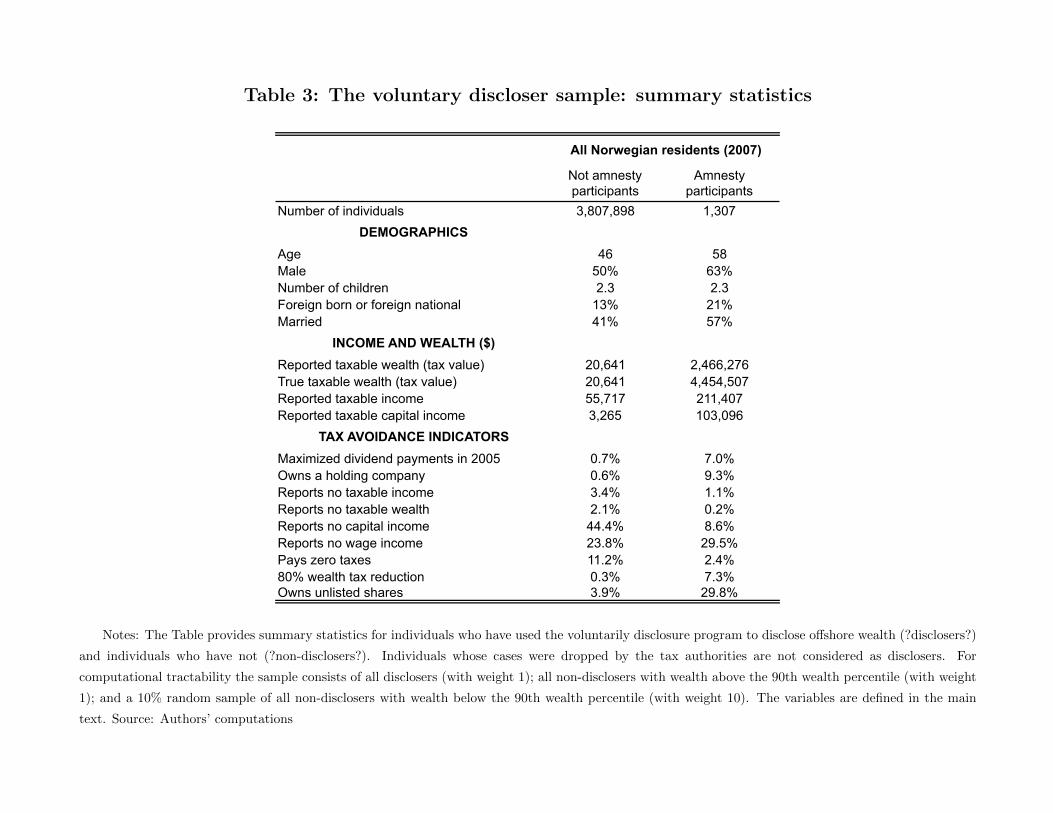
Table 3: The voluntary discloser sample: summary statistics
Not amnesty participants
Amnesty participants
Number of individuals 3,807,898 1,307DEMOGRAPHICS
Age 46 58Male 50% 63%Number of children 2.3 2.3Foreign born or foreign national 13% 21%Married 41% 57%
INCOME AND WEALTH ($)Reported taxable wealth (tax value) 20,641 2,466,276True taxable wealth (tax value) 20,641 4,454,507Reported taxable income 55,717 211,407Reported taxable capital income 3,265 103,096
TAX AVOIDANCE INDICATORSMaximized dividend payments in 2005 0.7% 7.0%Owns a holding company 0.6% 9.3%Reports no taxable income 3.4% 1.1%Reports no taxable wealth 2.1% 0.2%Reports no capital income 44.4% 8.6%Reports no wage income 23.8% 29.5%Pays zero taxes 11.2% 2.4%80% wealth tax reduction 0.3% 7.3%Owns unlisted shares 3.9% 29.8%
All Norwegian residents (2007)
Notes: The Table provides summary statistics for individuals who have used the voluntarily disclosure program to disclose offshore wealth (?disclosers?)
and individuals who have not (?non-disclosers?). Individuals whose cases were dropped by the tax authorities are not considered as disclosers. For
computational tractability the sample consists of all disclosers (with weight 1); all non-disclosers with wealth above the 90th wealth percentile (with weight
1); and a 10% random sample of all non-disclosers with wealth below the 90th wealth percentile (with weight 10). The variables are defined in the main
text. Source: Authors’ computations

Table 4: The effect of using a tax amnesty on tax avoidance
(1) (2) (3) (4) (5) (6) (7) (8)
Reported wealth
(in logs)
Reported income (in logs)
Taxes paid (in logs)
Founds holding
company (dummy)
Unlisted shares
(in logs)
Housing wealth
(in logs)
Zero capital income
(dummy)
Emigration (dummy)
Post-disclosure (periods 0-2) relative 0.4571*** 0.1817*** 0.2296*** -0.0006 -0.1141 -0.0736 0.0110 -0.0001***to pre-disclosure (period -4 to -2) (0.0403) (0.0333) (0.0311) (0.0018) (0.1048) (0.0528) (0.0074) (0.0000)
Observations 5,820,893 7,956,464 7,771,735 8,176,582 900,957 6,142,102 8,176,582 8,176,582R-squared 0.8499 0.7255 0.8000 0.0944 0.8617 0.7446 0.6063 0.2515Individual fixed effects X X X X X X X XWealth x year fixed effects X X X X X X X Xincome x year fixed effects X X X X X X X XAge x year fixed effects X X X X X X X X
Compliance Channels of avoidance
Notes: The Table shows the results from event-study regressions where the event is voluntary disclosure of hidden wealth and the outcomes are: claimed
taxable wealth (Column 1), claimed income (Column 2), claimed tax liability (Column 3), a dummy indicating the incorporation of a holding company
(Column 4), the tax value of unlisted securities (Column 5), the tax value of housing (Column 6), a dummy indicating zero reported capital income (Column
7) and a dummy indicating emigration (Column 8). Outcomes are regressed on individual fixed effects, year fixed effects, even-time dummies indicating
the year relative to disclosure and non-parametric controls for 2007 wealth (deciles of disclosers’ wealth at market value), income (deciles of disclosers’
income), and age (6 age groups) interacted with time. The event time categories t-4, t-3 and t ? 2 (?pre-disclosure period?) are omitted and event time
categories t, t+1 and t+2 are replaced by a single dummy (?post-disclosure period?). The sample period is 2002-2013. Standard errors are clustered at the
individual-level. Source: Authors’ computations

Figure 1: Taxes evaded as a % of taxes owed, by wealth group
0%
10%
20%
30%
P0-
10
P10
-20
P20
-30
P30
-40
P40
-50
P50
-60
P60
-70
P70
-80
P80
-90
P90
-95
P95
-99
P99
-99.
5
P99
.5-9
9.9
P99
.9-P
99.9
5
P99
.95-
P99
.99
P99
.99-
P10
0
% o
f tax
es o
wed
Position in the wealth distribution
Taxes evaded, % of taxes owed (stratified random audits + leaks)
Macro average: 2.9%
Notes: This figure combines random audits with the HSBC Switzerland leak and macro estimates of the stock of wealth in tax havens to estimate the size
of tax evasion across the wealth distribution in 2006. Each dot is equal to the average ratio of taxes evaded to total taxes owed in the corresponding wealth
bin. P0-10 denotes the bottom decile of the Scandinavian wealth distribution, and P99.99-P100 the top 0.01% (households with more than $40 million in
net wealth in 2006). Source: authors’ computations.

Figure 2: Country distribution of wealth at HSBC vs. in all Swiss banks
UAEArgent
Belgiu
Brazil
Canada
German
EgyptSpain
France
GreeceIndiaIrelan
Israel
Italy
Mexico
Nether
Russia
Saudi
Turkey
USAVenezu
DenmarNorway
Sweden
0.0
2.0
4.0
6.0
8.1
Shar
e of
HSB
C w
ealth
(200
7)
0 .02 .04 .06 .08 .1Share of wealth in all Swiss banks (2007)
Data source: ICIJ and SNB.Note: In the full sample excluding tax havens (131 countries), a regression of the share of HSBCwealth on the share of Swiss deposits has slope b= 1.00 (se = 0.04) and R-square of 0.80.
HSBC wealth vs. wealth in all Swiss banks
Notes: This figure shows the country distribution of the wealth managed by HSBC Private Bank Switzerland in 2006-2007 and the country distribution of
the foreign wealth managed by all Swiss bank. The black line is the 45 degree line. In the full sample excluding tax havens (131 countries), a regression of
the share of HSBC wealth on the share of Swiss deposits has slope b = 1.00 (se = 0.04) and R-square of 0.80. Source: ICIJ and Swiss National Bank.

Figure 3: Tax evasion at HSBC: intensive vs. extensive margin
0.0%
0.2%
0.4%
0.6%
0.8%
1.0%
P90-P95 [0.6 – 0.9]
P95-P99 [0.9 – 2.0]
P99-P99.5 [2.0 – 3.0]
P99.5-P99.9 [3.0 – 9.1]
P99.9-P99.95 [9.1 – 14.6]
P99.95-P99.99 [14.6 – 44.5]
Top 0.01% [> 44.5]
Net wealth group [millions of US$]
Probability to own an unreported HSBC account, by wealth group (HSBC leak)
0%
10%
20%
30%
40%
50%
P90-P95 [0.6 – 0.9]
P95-P99 [0.9 – 2.0]
P99-P99.5 [2.0 – 3.0]
P99.5-P99.9 [3.0 – 9.1]
P99.9-P99.95 [9.1 – 14.6]
P99.95-P99.99 [14.6 – 44.5]
Top 0.01% [> 44.5]
Net wealth group [millions of US$]
Average wealth hidden at HSBC, by wealth group (%oftotalwealth(includingheldatHSBC))
Notes: The top panel shows the fraction of households in Scandinavia (Norway, Sweden and Denmark) who had
an unreported bank account at HSBC Switzerland in 2006, by bins of Scandinavian wealth. The sample includes
520 Scandinavian households who could be matched to a tax return; see text. The bottom panel shows the ratio
of the wealth held at HSBC over total observable wealth, in the sample of 300 account holders with available
account values. Source: authors’ computations.

Figure 4: Panama papers individuals & amnesty participants
0.0%
0.2%
0.4%
0.6%
0.8%
1.0%
1.2%
P90-P95 [0.6 – 0.8]
P95-P99 [0.8 – 1.8]
P99-P99.5 [1.8 – 2.7]
P99.5-P99.9 [2.7 – 8.1]
P99.9-P99.95 [8.1 – 13.3]
P99.95-P99.99 [13.3 – 41.4]
Top 0.01% [> 41.4]
Net wealth group [millions of US$]
Probability to appear in the "Panama Papers", by wealth group (Shareholders of shell companies created by Mossack Fonseca)
0%
2%
4%
6%
8%
10%
12%
14%
P90-P95 [0.6 – 0.8]
P95-P99 [0.8 – 1.8]
P99-P99.5 [1.8 – 2.7]
P99.5-P99.9 [2.7 – 8.1]
P99.9-P99.95 [8.1 – 13.3]
P99.95-P99.99 [13.3 – 41.4]
Top 0.01% [> 41.4]
Net wealth group [millions of US$]
Probability to voluntarily disclose hidden wealth, by wealth group (Swedish and Norwegian tax amnesties)
Notes: The figures pools Norway and Sweden (hence the wealth thresholds are not exactly the same as in Figure
3 that pools Norway, Sweden and Denmark). Source: authors’ computations.

Figure 5: Offshore wealth & its impact on the size of tax evasion
0%
10%
20%
30%
40%
50%
60%
P0-50 P50-P90 P90-P99 P99-P99.9 P99.9-99.99 P.99.99-P100
% o
f tot
al re
cord
ed o
r hid
den
wea
lth
Position in the wealth distribution
Distribution of wealth: recorded vs. hidden
Hidden wealth disclosed in amnesty
Hidden wealth held at HSBC
All recorded wealth
0%
10%
20%
30%
40%
50%
60%
P90
-95
P95
-99
P99
-99.
5
P99
.5-9
9.9
P99
.9-P
99.9
5
P99
.95-
P99
.99
P99
.99-
P10
0
% o
f tot
al ta
xes
owed
Position in the wealth distribution
Offshore tax evasion, upper and lower bounds
Baseline estimate
Lower bound (No offshore wealth outside of Switzerland)
Upper bound (same macro offshore wealth as world average)
Notes: The top panel shows the distribution of wealth in Scandinavia (Norway, Sweden, Denmark) excluding
offshore wealth, and the distribution of wealth held at HSBC and disclosed by amnesty participants. The bottom
panel distributed the macro stock of offshore wealth based on the top panel and computes the implied amount
of taxes evaded. Source: authors’ computations.

Figure 6: Taxes evaded (% of taxes owed) in random audits, by wealth group
0.0%
1.0%
2.0%
3.0%
4.0%
5.0%
6.0%
P0-
10
P10
-20
P20
-30
P30
-40
P40
-50
P50
-60
P60
-70
P70
-80
P80
-90
P90
-95
P95
-99
P99
-99.
5
P99
.5-1
00
% o
f tax
es o
wed
that
are
not
pai
d
Position in the wealth distribution
Taxes evaded, % of taxes owed (stratified random audits)
Macro average: 2.3%

Figure 7: Detected Tax Evasion in Random Audits: Extensive vs.Intensive Margin
0%
10%
20%
30%
40% P
0-10
P10
-20
P20
-30
P30
-40
P40
-50
P50
-60
P60
-70
P70
-80
P80
-90
P90
-95
P95
-99
P99
-99.
5
P99
.5-1
00
Position in the wealth distribution
Fraction of households evading taxes, by wealth group (stratified random audits)
0%
5%
10%
15%
20%
25%
30%
P0-
10
P10
-20
P20
-30
P30
-40
P40
-50
P50
-60
P60
-70
P70
-80
P80
-90
P90
-95
P95
-99
P99
-99.
5
P99
.5-1
00
% o
f tot
al in
com
e (r
epor
ted
+ ev
aded
)
Position in the wealth distribution
Fraction of income undeclared, conditional on evading (stratified random audits)

Figure 8: Top wealth share in Norway including hidden wealth
0%
2%
4%
6%
8%
10%
12%
14%
1930 1940 1950 1960 1970 1980 1990 2000 2010
Top 0.1% wealth share in Norway
Excluding hidden wealth
Including hidden wealth
0%
1%
2%
3%
4%
5%
6%
1930 1940 1950 1960 1970 1980 1990 2000 2010
Top 0.01% wealth share in Norway
Excluding hidden wealth
Including hidden wealth
Notes: This graph compares the top 0.1% wealth share (top panel) and top 0.01% wealth share as estimated
from uncorrected tax data vs. corrected by including offshore wealth. Source: Authors’ computations, Appendix
Table B2 and B4.

Figure 9: Number of clients and average client account value at HSBC Private Bank Switzerland
0
5,000
10,000
15,000
20,000
25,000
30,000
35,000
0.0
1.0
2.0
3.0
4.0
5.0
6.0
7.0
2006 2007 2008 2009 2010 2011 2012 2013 2014
Num
ber o
f clie
nts
Ave
rage
acc
ount
val
ue (m
illio
n U
S$)
Number of clients and average account value at HSBC Private Bank Switzerland
Number of clients (right scale)
Average account value (left scale)
Notes: This figure presents the evolution of the total number of clients of HSBC Private Bank Switzerland and the average amount of wealth per
client managed by HSBC Private Bank Switzerland. Source: HSBC, Source:http://www.hsbc.com/~/media/hsbc-com/investorrelationsassets/
financial-and-regulatory-reports/gbp-update%20-290115.

Figure 10: The impact of using a tax amnesty on reported wealth &income
-.20
.2.4
.6le
vel r
elat
ive
to e
vent
yea
r
-6 -4 -2 0 2 4event time
-.10
.1.2
.3le
vel r
elat
ive
to e
vent
yea
r
-6 -4 -2 0 2 4event time
Notes: Panel A shows the results from an event-study regression where the event is voluntary disclosure of hidden wealth and
the outcome is taxable wealth as claimed by the tax payer before any corrections are made by the tax authorities. The outcome
is regressed on individual fixed effects, year fixed effects, even-time dummies indicating the year relative to disclosure and non-
parametric controls for 2007 wealth (deciles of disclosers’ wealth at market value), income (deciles of disclosers’ income), and age (6
age groups) interacted with time. The omitted time category is t - 2 (two years before disclosure). The sample period is 2002-2013.
Standard errors are clustered at the individual-level. Panels B shows results from an analogous regression where the outcome is
claimed income (including capital gains). Source: Authors’ computations.

Figure 11: The impact of using a tax amnesty on taxes paid
-.10
.1.2
.3.4
leve
l rel
ativ
e to
eve
nt y
ear
-6 -4 -2 0 2 4event time
Notes: The figure shows the results from an event-study regression where the event is voluntary disclosure of hidden wealth and
the outcome is total tax liabilities (i.e. income and wealth taxes at all levels of government) as claimed by the tax payer before
any corrections are made by the tax authorities. The outcome is regressed on individual fixed effects, year fixed effects, even-time
dummies indicating the year relative to disclosure and non-parametric controls for 2007 wealth (deciles of disclosers’ wealth at
market value), income (deciles of disclosers’ income), and age (6 age groups) interacted with time. The omitted time category is
t - 2 (two years before disclosure). The sample period is 2002-2013. Standard errors are clustered at the individual-level. Source:
Authors’ computations.