Embed Size (px)
Citation preview
Tax Evasion and Inequalitylowast
Annette Alstadsaeligter (Norwegian University of Life Sciences)Niels Johannesen (University of Copenhagen and CEBI)
Gabriel Zucman (UC Berkeley and NBER)
December 29 2017
Abstract
This paper estimates the size and distribution of tax evasion We combine randomaudits tax amnesties and leaks from offshore financial institutions matched to wealthrecords in Scandinavia Tax evasion rises sharply with wealth 3 of personal taxesare evaded on average versus 25ndash30 in the top 001 of the wealth distribution Amodel of the supply of evasion services can explain this gradient Taking tax evasion intoaccount increases inequality substantially After using tax amnesties evaders do not seemto increase legal tax avoidance suggesting that fighting evasion can allow governments tocollect more taxes from the wealthy
lowastAnnette Alstadsaeligter annettealstadsaternmbuno Niels Johannesen nielsjohanneseneconkudkGabriel Zucman zucmanberkeleyedu This paper is supplemented by an Online Appendix available athttpgabriel-zucmaneuleaks We thank the Scandinavian tax administrations (Skatteetaten Skattever-ket and SKAT) Statistics Sweden and SVT Uppdrag granskning for their goodwill and cooperation SigurdBjoslashrnestad Joachim Dyfvermark Linda Larsson Kakuli Fredrik Laurin Petter Lundberg Soslashren Pedersen GardThomassen and UiO Services for Sensitive Data (TSD) for exceptionally valuable assistance Alan AuerbachBrooke Harrington Send Jonas Patrick Kline Adair Morse Daniel Reck Emmanuel Saez Joel Slemrod DanielWaldenstrom and numerous seminar and conference participants for helpful comments and reactions We aregrateful for financial support from the Nordic Tax Research Council and the FRIPRO-program of the ResearchCouncil of Norway Johannesen gratefully acknowledges financial support from the Danish Council for Indepen-dent Research and the Danish National Research Foundation Zucman gratefully acknowledges financial supportfrom the Laura and John Arnold Foundation
1 Introduction
The size and distribution of tax evasion is a source of sustained interest and controversy among
the public Some believe that the bulk of tax evasion is done by the wealthy a view fueled
recently by the multiplication of high-profile leaks from offshore financial institutions such as
the ldquoPanama Papersrdquo Others stress that poorer individuals may be more likely to evade taxes
highlighting fraud by the self-employed or abuse of refundable tax credits
Who evades taxesmdashand how muchmdashmatters for both economists and policy-makers First
and most importantly it matters for the study of inequality Over the last fifteen years scholars
have increasingly relied on tax data to study distributional issues especially trends in top income
and wealth shares (see Roine and Waldenstrom 2015 for a recent survey) Tax returns are the
best available data source to study the top-end of the distribution because they do not contrary
to surveys suffer from sampling errorsmdasheverybody above a certain income level has to file a
return But they raise an obvious issue since tax rates tax evasion technologies and tax
enforcement strategies differ across countries and have changed dramatically over time tax
data may paint a distorted picture of the cross-country and time-series patterns in inequality
Second tax evasion matters for analyzing the effects of governments intervention in the economy
it redistributes the tax burden and affects the costs of raising taxes ldquobread-and-butter concerns
of public economicsrdquo (Slemrod 2017) Last knowing how tax evasion is distributed would help
tax authoritiesmdashwhich face tight budget constraintsmdashto better target their enforcement effort
Tax evasion is fundamentally hard to study because there is no single source of information
capturing all of it The key source used so far in rich countries is stratified random audits
These audits are a powerful way to uncover unreported self-employment income abuses of tax
credits and more broadly all relatively simple forms of tax evasion Tax authorities rely on
random audits to estimate the tax gap that is the total amount of unreported income and
unpaid taxes (eg IRS 2016) and academics have fruitfully used them to gain insights on
the determinants of tax evasion (eg Kleven et al 2011) But as discussed in Section 2
below random audits do not allow one to study tax evasion by the very wealthy satisfactorily
both because of insufficient sample sizes and because they fail to capture sophisticated forms
of evasion involving legal and financial intermediaries the detection of which would require
much more resources than available to tax authorities for their random audit programs This
limitation means that random audits need to be supplemented with other data sources to study
tax evasion at the top of the distribution Such data however have so far proven elusive
In this paper we analyze new micro-data that make it possible to study tax evasion by
1
very rich individuals These data come from recent massive leaks from offshore financial
institutionsmdashHSBC Switzerland (ldquoSwiss Leaksrdquo) and Mossack Fonseca (the ldquoPanama Papersrdquo)mdash
and tax amnesties conducted in the aftermath of the financial crisis of 2008ndash2009 Thanks to a
cooperation with Scandinavian administrations we were able to analyze the leaked and amnesty
micro-data matched to population-wide administrative income and wealth records in Norway
Sweden and Denmark We combine these data with random audits to estimate the size and
distribution of total tax evasion While random audits show that most of the population in ad-
vanced economies does not evade much taxmdashbecause most of its income derives from wages and
pensions which are automatically reported to the tax authoritiesmdashleaks and amnesty data show
pervasive tax evasion at the very top Overall tax evasion turns out to rise sharply with wealth
The top 001 of the Scandinavian wealth distributionmdasha group that includes households with
more than $45 million in net wealthmdashevades 25ndash30 of its personal taxes (Figure 1) This is
an order of magnitude more than the average evasion rate of about 3
The main leak used in this research is from HSBC Private Bank Switzerland the Swiss
subsidiary of the banking giant HSBC In 2007 an HSBC employee extracted the complete
internal records of the 30412 clients of this bank a large fraction of whom were evading taxes
We analyze the leaked HSBC files matched to individual tax data in Norway Sweden and
Denmark This leak has five key strengths for our study First it is not the result of specific
enforcement effort by tax authorities targeted at HSBC it can be seen as a random event
Second it involves a major player in the offshore wealth management industry Third a body
of evidence suggests that HSBC was representative of this industry as a whole there is no
indication that it was the ldquogo-tordquo place for Scandinavians to hide their wealth nor that it
catered to especially wealthy individuals Fourth HSBC Switzerland recorded the name of the
beneficial owners of the wealth it managed even when this wealth was held as is frequently the
case through intertwined shell companies incorporated in Panama and similar offshore havens
This makes it possible to link wealth to its actual owners Fifth while owning bank accounts
in Switzerland is not illegal per se the leaked file matched to tax returns offers a clear-cut
way to identify illegal tax evasion taxpayers who reported the dividends interest and capital
gains earned on their account were not evading those who did not were In practice the tax
authorities found that about 90ndash95 of the individuals on the HSBC list were evading taxes
The second leak used in this research is what is known as the ldquoPanama Papersrdquo This leak
revealed the identity of the shareholders of the shell companies created by the Panamanian law
firm Mossack Fonseca Just like for HSBC this leak is valuable as it can be seen as a random
2
event that involves a prominent provider of offshore financial services It brings additional
evidence on the extensive use of tax havens at the top of the distribution The Panama papers
however have one drawback they do not allow us to estimate how much tax was evaded (if
any) by the owners of the Mossack Fonseca shell companies It is not illegal per se to own shell
corporations in Panama or elsewhere and the investigations conducted by the tax authorities
to determine whether these shell companies were used to evade taxes are still ongoing
We also analyze a large sample of Norwegian and Swedish households who voluntarily dis-
closed previously hidden wealth in the context of a tax amnesty Many governments throughout
the world resort to tax amnesties to encourage tax evaders to declare unreported assets In the
United States for example beginning in 2009 the IRS has established a series of voluntary
disclosure programs under which cooperating tax evaders pay reduced penalties and can avoid
criminal sanctions (Johannesen et al 2017) But one difficulty with amnesty datamdashand pre-
sumably the reason why they have not been used much so far to study the distribution of tax
evasionmdashis the sample selection problem richer (or poorer) tax evaders may be more likely to
choose to participate in a tax amnesty than other tax evaders By contrasting the amnesty and
random leak data we have access to we can directly test for such self-selection We find that
it is quantitatively small if anything wealthier tax evaders seem to be slightly less likely to
participate in an amnesty
The leaked and amnesty data all paint the same robust picture the probability of hiding
assets offshore rises sharply and significantly with wealth including within the very top groups
of the wealth distribution Conditional on hiding assets the fraction of onersquos true wealth hidden
abroad is high (around 40) and does not vary with wealth As a result the wealth in tax
havens turns out to be extremely concentrated the top 001 of the wealth distribution owns
about 50 of it When we apply this distribution to available estimates of the amount of wealth
hidden in tax havens based on systematic exploitation of the available macroeconomic statistics
(Zucman 2013) we find that the top 001 evades about 25 of its tax liability by concealing
assets and investment income abroad This estimate only takes into account the wealth held
offshore that evades taxes it excludes properly declared offshore assets throughout the article
we maintain a clear distinction between legal tax avoidance and illegal evasion When we add
the tax evasion detected in random audits total evasion in the top 001 reaches 25ndash30
versus 3 on average in the population Our result that evasion at the top is much higher than
average is robust to a wide range of robustness tests
Do our findings apply to other countries We certainly do not claim that the pattern of
3
evasion by wealth group found in Scandinavia holds everywhere as a universal law But there is
no strong reason why Scandinavian countries should fundamentally differ from other rich coun-
tries The most developed economies are like Norway Sweden and Denmark likely to have
low average levels of evasion because most economic activity takes place in the corporate and
public sectors where third-party reporting strongly limits tax evasion There is also nothing
unique to Scandinavia that could explain the high evasion rates we find at the top Residents
of all developed countries are typically taxable on their worldwide income And although Scan-
dinavian countries are high-tax in an international perspective this owes more to their high
value-added and payroll taxes than to high rates on personal capital incomes which are in fact
taxed at flat relatively low rates in Norway and Sweden (Kleven 2014) In our view Scandina-
vian economies are an interesting laboratory because they rank among the countries with the
strongest respect for the rule of law (Kauffmann and Kraay 2017) and highest ldquotax moralerdquo
(Luttmer and Singhal 2014) suggesting that evasion among the wealthy may be even higher
elsewhere In future work we plan to apply our methodology to estimate distributional tax gaps
in as many countries as possible as most tax authoritiesmdashincluding the United Statesrsquomdashhave
access to random audit amnesty and leaked data similar to those we use in this research
How can we explain the prevalence of tax evasion we estimate at the top of the distribution
Existing models focus on the rational behavior of a tax evader under uncertainty (Allingham
and Sandmo 1972) which can be seen as the demand for tax evasion services Evasion is high
when the probability to be detected is low or when penalties are low and the effect of tax rates is
ambiguous These models do not provide a direct explanation for the sharp gradient in evasion
with wealth we find because Scandinavian taxpayers with more than $50 million in wealth face
the same marginal tax rates as those with $5 million are more likely to be (non-randomly)
audited and yet seem to evade much more We argue that to understand this gradient it is
necessary to consider the supply of tax evasion services We introduce such a model Providers
of tax evasion services (eg some Swiss banks) decide on the number of clients they serve by
internalizing the cost of being caught which rises with the number of clients served for instance
because the probability of a leak rises We derive a closed-form expression for the fraction of
the population served when wealth is Pareto distributed The higher is inequality the lower the
number of tax evaders When inequality is very high as is the case for wealth it is optimal for
banks to only supply tax evasion services to the super-rich
We discuss two implications of our results First we consider the implications of high-end
evasion for public finances Should tax evasion become impossible would wealthy individuals
4
pay significantly more taxes The answer depends on how substitutable illegal tax evasion and
legal tax avoidance are To address this question we analyze the behavior of a large sample of
Norwegians who voluntarily disclosed previously hidden wealth in the context of a tax amnesty
In an event study design we find that after voluntarily reducing tax evasion tax evaders do
not legally avoid taxes more despite ample opportunities to do so This finding suggests that
fighting tax evasion can be an effective way to collect extra tax revenue from the wealthy
Second we analyze how accounting for offshore wealth affects measured wealth inequality
We illustrate this with the case of Norway where high quality long-run time series of reported
top wealth shares exist Because offshore wealth appears to be extremely concentrated taking
it into account lifts top wealth shares significantly It increases the wealth reported by the top
001mdashthe wealthiest 300 Norwegian householdsmdashby more than 25 Our results highlight
the need to move beyond tax records to capture the income and wealth of the very rich even
in countries where tax compliance is generally high They also suggest that tax data may
significantly under-estimate the rise of wealth concentration over the last four decades as the
world was less globalized in the 1970s it was harder to move assets across borders and offshore
tax havens played a less important role (Zucman 2014)
The rest of this paper proceeds as follows In Section 2 we relate our work to the literature
Section 3 presents the HSBC Panama Papers and amnesty data and Section 4 analyzes them
In Section 5 we combine these micro-data with macro estimates of the stock of wealth in tax
havens to estimate the size and distribution of offshore evasion Section 6 constructs distri-
butional tax gaps taking into account offshore evasion and all other forms of evasion detected
in random audits Section 7 presents our supply-side model of tax evasion and Section 8 our
results on the interplay between tax avoidance and evasion We discuss the implications of our
results for long-run trends in inequality in Section 9 and conclude in Section 10 This paper is
supplemented by an Online Appendix1
2 Related Literature
21 Literature on Tax Evasion
Our paper first contributes to the empirical literature on tax evasion The key data source in
this literature is stratified random audits such as the National Research Program (NRP) in the
1The Appendix is available at httpgabriel-zucmaneuleaks All our code and data are posted onlineexcluding individual-level micro administrative data which cannot be publicly shared but including a largenumber of tabulations of the raw data by bins of wealth which make our results fully replicable
5
United States2 Based on the NRP the Internal Revenue Service (2016) estimates that the tax
gap for all federal taxes amounts to 163 percent of actual (paid plus unpaid) tax liability in
2008ndash2010 Random audit studies consistently find large rates of tax evasion for self-employment
and small business income for which the absence of third-party reporting makes tax evasion
relatively easy For example Kleven et al (2011) find that 449 of Danish self-employed evade
taxes3 Bishop Formby and Lambert (2000) and Johns and Slemrod (2010) use random audit
micro-data to study how accounting for tax evasion affects US income inequality4
Although a key data source random audits face two main limitations First it is likely
that they miss a large fraction of tax evasion The IRS acknowledges this issue by multiplying
the noncompliance found in its random audits by a factor of about three to calculate the US
tax gap5 In doing so it considers in effect that detected and undetected forms of tax evasion
are similarly distributed across the income spectrum Howevermdashand this is the second and
main problemmdashthey are likely to be distributed differently Sophisticated forms of evasion
involving legal and financial intermediariesmdashthat are only accessible to wealthy taxpayersmdashare
unlikely to be uncovered in random audits Such audits consist of line-by-line information about
what the taxpayer reported and what the examiner concluded was correct As one moves up
the wealth distribution the share of capital in taxable income rises Examiners can check that
taxpayers duly report the capital income earned through domestic financial institutions because
these institutions automatically and generally truthfully report data to the tax authority but
they cannot check that they duly report income earned through offshore financial institutions
because they typically receive limited information from tax havens and they cannot audit all
2In addition to random audits the literature also uses a variety of methods to detect traces of tax evasion inmicro or macro data see Slemrod and Weber (2012) and Slemrod (2007 2017) for surveys
3A number of studies that are not based on randomized audits obtain similar results (eg Pissarides andWeber 1989 Feldman and Slemrod 2007 Artavanis et al 2015) In these studies the true income of theself-employed is found to be on average about 15 to 2 times their reported income
4Nygard Slemrod and Thoresen (2017) study the distributional implications of sales tax evasion in Norway5The methodology used by the IRS to blow up detected tax evasion known as detection controlled estimation
is based on Feinstein (1991) It models the detection process by positing that conditional on evasion occurringonly a fraction is detected depending on the characteristics of the return examined (presence of self-employmentincome schedules filed etc) and of the examiner (experience age etc) Feinstein (1991) estimates such amodel by maximum likelihood and finds that about a third of tax evasion goes detected (ie if all examinerswere as perceptive as those who uncover the most evasion three times more evasion would be detected) Toadjust for unreported income that examiners were unable to detect the IRS applies DCE to the returns subjectto audit in effect multiplying the forms of evasion detected (mainly evasion by the self-employed) by about3 This procedure is very sensitive to parametric assumptions (the correlation between the error terms in theevasion and detection equations) absolute detection rates are not point identified (we cannot know whetherthe best examiner captures 100 or less of total evasion) and it does not address the key issue that given theinformation available to the IRS some forms of tax evasion cannot be detected in the context of random auditsno matter how talented the examiner See Andreoni et al (1998) and Johns and Slemrod (2010)
6
the worldrsquos providers of offshore services6 In addition the sample sizes in random audits are
usually too small to analyze with precision tax evasion in top wealth groups7
Our main contribution is that we are able to document tax evasion across the spectrum all
the way up to the very topmdashincluding households with more than $50 million in net wealth
whose behavior could not be studied until now Tax evasion at the top is important to study
because wealthy taxpayers although few in number own a large share of total wealth and are
liable for a large fraction of total taxes Another advantage of our setting is that Scandinavian
administrations maintain high-quality population-wide datasets on reported wealth which al-
lows us to study how evasion varies with wealth This is in contrast to the previous literature
which focuses on how evasion varies with taxable incomemdashwith the exception of Artavanis et
al (2015) who analyze how tax evasion varies across quintiles of wealth (proxied by real estate
values) in Greece While a useful indicator taxable income can be quite far from permanent
income and the actual capacity to pay taxes This might especially be the case for wealthy tax
evaders who in addition to evading taxes may reduce taxable income through various legal
means thus placing themselves in a low taxable income bin This problem is largely alleviated
when ranking people by wealth
22 Literature on the Long-Run Trends in Inequality
Our paper also contributes to the literature on inequality Over the last fifteen years there
has been renewed interest in the long-run evolution of the distribution of income and wealth
Following the pioneering work of Kuznets (1953) and Atkinson and Harrison (1978) a number
of studies have used tax data to construct top income and wealth shares for many countries8
6As a matter of fact random audits find little tax evasion on capital income The NRP finds that about4 of taxable interest and dividends are unreported (Johns and Slemrod 2010 Table 1) The figure is greaterfor capital gains (12) maybe because the cost basis on stock investments was not reported to the IRS untilrecently making tax evasion relatively easy In Denmark only 22 of capital income earners are found to evadetaxes the smallest figure across all income categories (Kleven et al 2011 p 669) These low rates could reflectlow actual evasion on capital income but the results of this paper suggest they are more likely to reflect thelimitations of random audits when it comes to uncovering high-end tax evasion In addition to capital incomedetecting sophisticated forms of business income tax evasion also raises formidable difficulties as evidenced bythe fact that in the United States 30 of partnership income (which is highly concentrated) cannot be tracedto any ultimate beneficiary hence is essentially un-auditable (Cooper et al 2016)
7In the 2001 tax gap exercise conducted by the IRS 2060 taxpayers in the top 05 of the taxable incomedistribution were randomly audited (Johns and Slemrod 2010 Table A1) This sample would in principle belarge enough to study the top 01 or even the top 001 but we have not been able to find any such studyIn the Danish random audit data used by Kleven et al (2011) and exploited in Section 6 below 59 taxpayersin the top 01 were audited and only 7 in the top 001 see Appendix Table H2
8See eg Piketty and Saez (2003) for US top income shares Saez and Zucman (2016) for US top wealthshares Atkinson et al (2011) for a survey and Piketty (2014) for a broad interpretative synthesis Top shareseries are collected in the World Wealth and Income Database httpwidworld (Alvaredo et al 2017)
7
Two central findings have so far emerged from this research inequality declined sharply in
todayrsquos developed economies during the first half of the twentieth century and it has increased
over the last thirty years but more so in the Anglo-Saxon world than in Continental Europe
and Japan Many of our current attempts to understand inequality take these facts seriously
and are based on how top shares vary across countries and over time
A key concern raised by the use of tax returns to measure inequality and indeed one of the
main reasons why tax data have for a long time been viewed with skepticism is tax evasion9
Tax records only provide information about income (and wealth when a wealth tax exists)
reported to the tax authority not true economic income and wealth Due to tax progressivity
the rich have particularly strong incentives to understate their resources This is a key issue for
the inequality literature because most of the cross-country and historical variation in inequality
comes from the very top of the distribution The problem is discussed in the literature (eg
Atkinson Piketty Saez 2011 pp 36ndash40) but until recently there was little data that would
allow to systematically quantify it Zucman (2013) estimates that 8 of the worldrsquos financial
wealth is held in tax havens globally a similar estimate is obtained by Pellegrini et al (2016)
In the absence of micro data on who owns the wealth hidden offshore however none of these
studies was able to assess the implications of tax havens for the measurement of inequality Our
contribution here is to study micro data that provide the first direct evidence on the distribution
of the wealth in tax havens10
A wave of recent studies attempts to compute more comprehensive inequality statistics than
in the top shares literature by distributing all of the national income recorded in the national
accounts see eg Piketty Saez and Zucman (2018) and Garbinti Goupille-Lebret and Piketty
(2017) For this purpose one needs to distribute the amount of income which evades taxes and is
explicitly factored into national income11 But there is no consensus on how to do this allocation
9A closely related problem raised by tax data is tax avoidance Not all income is taxable many forms ofcapital income in particular are usually tax-exempt for instance imputed rents for homeowners and corporateretained earnings The frontier between what is taxable or not varies over time and across countries and sodo the incentives to avoid taxes Alstadsaeligter et al (2016) show that business income reported on individualincome tax returns is responsive to tax changes
10 Larudee (2016) investigates the extent to which capital flight to Switzerland can explain the decline in theFrench top 1 income share between the two world wars Roine and Waldenstrom (2008 2009) is the onlyattempt to focus on the distributional implications of hidden wealth for the recent period They use an indirectmethodmdashresidual flows in the balance of payments and financial accountsmdashto estimate the amount of wealthhidden by Swedish residents and assume that this wealth primarily belongs to the top The share of wealthowned by the top one percent rises from about 20 percent in the 2000s to a range of 25ndash30 percent dependingon the methodology
11The national accounts include some but not all forms of misreported taxable income In the United Statesnational income includes an estimated $538 billion in unreported non-corporate business profits in 2013 and $80billion in unreported wages but it excludes unreported income earned offshore (Zucman 2013) The currently
8
(Auten and Splinter 2017) Our paper contributes to this area of research by providing evidence
that tax evasion is likely to be more concentrated than what random audit data suggestmdashand
that accounting for it accurately is likely to increase inequality Looking forward our goal is
to correct global inequality statistics in a systematic way so as to better account for the true
wealth of the rich
3 Micro-Data on Households With Assets in Tax Havens
Our main goal in this paper is to estimate how much each group of the wealth distribution
evades in taxes as a fraction as their true tax liability There are three main steps in the
analysis First we analyze samples of wealthy individuals found evading taxes through offshore
financial institutions Second we combine these samples with statistics on the macro amount
of wealth hidden offshore to estimate the size and distribution of the tax evasion done through
offshore intermediaries Third we add information about other forms of tax evasion using
random audits We start in this Section by describing the samples of households with assets in
tax havens we have access to
31 HSBC Switzerland Leak
The first micro-dataset used in this research is the leak from HSBC Private Bank Switzerland
the Swiss subsidiary of HSBC In 2007 a systems engineer employed by HSBC Herve Falciani
extracted the complete internal records of this Swiss bank Falciani turned the data over to
the French government in 2008 who shared it with a number of foreign administrations when
Christine Lagarde was Finance Minister in France (thus the ldquoFalciani listrdquo became known as
the ldquoLagarde listrdquo) The leaked files are not publicly available but thanks to a cooperation with
Scandinavian authorities we were able to analyze the full portion of the FalcianiLagarde list
matched by the Scandinavian authorities to individual tax returns and administrative income
and wealth data From the complete set of leaked files the authorities attempted to match all
accounts potentially connected to Scandinavia (ie whose owner controlling attorney or other
related party had an address in Scandinavia or Scandinavian nationality) They succeeded in
about 90 of the cases and we have access to all matched records12
available distributional national accounts of Piketty Saez and Zucman (2018) match US national incomehence do not take into account offshore tax evasion either Looking forward a comprehensive treatment of taxevasion would involve revising national income so as to account for missing offshore income
12Some of the unmatched accounts could belong to tax evaders (eg accounts owned by shell companies withScandinavian attorneys but whose beneficial owners were not known or recorded by HSBC) or to legitimateorganizations (eg financial institutions or non-profit organizations) If these untraceable accounts are used by
9
The HSBC leak has a number of key strengths for our purposes First it was not the
result of specific enforcement effort by tax authorities and can be seen as a random event The
documents leaked by Falciani include the complete internal recordsmdashincluding the names and
in the majority of cases account valuesmdashof the 30412 clients (who controlled about 112000
accounts) of this Swiss bank in 2007 Importantly HSBC Switzerland recorded the name of the
beneficial owners of the wealth it managed even when this wealth was held as is frequently the
case through shell companies Identifying beneficial owners is a requirement for banks under
anti-money laundering regulations and it appears that HSBC complied with it This is what
made it possible for the tax authorities to link the accounts to the tax returns of their owners
At the time of the leak HSBC Switzerland was a major player in the offshore wealth man-
agement industry It managed 44 of all the foreign wealth in Swiss banks $1184 billion out
of $2667 billion The $1184 billion figure is the official value for 2007 published by HSBC
(2015) the amount of offshore wealth managed by all Swiss banks is from the official statistics
published annually by the Swiss central bank Throughout this article offshore wealth is defined
as the sum of the bank deposits and portfolio securities (equities bonds mutual fund shares)
managed by banks on behalf of non-resident investors Since more than 200 banks operated in
Switzerland at the time of the leak the market share of HSBC Private Bank was significant
it was likely to be among the top 10 largest Swiss banks13 Around $56 trillion of wealth was
held in tax havens globally at the time of the Falciani leak HSBC Switzerland alone accounted
for 21 of that total14
The available evidence suggests that HSBC was representative of the Swiss banking industry
Importantly there is no evidence that it was the ldquogo-tordquo place for Scandinavians to park their
wealth A country-by-country breakdown of the wealth managed by HSBC Switzerland in 2007
is published by the International Consortium of Investigative Journalists (ICIJ) who obtained a
copy of the complete set of files leaked by Falciani An annual country-by-country breakdown of
the amount of offshore wealth in all Swiss banks is published by the Swiss central bank Figure 2
the wealthiest tax evaders we under-estimate the concentration of tax evasion Online Appendix E providesdetailed background information about HSBC Switzerland the leak and the data we got access to in his research
13Rankings of the worldrsquos largest private banks (or private banking divisions of large bank holding companies)are regularly published in trade magazines (eg Scorpio partnership) At the time of the leak other majorplayers in this market included UBS Credit Suisse Julius Baer Pictet Royal Bank of Scotland BNP Paribasetc To our knowledge however there are no reliable rankings for the Swiss wealth management industry alone(ie available rankings aggregate assets managed by banks in all their subsidiaries across the world with nocountry-by-country breakdowns)
14The $56 trillion estimate for the worldrsquos offshore wealth in the middle of 2007 is from Zucman (2013) Wereturn to the computation of the global amount of wealth in tax havens in Section 5 when we try to estimatethe size and distribution of total offshore tax evasion (ie at HSBC and other offshore banks)
10
compares the two distributions they look similar Scandinavian residents in particular own in
total about 1 of the wealth held at HSBC and 1 of all the wealth held in all Swiss banks15
Moreover we have not found evidence that HSBC was catering to very wealthy clients more than
its peers In the years before the leak it was in fact advertising its wealth management services
in most of the worldrsquos airports so it is possible that its clientele was actually less wealthy than
that of its more discrete competitors
Another strength of the HSBC leak is that it provides a clear-cut way to assess whether tax
evasion is involved All developed countries tax residents on their worldwide income Owning
offshore accounts is legal as long as any interest dividend or capital gain earned is duly declared
by the accountrsquos owner on his individual income tax return Moreover offshore accounts must
typically be reported to tax authorities (in the United States using the electronic Foreign Bank
and Financial Account form if the account value is $10000 or more) In Denmark and Norway
the tax authorities after detailed investigations found that 90 to 95 of all HSBC account-
holders had failed to report the income earned on their account (and the wealth held there
in the case of Norway where a wealth tax exists) and were thus evading taxes16 This result
is consistent with a body of evidence suggesting that more than 90 of Swiss accounts were
undeclared around 2007 this includes two US Senate (2008 2014) reports finding that 85ndash
95 of US-owned accounts at UBS and Credit Suisse were undeclared in 2007ndash2008 Roussille
(2015) who estimates that more than 90 of the wealth held by Europeans in Switzerland was
undeclared before 2010 and Johannesen and Zucman (2014) who obtain a similar estimate
We construct our working sample of HSBC tax evaders as follows Starting with all Scandi-
navians linked by the tax authorities to an HSBC account we exclude taxpayers who claimed
15Some countries are slightly over-represented in the HSBC leak notably Venezuela the United States andBrazil This can be explained as follows In 1999 HSBC Switzerland merged with the Republic National Bankof New York and Safra Republic Holdings two private banks with a large customer base in the United Statesand Brazil respectively In addition according to the ICIJ the biggest account at HSBC Switzerland was a US$119 billion account registered in the name of Venezuelarsquos National Treasurer (who started off as a bodyguardfor the late Venezuelan President Hugo Chavez)
16This does not imply that all taxpayers with undeclared HSBC accounts have been convicted of tax evasionIn prosecuting the cases the tax authorities face constraints In particular the nature of the evidence (a leakedfile) raises legal issues and is generally insufficient to prove in court the existence of a hidden account Tocircumvent this issue tax authorities can ask for information from the Swiss tax authority and to HSBC Weknow that in Denmark in many instances neither the taxpayers nor the Swiss authorities cooperated forcingthe tax authority to drop cases Note that it is optimal for the tax authority to focus its resources on prosecutingthe largest cases analyzing the sub-sample of cases that eventually led to conviction would thus introduce aselection bias and would lead us to over-estimate the concentration of tax evasion We therefore do not base ourassessment of whether tax evasion occurred on what was the legal outcome of the case but instead on whetherthe account and the income it generated were declared on individual income tax returns (and wealth tax returnswhen a wealth tax exists) This is similar to what is done in random audit studies where non-compliance isestimated based on an examinerrsquos assessmentmdashnot a court decision
11
to be non-residents hence not taxable in Scandinavia17 Some accounts are linked to several
members of a single household we remove any double-counting by conducting all our analysis
at the household level Last we exclude the Norwegians who properly declared their accounts
(we were not able to remove the few around 20ndash30 properly declared Danish and Swedish
accounts18) This leaves us with a sample of 520 households who owned at least one account at
HSBC Switzerland declared themselves as taxable in Scandinavia in 2006 could be matched
to a tax return (and for the Norwegian portion of the list did not declare their account)
32 Panama Papers Leak
The second leak we use in this research is the Panama Papers In the Spring of 2016 the ICIJ
published the names and addresses of the owners of shell companies created by the Panamanian
law firm Mossack Fonseca19 The leak provides information on shell corporations that were
created over two decades many of which were still active at the time of the leak in 2015
We matched the names of the shareholders of these shell companies to individual wealth data
in Norway and Sweden (but were not able to do so in Denmark) Although Mossack Fonseca
is a major provider of offshore services our working sample is smaller than for the HSBC leak
(165 vs 520) Beyond the exclusion of Denmark one other factor contributes to the smaller
sample size a number of shell companies cannot be linked to their ultimate owner A company
created by Mossack Fonseca can be owned by another shell created by another incorporation
agent in which case ultimate owners remain untraceablemdashwhile they are usually identifiable at
HSBC A last limitation of the Panama Papers is that we donrsquot know whether the Scandinavian
individuals appearing in the leak evaded taxes There are legal uses of shell companies and the
investigations conducted by the tax authorities are still ongoing Despite these limitations the
Panama Papers provide valuable corroborating information as we shall see
17Note that some of them might in fact be taxable in Scandinavia claiming to be non-resident is a form oftax evasion sometimes practiced by wealthy individuals which we cannot detect with the data at our disposalIf true we would under-estimate tax evasion at the top
18This is unlikely to bias our findings significantly since we know that close to 95 of the matched Danishand Norwegian accounts were undeclared If anything the inclusion of the duly reported Danish and Swedishaccounts may lead us to slightly under-estimate the actual concentration of hidden wealth as the availableevidence suggests that declared accounts may belong to less wealthy evaders than hidden accounts As shown byAppendix Figure E5 the wealth held by Norwegians at HSBCmdashwhich excludes accounts properly declaredmdashis more concentrated than than held by Swedish and Danish householdsmdashwhich includes properly declaredaccounts The small size of the sample of declared accounts however does not give us enough power to rejectthe hypothesis that duly reported and undeclared accounts are distributed similarly To simplify the expositionin the rest of the analysis we consider that all matched Swedish and Danish households evade taxes
19Online Appendix F provides background information about the Panama Papers and analyzes the data madepublic by the ICIJ In contrast to the HSBC leak all the names and corporate structures appearing in theMossack Fonseca files have been disclosed by the ICIJ
12
33 Tax Amnesty Participants
Our third dataset is a large sample of individuals who voluntarily declared previously hidden
assets in the context of tax amnesties In recent years governments have encouraged tax evaders
to declare hidden wealth in exchange for reduced penalties In Norway and Sweden we have
access to all the voluntary disclosures made since 200620 The number of amnesty partici-
pants picked up significantly in 2009 when G20 countries compelled tax havens to exchange
bank information upon request with foreign authorities (Johannesen and Zucman 2014) it was
negligible before21
A key advantage of the amnesty dataset is the large sample size 1422 households in Norway
and 6811 in Sweden Another strength is that we know that tax evasion is by definition
involved This data source suffers from one limitation however there may be selection into the
amnesty based on wealth According to the canonical Allingham and Sandmo (1972) model of
tax evasion tax evaders should continue evading as long as τ the marginal tax rate they face
is greater than p times θ the probability to be detected times the penalty if detected In 2009
when the number of households participating in amnesties starts rising the only parameters
that changes is the perceived probability to get caught which increases The increase may
depend on wealthmdashand the effect could go either way Only unsophisticated moderately rich
individuals with inherited offshore accounts might have perceived an increase in p in 2009 while
very rich evaders may have considered they would always be able to conceal their wealth by using
sophisticated combinations of shell companies and trusts Conversely the richest evaders might
have feared that governments would strengthen their monitoring of the wealthy in the aftermath
of the financial crisis or liquidity constraints may have prevented less wealthy individuals from
using tax amnesties that require them to pay back taxes In the end whether richer evaders
self-select into amnesties is an empirical issue The results discussed below suggest that less
wealthy evaders are slightly more likely to self-select
4 Patterns of Tax Evasion in Leaked and Amnesty Data
In this Section we study how the probability to have a hidden HSBC account to own a shell
company created by Mossack Fonseca or to disclose hidden assets in a tax amnesty varies
with wealth Because our three samples differ in size these probabilities do not have the same
20Appendix G discusses the specifics of the Norwegian and Swedish amnesties21In Norway we have access to details on the origin of the wealth disclosed half was held in Switzerland and
the other half in the other tax havens a tiny amount was held in Norway itself
13
absolute level but in all cases they rise sharply with wealth We start by describing how we
rank households in the wealth distribution before discussing the results
41 How We Rank Tax Evaders in the Wealth Distribution
We construct the full distribution of household wealth in Norway Denmark and Sweden fol-
lowing a common methodology All wealth series computations and results are described in
a detailed manner in Online Appendix A (for Scandinavia as whole) B (for computations and
issues specific to Norway) C (Sweden) and D (Denmark) here we discuss the main method-
ological principles and data sources
We compute wealth at the micro level for the entire population by distributing 100 of the
macroeconomic amount of household wealth at market value recorded in the national accounts
Although the national accounts are unlikely to be perfectly accurate this method enables us to
estimate wealth levels and shares for each Scandinavian country that are directly comparable
and comparable to those estimated in the United States by Saez and Zucman (2016) and in a
growing number of countries where a similar methodology is followed22
One advantage of the Scandinavian context is that it is possible there to compute a particu-
larly reliable estimate of the wealth distribution for one simple reason While in most countries
one has to rely on indirect methods to estimate wealth inequality in Scandinavia we directly
observe the market value of most wealth components for the entire population Scandinavian
administrations collect individual-level wealth data from a large number of third partiesmdashbanks
mutual funds central securities depositories insurance companies etcmdashwhich report on the
end-of-year market value of the wealth they manage on behalf of their clients Non-financial
assets are recorded using land and real estate registries and marked to market using observed
transaction prices To capture 100 of the macro amount of household wealth we supplement
these administrative micro-data as follows First we account for funded pension wealth which
was not reported at the micro-level in 200723 Second we impute non-corporate business assets
and unlisted equities which are not consistently recorded in the three countries by following
a common methodology Namely we compute non-corporate business assets by capitalizing
22See the series published on the World Wealth and Income Database at httpWIDworld (Alvaredo et al2017)
23Pension wealth has been reported at the individual level in Denmark data since 2012 see Jakobsen et al(2018) In 2012 we observe that about 40 of Danish pension wealth belongs to wage-earners and 60 toretirees We assume a similar breakdown in the other Scandinavian countries we then allocate the pensionwealth of workers proportionally to wage income (winsorized at the 99th percentile) and the pension wealth ofretirees proportionally to the pension benefits paid out of pension funds Saez and Zucman (2016) use the sameimputation procedure in the United States
14
business income (the capitalization rate is equal to the market value of business assets divided
by the flow of business income reported on individual income tax returns) we similarly impute
unlisted equities by capitalizing dividend income The imputations introduce some noise at the
micro-level This noise however is second-order for our purposes because the largest form of
wealth missed by the administrative data is pension wealth which only accounts for a small
fraction of wealth at the top of the distribution the main focus of our analysis
As shown by Appendix Figure A16 wealth is similarly distributed in Norway Sweden and
Denmark The top 1 owns about 20 of total non-hidden wealth the top 01 around 9
and the top 001 around 4-5 These estimates are the best we can form on the basis of
the information available to the tax and statistical authorities they disregard hidden assets
(whose impact we investigate in Section 9 below) Taxable income is also similarly distributed
and the 3 countries share many macro features (in terms of average income and wealth wealth
composition etc see Appendix Figure A1 to A17 for extensive comparisons) Thus for our
main analysis we combine Denmark Norway and Sweden into a single Scandinavian ldquocountryrdquo
as follows We collapse each countryrsquos population-wide data into small bins (of as few as 10 tax
units at the top) compute average minimum and maximum wealth in each bin using current
market exchange rates to convert local currencies into US$24 and interpolate the distribution of
wealth within each bin using generalized Pareto interpolation methods (Blanchet et al 2017)
This makes it possible to study the distribution of wealth and tax evasion in Scandinavia as a
whole in a dataset virtually identical to the one that would exist if the population-wide files
of the three countries could be appended (which is not currently possible) Of course Norway
Sweden and Denmark differ in some dimensions eg Norway has less private wealth (maybe
because it has more public wealth) But the gradients in the probability to hide assets are
similar within each country pooling them together simply allows us to reduce standard errors
42 Tax Evasion in Leaks
The HSBC leak the Panama Papers and the amnesty data all paint the same robust picture
the probability of hiding assets offshore rises sharply continuously and significantly with wealth
24In the context of our study that focuses on top-end wealth using market exchange rates seems preferableto using PPP exchange rates because rich Scandinavians all have access to the same basket of goods andglobal assets In Appendix A we report detailed results on Scandinavian income and wealth using both marketand PPP-adjusted exchange rates PPP-adjusted rates slightly reduce the weight of Norway (where the pricelevel is relatively high) in the Scandinavian aggregate but does not significantly affect any of the main resultsof the paper All dollar figures given in this paper are at current-year prices and using current-year marketexchange rates (for instance $445 million is the threshold to be part of the top 001 of the Scandinavianwealth distribution in 2006 using 2006 prices and exchange rates to convert Scandinavian currencies into US$)
15
including within the very top groups of the wealth distribution
Starting with HSBC the top panel of Figure 3 shows that the fraction of Scandinavians who
hide asset in that Swiss bank is negligible up to the top 1 threshold and then rises to almost
1 for the 001 richest households who own more than $445 million in net wealth at the
end of 2006 Remember that HSBC Switzerland is just one bank in one tax haven a bank that
managed around 2 of the wealth held offshore globally at the time of the leak so the high
absolute level of the probabilities is notable The gradient is notable too households in the top
001 are 13 times more likely to hide assets at HSBC than households in the bottom half of
the top 1 ie in between percentile 99 ($2 million in net wealth) and 995 ($3 million) The
differences in the probabilities across wealth group are statistically significant The first column
of Table 1 reports bootstrapped standard errors for these probabilities and the second column
shows pairwise comparisons across wealth bins The probabilities to hide assets at HSBC differ
from each other at the 5 level25 As shown by Appendix Figures E4 and E4b the gradients
look the same in the three Scandinavian countries separately
A remark is in order here For the purpose of ranking HSBC customers in the wealth
distribution we added the hidden HSBC wealth to non-hidden wealth26 This mechanically
moves HSBC evaders up the wealth ladder However this re-ranking does not drive the gradient
reported in the top panel of Figure 3 In Appendix Figure E2 we re-produce this figure but
ranking households by their wealth excluding that held at HSBC the patterns are similar27
25 The only exception is for the very top binmdashthe top 001mdashwhere the small sample size does not allowus to reject the null hypothesis that the probability to evade taxes is the same as in the rest of the top 01Appendix Table E7 reports a version of Table 1 where the top 001 is lumped together with the next 004ie the top 01 is split in two equal-size groups P999ndash9995 (tax units with between $91 million and $146million in net wealth) and P9995ndash100 (tax units with more than $146 million) The probabilities to own anHSBC account are statistically different in these two groups at the 10 level
26The amount hidden at HSBC is observable for 300 households out of 520 As discussed in Appendix Ethe main explanation for the gap is that a number of accounts initially held by households directly in theirown name were over time transferred to shell corporations following which the identity of the beneficial ownerremains observable in the files leaked by Falciani but not the account details As shown in Appendix Figure E1excluding accounts with no known values does not change the gradient reported in the top panel of Figure 3
27Including hidden wealth when ranking households seems preferable because doing so delivers the bestestimate of the amount of wealth the HBSC evaders actually own given observable data Johns and Slemrod(2010) follow a similar procedure in the United States Note that if HSBC account-holders hide assets in otherbanks too then we under-estimate their true wealth In the extreme case where all offshore wealth belongs tothe HSBC sample (ie these are the same households who have unreported accounts at HSBC UBS CreditSuisse etc) then many HSBC account-holders ranked below the top 001 actually belong to the top 001and the gradient in the probability to hide assets abroad would be even steeper than implied by the HSBC datashown on Figure 3 Conversely if all the non-HSBC offshore wealth belongs to other tax evaders (ie HSBCaccount holders do not hide assets elsewhere) then we over-estimate the rank of HSBC account-holders in thetrue Scandinavian wealth distribution Our computations that add observable hidden wealth to non-hiddenassets to rank households attempt to reach a middle ground between these two polar cases With the data atour disposal we cannot tell whether tax evaders tend to have accounts in multiple or just one bank
16
Households who evaded taxes through HSBC hid a strikingly large fraction of their total
wealth in that Swiss bank The bottom panel of Figure 3 shows the ratio of the wealth held
at HSBC over total observable wealth in the sample of HSBC account-holders with available
account valuesmdashthe intensive margin of evasion in contrast to the extensive margin studied in
the top panel HSBC customers owned around 40 of their wealth there with no trend across
the wealth distribution
The Panama Papers confirm that the use of offshore financial institutions steeply rises with
wealth As shown in Figure 4 the probability to own a Mossack Fonseca offshore shell company
reaches 12 in the top 001 of the (Norwegian plus Swedish) wealth distribution against
less than 02 for all groups below the top 001 The difference between the top 001 and
all other groups is highly significant (Table 1 col 5) The use of tax havens appears more
concentrated in the Panama Papers than in the HSBC leak in both Norway and Sweden as
shown by Appendix Figure F1 one finds very few households who own Mossack Fonseca shell
companies in the bottom 999 of the wealth distribution One interpretation of this finding is
that wealth concealment using shell corporations is a more sophisticated form of tax avoidance
than owning offshore bank accounts The two techniques are often combined but the wealthiest
tax evaders might be more likely to combine offshore accounts with shell companies while less
wealthy tax evaders may be relatively more likely to own offshore accounts in their own names
43 Tax Evasion Among Amnesty Participants
Turning to amnesty participants Figure 5 shows that the probability to disclose previously
hidden offshore wealth also rises sharply with wealth There are three additional findings First
and most importantly the amnesty data reveal widespread evasion among the rich Strikingly
14 of all top 001 Norwegian and Swedish households have disclosed hidden assets in a tax
amnesty between 2009 and 2015 Thus we know that at least 14 of Scandinaviansrsquo richest
households were evading taxes on the eve of the financial crisis of 2008-09
Second by contrasting the probabilities to appear in the HSBC leak to the probability to
voluntarily disclose hidden assets we can study whether self-selection into amnesties correlates
with wealth We find that the poorest evaders are slightly more likely to participate in an
amnesty Households between the 95th and the 995th percentilemdashie with net wealth between
about $1 and $3 millionmdashare relatively over-represented in the amnesty sample For that group
the odds of using the amnesty are 328 higher than the odds of evading taxes at HSBC For the
top 01 the odds ratio drops to 204 Overall however the self-selection is not massive As
17
can be seen by comparing the top panel of Figure 3 to Figure 5 the gradients in the probability
to hide assets at HSBC vs report hidden wealth in an amnesty are remarkably similar As
a result our key estimates would be almost unchanged should we only use the amnesty data
and disregard the leaked data altogether This finding suggests that amnesty datamdashthat are
widely available in many tax authorities throughout the worldmdashcould be leveraged to study tax
evasion and its distribution more extensively than they have been so far28
Third as reported in cols 9 and 10 of Table 1 we find that amnesty participants used to
hide close to a third of their wealth on average with no trend across the distribution The
fraction of wealth hidden is lower than in the HSBC sample (where it reaches 40) consistent
with the notion that the most aggressive tax evaders are less likely to self-select into amnesties
Finally we pool HSBC evaders and amnesty participants excluding the small overlap between
the two samples As reported in cols 11 and 12 of Table 1 148 of the top 001 richest
Norwegians and Swedish households revealed hiding wealth or were caught in the HSBC leak a
probability statistically greater than that of the the next 004 (118) which is itself greater
than than of the next 005 and so on
5 The Size and Distribution of Offshore Tax Evasion
The samples analyzed above are drawn from the universe of individuals who use tax havens
In this Section we combine these samples with macro statistics on the stock of wealth held in
tax havens to estimate how much tax is evaded through offshore intermediaries by each group
of the wealth distribution We proceed in four steps First we estimate the total amount of
wealth held by Scandinavians in tax havens second we assume this wealth is distributed in the
same was as in the micro-samples we have access to third we estimate what fraction of offshore
wealth is hidden vs properly declared last we compute the extra amount of taxes that would
be paid if all this wealth and the income it generates were duly declared to tax authorities We
discuss each step in turn
51 The Macro Stock of Offshore Wealth
The available evidence suggests that Scandinavians held in total around 16 of their wealth
(the equivalent of 42 of their GDP) in tax havens in 2007 This estimate includes household
wealth only whether hidden or duly reported to tax authorities it disregards corporate assets
28Data from US state amnesties were analyzed by Mikesell (1986) Fisher et al (1989) and Crane andNourzad (1990) These studies did not address the effect of tax evasion on US income or wealth inequality
18
such as assets owned by mutual funds operating in Luxembourg As shown by Alstadsaeligter
Johannesen and Zucman (2017 Figure 5) Scandinavian countries appear to have one of the
worldrsquos smallest stock of household offshore assets significantly less than the United States
(the equivalent of 73 of GDP) Continental European countries like France Germany and
the UK (around 16 of GDP) or Greece (36 of GDP) Although quantifying the macro
stock of wealth held offshore by Scandinavians involves a margin of error our result is likely to
be robust we obtain similar results using two different methodologies presented in Table 2
Bottom-up estimate Our first strategy is a bottom-up approach that scales up the wealth
held by Scandinavians at HSBC Switzerland We know that this bank managed $1184 billion
in wealth in 2007 Based on a systematic investigation of the international statistics and the
anomalies therein Zucman (2013) estimates that households held $56 trillion in tax havens
globally at the time of the leak ie 475 times the wealth held at HSBC We apply this 475
multiplicative factor to the amount of wealth owned at HSBC by customers who were taxable
in Scandinavia could be matched to a tax return and for whom we are able to observe account
values namely $1013 million By this estimate Scandinavians owned $48 billion in tax havens
globally in 2007 15 of their total wealth This method has two potential drawbacks First
because it disregards the HSBC accounts that could not be matched to any individual income
tax return and those where no balance information is available it might under-estimate the
total amont of offshore assets owned by Scandinavians Second if HSBC was the ldquogo-tordquo place
for Scandinavians to park their wealth the 475 multiplicative factor we use would be too high
Top-down estimate Our second strategy is a top-down approach that does not rely on the
HSBC data It is this top-down approach that we retain for our benchmark estimates Starting
from the $56 trillion in global offshore wealth we allocate this total across countries by using
macro statistics disclosed by tax havens on who owns deposits in their banks The Swiss central
bank has published a breakdown of the bank deposits owned in Switzerland by country of
the owner since the 1970s a number of prominent tax havensmdashincluding Luxembourg the
Channel Islands and Hong Kongmdashhave started publishing similar retrospective information
through the Bank for International Settlements in 2016 In a companion paper (Alstadsaeligter
Johannesen and Zucman 2017) we use this new information to allocate the global amount of
offshore wealth to each of the worldrsquos countries and provide a comprehensive discussion of the
data and methodology involved By this estimate Scandinavians owned 16 of their wealth
in tax havens in 2007
19
It is notable that our two methods deliver consistent results despite the fact that they rely
on independent data This result confirms that Scandinavians did not have an idiosyncratic
preference for HSBC The amnesty data also clearly show that the wealth hidden at HSBC was
only a small fraction of that concealed in total by Scandinavians Among the 8233 Norwegian
and Swedish households who disclosed previously hidden assets in a tax amnesty over the 2007ndash
2015 period only about 50 disclosed an HSBC Switzerland account More than 99 of amnesty
participants hid assets in other offshore banks29
If anything our estimate of Scandinaviansrsquo offshore wealth is likely to be conservative Both
our bottom-up and top-down approaches rely on Zucmanrsquos (2013) estimate that $56 trillion was
held by households in tax havens globally in 2007 which is at the low-end of the scale of available
estimates The OECD calculates that households owned a total of $5 to $7 trillion offshore in
2007 (Owens 2007) based on interviews with wealth managers the Boston Consulting Group
(2008) finds $73 trillion that same year Cap Gemini and Merrill Lynch (2002) have a $85
trillion estimate for 2002 Palan Murphy and Chavagneux (2010) write that ldquothe global rich
held in 2007 approximately $12 trillion of their wealth in tax havensrdquo and Henry (2012) finds $21
to $32 trillion as of 2010 One limitation of Zucmanrsquos (2013) methodology is that it only captures
financial wealth disregarding valuables works of art real estate and other non-financial assets
52 The Distribution of Offshore Wealth
The second step involves distributing the macro amount of offshore wealth owned by Scandina-
vians across wealth groups To do this allocation we assume that Scandinaviarsquos offshore wealth
is distributed like in the HSBC and the amnesty samples That is we assume that 77 of
it belongs to the top 01 richest households 52 belongs to the 001 etc which are the
fractions observed in these two micro datasets (top panel of Figure 6)
It is striking to note that offshore wealth is very similarly distributed in the HSBC and
amnesty samples All available evidence suggests that in 2007 the offshore wealth of Scandi-
navians was extremely concentrated Admittedly Swiss banks had hundreds of thousands of
customers at the time of the Falciani leak but the wealth held by bottom 999 evaders does
29Because the wealth disclosed by amnesty participants tends to be smaller than that held by tax evadersat HSBC in terms of amounts HSBC accounts for a bit more than 1 of the total assets disclosed duringthe amnesty (about 12) Note that 12 is less than what we estimate was the share of Scandinaviansrsquooffshore wealth held at HSBC (20) This suggests that we may under-estimate the total offshore wealth ofScandinavians Another interpretation is that HSBC customers were less likely to self-select into the amnestyNothing however prevented them from using it since Scandinavian tax authorities only received the HSBClist in 2015 following the ldquoSwiss leaksrdquo scandalmdashhence before 2015 HSBC evaders had not been prosecuted forhiding assets in that bank and were free to use the amnesty
20
not account for much compared to that owned by the top 01 While the top 001 owns only
about 5 of all non-hidden wealth it owns about half of all hidden wealth Consistent with
our finding that self-selection into amnesties is slightly negatively correlated with wealth the
concentration of offshore wealth appears slightly lower in the amnesty sample The differences
however are small and not statistically significant To allocate Scandinaviarsquos macro stock of
offshore wealth we thus simply take the arithmetic average of the HSBC and amnesty distri-
butions (eg we assume that 516 of Scandinaviarsquos offshore wealth belongs to the top 001
which is the arithmetic average of 553mdashobserved in the HSBC samplemdashand 478mdashobserved
in the amnesty sample see Appendix Table J1)
53 Taxes Evaded on Offshore Assets
The last step involves computing how much tax each group of the wealth distribution evades
offshore
First we take into account that not all offshore wealth evades taxes Consistent with the
evidence from the HSBC leak and several other concurring sources (US Senate 2008 2014
Roussille 2015 Johannesen and Zucman 2014) we assume that 10 of the macro stock of
Scandinaviansrsquo offshore wealth was duly declared to tax authorities in 2006 and 90 hidden
Next based on the observed composition of offshore wealth and the returns on global se-
curities markets and deposits in 2006 we apply a 45 taxable rate of return to the wealth
hidden30 We then compute the amount of taxes evaded on the hidden wealth itself (when a
wealth tax exists which was the case in Norway and Sweden in 2006) and the dividends inter-
est and capital gains it generates by using a detailed tax simulator that allows us to estimate
the average marginal tax on capital income and wealth by wealth group in Norway Sweden
and Denmark31 We apply these empirical marginal tax rates to the amounts of income and
30The average interest rate paid by Swiss banks on their term deposits was 43 in 2006 the US Federalfund rate was in range of 43 to 525 the total nominal return (dividends reinvested) was 134 for the theSampP500 and 2065 for the MSCI world (see Appendix Table J4) As shown in Zucman (2013) about 75of the worldrsquos offshore wealth was invested in global securities (equities bonds and mutual funds) before thefinancial crisis the rest was held in bank deposits Note that the 45 return we assume in our benchmarkscenario is higher than the realized taxable return observed on non-hidden wealth (about 35 for the top 1richest Scandinavians) The observed return on non-hidden wealth is a lower bound for the return on offshoreassets for two reasons First the portfolio composition differs the non-hidden wealth of top 1 Scandinaviansincludes a large fraction (around 50) of closely-held equities which tend to have lower taxable returns thanlisted securities Second there are incentives to realize low returns on non-hidden wealth so as to avoid taxesfor instance by investing in non-dividend paying equities or by retaining earnings within closely-held firms Acase in point is Norway where following the introduction of a new tax dividend distributions collapsed in 2006and retained earnings surged leading to low realized rates of return (Alstadsaeligter et al 2016) There are nosuch incentives to avoid taxes for offshore investments that evade taxes altogether
31See Appendix J in particular Figures J1 and J2
21
wealth hidden by each wealth group This procedure is reliable because there is very little
heterogeneity in the marginal tax rates on financial capital faced by individual taxpayers at the
top of the distribution as marginal tax rates in Sweden and Norway are the same for interest
dividends and capital gains32 We do not attempt to take into account any tax evasion that
might have occurred on the principalmdashsome of the wealth held offshore is probably accumulated
out of untaxed earnings but we are not able to quantify that form of evasion with the data at
our disposal We also disregard tax evasion on inter-generational transmissions of hidden assets
54 How Offshore Tax Evasion Varies With Wealth
The bottom panel of Figure 6 reports our estimates of how much tax each group of the wealth
distribution evades offshore as a fraction of their true tax liability We find large rates of evasion
at the top of the wealth distribution in our benchmark scenario the top 001 evades 25 of
its true tax liability through tax havens
Tax evasion is high at the top not because the macro stock of wealth in tax havens is
large (indeed it is small in Scandinavia) but because it is hugely concentrated As we saw in
Section 4 top 001 households are much more likely to hide assets and conditional on doing
so hide a lot (about 40 of their total wealth in the HSBC sample) This explains why offshore
tax evasion is orders of magnitude higher in the top 001 (25 of taxes owed) than in the
overall population (a mere 06) A second factor drives the sharp gradient displayed in the
bottom panel of Figure 6 at the very top the vast majority of income derives from wealth So
when a top 001 taxpayer hides 40 of her wealth she hides close to 40 of her income (or
even more if the taxable return on hidden assets is higher than on domestic wealth) and evades
close to (possibly more than) 40 of her taxes For a less wealthy evader who hides 40 of
his assets the taxes evaded offshore will account for a smaller fraction of his tax bill because a
large fraction of taxes owed arise from labor income33
One might wonder how the presence of a wealth tax in Sweden and Norway affects the
results In an accounting sense it does not when computing the ratio of taxes evaded to
32In Denmark share income is taxed at a lower rate 42 vs 48 for interest at the top33To reconcile the estimates of the rates of evasion shown in the bottom panel of Figure 6 with the patterns
of evasion in the micro-data studied in Section 4 consider the following simplified computation As reportedin Figure 3 about 1 of top 001 richest Scandinavians hid assets at HSBC Switzerland and they held thereabout 40 of their wealth Assuming that HSBC Switzerland accounts for 2 of all offshore tax evasion (andthat HSBC customers do not hide assets in other offshore banks and vice versa) this implies that 50 of top001 Scandinavians hid assets abroad and that the top 001 concealed 20 of its total wealth offshore Thefraction of taxes eschewed is slightly larger than 20 in our benchmark scenario because the return we assumeon hidden wealth is slightly higher than on non-hidden wealth
22
taxes owed wealth taxes enter both the numerator and denominator absent such taxes rich
Scandinavians would still evade a similarly high fraction of their tax liability (albeit a smaller
amount in absolute terms) From an economic perspective however wealth taxes might have a
causal effect on tax evasion To analyze this issue it is useful to consider the overall tax rate on
capital income in Scandinavia With a 45 rate of return a wealth tax of 12 (as in Sweden)
is equivalent to a tax on capital income at a rate of 27 a wealth tax of 09 (as in Norway) to
a tax on capital income of 2034 All included the marginal tax rate on capital income reaches
57 in Sweden and 48 in Norway slightly higher than Denmark (42 on share income) where
no wealth tax applies These marginal rates are high but not extraordinarily so For instance
a wealthy New York City resident faces a 56 marginal tax rate on interest income and 36 on
dividends and capital gains in 2016 In effect Norway and Sweden offset part of their wealth
taxes with flat rates on investment incomes while other rich countries usually tax at least part of
capital income progressively What makes Scandinavian countries high-tax in an international
perspective is not so much their high taxes on financial wealth as their broad-base payroll and
value-added taxes (Kleven 2014) none of which are directly relevant for our purposes35
55 Robustness Tests and Sensitivity Analysis
Because our estimates of offshore tax evasion are obtained by transparently combining macro
stocks of hidden assets with observed distributions and assumed taxable rates of returns it is
straightforward to asses how changing one several or all of our assumptions at the same time
affects the results We consider a large number of robustness tests in the Online Appendix based
on varying the macro stock of Scandinaviansrsquo offshore wealth (variants a b c d e in Appendix
Tables J1 J2 J3) the fraction of offshore wealth that is hidden from the tax authorities
(Appendix Table J1) the distribution of offshore assets (cols 9 10 and 11 in Appendix Tables
J1 J2 J3) andor the rate of return on hidden wealth (Appendix J2 and J4) In all cases
offshore tax evasion turns out to be large at the topmdashmuch larger than the evasion detected in
34More precisely in Sweden the marginal wealth tax rate was 15 and in Norway 11 but in both cases itapplied to only a fraction of wealth (eg 80 for equities in both countries) So the marginal tax rate on listedequity wealth was 12 in Sweden and 088 in Norway see Appendix Table J7b for detailed computationsThe Swedish wealth tax was abolished in 2007
35The evidence reported in Table 2 shows that Denmarkmdashwhere wealth taxation was abolished in 1997 andthe overall marginal tax rate on capital is slightly lowermdashseems to hide a smaller fraction of its wealth thanNorway and Sweden However given the uncertainties involved we caution against drawing strong conclusionsfrom this difference In our view tax evasion is better analyzed at the level of Scandinavia as a whole at themicro level small sample sizes do not allow us to detect any statistically significant differences across countriesWe leave to future research the task of investigating the causal effect of wealth taxation on capital flight usingmicro-data and within-country variation For cross-country comparisons of marginal and average tax rates inScandinavia see Appendix Figures J1 J2 and J3
23
random audits For all plausible scenarios it is in a range of 20 to 30
In the bottom panel of Figure 6 we consider two extreme scenarios In the low-end scenario
we assume that Scandinavians own no offshore assets outside of Switzerland The Swiss central
bank publishes direct official data on the stock of wealth owned by foreigners in its banks with a
country-by-country breakdown36 We only include these directly observable assets and exclude
any wealth held by Scandinavians in Luxembourg Singapore or any other tax haven which is
less directly observable This reduces the offshore wealth of Scandinavians by about half The
top 001 however still evades 12 of its tax bill which ismdashas we shall see belowmdashthree times
higher than the amount of evasion detected in random audits Note that we know as a fact
that Scandinavians hid a sizable amount of wealth in Luxembourg Jersey and similar havens in
2006mdashif only because around half of the wealth disclosed in the Norwegian tax amnesty was held
outside of Switzerland So our low-end scenario is maybe better interpreted as reflecting a world
where about half of Scandinaviansrsquo global offshore wealth is duly declared to tax authorities
Conversely we report a high-end scenario where we assume that Scandinavians own the same
fraction of their wealth offshore as the world as a whole This scenario is informative of how
offshore evasion might look like in Continental European countries where macro stocks of
offshore assets are larger than in Scandinavia Offshore tax evasion for the top 001 then rises
to 40 of taxes owed
6 Distributional Tax Gaps
Offshore evasion is just one form of evasion and it is not too surprising that it is concentrated
among the rich The interesting and non-obvious result of our research is that at the top
offshore tax evasion alone is much larger than all forms of evasion detected in random auditsmdash
the current gold standard in the literature This suggests that combining different data sources
is critical to study tax evasion In this Section we contrast and combine offshore tax evasion
with the evasion detected in random audits
61 Random Audit Data
The random audit data we use come from the stratified random audits conducted by the Danish
Tax Authority (SKAT) The first wave of this program for the tax year 2006 was studied by
Kleven et al (2011) Here we analyze the three subsequent waves which were conducted for the
tax years 2008 2010 and 2012 In each wave SKAT randomly selects a sample of self-employed
36See Zucman (2013 Section III 2015 chapter 1) for a detailed analysis of this unique high-quality dataset
24
individuals and a sample of individuals who are not self-employedmdashmostly wage-earners and
retirees The sampling rate is higher for the self-employed who are relatively more numerous
at the top of the distribution and more likely to evade taxes in both groups taxpayers with
complex tax returns are over-sampled Our final sample pools tax years 2008 2010 and 2012
and includes 18985 randomly audited taxpayers (of which 6223 are self-employed and the
remaining 12762 are not)37 Detailed summary statistics are presented in Appendix H
The Danish random audits are widely considered to be of high quality because the tax
authority can draw on a particularly comprehensive set of information returns provided by
employers banks credit card companies and other financial institutions supporting documen-
tation requested from the taxpayers themselves and detailed wealth data This enables SKAT
to detect a wide range of errors from mistakes in the claiming of deductions (eg for alimony or
commuting expenses) to mis-reporting of income that is not declared by a third party (eg tax-
able fringe benefits) and unreported labor market activity (which SKAT can infer by comparing
reported income to the change in wealth) Every line item on the tax return is examined SKAT
improved its audit technique after 2006mdashthe first year it conducted a randomized auditmdashand
now detects more errors While mistakes were found for 107 of all individuals audited in 2006
(Kleven et al Table 2 col 2 line 2) the error rate climbed to 125 in 2010 and 2012 (which
could also partly reflect a real decline in compliance between 2006 and 2010)
By construction the rates of evasion measured in the random audits exclude offshore evasion
for the following reason As discussed in Section 2 above examiners are not well equipped to
detect evasion through offshore intermediaries in the context of random audits In the rare cases
when an examiner might suspect such type of evasion the case is transferred to a specialized
unit within SKAT with the skills to conduct a specific investigation Whatever is found at the
end of this long process is not included in the result of the random audit study as this would
delay the publication of the results for too long
62 Patterns of Tax Evasion in Random Audits
Random audits find modest rates of tax evasion albeit with a lot of heterogeneity across income
sources In total 115 of all taxpayers are found making mistakes As shown by the top panel
of Figure 7 this probability rises sharply with wealth to more than 35 for the 05 richest
households This trend reflects the facts that the probability to earn self-employment income
37Overall 015 of the entire adult Danish population is randomly audited each year in the context of thisprogram The empirical sampling rate is 35 times higher for taxpayers in the top 1 of the distribution (053)our sample includes 663 taxpayers in the top 1 of the wealth distribution See Appendix Table H2
25
rises a lot with wealth (to close to 50 in the top 05) and that the error rate is much
higher among the self-employed (around 60 with no trend across the wealth distribution)
than among wage-earners and retirees (around 10 with no trend either) see Appendix Figure
H4 Conditional on evading around 10ndash20 of income is misreported with a declining trend
across wealth bins (bottom panel of Figure 7) These fractions are modest and as a result the
overall tax gap is small 22 of personal taxes owed are found to be dodged in total This
number rises a little bit with wealth from the 90th to the 99th percentile but in no wealth group
does evaded tax exceeds 5 of taxes owed38
In the United States the IRS estimates that a larger fraction of taxes is evaded about
11 (Johns and Slemrod 2001)39 There are two reasons for this difference First the IRS
blows up the tax evasion its random audits uncover by a factor of about three contrary to
SKAT which does not correct the results found in its random audit program As discussed
in Section 2 above the multiplication done by the IRS rests on weak foundations Second
the self-employment sectormdashwhere the bulk of detected tax evasion takes placemdashaccounts for
roughly twice as much of total economic activity in the United States than in Denmark 11
of factor-cost GDP vs 6 As shown by Appendix Figure H10 Denmark is not unusual in
having a low share of self-employment the other Scandinavian countries have similarly low
shares as do most of the worldrsquos high-income countries eg Japan (4) and France (6)
In countries such as Greece and Italy the self-employed generate a higher fraction of output
(about 20-25) tax evasion is likely to be much higher there than in Denmark Looking
forward Scandinavia is likely to be more representative of the overall rich world than a country
like Greece since self-employment typically falls as countries develop The use of cash which
is conducive of evasion and is limited in Scandinavia is also declining globally (Rogoff 2016)
The key lesson from random audit studies is that in developed economies total tax evasion is
limited because the majority of the population is not able to evade Most individuals earn only
three forms of income in their lifetimemdashwages pensions and investment income in domestic
financial institutionsmdashwhich due to third-party reporting are difficult to hide (Kleven et al
2011) Whenever tax evasion is possible however it tends to be high
38These figures include all mistakes found during the audit whether deemed voluntary or not In AppendixH we report similar statistics where we exclude the errors that examiners deem non-deliberate The fraction ofhouseholds found evading taxes is reduced by a factor of 10 (128 of audited taxpayers are found deliberatelyevading taxes a fraction rising to 54 in the top 1 see Appendix Figure H5) but the average amount ofincome misreported increases by a factor of 5 (Appendix Figure H6) so that taxes deliberately evaded accountfor about half of all unpaid taxes The distributional patterns are similar (Appendix Figure H7)
39As shown by Appendix Figure H3 although the level of evasion is different its distribution across wealth(or income in the case of the United States) groups is similar with an increase in the top 10
26
63 Combining Offshore Evasion with Random Audits
The top panel of Figure 8 shows the tax gap by wealth group for domestic evasion (as estimated
from the random audit data) and offshore evasion separately Adding both types of evasion
we find that 28 of total taxes go unpaid For the vast majority of the populationmdashup to
the 995th percentilemdashonly domestic evasion matters and evaded taxes are small It is only for
the top 005 where wealth concealment is widespread that evasion becomes large Overall a
clear gradient in tax evasion by wealth group thus emerges
One limitation of our estimated distributional tax gap is that it only includes evasion on
payroll personal income and net wealth taxes It excludes evasion on the VAT the corporate
tax real estate taxes and excise duties These forms of tax evasion account for the majority
of the tax gap estimated by Scandinavian tax authorities (see Skatteverket 2014 for Sweden)
but are harder to allocate across the wealth distribution We leave to future work the task of
producing comprehensive tax gaps including all taxes Another limitation is that there might
be forms of personal tax evasion that neither random audits nor the leaked and amnesty data
we use can capture hence that our estimates miss At a modest level our main finding is that
combining random audits leaks amnesties and macroeconomic statistics makes it possible to
obtain a more comprehensive picture of tax evasion than was available until now
Because of tax evasion the personal tax rate effectively paid by the wealthiest Scandinavians
is substantially lower than implied by the tax law The bottom panel of Figure 8 computes
effective tax rates across the wealth distribution taking into account payroll taxes individual
income taxes and wealth taxes (when they exist) at all levels of government Absent tax
evasion the top 01 richest Scandinavians would pay about 45 of their income in taxes
In practice the rate effectively paid barely reaches 35 for the top 001 This rate remains
somewhat higher than the rate paid by the bottom 95 of the wealth distribution But tax
evasion strongly erodes the progressivity of the tax system and makes it regressive at the top
7 A Model of Tax Evasion and Inequality
How can we explain the sharp gradient of evasion with wealth that we find The canonical
Allingham and Sandmo (1972) model predicts that the very rich should evade less because
they are more likely to be (non-randomly) audited by the tax authority Yet our results show
the opposite in all our samples top 001 households are much more likely to hide assets
abroad than households in the bottom of the top 1 A simple model with a fixed cost of
27
hiding wealth cannot realistically generate this pattern because it only costs a few hundred
dollars to create a shell company (see Findley Nielson and Sharman 2012) and even less to
open an offshore bank account40 To explain our findings we believe it is important to analyze
the supply of tax evasion services instead of its demand only We introduce such a model in
this Section
To keep things simple assume that there is a single firmmdashsay a Swiss bankmdashthat sells
wealth concealment services41 Households differ in their wealth y but are all willing to pay
the same unit price θ to hide one dollar of wealth θ can be interpreted as the effective tax
rate on capital which is saved by hiding wealth abroad (and is typically constant within the
top 1 richest households) The wealth distribution is described by the density function f(y)
and the mass of households is normalized to one The more clients the bank serves the higher
the probability that a leak occurs we assume that when it serves s clients the bank has a
probability λs to be caught breaking the law If the bank is caught it has to pay a fine equal
to a fraction φ of the total assets it manages Our model illustrates how internalizing this cost
the bank will serve few but wealthy customers
Assume that the bank is allowed to set different unit prices p(y) across customers with
different wealth y Its expected profit function is
π =
intyp(y)s(y)f(y)dy minus λsφ
intys(y)f(y)dy (1)
where s(y) is the share of households at wealth level y who hide assets in the bank The first
term captures the bankrsquos revenue at a given wealth level y there are s(y)f(y) households who
each pay the bank yp(y) for its services The second term captures the bankrsquos expected penalty
with probability λs it must pay a fine equal to a fraction φ of the wealth it manages The
bankrsquos optimal pricing strategy extracts all surplus from customers who add to its profitabilitymdash
by quoting a price equal to the willingness to pay θmdashand deters households who reduces its
40Purely informational explanations cannot fully account for our results either At the time of the HSBCleak there was almost no information exchange between offshore banks and foreign tax authorities making taxevasion easy This lack of third-party reporting is probably an important explanation for the high rates of taxevasion we obtain at the top of the distribution However it was as easy to hide assets for households with$2 million in net wealth as for households with $50 million yet households with $50 million were much morelikely to do so Although both types of households could have felt very confident in the evasion strategy used(ie could have felt they had a low probability of being caught) only the very wealthy evaded The lack ofthird-party reporting thus does not seem enough to explain the gradient we obtain
41In Appendix K2 we consider an extension of the model to the competitive case all our results carry overSupport for the monopolistic assumption comes from the fact that Swiss banks (which supplied the vast majorityof cross-border wealth management services until the 1980s before financial liberalization in the UK and theemergence of new offshore centers) historically had a cartel agreement the Convention IV of the Swiss BankersAssociation which strictly regulated fees see Zucman (2015 chapter 1)
28
profitability from being customersmdashby quoting a prohibitive price above θ42 Thus we can
think of the bankrsquos problem as choosing the set of customers that maximizes expected profits
given the price θ It follows directly from eq (1) that for a given level of total assets under
management the bank is more profitable when the number of customers is low The bank
optimally chooses to serve wealthier customers first because they generate more revenue than
less wealthy individuals and add the same risk Letting k(s) denote the total wealth owned by
the wealthiest s households we can restate the bankrsquos expected profit function as43
π = θk(s)minus λsφk(s) (2)
The profit-maximizing number of customers slowast is determined by the first-order condition
dπds = 0 which can be expressed as follows
θ =
(1 +
1
εk(slowast)
)φλslowast (3)
where εk(s) = skprime(s)k(s) is the elasticity of the stock of wealth under management with respect
to the number of customers44
The left-hand side is the marginal revenue of managing more wealth and the right-hand side
is the marginal cost (ie the increase in the expected penalty) The expected penalty increases
when the bank manages more wealth both because the penalty applies to a larger stock in case
of detection and because the probability of detection rises with the number of customers
Proposition 1 In equilibrium the slowast wealthiest households face a unit price of θ for wealth
concealment services and evade taxes while all other households face a price higher than θ and
do not evade
To gain further insights assume that wealth follows a Pareto distribution at the top with
a Pareto coefficient a gt 1 This parameterization encompasses different levels of inequality
A high a corresponds to a relatively equal distribution of wealth a low a corresponds to an
42In practice private wealth management banks typically select customers by requiring them to have a min-imum amount of assets (eg $1 million $10 million or $20 million) in effect setting an infinite price for lesswealthy individuals while advertising their services to potential high-net-worth clients through by-invitationonly events (golf tournaments galas etc) See eg Harrington (2016)
43By construction adding ever less wealthy customers adds wealth under management at a declining rate sothat kprime(s) gt 0 and kprimeprime(s) lt 0
44The first-order condition indeed characterizes an optimum since
d2π
ds2= (θ minus λsφ)kprimeprime(s)minus 2λφkprime(s) lt 0
29
unequal distribution when a rarr 1 inequality tends to infinity Income and wealth tend to
follow Pareto distributions at the top and a large literature estimates Pareto coefficients over
time and across countries (see eg Atkinson Piketty and Saez 2011) A typical value of a for
the wealth distribution is a = 15 When wealth is Pareto-distributed the equilibrium number
of tax evaders takes a simple closed-form expression
slowast =θ(
1 + aaminus1
)λφ
(4)
This equation pins down slowast as a function of the modelrsquos parameters the penalty φ the
probability of detection λ and inequality a We summarize the comparative statics in the
following Proposition
Proposition 2 The share slowast of households who evade taxes (i) falls with the probability of
detection λ (ii) falls with the penalty rate φ and (iii) falls as wealth becomes more unequally
distributed (ie as the Pareto coefficient falls)
The first resultmdashthat evasion falls when the probability of detection risesmdashis intuitive and
also present in demand-side models of evasion (Allingham and Sandmo 1972) In our context
however it has new implications for recent and future trends in tax evasion Since 2008 there has
been a growing number of leaks from offshore financial institutions (see Johannesen and Stolper
2017) maybe because technological change makes such leaks easier or because of increases in
the rewards offered to whistleblowers45 This could lead to a reduction in tax evasion But new
technologies such as blockchain or improvements in the banksrsquo internal IT systems might lead λ
to fallmdashmaking tax evasion accessible to less wealthy individuals λ might also be lower in small
banksmdashwhere it might be easier to maintain a strong culture of secrecymdashthan in banking giants
like HSBC If wealth concealment services move to such small boutique banks then enforcement
might prove increasingly hard
The second resultmdashthat evasion falls when penalties risemdashhas implications for policy-making
Although evasion also falls with penalties in standard demand-side models of tax evasion in-
creasing penalties for tax evaders has not proved to be a practical way to curb tax cheating
There are limits to the penalties that can be applied to persons conducting such crimes and
if the penalties set by law are too high judges might require a stronger burden of proof from
prosecutors potentially leading to fewer convictions Large sanctions against the suppliers of
45In the United States the IRS signed a check for $104 million to the ex-banker UBS banker Bradley Birken-feld who revealed the practices of his former employer UBS entered into a deferred prosecution agreement withthe Department of Justice and had to pay a fine of $780 million in 2009
30
tax evasion services may by contrast be a more practical way to curb tax evasionmdashif only
because fewer cases need to be investigated If policy-makers were willing to systematically
put out of business the financial institutions found facilitating evasion then slowast could be re-
duced dramatically It is however easier to close small banks than systematically important
institutions Since 2009 80 Swiss banks have admitted helping US persons to evade taxes
16 others have been under criminal investigation by the Department of Justice But the US
government has been able to shut down only three relatively small institutions (Wegelin Neue
Zurcher Bank and Bank Frey) in 2014 Credit Suisse was able too keep its US banking licence
despite pleading guilty of a criminal conspiracy to defraud the IRS In 2012 US authorities
similarly decided against indicting HSBC despite evidence that the bank had enabled Mexican
drug cartels to move money through its American subsidiaries46 If big financial institutions be-
come ldquotoo big to indictrdquo (because regulators fear that this would destabilize financial markets)
tax evasion might flourish
The third resultmdashthat the number of tax evaders falls when inequality increasesmdashis specific
to the supply-side model developed here It holds true with any well-behaved distribution of
wealth Its intuition is the following when inequality is high a handful of individuals own the
bulk of wealth they generate a lot of revenue for the bank and are unlikely to be detected
Moving down the distribution would mean reaching a big mass of the population that would
generate only relatively little additional revenue but would increase the risk of detection a lot
it is not worth it As inequality rises the fraction of households who evade taxes falls but the
fraction of wealth which is hidden increases In the extreme case where inequality is infinite
(ararr 1) only one person evades taxesmdashbut 100 of capital taxes owed are evaded
This inequality effect could explain some of the observed trends in top-end evasion The
number of clients of Swiss banks seems to have declined over the last ten years as shown
by Appendix Figure E6 it has been divided by 3 at HSBC Switzerland over the 2006ndash2014
period While part of this fall probably owes to changes in λ and φ (and in the specific case of
HSBC to the Falciani leak) one other contributing factor might be the rise in global wealth
concentration47 Indeed while the number of HSBC clients fell the average account value
increased 80 from $37 million in 2006 to $66 million in 2014 the offshore wealth managed by
Swiss banks has also increased significantly since 2000 (Zucman 2015) As the world becomes
46Instead HSBC was fined $192 billion in a year when its pretax profits reached $226 billion47In the worldrsquos two largest economies the United States and China top wealth shares have increased sig-
nificantly since the beginning of the century (Saez and Zucman 2014 Piketty Yang Zucman 2017) Forbesmagazine data suggest that the wealth of global billionaires is rising faster than world wealth (Piketty 2014)
31
more unequal offshore banks might choose to serve fewer but wealthier clients Conversely
when wealth inequality was low in the 1950s and 1960s (following the destructions of World
War II nationalizations in Europe and a number of other anti-capital policies) Swiss banks
may have chosen to serve a broader segment of the population This could explain why on top
of ultra-rich households we also observe a number of moderately wealthy old evaders in the
HSBC leak and the amnesty data
Appendix K shows that introducing competition in our model does not affect the comparative
statics summarized in Proposition 248 but generates an additional insight With competition
an exogenous increase in the number of suppliers of wealth concealment servicesmdashfor instance
due to market liberalization that lowers entry costsmdashincreases the fraction of households who
evade taxes by reducing unit prices for wealth concealment Supply forces could thus help
explain the rise in offshore tax evasion through the 1980s 1990s and 2000s
8 The Interplay Between Tax Avoidance and Evasion
Should tax evasion become impossible would wealthy individuals pay significantly more taxes
The answer largely depends on how substitutable illegal tax evasion and legal tax avoidance
are In this Section we address this question by analyzing the behavior of the large sample of
Norwegians who voluntarily disclosed previously hidden wealth in the context of a tax amnesty
81 Sample of Amnesty Participants
Norwayrsquos tax amnesty program allows taxpayers to avoid penalties and criminal sanctions for
past tax evasion Tax evaders can benefit from the program under three conditions they must
offer information about hidden wealth voluntarily and not in connection with investigations by
the tax authority the information must be sufficient for the tax administration to assess the
correct amount of taxes owed and the origin of the hidden wealth and income must be revealed
The amnesty program was rarely used in the decades following its inception in 1950 The
number of participants first increased in 2008 when in a scandal widely covered by the media
the mayor of Oslo had to resign from office after his ex-son-in-law revealed that he had owned
hidden bank accounts in Switzerland As Appendix Figure G6 shows most subsequent disclo-
48While the offshore banking sector continues to serve all households above a wealth threshold competitionprevents banks from appropriating the full economic rent associated with tax evasion and equilibrium unit pricesin the market for wealth management are declining in the wealth level of the customers Intuitively prices forcustomers with more wealth are competed down to lower levels because they generate more revenue for thebanks while adding the same detection risk as customers with less wealth
32
sures happened in two waves in 2009 and 2013-14 The 2009 wave coincides with the G20 tax
haven crackdown where tax havens like Switzerland and Luxembourg agreed to provide bank
information to foreign tax administrations on request (Johannesen and Zucman 2014) The
2013ndash2014 wave coincides with the commitment by most tax havens to exchange bank informa-
tion automatically The sample we use includes all individuals who disclosed hidden offshore
wealth in the amnesty during the 2008ndash2015 period whose cases were not dropped by the tax
authority and for whom a tax return with income and wealth information exists for 2007
Tax amnesty participants tend to be extremely wealthy Table 3 reports summary statistics
for our sample in 2007 before they use the amnesty Individuals in that sample report on average
150 times more wealth (at tax value) than other Norwegians Accounting for the hidden wealth
subsequently disclosed they own almost 250 times more taxable assets They are older and
more likely to be male married and foreign-born than the rest of the population
Before using the amnesty disclosers also engaged more frequently in tax avoidance although
far from systematically We consider four indicators of legal tax avoidance First the introduc-
tion of a dividend tax in 2006 created an incentive for owners of closely-held firms to pay out
dividends in 2005 Among the sample of amnesty participants 67 paid out all the retained
earnings of a closely-held firm in 2005 as compared to 07 in the rest of the population Second
until 2009 the tax rules provided for a wealth tax rebate if the combined wealth and income tax
liabilities exceeded 80 of the taxpayerrsquos taxable income 65 of the disclosers benefited from
this rebate in 2007 compared to 03 of the non-disclosers Third a well-known tax planning
technique in Norway is the holding of unlisted shares which are taxed for only a fraction of
their actual market value49 286 of the amnesty participants held unlisted securities in 2007
(vs 39 in the rest of the population) Fourth rich Norwegians can defer personal taxes on
capital income by holding assets through a separate legal entity 119 of our sample owned a
holding company in 2007 (vs 06)
82 Estimating Substitution Between Evasion and Avoidance
To test whether a decrease in tax evasion sparks an increase in tax avoidance we use an event-
study framework We estimate how the reported wealth and income of amnesty participants
and the taxes they pay evolve around the time they voluntarily disclose hidden assets Our
49While listed equities enter the wealth tax base at their market value unlisted equities are taxed at the taxvalue of the underlying business assets which typically implies a significant rebate Gobel and Hestdal (2015)estimate that the tax rebate to the most liquid unlisted equities is around 70 and exceeds 90 for a set ofunlisted equities that were eventually listed
33
estimating sample includes all 1485 disclosers described above plus a sample of non-disclosers
serving to establish a counterfactual This control group includes all non-disclosers in the top
10 of the 2007 wealth distribution andmdashfor computational reasonsmdasha randomly selected 10
sample of the non-disclosers in the bottom 90 Indexing individuals by i and years by t we
estimate the following model
log(Yit) = αi + γt +X primeitψ +sum
βkDkit + uit
where αi denotes individual fixed effects γt year fixed-effects and Dit year time dummies
These dummies are the main variables of interest and measure the change in the outcomes
Yit of amnesty participants relative to the year before they use the amnesty over and above
the changes observed for similar non-amnesty participants50 We also include a set of non-
parametric controls Xit for wealth income and age Specifically we divide the sample of
amnesty participants into ten equally-sized groups based on their wealth in 2007 assign non-
disclosers to these wealth groups and introduce a separate set of time dummies for each group
This allows time trends to vary across taxpayers with different wealth and ensures that we
identify from a comparison of evaders and non-evaders that are similar with respect to their
wealth in 2007 We similarly allow time trends to vary across taxpayers of different ages (6 age
groups) and with different levels of 2007 income (10 income groups)
83 Results
The first finding is that the wealth and income reported by amnesty participants on their tax
return jumps sharply just after they use the amnesty As shown by Figure 9 reported income
and wealth follow the same trend among disclosers and non-disclosers in the years tminus 5 to tminus 2
(where t is the year when the disclosers use the amnesty) but the taxable wealth reported by
disclosers increases by more than 50 relative to non-disclosers between tminus 2 and t The effect
of the amnesty shows up as soon as tminus1 because tax evaders using the amnesty in the beginning
of year t can account for the disclosed income and assets in the tax return for year tminus 1 The
jump is consistent with the evidence discussed in Section 4 that amnesty participants hid on
average one third of their true wealth Reported taxable income similarly rises by around 20
Second taxes paid rise in line with the increase in income and wealth declared As shown
by Figure 10 the taxes paid by amnesty participants increase by about 30 right at the time
50Since evaders disclosing offshore wealth in the beginning of year t can incorporate the disclosed wealth intothe tax return for year tminus1 we let year tminus2 the last year for which the tax return has definitely been submittedat disclosure in year t be the omitted event time category
34
they use the amnesty relative to non-participants The magnitude of the increase corresponds
to what one would mechanically expect given the rise of 20 in taxable income and 50 in
taxable wealth and the marginal tax rates that apply There is thus no indication that amnesty
participants start avoiding more just at the time when they use the amnesty
Third and most importantly income wealth and taxes paid remain permanently higher
through year t+ 4 There is no sign that the tax bases and tax liabilities of disclosers decrease
after the initial surge suggesting that substitution away from evasion toward legal tax avoidance
is limited This interpretation is supported by Table 4 in which we analyze patterns in tax
avoidance around the time of disclosure We find no sign that tax evaders incorporate holding
companies more frequently after disclosing their offshore wealth (col 4) nor that they increase
their holdings of tax-favored asset classes such as unlisted equities (col 5) and real estate which
is typically taxed at only about 20 of its market value (col 6) These results do not seem to
mask heterogeneity in the form of a tail of aggressive avoiders tax evaders do not become more
likely to report zero capital income after using the amnesty (col 7) nor do they emigrate more
(col 8) Along all these dimensions substitution from evasion towards avoidance is negligible
One potential concern with our interpretation of these results is that amnesty participants
might have already exhausted all available avoidance strategies by the time they use the amnesty
This would be the case if the most tax-averse individuals first search for legal ways to cut their
taxes before turning to illegal ways We test this hypothesis in a set of cross-sectional regressions
for 2007 where avoidance dummies are regressed on a dummy indicating whether the individual
discloses hidden wealth at some point during the 2008-2015 period and flexible non-parametric
controls for wealth income and age This specification tests for whether tax evaders were
avoiding more prior to disclosure than taxpayers who were similar in terms of wealth income
and age The results are reported in Appendix Table G7 We find that amnesty participants
prior to disclosure were in fact less likely to maximize dividend payments from closely-held
firms to own a holding company and to artificially lower their taxable income so as to reduce
their wealth tax bill by virtue of the 80 tax ceiling rule These results are not driven by
differences in wealth across treated and control groups which we appropriately control for
Overall the Norwegian amnesty seems to have been an effective way to generate more tax
revenue from the very wealthy The rise in taxable income taxable wealth and taxes paid
when amnesty participants disclose previously hidden assets is not eroded by a rise in legal tax
avoidance despite ample opportunities to do so Tax amnesties however raise other issues that
we cannot address with our data they might for example encourage tax evasion if taxpayers
35
expect they will always be able to come clean for a modest cost if need be The main lesson we
draw from our analysis is that fighting tax evasion can at least in some circumstances be an
effective way to increase tax collections from the very wealthy51
9 Implications for the Measurement of Inequality
In this Section we analyze the implications of our results for the measurement of long-run
trends in wealth inequality We consider the case of Norway where consistent long-run time
series of top wealth shares exist
Norway has been levying a wealth tax throughout most of the twentieth century Based
on published tabulated tax statistics Roine and Waldenstrom (2015) estimate long-run top
wealth shares From 2001 we have access to micro-level estimates of wealth for each Norwegian
individual based on reports by third-parties (Norwegian banks mutual funds depositories etc)
We use these data to construct top wealth shares following the methodology described in section
41 and further detailed in Appendix B Our top wealth shares are fully consistent in level and
trends with those reported by Roine and Waldenstrom (2015) Before 2001 the estimates
produced by Roine and Waldenstrom (2015) are not based on population-wide micro-files but
on tabulated statistics so they involve some margin of error The overall long-run evolution
however seems pretty clear Wealth concentrationmdashas seen from administrative datamdashwas
relatively high in the early twentieth century the top 01 richest households owned around
12ndash14 of total wealth It then declined from the 1940s to the 1970s over these four decades
the top 01 wealth appears to have been more than halved reaching a low water-mark of
around 6 in the 1980s Since then it seems to have rebounded to about 8 The time
evolution of top income shares is similar (Aaberge and Atkinson 2010)
How does factoring in hidden wealth affect this evolution In our benchmark scenario we
estimate that Norwegians own about 19 of their total household wealth offshore We assume
that this wealth is distributed like in the HSBC and amnesty samples ie that about 80 of
it belongs to the top 01 and about 50 to the top 001 As reported in the top panel of
Figure 11 including offshore wealth increases the top 01 wealth share significantly from 84
to 98 on average over the 2000ndash2009 period For the top 001mdasha group that includes about
300 Norwegian households in 2010mdashreported wealth increases by more than 25 (bottom panel
51This needs not to be true in all contexts In an important contribution Slemrod Blumenthal and Christian(2001) analyze a randomized experiment in Minnesota where randomly selected taxpayers were informed thatthe returns they were about to file would be ldquoclosely examinedrdquo They find that high-income treated taxpayerspaid less tax relative to the control group suggesting substitution away from evasion toward legal avoidance
36
of Figure 11) That is these households own more than 20 of their wealth in tax havens
In order to give a broad sense of how tax havens affect the long-run trends in wealth inequal-
ity we correct top wealth share back to the 1930s In the 1990s two international commissions
got access to the archives of Swiss banks The firstmdashpresided over by Paul Volcker former
chairman of the US Federal Reservemdashaimed at identifying the dormant accounts belonging to
victims of Nazi persecutions and their heirs the secondmdashchaired by the historian Jean-Francois
Bergiermdashaimed at better understanding the role played by Switzerland during World War II
Drawing on the work of these commissions Zucman (2015 chapter 1) constructs historical series
for the amount of foreign wealth managed by Swiss banks back to the early twentieth century
We assume that Norwayrsquos offshore wealth has followed the same evolution as the foreign wealth
in Swiss banks and that hidden wealth was as concentrated in the past as today Although
a sizable margin of error is involved here the broad patterns are likely to be robust all the
available evidence suggests that although the wealth held by foreigners in Switzerland was not
insignificant back in the 1930s it is in the 1980s and 1990s that it grew the most As a result
accounting for hidden assets erases almost half of the decline in the top 01 wealth share
observed in tax data since the 1930s The top 001 appears to have now recovered from the
decline in wealth concentration caused by World War II and the policy changes of the post-war
decades This finding suggests that the historical decline of European inequality over the last
century one of the core findings in the literature on the long-run distribution of income and
wealth (eg Piketty 2014 chapter 10) may be less spectacular than suggested by tax data
10 Conclusion
In this paper we combine micro-data leaked from financial institutions in tax havens with
randomized audit amnesty and population-wide registry data to study the size and distribution
of tax evasion in rich countries Random audits show high evasion rates among the self-employed
but little evasion among salaried workers and retirees for whom third-party reporting greatly
limits evasion possibilities Since self-employed individuals only account for a small fraction of
the population in rich countries random audits suggest that tax evasion is low overall Leaks and
tax amnesties on the other imply sizable tax evasion by very rich households a phenomenon
random audits do not capture Combining leaks amnesties and random audits we estimate
that the top 001 of the wealth distributionmdasha group that includes households with more
than $45 million in net wealthmdashevades 25ndash30 of its taxes This is an order of magnitude
more than the average evasion rate of 3 To have a good measure of tax evasion combining
37
different data sources is critical
Because the income and wealth that evades taxes is highly concentrated tax evasion turns
out to have important implications for the measurement of inequality In the case of Norway
accounting for hidden assets increases the wealth of the top 001 by more than 25 Our
results suggest that tax data may significantly under-estimate the rise of wealth concentration
over the last four decades as the world was less globalized in the 1970s it was harder to move
assets across borders and offshore tax havens played a less important role Because most
Latin American and many Asian and European economies own much more wealth offshore
than Norway the results found in Norway are likely to be lower bound for most of the worldrsquos
countries Fortunately many countries have access to data similar to those we exploit in this
paper Although the HSBC list is not public it was shared by the French tax authority with
foreign countriesrsquo administrations in 2009 The Panama Papers database is publicly accessible
Other leaks have occurred in recent years from majors providers of offshore financial services
Moreover tax amnesty data are widely available in many countries and our results suggest
they can yield valuable insight into the distribution of tax evasion Our analysis could thus be
implemented by tax authorities and researchers around the world including in countries where
tax evasion may be more prevalent than in Scandinavia
As a first step in this endeavor in Alstadsaeligter Johannesen and Zucman (2017) we construct
estimates of the macro amount of wealth held in tax havens by households of each country in
the world and we investigate the implications of hidden wealth for inequality assuming that
offshore wealth is as concentrated in the other countries as in Scandinavia We report the results
for 6 economies in Figure 12 In an international perspective Scandinavians own a relatively
small fraction of their wealth offshore the effects of accounting for offshore wealth are therefore
larger in the UK Spain and France where by our estimates 30ndash40 of all the (hidden plus
non-hidden) wealth of the 001 richest households is concealed abroad In the United States
offshore wealth also increases inequality significantly The effect is more muted than in Europe
because US top wealth shares are very high even disregarding tax havens Although more
research is needed to have fully accurate estimates of the size and distribution of the wealth
held in tax havens these results highlight the importance of looking beyond tax data to study
wealth accumulation among the rich in a globalized world
References
Aaberge Rolf and Anthony B Atkinson 2010 ldquoTop Incomes in Norwayrdquo in Atkinson
AB and Piketty T (ed) Top Incomes A Global Perspective Oxford University Press
Allingham Michael G and Agnar Sandmo 1972 ldquoIncome Tax Evasion A Theoretical
Analysisrdquo Journal of Public Economics 1(3ndash4) 323ndash338
Alstadsaeligter Annette Martin Jacob Wojciech Kopczuk and Kjetil Telle 2016
ldquoAccounting for Business Income in Measuring Top Income Shares Integrated Accrual Ap-
proach Using Individual and Firm Data from Norwayrdquo NBER Working Paper No 22888
Alstadsaeligter Annette Niels Johannesen and Gabriel Zucman 2017 ldquoWho Owns
the Wealth in Tax Havens Macro Evidence and Implications for Global Inequalityrdquo NBER
working paper No 23805
Alvaredo Facundo Anthony Atkinson Thomas Piketty Emmanuel Saez and Gabriel
Zucman 2017 The World Wealth and Income Database httpWIDworld
Andreoni James Brian Erard and Jonathan Feinstein 1998 ldquoTax Compliancerdquo
Journal of Economic Literature 36 818ndash60
Artavanis Nikolaos Adair Morse and Margarita Tsoutsoura 2016 ldquoMeasuring In-
come Tax Evasion Using Bank Credit Evidence from Greecerdquo Quarterly Journal of Economics
131(2) 739ndash798
Atkinson Anthony B and A J Harrison 1978 The Distribution of Personal Wealth
in Britain Cambridge Cambridge University Press
Atkinson Anthony Thomas Piketty and Emmanuel Saez 2011 ldquoTop Incomes in the
Long-Run of Historyrdquo Journal of Economic Literature 49(1) 3ndash71
Auten Gerald and David Splinter 2017 ldquoIncome Inequality in the United States Using
Tax Data to Measure Long-term Trendsrdquo US Department of the Treasury Office of Tax
Analysis unpublished mimeo
Bishop John A John P Formby and Peter Lambert 2000 ldquoRedistribution Through
the Income Tax The Vertical and Horizontal Effects of Noncompliance and Tax Evasionrdquo
Public Finance Review 28(4) 335ndash350
Blanchet Thomas Juliette Fournier and Thomas Piketty 2017 ldquoGeneralized Pareto
Curves Theory and Applicationsrdquo WIDworld Working Paper 201703
Boston Consulting Group 2008 ldquoGlobal Wealth Report A Wealth of Opportunities in
Turbulent Timesrdquo September 2008
Cap Gemini and Merrill Lynch 2002 ldquoWorld Wealth Reportrdquo
Cooper Michael John McClelland James Pearce Richard Prisinzano Joseph Sul-
livan Danny Yagan Owen Zidar and Eric Zwick 2016 ldquoBusiness in the United States
Who Owns It and How Much Tax Do They Payrdquo Tax Policy and the Economy 30 91ndash128
Crane Steven E and Farrokh Nourzad 1990 ldquoTax Rates and Tax Evasion Evidence
from California Amnesty Datardquo National Tax Journal 43(2) pp 189ndash199
Feinstein Jonathan S 1991 ldquoAn Econometric Analysis of Income Tax Evasion and Its
Detectionrdquo The RAND Journal of Economics 22(1) 13ndash35
Feldman Naomi and Joel Slemrod 2007 ldquoEstimating Tax Noncompliance with Evidence
from Unaudited Tax Returnsrdquo Economic Journal 117(518) 327ndash352
39
Findley Michael Daniel Nielson and Jason Sharman 2012 ldquoGlobal Shell Games
Testing Money Launderersrsquo and Terrorist Financiersrsquo Access to Shell Companiesrdquo http
wwwgfintegrityorgwp-contentuploads201405Global-Shell-Games-2012pdf
Fisher Ronald C John H Goddeeris and James C Young 1989 ldquoParticipation in
Tax Amnesties The Individual Income Taxrdquo National Tax Journal 42(1) pp 15ndash27
Garbinti Bertrand Jonathan Goupille-Lebret and Thomas Piketty 2017 ldquoIncome
Inequality in France 1900-2014 Evidence from Distributional National Accounts (DINA)rdquo
Working Paper
Gobel Maria Nyrud and Thea Hestdal 2015ldquoFormuesskatt pa unoterte aksjer en analyse
av ulikheter i verdsettelsesgrunnlaget til boslashrsnoterte og unoterte aksjerrdquo mimeo
Harrington Brooke 2016 Capital Without Borders Cambridge Harvard University Press
Henry James S 2012ldquoThe Price of Offshore Revisited New Estimates for Missing Global
Private Wealth Income Inequality and Lost Taxesrdquo Tax Justice Network working paper
HSBC 2015 ldquoHSBCrsquos Swiss Private BankmdashProgress Updaterdquo available online at http
tinyurlcomycucct3d
Internal Revenue Service 2016 ldquoTax Gap Estimates for Tax Years 2008ndash2010rdquo April 2016
Jakobsen Katrine Kristian Jakobsen Henrik Kleven and Gabriel Zucman 2018
ldquoWealth Taxation and Wealth Accumulation Theory and Evidence from Denmarkrdquo working
paper
Johannesen Niels and Tim Stolper 2017 ldquoThe Deterrence Effect of Whistleblowing -
An Event Study of Leaked Customer Information from Banks in Tax Havensrdquo working paper
Johannesen Niels Patrick Langetieg Daniel Reck Max Risch and Joel Slemrod
2017 ldquoTaxing Hidden Wealth The Consequences of US Enforcement Initiatives for Evasive
Foreign Accountsrdquo unpublished mimeo
Johannesen Niels and Gabriel Zucman 2014 ldquoThe End of Bank Secrecy An Evaluation
of the G20 Tax Haven Crackdownrdquo American Economic Journal Economic Policy 6(1) 65ndash91
Johns Andrew and Joel Slemrod 2010 ldquoThe Distribution of Income Tax Noncompliancerdquo
National Tax Journal 63(3) 397ndash418
Kauffmann Daniel and Art Kraay 2017 ldquoThe Worldwide Governance Indicatorsrdquo avail-
able online at httpinfoworldbankorggovernancewgihome
Kleven Henrik Jacobsen 2014 ldquoHow Can Scandinavians Tax So Muchrdquo Journal of
Economic Perspectives 28(4) 77ndash98
Kleven Henrik Jacobsen Martin B Knudsen Claus Thustrup Kreiner Soslashren Ped-
ersen and Emmanuel Saez 2011 ldquoUnwilling or Unable to Cheat Evidence from a Tax
Audit Experiment in Denmarkrdquo Econometrica 79(3) 651ndash692
Kuznets Simon 1953 Shares of Upper Income Groups in Income and Savings New York
National Bureau of Economic Research
Larudee Mehrene 2016 ldquoDid capital go away Capital flight as an explanation for declining
reported wealth inequality during and after World War Irdquo mimeo University of Massachusetts
Luttmer Erzo FP and Monica Singhal 2014 ldquoTax Moralerdquo Journal of Economic
Perspectives 28(4) pp 149ndash168
Mikesell John L 1986 ldquoAmnesties for State Tax Evaders The Nature of and Response to
Recent Programsrdquo National Tax Journal 39(4) pp 507ndash25
40
Novokmet Filip Thomas Piketty and Gabriel Zucman 2017 ldquoFrom Soviets to Oli-
garchs Inequality and Property in Russia 1905ndash2016rdquo NBER Working Paper No 23712
Nygard Odd E Joel Slemrod and Thor O Thoresen 2017 ldquoDistributional Implica-
tions of Joint Tax Evasionrdquo Economic Journal forthcoming
Owens Jeffrey 2007 ldquoOffshore Tax Evasion The Role of Exchange of Informationrdquo written
testimony before the Senate Finance Committee on Offshore Tax evasion May 3 2007
Palan Ronen Richard Murphy and Christian Chavagneux 2010 Tax Havens How
Globalization Really Works Cornell Studies in Money Ithaca NY Cornell University Press
Pellegrini Valeria Alessandra Sanelli and Enrico Tosti 2016ldquoWhat do External
Statistics tell us About Undeclared Assets held Abroad and Tax Evasionrdquo Bank of Italy
Occasional Paper 367
Piketty Thomas 2014 Capital in the 21st Century Cambridge Harvard University Press
Piketty Thomas and Emmanuel Saez 2003 ldquoIncome Inequality in the United States
1913ndash1998rdquo Quarterly Journal of Economics 118(1) 1-39
Piketty Thomas Emmanuel Saez and Gabriel Zucman 2018 ldquoDistributional National
Accounts Methods and Estimates for the United Statesrdquo Quarterly Journal of Economics
forthcoming
Piketty Thomas Li Yang and Gabriel Zucman 2017 ldquoCapital Accumulation Private
Property and Rising Inequality in China 1978ndash2015rdquo NBER Working Paper 23368
Pissarides Christopher A and Guglielmo Weber 1989 ldquoAn Expenditure-Based Esti-
mate of Britainrsquos Black Economyrdquo Journal of Public Economics 39 17ndash32
Rogoff Kenneth S 2016 The Curse of Cash Princeton University Press
Roine Jesper and Daniel Waldenstrom 2008 ldquoThe evolution of top incomes in an
egalitarian society Sweden 1903ndash2004rdquo Journal of Public Economics 92 366ndash387
Roine Jesper and Daniel Waldenstrom 2009 ldquoWealth Concentration over the Path of
Development Sweden 18732006rdquo Scandinavian Journal of Economics 111(1) 151ndash187
Roine Jesper and Daniel Waldenstrom 2015 ldquoLong-run Trends in the Distribution of
Income and Wealthrdquo In Handbook of Income Distribution Vol 2 ed Anthony B Atkinson
and Francois Bourguignon Chapter 7 469ndash592 ElsevierNorth Holland
Roussille Nina 2015 ldquoTax Evasion and the lsquoSwiss Cheesersquo Regulationrdquo mimeo
Saez Emmanuel and Gabriel Zucman 2016 ldquoWealth Inequality in the United States
since 1913 Evidence from Capitalized Income Tax Datardquo Quarterly Journal of Economics
131(2) 519ndash578
Skatteverket 2014 ldquoThe development of the tax gap in Sweden 2007ndash12rdquo technical report
Slemrod Joel 2007 ldquoThe Economics of Tax Evasionrdquo Journal of Economic Perspectives
21(1) 25ndash48
Slemrod Joel 2017 ldquoTax Compliance and Enforcementrdquo working paper
Slemrod Joel Marsha Blumenthal and Charles Christian 2001 ldquoTaxpayer response
to an increased probability of audit evidence from a controlled experiment in Minnesotardquo
Journal of Public Economics 79 455ndash483
Slemrod Joel and Caroline Weber 2012 ldquoEvidence of the invisible toward a credibility
revolution in the empirical analysis of tax evasion and the informal economy rdquo International
Tax and Public Finance 19(1) 25ndash53
41
US Senate 2008 ldquoTax Haven Banks and US Tax compliancerdquo Staff Report of the
Permanent Subcommittee on investigations
US Senate 2014 ldquoOffshore Tax Evasion The Effort to Collect Unpaid Taxes on Billions in
Hidden Offshore Accountsrdquo Staff Report of the Permanent Subcommittee on investigations
Zucman Gabriel 2013 ldquoThe Missing Wealth of Nations Are Europe and the US net
Debtors or net Creditorsrdquo Quarterly Journal of Economics 128(3) 1321ndash1364
Zucman Gabriel 2014 ldquoTax Evasion on Offshore Profits and Wealthrdquo Journal of Economic
Perspectives 28(4) 121ndash148
Zucman Gabriel 2015 The Hidden Wealth of Nations The Scourge of Tax Havens Chicago
University of Chicago Press
42
Table 1 HSBC evaders Panama papers individuals amp amnesty participants by wealth group
[1] [2] [3] [4] [5] [6] [7] [8] [9] [10] [11] [12]
Wealth group of all households
Test of evaders
wealthTest
of all households
Test of all
householdsTest
of evaders wealth
Test of all
householdsTest
P0-90 000 3508 A 000 003 3652 C 003(000) (921) (000) (000) (186) (000)
P90-95 001 3827 A 001 A 025 2532 A 026(000) (445) (000) (001) (206) (001)
P95-99 003 3934 A 001 A 078 2742 AB 080(000) (351) (000) (002) (126) (002)
P99-995 007 4232 A 004 B 283 3102 B 289(001) (591) (001) (009) (195) (009)
P995-999 019 4651 A 004 B 431 3089 B 449(002) (377) (001) (012) (152) (012)
P999-9995 038 A 3619 A 016 B 816 3126 ABC 851(008) (585) (006) (045) (279) (045)
P9995-9999 066 A 3663 A 017 B 1149 A 3284 BC 1176(012) (924) (007) (058) (292) (059)
P9999-100 094 A 3860 A 119 1377 A 2630 AB 1483(030) (934) (039) (125) (451) (129)
Number of householdsNumber of tax evaders 8233
75471701375
75471708571520
10617167300
7547170165
Intensive margin Extensive margin
HSBC + AmnestyAmnesty
10617167 7547170
HSBC Panama Papers
Intensive margin Extensive margin Extensive marginExtensive margin
Notes Cols 1 5 7 and 11 show the fraction of all households who evaded taxes at HSBC Switzerland who are in the Panama papers or who used a
tax amnesty to voluntarily disclose hidden wealth by wealth group For HSBC our sample pools Norwegian Swedish and Danish households therefore
wealth groups are defined relative to Scandinavia as a whole (Norway Sweden plus Denmark) For the Panama papers amnesty participants and HSBC
plus amnesty columns our sample pools Norwegian and Swedish households therefore wealth groups are defined relative to Norway plus Sweden Col 3
shows the wealth hidden at HSBC Switzerland as a fraction of each evaderrsquos wealth (including that hidden at HSBC) the sample includes all HSBC evaders
for whom HSBC account values are available Col 9 shows the same statistic for the sample of Norwegian amnesty participants All values are expressed
in percentage points Bootstrapped standard errors are reported in parenthesis Cols 2 4 6 6 8 10 and 12 show the results of pairwise tests for the
equality of the group means displayed in cols 1 3 5 7 9 and 11 Wealth groups sharing a common letter are not significantly different at the 5 level
Table 2 Offshore wealth at HSBC in all Swiss banks and in all tax havens (2007)
World Scandinavia Sweden Norway Denmark
A Wealth held offshore ($ billion)
At HSBC Switzerland Private Bank 1050 101 049 032 020
In all Swiss banks 2670 215 128 42 44
In all the worlds tax havens (benchmark estimate) 5620 510 284 141 84
- Bottom-up estimate 5620 542 262 173 107
B Wealth held offshore ( of household wealth)
In all Swiss banks 15 07 09 06 04
In all the worlds tax havens (benchmark estimate) 33 16 19 19 08
- Bottom-up estimate 33 17 18 24 10
Notes This Table reports estimates of (i) the wealth managed by HSBC Private Bank Switzerland (ii) the offshore wealth managed by all Swiss banks
and (iii) the offshore wealth held in all the worldrsquos tax havens Offshore wealth is defined as bank deposits and portfolio securities managed by domestic
banks on behalf of non-resident households All the data are for the middle of 2007 the time of the Falciani leak For HSBC the column ldquoworldrdquo is the
official total published by HSBC (2015) totals for Scandinavia Sweden Norway and Denmark only include the accounts that could be matched to an
individual taxable in Scandinavia they exclude all unmatched accounts non-resident account-holders and remove the double-counting of joint accounts
see Appendix E The offshore wealth in all Swiss banks is constructed from official statistics published by the Swiss central bank see Zucman (2013 2015)
and Appendix I The wealth held in all the worldrsquos tax havens is estimated by averaging the end-2006 and end-2007 estimate of Zucman (2013) see text
for a description of the benchmark and bottom-up allocation of this total to Scandinavia Panel B divides the amounts reported in Panel A by household
wealth totals constructed by averaging end-2006 and end-2007 values see Appendix A
Table 3 Norwegian tax amnesty participants summary statistics
Not amnesty participants
Amnesty participants
Number of individuals 3807650 1485
DEMOGRAPHICS
Age 46 58
Male 50 66
Number of children 23 22
Foreign born or foreign national 12 22
Married 46 61
INCOME AND WEALTH ($)
Reported taxable wealth (tax value) 20268 3106924
True taxable wealth (tax value) 20268 4830379
Reported taxable income 55713 202759
Reported taxable capital income 3264 93762
TAX AVOIDANCE INDICATORS
Maximized dividend payments in 2005 07 67
80 wealth tax reduction 03 65
Owns unlisted shares 39 286
Owns a holding company 06 119
All Norwegian residents (2007)
Notes The Table provides summary statistics for individuals who have used the Norwegian tax amnesty to
disclose previously hidden offshore assets and individuals who have not used the amnesty Amnesty participants
whose cases were dropped by the tax authorities are excluded For computational tractability the sample consists
of all amnesty participants (with weight 1) all non-participants with wealth above the 90th wealth percentile
(with weight 1) and a 10 random sample of all non-participants with wealth below the 90th wealth percentile
(with weight 10) The variables are defined in the main text
Table 4 The effect of using a tax amnesty on tax avoidance
(1) (2) (3) (4) (5) (6) (7) (8)
Reported wealth
(in logs)
Reported income (in logs)
Taxes paid (in logs)
Founds holding
company (dummy)
Unlisted shares
(in logs)
Housing wealth
(in logs)
Zero capital income
(dummy)
Emigration (dummy)
Post-disclosure (periods 0-2) relative 04562 01761 02218 -00007 -00778 -00989 00084 -00004
to pre-disclosure (period -4 to -2) (00415) (00341) (00317) (00018) (01039) (00542) (00075) (00010)
Observations 5821045 7957037 7772277 8177190 900979 6142434 8177190 8316826
R-squared 08501 07252 07998 00943 08617 07442 06064 01010
Individual fixed effects X X X X X X X X
Wealth x year fixed effects X X X X X X X X
income x year fixed effects X X X X X X X X
Age x year fixed effects X X X X X X X X
Compliance Channels of avoidance
Notes The Table shows the results from event-study regressions where the event is voluntary disclosure of hidden wealth and the outcomes are reported
taxable wealth (col 1) reported taxable income (col 2) claimed tax liability (col 3) a dummy indicating the incorporation of a holding company (col
4) the tax value of unlisted securities (col 5) the tax value of housing (col 6) a dummy indicating zero reported capital income (col 7) and a dummy
indicating emigration (col 8) Outcomes are regressed on individual fixed effects year fixed effects even-time dummies indicating the year relative to
disclosure and non-parametric controls for 2007 wealth (deciles of disclosersrsquo wealth at market value) income (deciles of disclosersrsquo income) and age (6 age
groups) interacted with time The event time categories tminus 4 tminus 3 and tminus 2 (pre-disclosure) are omitted and event time categories t t+ 1 and t+ 2 are
replaced by a single post-disclosure dummy The sample period is 2002ndash2013 Robust standard errors are clustered at the individual level
Figure 1 Taxes evaded as a of taxes owed by wealth group
0
10
20
30
P0-
10
P10
-20
P20
-30
P30
-40
P40
-50
P50
-60
P60
-70
P70
-80
P80
-90
P90
-95
P95
-99
P99
-99
5
P99
5-9
99
P99
9-P
999
5
P99
95-
P99
99
P99
99-
P10
0
o
f tax
es o
wed
Position in the wealth distribution
Taxes evaded of taxes owed (stratified random audits + leaks)
Average 28
Notes This figure combines random audits with micro-samples of households hiding assets abroad and macro estimates of the stock of wealth held in tax
havens to estimate the size of tax evasion across the wealth distribution in 2006 Each dot is equal to the average ratio of taxes evaded to total taxes owed
in the corresponding wealth bin P0-10 denotes the bottom decile of the Scandinavian wealth distribution and P9999-P100 the top 001 (households
with more than $45 million in net wealth in 2006) 95 confidence intervals based on bootstrapped standard errors Source Appendix Table J5
Figure 2 Country distribution of wealth at HSBC vs in all Swiss banks
UAEArgentBelgiu
Brazil
Canada
German
EgyptSpain
UK
GreeceIndia
Israel
Italy
MexicoRussia
Saudi
Turkey
USA
Venezu
DenmarNorway
Sweden
00
20
40
60
81
Shar
e of
HSB
C w
ealth
0 02 04 06 08 1Share of wealth in all Swiss banks
Data source ICIJ and SNBNote In the full sample excluding tax havens (134 countries) a regression of the share of HSBCwealth on the share of Swiss deposits has slope b= 090 (se = 004) and R-square of 075
HSBC wealth vs wealth in all Swiss banks
Notes This figure shows the country distribution of the wealth managed by HSBC Private Bank Switzerland in 2007 and the country distribution of the
foreign wealth managed by all Swiss bank in 2003-2004 (the last years before the introduction of the European Saving Tax Directive which greatly increased
the use of shell corporations by European owners of Swiss accounts see Appendix E2) The black line is the 45 degree line In the full sample excluding
tax havens (134 countries) a regression of the share of HSBC wealth on the share of Swiss deposits has slope b = 090 (se = 004) and R-square of 075
Source Appendix Table E8
Figure 3 Tax evasion at HSBC intensive vs extensive margin
00
02
04
06
08
10
P90-P95 [06 ndash 09]
P95-P99 [09 ndash 20]
P99-P995 [20 ndash 30]
P995-P999 [30 ndash 91]
P999-P9995 [91 ndash 146]
P9995-P9999 [146 ndash 445]
Top 001 [gt 445]
Net wealth group [millions of US$]
Probability to own an unreported HSBC account by wealth group (HSBC leak)
0
10
20
30
40
50
P90-P95 [06 ndash 09]
P95-P99 [09 ndash 20]
P99-P995 [20 ndash 30]
P995-P999 [30 ndash 91]
P999-P9995 [91 ndash 146]
P9995-P9999 [146 ndash 445]
Top 001 [gt 445]
Net wealth group [millions of US$]
Average wealth hidden at HSBC by wealth group (oftotalwealth(includingheldatHSBC))
Notes The top panel shows the fraction of households in Scandinavia (Norway Sweden and Denmark) who had
an unreported bank account at HSBC Switzerland in 2006 by bins of 2006 Scandinavian wealth The sample
includes 520 Scandinavian households who could be matched to a tax return see text The bottom panel shows
the ratio of the wealth held at HSBC over total observable wealth in the sub-sample of 300 matched HSBC
account-holders for whom account values are available Source Appendix Tables E2 and E6
Figure 4 Probability to appear in the Panama Papers by wealth group
00
02
04
06
08
10
12
P90-P95 [06 ndash 08]
P95-P99 [08 ndash 18]
P99-P995 [18 ndash 27]
P995-P999 [27 ndash 81]
P999-P9995 [81 ndash 133]
P9995-P9999 [133 ndash 414]
Top 001 [gt 414]
Net wealth group [millions of US$]
Notes This figure shows the fraction of households in Norway and Sweden who are identified in the Panama Papers as beneficial owners of shell companies
created by the Panamanian law firm Mossack Fonseca by bins of 2006 wealth The wealth bins are defined relative to the pooled Norwegian plus Swedish
population Source Appendix Table F1
Figure 5 Probability to use a tax amnesty by wealth group
0
2
4
6
8
10
12
14
P90-P95 [06 ndash 08]
P95-P99 [08 ndash 18]
P99-P995 [18 ndash 27]
P995-P999 [27 ndash 81]
P999-P9995 [81 ndash 133]
P9995-P9999 [133 ndash 414]
Top 001 [gt 414]
Net wealth group [millions of US$]
Notes This figure shows the fraction of households in Norway and Sweden who voluntarily declared previously hidden wealth in a context of a tax amnesty
over the period 2007 to 2015 by bins of 2006 wealth The wealth bins are defined relative to the pooled Norwegian plus Swedish population Source
Appendix Table G2
Figure 6 The distribution of offshore wealth and offshore tax evasion
0
10
20
30
40
50
60
P0-50 P50-P90 P90-P99 P99-P999 P999-9999 P9999-P100
o
f tot
al (r
ecor
ded
or h
idde
n) w
ealth
Position in the wealth distribution
Distribution of wealth recorded vs hidden
Hidden wealth disclosed in amnesty
Hidden wealth held at HSBC
Recorded wealth
0
10
20
30
40
50
P90
-95
P95
-99
P99
-99
5
P99
5-9
99
P99
9-P
999
5
P99
95-
P99
99
P99
99-
P10
0
o
f tot
al ta
xes
owed
that
are
not
pai
d
Position in the wealth distribution
Offshore tax evasion by wealth group
Lower-bound scenario
High scenario
Notes The top panel shows the distribution of wealth in Scandinavia (Norway Sweden Denmark) excluding
offshore wealth and the distribution of wealth held at HSBC and disclosed by amnesty participants The bottom
panel distributes the macro stock of offshore across wealth groups and computes the implied amount of taxes
evaded See text for a description of the benchmark higher and lower-bound scenarios 95 confidence intervals
based on bootstrapped standard errors Source Appendix Tables A2 J1 J3 J3b and J3c
Figure 7 Tax evasion detected in random audits
0
10
20
30
40 P
0-10
P10
-20
P20
-30
P30
-40
P40
-50
P50
-60
P60
-70
P70
-80
P80
-90
P90
-95
P95
-99
P99
-99
5
P99
5-1
00
Position in the wealth distribution
Fraction of households evading taxes by wealth group (stratified random audits)
0
5
10
15
20
25
30
P0-
10
P10
-20
P20
-30
P30
-40
P40
-50
P50
-60
P60
-70
P70
-80
P80
-90
P90
-95
P95
-99
P99
-99
5
P99
5-1
00
o
f tot
al in
com
e (r
epor
ted
+ ev
aded
)
Position in the wealth distribution
Fraction of income undeclared conditional on evading (stratified random audits)
Notes The top panel shows the probability to be found evading taxes in SKATrsquos random audits by wealth
groups Tax evasion includes all mistakes found by the examiner whether deemed deliberate or involuntary
The bottom panel shows the ratio of income undeclared to true income conditional on evading taxes Source
Appendix H3
Figure 8 Total tax evasion and its effect on effective tax rates
0
5
10
15
20
25
30
P0-
10
P10
-20
P20
-30
P30
-40
P40
-50
P50
-60
P60
-70
P70
-80
P80
-90
P90
-95
P95
-99
P99
-99
5
P99
5-9
99
P99
9-P
999
5
P99
95-
P99
99
P99
99-
P10
0
o
f tax
es o
wed
that
are
not
pai
d
Position in the wealth distribution
Taxes evaded of taxes owed
Offshore evasion (leaks and tax amnesties)
Tax evasion other than offshore (random audits)
25
30
35
40
45
50
P0-
10
P10
-20
P20
-30
P30
-40
P40
-50
P50
-60
P60
-70
P70
-80
P80
-90
P90
-95
P95
-99
P99
-99
5
P
995
-99
9
P
999
-P99
95
P
999
5-P
999
9
P
999
9-P
100
o
f tax
able
inco
me
Position in the wealth distribution
Taxes paid vs taxes owed
Taxes paid
Taxes owed
Notes The top panel shows the fraction of taxes owed which are evaded as detected in SKATrsquos random audits
The last dot shows the average for P995ndash100 (as due to insufficient sample sizes we cannot estimate how detected
tax evasion varies within the top 05) For comparison we report our benchmark estimate of taxes evaded
offshore from Figure 6 The bottom panel shows average tax rates across the wealth distribution including
vs excluding evaded taxes and income Taxes include individual income taxes wealth taxes (in Norway and
Sweden) and payroll taxes at all levels of governments Source Appendix Tables H4 and J6
Figure 9 The impact of using a tax amnesty
Panel A Impact on reported wealth
-20
24
6le
vel r
elat
ive
to e
vent
yea
r
-6 -4 -2 0 2 4event time
Panel B Impact on reported income
-10
12
3le
vel r
elat
ive
to e
vent
yea
r
-6 -4 -2 0 2 4event time
Notes Panel A shows the results from an event-study regression where the event is voluntary disclosure of hidden wealth and
the outcome is taxable wealth as claimed by the tax payer before any corrections are made by the tax authorities The outcome
is regressed on individual fixed effects year fixed effects even-time dummies indicating the year relative to disclosure and non-
parametric controls for 2007 wealth (deciles of disclosersrsquo wealth at market value) income (deciles of disclosersrsquo income) and age
(6 age groups) interacted with time The omitted time category is t minus 2 (two years before disclosure) because evaders disclosing
offshore wealth in the beginning of year t can incorporate the disclosed wealth into their tax return for year tminus 1 hence the effect
of the amnesty shows up as soon as tminus 1 on the graphs The sample period is 2002-2013 Robust standard errors are clustered at
the individual-level Panels B shows results from an analogous regression where the outcome is claimed income (including capital
gains) Source Authorsrsquo computations
Figure 10 The impact of using a tax amnesty on taxes paid
-10
12
34
leve
l rel
ativ
e to
eve
nt y
ear
-6 -4 -2 0 2 4event time
Notes The figure shows the results from an event-study regression where the event is voluntary disclosure of hidden wealth and the outcome is total tax
liabilities (ie income and wealth taxes at all levels of government) as claimed by the taxpayer before any corrections are made by the tax authorities
The outcome is regressed on individual fixed effects year fixed effects even-time dummies indicating the year relative to disclosure and non-parametric
controls for 2007 wealth (deciles of disclosersrsquo wealth at market value) income (deciles of disclosersrsquo income) and age (6 age groups) interacted with time
The omitted time category is t minus 2 (two years before disclosure) because evaders disclosing offshore wealth in the beginning of year t can incorporate the
disclosed wealth into their tax return for year tminus 1 hence the effect of the amnesty shows up as soon as tminus 1 on the graph The sample period is 2002-2013
Robust standard errors are clustered at the individual-level Source Authorsrsquo computations
Figure 11 Top wealth share in Norway including hidden wealth
0
2
4
6
8
10
12
14
1930 1940 1950 1960 1970 1980 1990 2000 2010
Top 01 wealth share in Norway
Excluding hidden wealth
Including hidden wealth
0
1
2
3
4
5
1930 1940 1950 1960 1970 1980 1990 2000 2010
Top 001 wealth share in Norway
Excluding hidden wealth
Including hidden wealth
Notes This graph compares the top 01 wealth share (top panel) and top 001 wealth share (bottom panel)
as estimated from administrative data vs corrected by including offshore wealth In both cases top shares are
expressed as a percentage of total household wealth For series excluding hidden wealth total household wealth
is the total recorded in the national accounts For corrected series total household wealth is the total recorded
in the national accounts plus the estimated total offshore wealth of Norwegians Source Appendix Table B2
and B4
Figure 12 The top 001 wealth share and its composition (2000-2009)
0
2
4
6
8
10
12
Spain UK Scandinavia France USA Russia
o
f tot
al h
ouse
hold
wea
lth
The top 001 wealth share and its composition
Offshore wealth
All wealth excluding offshore
Notes This figure plots the level of the top 001 wealth share in six economies on average over the 2000ndash2009 period To ensure comparability all top
shares are estimated following the same methodology We first distribute the total amount of household wealth recorded in the national accounts following
the methodology in Saez and Zucman (2016) and Alvaredo et al (2017) (blue portion) We then add unreported offshore assets (red portion) in both the
numerator (fraction of offshore wealth belonging to the top 001) and the denominator (total offshore wealth) Wealth is equally split among married
couples Scandinavia is the arithmetic average of Norway Sweden and Denmark Estimates for Scandinavia are from this paper estimates for other
countries are constructed in Alstadsaeligter Johannesen and Zucman (2017) Source Alstadsaeligter Johannesen and Zucman (2017)
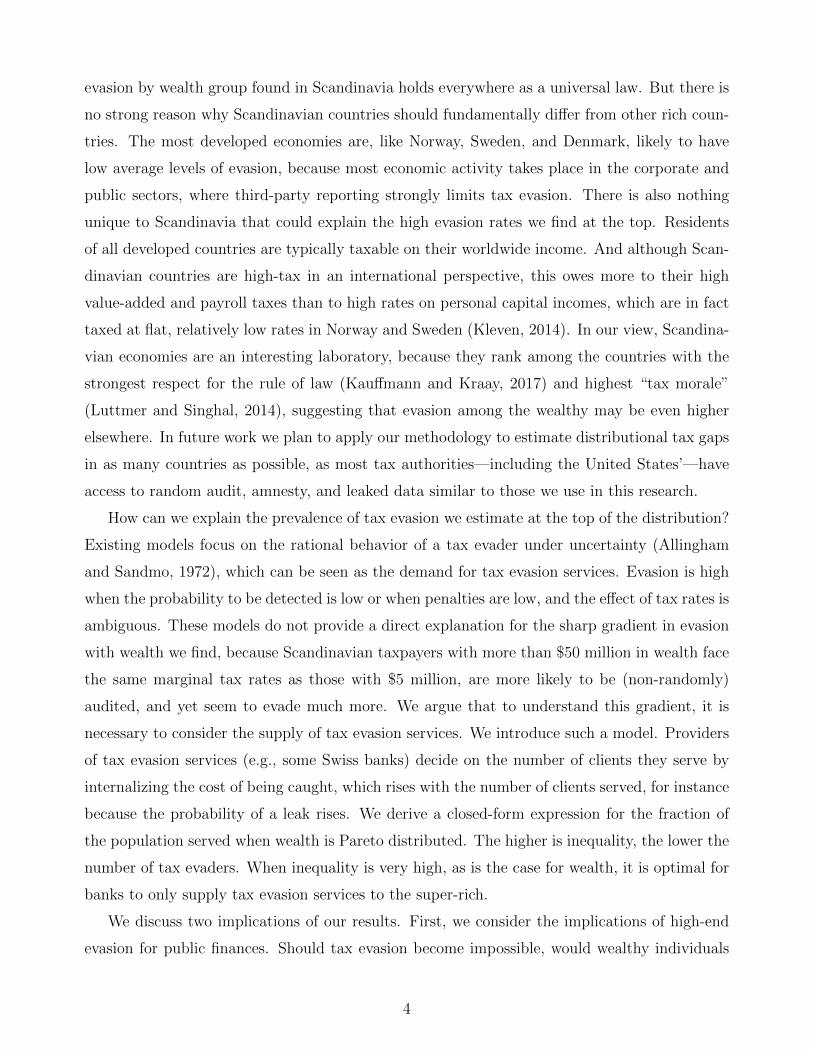
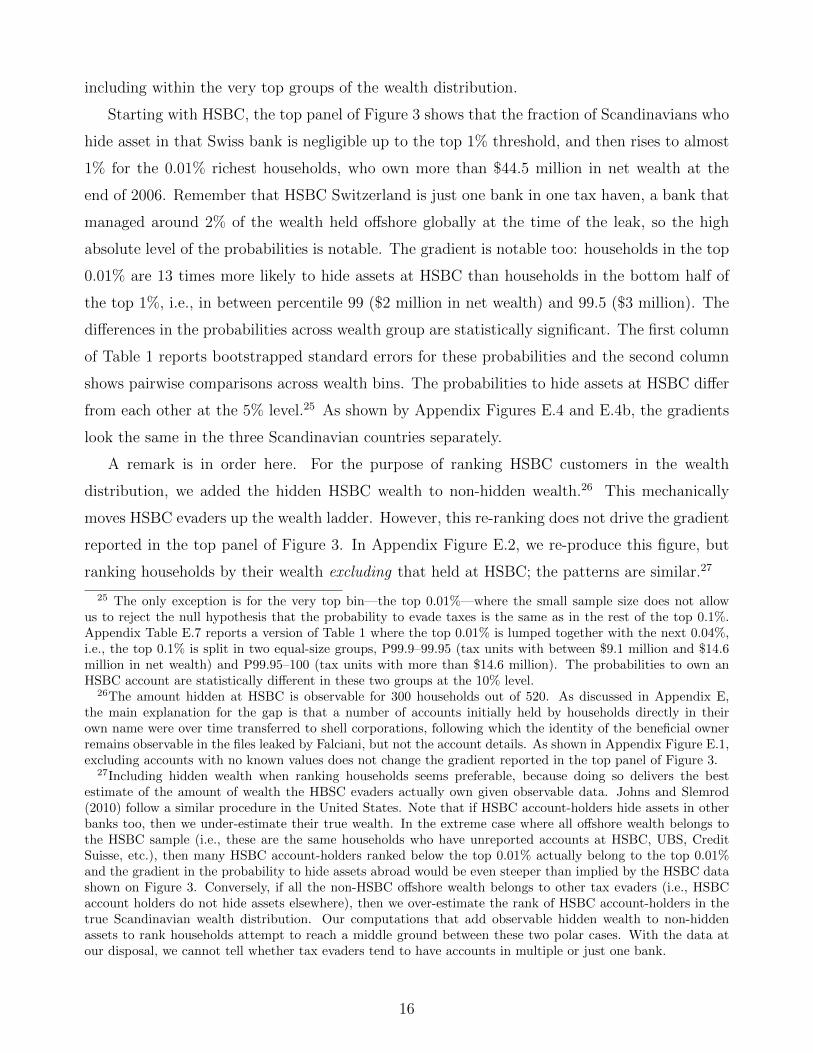
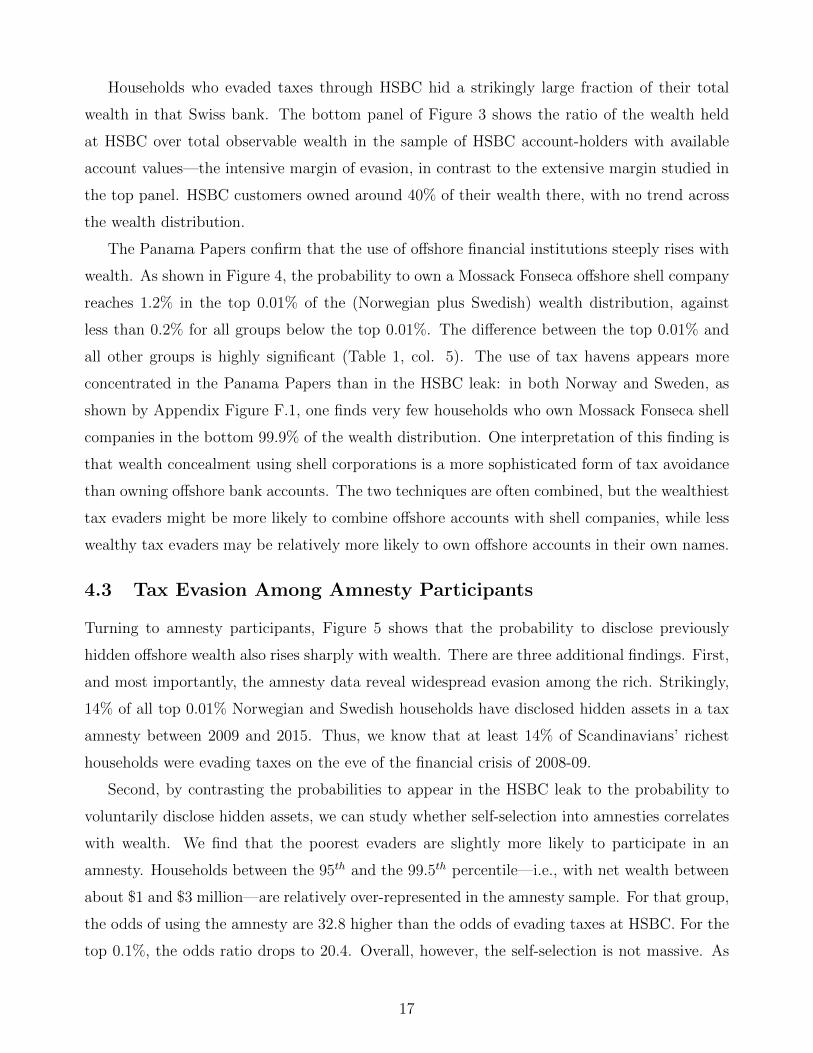
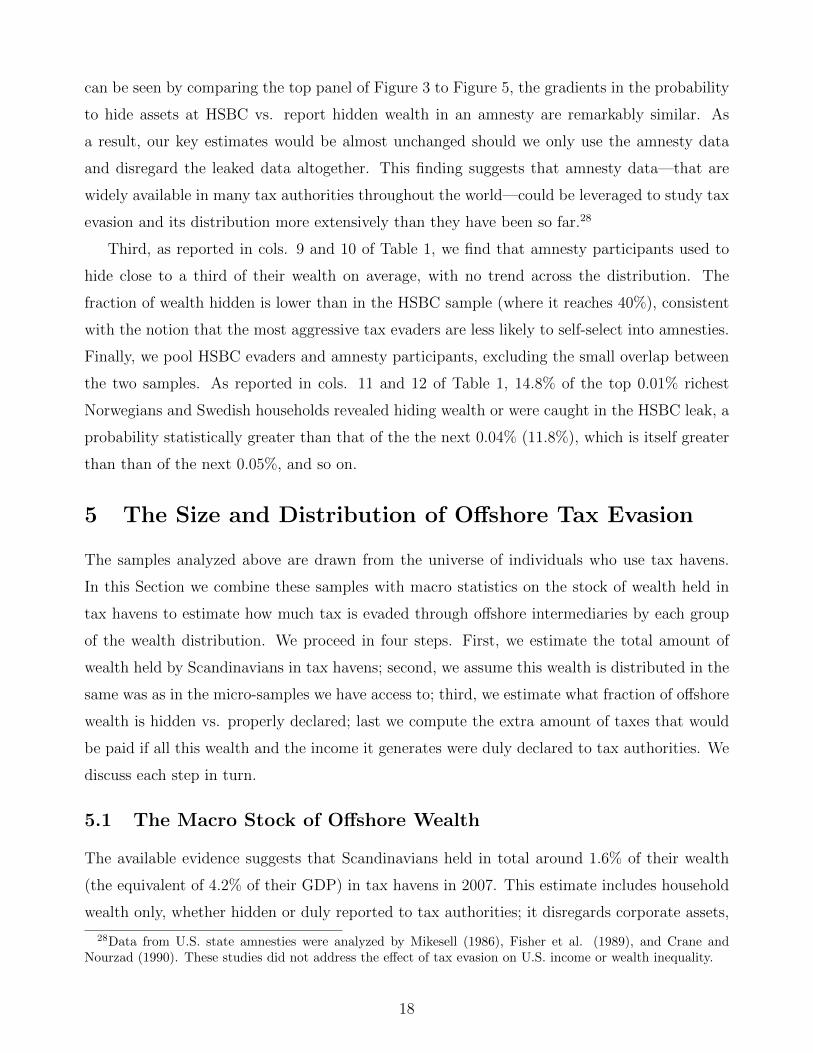
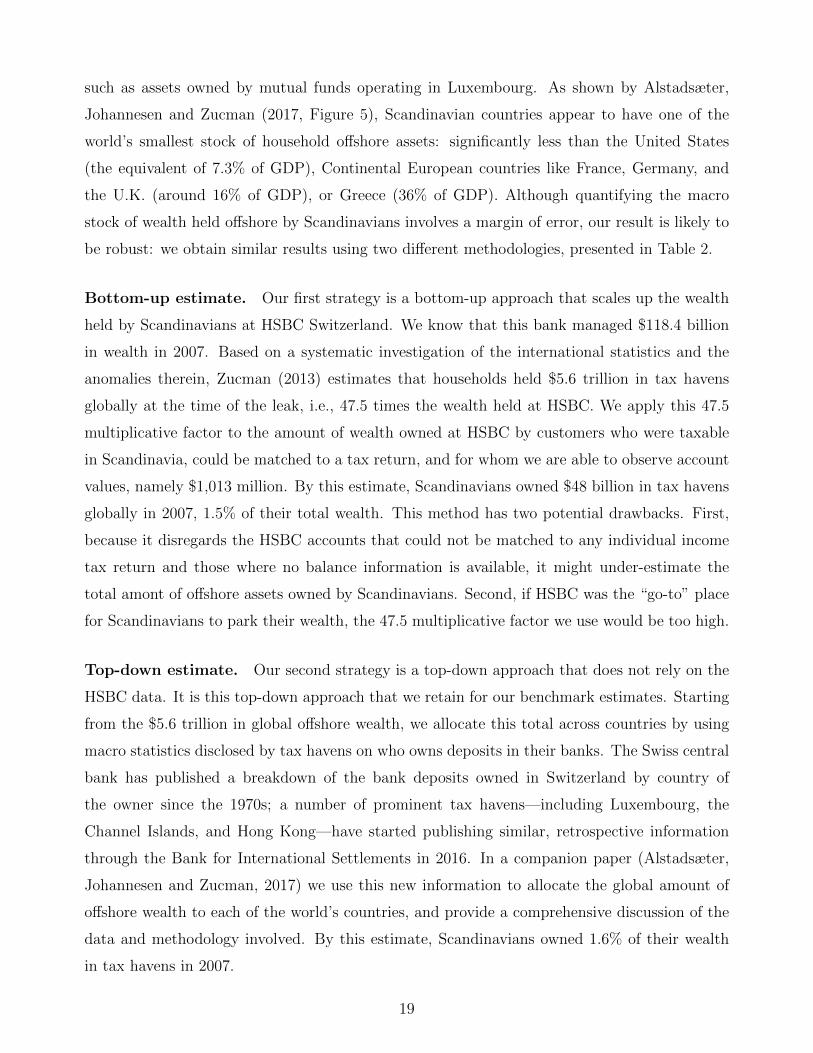
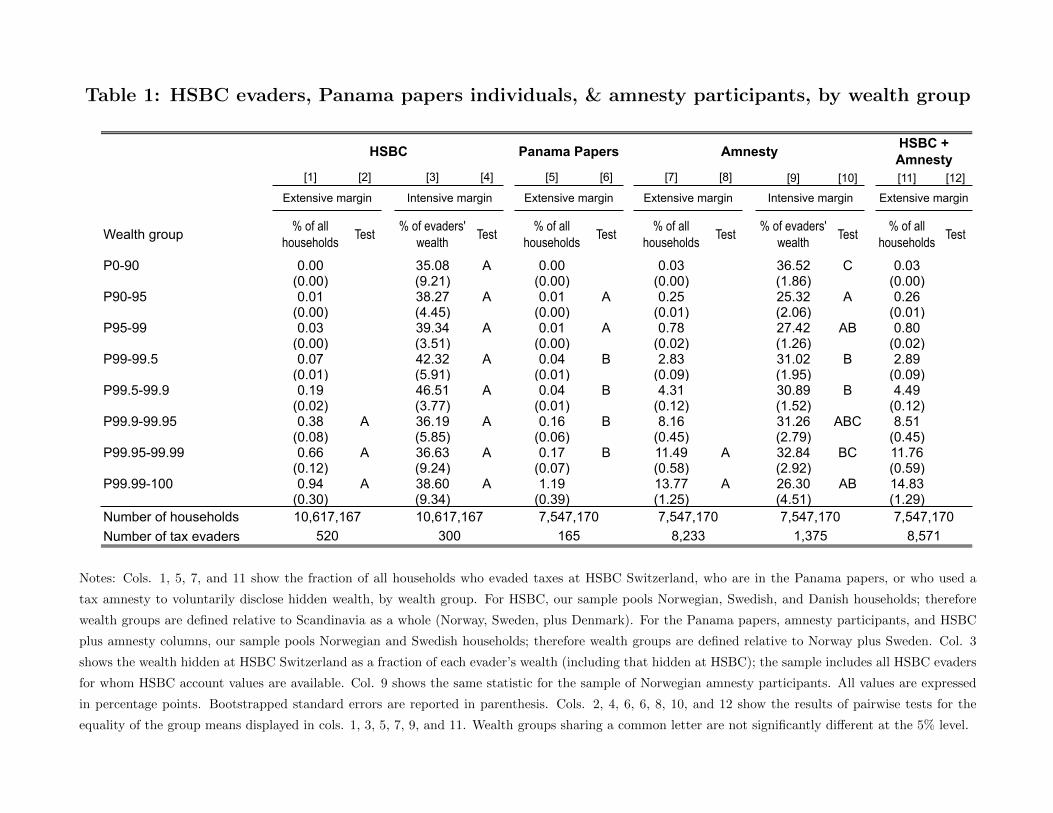
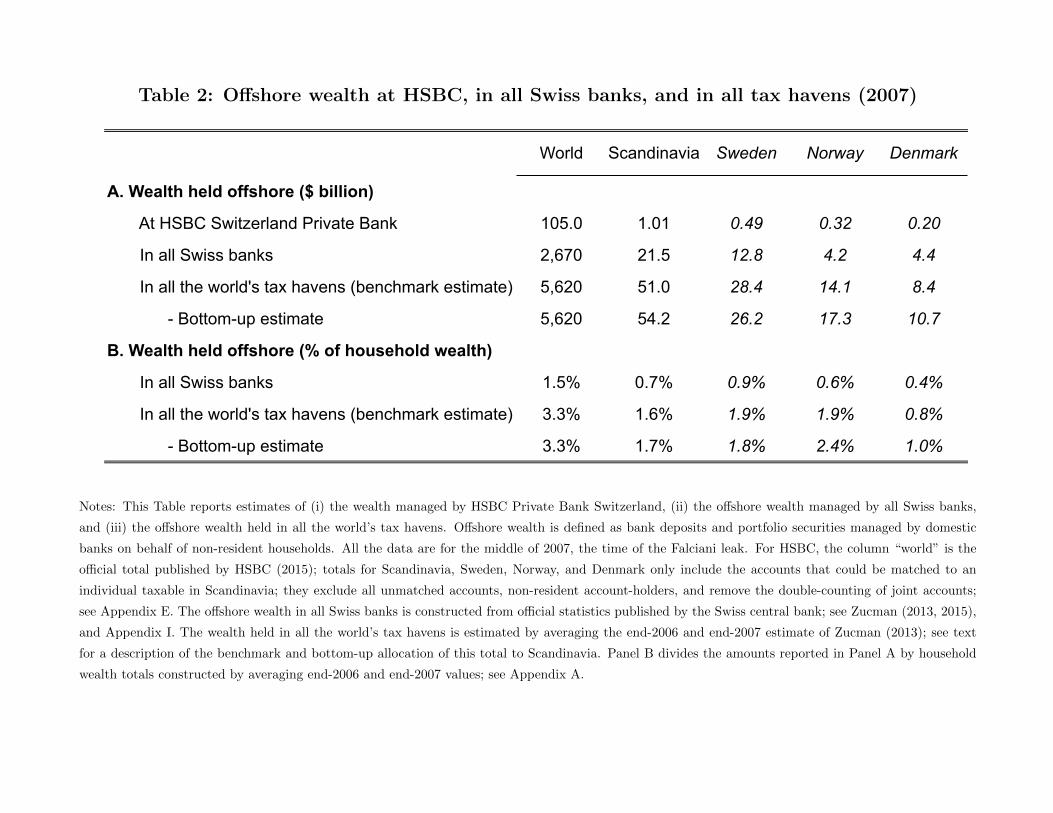
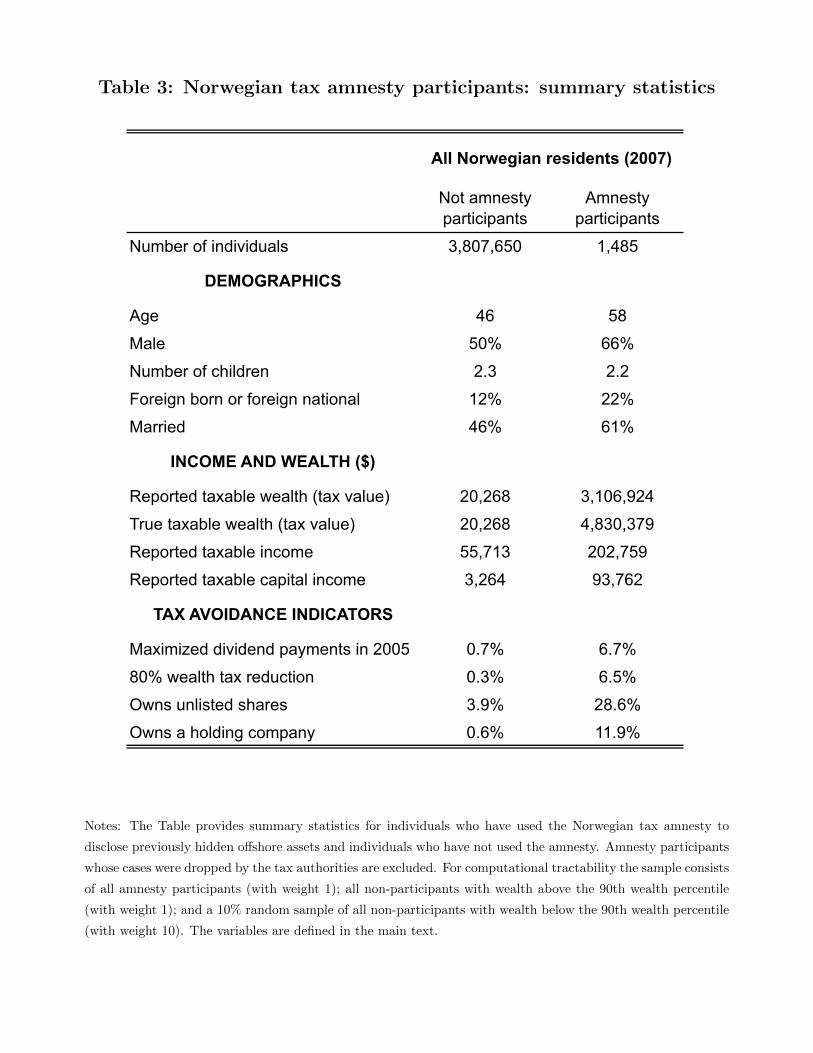
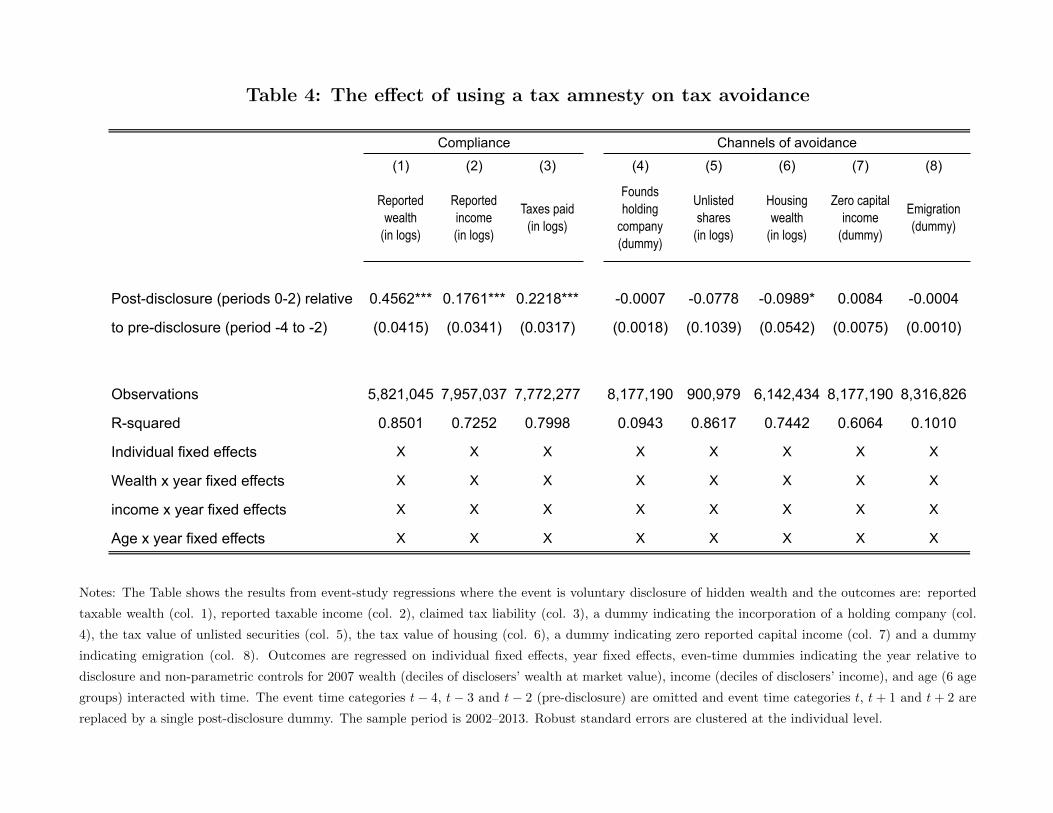
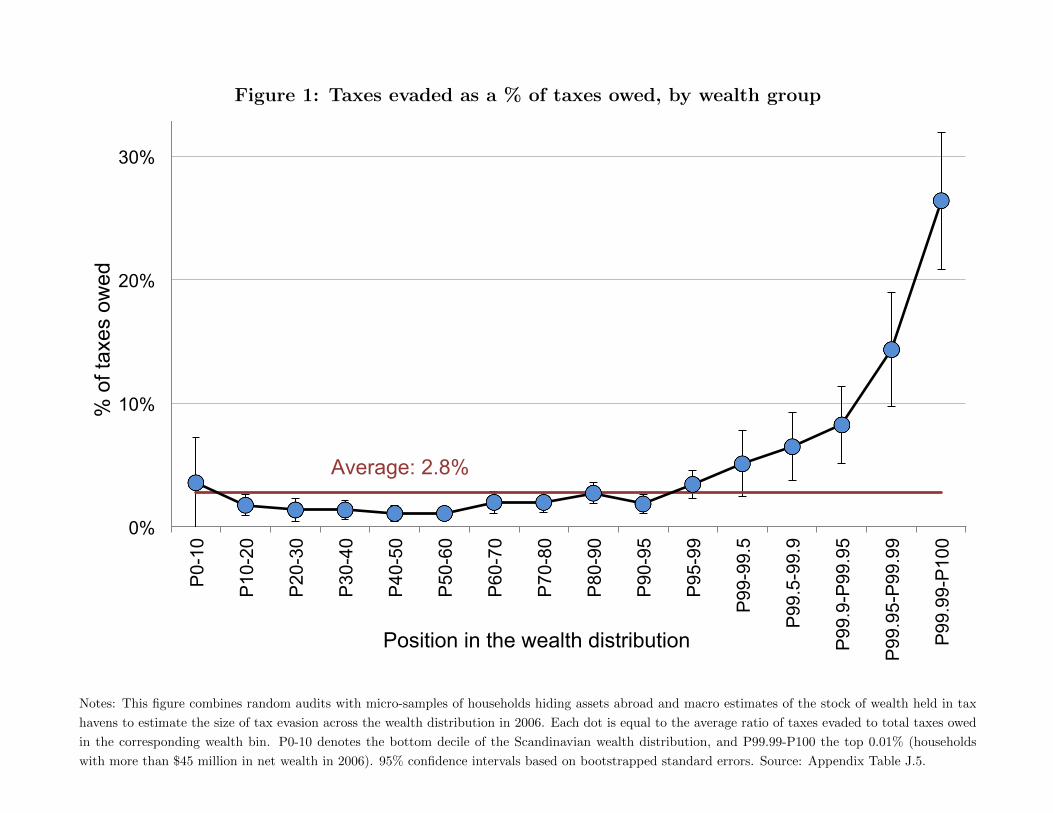
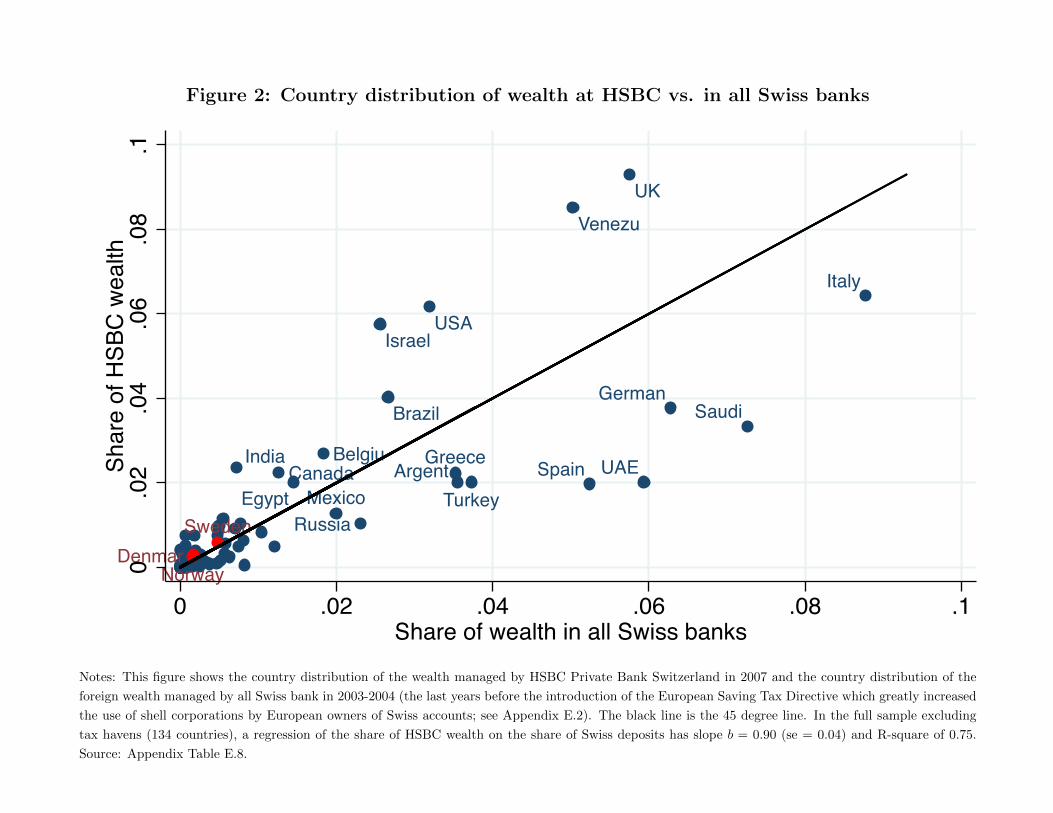
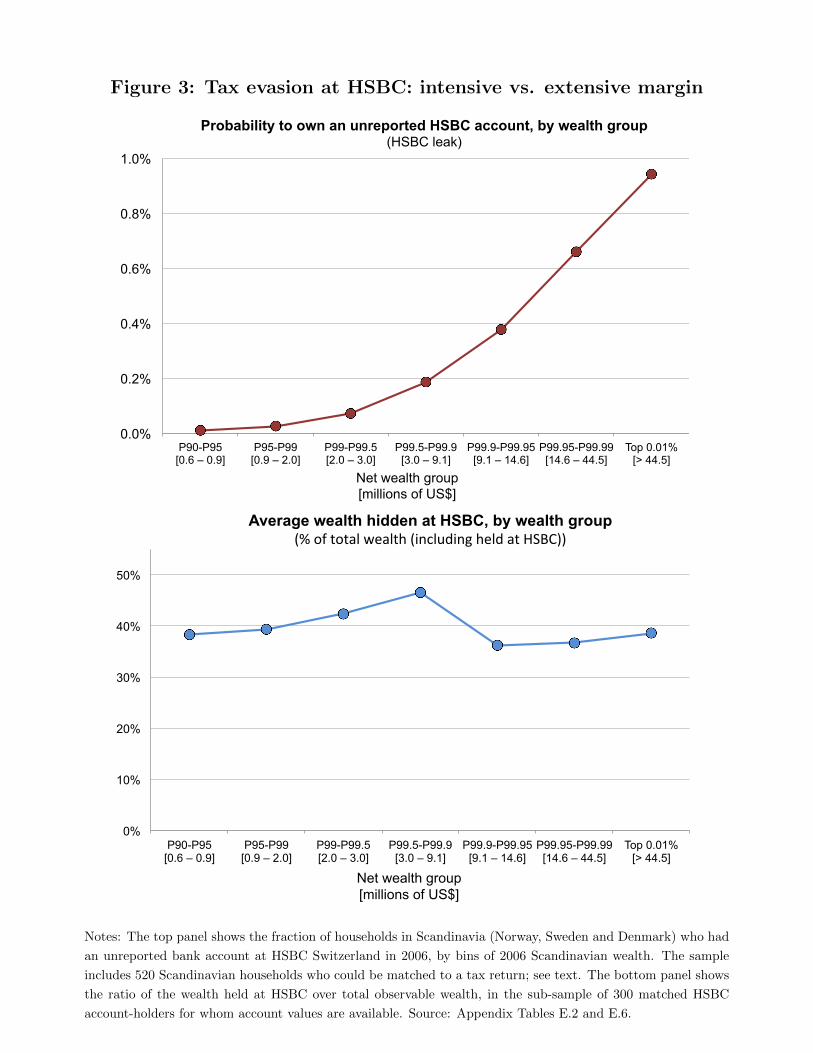
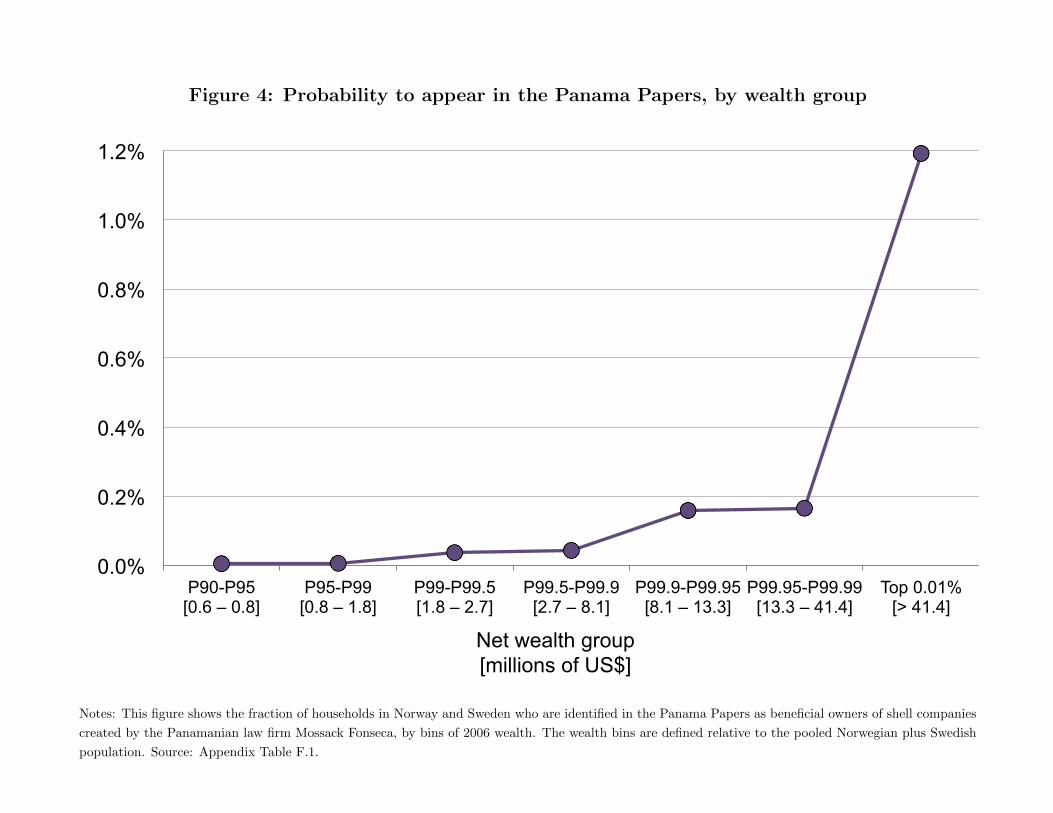
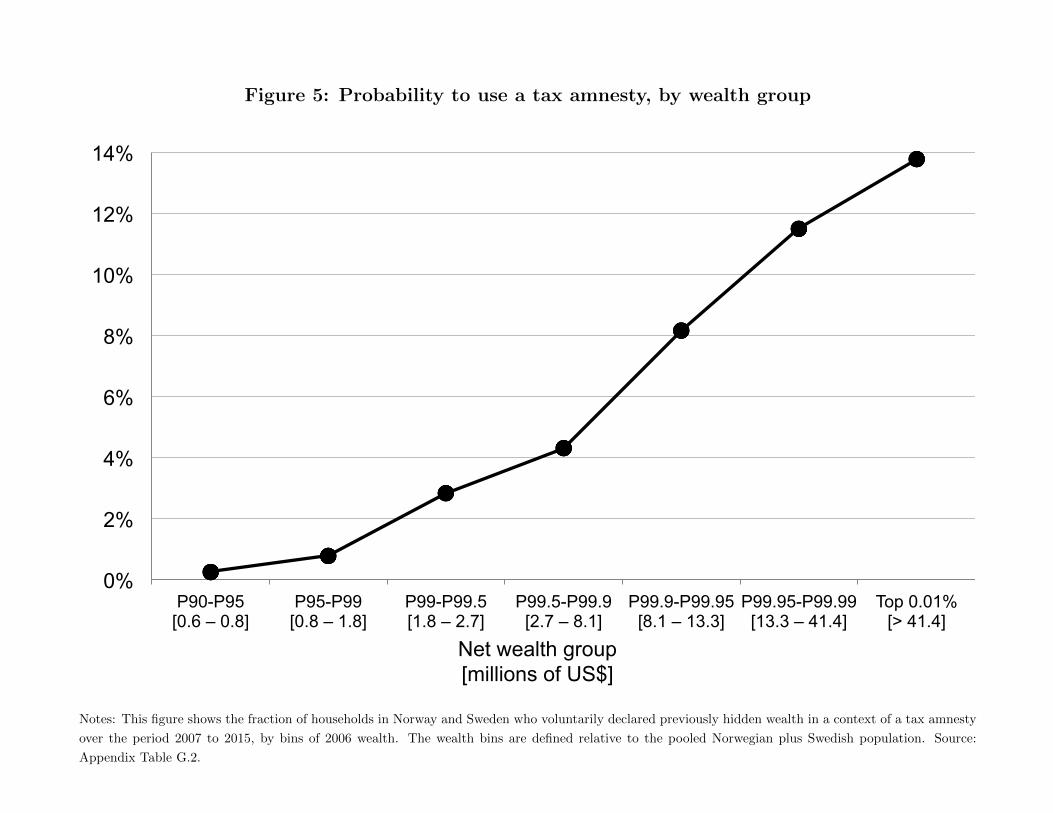
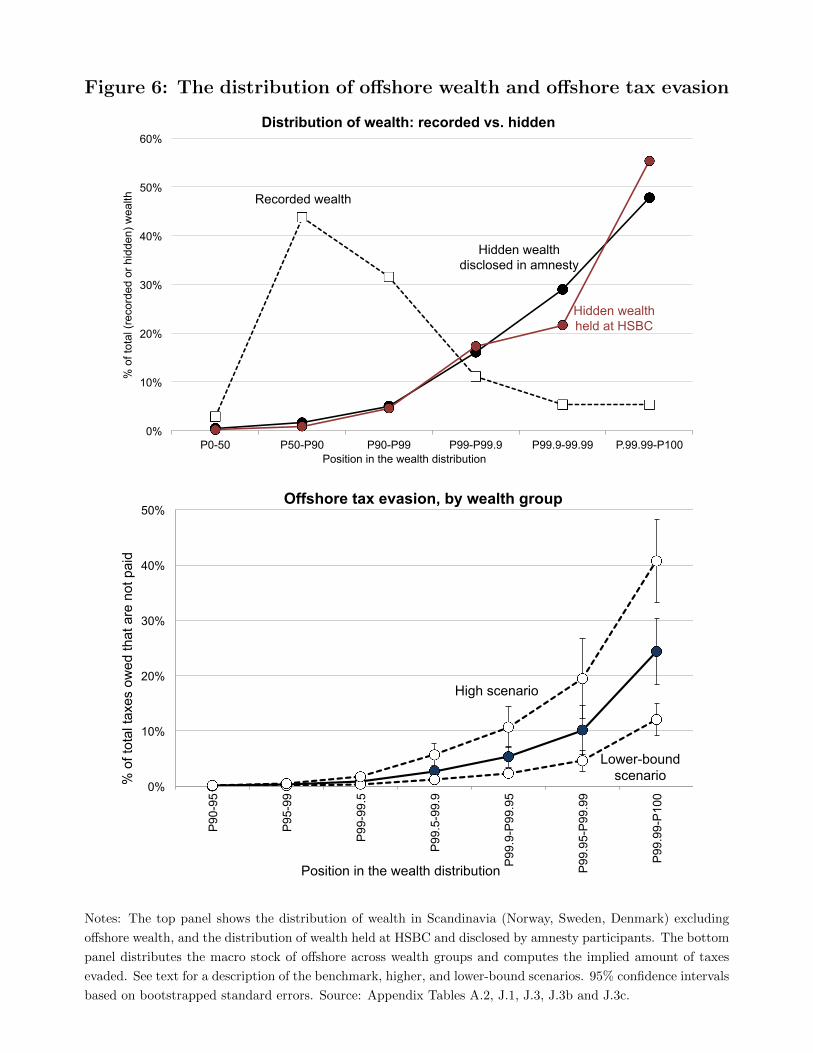
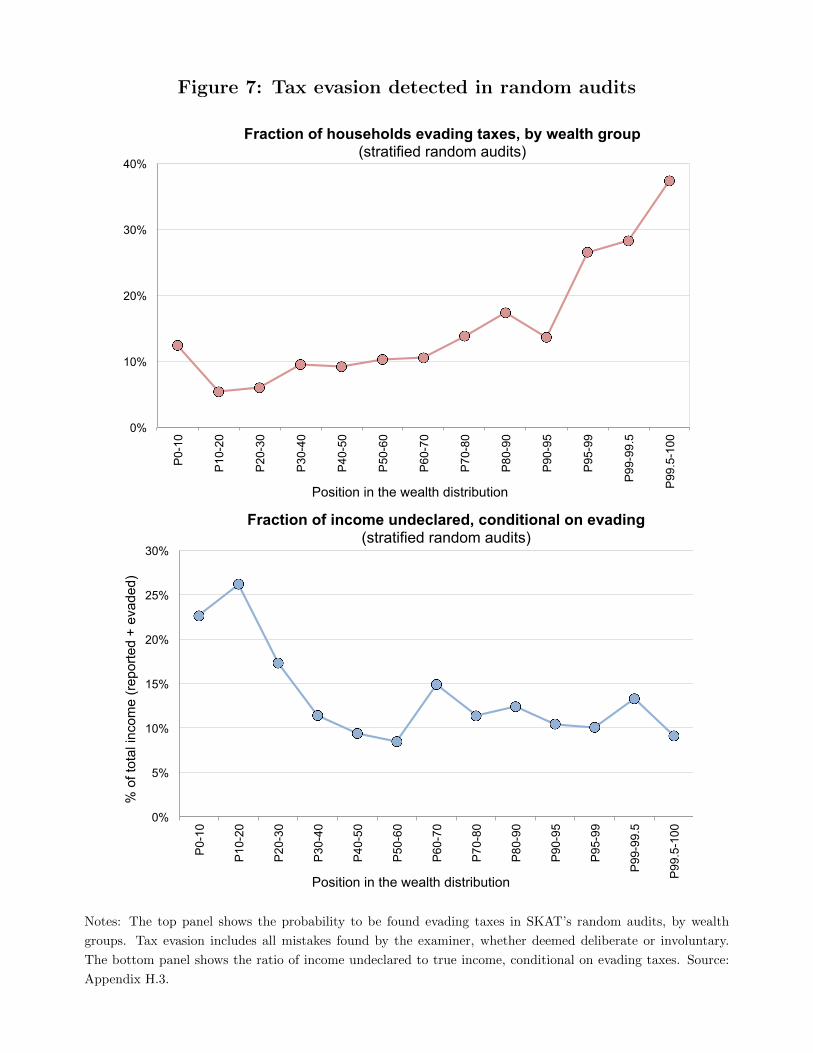
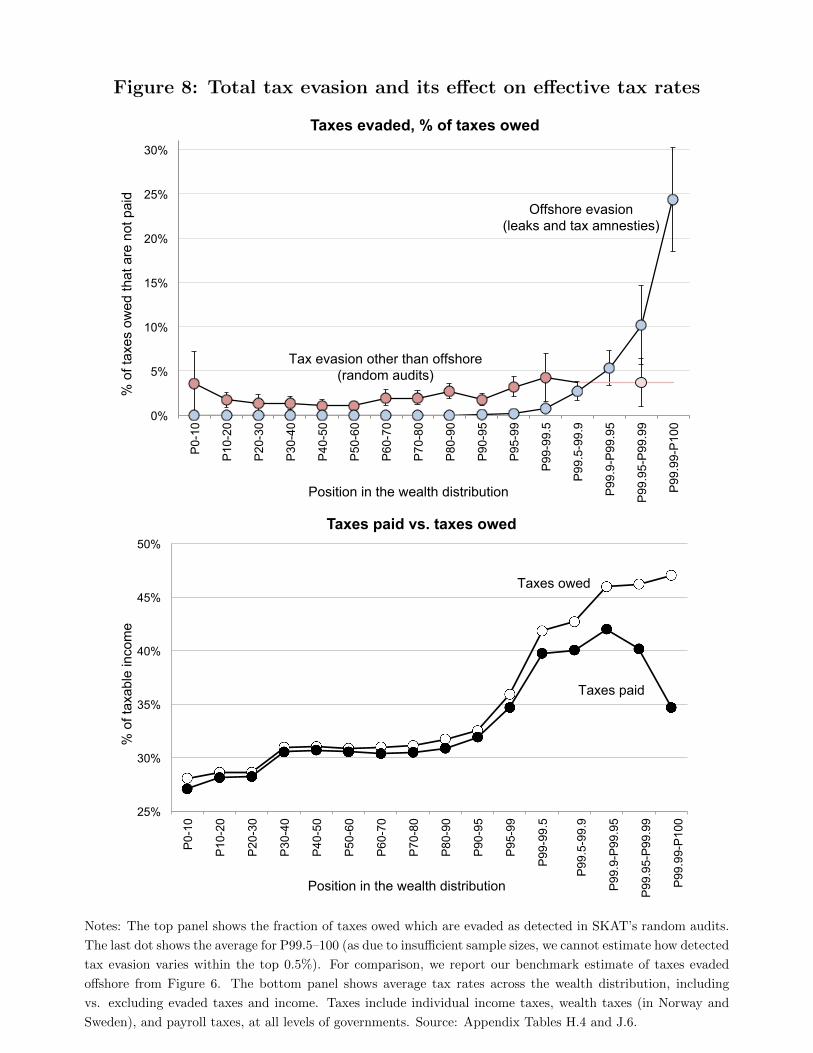
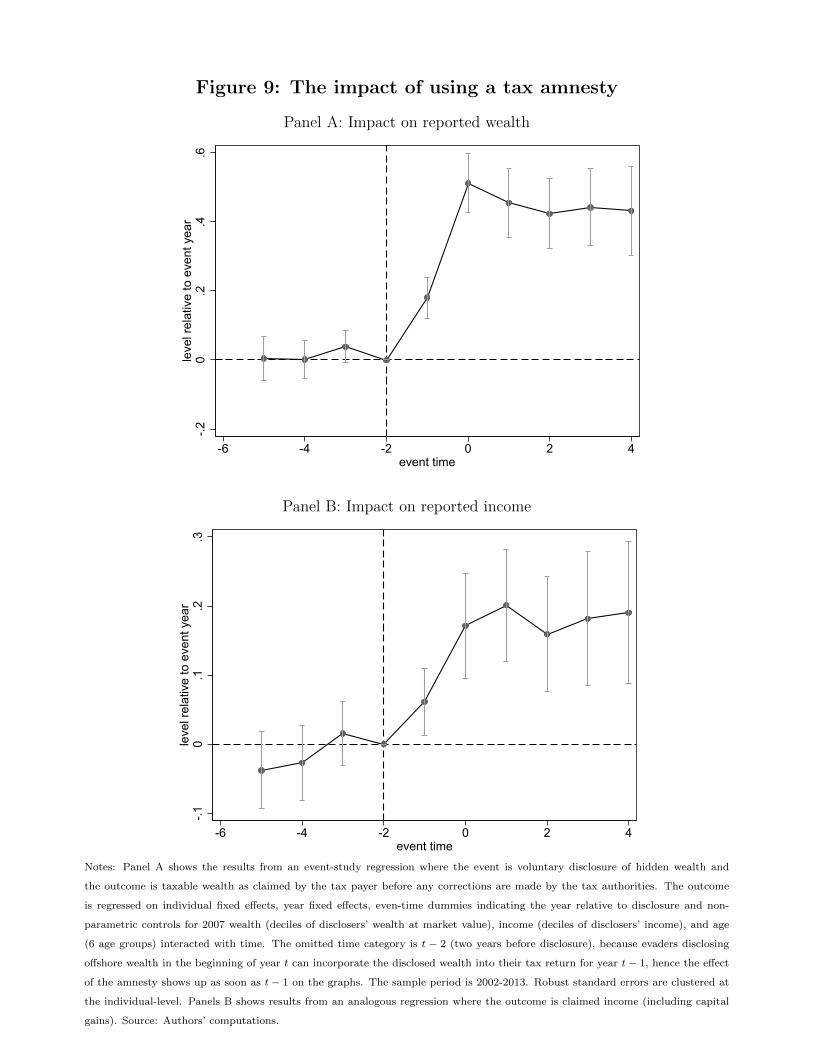
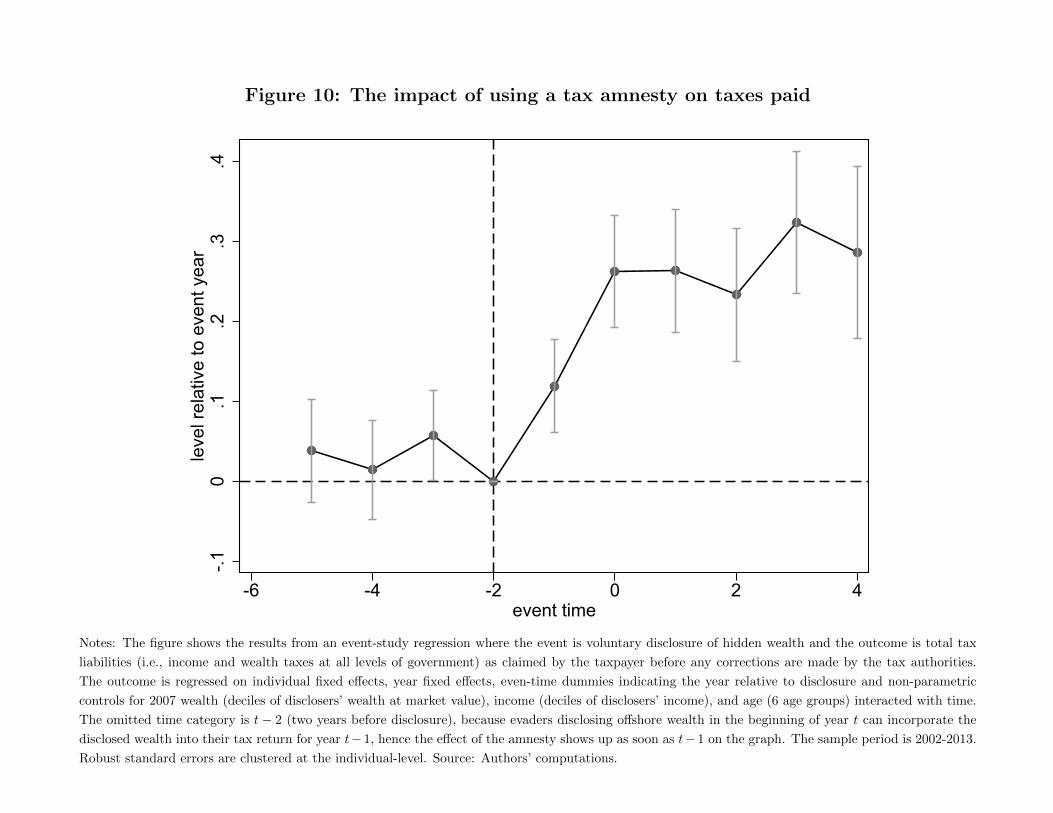
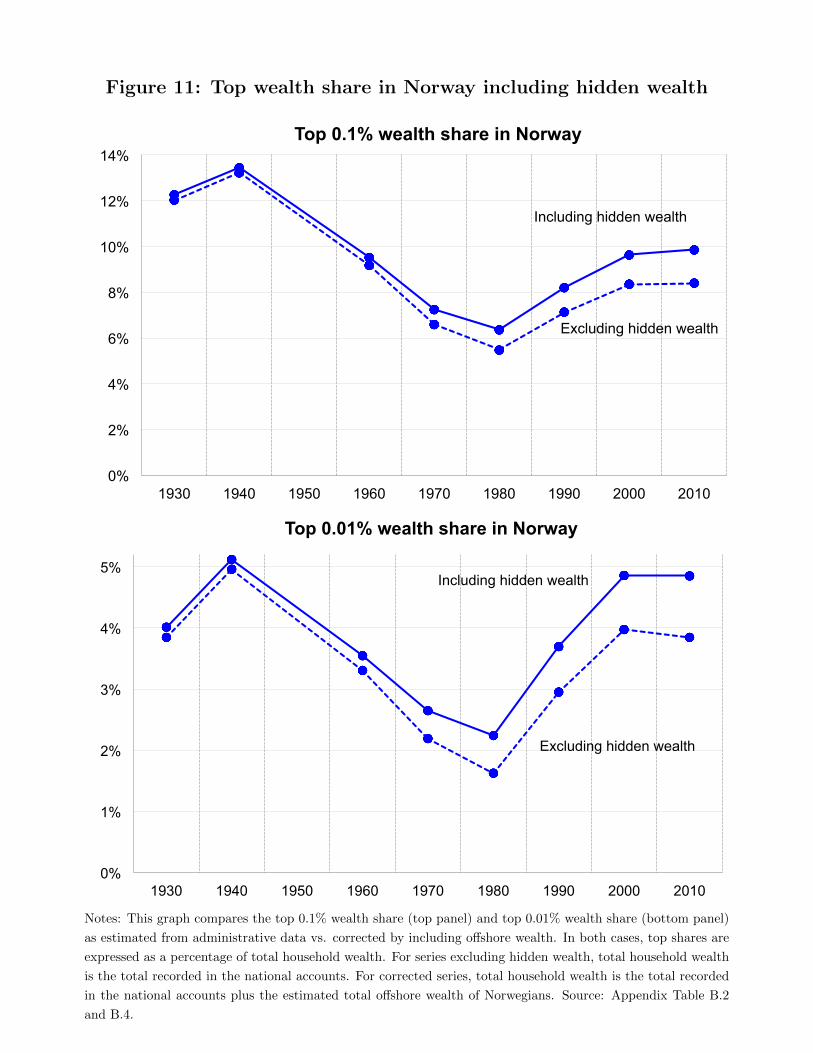
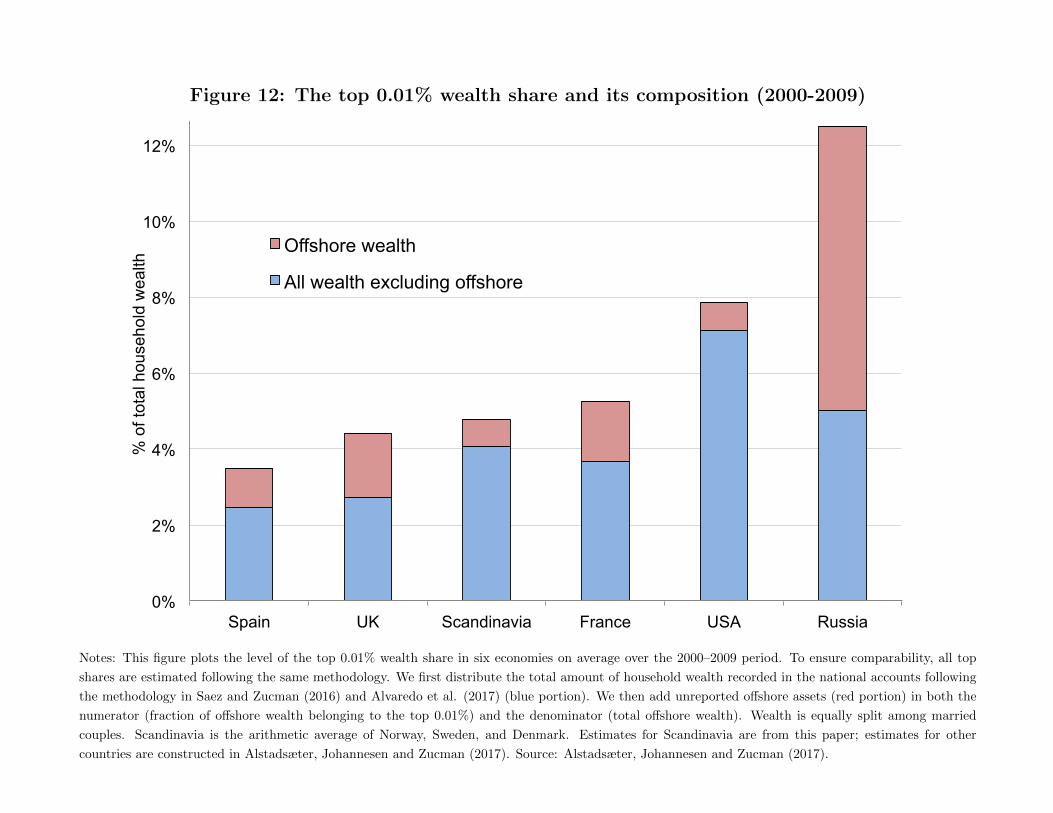