Embed Size (px)
Citation preview

Hope CollegeDigital Commons @ Hope College
Faculty Publications
8-1-2010
Targeting the ICB2 Site of the Topoisomerase IIAlpha Promoter with a Formamido-pyrrole-imidazole-pyrrole H-pin PolyamideAndrew FranksHope College
Christopher TronrudHope College
Konstantinos KiakosUCL Cancer Institute
Jerome KluzaUCL Cancer Institute
Manoj MundeGeorgia State University
See next page for additional authors
Follow this and additional works at: http://digitalcommons.hope.edu/faculty_publicationsPart of the Chemistry Commons
This Article is brought to you for free and open access by Digital Commons @ Hope College. It has been accepted for inclusion in Faculty Publicationsby an authorized administrator of Digital Commons @ Hope College. For more information, please contact [email protected].
Recommended CitationPublished in: Bioorganic and Medicinal Chemistry, Volume 18, Issue 15, August 1, 2010, pages 5553-5561. Copyright © 2010Pergamon-Elsevier Science LTD, Oxford. The final published version is available at: http://dx.doi.org/10.1016/j.bmc.2010.06.041

AuthorsAndrew Franks, Christopher Tronrud, Konstantinos Kiakos, Jerome Kluza, Manoj Munde, Toni Brown,Hilary Mackay, W. David Wilson, Daniel Hochhauser, John A. Hartley, and Moses Lee
This article is available at Digital Commons @ Hope College: http://digitalcommons.hope.edu/faculty_publications/7

Targeting the ICB2 Site of the Topoisomerase IIα Promoter with a Formamido-Pyrrole-Imidazole-Pyrrole H-Pin Polyamide
Andrew Franks,a Christopher Tronrud,a Konstantinos Kiakos,b Jerome Kluza,b Manoj Mundec
Toni Brown,a Hilary Mackay,a W. David Wilson,c Daniel Hochhauser,b John A. Hartley,b Moses
Lee a,*
aDivision of Natural and Applied Sciences and Department of Chemistry, Hope College,
Holland, MI, 49423, USA bCancer Research UK Drug-DNA Interactions Research Group, UCL Cancer Institute, Paul
O’Gorman Building, 72 Huntley Street, London, WC1E 6BT, UK cDepartment of Chemistry, Georgia State University, Atlanta GA 30302, USA
*Tel.: +1 616 395 7190; fax: +1 616 395 7923; e-mail: [email protected]

2
Abstract
The synthesis, DNA binding characteristics and biological activity of an N-formamido
pyrrole- and imidazole-containing H-pin polyamide (f-PIP H-pin, 2) designed to selectively
target the ICB2 site on the topoIIα promoter, is reported herein. Thermal denaturation, circular
dichroism, isothermal titration calorimetry, surface plasmon resonance and DNase I footprinting
studies demonstrated that 2 maintained the selectivity of the unlinked parent monomer f-PIP (1)
and with a slight enhancement in binding affinity (Keq = 5 × 10⁵ M-1) to the cognate site (5`-
TACGAT-3`). H-pin 2 also exhibited comparable ability to inhibit NF-Y binding to 1, as
demonstrated by gel shift studies. However, in stark contrast to monomer 1, the H-pin did not
affect the up-regulation of topoisomerase IIα (topoIIα) in cells (western blot), suggesting that the
H-pin does not enter the nucleus. This study is the first to the authors’ knowledge that reports
such a markedly different cellular response between two compounds of almost identical binding
characteristics.
Keywords: polyamides, DNA, topoisomerase II, sequence specificity, minor groove binders, NF-
Y, gene expression.

3
1. Introduction
DNA-binding polyamides have shown promise as agents for altering gene expression in
living cells, including their use in cancer research and potential application in cancer treatment.1
Polyamide analogues of the naturally-occurring Distamycin A, bind selectively in the minor
groove to specific DNA sequences in a 2:1 anti-parallel stacked dimer motif, in which the two
oligopeptides are aligned in a staggered manner.2
Among the polyamides previously synthesized by the authors, f-PIP [formamido (f)-
pyrrole (P)-imidazole (I)-pyrrole (P), 1, Figure 1A] has been shown to elicit a targeted biological
response.3 Polyamide 1 was designed to target the sequence 5′-TACGAT-3′ (TACGAT) found
on the 5′-flank of the inverted CCAAT box-2 (ICB2) in the promoter region of the
topoisomerase IIα (topoIIα) gene (Figure 1B). In confluent cancer cells, nuclear factor-Y (NF-Y)
binds to this sequence causing down-regulation of topoIIα.4,5 This results in the reduced efficacy
of anti-cancer therapeutic agents designed to exploit the increased activity of this enzyme.6
Previous studies in confluent cancer cells demonstrated that compounds which inhibit NF-Y
binding to ICB2, are capable of up-regulating topoIIα and sensitizing such cells to the effects of
the topoIIα poison, etoposide.6-8 However, these compounds were found to target additional
sites, and this lack of specificity limited further development. Polyamide 1 was thus designed to
selectively bind to the 5′-flank of ICB2. Biophysical and in vitro biological testing confirmed
that polyamide 1 bound to its target site and subsequently increasing expression of topoIIα in
confluent cancer cells.3 However, the binding affinity of 1, as determined by surface plasmon
resonance (SPR)9 was reduced as compared to the parent distamycin (Keq = 105 vs. 107 M-1,
respectively), leaving scope for development.
In an attempt to improve the binding affinity of f-PIP (1), yet retain its selectivity,
compound 2 (Figure 1A) was designed, and its synthesis and evaluation are reported herein. The
rationale for the design of 2 is that by tethering the two f-PIP monomers together in an ‘H-pin’
motif, the entropy cost of arranging two un-tethered polyamides within the minor groove is
minimized.10-12 Recent studies from our laboratories demonstrated that H-pin 3, in which two f-
IPI monomers were tethered by an ethylene glycol (EG) moiety, provided an effective molecular
design. The favorable solubility of H-pin 3 in aqueous buffer was retained with reference to the
non-tethered parent monomer f-IPI (4, figure 1A), as was sequence selectivity. Additionally, the
binding affinity of 3 was dramatically improved (Keq = 2 × 10¹⁰ vs. 1.9 × 10⁸ M-1).9,10 Thus the

4
H-pin design offers a strategy for designing new sequence specific polyamides with potential use
in controlling gene expression. Accordingly, the f-PIP monomers of H-pin 2 were linked by an
EG tether; with the difference that the monomers were joined through the N-terminal P units
rather than in the central I position for synthetic reasons. Upon synthesis of f-PIP H-pin 2, the
aim of the current report was to ascertain its binding affinity to the cognate sequence located at
the 5’-flank of the ICB2 site (TACGAT), and to determine if 2 was able to inhibit NF-Y binding
and, thereby induce expression of the topoIIα gene in confluent cells. The studies were
conducted in comparison to the monomer unit f-PIP 1.
2. Results and Discussion
2.1. Synthesis
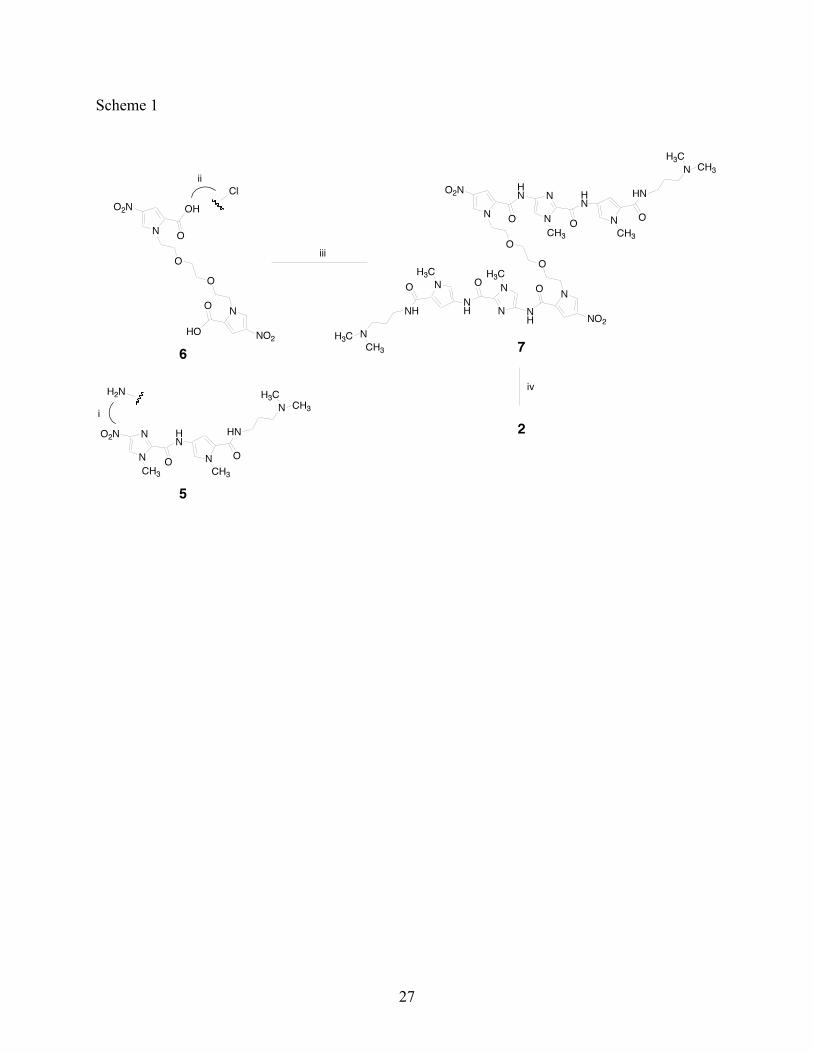
H-pin 2 was synthesized as described in Scheme 1, adapting a previously published
procedure.12a The nitro-IP diamide 5 was reduced to the amine via catalytic hydrogenation over
palladium on carbon (Pd/C, 5%).13 The nitro-pyrrole-EG-linked diacid (6) was converted to a
diacid chloride using thionyl chloride, which was subsequently coupled to the aforementioned
amine using Schotten-Baumann chemistry.14 The resulting nitro-linked-triamide 7 was reduced
with 10% Pd/C, and the amine reacted with freshly prepared formic acetic anhydride to produce
the final H-pin (2) in 16% yield after purification using silica gel column chromatography.15
Compounds 7 and 2 were characterized by 400 MHz 1H NMR, MS, and FT-IR. The purity of H-
pin 2 was ascertained through TLC and 1H-NMR analyses.
2.2. Circular Dichroism (CD)
When a non-chiral ligand, such as a polyamide, binds in the minor groove of DNA, the
resulting chiral complex induces a CD response at ~330 nm.16 CD studies were carried out using
three DNA sequences: cognate sequence TACGAT representing the 5′-flank of the ICB2 site, an
A/T rich non-cognate AAATTT, and a second cognate sequence ATCGAT, which differs only in
the order of the first two base pairs. It is known that an f/P pairing and the charged dialkylamino
tail moiety show no binding preference for A/T over T/A, thus, both cognate sequences should
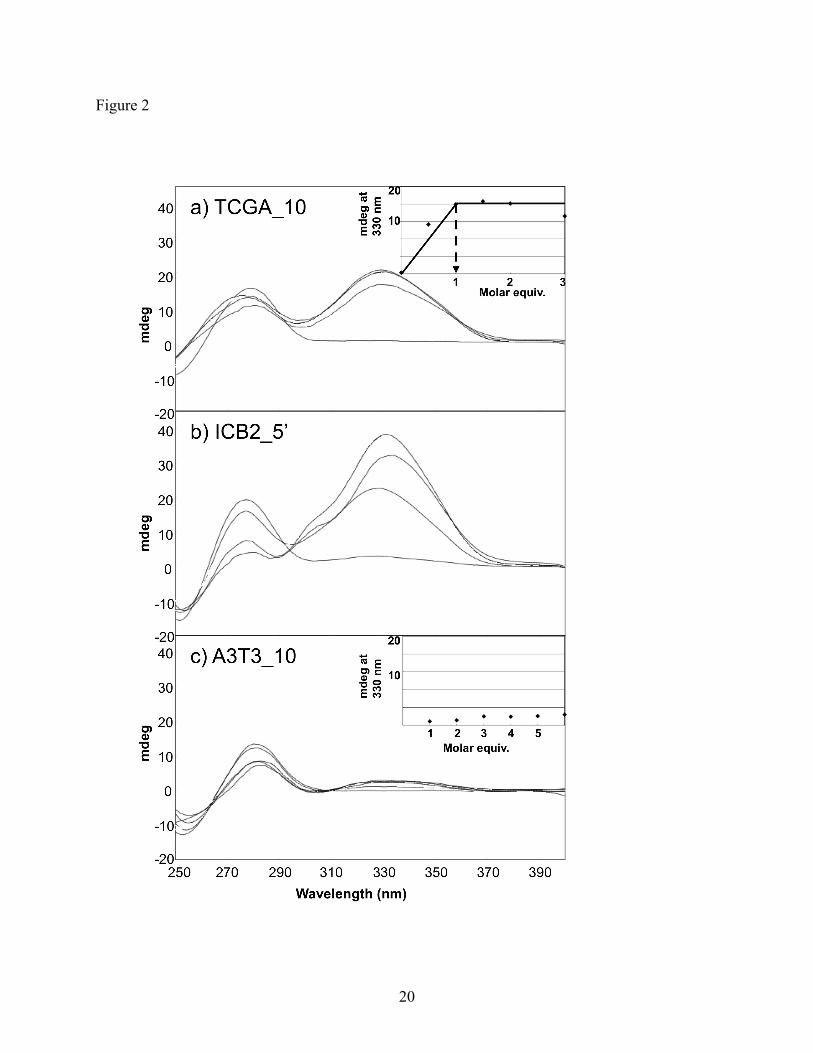
present similar binding sites.9,17,18 Strong DNA-induced CD bands shown in Figure 2A and B
provide evidence that H-pin 2 binds in the minor groove of both cognate sequences. Specifically,
ATCGAT was saturated at 20 mdeg ellipticity with 1 molar equivalent of added polyamide
5
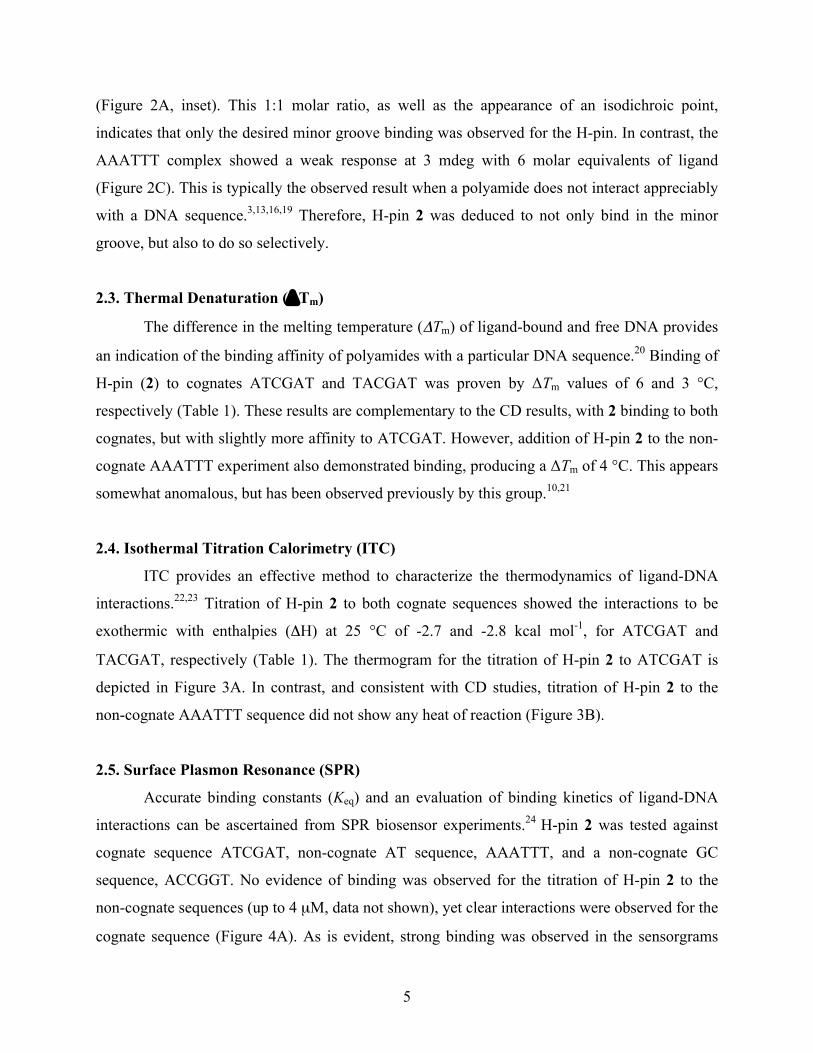
(Figure 2A, inset). This 1:1 molar ratio, as well as the appearance of an isodichroic point,
indicates that only the desired minor groove binding was observed for the H-pin. In contrast, the
AAATTT complex showed a weak response at 3 mdeg with 6 molar equivalents of ligand
(Figure 2C). This is typically the observed result when a polyamide does not interact appreciably
with a DNA sequence.3,13,16,19 Therefore, H-pin 2 was deduced to not only bind in the minor
groove, but also to do so selectively.
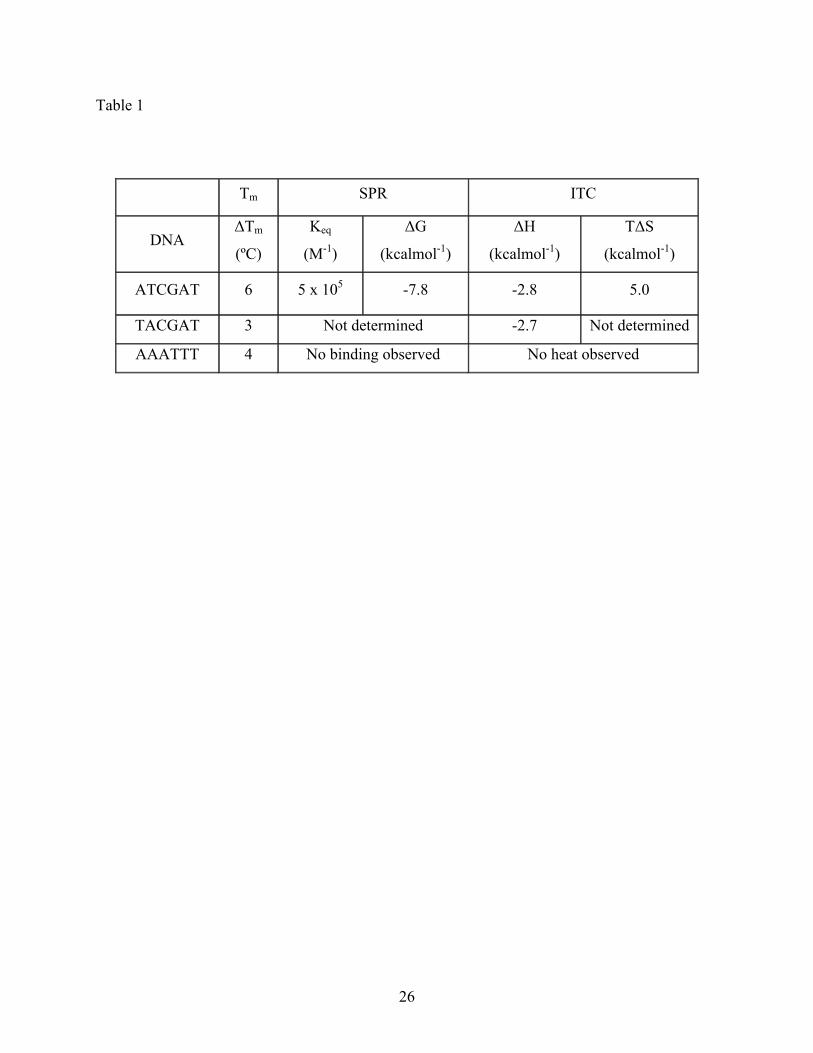
2.3. Thermal Denaturation (ΔTm)
The difference in the melting temperature (ΔTm) of ligand-bound and free DNA provides
an indication of the binding affinity of polyamides with a particular DNA sequence.20 Binding of
H-pin (2) to cognates ATCGAT and TACGAT was proven by ΔTm values of 6 and 3 °C,
respectively (Table 1). These results are complementary to the CD results, with 2 binding to both
cognates, but with slightly more affinity to ATCGAT. However, addition of H-pin 2 to the non-
cognate AAATTT experiment also demonstrated binding, producing a ΔTm of 4 °C. This appears
somewhat anomalous, but has been observed previously by this group.10,21
2.4. Isothermal Titration Calorimetry (ITC)
ITC provides an effective method to characterize the thermodynamics of ligand-DNA
interactions.22,23 Titration of H-pin 2 to both cognate sequences showed the interactions to be
exothermic with enthalpies (ΔH) at 25 °C of -2.7 and -2.8 kcal mol-1, for ATCGAT and
TACGAT, respectively (Table 1). The thermogram for the titration of H-pin 2 to ATCGAT is
depicted in Figure 3A. In contrast, and consistent with CD studies, titration of H-pin 2 to the
non-cognate AAATTT sequence did not show any heat of reaction (Figure 3B).
2.5. Surface Plasmon Resonance (SPR)
Accurate binding constants (Keq) and an evaluation of binding kinetics of ligand-DNA
interactions can be ascertained from SPR biosensor experiments.24 H-pin 2 was tested against
cognate sequence ATCGAT, non-cognate AT sequence, AAATTT, and a non-cognate GC
sequence, ACCGGT. No evidence of binding was observed for the titration of H-pin 2 to the
non-cognate sequences (up to 4 µM, data not shown), yet clear interactions were observed for the
cognate sequence (Figure 4A). As is evident, strong binding was observed in the sensorgrams
6
and rates of association are rapid (< 0.1 sec). SPR studies using the same biosensor chip were
simultaneously conducted on the monomer f-PIP 1 (Figure 4B) with similar concentrations. H-
pin 2, which has roughly twice the molecular weight as that of f-PIP, binds as a monomer to
ATCGAT whereas f-PIP binds as a dimer. Hence the predicted RUs (response units) for binding
of one molecule of H-pin 2 to ATCGAT are expected to be approximately equal to binding of
two molecules of f-PIP. In the comparison of binding plots in Figure 4, f-PIP has fewer RUs in
the initial concentration range because its binding affinity is lower than for H-pin 2. A higher
concentration of f-PIP would be needed to match RUs of H-pin 2. Keq for H-pin 2 was calculated
using a 1:1 steady state model10,24 and was found to be 5 x 10⁵ M-1. The observed free energy of
the interaction was favorable, with a ΔG value at 25 °C of -7.8 kcal mol-1 (Table 1). Using the
enthalpy value of -2.8 kcal mol-1 determined from ITC studies, the TΔS, or entropy term, was
calculated to be 5.0 kcalmol-1. Hence, the primary thermodynamic driving force for the binding
of H-pin 2 to ATCGAT was through gains in entropy. Unexpectedly, this is only a slight
enhancement in binding affinity by using the H-pin motif when compared to that of the f-PIP 1
monomer which forms a cooperative 2:1 complex as expected [Keq= (K1xK2)1/2 = 2 x 10⁵ M-1;
this is the binding constant per molecule to compare directly with the H-pin]. It is worthy to note
that the Keq for the monomer f-PIP 1 is in agreement with previously published values.3 This
small enhancement is contrary to our previous findings of using the H-pin motif to enhance
binding affinity.
2.6. DNase I Footprinting
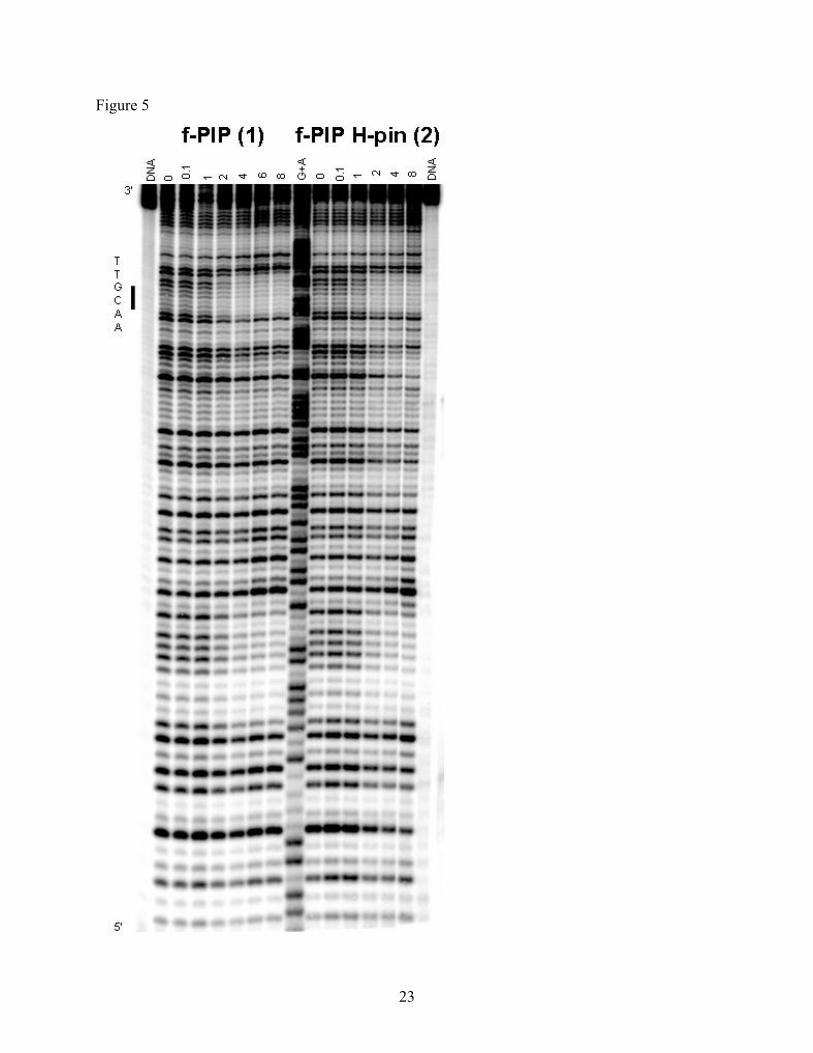
DNase I footprinting was used to examine the competitive selectivity of H-pin 2 for
cognate sites placed within a single DNA fragment containing several cognate and non-cognate
sites. Figure 5 shows the titration results for H-pin 2 and f-PIP monomer 1. A clear footprint is
observed for both compounds over the cognate site 5`-AACGAT at 2 µM. However, at 1 µM of
H-pin 2 the bands corresponding to this binding site were diminished compared to monomer 1,
indicating that the H-pin gave a slightly stronger affinity. This result is concurrent with the SPR
data.
2.7. Electrophoretic mobility shift assay (EMSA)
7
EMSA can provide direct evidence for the ability of small molecules to interfere with the
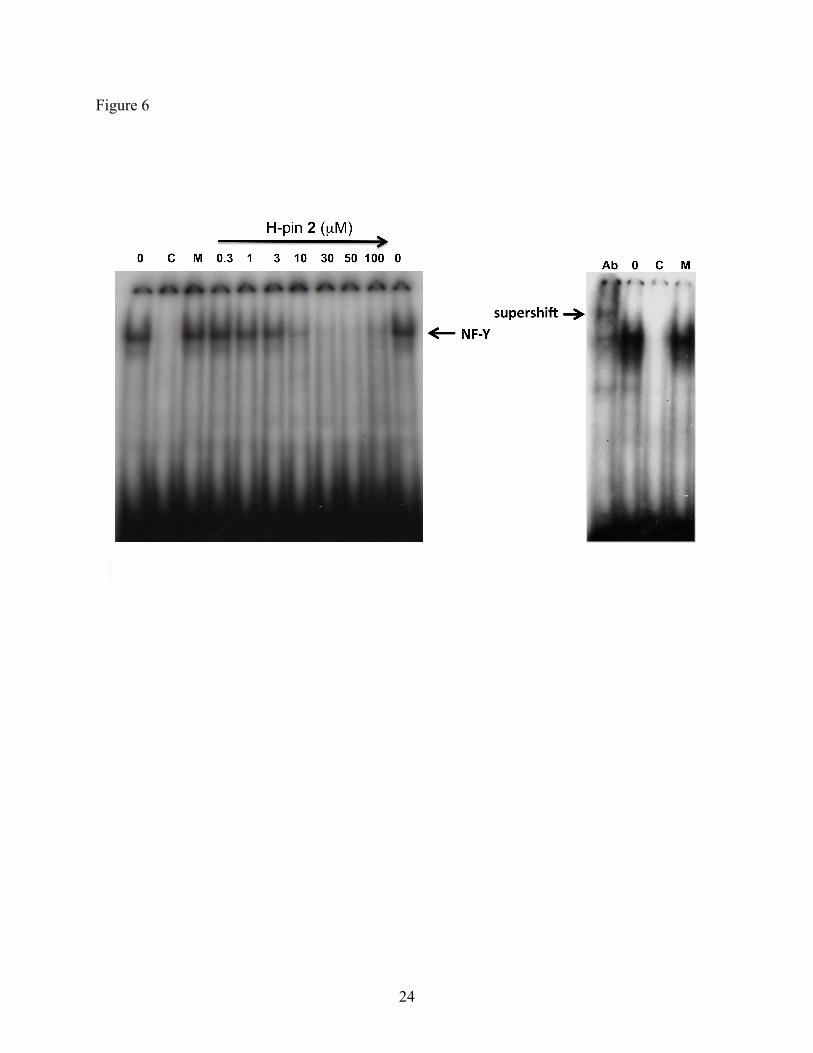
binding of transcription factors to target DNA sequences. As shown in Figure 6, pre-incubation
of H-pin 2 with the radioactive probe containing the ICB2 target sequence, for 1h and subsequent
addition of nuclear extracts from confluent NIH 3T3 cells results in inhibition of NF-Y binding
at drug concentrations greater than 3 µM. The same experiment was repeated with the nuclear
extracts incubated with the radioactive probe first, for 1h, before addition of 2. The NF-Y
binding inhibition patterns were identical (data not shown) suggesting that 2 can not only
compete but also displace protein factors bound to DNA, including NF-Y, as confirmed by
supershifting with antibody to the A subunit of NF-Y.
2.8. Western Blot
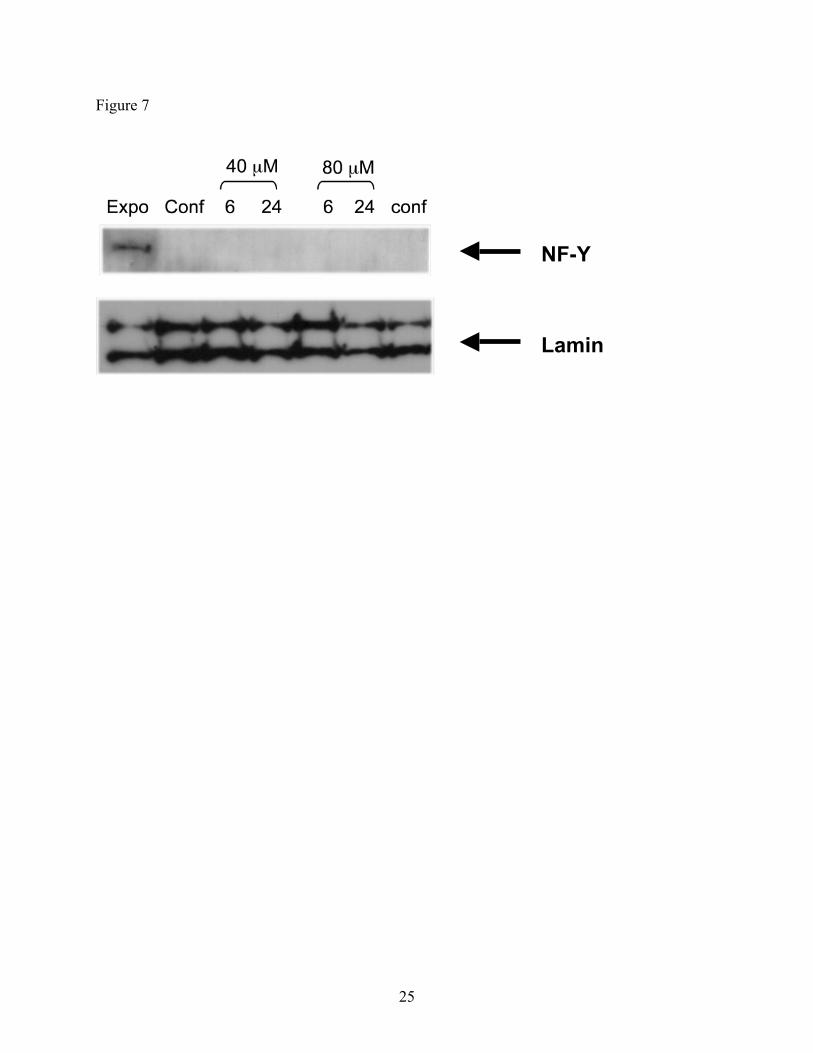
In order to demonstrate whether H-pin polyamides could be developed as cellular gene
control agents, the ability of H-pin 2 to enter the nucleus of cells and subsequently affect gene
expression was investigated using immunoblotting. Confluent NIH 3T3 cells were incubated
with up to 80 µM H-pin for 4, 6, and 24 h. Western blot analysis of treated cells was performed
and the results are shown in Figure 7. Disappointingly, the results demonstrate that H-pin does
not affect topoIIα protein expression. This is in contrast to the monomer, f-PIP 1, which at 10
µM increased topoIIα levels after only 4 h incubation.3 As a control, the level of lamin in the
cells were probed, and it was found to be unaffected (Figure 7). This indicates that the cells were
growing properly and the gene expression machinery was not impaired. It is suggested that due
to the bulk of the H-pin, uptake into the nucleus does not occur. This suggestion is support by
recent reports indicating that cell permeability and nuclear localization of hairpin and H-pin
polyamides are not predictable, and molecular size and pyrrole/imidazole content are possible
determining factors.25 However, the results do not rule out the possibility that binding of H-pin 2
to albumin or other components might have also blocked any biological activity.
2.9. Cytotoxicity Studies
The cytotoxicity of f-PIP H-pin 2 in murine leukemia (L1210) and murine melanoma
(B16) cell lines was determined using a colorimetric MTT assay. It was anticipated that 2 would
not bear any inherent cytotoxicity as its mechanism of inhibiting NF-Y and up-regulating
topoIIα, should not reduce/inhibit cell growth. H-pin 2 was incubated with each cell line over a

8
concentration gradient for 72h, at which point the MTT stain was added. After 4 h development
time, the absorbance of each plate was read and an IC50 value (the concentration of 2 required to
inhibit 50% cell growth, compared to an untreated control) of > 100 µM was determined. Thus,
H-pin 2 yields no observable cytotoxicity, even at high concentrations, which is consistent with
our hypothesis.
3. Conclusion
The proven success of the H-pin motif to enhance binding affinity of polyamides to
cognate DNA sequences was combined with the biological potential of monomeric f-PIP 1 to up-
regulate expression of topoIIα, resulting in the design of glycol linked H-pin 2. H-pin 2
demonstrated excellent solubility in aqueous buffer, gave appreciable DNA binding affinity in
the minor groove, and displayed DNA sequence selectivity. H-pin 2 was also shown to inhibit
NF-Y from binding to ICB2 at a concentration of 3 µM. However, in contrast to the fPIP
monomer 1, H-pin 2 had no effect on the up-regulation of topoIIα in a culture of NIH 3T3 cells,
suggesting that 2 did not enter the nucleus, presumably due to its bulk. In spite of this outcome,
the study still demonstrates the potential of polyamides to selectively bind predetermined DNA
sequences with appreciable affinity. This result is interesting in that it directly compares a
monomer and an H-pin that, despite having similar binding characteristics, demonstrate such
vastly different cellular properties. Studies currently ongoing in the authors’ laboratory are
focused on addressing the problem of nuclear uptake through the design of next generation
polyamides.
4. Experimental
4.1. Synthesis
4.1.1. General
Solvents and organic reagents were purchased from Aldrich or Fisher Scientific; most
products were used without further purification with the exception of DCM and DMF, which
were distilled over P2O5 and BaO, respectively, prior to use. Melting points were obtained using
a Mel-temp melting point apparatus and are uncorrected. Infrared (IR) spectra were recorded
using a Midac M1700 FT-IR instrument as films on NaCl plates. 1H-NMR spectra were acquired
with a Varian Inova 400 MHz instrument. Chemical shifts (δ) are reported at 20 °C in parts per

9
million (ppm) downfield from internal tetramethylsilane (Me4Si). Mass spectra were provided by
the Mass Spectrometry Laboratory, University of South Carolina, Columbia. Reaction progress
was assessed by thin-layer chromatography (TLC) using silica gel on aluminum plates (Sorbent
Technologies). Visualization was achieved with UV light at 254 nm and/or 366 nm.
4.1.2. Compound 7
Compound 5 (300 mg, 0.79 mmol) was reduced with H2 in the presence of 5% Pd/C (150
mg) in cold MeOH (~30 mL) for ~24 h at RT.14 The reaction mixture was filtered through celite
and the catalyst was thoroughly rinsed with MeOH. The MeOH was removed and residual
solvent was removed by co-evaporation with DCM (3 x 2 mL). The resulting yellow, solid
amino product was protected from light and dried under high vacuum until required. Separately,
diacid 6 (162 mg, 0.38 mmol) was dissolved in dry THF (2 mL) and SOCl2 (4 mL) was added to
the solution. The reaction mixture was refluxed for ~15 minutes and then allowed to cool to
room temperature. The solvents were removed by aspiration and residual solvent was removed
by co-evaporation with dry DCM (3 x 2 mL). The acid chloride was dissolved in DCM (5 mL)
and added drop-wise to the above amine in dry triethylamine (TEA) (79.9 mg ≡ 0.06 mL, 0.79
mmol) and dry DCM (~10 mL) at 0 °C (ice/H2O). The reaction was allowed to warm to RT and
was stirred for ~18 h, protected from light. A basic aqueous work-up was performed24 and the
residue purified by flash column chromatography (silica gel, gradient: 100:0:0-0:100:0-
95:4.5:0.5 CHCl3:MeOH:NH4OH) to yield compound 7 as a yellow solid (102 mg, 25%). mp.
decomp. 186 °C: Rf 0.12 (69.5:30:0.5% CHCl3:MeOH:NH4OH); 1H NMR: 400 MHz, CD3OD,
7.88 (d, J=1.6 Hz, 2H); 7.38 (d, J=2.0 Hz, 2H); 7.37 (s, 2 H); 7.17 (d, J=1.6 Hz, 2 H); 6.77 (d,
J=2.0 Hz, 2H); 4.55 (t, J=4.6 Hz, 4H); 3.99 (s, 6H); 3.84 (s, 6H); 3.76 (t, J=4.0 Hz, 2H); 3.55 (s,
4H); 2.40 (t, J=8.0 Hz, 4H); 2.25 (s, 12H); 1.76 (quin, J=8.0 Hz, 4H); IR (neat) υ 2926, 1660,
1650, 1642, 1632, 1548, 1503, 1434, 1322, 1117 cm-1; MS (ES+) m/z (rel. intensity) 1086 (M+H,
10%); 558 (15%); 543 (100%).
4.1.3. f-PIP-EG H-pin 2
Compound 7 (102 mg, 0.094 mmol) was reduced with H2 in the presence of 10% Pd/C in
cold MeOH for ~18 h at RT.14 The amine was isolated as above and then re-dissolved in dry
DCM (5 mL). Formic acetic anhydride was prepared fresh as previously described.16 and added

10
dropwise to the amine solution at 0 °C (ice/H2O bath). The reaction mixture was allowed to
reach RT and was stirred for ~18 h. The reaction was cooled to 0 °C (ice/H2O bath), was
quenched with MeOH, and stirred at 0 °C for ~1 h. The reaction was dissolved in CHCl3 and a
basic aqueous work-up was performed.26 The yellow/cream solid product (2) (16 mg, 16%) was
isolated by flash column chromatography (silica gel, gradient: 100:0:0-0:100:0-95:4.5:0.5
CHCl3/MeOH/NH4OH). mp. decomp. at 180 °C: Rf 0.25 (90:10 MeOH:NH4OH); 1H NMR: 400
MHz, DMSO-d6, 10.29 (s, 2H); 10.06 (s, 2H); 9.93 (s, 2H); 8.10 (s, 2H); 7.52 (s, 2H); 7.31 (s,
2H); 7.20 (s, 2H); 6.99 (s, 2H); 6.88 (s, 2H); 4.42 (t, J=5.0 Hz, 4 H); 3.94 (s, 6H); 3.78 (s, 6H);
3.62 (t, J=5.4 Hz, 4H); 3.43 (s, 4H); 3.16 (dt, J=6.4 Hz, 4H); 2.29 (t, J=6.8 Hz, 4H); 2.12 (s,
12H); 1.59 (quintet, J=6.8 Hz, 4 H); IR (neat) υ 3357, 2924, 2863, 1654, 1650, 1639, 1581,
1537, 1465, 1403, 1381, 1256, 110, 1095 cm-1; MS (ES+) m/z (rel. intensity) 1082 (M+H, 5%);
541 (100%); 361 (52%); HRMS for C50H68N18O10 calc. 1081.5444; obs.1081.5461.
4.2. Thermal Denaturation (ΔTM)
DNA oligomers were purchased from Operon with the following sequences: ATCGAT,
GAATCGATTGCTCTCAATCGATTC; TACGAT, CTACGATTGGTCTTTTTGACCAATC-
GTAG; AAATTT, CGAAATTTCCCTCTGGAAATTTCG. Tm data were obtained using a Cary
100 Bio (Varian) spectrophotometer with DNA (1 µM) in PO40 (10 mM Phosphate, 12.5 mM
Na+, 1 mM EDTA, pH 6.2) and compound 2 (3 µM), as previously described.27
4.3. Circular Dichroism (CD)
CD studies were performed on an OLIS (Bogart, GA) DSM20 spectropolarimeter using a
1 mm pathlength cuvette and a band pass of 2.4 nm as described previously28 with the exception
of the integration time, which was set to integrate as a function of PMT high volts. Experiments
were carried out in duplicate using PO45 buffer (10 mM Phosphate, 50 mM Na+, 1 mM EDTA,
pH 6.2) and the data analyzed using KaleidaGraph software (Synergy Software, Reading, PA).15
4.4. Isothermal Titration Microcalorimetry (ITC)
A VP-ITC micromalorimeter (MicroCal) was used to perform ITC analysis on the DNA
sequences described above. Compound 2 was dissolved in PO45 and the instrument equilibrated
at 25 °C. After an initial delay of 300 s, compound 2 (100 µM) was titrated, via 50 injections (3
11
µL for 7.7 s, repeated every 240 s), into 2 µM DNA (PO45). The data was analyzed using the
same method as previously reported.29 Origin 7.0 was used to integrate the area under the curve
as a function of time. A linear fit was then employed and this was subtracted from the reaction
integrations to normalize for non-specific heat components, from which the enthalpy of reaction
ΔH was determined.
4.5. Surface Plasmon Resonance (SPR)
Biosensor chip surface preparations and biotinylated DNA immobilizations were
conducted as previously described.24 The cognate biotin-labeled DNA hairpin used was 5’-
biotin-GATCGATTCTCTAATCGATTC-3’ (ATCGAT). Similar oligomer design was used for
the non-cognate DNAs. The experiments were performed at 25 °C in cacodylic acid buffer at pH
6.25 and 0.1 M NaCl. In a typical experiment, 200 µL samples at different concentrations were
injected onto the chip surface with a flow rate of 25 µL /min and 400-sec dissociation period.
The surface was regenerated with a glycine pH 2.5 solution and multiple buffer injections. The
data were fitted with equation 2 to obtain macroscopic binding constants:
r = ( K1×Cfree + 2×K1×K2×Cfree2) / (1+K1×Cfree + K1×K2×Cfree
2 ) (2)
this is used directly for a two site model and with =0 for a one site model of binding.
4.6. Preparation of Nuclear Cell Extracts
Nuclear extracts were prepared using the Active Motif Nuclear-extract kit following the
manufacturer’s protocol. All steps were carried out at 4 °C in the presence of protease inhibitor
mix (Complete; Roche). The protein concentration of the nuclear extract was assayed using the
Bio-Rad protein assay.
4.6.1. Electrophoretic Mobility Shift Assay (EMSA)
The oligonucleotides (Eurofins MWG Operon) containing the inverted CCAAT box 2
(ICB2; italicized) used in the EMSA assay are: ICB2 sense 5’-
GGCAAGCTACGATTGGTTCTTCTGGACG-3’ and ICB2 antisense 5’-
CGTCCAGAAGAACCAATCGTAGCTTGCC-3’. Oligonucleotides containing a mutated ICB2,
with the wild-type ICB2 sequence replaced by AAACC and GGTTT in sense and antisense
oligonucleotides respectively were used as specific competitors. Sense and antisense

12
oligonucleotides were annealed in an equimolar ratio. Double-stranded oligonucleotides were 5’-
end labeled with T4 Kinase (NEB) using [γ-32P] ATP and subsequently purified on Bio-Gel P-6
columns (Bio-Rad). ~ 0.1 ng of radiolabeled probe was incubated with 2 for 1h at room
temperature in a total volume of 20 µl containing 4 µl of the 5x binding buffer [20% glycerol, 5
mM MgCl2, 2.5 mM EDTA, 2.5 mM DTT, 250 mM NaCl and 50 mM Tris-HCl (pH 7.5)] , 1 µg
poly (dI-dC).poly(dI-dC) (Sigma) and 1x protease inhibitor mix (Complete; Roche). 10 µg of
nuclear extracts were subsequently added and the reaction was further incubated for another
hour. For supershifts, the nuclear extracts were preincubated with an antibody against NF-Y(A)
(Abcam) for 1h, on ice, before addition of the radioactive probe. In competition experiments,
radiolabeled probe and competitor were added simultaneously. Prior to loading, 2 µl of loading
buffer [25 mmol/L Tris-HCl (pH 7.5), 0.02% Bromophenol blue, and 10% glycerol] was added
and the samples were separated on a pre-run 4% polyacrylamide gel in 0.5% TBE buffer
containing 2.5% Glycerol at 4 ºC. After drying the gels, the radioactive signal was visualized by
exposure to Fuji medical X-ray film.
4.6.2. Western Blot analysis
50 µg of nuclear extract was denatured by heating for 3 min at 95 ºC in sample buffer
containing 100 mM Tris-Cl (pH 6.8), 4% SDS, 10% 2-mercaptoethanol, 20% glycerol and
0.02% bromophenol blue. Novex Sharp Pre-stained molecular weight standards were used as a
reference. Proteins were separated on a NuPAGE 7% Tris-acetate mini-gel (InVitrogen) and
subsequently transferred (Trans Blot Cell; Bio-Rad) to polyvinylidene difluoride membranes
(Immobilon-P; Millipore). Western blot analysis was performed with the Cell Signaling rabbit
polyclonal topoisomerase IIα antibody at a 1:1000 dilution using an enhanced
chemiluminescence Western Blot detection kit and protocol (Amersham) using 5% bovine serum
albumin (Promega) as blocking reagent and TBS-0.1% Tween-20 (BDH) as a buffer. The
chemiluminescent signal was visualized by exposing the blots to Fuji medical X-ray film.
4.6.3. DNase I Footprinting Studies
A radiolabeled DNA fragment of 131 base pairs containing a unique cognate site 5’-
AACGTT-3’ was generated by polymerase chain reaction as described previously.30 The

13
amplified fragment was purified on a Bio-Gel P-6 column followed by agarose gel
electrophoresis and isolated using the Mermaid Kit (MP biomedicals) according to the
manufacturer’s instructions.
DNase I digestions were conducted in a total volume of 8 µL. The labeled DNA fragment
(2 µl, 200 counts s-1) was incubated for 30 min at room temperature in 4 µL TN binding buffer
(10 mM Tris Base, 10 mM NaCl, pH 7) containing the required drug concentration. Cleavage by
DNase I was initiated by addition of 2 µL of DNase I solution (20mM NaCl, 2mM MgCl2, 2mM
MnCl2, DNase I 0.02U, pH 8.0) and stopped after 3 min by snap freezing the samples on dry ice.
The samples were subsequently lyophilized to dryness and resuspened in 5 µL of formamide
loading dye (95% formamide, 20 mM EDTA, 0.05% bromophenol blue, and 0.05% cyanol blue).
Following heat denaturation for 5 min at 90 °C, the samples were loaded on a denaturing
polyacrylamide (10%) gel (Sequagel, National Diagnostics, UK) containing urea (7.5 mM).
Electrophoresis was carried out for 2 h at 1650 V (~70W, 50 °C) in 1X TBE buffer. The gel was
then transferred onto Whatman 3MM and dried under vacuum at 80°C for 2 h. The gel was
exposed overnight to Fuji medical X-Ray film and developed on a Konica Medical Film
Processor SRX-101A.
4.7. Cytotoxicity Studies
B16 and L1210 cell line maintenance and MTT assays were conducted as previously
reported,31 with the exception of incubation in a 10% humidified CO2 atmosphere (cf. 5%).
Acknowledgements
Support from the NSF (CHE 0550992) and CRUK (C2259/A9994) is greatly
acknowledged. A.F. thanks the Eli Lilly Co. for a summer research fellowship.
References
1. Melander, C.; Burnett, R.; Gottesfeld, J. M. J. Biotechnol. 2004, 112, 195.
2. Kopka, M. L.; Goodsell, D. S.; Han, G. W.; Chiu, T. K.; Lown, J. W.; Dickerson, R. E.
Structure 1997, 5, 1033.

14
3. Le, N. M.; Sielaff, A. M.; Cooper, A. J.; Mackay, H.; Brown, T.; Kotecha, M.; O’Hare, C.;
Hochhauser, D.; Lee, M.; Hartley, J. A. Bioorg. & Med. Chem. Lett. 2006, 16, 6161.
4. Ronchi, A.; Bellorini, M.; Mongelli, N.; Mantovani, R. Nucleic Acids Res. 1995, 23, 4565.
5. Isaacs, R. J.; Harris, A. L.; Hickson, I. D. J. Biol. Chem. 1996, 271, 16741.
6. Tolner, B.; Hartley, J.A.; Hochhauser, D. Mol. Pharmacol. 2001, 59, 699.
7. Hochhauser, D.; Kotecha, M.; O’Hare, C.; Morris, P.J.; Hartley, J.M.; Taherbhai, Z.; Harris,
D.; Forni, C.; Mantovani, R.; Lee, M.; Hartley, J. A. Mol. Cancer Ther. 2007, 6, 346.
8. Henry, J. A; Le, N. M.; Nguyen, B.; Howard, C. M.; Bailey, S. L.; Horick, S. M.;
Buchmueller, K. L.; Kotecha, M.; Hochhauser, D.; Hartley, J. A.; Wilson, W. D.; Lee, M.
Biochemistry 2004, 43, 12249.
9. Buchmueller, K. L.; Staples, A. M.; Howard, C. M.; Horick, S. M.; Uthe, P. B.; Le, M. N.;
Cox, K. K.; Nguyen, B.; Pacheco, K. A. O.; Wilson, W. D.; Lee, M. J. Am. Chem. Soc. 2005,
127, 742.
10. O'Hare, C.; Uthe, P.; Mackay, H.; Blackmon, K.; Jones, J.; Brown, T.; Nguyen, B.; Wilson,
W. D.; Lee, M.; Hartley, J. A. Biochemistry 2007, 46, 11661.
11. (a) Dwyer, T. J.; Geierstanger, B. H.; Mrksich, M.; Dervan, P. B.; Wemmer, D. E. J. Am.
Chem. Soc. 1993, 115, 9900; (b) Mrksich, M.; Dervan, P. B. J. Am. Chem. Soc. 1993, 115,
9892; (c) Mrksich, M.; Dervan, P. B. J. Am. Chem. Soc. 1994, 116, 3663; (d) Olenyuk, B.;
Jitianu, C., Dervan, P. B. J. Am. Chem. Soc. 2003, 125, 4741; (e) Dervan, P. B. Bioorg. Med.
Chem. 2001, 9, 2215.
12. (a) Al-Said, N. J.; Lown, W. Synth. Comm. 1995, 25, 1059; (b) Chen, Y-H. ; Yang, Y. J. ;
Lown, W. J. Biomolec. Struct. Dyn. 1996, 14, 341; (c) Chen, Y-H. ; Liu, J-X.; Lown, J. W.
Bioorg. Med. Chem. Lett. 1995, 5, 2223; (d) O'Hare, C. C.; Mack, D.; Tandon, M.; Sharma,
S. K.; Lown, J. W.; Kopka, M. L.; Dickerson, R. E.; Hartley, J. A. Proc. Natl. Acad. Sci.
2002, 99, 72-77.
13. Brown, T.; Taherbhai, Z.; Sexton, J.; Sutterfield, A.; Turlington, M.; Jones, J.; Stallings, L.;
Stewart, M.; Buchmueller, K.; Mackay, H.; O’Hare, C.; Kluza, J.; Nguyen, B.; Wilson, D.;
Lee, M.; Hartley, J. A. Bioorg. Med. Chem. 2007, 15, 474.
14. March, J. In Advanced Organic Chemistry: Reactions, Mechanisms and Structure; John
Wiley & Sons: New York, 1992, 4th Edition, p 392.

15
15. Lacy, E. R., Le, N. M., Price, C. A., Lee, M., Wilson, W. D. J. Am. Chem. Soc. 2002, 124,
2153.
16. (a) Lyng, R.; Rodger, A.; Norden, B. Biopolymers 1991, 31, 1709; (b) Lyng, R.; Rodger, A.;
Norden, B. Biopolymers 1992, 32, 1201.
17. Yang, X.-L.; Kaenzig, C.; Lee, M.; Wang, A. Eur. J. Biochem. 1999, 263, 646.
18. Lee, M.; Krowicki, K.; Hartley, J. A.; Pon, R. T.; Lown, J. W. J. Am. Chem. Soc. 1988, 110,
3641.
19. Mackay, H.; Brown, T.; Sexton, J. S.; Uthe, P. B.; Westrate, L.; Sielaff, A.; Jones, J.; Lajiness, J. P.; Kluza, J.; O’Hare, C. C.; Nguyen, B.; Davies, Z.; Bruce, C.; Wilson, W. D.; Hartley, J. A.; Lee, M. Bioorg. Med. Chem. 2008, 16, 9145.
20. Wilson, W. D.; Tanious, F. A.; Fernandez-Saiz, M.; Ted Rigl, C. In Drug-DNA
Interaction Protocols (Methods In Molecular Biology); Fox, K., Ed.; Humana Press: Totowa,
1997, Vol. 90, pp 219-240.
21. Mackay, H.; Brown, T.; Sexton J. S.; Kotecha, M.; Nguyen, B.; Wilson, W. D.; Kluza, J.;
Savic, B.; O’Hare, C.; Hochhauser, D.; Lee, M.; Hartley, J. A.; Bioorg. Med. Chem. 2008,
16, 2093.
22. Chaires, J. B. Annu. Rev. Biophys. 2008, 37, 135.
23. Chellani, M. Am. Biotechnol. Lab. 1999, 17, 14.
24. Nguyen, B.; Tanious, F. A., Wilson, W. D. Methods, 2008, 42, 150.
25. (a) Nishijima, S.; Shinohara, K.; Bando, T.; Minoshima M.; Kashiwazaki, G.; Sugiyama, H.
Bioorg. & Med. Chem. 2010, 18, 978; (b) Nickols, N. G.; Jacobs, C. S.; Farkas, M. E.; and
Dervan, P. B. Nucl. Acids Res. 2007, 35, 363; (c) Edelson, B. S.; Best, T. P.; Olenyuk, B.;
Nickols, N. G.; Doss, R. M.; Foister, S.; Heckel, A.; and Dervan, P. B. Nucl. Acids Res.
2004, 32, 2802; (d) Best, T. P.; Edelson, B. S.; Nickols, N. G.; Dervan, P. B. Proc. Natl.
Acad. Sci. U.S.A. 2003, 100, 12063.
26. Basic aqueous work-up' refers to washing the organic layer with a solution of aq. NaOH
(pH~11). The aqueous layer was then back-extracted with CHCl3 (x3). The organic layers
were then combined, dried (Na2SO4) and evaporated to dryness.
27. Flores, L. V.; Staples, A. M.; Mackay, H.; Howard, C. M.; Uthe, P. B.; Sexton, J. S.;
Buchmueller, K. L.; Wilson, W. D.; O’Hare, C.; Kluza, J.; Hochhauser, D.; Hartley, J. A.;
Lee, M. ChemBioChem, 2006, 7, 1722.
16
28. Sielaff, A. S.; Mackay, H.; Brown, T.; Lee, M. Biochem. Biophys. Res. Commun. 2008, 369,
630.
29. Buchmueller, K. L., Bailey, S. L., Matthews, D. A., Taherbhai, Z. T., Register, J. K., Davis,
Z. S., Bruce, C. D., O'Hare, C., Hartley, J. A., Lee, M. Biochem. 2006, 45, 13551.
30. O'Hare, C. C.; Uthe, P.; Mackay. H.; Blackmon, K.; Jones, J.; Brown, T.; Nguyen, B.;
Wilson, W. D.; Lee, M.; Hartley, J. A. Biochemistry 2007, 46, 11661.
31. LeBlanc, R.; Dickson, J.; Brown, T.; Stewart, M.; Pati, H. D.; VanDerveer, D.; Arman, H.;
Harris, J.; Pennington, W.; Holt, Jr. H. L.;. Lee, M. Bioorg. Med. Chem. 2005, 13, 6025.
17
Legends
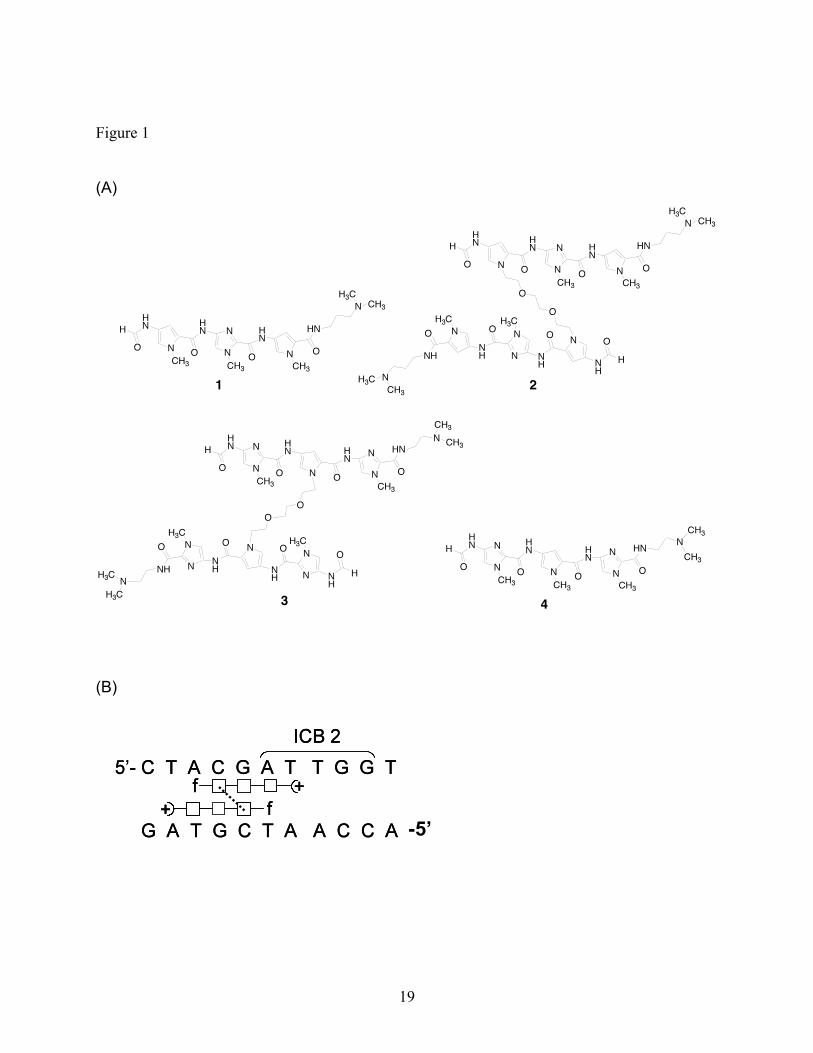
Figure 1. (A) f-PIP monomer 1 and corresponding H-pin 2, which bind, respectively, in a 2:1 or
1:1 stoichiometric ratio to the 5`-TACGAT sequence on the 5`-flank of the ICB2 site.
Analogous polyamides f-IPI H-pin (3) and f-IPI (4), previously synthesized by the
authors' laboratory. (B) Diagram of the ICB2 site, detailing the cognate sequence of
H-pin 2.
Figure 2. CD spectra for H-pin 2 binding to cognate sites ATCGAT (A) and TACGAT (B), and
non-cognate AAATTT (C). Inset graphs show stoichiometric data; the necessary
molar equivalents of polyamide:DNA to achieve saturation of the CD signal at 330
nm.
Figure 3. ITC thermograms for H-pin 2 binding to cognate ATCGAT (A) and non-cognate
AAATTT (B) at 25 °C.
Figure 4. SPR sensorgrams of the cognate sequence, ATCGAT, with (A) H-pin 2 at 0.03, 0.07,
0.1, 0.3, 0.7, 0.9, 1.2, 1.5, 1.7, 2.0, 2.2, 2.5, 2.7, 3.0, 3.2, 3.5, 4.0 µM and (B) f-PIP 1
at 0.1, 0.3, 0.7, 0.9, 1.2, 1.7, 2.0, 2.2, 2.5, 2.7, 3.2, 3.5, 4.0 µM. (C) Steady state plots
for sensorgrams given in parts (A) and (B). Non-cognate DNA sequences gave
essentially no RUs in their sensorgrams, indicating very weak binding.
Figure 5. Autoradiograph from DNase I footprinting studies of f-PIP 1 amd H-pin 2.
Figure 6 EMSA of H-pin 2 with oligonucleotide containing the ICB2 sequence present on the
topo IIα promoter. The oligonucleotide was incubated with 2 (concentrations ranging
from 0-50 µM) for 1h at RT prior to incubation with nuclear extracts from cultured
confluent NIH 3T3 cells. Cold (C) and mutated (M) lanes represent reactions carried
out in the presence of excess unlabelled and mutated ICB2 oligonucleotides. Lane Ab
contains anti-NF-Y(A) antibody and the arrow indicates the band corresponding to
the NF-Y bound oligonucleotide. The same nuclear extracts were used under the
same experimental conditions in all lanes.
Figure 7 Western blot analysis of NIH 3T3 cell extracts following treatment with H-pin 2.
Cells were either exponentially growing (exp) or maintained at confluence for 96 h
(conf). Confluent cells were treated with 40 and 80 µM of 2 and analysis was carried
out on samples collected after 6 and 24 h of drug treatment as indicated. Lamin A/C
is shown as a loading control.
18
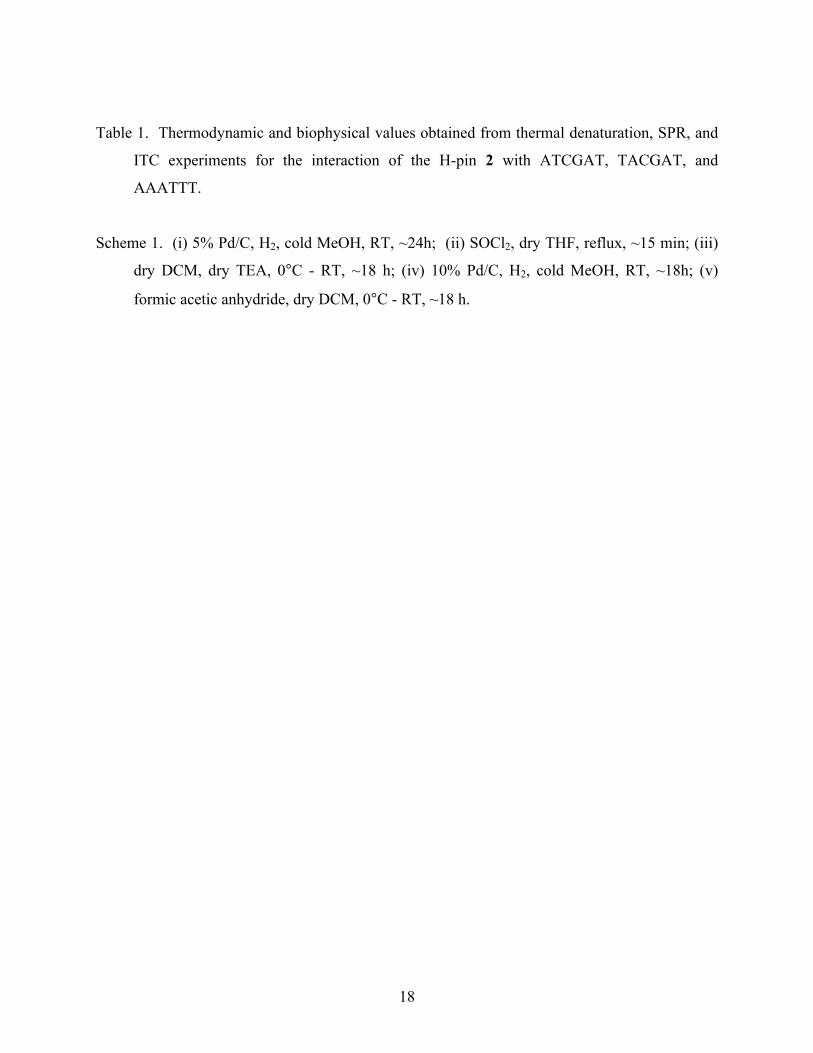
Table 1. Thermodynamic and biophysical values obtained from thermal denaturation, SPR, and
ITC experiments for the interaction of the H-pin 2 with ATCGAT, TACGAT, and
AAATTT.
Scheme 1. (i) 5% Pd/C, H2, cold MeOH, RT, ~24h; (ii) SOCl2, dry THF, reflux, ~15 min; (iii)
dry DCM, dry TEA, 0°C - RT, ~18 h; (iv) 10% Pd/C, H2, cold MeOH, RT, ~18h; (v)
formic acetic anhydride, dry DCM, 0°C - RT, ~18 h.
19
Figure 1
(A)
(B)
-5’
20
Figure 2

21
Figure 3
B A
ATCGAT AAATTT

22
Figure 4
23
Figure 5
24
Figure 6
25
Figure 7
NF-Y
Lamin
26
Table 1
Tm SPR ITC
DNA ΔTm
(ºC)
Keq
(M-1)
ΔG
(kcalmol-1)
ΔH
(kcalmol-1)
TΔS
(kcalmol-1)
ATCGAT 6 5 x 10⁵ -7.8 -2.8 5.0
TACGAT 3 Not determined -2.7 Not determined
AAATTT 4 No binding observed No heat observed
27
Scheme 1

28
TOC Graphical Abstract
-5’


![DNA Topoisomerase II-mediated Interaction of Doxorubicin ......(CANCER RESEARCH 49, 5969-5978, November 1, 1989] DNA Topoisomerase II-mediated Interaction of Doxorubicin and Daunorubicin](https://img.pdfslide.us/doc/110x75/60b066283fa7be5d4554ad65/dna-topoisomerase-ii-mediated-interaction-of-doxorubicin-cancer-research.jpg)