Embed Size (px)
Citation preview

1
Taking Stock of Africa’s Manufacturing Sector Economic Performance, Business Constraints and some
Policy Considerations
Måns Söderbom University of Gothenburg
Prepared for Sida Academy, Stockholm, September 17th 2009
www.soderbom.net [email protected]
2
Today’s talk revolves around:
1) The performance of the manufacturing sector in Sub-Saharan Africa (=“Africa”)
2) The leading constraints for growth and modernization in the sector
3) The role of manufacturing in generating jobs and reducing poverty
4) Manufacturing in rural areas (Ethiopia)

3
Basis for the research: Data
• Empirical research. Survey data. Large number of enterprises & workers in Africa.
• Typically 100s, sometimes 1,000s, of firms; typically 1,000+ workers. Firms can be followed over time.
• Primarily: Ethiopia, Kenya, Tanzania, Ghana; also: Nigeria, Uganda, Morocco, Zambia, Cameroon….
• Main overall lesson: Enormous diversity in choices & outcomes across firms
• Compare & contrast: Some firms perform very well, others rather badly. Why?
4
The underlying research
• I will focus mostly on research that I am (have been) involved in:– A non-technical general overview (Arne Bigsten & Måns
Söderbom, 2006, World Bank Research Observer)– A recent policy paper on Kenya’s MFG sector, forthcoming in a
book edited by Paul Collier and collaborators and published by Oxford University Press and the Central Bank of Kenya.
– Recent work on Ethiopia’s rural non-farm sector, commissioned by the World Bank.
– Ongoing work on Ethiopia’s industrialization strategy, in collaboration with researchers in Oxford and London School of Economics, and funded by DFID.
5
Is this research useful…?
• General policy: Research can’t offer complete policy recipes.
• Specific projects: Research won’t tell you how to best design (say) technical assistance programs.
• My take: Good empirical research shapes ideas– Sheds light on whether certain existing ideas about ’how things
work’ are true in the real world. Example: ”Lack of credit is a severe constraint on enterprise growth”. True?
– Sometimes shapes new ideas. Example - Finding: Improved credit access in Kenya in the 1990s had very little impact on investment. Not surprising, perhaps, as firms didn’t want to grow anyway – no demand. Why no demand? New idea: ”Because of high economic and political uncertainty”. True?
6
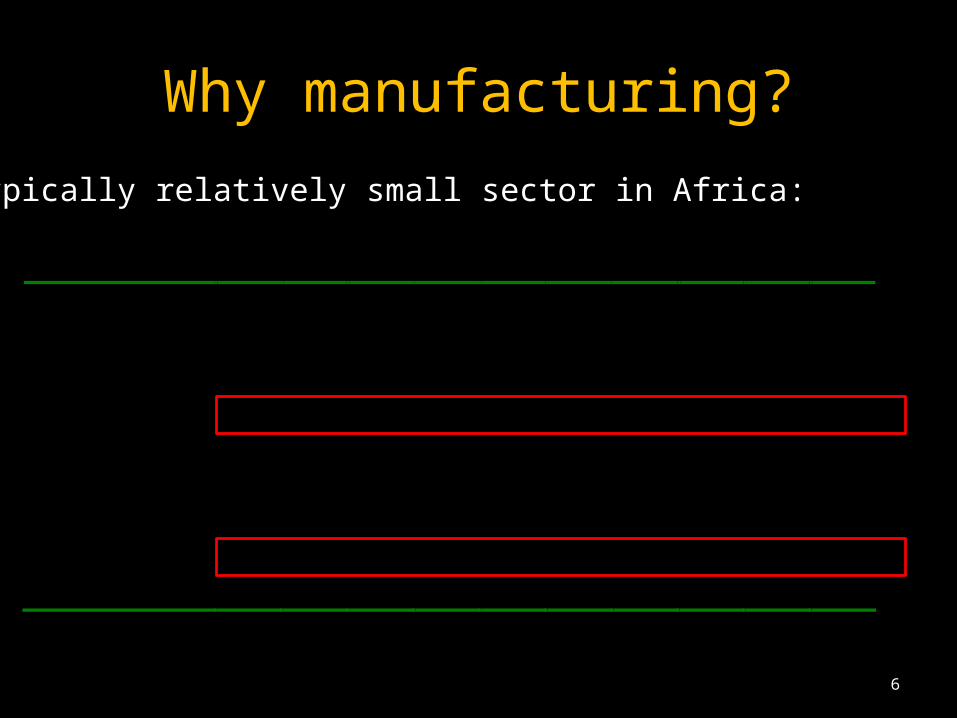
Why manufacturing?
Table 3: Sectoral value added as % of GDP 1975-2007 in SSA and China 1965 1970 1975 1980 1985 1990 1995 2000 2005 2007 Sub-Saharan Africa Agriculture 21.85 19.65 20.02 18.50 18.01 18.83 17.95 16.53 17.00 15.27 Industry 31.02 30.86 32.68 36.84 34.49 32.14 29.15 29.38 31.19 31.98 - manufacturing 17.50 17.86 17.63 16.58 16.47 17.60 15.77 14.52 13.11 14.48 Services 47.14 49.48 47.31 44.64 47.49 49.24 52.91 54.10 51.81 52.88 China Agriculture 37.94 35.22 32.40 30.17 28.44 27.12 19.96 15.06 12.59 11.13 Industry 35.09 40.49 45.72 48.22 42.89 41.34 47.18 45.92 47.68 48.50 - manufacturing 29.23 33.75 38.13 40.23 34.73 33.66 33.65 32.12 32.18 - Services 26.97 24.29 21.88 21.60 28.67 31.54 32.86 39.02 39.72 40.37
Source: WDI 2009
MFG typically relatively small sector in Africa:
7
Why pay so much attention to MFG?
• Two main arguments• Manufacturing is ”special”
– Leading edge of modernization– Creates skilled jobs– Generates technological spillover effects
• Manufacturing growth not constrained by land (scarce). With high population growth & pressure on land, diversification beyond agriculture is necessary.
8
1. General Overview of Findings• Reference: “What Have We Learned from a Decade of Manufacturing Enterprise
Surveys in Africa?” 2006, World Bank Research Observer 21:2, pp. 241-265 (Arne Bigsten & Måns Söderbom).
• First, the ‘doom and gloom’:• Except for a few countries (e.g. Mauritius), African
MFG is underdeveloped: – MFG value-added per capita:
• 1972: $98• 2002: $85
– Africa’s share in world…• population 11%• income 1.1% • manufacturing value-added 0.8%
9
1. Overview (cont’d)• Foreign investors do not see Africa as a promising location for
investment (e.g. extensive outsourcing to Asia - very little to Africa).
• Africans (!) keep a large share of their wealth outside Africa (40% according to Collier, Hoeffler and Pattillo, 2001).
• So that’s the bird’s eye view – we have not yet seen a manufacturing take-off in Africa, on average.
• Once you look at a large number of individual firms: big differences in outcomes across firms – some firms remain small and stagnant, others are very profitable and grow fast.
• Compare & contrast such cases. What drives success?• Firm-level data are very useful for this type of analysis.
10
1. Overview (cont’d)• Four main findings (primarily based on data from 1990s and
early 2000s):1. Investment in new equipment has remained low. Lack of
credit appears not to be the main reason; high risk and low demand are more important factors. Caveat: Credit more important for the very smallest firms.
2. Being exposed to international competition – either through exporting or by competing with imports– raises productivity.
3. High transaction costs is an important reason as to why manufactured exports have remained low.
4. Firm performance is hampered by poorly integrated domestic markets for labor, capital and MFG output.

11
Investment
Table 3. Investment rates and returns on fixed capital
in eight countries
Investment rate Average return on fixed
capital
Cameroon 0.11 1.36 Ghana 0.13 3.63 Kenya 0.11 1.82 Uganda 0.12 0.75 Zimbabwe 0.12 0.85 Belgium 0.13 0.18 France 0.11 0.12 Germany 0.12 0.16 UK 0.12 0.13

12
Exports & productivity• Exports and productivity positively correlated• In the literature there are two competing hypotheses with
regard to the relation between exporting and productivity: – self-selection: more efficient firms choose to export (causality from
efficiency to exporting)– learning-by-exporting: firms become more efficient as a result of
exporting (causality from exporting to efficiency)
• The two hypotheses are not mutually exclusive. • Influential papers by Bernard and Jensen (1999) and Clerides,
Lach, and Tybout, (1998). • Most studies have found evidence supporting the self-
selection hypothesis but not learning-by exporting.
13
Summary of the evidence• But now some evidence that learning-by-exporting holds for
Africa - including Bigsten et al. (2004) and Van Biesebroeck (2005) for a range of SSA countries.
• This suggests that active policies encouraging exports may help African firms to become more competitive.
• But breaking into exports market is costly – when we estimate entry costs the results indicate these are high.
• Reducing entry costs will give these firms access to a larger market.

14
Case Study I: Industry & Policy in KenyaReference: Arne Bigsten, Peter Kimuyu & Måns Söderbom (2010). “Chapter 10: The Manufacturing Sector,” in (ed.) C. Adam, P. Collier and N. Ndung’u, Kenya: Policies for Prosperity. Oxford University Press and Central Bank of Kenya.
• Draws on >10 years of research on Kenya’s MFG sector. • Discusses the Kenyan context and main challenges for
manufacturing. • Provides a forward-looking discussion of policy issues for the
future, cast in terms of policy options and choices rather than recommendations.

15
Kenya: Context• A resource poor country, with rapid population growth and a
large agricultural sector. • With limited access to fertile land, the agricultural sector
cannot be relied upon to deliver sustained growth in per capita income. Need growth in the non-farm sector.
• The government: manufacturing has an important role to play for long-term economic development.
• The growth targets for manufacturing stated by the government in its Vision 2030 document are ambitious and require rapidly increasing investment levels, eventually reaching levels above 30% of GDP.

16
Kenya: Overview
• 2003/4-2007, strong phase: high growth, rising investment, high MFG growth. Investment at 20% of GDP is high, but a long way away from the long-term target of investments of 30% of GDP.
• Post-election unrest in 2008 a major setback.• Manufacturing’s share in GDP constant at 10% - no major take-off for
manufacturing production in Kenya.
Economic indicators 2000-2007 2000 2002 2004 2006 2007 Real GDP growth (%) 0.5 0.5 5.1 6.4 7.0 Investment’s share in GDP (%) 16.8 17.4 16.3 19.1 19.5 Manufacturing growth (%) 1.0 0.1 4.5 6.3 6.2 Manufacturing share in GDP (%) 10.1 9.7 10.9 10.3 9.7 Manufacturing employment (´000) 218.7 229.7 242 254.9 261.3 Informal employment (‘000) 4,150.9 5,086,4 6,168.2 7,048.7 7,475.6 Manufacturing quantum index 281.4 287 310 353.5 381.5 Index manufacturing outp/empl 1 0.971 1.057 1.032 1.053

17
Kenya: Findings from Firm Surveys• Large productivity differences between small & large firms.*• These are mirrored by differences in the average amount of
physical capital used by workers in small & large firms.
*We care about productivity for many reasons: one is that higher productivity enables firms to pay higher wages.
How Labor Productivity and Capital Intensity Differ Across the Size Range Value-Added per Employee Physical Capital per Employee 2003 2000 2003 2000
Small - 10-49 Emp.
1% 0% (Benchmark)
-3% 0% (Benchmark)
Medium - 50-99 Emp.
58% 65% 26% 84%
Large 100+ Emp.
118% 95% 77% 153%
Observations 136 131 136 131 Note: The table reports percentage differences in value-added per employee and physical capital per employee, using small firms in 2003 as the benchmark. Source: Based on Bigsten, Kimuyu and Söderbom (2010).
18
Kenya: Findings from Firm Surveys• Investment and technology upgrading is done primarily by
large firms that are outward oriented (e.g. exporters).
Table: How the characteristics of investing and non-investing firms differ Introduced new technology? No Yes Exporters 32% 45% ISO certif. 8% 28% Part of global production network 3% 12% Employees 65.8 184.0 Firm age (years) 23.9 22.5 Foreign ownership 18% 0.17% Nairobi 76% 82% Mombasa 10% 12% Kisumu 2% 5% Nakuru 11% 1%
Observations 171 225
Source: Authors’ calculations based on firm-level survey data.
19
Kenya: Findings from Firm Surveys• Physical capital and technology determine how much each worker is able to produce. • We need to understand why investment is low.• We turn to the investment climate, especially:
• Demand • Uncertainty and instability (political, economic)• Imperfections in credit markets
• Variation in demand matters but less than you might think. That is, investment is not very responsive to demand fluctuations.• Uncertainty appears to play an important role.• Lack of credit – mixed evidence
20
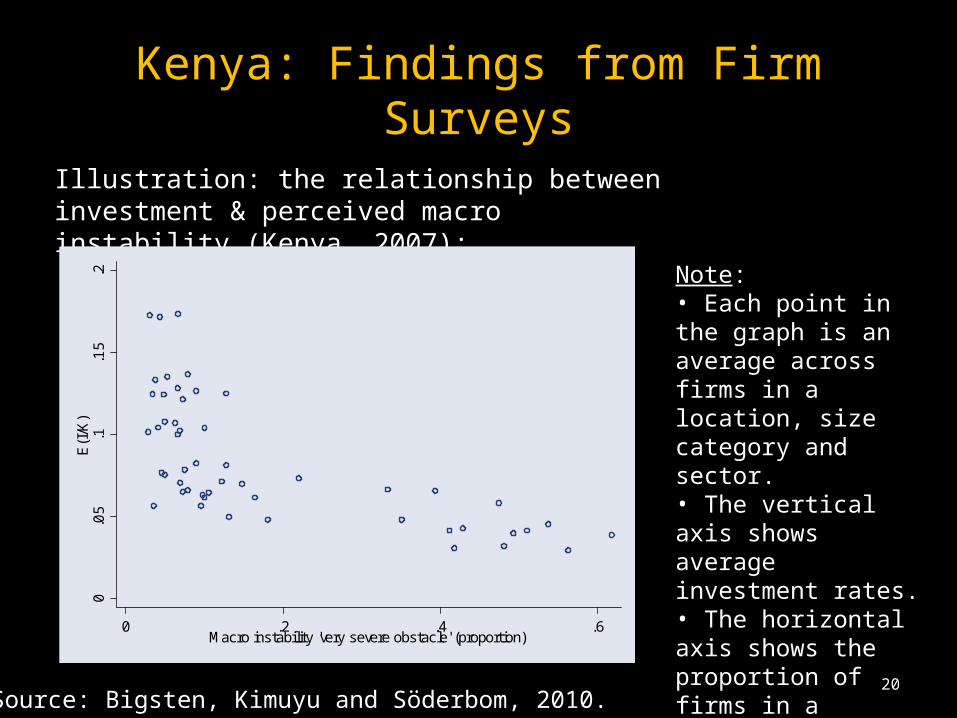
Kenya: Findings from Firm SurveysIllustration: the relationship between investment & perceived macro instability (Kenya, 2007):
0.0
5.1
.15
.2E
(I/K
)
0 .2 .4 .6Macro instability 'very severe obstacle' (proportion)
Note: • Each point in the graph is an average across firms in a location, size category and sector. • The vertical axis shows average investment rates.• The horizontal axis shows the proportion of firms in a particular location-size-sector cell that rate macroeconomic instability as a "very severe obstacle".
Source: Bigsten, Kimuyu and Söderbom, 2010.
21
Kenya: Findings from Firm Surveys• For Kenya, lack of stability remains a problem. The turmoil
and clashes in January 2008 and beyond, following the Presidential elections, likely caused significant damage to investor confidence.
• On top of this, Kenya’s exports are adversely affected by the demand effects of the financial crises. Disincentivizes investment further.
• Theoretical investment models, emphasizing real options, predict that the response of investment to demand growth is weak if uncertainty is high (see e.g. Bond, Bloom and Van Reenen, 2006). This suggests that when the global business cycle recovers, firms in Kenya will be slower to respond than firms in more politically stable countries.
22
Kenya: Findings from Firm Surveys• Mixed findings on the effects of financial constraints & imperfect credit markets on investment.
•Data from subjective questions suggest that poor access to credit is a major problem. Across 34 African countries, 50% of the respondents (managers, CEOs etc.) indicate that finance is a “major or very severe” constraint; and in Kenya, more than 70% said so (World Economic Forum, 2007).
• However non-subjective data do not back this up. Statistical analysis shows that the response of investment to changes in internal funds is weak – which can be interpreted as evidence that financial constraints are not binding (Bigsten et al., 1999).
23
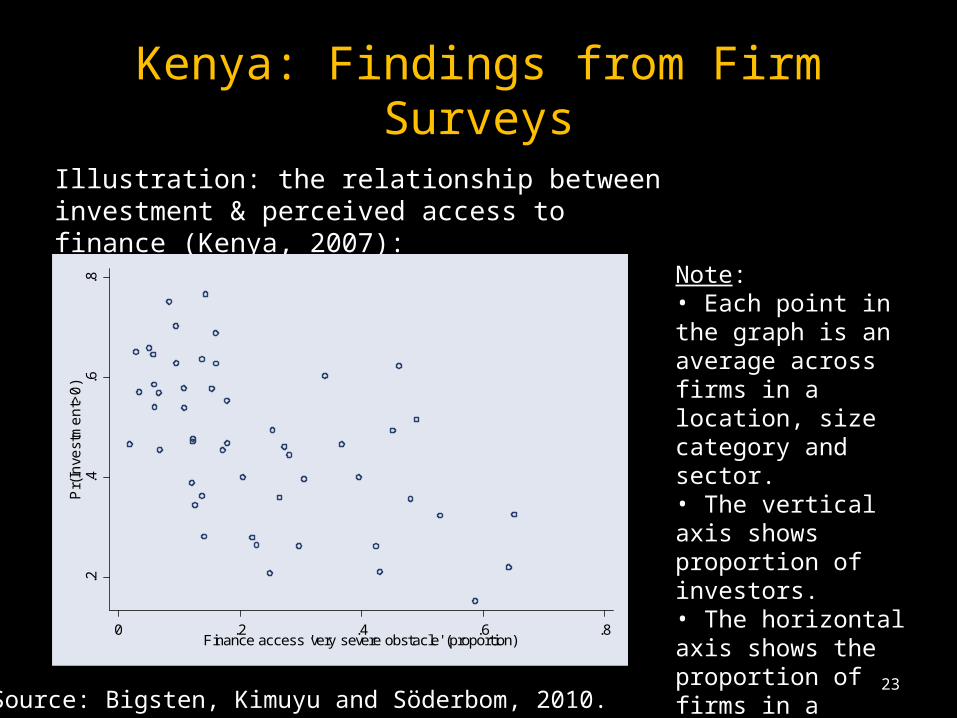
Kenya: Findings from Firm SurveysIllustration: the relationship between investment & perceived access to finance (Kenya, 2007):
Note: • Each point in the graph is an average across firms in a location, size category and sector. • The vertical axis shows proportion of investors.• The horizontal axis shows the proportion of firms in a particular location-size-sector cell that rate finance access as a "very severe obstacle".
Source: Bigsten, Kimuyu and Söderbom, 2010.
.2.4
.6.8
Pr(
Inve
stm
en
t>0
)
0 .2 .4 .6 .8Finance access 'very severe obstacle' (proportion)
24
Kenya: Findings from Firm Surveys• In recent years, the lending regime in Kenya has improved, lowering the direct costs of credit (note: prior to global financial crisis).
• We see this in the survey data; the proportion of firms reporting being financially constrained has fallen.
• Still, many firms still rate finance as a serious obstacle. Small firms in particular have a hard time accessing credit for start-up and expansion.
25
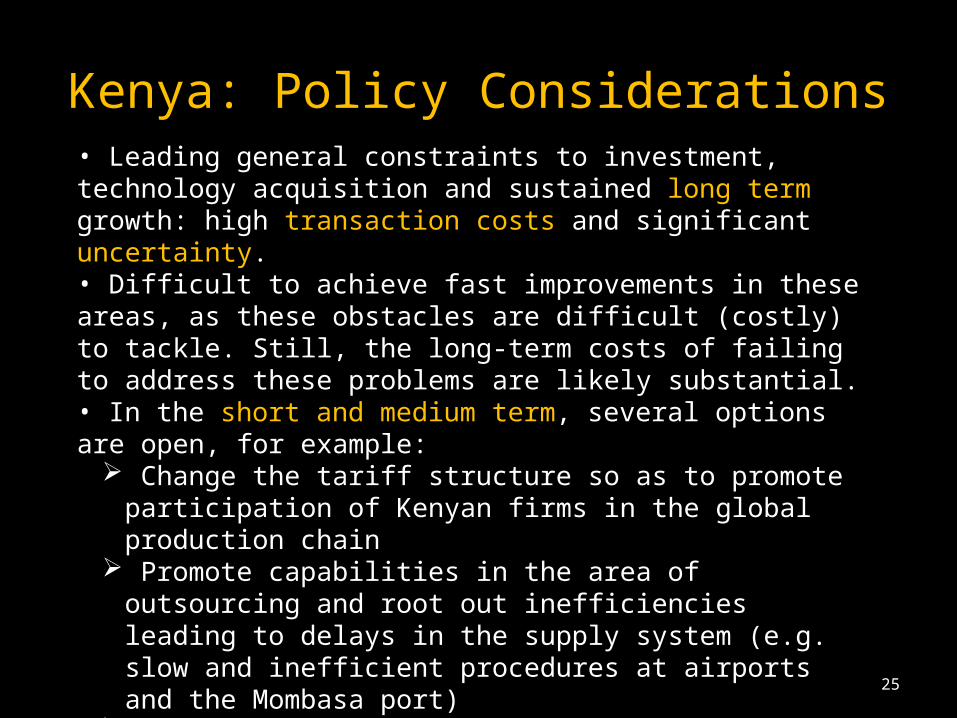
Kenya: Policy Considerations• Leading general constraints to investment, technology acquisition and sustained long term growth: high transaction costs and significant uncertainty. • Difficult to achieve fast improvements in these areas, as these obstacles are difficult (costly) to tackle. Still, the long-term costs of failing to address these problems are likely substantial. • In the short and medium term, several options are open, for example:
Change the tariff structure so as to promote participation of Kenyan firms in the global production chain
Promote capabilities in the area of outsourcing and root out inefficiencies leading to delays in the supply system (e.g. slow and inefficient procedures at airports and the Mombasa port)
Encourage the formation of modern industrial clusters, economizing on indirect costs and nurturing potential externalities
Promote exporting, e.g. by rejuvenating export processing zones.
26
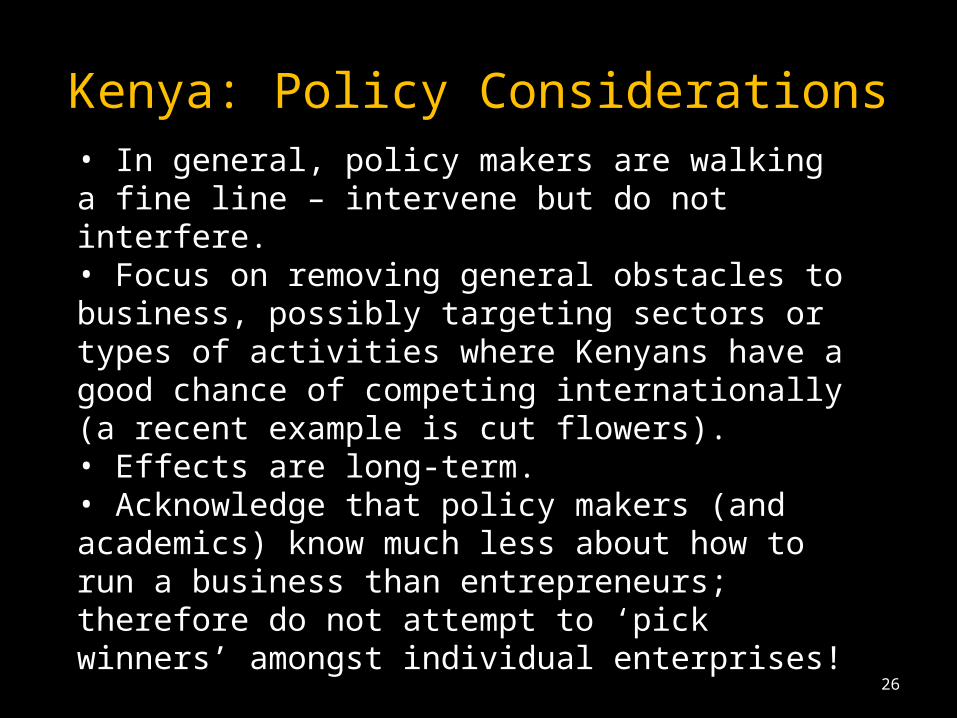
Kenya: Policy Considerations• In general, policy makers are walking a fine line – intervene but do not interfere.• Focus on removing general obstacles to business, possibly targeting sectors or types of activities where Kenyans have a good chance of competing internationally (a recent example is cut flowers). • Effects are long-term.• Acknowledge that policy makers (and academics) know much less about how to run a business than entrepreneurs; therefore do not attempt to ‘pick winners’ amongst individual enterprises!
27
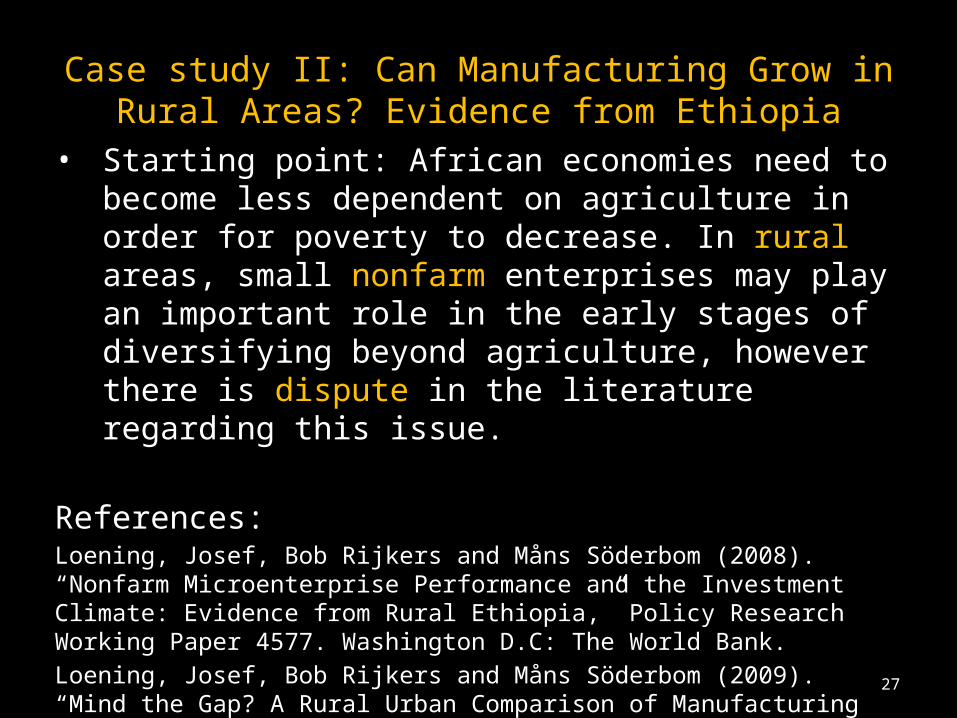
Case study II: Can Manufacturing Grow in Rural Areas? Evidence from Ethiopia
• Starting point: African economies need to become less dependent on agriculture in order for poverty to decrease. In rural areas, small nonfarm enterprises may play an important role in the early stages of diversifying beyond agriculture, however there is dispute in the literature regarding this issue.
References:Loening, Josef, Bob Rijkers and Måns Söderbom (2008). “Nonfarm Microenterprise Performance and the Investment Climate: Evidence from Rural Ethiopia,” Policy Research Working Paper 4577. Washington D.C: The World Bank.Loening, Josef, Bob Rijkers and Måns Söderbom (2009). “Mind the Gap? A Rural Urban Comparison of Manufacturing Firms," June 2009, Policy Research Working Paper 4946. Washington D.C: The World Bank.
28
Ethiopia: Manufacturing in Rural Areas?
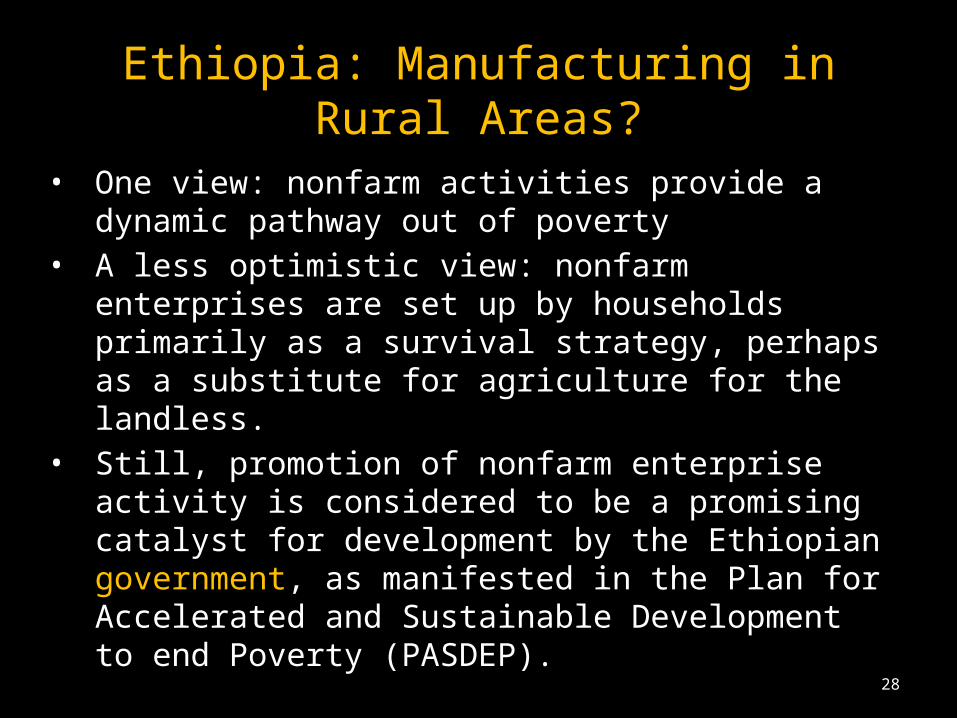
• One view: nonfarm activities provide a dynamic pathway out of poverty
• A less optimistic view: nonfarm enterprises are set up by households primarily as a survival strategy, perhaps as a substitute for agriculture for the landless.
• Still, promotion of nonfarm enterprise activity is considered to be a promising catalyst for development by the Ethiopian government, as manifested in the Plan for Accelerated and Sustainable Development to end Poverty (PASDEP).
29
Ethiopia: Manufacturing in Rural Areas?
• Understanding better the opportunities and constraints in Ethiopia’s rural nonfarm enterprise sector is the goal of this project.
• The empirical basis is the Rural Investment Climate Survey (RICS), implemented in the Amhara region by the World Bank in December 2006 and January 2007 in collaboration with Ethiopia’s Central Statistical Agency (CSA).
• Detailed data at the household, enterprise and community level.
30
Ethiopia: Manufacturing in Rural Areas?
• Main research questions:– How economically important are NFEs? – What are their main constraints? – Do NFEs provide a ‘dynamic pathway out of poverty’?
• We focus on:1) Participation2) Productivity3) Growth & Investment
• There is an important gender dimension in this context, which I will also touch upon.
31
Ethiopia: Manufacturing in Rural Areas?
Summary of findings:1. The nonfarm enterprise sector is sizeable, particularly
important for women, and plays and important role during the low season for agriculture, when alternative job opportunities are limited.
2. Returns to nonfarm enterprise employment are low on average. That is, these enterprises are not particularly profitable (relative to, say, the going rate for a casual worker in agriculture)
3. Profits are particularly low amongst female-headed enterprises.
32
Ethiopia: Manufacturing in Rural Areas?
Summary of findings:4. At the same time, women have much higher participation
rates than men, which attest to their marginalized position in the labor market.
5. Most enterprises are very small and rely almost exclusively on household members to provide the required labor inputs.
6. Few firms grow after startup – little investment or new employment.
7. Enterprise performance is affected by the localized nature of sales and limited market integration for nonfarm enterprises.

33
Ethiopia: Manufacturing in Rural Areas?
Summary of findings:8. Comparing the performance of small rural enterprises to that
of small urban enterprises we find some interesting results:• Urban firms operate in better integrated and more
competitive markets, where they have much better access to inputs. Urban firms are larger, more capital-intensive and produce more output per worker. Not very surprising, you might say.
• Distinguishing between enterprises in rural towns and enterprises in remote rural areas, we find that the underlying productivity does not differ if you compare firms in rural towns to those in large urban areas. But the productivity of rural/remote firms is much lower.

34
Ethiopia: Manufacturing in Rural Areas?
• The problem in rural towns is not that firms are (relatively) unproductive, but that there is very little growth.
• An optimistic way of interpreting this is as saying that rural towns is a promising location for small-scale manufacturers, but efforts need to be made to provide incentives for growth.
• We are back to the question as to what determines investment again. • Uncertainty, again? Interestingly, yes! Significant negative correlation
between the standard deviation in rainfall – a useful measure of risk here - and investment of nonfarm enterprises.
• Better market integration might help to reduce at least this type of risk (as access to a larger market reduces the adverse effect of local rainfall shocks). The good news coming out of the productivity analysis, is that firms in rural towns appear able to compete with firms in large urban areas.

35
Case study III: Industrialization Strategy in Ethiopia
• The International Growth Centre: A new research centre directed and organized from hubs at the LSE and Oxford, initiated by and funded by DFID. Comprises country offices across the developing world and a global network of partners. See www.internationalgrowthcentre.org.
• The mission: provide demand-led policy advice based on frontier research. • A team from the IGC has been set up this summer to provide analysis and
advice to the Ethiopian government regarding industrial strategy. • The initiative is coming from the Ethiopian government. The PM and his
economic adviser are very interested in the work we are initiating.• I’d like to give you an outline of this work, as I think this is an interesting
(new) model for how researchers, donors and policy makers can work together.
36
Ethiopia: Industrialization Strategy
• Context:• The economy has grown at about 10% annually since 2000.
Growth has been driven mainly by expansion of domestic agriculture and services. Due to the impact of the global recession, growth is projected to slow to 6.5% in 2008/09.
• Public investment a major factor behind this. The share of private investment in GDP is low (even by African standards); the share of private investment has fallen recently.
• Ethiopia’s imports are nearly 4 to 5 times the value of its exports, and – despite rapid growth of some non-traditional exports – imports are growing faster than exports.
37
Ethiopia: Industrialization Strategy
• Context:• Agriculture remains the dominant sector - 51% per cent of
GDP in 2007/08 and dominating exports • More than 80% of the population depends on various forms
agricultural production for their livelihoods. Vulnerability to climatic shocks and high food insecurity.
• With low wages, favorable demography and improved investment climate in recent years, one would expect Ethiopia to be competitive in labor-intensive, low-skill manufacturing products.
38
Ethiopia: Industrialization Strategy• Instead, Ethiopia has one of the smallest manufacturing sectors in
the world, and the sector’s share in GDP has been falling in recent years—from 5.7 percent in 2003/2003 to 4.7 percent in 2006/2007 – notwithstanding recent successes in footwear and garments.
• The proportion of Ethiopian businesses that are owned by foreign investors is low (only 7% in 2006) relative to low income countries (12%) or African averages (18%).
• During the last five years the government has assigned a high priority to industrial development, especially for exports. The investment climate has been improved over the last 5 years, and there is now considerable excitement about investment opportunities (e.g. in agribusiness). Incentives: free land, duty-free imports, exemption from profit taxes.
39
Ethiopia: Industrialization Strategy
• Purpose of the IGC research:• Despite these recent successes, however, questions remain
both within the government and in the business community concerning the government’s strategy for industrial development.
• Most new consumer and light manufacturing is likely to focus on the domestic market.
• Policy challenge: encourage entry and investment in manufacturing without sheltering inefficient industries behind protection and subsidies in the long run.

40
Ethiopia: Industrialization Strategy
• For the IGC, the first step in supporting the development of a second generation industrial development strategy is to invest in the information base needed to inform public decisions.
• Ethiopia is fortunate to be among the handful of African countries that have conducted repeated industrial censuses over the past ten years, but these data have only been partially analyzed.
• Answers to such key questions as: what capabilities do Ethiopian forms possess, where did they acquire these capabilities, how do they source their inputs and access their markets, are lacking. Specialist studies of key areas such as micro- and small-scale enterprises are also needed.

41
Ethiopia: Industrialization Strategy
• As an example of the type of research that will feed into the work on industrialization strategy, I’d like to talk briefly about ongoing research on the links between trade liberalization and firm performance in Ethiopia’s industrial sector.
• Reference: Bigsten, Arne, Mulu Gebreeyesus and Måns Söderbom (in progress) “Firm-Level Productivity and Trade Liberalization: Evidence from Ethiopia”.
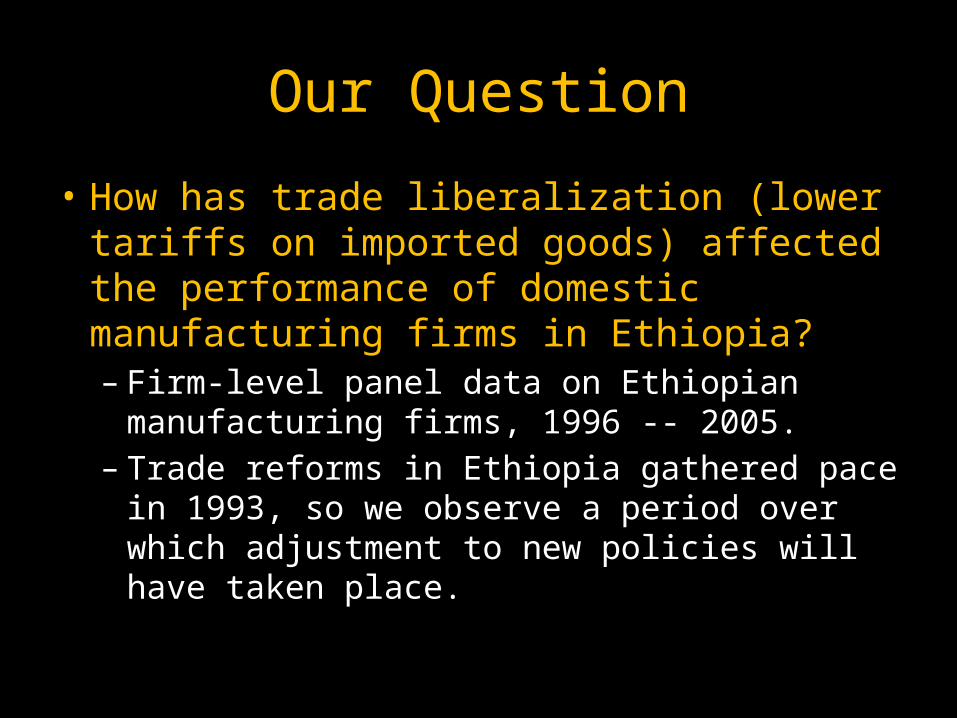
Our Question
• How has trade liberalization (lower tariffs on imported goods) affected the performance of domestic manufacturing firms in Ethiopia? – Firm-level panel data on Ethiopian manufacturing
firms, 1996 -- 2005. – Trade reforms in Ethiopia gathered pace in 1993,
so we observe a period over which adjustment to new policies will have taken place.
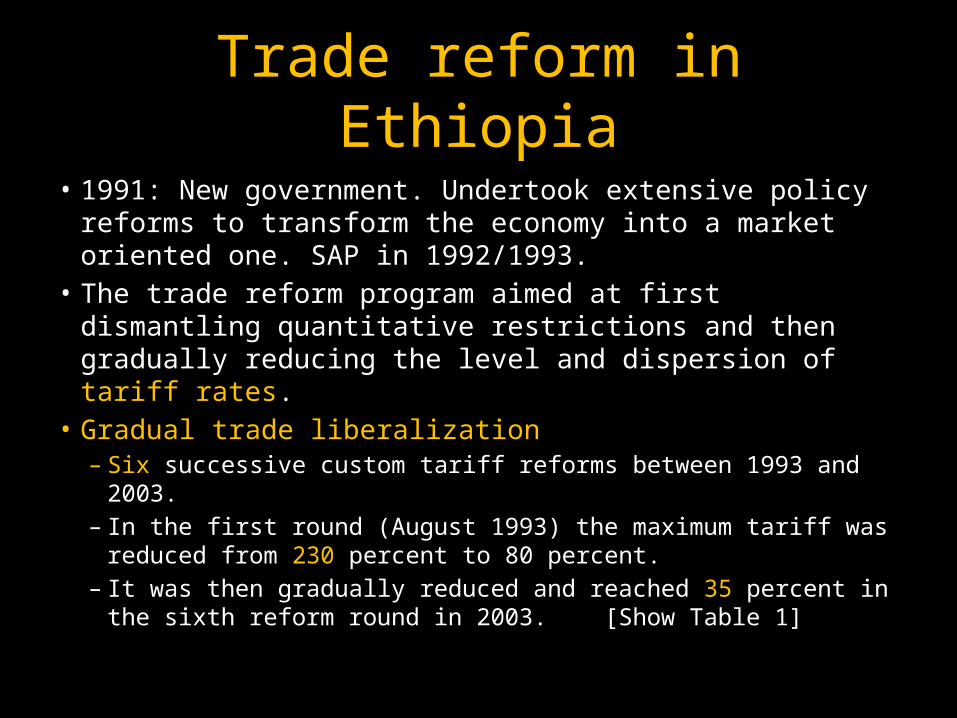
Trade reform in Ethiopia
• 1991: New government. Undertook extensive policy reforms to transform the economy into a market oriented one. SAP in 1992/1993.
• The trade reform program aimed at first dismantling quantitative restrictions and then gradually reducing the level and dispersion of tariff rates.
• Gradual trade liberalization – Six successive custom tariff reforms between 1993 and 2003. – In the first round (August 1993) the maximum tariff was reduced
from 230 percent to 80 percent. – It was then gradually reduced and reached 35 percent in the sixth
reform round in 2003. [Show Table 1]
Gradual Trade Liberalization
Tariff reform steps in Ethiopia (1993-2003)Rounds of reforms
Year Maximum tariff
Average tariff
Number of tariff bands
Before reform Before 1993 230 41.6 23 1st round August 1993 80 2nd round January 1996 60 3rd round ______ 1997 60 4th round January 1998 50 21.5 5th round December 1998 40 19.5 6th round January 2003 35 17.5 6 Source: MoFED (Study on Ethiopia’s Industrial sector Effective Rate of Protection, December, 2006 – MoFED mimeo)
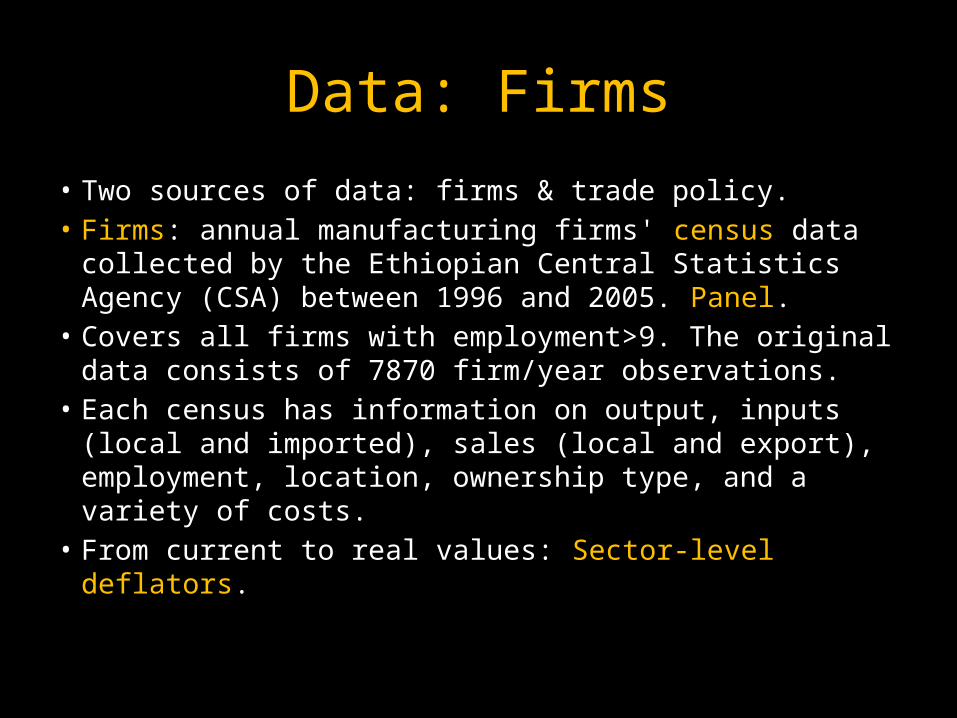
Data: Firms
• Two sources of data: firms & trade policy.• Firms: annual manufacturing firms' census data
collected by the Ethiopian Central Statistics Agency (CSA) between 1996 and 2005. Panel.
• Covers all firms with employment>9. The original data consists of 7870 firm/year observations.
• Each census has information on output, inputs (local and imported), sales (local and export), employment, location, ownership type, and a variety of costs.
• From current to real values: Sector-level deflators.

Summary Statistics: Firms
Number of plants, employment and output
Number of plants
growth of
plants 1997-2004
total employment
Sector share of total
employment
growth emplo-yment 1997-2004
mean employ-yment
median employment
1997 2004 1997 2004 1997 2004 1997 2004 1997 2004
Food 179 294 64.2 26926 31238 28.1 29.7 16.0 150 106 21 24.5 Textile 59 73 23.7 31839 26677 33.2 25.4 -16.2 540 365 51 58 Leather 61 62 1.6 8226 7575 8.6 7.2 -7.9 135 122 27 49.5 Wood 132 185 40.2 5680 6822 5.9 6.5 20.1 43 37 20.5 16 Paper 46 73 58.7 5122 6929 5.3 6.6 35.3 111 95 24.5 35 chemical 64 87 35.9 6124 9306 6.4 8.9 52.0 96 107 36 59 Non-metallic 89 119 33.7 6745 9170 7.0 8.7 36.0 76 77 17 19 Fabricated metal 72 103 43.1 4377 6594 4.6 6.3 50.7 61 64 20.5 30 Total 703 997 41.8 95992 105095 9..5 137 105 23 26
Data: Tariffs and Imports• Data on tariffs were collected from the Ethiopian Customs Authority
(ECA) from 1997 to 2006. Raw data on values of imported goods and tariffs paid for commodities transformed from 6-digit level to 4-digit ISIC product codes. Enables us to match the trade data with the firm-level data.
• Weighted average tariff rate in the sector - calculated from import duties collected and the CIF value of imports, and the average is weighted by the value of imports of each commodity.
• About 40 sectors are represented in the firm data, and tariffs vary quite a bit across sectors, and over time. Hence, a lot of variation in key explanatory variable.
• Import penetration ratio in the sector - defined as the share of imports in the total domestic market for that sector.
Tariffs and Firm-Level Outcomes
• (1): Import penetration ratio rises as tariffs are cut• (2): Value-added per worker rises as tariffs are cut• (3)-(6): No statistically significant correlation with entry rates, exit rates,
investment or hiring.• (7): Evidence of a nonlinear relationship between tariffs and value-added per
worker – see graph on the next slide.
Table 4. The Correlates of Tariffs
(1) (2) (3) (4) (5) (6) (7) IPR log V/L Entry rate Exit rate D log K D log L log V/L Tariff -0.545 -1.216 -0.048 0.067 -0.030 -0.040 5.045 (3.72)** (2.71)** (0.61) (0.88) (0.54) (0.56) (3.28)** Tariff squared -13.586 (4.63)** Observations 346 348 348 309 344 344 348 R-squared 0.07 0.03 0.08 0.09 0.07 0.03 0.06 Note: Year dummies and a constant included in all regressions. Robust t-statistics in parentheses. * significant at 5% level; ** significant at 1% level

Tariffs and Value-Added per Worker
• Suggests that it is primarily high tariffs that have adverse effects on productivity. To the extent that moderate tariffs provide an important source of revenue, and abstracting from consumer welfare implications (which with our data we cannot say anything about), our results thus suggest that tariffs set just above zero may be justifiable from an economic point of view.
• At moderate tariff levels (10-20%) there is no evidence that (small) changes to the tariff rate would affect firm-level productivity. • However, at high tariff levels we document statistically highly significant, and economically important, positive effects of lowering tariff rates on productivity

50
Summing Up• Performance in the private non-farm sector in Africa must improve
– agriculture and aid will not solve the continent’s development problem.
• By analyzing firm-level data, we can learn about certain relationships and mechanisms in Africa’s industrial sector that would be masked in aggregate data.
• I would argue such research can be useful for policy makers. • I’ve tried to give you an overview of some of the key findings, plus I
have reviewed new policy-oriented work that I am involved in.

51
Summing Up• Of course, much more can be done. Plans:
– Interdisciplinary: The development economics unit in Gothenburg and a group within the Department of Political Science are joining forces to better understand the nexus between economic development and the development of institutions. Micro/macro.
– Gender: Work by an Ethiopian PhD student at Gothenburg is in progress, to try to better understand the role of gender in the development of the non-farm sector in rural Ethiopia.
– New approach: The experimental approach to documenting causal mechanisms has become very popular in the development economics literature in the last decade. Hasn’t caught on that much in the literature on private sector performance – this can be developed too.
Thank you for your attention