Embed Size (px)
Citation preview
Tahoe Donner Association2019 Budget – 3rd Workshop
Board, Finance Committee, Members Meeting 10/19/2018Prepared by Michael Salmon, Director of Finance and Accounting, 10/12/2018
Budget Workshop 10/19/2018 1
FC Draft 10/9/2018
2019 Budget – 3rd Workshop ‐ Agenda today 10/19
• 0900–0910 Educational and Other Information Keynotes• 0910‐0915 5yr Trend and other salient information points• 0910‐0930 Changes Detail since prior draft by Fund• 0930‐1000 Capital Funds• 1000‐1130 Operating Fund• 1130‐Noon Next Steps – Board Direction
Budget Workshop 10/19/2018 2
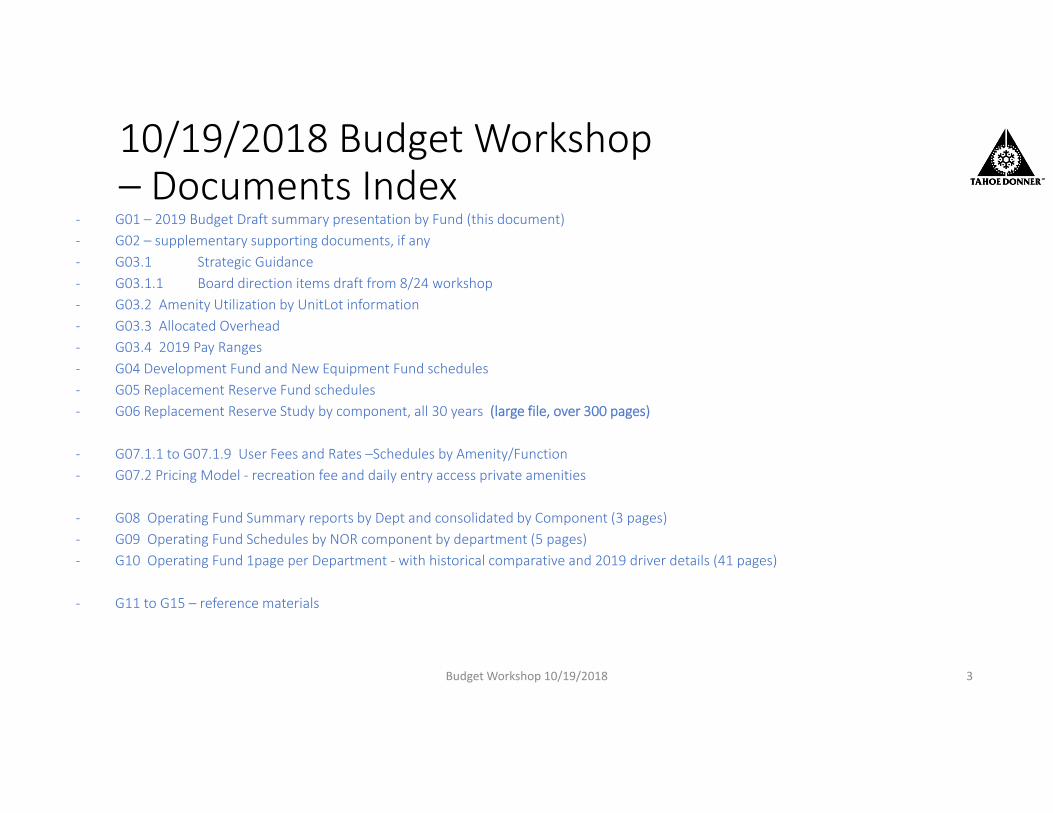
10/19/2018 Budget Workshop – Documents Index
Budget Workshop 10/19/2018 3
‐ G01 – 2019 Budget Draft summary presentation by Fund (this document)‐ G02 – supplementary supporting documents, if any‐ G03.1 Strategic Guidance‐ G03.1.1 Board direction items draft from 8/24 workshop‐ G03.2 Amenity Utilization by UnitLot information‐ G03.3 Allocated Overhead‐ G03.4 2019 Pay Ranges‐ G04 Development Fund and New Equipment Fund schedules‐ G05 Replacement Reserve Fund schedules‐ G06 Replacement Reserve Study by component, all 30 years (large file, over 300 pages)
‐ G07.1.1 to G07.1.9 User Fees and Rates –Schedules by Amenity/Function‐ G07.2 Pricing Model ‐ recreation fee and daily entry access private amenities
‐ G08 Operating Fund Summary reports by Dept and consolidated by Component (3 pages)‐ G09 Operating Fund Schedules by NOR component by department (5 pages)‐ G10 Operating Fund 1page per Department ‐ with historical comparative and 2019 driver details (41 pages)
‐ G11 to G15 – reference materials
Training Keynote ‐ Leadership
Budget Workshop 10/19/2018 4
Leadership is a process of social influence, which maximizes the efforts of others, towards the achievement of a goal. @Kruse http://www.forbes.com/sites/kevinkruse/2013/04/09/what‐is‐leadership
Leaders bring out the best in individuals and of the group collectively, while also driving a higher level of performance than usually would be achieved. Effective leaders drive innovation, and they encourage their people to think strategically and creatively, while also reaching for new limits. In the world of business, an effective leader drives higher profits, and ultimately, increases the value and bottom line of the business as a whole.….• Aligning the team for success or failure? Providing adequate resources?• Motivating or demotivating?• Pride in the workplace or turmoil?• Silo decisions or improving business as a whole?
Training Keynote ‐ Organizational Agility
Budget Workshop 10/19/2018 5
The principles behind organizational agility are well‐known by now. Agile groups can thrive in an unpredictable, rapidly changing environment. They are both stable and dynamic. They focus on customers, fluidly adapt to environmental changes, and are open, inclusive, and nonhierarchical; they evolve continually and embrace uncertainty and ambiguity.It sounds so easy, doesn’t it? Yet even as agile concepts have taken hold, the average large firm reorganizes every two to three years, and the average reorganization takes more than 18 months to implement. Agility doesn’t mean constant reorganization or constant flux, though. It means building a structure that allows people to react in real time.To organize for our current age of urgency, companies have to take the principles behind agile and use them a little differently. Let’s call them the three “insteads”: Instead of making a decision when you have 90 percent of the information, make it when you have 70 percent. Instead of imposing decisions from top down, encourage real‐time decisions across your organization, decoupled from title or rank. Instead of relying on charismatic leaders who get results by force, recognize that leadership can come from anyone, and is earned not appointed.McKinsey&Company/McKinsey Agile Tribe
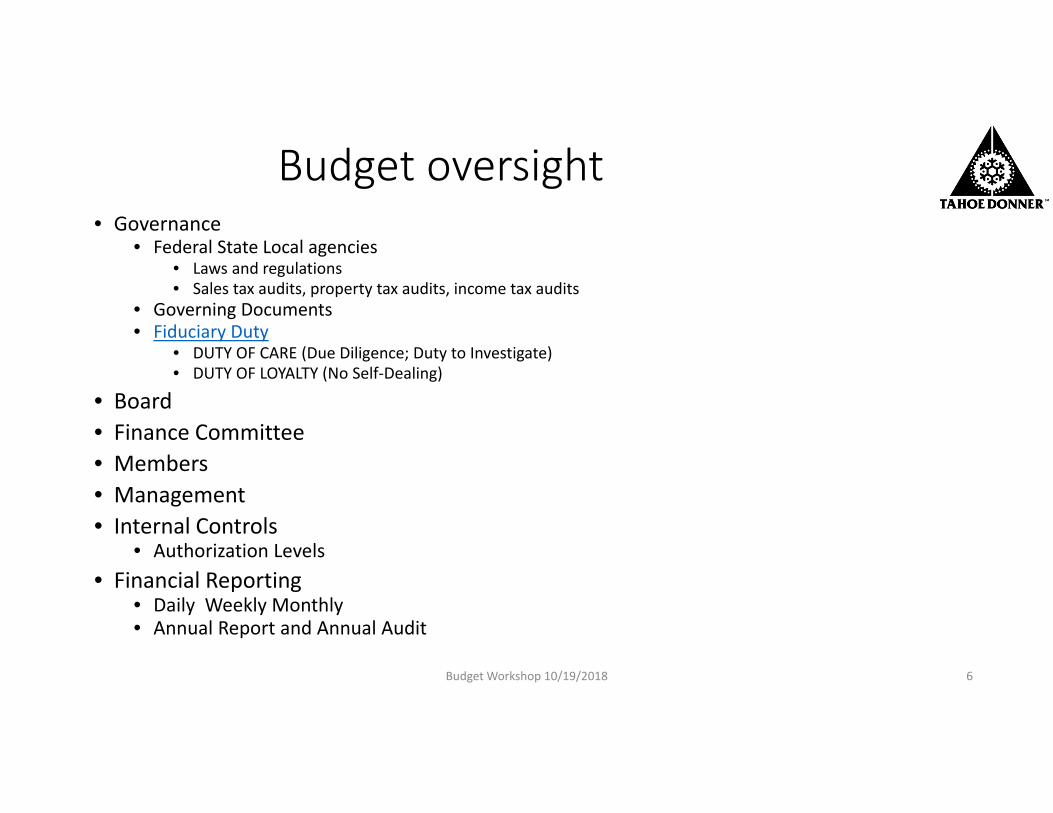
Budget oversight• Governance
• Federal State Local agencies• Laws and regulations• Sales tax audits, property tax audits, income tax audits
• Governing Documents• Fiduciary Duty
• DUTY OF CARE (Due Diligence; Duty to Investigate)• DUTY OF LOYALTY (No Self‐Dealing)
• Board• Finance Committee• Members• Management• Internal Controls
• Authorization Levels• Financial Reporting
• Daily Weekly Monthly• Annual Report and Annual Audit
Budget Workshop 10/19/2018 6
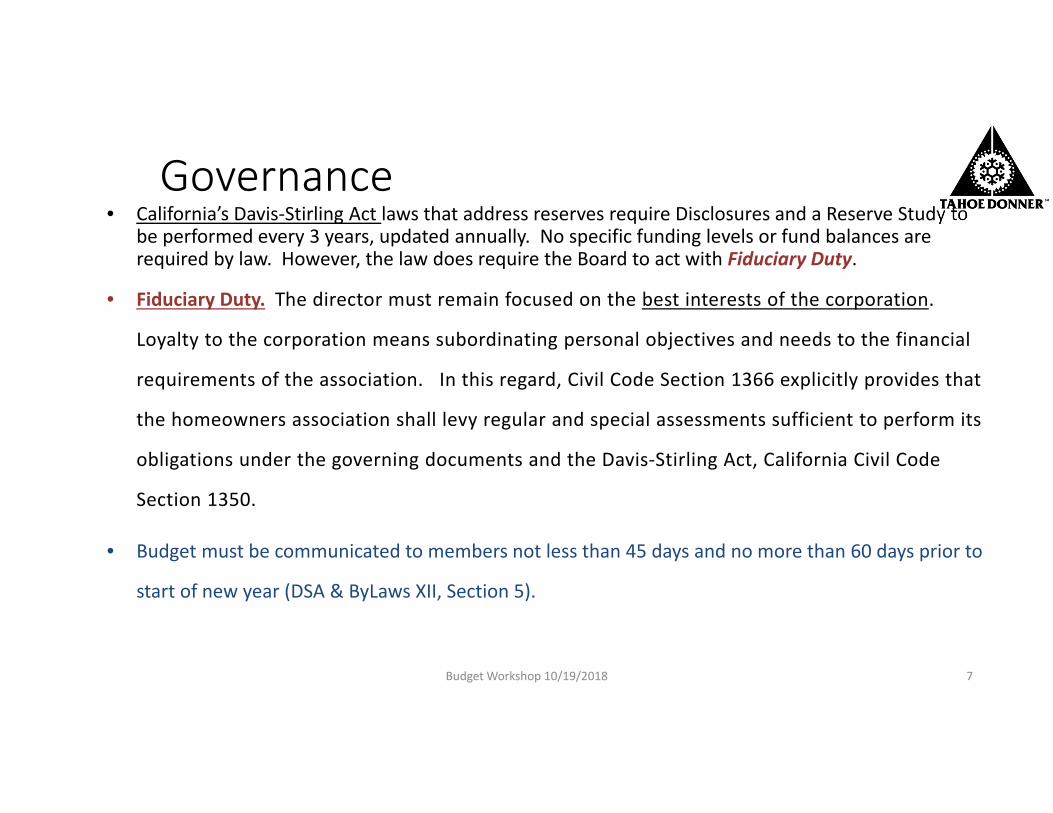
Governance• California’s Davis‐Stirling Act laws that address reserves require Disclosures and a Reserve Study to
be performed every 3 years, updated annually. No specific funding levels or fund balances are required by law. However, the law does require the Board to act with Fiduciary Duty.
• Fiduciary Duty. The director must remain focused on the best interests of the corporation.
Loyalty to the corporation means subordinating personal objectives and needs to the financial
requirements of the association. In this regard, Civil Code Section 1366 explicitly provides that
the homeowners association shall levy regular and special assessments sufficient to perform its
obligations under the governing documents and the Davis‐Stirling Act, California Civil Code
Section 1350.
• Budget must be communicated to members not less than 45 days and no more than 60 days prior to
start of new year (DSA & ByLaws XII, Section 5).
Budget Workshop 10/19/2018 7
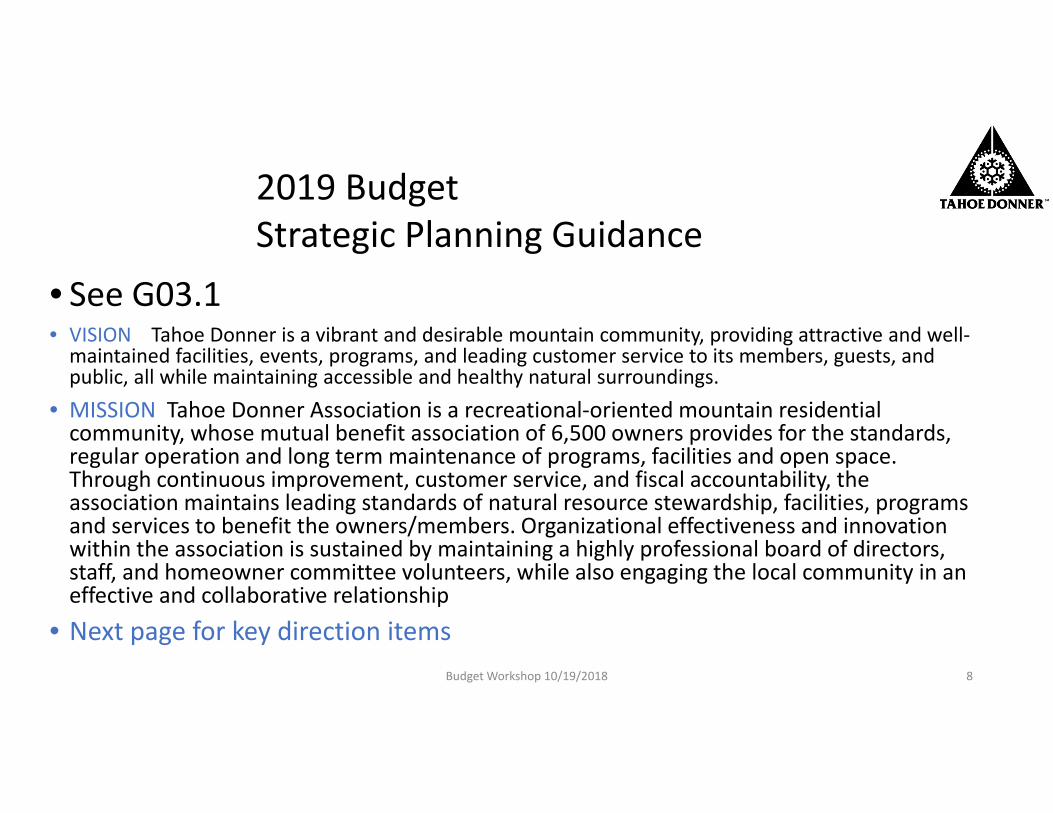
• See G03.1 • VISION Tahoe Donner is a vibrant and desirable mountain community, providing attractive and well‐maintained facilities, events, programs, and leading customer service to its members, guests, and public, all while maintaining accessible and healthy natural surroundings.
• MISSION Tahoe Donner Association is a recreational‐oriented mountain residential community, whose mutual benefit association of 6,500 owners provides for the standards, regular operation and long term maintenance of programs, facilities and open space. Through continuous improvement, customer service, and fiscal accountability, the association maintains leading standards of natural resource stewardship, facilities, programs and services to benefit the owners/members. Organizational effectiveness and innovation within the association is sustained by maintaining a highly professional board of directors, staff, and homeowner committee volunteers, while also engaging the local community in an effective and collaborative relationship
• Next page for key direction itemsBudget Workshop 10/19/2018 8
2019 Budget Strategic Planning Guidance
2019 Budget ‐ Board strategic Planning Guidance
• Aggressively address Peak Periods overcrowding of all facilities, primarily via pricing
• Improve financial performance across all amenities to improve net results• Calculate and Report Allocated Overhead• Factor new STR compliance/monitor initiative• Add third chipping crew to Forestry, begin shift from 8yr to 6yr defensible space cycle
• STR Compliance, Enforcement
Budget Workshop 10/19/2018 9
Budget Workshop 10/19/2018 10
• What is Budget at Tahoe Donner Association• An annual Plan of Revenues and Expenditures by Fund.
• Based on documented key assumptions; macro and micro• A plan of the resources allocation amongst a diverse range of membership driven priorities. Balancing regulatory and initiatives, as well as a known aging infrastructure
• Guidance = Strategic Planning Guidance• A balanced budget, addressing strategic initiatives, while ensuring consistent level of membership services
and offerings.• SPG did NOT direct to ‘cut from your resources to lower or hold annual assessment flat’
• Achievable, setting the company up for success? Providing adequate resources to succeed?• Stretch beyond achievable? Cutting resources just to meet other goals and objectives?• Properly saving for the future capital needs of the association?• Holding the assessment flat to hold it flat? Are we adequately saving for the future capital needs?• Cutting operating resources to fund capital needs was NOT SPG.
• Would this serve membership as a whole?• There is no smoking gun of excessive costs growth (see other slides)
• There has been known cost growth (and revenue growth) changes including CA min wage and FED ACA and strategic initiatives, as well as, changes in the company. Past years droughts and workers compensation costs, capital assessment increases and other drivers each year are well documented.
• Examples – Bikeworks is new (revenue and costs growth) Trails – focused execution of member driven trails master plan imitative
Budget Workshop 10/19/2018 11
•Cost cutting assumes past has had uncontrolled growth and inefficiencies
•The reality is balanced growth from known drivers and not sacrifice service levels for cost cutting sake
•A balance Budget achieving strategic objectives; not a cost cutting drill for sake of cost cutting to hold AA or fund capital needs based on past under‐savings of capital
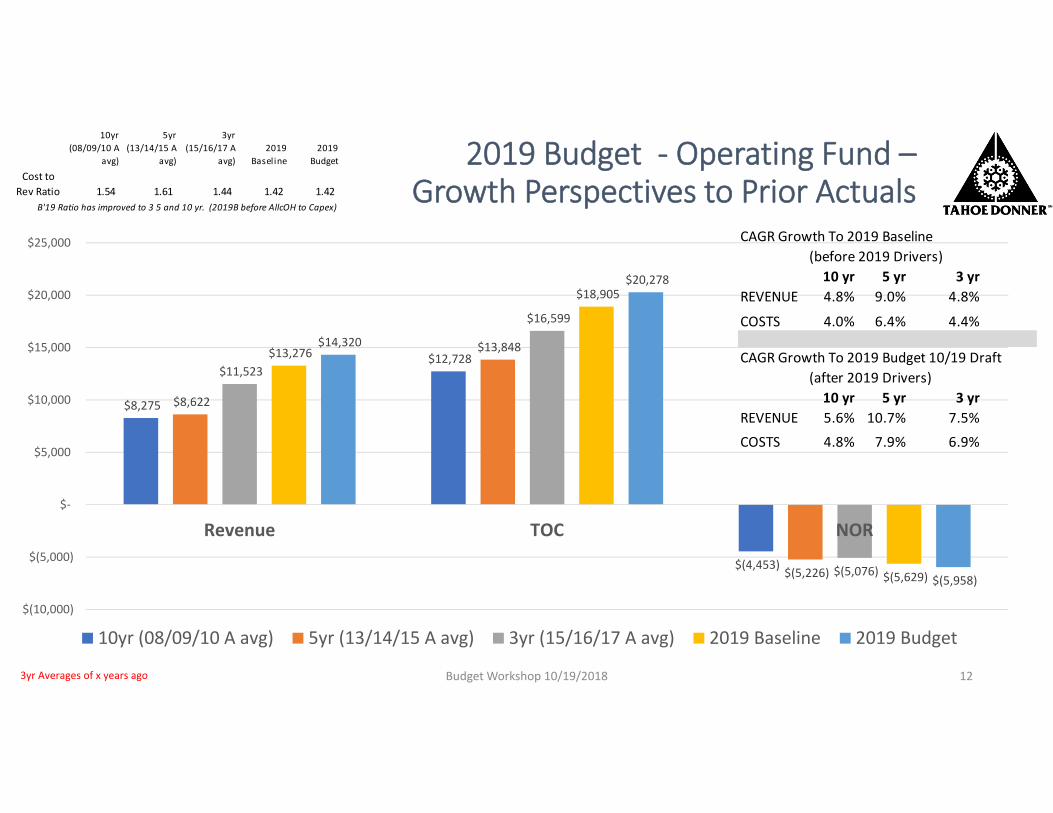
2019 Budget ‐ Operating Fund –Growth Perspectives to Prior Actuals
Budget Workshop 10/19/2018 12
$8,275
$12,728
$(4,453)
$8,622
$13,848
$(5,226)
$11,523
$16,599
$(5,076)
$13,276
$18,905
$(5,629)
$14,320
$20,278
$(5,958)
$(10,000)
$(5,000)
$‐
$5,000
$10,000
$15,000
$20,000
$25,000
Revenue TOC NOR
10yr (08/09/10 A avg) 5yr (13/14/15 A avg) 3yr (15/16/17 A avg) 2019 Baseline 2019 Budget
3yr Averages of x years ago
CAGR Growth To 2019 Baseline (before 2019 Drivers)10 yr 5 yr 3 yr
REVENUE 4.8% 9.0% 4.8%
COSTS 4.0% 6.4% 4.4%
CAGR Growth To 2019 Budget 10/19 Draft(after 2019 Drivers)10 yr 5 yr 3 yr
REVENUE 5.6% 10.7% 7.5%
COSTS 4.8% 7.9% 6.9%
10yr (08/09/10 A
avg)
5yr (13/14/15 A
avg)
3yr (15/16/17 A
avg)2019
Baseline2019
Budget
1.54 1.61 1.44 1.42 1.42 B'19 Ratio has improved to 3 5 and 10 yr. (2019B before AllcOH to Capex)
Cost to Rev Ratio
2019 Budget ‐ 5 years Perspective
Budget Workshop 10/19/2018 13
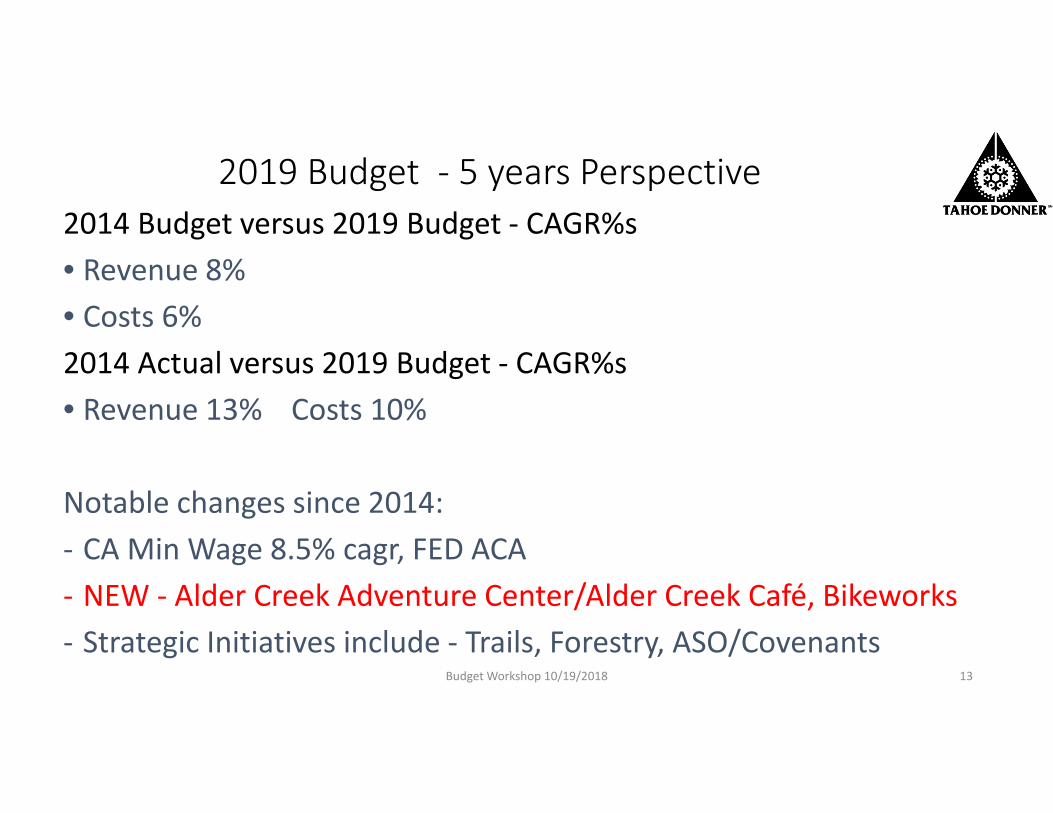
2014 Budget versus 2019 Budget ‐ CAGR%s• Revenue 8%• Costs 6%2014 Actual versus 2019 Budget ‐ CAGR%s• Revenue 13% Costs 10%
Notable changes since 2014:‐ CA Min Wage 8.5% cagr, FED ACA‐ NEW ‐ Alder Creek Adventure Center/Alder Creek Café, Bikeworks‐ Strategic Initiatives include ‐ Trails, Forestry, ASO/Covenants
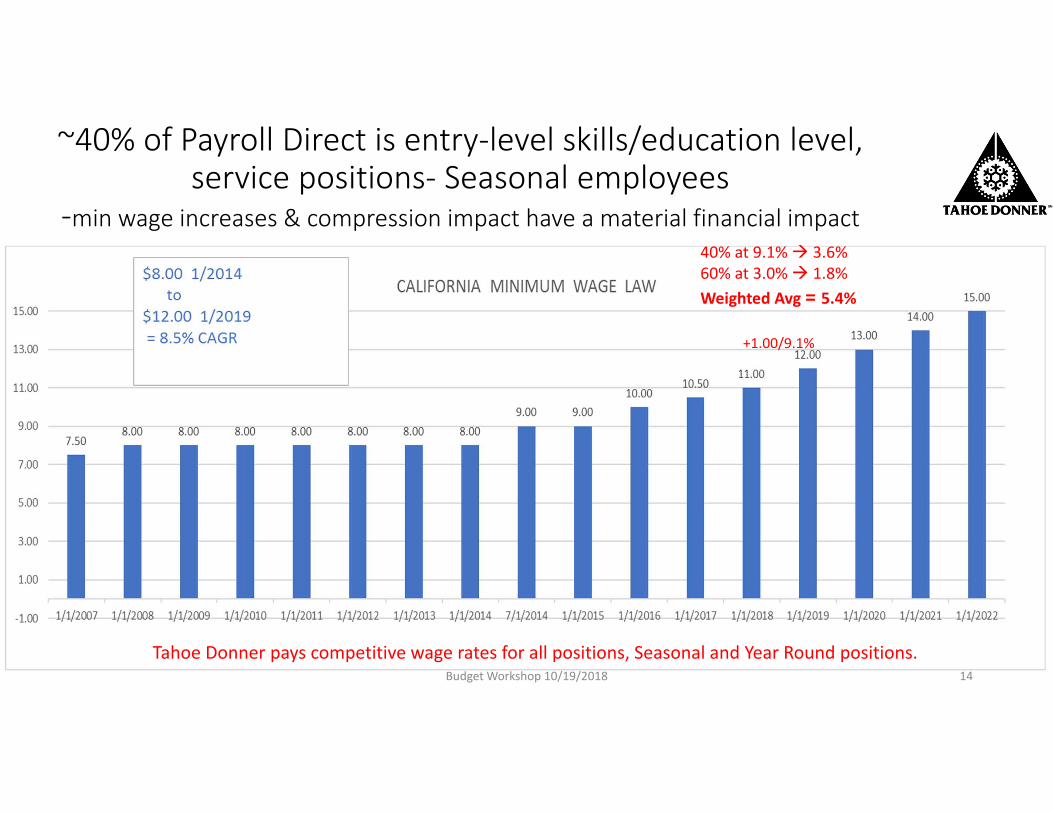
~40% of Payroll Direct is entry‐level skills/education level, service positions‐ Seasonal employees
‐min wage increases & compression impact have a material financial impact
Budget Workshop 10/19/2018 14
40% at 9.1% 3.6%60% at 3.0% 1.8%Weighted Avg = 5.4%
+1.00/9.1%
Tahoe Donner pays competitive wage rates for all positions, Seasonal and Year Round positions.
2019 Budget ‐ 5 years Perspective
Budget Workshop 10/19/2018 15
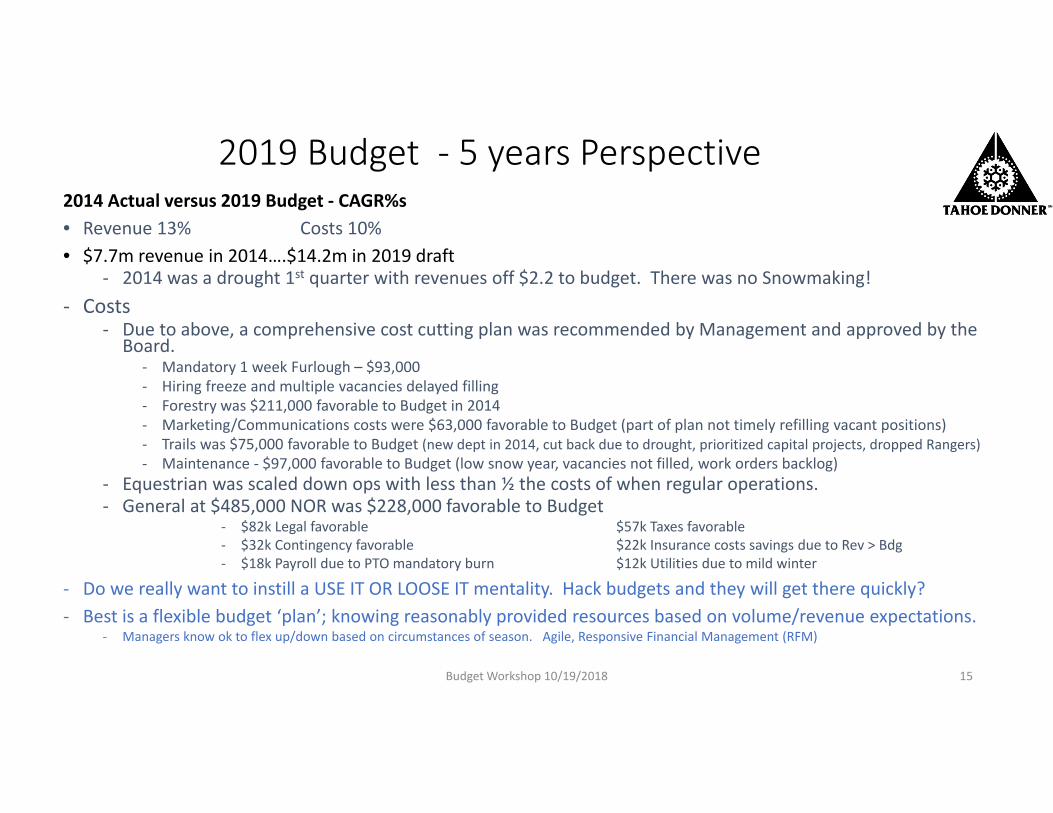
2014 Actual versus 2019 Budget ‐ CAGR%s• Revenue 13% Costs 10% • $7.7m revenue in 2014….$14.2m in 2019 draft
‐ 2014 was a drought 1st quarter with revenues off $2.2 to budget. There was no Snowmaking!‐ Costs
‐ Due to above, a comprehensive cost cutting plan was recommended by Management and approved by the Board.
‐ Mandatory 1 week Furlough – $93,000‐ Hiring freeze and multiple vacancies delayed filling‐ Forestry was $211,000 favorable to Budget in 2014‐ Marketing/Communications costs were $63,000 favorable to Budget (part of plan not timely refilling vacant positions)‐ Trails was $75,000 favorable to Budget (new dept in 2014, cut back due to drought, prioritized capital projects, dropped Rangers)‐ Maintenance ‐ $97,000 favorable to Budget (low snow year, vacancies not filled, work orders backlog)
‐ Equestrian was scaled down ops with less than ½ the costs of when regular operations.‐ General at $485,000 NOR was $228,000 favorable to Budget
‐ $82k Legal favorable $57k Taxes favorable‐ $32k Contingency favorable $22k Insurance costs savings due to Rev > Bdg‐ $18k Payroll due to PTO mandatory burn $12k Utilities due to mild winter
‐ Do we really want to instill a USE IT OR LOOSE IT mentality. Hack budgets and they will get there quickly?‐ Best is a flexible budget ‘plan’; knowing reasonably provided resources based on volume/revenue expectations.
‐ Managers know ok to flex up/down based on circumstances of season. Agile, Responsive Financial Management (RFM)
2019 Budget ‐ Full Time Benefited Employees
Budget Workshop 10/19/2018 16
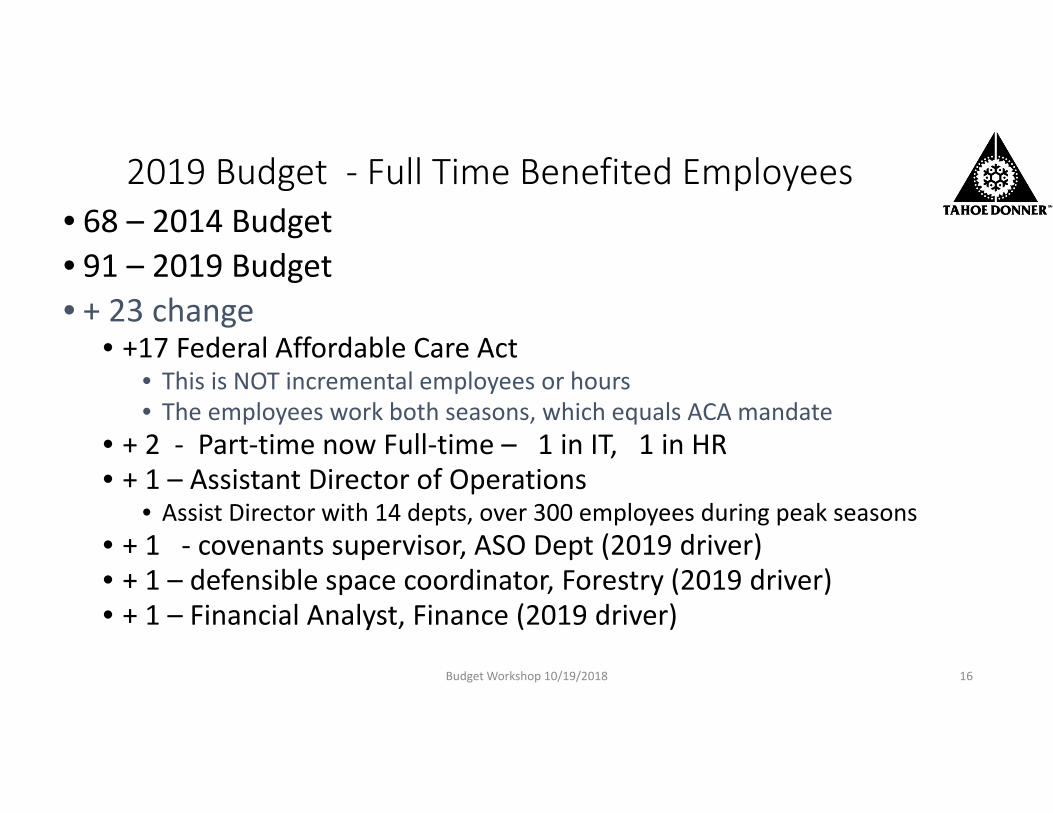
• 68 – 2014 Budget• 91 – 2019 Budget• + 23 change
• +17 Federal Affordable Care Act• This is NOT incremental employees or hours• The employees work both seasons, which equals ACA mandate
• + 2 ‐ Part‐time now Full‐time – 1 in IT, 1 in HR• + 1 – Assistant Director of Operations
• Assist Director with 14 depts, over 300 employees during peak seasons• + 1 ‐ covenants supervisor, ASO Dept (2019 driver)• + 1 – defensible space coordinator, Forestry (2019 driver)• + 1 – Financial Analyst, Finance (2019 driver)
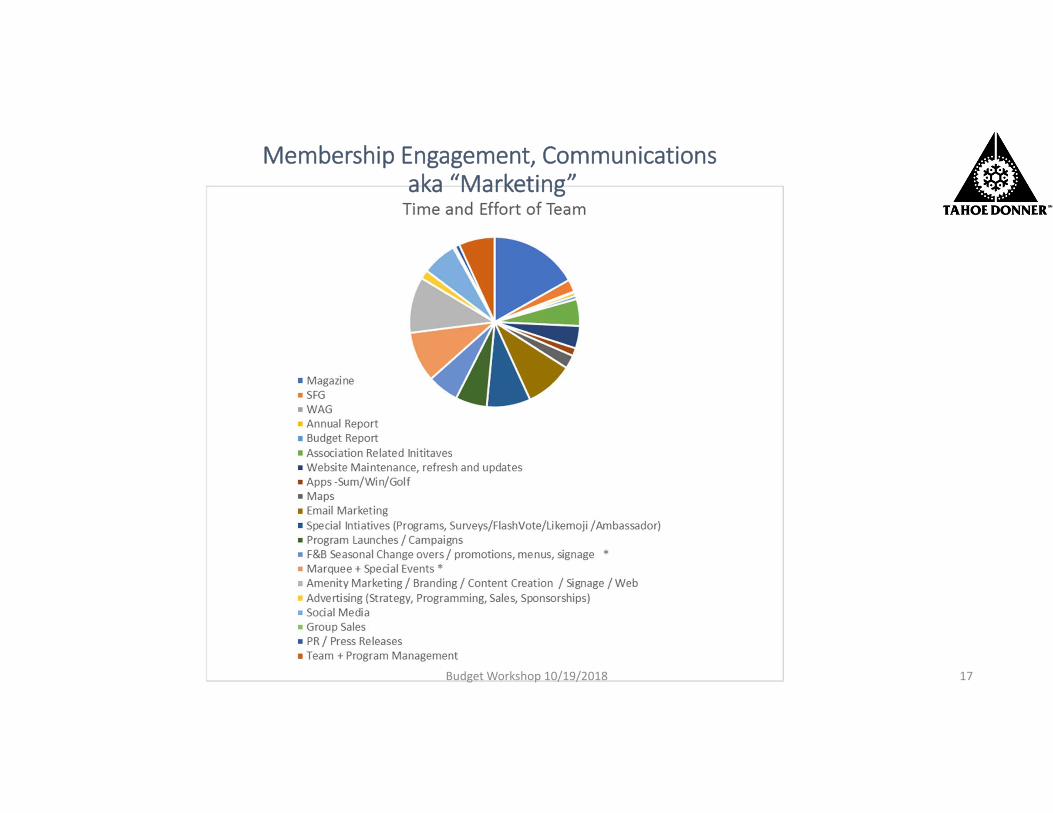
Membership Engagement, Communicationsaka “Marketing”
Budget Workshop 10/19/2018 17
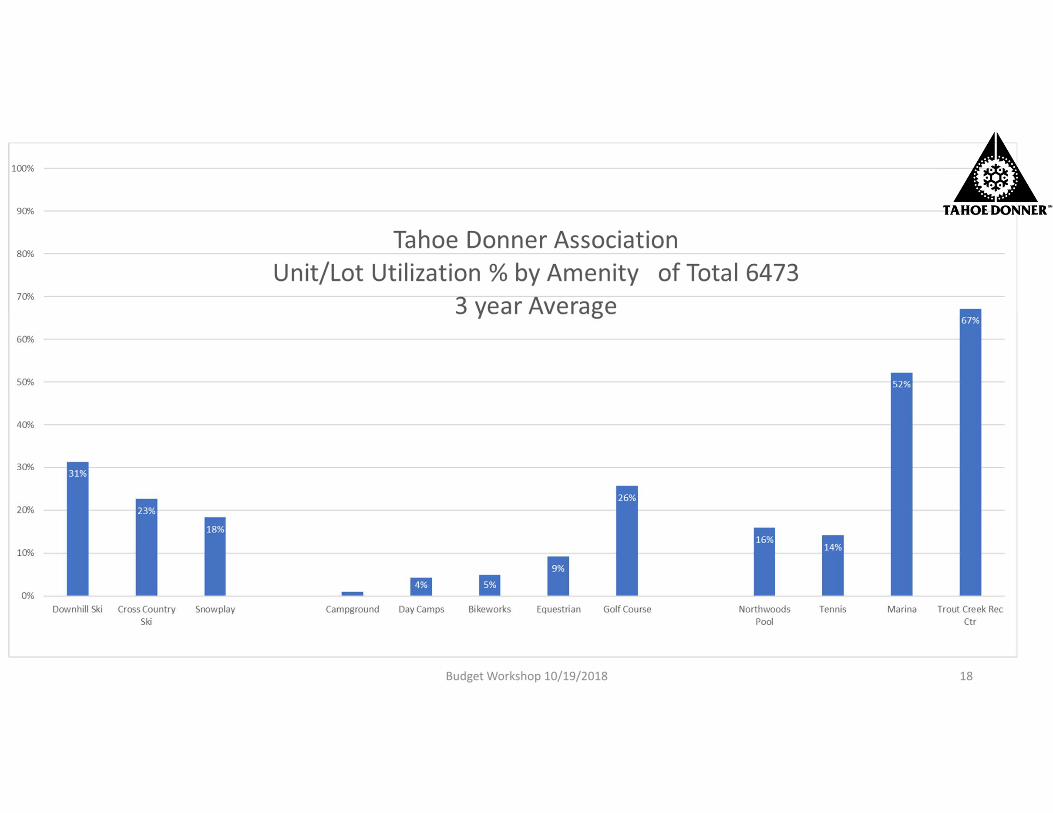
Budget Workshop 10/19/2018 18
Budget Workshop 10/19/2018 19
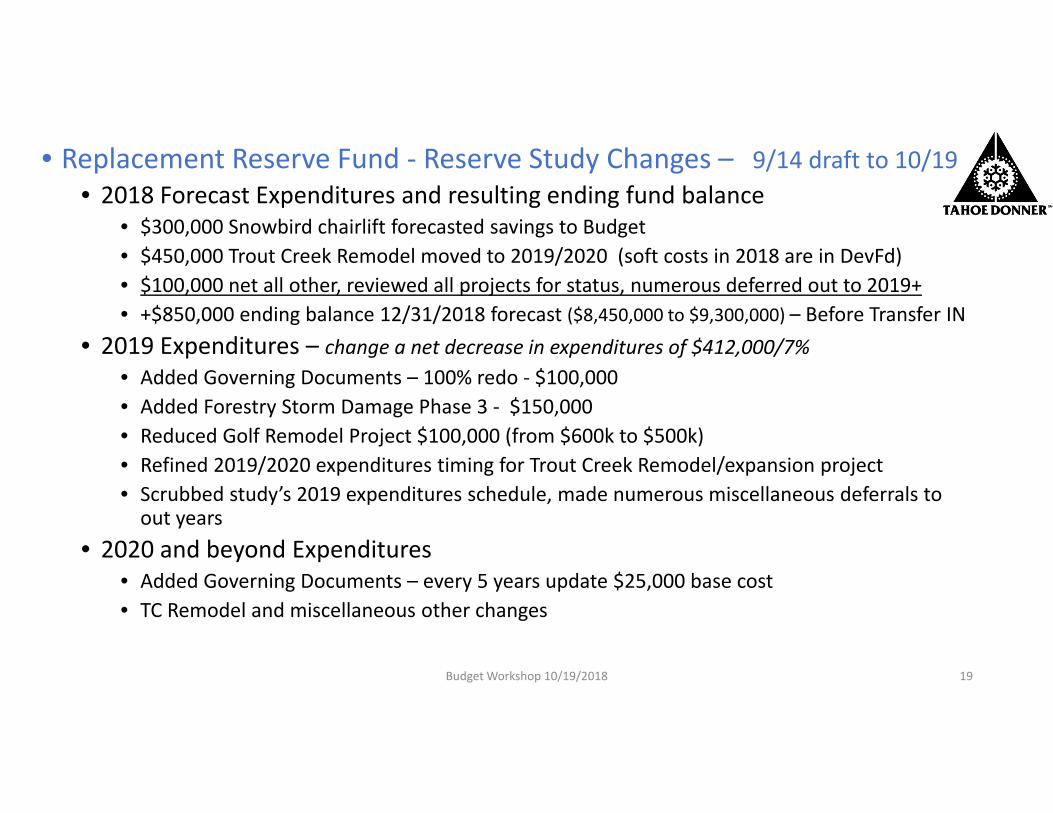
• Replacement Reserve Fund ‐ Reserve Study Changes – 9/14 draft to 10/19• 2018 Forecast Expenditures and resulting ending fund balance
• $300,000 Snowbird chairlift forecasted savings to Budget• $450,000 Trout Creek Remodel moved to 2019/2020 (soft costs in 2018 are in DevFd)• $100,000 net all other, reviewed all projects for status, numerous deferred out to 2019+• +$850,000 ending balance 12/31/2018 forecast ($8,450,000 to $9,300,000) – Before Transfer IN
• 2019 Expenditures – change a net decrease in expenditures of $412,000/7%• Added Governing Documents – 100% redo ‐ $100,000• Added Forestry Storm Damage Phase 3 ‐ $150,000 • Reduced Golf Remodel Project $100,000 (from $600k to $500k)• Refined 2019/2020 expenditures timing for Trout Creek Remodel/expansion project• Scrubbed study’s 2019 expenditures schedule, made numerous miscellaneous deferrals to out years
• 2020 and beyond Expenditures• Added Governing Documents – every 5 years update $25,000 base cost• TC Remodel and miscellaneous other changes
Budget Workshop 10/19/2018 20
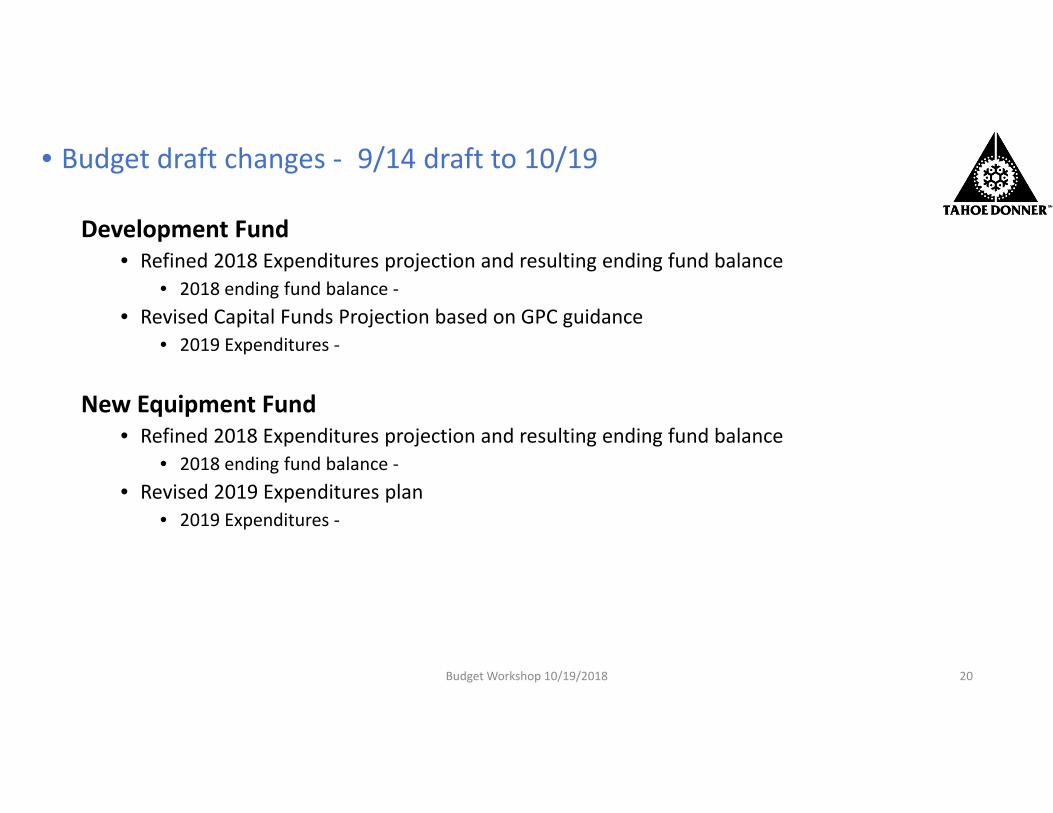
• Budget draft changes ‐ 9/14 draft to 10/19
Development Fund• Refined 2018 Expenditures projection and resulting ending fund balance
• 2018 ending fund balance ‐• Revised Capital Funds Projection based on GPC guidance
• 2019 Expenditures ‐
New Equipment Fund• Refined 2018 Expenditures projection and resulting ending fund balance
• 2018 ending fund balance ‐• Revised 2019 Expenditures plan
• 2019 Expenditures ‐
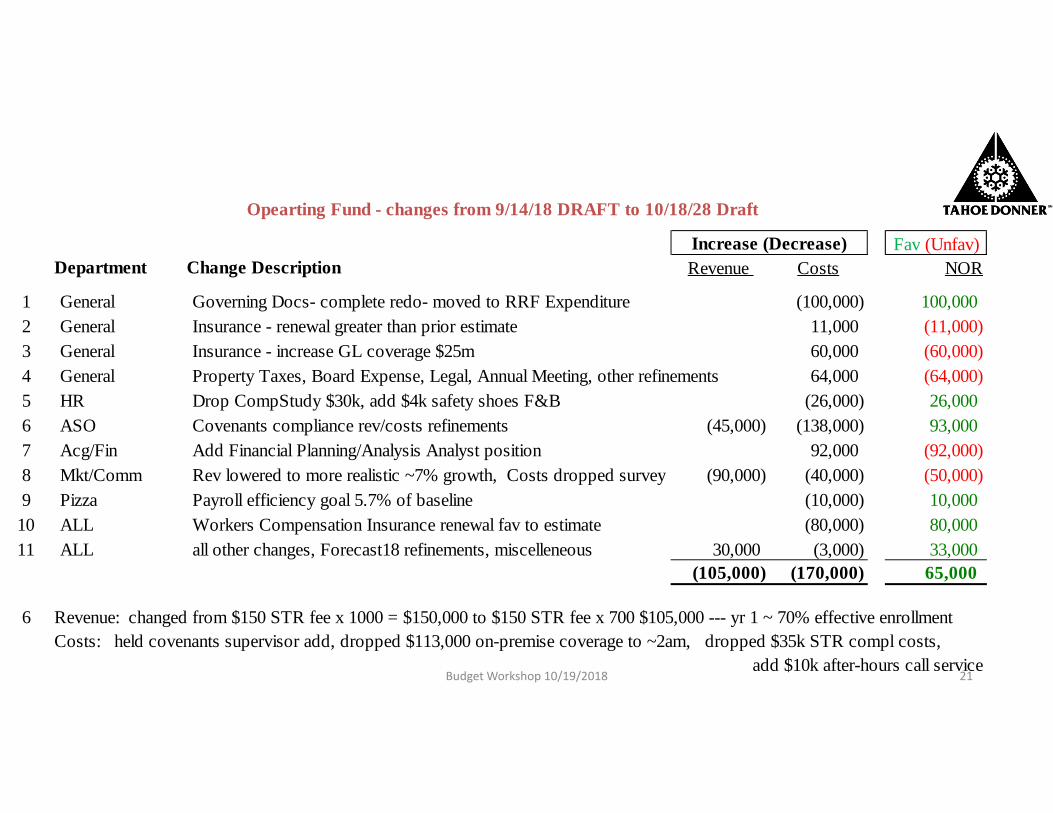
Budget Workshop 10/19/2018 21
Fav (Unfav)Department Change Description Revenue Costs NOR
1 General Governing Docs- complete redo- moved to RRF Expenditure (100,000) 100,0002 General Insurance - renewal greater than prior estimate 11,000 (11,000)3 General Insurance - increase GL coverage $25m 60,000 (60,000)4 General Property Taxes, Board Expense, Legal, Annual Meeting, other refinements 64,000 (64,000)5 HR Drop CompStudy $30k, add $4k safety shoes F&B (26,000) 26,0006 ASO Covenants compliance rev/costs refinements (45,000) (138,000) 93,0007 Acg/Fin Add Financial Planning/Analysis Analyst position 92,000 (92,000)8 Mkt/Comm Rev lowered to more realistic ~7% growth, Costs dropped survey (90,000) (40,000) (50,000)9 Pizza Payroll efficiency goal 5.7% of baseline (10,000) 10,000
10 ALL Workers Compensation Insurance renewal fav to estimate (80,000) 80,00011 ALL all other changes, Forecast18 refinements, miscelleneous 30,000 (3,000) 33,000
(105,000) (170,000) 65,000
6 Revenue: changed from $150 STR fee x 1000 = $150,000 to $150 STR fee x 700 $105,000 --- yr 1 ~ 70% effective enrollmentCosts: held covenants supervisor add, dropped $113,000 on-premise coverage to ~2am, dropped $35k STR compl costs,
add $10k after-hours call service
Increase (Decrease)
Opearting Fund - changes from 9/14/18 DRAFT to 10/18/28 Draft
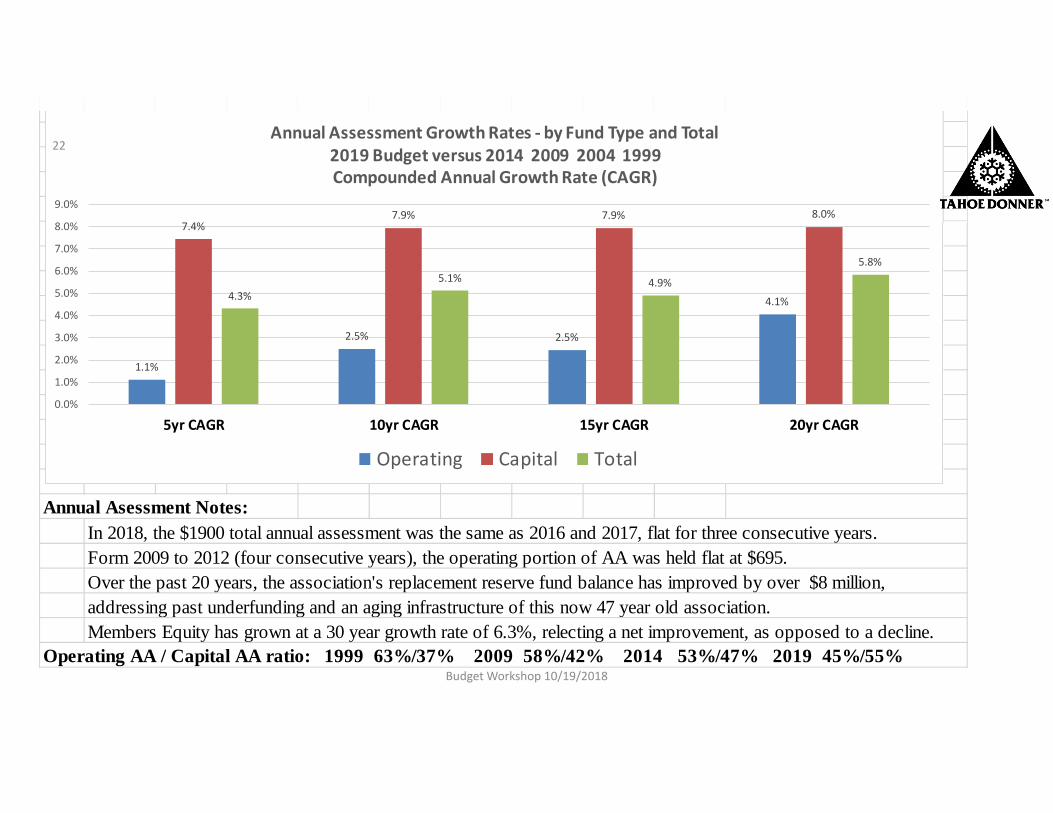
Annual Asessment Notes:In 2018, the $1900 total annual assessment was the same as 2016 and 2017, flat for three consecutive years.Form 2009 to 2012 (four consecutive years), the operating portion of AA was held flat at $695.Over the past 20 years, the association's replacement reserve fund balance has improved by over $8 million,addressing past underfunding and an aging infrastructure of this now 47 year old association.Members Equity has grown at a 30 year growth rate of 6.3%, relecting a net improvement, as opposed to a decline.
Operating AA / Capital AA ratio: 1999 63%/37% 2009 58%/42% 2014 53%/47% 2019 45%/55%
7.4%7.9% 7.9% 8.0%
1.1%
2.5% 2.5%
4.1%4.3%5.1% 4.9%
5.8%
0.0%
1.0%
2.0%
3.0%
4.0%
5.0%
6.0%
7.0%
8.0%
9.0%
5yr CAGR 10yr CAGR 15yr CAGR 20yr CAGR
Annual Assessment Growth Rates ‐ by Fund Type and Total2019 Budget versus 2014 2009 2004 1999Compounded Annual Growth Rate (CAGR)
Operating Capital Total
Budget Workshop 10/19/2018
22
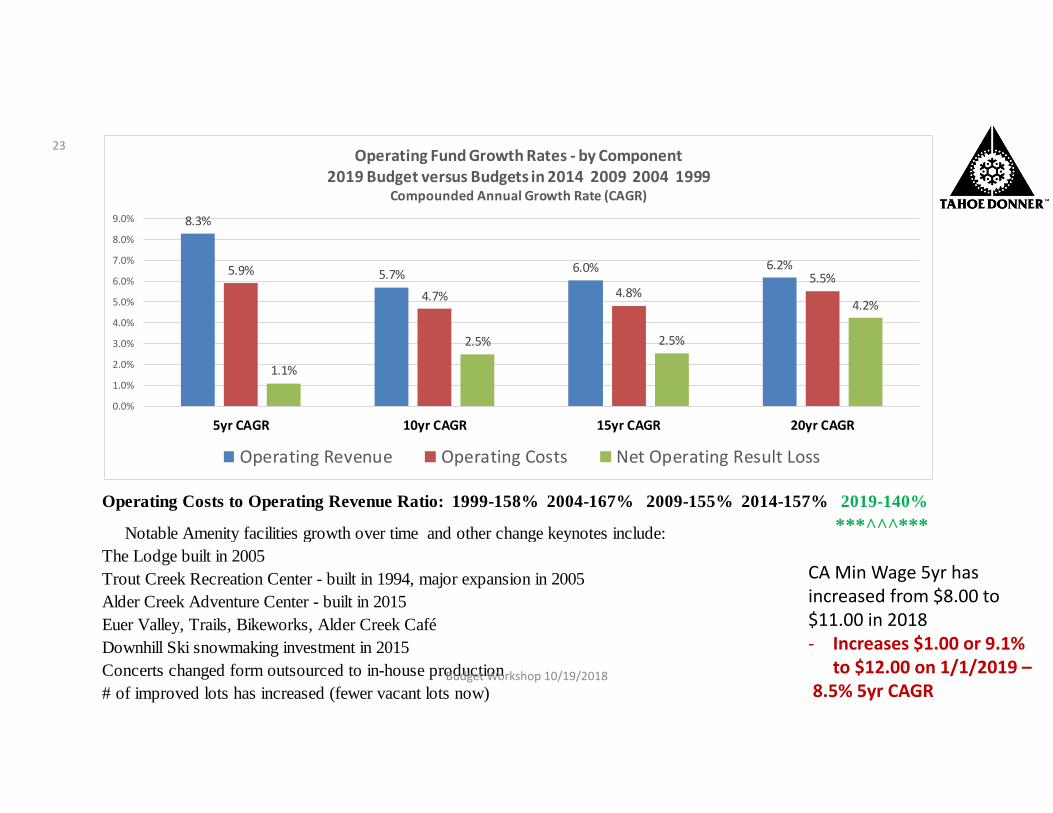
Operating Costs to Operating Revenue Ratio: 1999-158% 2004-167% 2009-155% 2014-157% 2019-140%
Notable Amenity facilities growth over time and other change keynotes include: ***^^^*** The Lodge built in 2005Trout Creek Recreation Center - built in 1994, major expansion in 2005Alder Creek Adventure Center - built in 2015Euer Valley, Trails, Bikeworks, Alder Creek CaféDownhill Ski snowmaking investment in 2015Concerts changed form outsourced to in-house production# of improved lots has increased (fewer vacant lots now)
8.3%
5.7% 6.0% 6.2%5.9%
4.7% 4.8%5.5%
1.1%
2.5% 2.5%
4.2%
0.0%
1.0%
2.0%
3.0%
4.0%
5.0%
6.0%
7.0%
8.0%
9.0%
5yr CAGR 10yr CAGR 15yr CAGR 20yr CAGR
Operating Fund Growth Rates ‐ by Component2019 Budget versus Budgets in 2014 2009 2004 1999
Compounded Annual Growth Rate (CAGR)
Operating Revenue Operating Costs Net Operating Result Loss
Budget Workshop 10/19/2018
23
CA Min Wage 5yr has increased from $8.00 to $11.00 in 2018‐ Increases $1.00 or 9.1%
to $12.00 on 1/1/2019 –8.5% 5yr CAGR
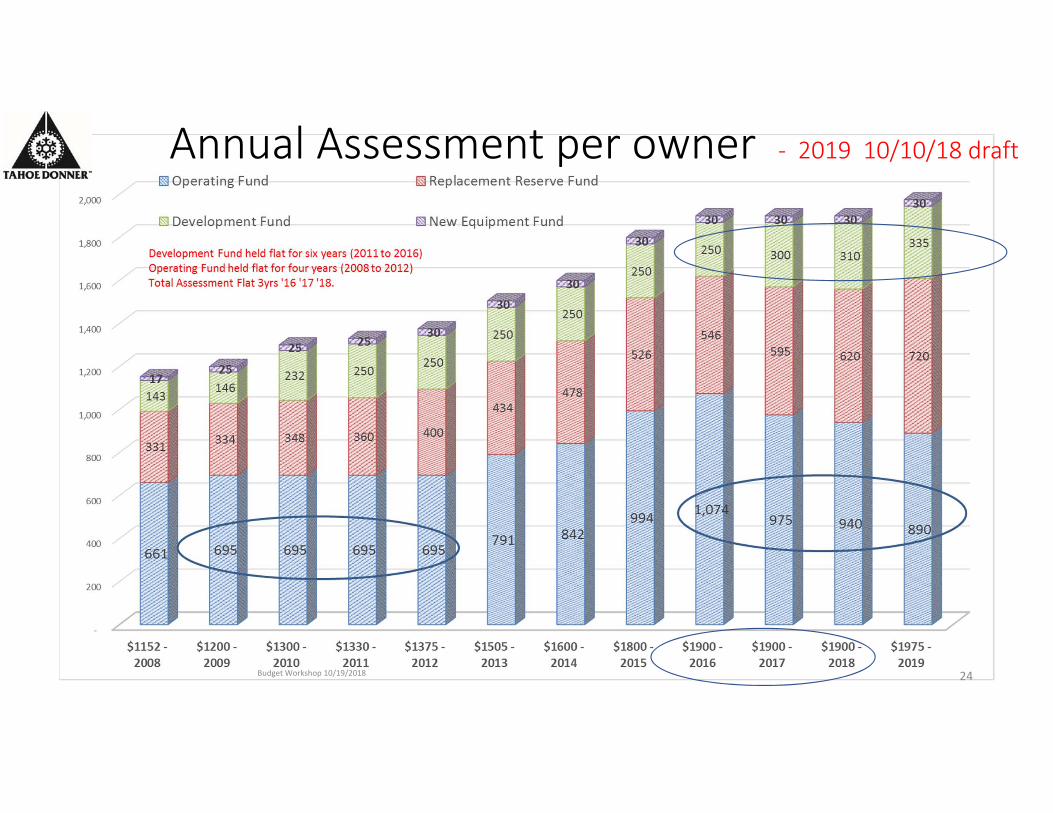
Annual Assessment per owner ‐ 2019 10/10/18 draft
Budget Workshop 10/19/2018 24
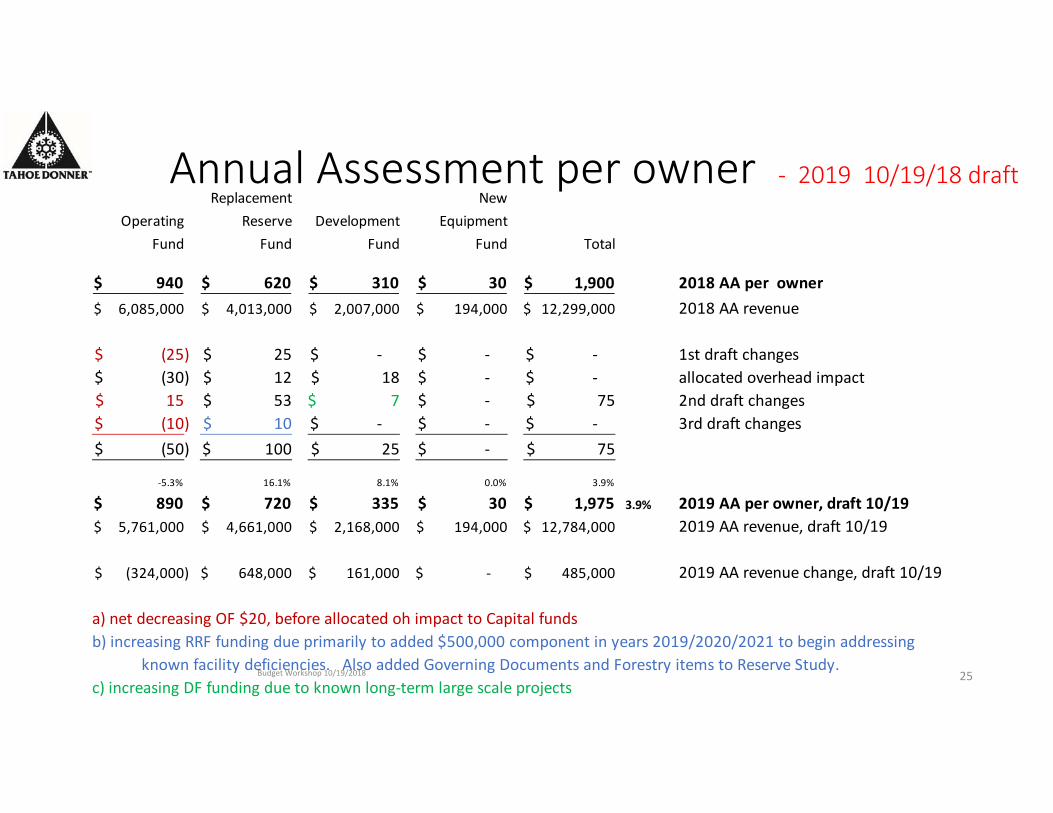
Replacement NewOperating Reserve Development Equipment
Fund Fund Fund Fund Total
940$ 620$ 310$ 30$ 1,900$ 2018 AA per owner6,085,000$ 4,013,000$ 2,007,000$ 194,000$ 12,299,000$ 2018 AA revenue
(25)$ 25$ ‐$ ‐$ ‐$ 1st draft changes(30)$ 12$ 18$ ‐$ ‐$ allocated overhead impact15$ 53$ 7$ ‐$ 75$ 2nd draft changes(10)$ 10$ ‐$ ‐$ ‐$ 3rd draft changes(50)$ 100$ 25$ ‐$ 75$
‐5.3% 16.1% 8.1% 0.0% 3.9%
890$ 720$ 335$ 30$ 1,975$ 3.9% 2019 AA per owner, draft 10/195,761,000$ 4,661,000$ 2,168,000$ 194,000$ 12,784,000$ 2019 AA revenue, draft 10/19
(324,000)$ 648,000$ 161,000$ ‐$ 485,000$ 2019 AA revenue change, draft 10/19
a) net decreasing OF $20, before allocated oh impact to Capital fundsb) increasing RRF funding due primarily to added $500,000 component in years 2019/2020/2021 to begin addressing known facility deficiencies. Also added Governing Documents and Forestry items to Reserve Study.c) increasing DF funding due to known long‐term large scale projects
Annual Assessment per owner ‐ 2019 10/19/18 draft
Budget Workshop 10/19/2018 25
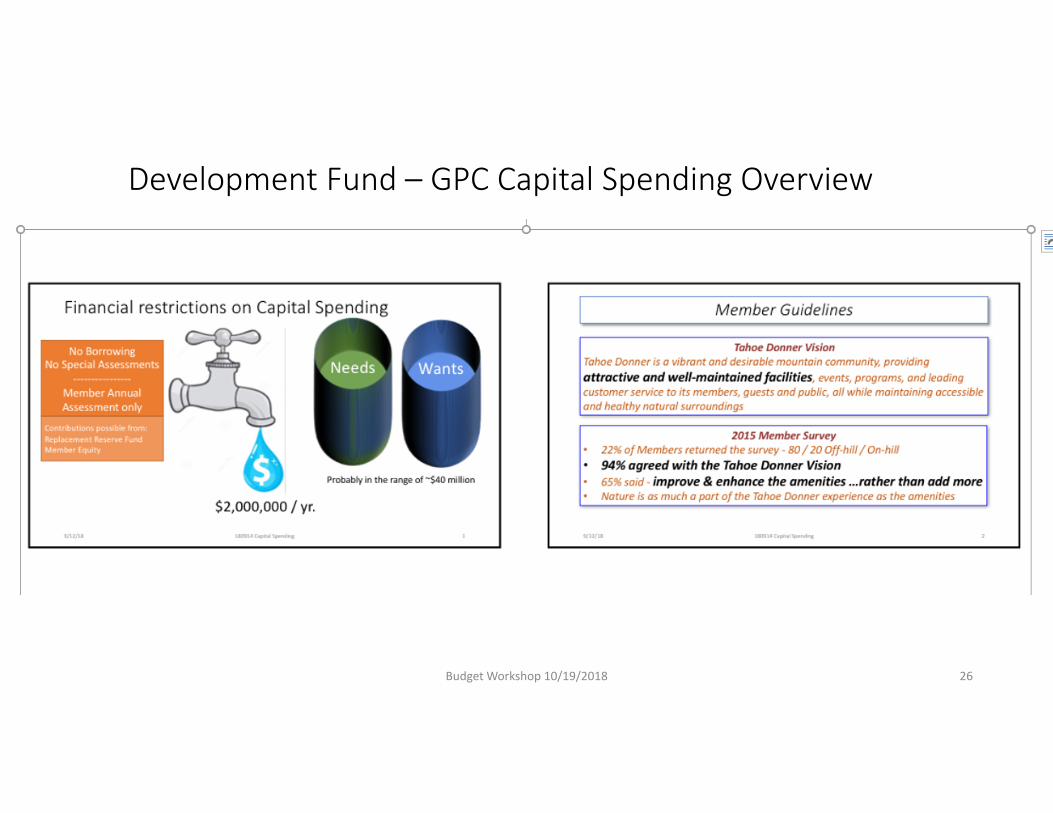
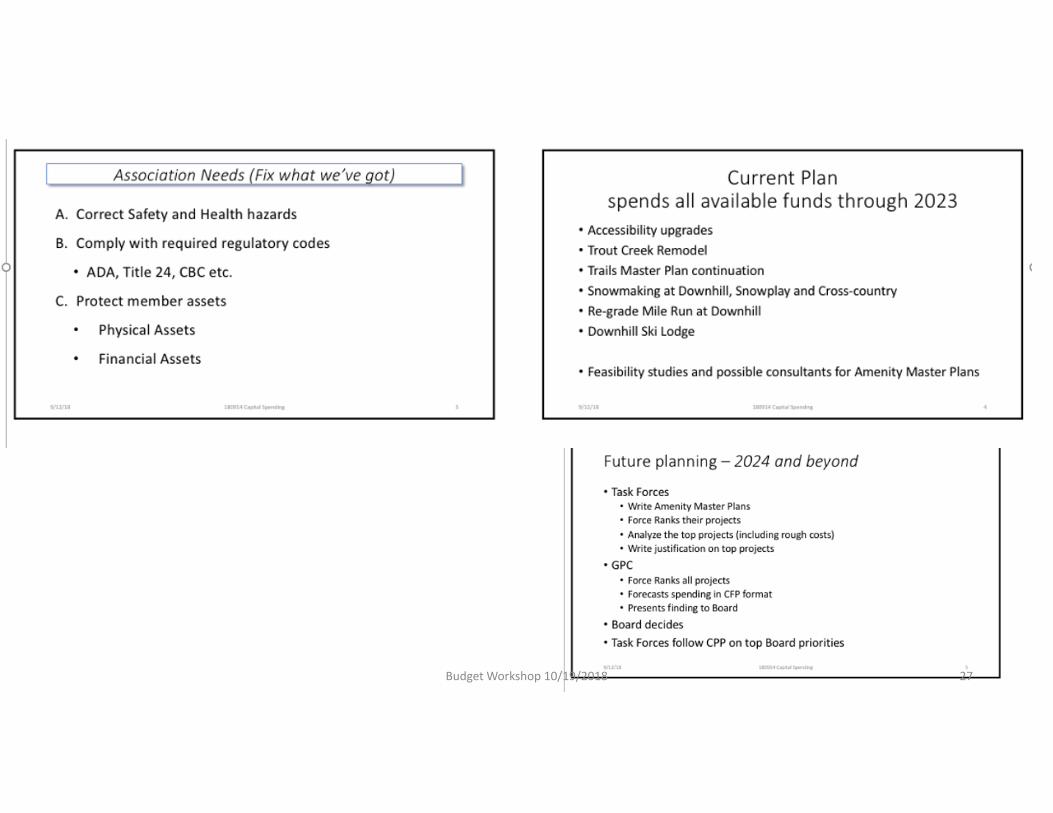
Development Fund – GPC Capital Spending Overview
Budget Workshop 10/19/2018 26
Budget Workshop 10/19/2018 27
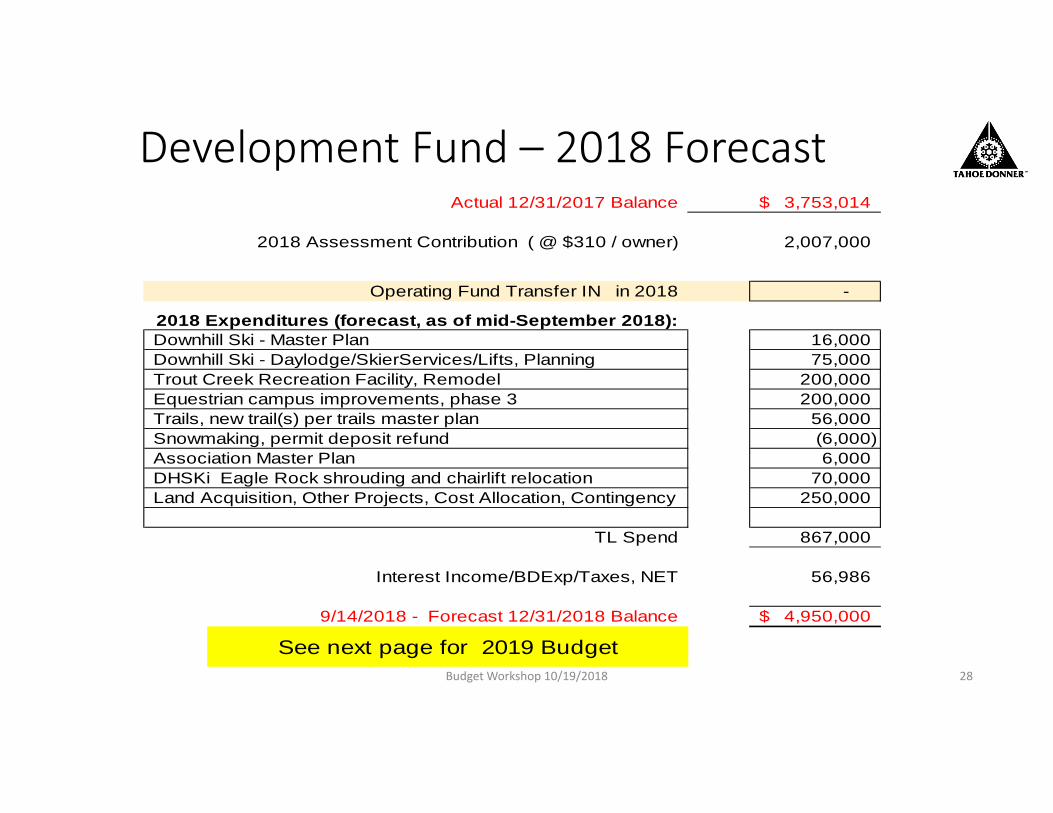
Development Fund – 2018 Forecast
Budget Workshop 10/19/2018 28
Actual 12/31/2017 Balance 3,753,014$
2018 Assessment Contribution ( @ $310 / owner) 2,007,000
Operating Fund Transfer IN in 2018 -
2018 Expenditures (forecast, as of mid-September 2018):Downhill Ski - Master Plan 16,000 Downhill Ski - Daylodge/SkierServices/Lifts, Planning 75,000 Trout Creek Recreation Facility, Remodel 200,000 Equestrian campus improvements, phase 3 200,000 Trails, new trail(s) per trails master plan 56,000 Snowmaking, permit deposit refund (6,000) Association Master Plan 6,000 DHSKi Eagle Rock shrouding and chairlift relocation 70,000 Land Acquisition, Other Projects, Cost Allocation, Contingency 250,000
TL Spend 867,000
Interest Income/BDExp/Taxes, NET 56,986
9/14/2018 - Forecast 12/31/2018 Balance 4,950,000$
See next page for 2019 Budget
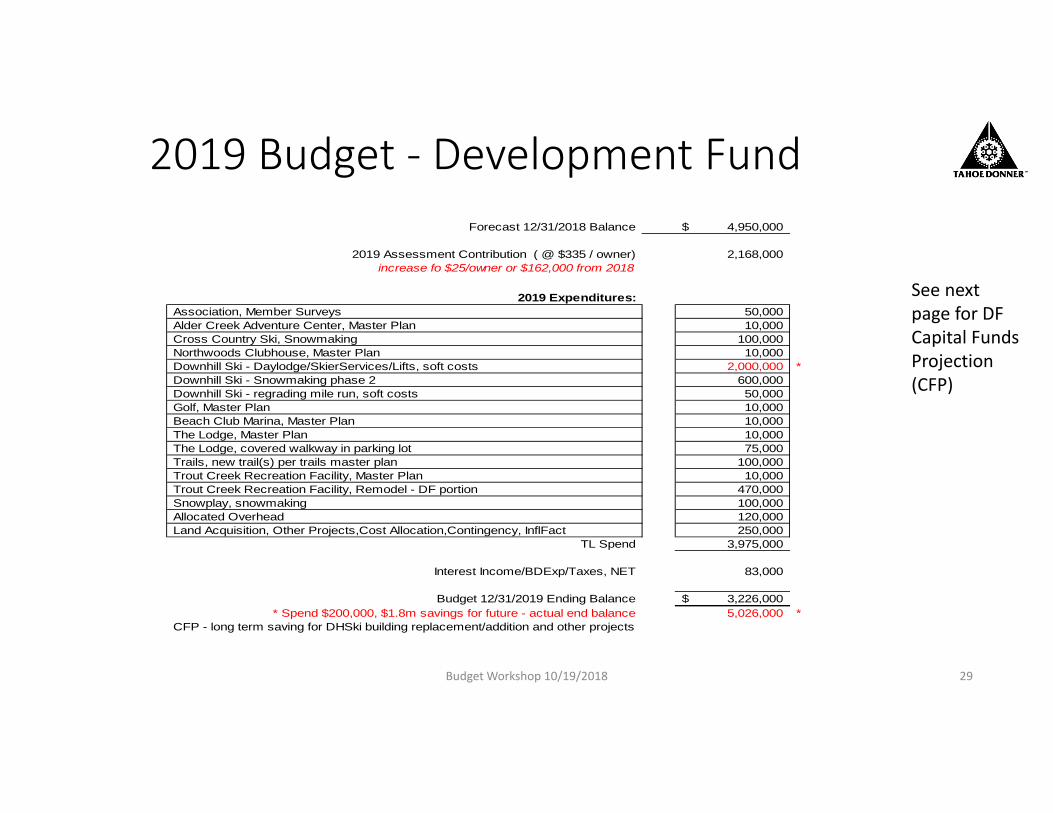
2019 Budget ‐ Development Fund
Budget Workshop 10/19/2018 29
Forecast 12/31/2018 Balance 4,950,000$
2019 Assessment Contribution ( @ $335 / owner) 2,168,000 increase fo $25/owner or $162,000 from 2018
2019 Expenditures:Association, Member Surveys 50,000 Alder Creek Adventure Center, Master Plan 10,000 Cross Country Ski, Snowmaking 100,000 Northwoods Clubhouse, Master Plan 10,000 Downhill Ski - Daylodge/SkierServices/Lifts, soft costs 2,000,000 *Downhill Ski - Snowmaking phase 2 600,000 Downhill Ski - regrading mile run, soft costs 50,000 Golf, Master Plan 10,000 Beach Club Marina, Master Plan 10,000 The Lodge, Master Plan 10,000 The Lodge, covered walkway in parking lot 75,000 Trails, new trail(s) per trails master plan 100,000 Trout Creek Recreation Facility, Master Plan 10,000 Trout Creek Recreation Facility, Remodel - DF portion 470,000 Snowplay, snowmaking 100,000 Allocated Overhead 120,000 Land Acquisition, Other Projects,Cost Allocation,Contingency, InflFact 250,000
TL Spend 3,975,000
Interest Income/BDExp/Taxes, NET 83,000
Budget 12/31/2019 Ending Balance 3,226,000$ * Spend $200,000, $1.8m savings for future - actual end balance 5,026,000 *
CFP - long term saving for DHSki building replacement/addition and other projects
See next page for DF Capital Funds Projection (CFP)
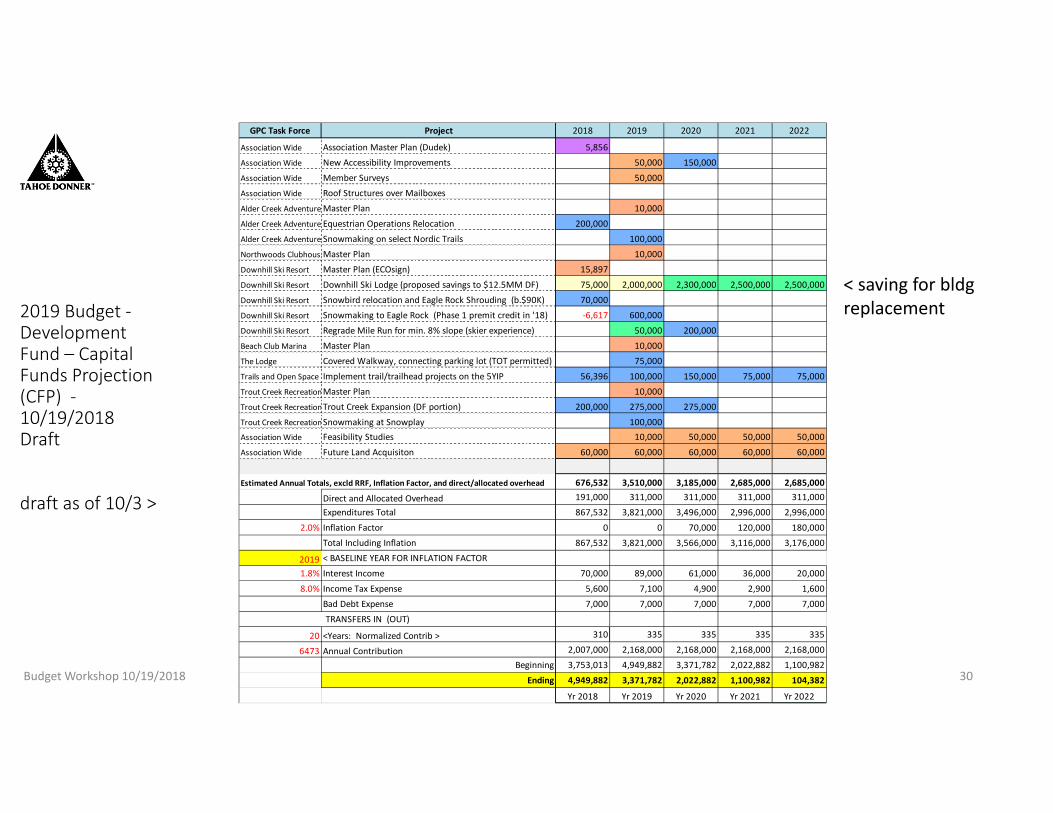
2019 Budget ‐Development Fund – Capital Funds Projection (CFP) ‐10/19/2018 Draft
draft as of 10/3 >
Budget Workshop 10/19/2018 30
GPC Task Force Project 2018 2019 2020 2021 2022
Association Wide Association Master Plan (Dudek) 5,856
Association Wide New Accessibility Improvements 50,000 150,000
Association Wide Member Surveys 50,000
Association Wide Roof Structures over Mailboxes
Alder Creek Adventure Master Plan 10,000
Alder Creek Adventure Equestrian Operations Relocation 200,000
Alder Creek Adventure Snowmaking on select Nordic Trails 100,000
Northwoods ClubhouseMaster Plan 10,000
Downhill Ski Resort Master Plan (ECOsign) 15,897
Downhill Ski Resort Downhill Ski Lodge (proposed savings to $12.5MM DF) 75,000 2,000,000 2,300,000 2,500,000 2,500,000
Downhill Ski Resort Snowbird relocation and Eagle Rock Shrouding (b.$90K) 70,000
Downhill Ski Resort Snowmaking to Eagle Rock (Phase 1 premit credit in '18) ‐6,617 600,000
Downhill Ski Resort Regrade Mile Run for min. 8% slope (skier experience) 50,000 200,000
Beach Club Marina Master Plan 10,000
The Lodge Covered Walkway, connecting parking lot (TOT permitted) 75,000
Trails and Open Space Implement trail/trailhead projects on the 5YIP 56,396 100,000 150,000 75,000 75,000
Trout Creek RecreationMaster Plan 10,000
Trout Creek RecreationTrout Creek Expansion (DF portion) 200,000 275,000 275,000
Trout Creek RecreationSnowmaking at Snowplay 100,000Association Wide Feasibility Studies 10,000 50,000 50,000 50,000
Association Wide Future Land Acquisiton 60,000 60,000 60,000 60,000 60,000
Estimated Annual Totals, excld RRF, Inflation Factor, and direct/allocated overhead 676,532 3,510,000 3,185,000 2,685,000 2,685,000
Direct and Allocated Overhead 191,000 311,000 311,000 311,000 311,000
Expenditures Total 867,532 3,821,000 3,496,000 2,996,000 2,996,000
2.0% Inflation Factor 0 0 70,000 120,000 180,000
Total Including Inflation 867,532 3,821,000 3,566,000 3,116,000 3,176,000
2019 < BASELINE YEAR FOR INFLATION FACTOR
1.8% Interest Income 70,000 89,000 61,000 36,000 20,000
8.0% Income Tax Expense 5,600 7,100 4,900 2,900 1,600
Bad Debt Expense 7,000 7,000 7,000 7,000 7,000
TRANSFERS IN (OUT)
20 <Years: Normalized Contrib > 310 335 335 335 335
6473 Annual Contribution 2,007,000 2,168,000 2,168,000 2,168,000 2,168,000
Beginning 3,753,013 4,949,882 3,371,782 2,022,882 1,100,982
Ending 4,949,882 3,371,782 2,022,882 1,100,982 104,382
Yr 2018 Yr 2019 Yr 2020 Yr 2021 Yr 2022
< saving for bldgreplacement
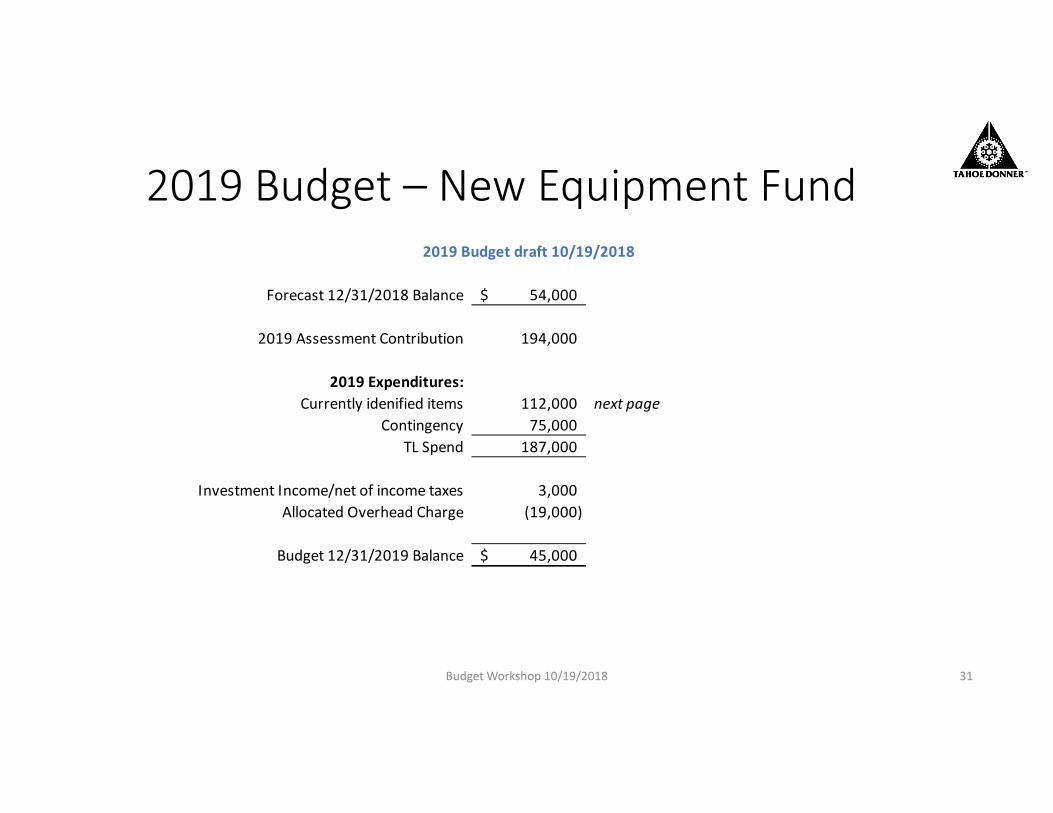
2019 Budget – New Equipment Fund
Budget Workshop 10/19/2018 31
2019 Budget draft 10/19/2018
Forecast 12/31/2018 Balance 54,000$
2019 Assessment Contribution 194,000
2019 Expenditures:Currently idenified items 112,000 next page
Contingency 75,000 TL Spend 187,000
Investment Income/net of income taxes 3,000 Allocated Overhead Charge (19,000)
Budget 12/31/2019 Balance 45,000$
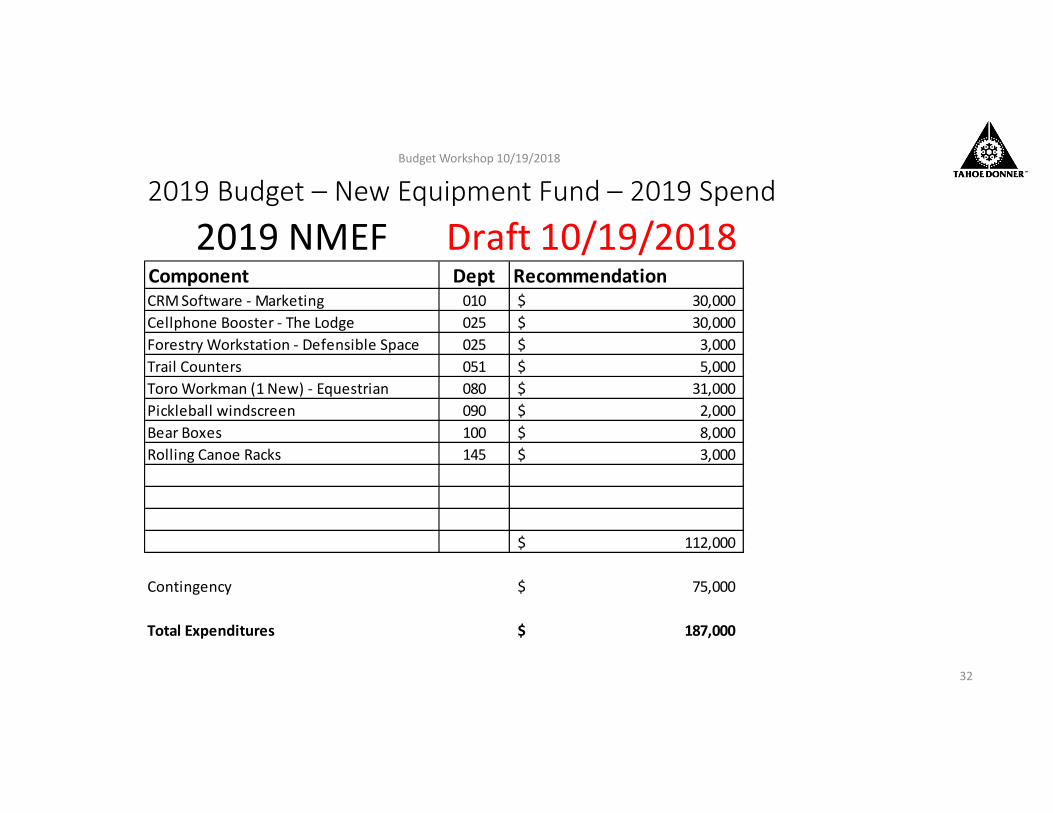
2019 Budget – New Equipment Fund – 2019 SpendBudget Workshop 10/19/2018
32
2019 NMEF Draft 10/19/2018Component Dept RecommendationCRM Software ‐ Marketing 010 30,000$ Cellphone Booster ‐ The Lodge 025 30,000$ Forestry Workstation ‐ Defensible Space 025 3,000$ Trail Counters 051 5,000$ Toro Workman (1 New) ‐ Equestrian 080 31,000$ Pickleball windscreen 090 2,000$ Bear Boxes 100 8,000$ Rolling Canoe Racks 145 3,000$
112,000$
Contingency 75,000$
Total Expenditures 187,000$
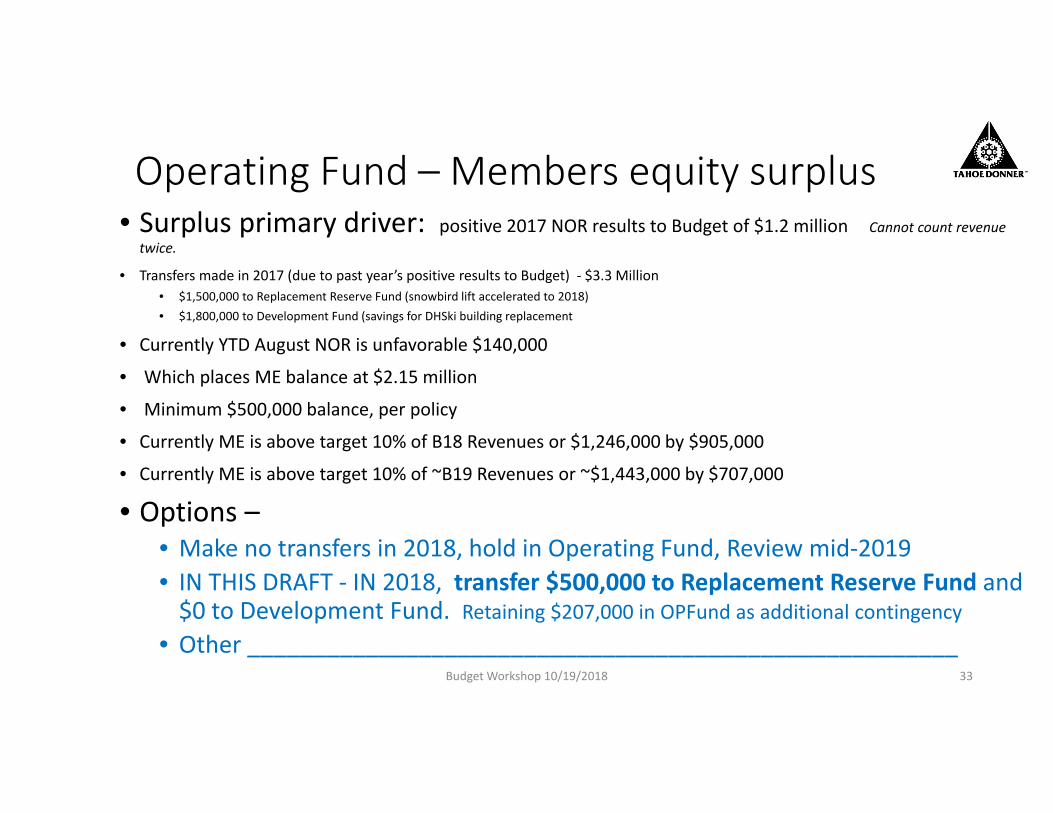
Operating Fund – Members equity surplus• Surplus primary driver: positive 2017 NOR results to Budget of $1.2 million Cannot count revenue
twice.
• Transfers made in 2017 (due to past year’s positive results to Budget) ‐ $3.3 Million• $1,500,000 to Replacement Reserve Fund (snowbird lift accelerated to 2018)• $1,800,000 to Development Fund (savings for DHSki building replacement
• Currently YTD August NOR is unfavorable $140,000
• Which places ME balance at $2.15 million
• Minimum $500,000 balance, per policy
• Currently ME is above target 10% of B18 Revenues or $1,246,000 by $905,000
• Currently ME is above target 10% of ~B19 Revenues or ~$1,443,000 by $707,000
• Options –• Make no transfers in 2018, hold in Operating Fund, Review mid‐2019• IN THIS DRAFT ‐ IN 2018, transfer $500,000 to Replacement Reserve Fund and $0 to Development Fund. Retaining $207,000 in OPFund as additional contingency
• Other ______________________________________________________Budget Workshop 10/19/2018 33
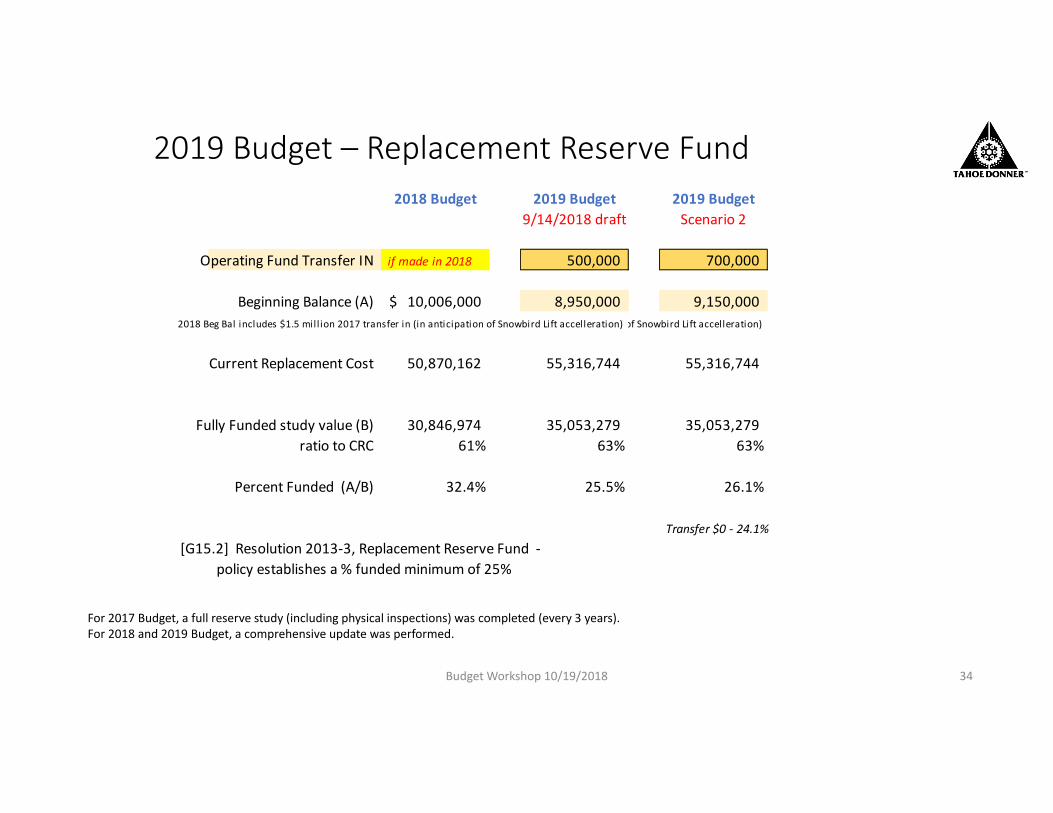
2019 Budget – Replacement Reserve Fund
Budget Workshop 10/19/2018 34
2018 Budget 2019 Budget 2019 Budget9/14/2018 draft Scenario 2
Operating Fund Transfer IN if made in 2018 500,000 700,000
Beginning Balance (A) 10,006,000$ 8,950,000 9,150,000 2018 Beg Bal includes $1.5 million 2017 transfer in (in anticipation of Snowbird Lift accelleration) of Snowbird Lift accelleration)
Current Replacement Cost 50,870,162 55,316,744 55,316,744
Fully Funded study value (B) 30,846,974 35,053,279 35,053,279 ratio to CRC 61% 63% 63%
Percent Funded (A/B) 32.4% 25.5% 26.1%
Transfer $0 ‐ 24.1% [G15.2] Resolution 2013‐3, Replacement Reserve Fund ‐
policy establishes a % funded minimum of 25%
For 2017 Budget, a full reserve study (including physical inspections) was completed (every 3 years). For 2018 and 2019 Budget, a comprehensive update was performed.
Budget Workshop 10/19/2018 35
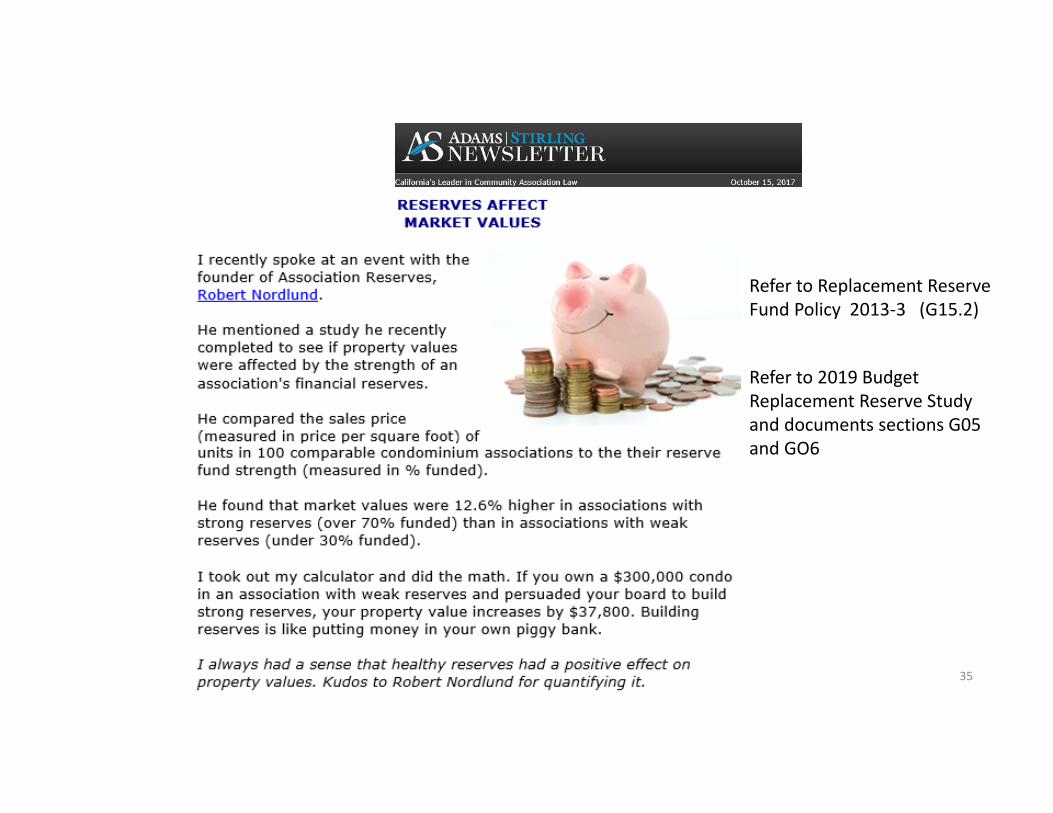
Refer to Replacement Reserve Fund Policy 2013‐3 (G15.2)
Refer to 2019 Budget Replacement Reserve Study and documents sections G05 and GO6
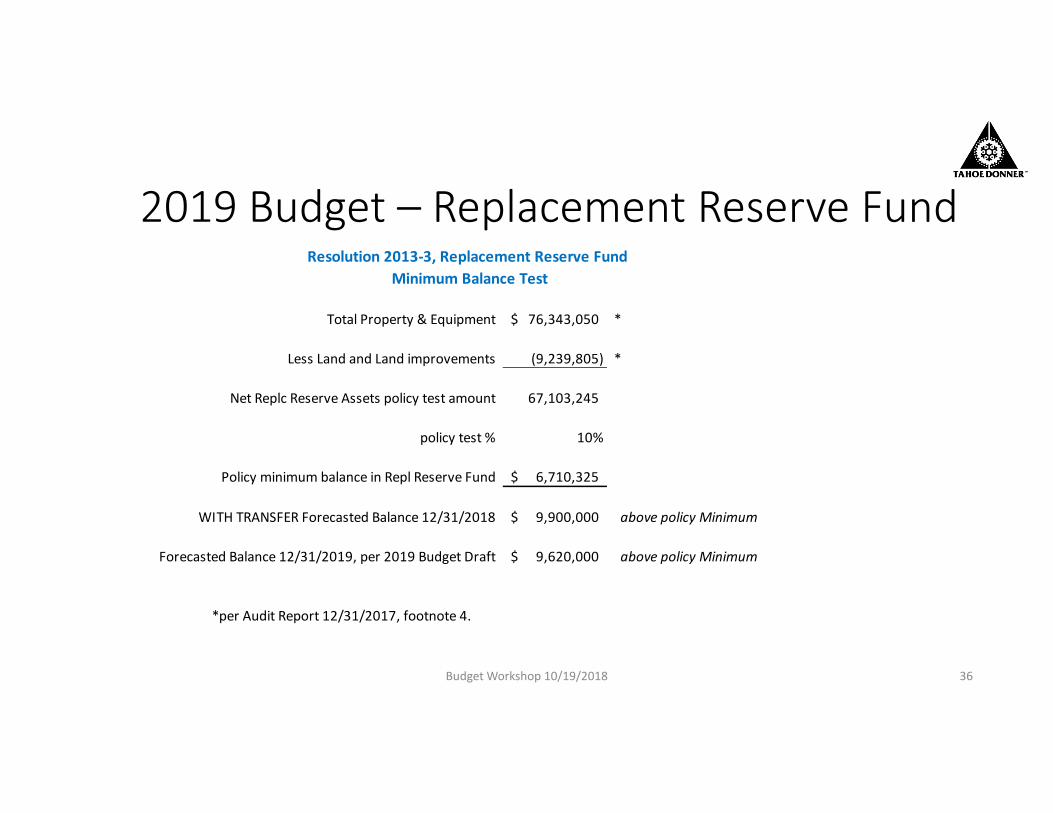
2019 Budget – Replacement Reserve Fund
Budget Workshop 10/19/2018 36
Total Property & Equipment 76,343,050$ *
Less Land and Land improvements (9,239,805) *
Net Replc Reserve Assets policy test amount 67,103,245
policy test % 10%
Policy minimum balance in Repl Reserve Fund 6,710,325$
WITH TRANSFER Forecasted Balance 12/31/2018 9,900,000$ above policy Minimum
Forecasted Balance 12/31/2019, per 2019 Budget Draft 9,620,000$ above policy Minimum
*per Audit Report 12/31/2017, footnote 4.
Resolution 2013‐3, Replacement Reserve Fund Minimum Balance Test
2019 Budget – Replacement Reserve Fund
Budget Workshop 10/19/2018 37
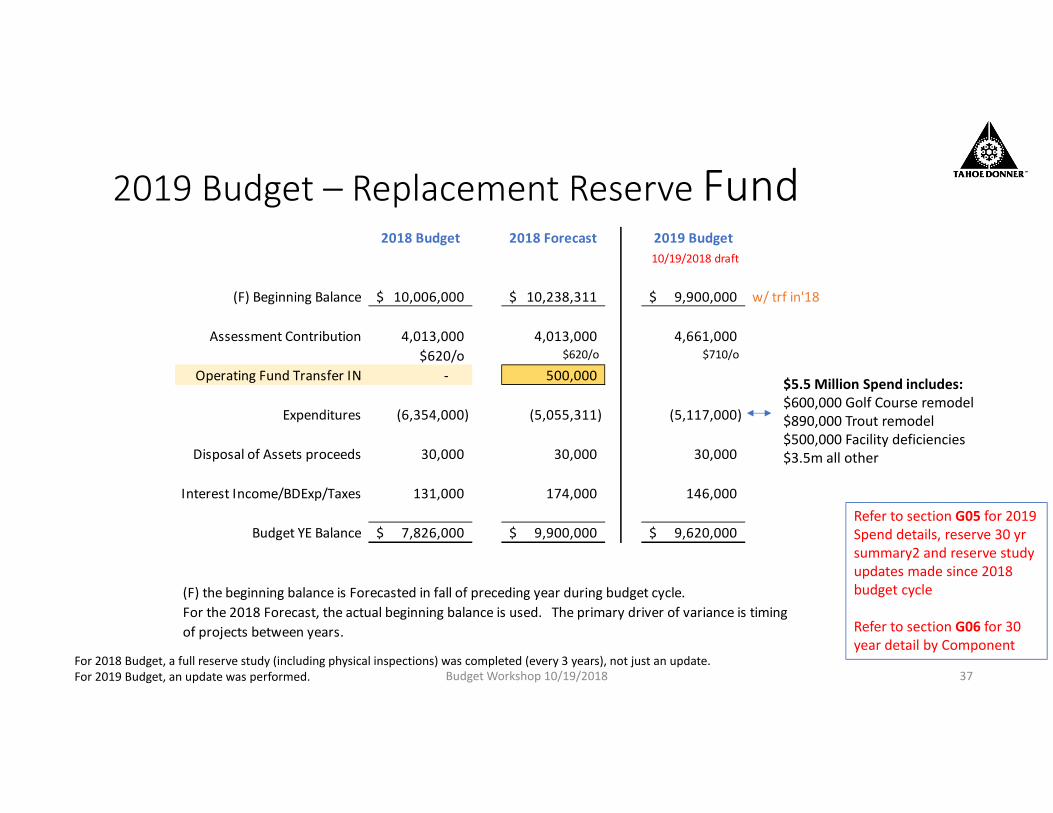
2018 Budget 2018 Forecast 2019 Budget10/19/2018 draft
(F) Beginning Balance 10,006,000$ 10,238,311$ 9,900,000$ w/ trf in'18
Assessment Contribution 4,013,000 4,013,000 4,661,000 $620/o $620/o $710/o
Operating Fund Transfer IN ‐ 500,000
Expenditures (6,354,000) (5,055,311) (5,117,000)
Disposal of Assets proceeds 30,000 30,000 30,000
Interest Income/BDExp/Taxes 131,000 174,000 146,000
Budget YE Balance 7,826,000$ 9,900,000$ 9,620,000$
(F) the beginning balance is Forecasted in fall of preceding year during budget cycle.For the 2018 Forecast, the actual beginning balance is used. The primary driver of variance is timingof projects between years.
For 2018 Budget, a full reserve study (including physical inspections) was completed (every 3 years), not just an update.For 2019 Budget, an update was performed.
$5.5 Million Spend includes:$600,000 Golf Course remodel$890,000 Trout remodel$500,000 Facility deficiencies$3.5m all other
Refer to section G05 for 2019 Spend details, reserve 30 yrsummary2 and reserve study updates made since 2018 budget cycle
Refer to section G06 for 30 year detail by Component
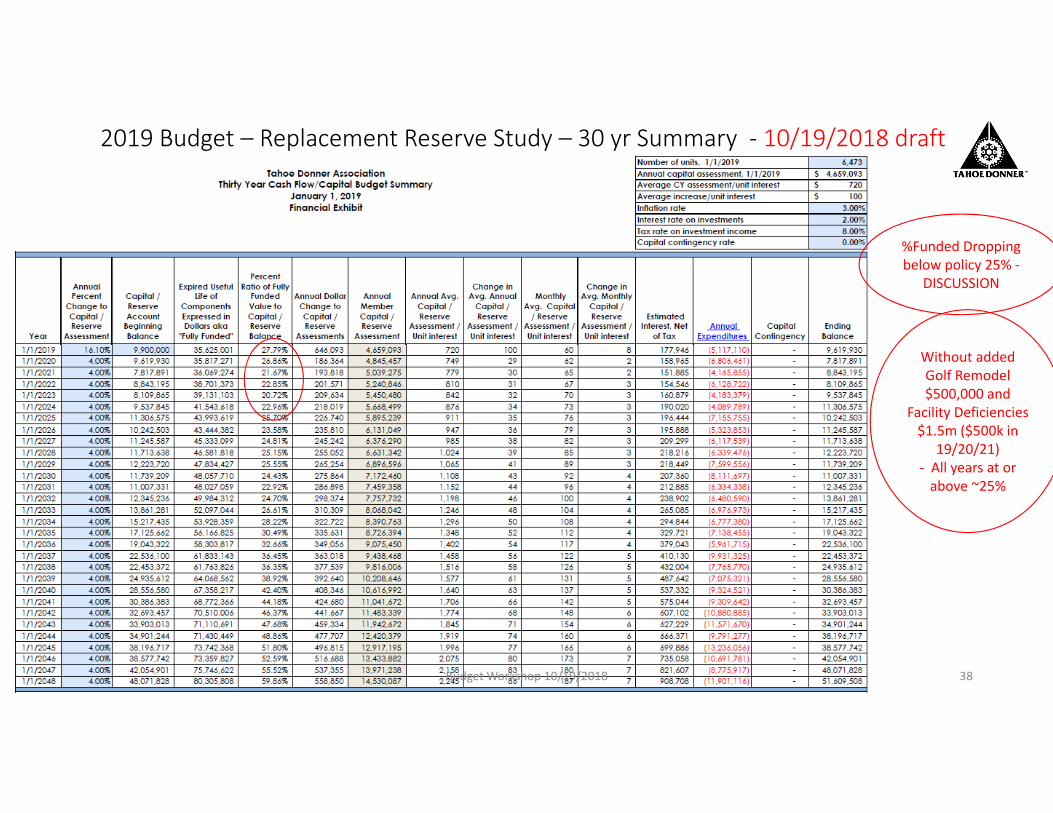
2019 Budget – Replacement Reserve Study – 30 yr Summary ‐ 10/19/2018 draft
Budget Workshop 10/19/2018 38
%Funded Dropping below policy 25% ‐
DISCUSSION
Without added Golf Remodel $500,000 and
Facility Deficiencies $1.5m ($500k in
19/20/21)‐ All years at or above ~25%
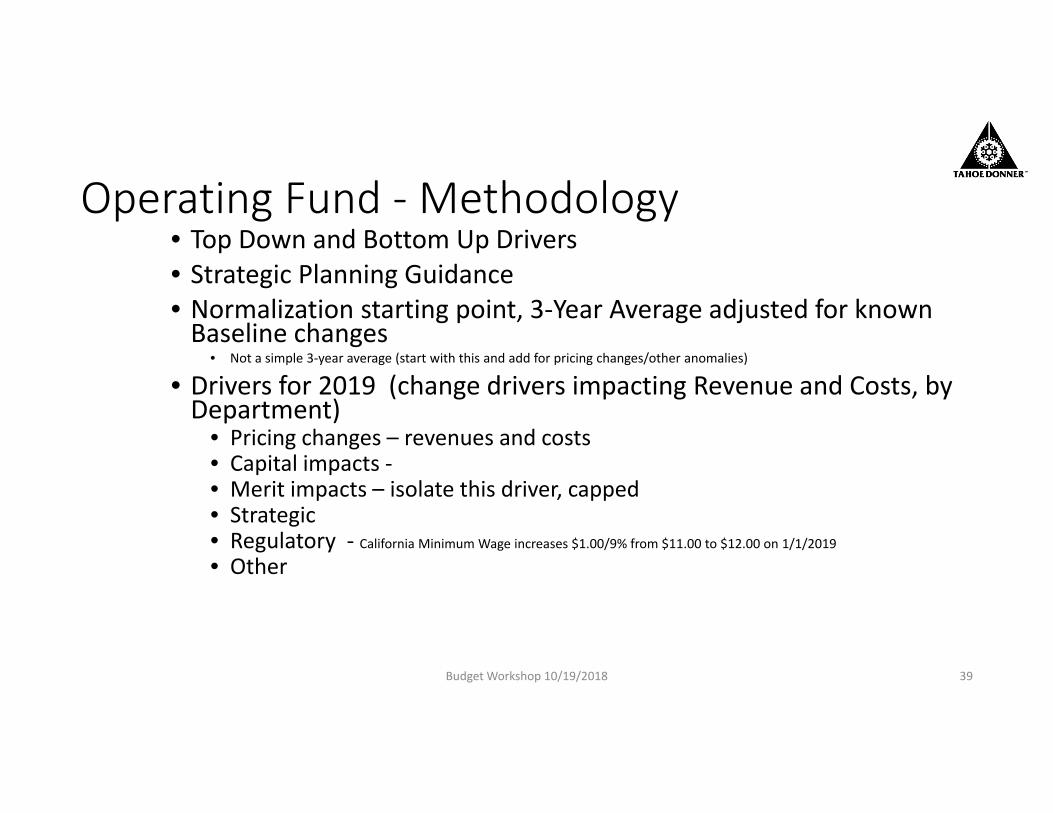
Operating Fund ‐Methodology• Top Down and Bottom Up Drivers• Strategic Planning Guidance • Normalization starting point, 3‐Year Average adjusted for known Baseline changes
• Not a simple 3‐year average (start with this and add for pricing changes/other anomalies)
• Drivers for 2019 (change drivers impacting Revenue and Costs, by Department)
• Pricing changes – revenues and costs• Capital impacts ‐• Merit impacts – isolate this driver, capped• Strategic• Regulatory ‐ California Minimum Wage increases $1.00/9% from $11.00 to $12.00 on 1/1/2019
• Other
Budget Workshop 10/19/2018 39
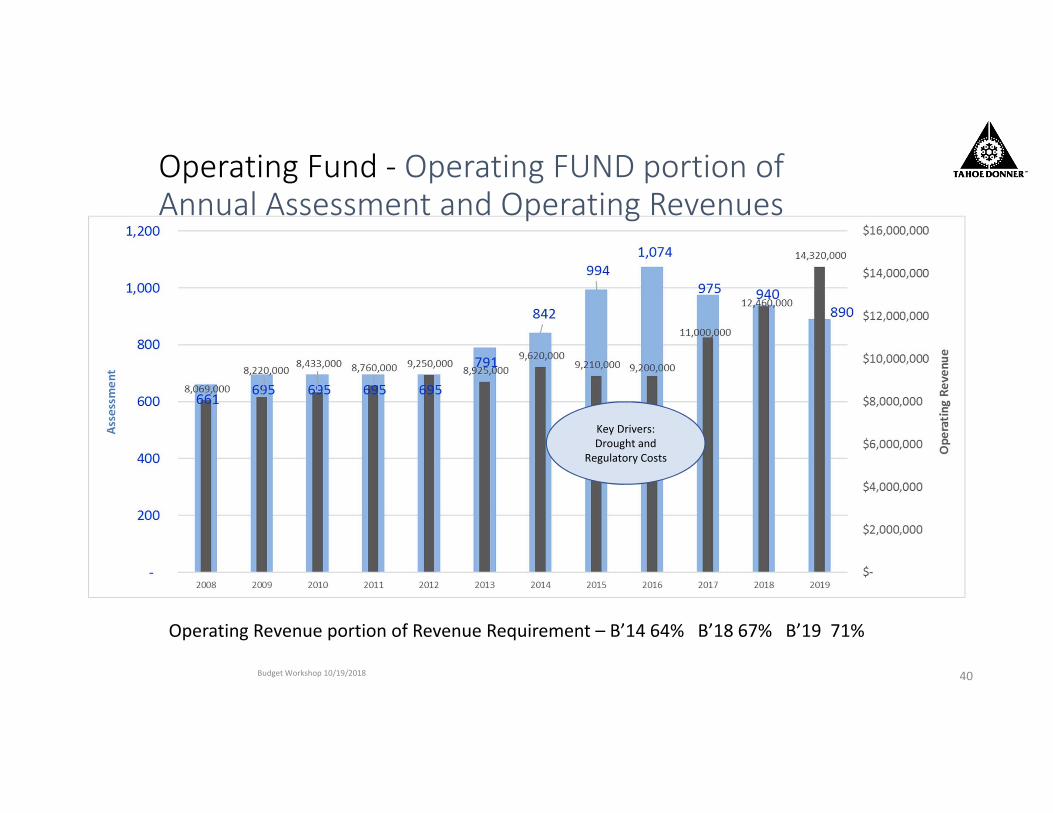
Operating Fund ‐ Operating FUND portion ofAnnual Assessment and Operating Revenues
Budget Workshop 10/19/2018 40
Key Drivers:Drought and
Regulatory Costs
Operating Revenue portion of Revenue Requirement – B’14 64% B’18 67% B’19 71%
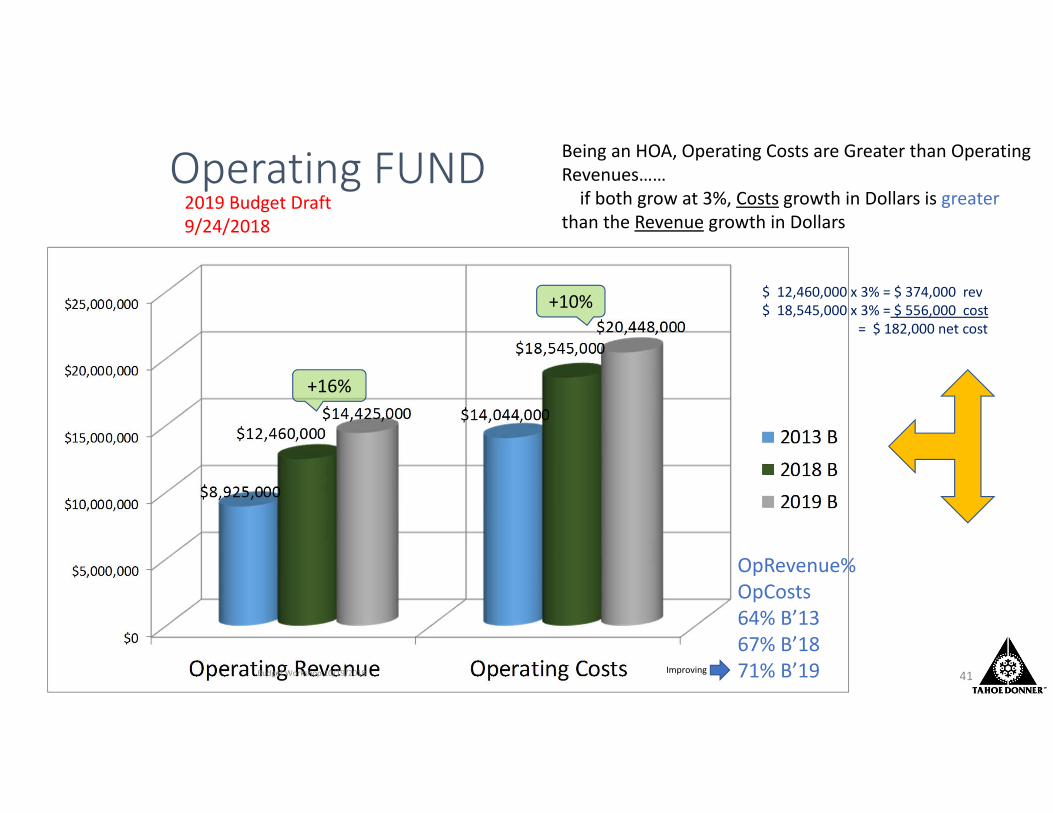
Operating FUND
Budget Workshop 10/19/2018 41
Being an HOA, Operating Costs are Greater than Operating Revenues……if both grow at 3%, Costs growth in Dollars is greater
than the Revenue growth in Dollars
OpRevenue% OpCosts64% B’1367% B’1871% B’19
$ 12,460,000 x 3% = $ 374,000 rev$ 18,545,000 x 3% = $ 556,000 cost
= $ 182,000 net cost
+16%
+10%
2019 Budget Draft 9/24/2018
Improving
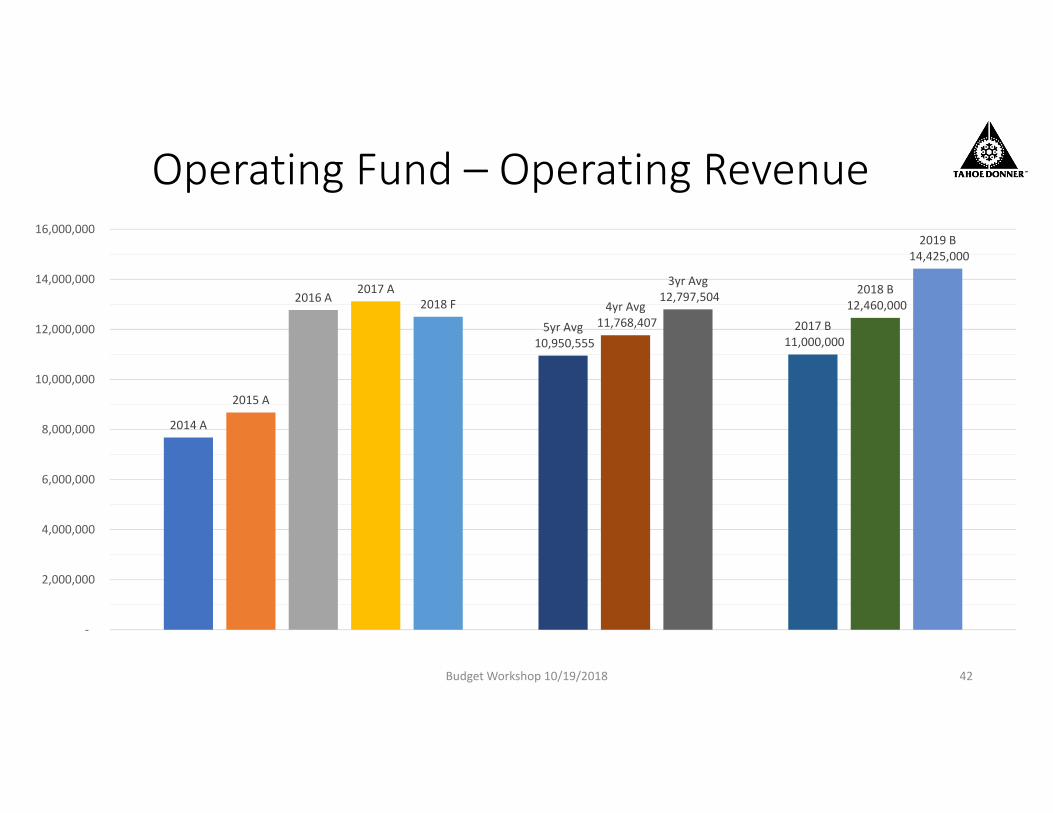
Operating Fund – Operating Revenue
Budget Workshop 10/19/2018 42
2014 A
2015 A
2016 A2017 A
2018 F
5yr Avg10,950,555
4yr Avg11,768,407
3yr Avg12,797,504
2017 B11,000,000
2018 B12,460,000
2019 B14,425,000
‐
2,000,000
4,000,000
6,000,000
8,000,000
10,000,000
12,000,000
14,000,000
16,000,000
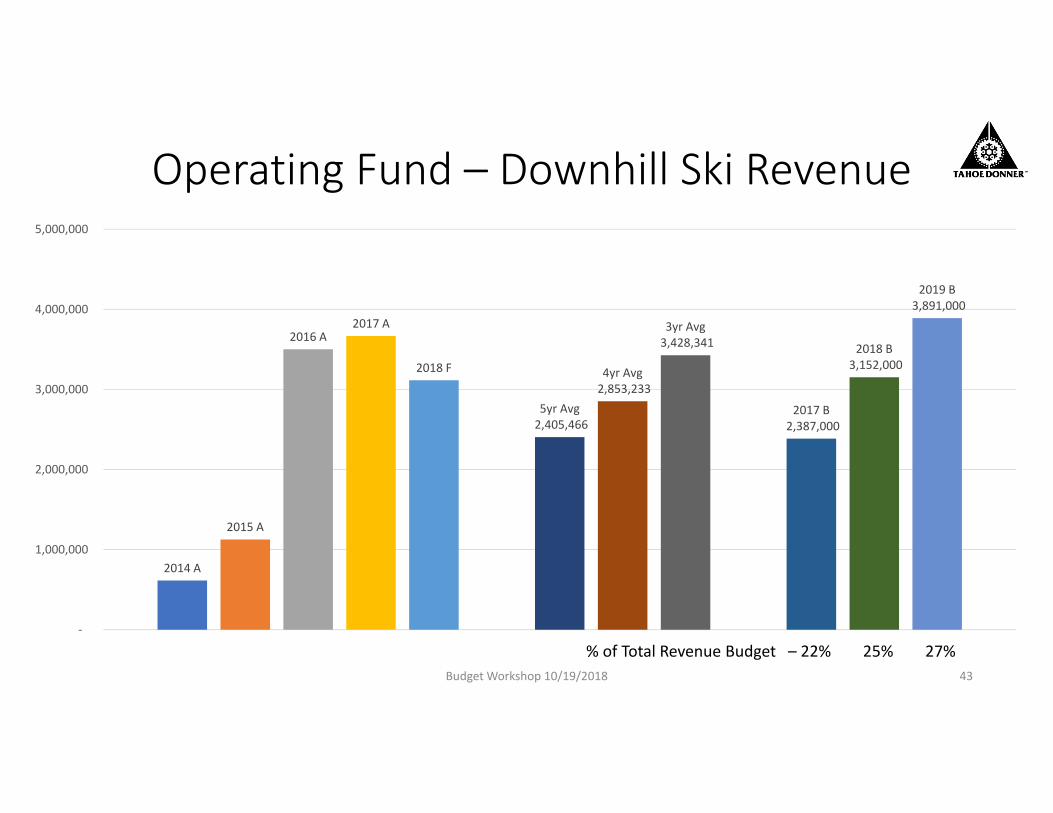
Operating Fund – Downhill Ski Revenue
Budget Workshop 10/19/2018 43
2014 A
2015 A
2016 A2017 A
2018 F
5yr Avg2,405,466
4yr Avg2,853,233
3yr Avg3,428,341
2017 B2,387,000
2018 B3,152,000
2019 B3,891,000
‐
1,000,000
2,000,000
3,000,000
4,000,000
5,000,000
% of Total Revenue Budget – 22% 25% 27%
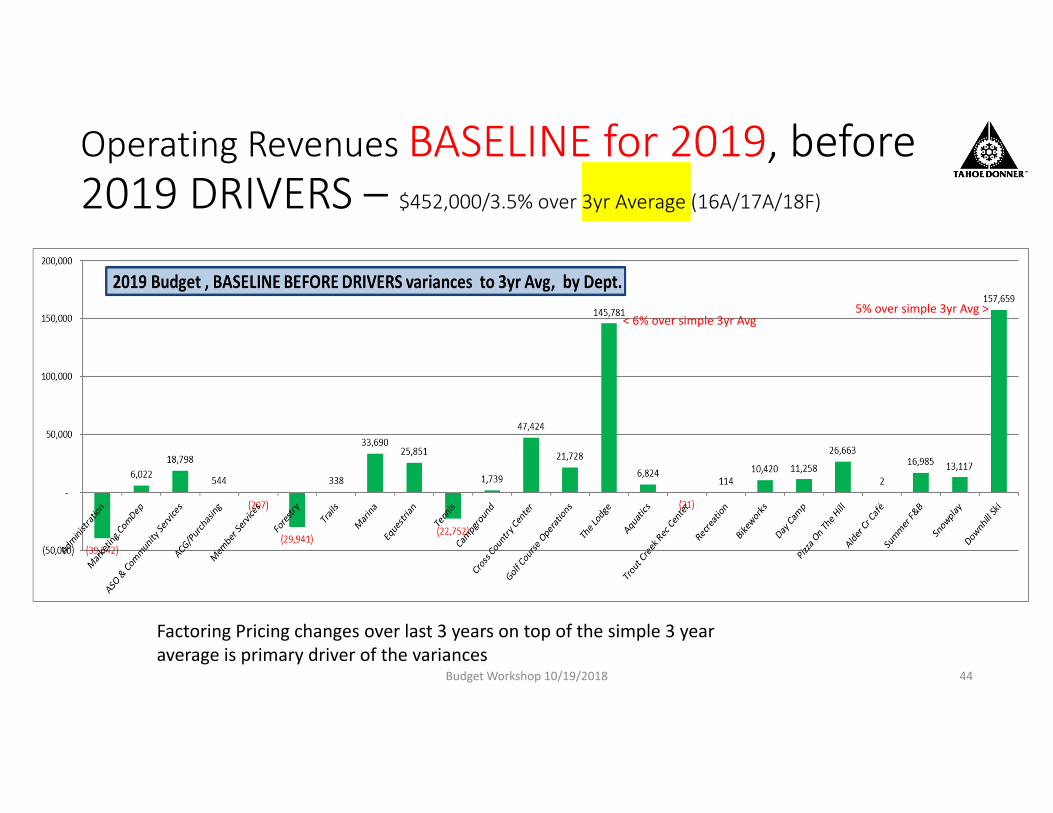
Operating Revenues BASELINE for 2019, before 2019 DRIVERS – $452,000/3.5% over 3yr Average (16A/17A/18F)
Budget Workshop 10/19/2018 44
Factoring Pricing changes over last 3 years on top of the simple 3 year average is primary driver of the variances
< 6% over simple 3yr Avg5% over simple 3yr Avg >
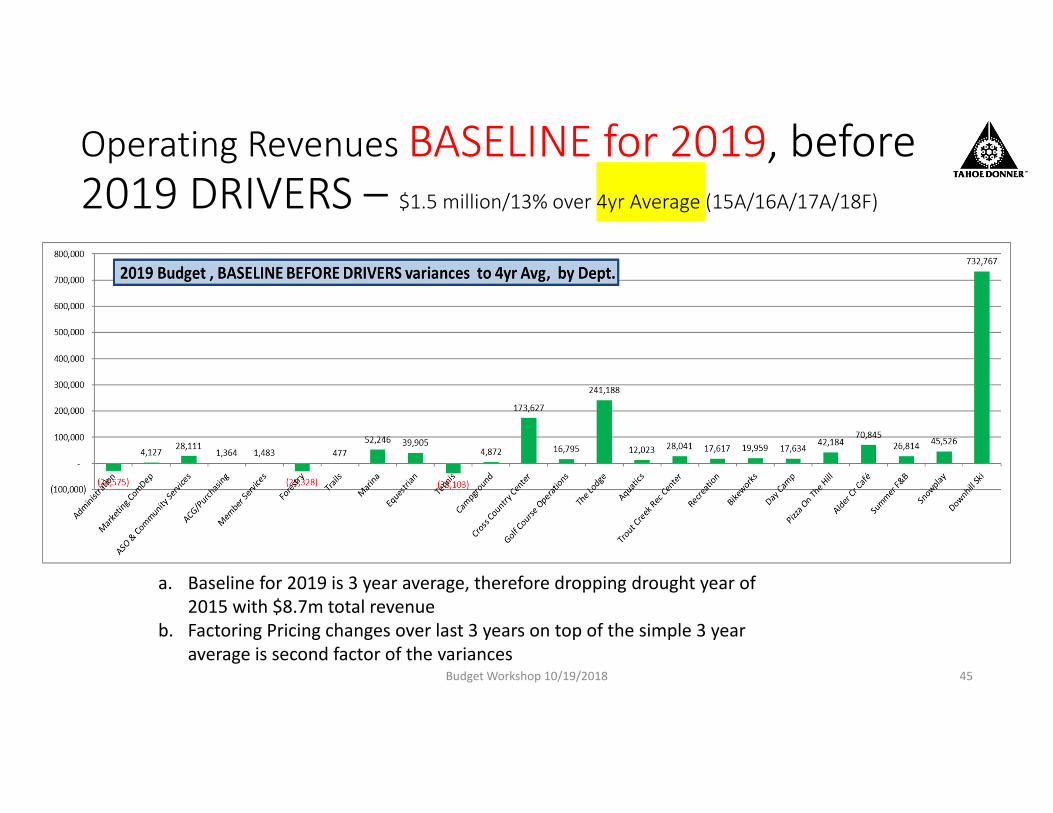
Operating Revenues BASELINE for 2019, before 2019 DRIVERS – $1.5 million/13% over 4yr Average (15A/16A/17A/18F)
Budget Workshop 10/19/2018 45
a. Baseline for 2019 is 3 year average, therefore dropping drought year of 2015 with $8.7m total revenue
b. Factoring Pricing changes over last 3 years on top of the simple 3 year average is second factor of the variances
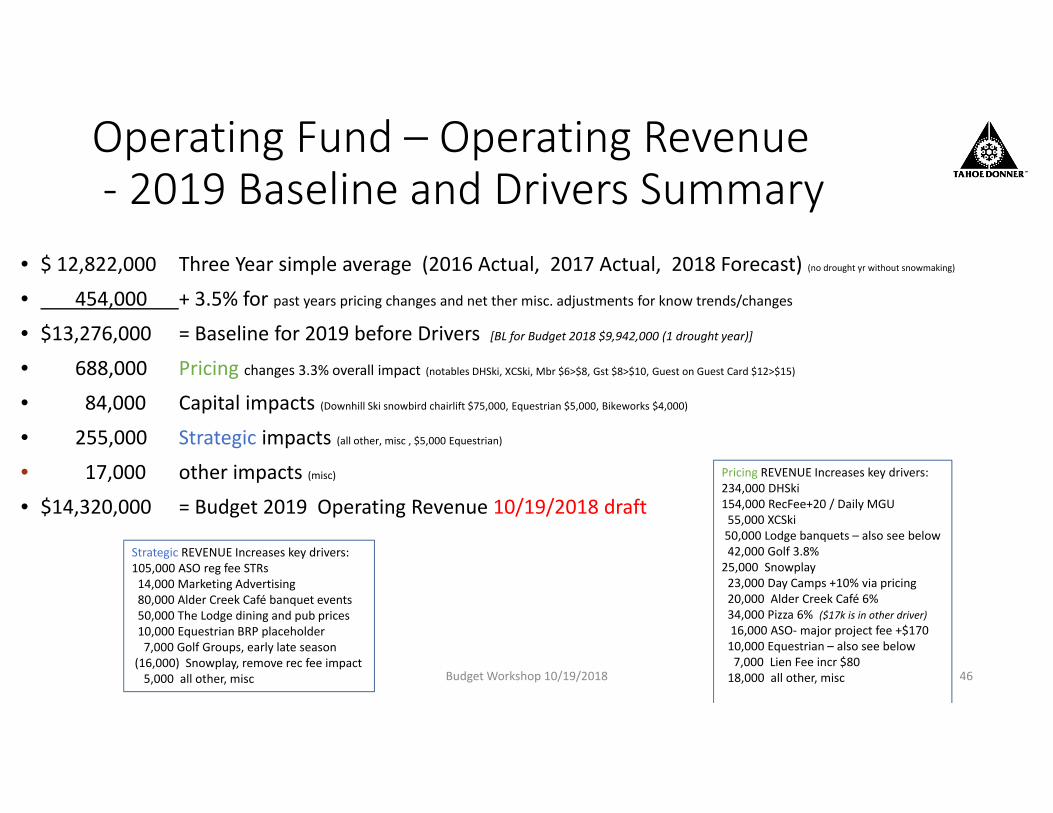
Operating Fund – Operating Revenue‐ 2019 Baseline and Drivers Summary
• $ 12,822,000 Three Year simple average (2016 Actual, 2017 Actual, 2018 Forecast) (no drought yr without snowmaking)
• 454,000 + 3.5% for past years pricing changes and net ther misc. adjustments for know trends/changes
• $13,276,000 = Baseline for 2019 before Drivers [BL for Budget 2018 $9,942,000 (1 drought year)]
• 688,000 Pricing changes 3.3% overall impact (notables DHSki, XCSki, Mbr $6>$8, Gst $8>$10, Guest on Guest Card $12>$15)
• 84,000 Capital impacts (Downhill Ski snowbird chairlift $75,000, Equestrian $5,000, Bikeworks $4,000)
• 255,000 Strategic impacts (all other, misc , $5,000 Equestrian)
• 17,000 other impacts (misc)
• $14,320,000 = Budget 2019 Operating Revenue 10/19/2018 draft
Budget Workshop 10/19/2018 46
Pricing REVENUE Increases key drivers:234,000 DHSki154,000 RecFee+20 / Daily MGU55,000 XCSki50,000 Lodge banquets – also see below42,000 Golf 3.8%25,000 Snowplay23,000 Day Camps +10% via pricing20,000 Alder Creek Café 6% 34,000 Pizza 6% ($17k is in other driver)16,000 ASO‐major project fee +$17010,000 Equestrian – also see below7,000 Lien Fee incr $8018,000 all other, misc
Strategic REVENUE Increases key drivers:105,000 ASO reg fee STRs14,000 Marketing Advertising80,000 Alder Creek Café banquet events50,000 The Lodge dining and pub prices10,000 Equestrian BRP placeholder7,000 Golf Groups, early late season
(16,000) Snowplay, remove rec fee impact5,000 all other, misc
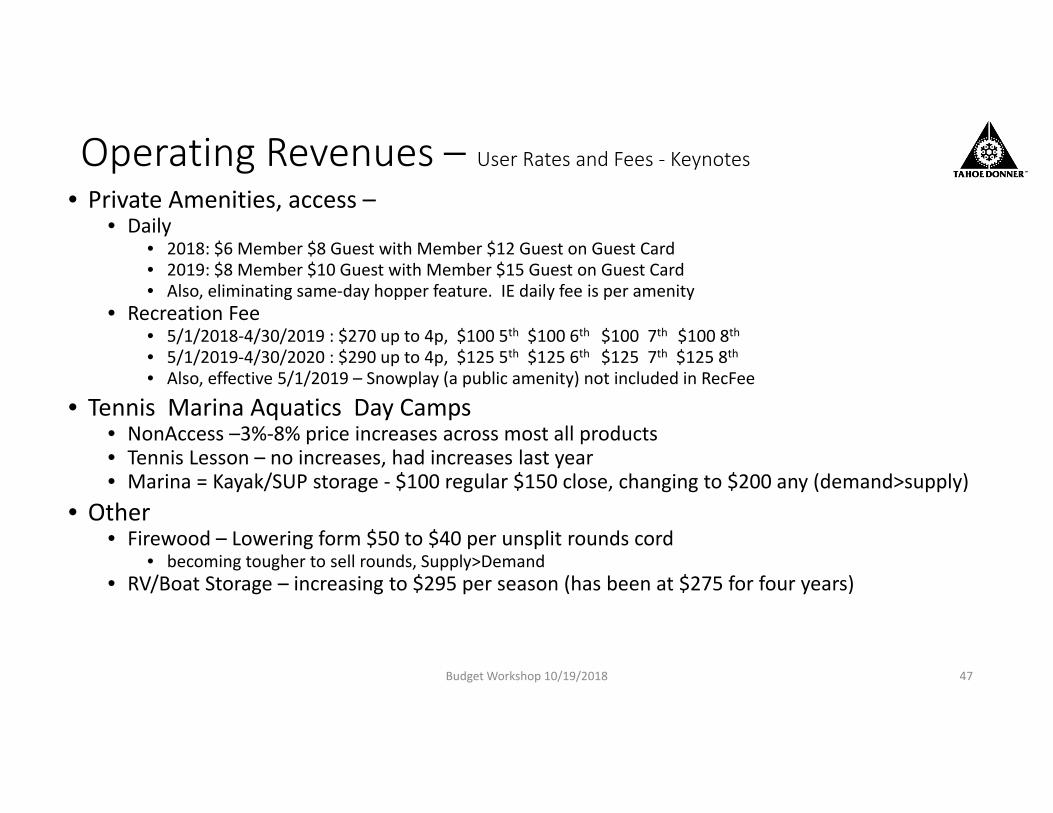
Operating Revenues – User Rates and Fees ‐ Keynotes
• Private Amenities, access –• Daily
• 2018: $6 Member $8 Guest with Member $12 Guest on Guest Card• 2019: $8 Member $10 Guest with Member $15 Guest on Guest Card• Also, eliminating same‐day hopper feature. IE daily fee is per amenity
• Recreation Fee• 5/1/2018‐4/30/2019 : $270 up to 4p, $100 5th $100 6th $100 7th $100 8th• 5/1/2019‐4/30/2020 : $290 up to 4p, $125 5th $125 6th $125 7th $125 8th• Also, effective 5/1/2019 – Snowplay (a public amenity) not included in RecFee
• Tennis Marina Aquatics Day Camps• NonAccess –3%‐8% price increases across most all products• Tennis Lesson – no increases, had increases last year• Marina = Kayak/SUP storage ‐ $100 regular $150 close, changing to $200 any (demand>supply)
• Other• Firewood – Lowering form $50 to $40 per unsplit rounds cord
• becoming tougher to sell rounds, Supply>Demand• RV/Boat Storage – increasing to $295 per season (has been at $275 for four years)
Budget Workshop 10/19/2018 47
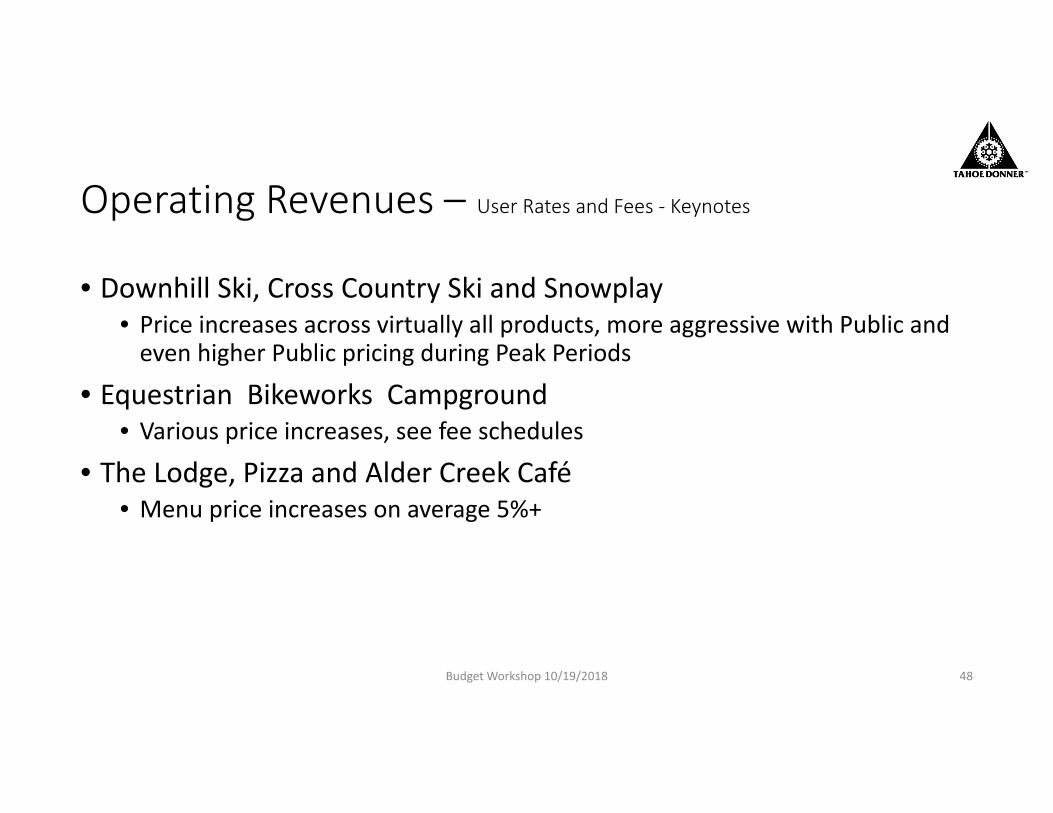
Operating Revenues – User Rates and Fees ‐ Keynotes
• Downhill Ski, Cross Country Ski and Snowplay• Price increases across virtually all products, more aggressive with Public and even higher Public pricing during Peak Periods
• Equestrian Bikeworks Campground• Various price increases, see fee schedules
• The Lodge, Pizza and Alder Creek Café• Menu price increases on average 5%+
Budget Workshop 10/19/2018 48
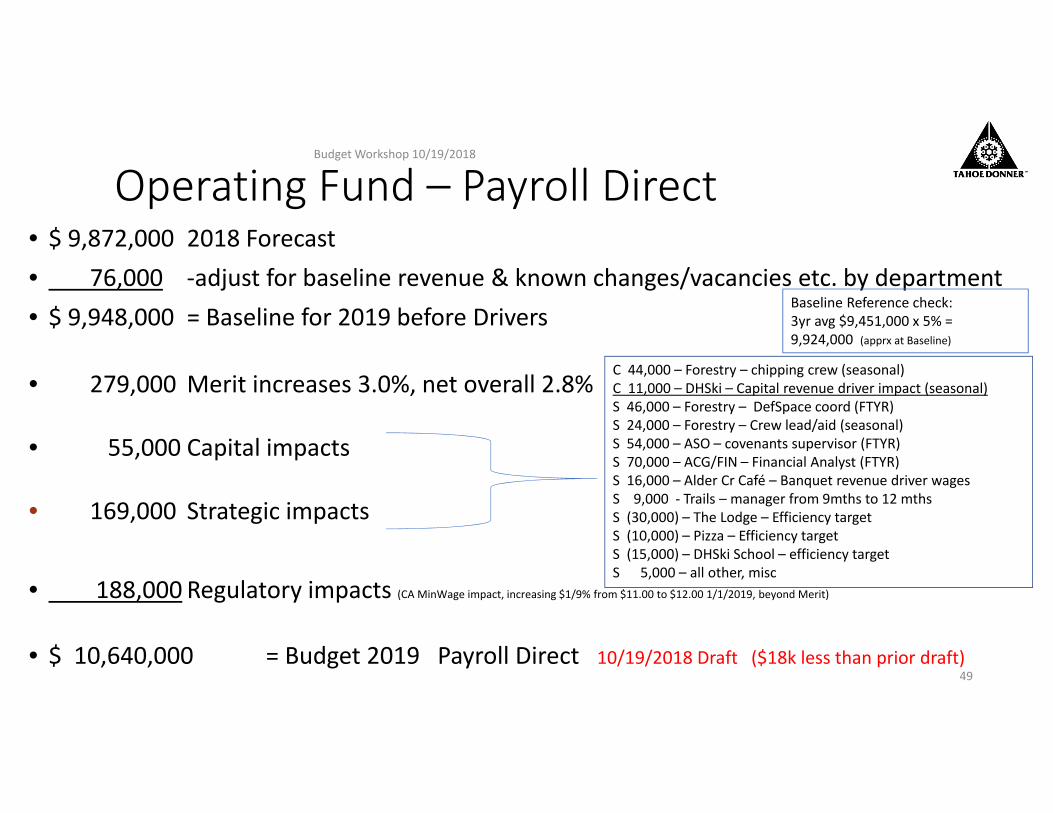
Operating Fund – Payroll Direct• $ 9,872,000 2018 Forecast• 76,000 ‐adjust for baseline revenue & known changes/vacancies etc. by department• $ 9,948,000 = Baseline for 2019 before Drivers
• 279,000 Merit increases 3.0%, net overall 2.8%
• 55,000 Capital impacts
• 169,000 Strategic impacts
• 188,000 Regulatory impacts (CA MinWage impact, increasing $1/9% from $11.00 to $12.00 1/1/2019, beyond Merit)
• $ 10,640,000 = Budget 2019 Payroll Direct 10/19/2018 Draft ($18k less than prior draft)
Budget Workshop 10/19/2018
49
Baseline Reference check:3yr avg $9,451,000 x 5% =9,924,000 (apprx at Baseline)
C 44,000 – Forestry – chipping crew (seasonal)C 11,000 – DHSki – Capital revenue driver impact (seasonal)S 46,000 – Forestry – DefSpace coord (FTYR)S 24,000 – Forestry – Crew lead/aid (seasonal)S 54,000 – ASO – covenants supervisor (FTYR)S 70,000 – ACG/FIN – Financial Analyst (FTYR)S 16,000 – Alder Cr Café – Banquet revenue driver wagesS 9,000 ‐ Trails – manager from 9mths to 12 mthsS (30,000) – The Lodge – Efficiency targetS (10,000) – Pizza – Efficiency targetS (15,000) – DHSki School – efficiency targetS 5,000 – all other, misc
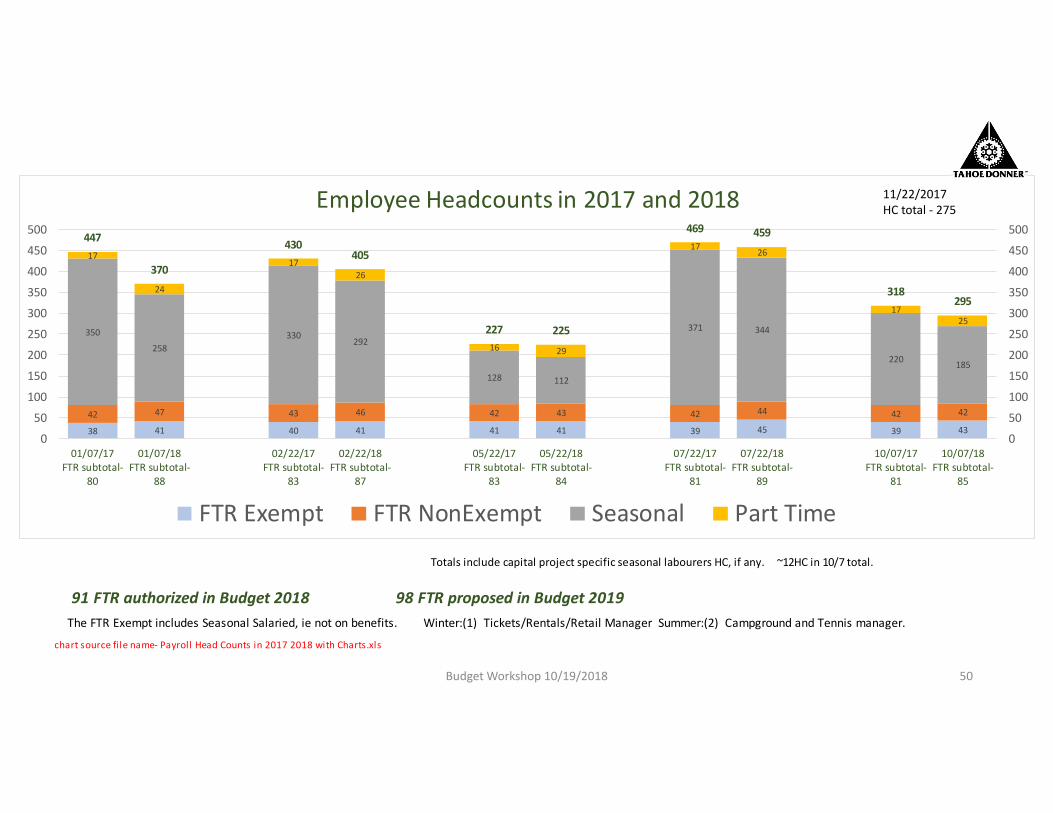
Totals include capital project specific seasonal labourers HC, if any. ~12HC in 10/7 total.
91 FTR authorized in Budget 2018 98 FTR proposed in Budget 2019 The FTR Exempt includes Seasonal Salaried, ie not on benefits. Winter:(1) Tickets/Rentals/Retail Manager Summer:(2) Campground and Tennis manager.
chart source fi le name‐ Payroll Head Counts in 2017 2018 with Charts.xls
38 41 40 41 41 41 39 45 39 43
42 47 43 46 42 43 42 44 42 42
350
258330
292
128 112
371 344
220 185
17
24
1726
16 29
17 26
1725
447
370
430405
227 225
469 459
318295
0
50
100
150
200
250
300
350
400
450
500
0
50
100
150
200
250
300
350
400
450
500
01/07/17FTR subtotal‐
80
01/07/18FTR subtotal‐
88
02/22/17FTR subtotal‐
83
02/22/18FTR subtotal‐
87
05/22/17FTR subtotal‐
83
05/22/18FTR subtotal‐
84
07/22/17FTR subtotal‐
81
07/22/18FTR subtotal‐
89
10/07/17FTR subtotal‐
81
10/07/18FTR subtotal‐
85
Employee Headcounts in 2017 and 2018
FTR Exempt FTR NonExempt Seasonal Part Time
Budget Workshop 10/19/2018 50
11/22/2017 HC total ‐ 275
Payroll W2s• In 2017 – 924 W2’s issued, up 3.0% to 2016
• The calendar year covers two winter seasons• 1 winter season jan‐apr employee • 1 summer season employee• 1 winter season nov‐dec employee
• This increases the # of tax forms as compared to # EE’s in each ‘season’
• 2017 Average Wages per W2 of $10,276 ‐ up 4.6% to 2016
Budget Workshop 10/19/2018 51
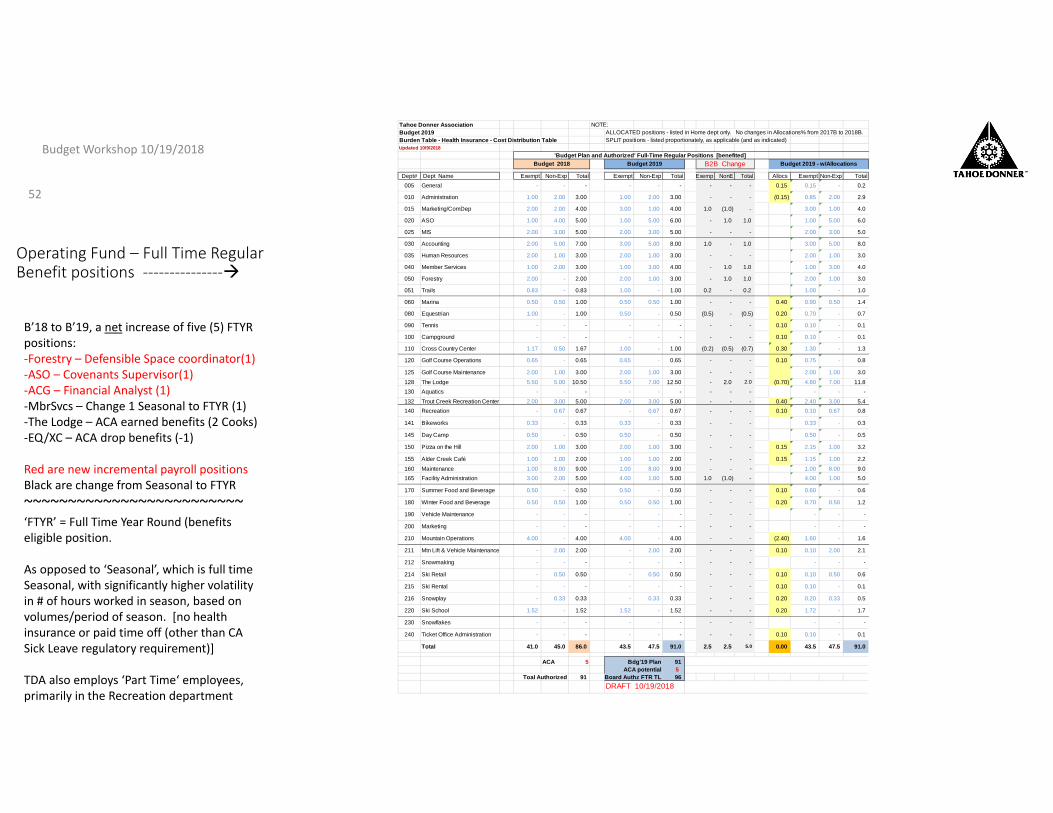
Operating Fund – Full Time Regular Benefit positions ‐‐‐‐‐‐‐‐‐‐‐‐‐‐‐
Budget Workshop 10/19/2018
52
B’18 to B’19, a net increase of five (5) FTYR positions:‐Forestry – Defensible Space coordinator(1)‐ASO – Covenants Supervisor(1)‐ACG – Financial Analyst (1)‐MbrSvcs – Change 1 Seasonal to FTYR (1)‐The Lodge – ACA earned benefits (2 Cooks)‐EQ/XC – ACA drop benefits (‐1)
Red are new incremental payroll positionsBlack are change from Seasonal to FTYR~~~~~~~~~~~~~~~~~~~~~~~~~‘FTYR’ = Full Time Year Round (benefits eligible position.
As opposed to ‘Seasonal’, which is full time Seasonal, with significantly higher volatility in # of hours worked in season, based on volumes/period of season. [no health insurance or paid time off (other than CA Sick Leave regulatory requirement)]
TDA also employs ‘Part Time‘ employees, primarily in the Recreation department
Tahoe Donner Association NOTE:Budget 2019 ALLOCATED positions - listed in Home dept only. No changes in Allocations% from 2017B to 2018B.Burden Table - Health Insurance - Cost Distribution Table SPLIT positions - listed proportionately, as applicable (and as indicated)Updated 10/9/2018
'Budget Plan and Authorized' Full-Time Regular Positions [benefited]
Dept# Dept Name Exempt Non-Exp Total Exempt Non-Exp Total Exemp NonE Total Allocs Exempt Non-Exp Total005 General - - - - - - - - - 0.15 0.15 - 0.2
010 Administration 1.00 2.00 3.00 1.00 2.00 3.00 - - - (0.15) 0.85 2.00 2.9
015 Marketing/ComDep 2.00 2.00 4.00 3.00 1.00 4.00 1.0 (1.0) - 3.00 1.00 4.0
020 ASO 1.00 4.00 5.00 1.00 5.00 6.00 - 1.0 1.0 1.00 5.00 6.0
025 MIS 2.00 3.00 5.00 2.00 3.00 5.00 - - - 2.00 3.00 5.0
030 Accounting 2.00 5.00 7.00 3.00 5.00 8.00 1.0 - 1.0 3.00 5.00 8.0
035 Human Resources 2.00 1.00 3.00 2.00 1.00 3.00 - - - 2.00 1.00 3.0
040 Member Services 1.00 2.00 3.00 1.00 3.00 4.00 - 1.0 1.0 1.00 3.00 4.0
050 Forestry 2.00 - 2.00 2.00 1.00 3.00 - 1.0 1.0 2.00 1.00 3.0
051 Trails 0.83 - 0.83 1.00 - 1.00 0.2 - 0.2 1.00 - 1.0
060 Marina 0.50 0.50 1.00 0.50 0.50 1.00 - - - 0.40 0.90 0.50 1.4
080 Equestrian 1.00 - 1.00 0.50 - 0.50 (0.5) - (0.5) 0.20 0.70 - 0.7
090 Tennis - - - - - - - - - 0.10 0.10 - 0.1
100 Campground - - - - - - - - - 0.10 0.10 - 0.1
110 Cross Country Center 1.17 0.50 1.67 1.00 - 1.00 (0.2) (0.5) (0.7) 0.30 1.30 - 1.3
120 Golf Course Operations 0.65 - 0.65 0.65 - 0.65 - - - 0.10 0.75 - 0.8
125 Golf Course Maintenance 2.00 1.00 3.00 2.00 1.00 3.00 - - - 2.00 1.00 3.0
128 The Lodge 5.50 5.00 10.50 5.50 7.00 12.50 - 2.0 2.0 (0.70) 4.80 7.00 11.8 130 Aquatics - - - - - - - - - - - -
132 Trout Creek Recreation Center 2.00 3.00 5.00 2.00 3.00 5.00 - - - 0.40 2.40 3.00 5.4 140 Recreation - 0.67 0.67 - 0.67 0.67 - - - 0.10 0.10 0.67 0.8
141 Bikeworks 0.33 - 0.33 0.33 - 0.33 - - - 0.33 - 0.3
145 Day Camp 0.50 - 0.50 0.50 - 0.50 - - - 0.50 - 0.5
150 Pizza on the Hill 2.00 1.00 3.00 2.00 1.00 3.00 - - - 0.15 2.15 1.00 3.2
155 Alder Creek Café 1.00 1.00 2.00 1.00 1.00 2.00 - - - 0.15 1.15 1.00 2.2
160 Maintenance 1.00 8.00 9.00 1.00 8.00 9.00 - - - 1.00 8.00 9.0 165 Facility Administration 3.00 2.00 5.00 4.00 1.00 5.00 1.0 (1.0) - 4.00 1.00 5.0
170 Summer Food and Beverage 0.50 - 0.50 0.50 - 0.50 - - - 0.10 0.60 - 0.6
180 Winter Food and Beverage 0.50 0.50 1.00 0.50 0.50 1.00 - - - 0.20 0.70 0.50 1.2
190 Vehicle Maintenance - - - - - - - - - - - -
200 Marketing - - - - - - - - - - - -
210 Mountain Operations 4.00 - 4.00 4.00 - 4.00 - - - (2.40) 1.60 - 1.6
211 Mtn Lift & Vehicle Maintenance - 2.00 2.00 - 2.00 2.00 - - - 0.10 0.10 2.00 2.1
212 Snowmaking - - - - - - - - - - - -
214 Ski Retail - 0.50 0.50 - 0.50 0.50 - - - 0.10 0.10 0.50 0.6
215 Ski Rental - - - - - - - - - 0.10 0.10 - 0.1
216 Snowplay - 0.33 0.33 - 0.33 0.33 - - - 0.20 0.20 0.33 0.5
220 Ski School 1.52 - 1.52 1.52 - 1.52 - - - 0.20 1.72 - 1.7
230 Snowflakes - - - - - - - - - - - -
240 Ticket Office Administration - - - - - - - - - 0.10 0.10 - 0.1
Total 41.0 45.0 86.0 43.5 47.5 91.0 2.5 2.5 5.0 0.00 43.5 47.5 91.0
ACA 5 Bdg'19 Plan 91 budget cost is 75 positions or 85% enrollment. Budgeted cost (75ACA potential 5 as we do not know where exactly the not to enroll will occur,
Toal Authorized 91 Board Authz FTR TL 96 DRAFT 10/19/2018 Starting, 10/2016, the Fed/Affordable Care Act dictates health car
Budget 2018 Budget 2019 Budget 2019 - w/AllocationsB2B Change
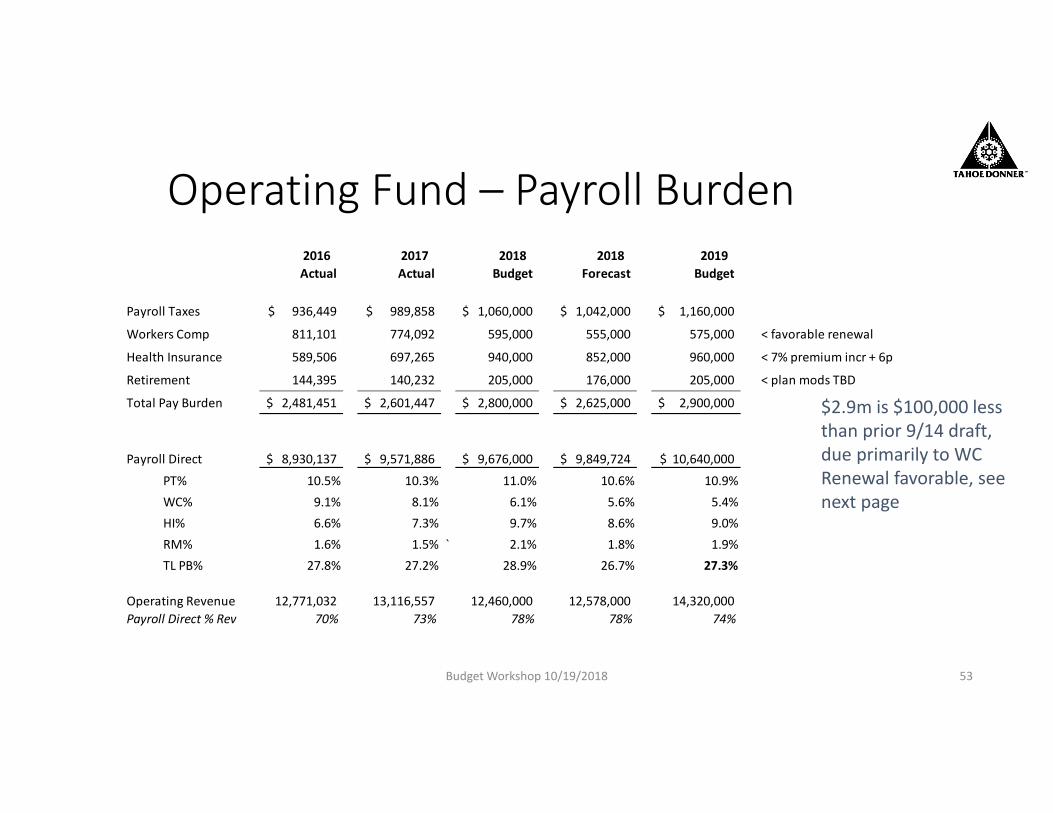
Operating Fund – Payroll Burden2016 2017 2018 2018 2019Actual Actual Budget Forecast Budget
Payroll Taxes 936,449$ 989,858$ 1,060,000$ 1,042,000$ 1,160,000$
Workers Comp 811,101 774,092 595,000 555,000 575,000 < favorable renewal
Health Insurance 589,506 697,265 940,000 852,000 960,000 < 7% premium incr + 6p
Retirement 144,395 140,232 205,000 176,000 205,000 < plan mods TBD
Total Pay Burden 2,481,451$ 2,601,447$ 2,800,000$ 2,625,000$ 2,900,000$
Payroll Direct 8,930,137$ 9,571,886$ 9,676,000$ 9,849,724$ 10,640,000$
PT% 10.5% 10.3% 11.0% 10.6% 10.9%WC% 9.1% 8.1% 6.1% 5.6% 5.4%HI% 6.6% 7.3% 9.7% 8.6% 9.0%RM% 1.6% 1.5% ` 2.1% 1.8% 1.9%TL PB% 27.8% 27.2% 28.9% 26.7% 27.3%
Operating Revenue 12,771,032 13,116,557 12,460,000 12,578,000 14,320,000 Payroll Direct % Rev 70% 73% 78% 78% 74%
Budget Workshop 10/19/2018 53
$2.9m is $100,000 less than prior 9/14 draft,due primarily to WC Renewal favorable, see next page
13%
11%
9%
6%
5%4% 4% 4%
5% 5%
7.7%8.2%
9.1%
8.1%
6.1%5.6% 5.4%
0%
2%
4%
6%
8%
10%
12%
14%
$0
$100,000
$200,000
$300,000
$400,000
$500,000
$600,000
$700,000
$800,000
$900,000
2004 2005 2006 2007 2008 2009 2010 2011 2012 2013 2014 2015 2016 2017 2018B
2018F
2019B
WC Costs
WC$ as a % of Payroll Direct
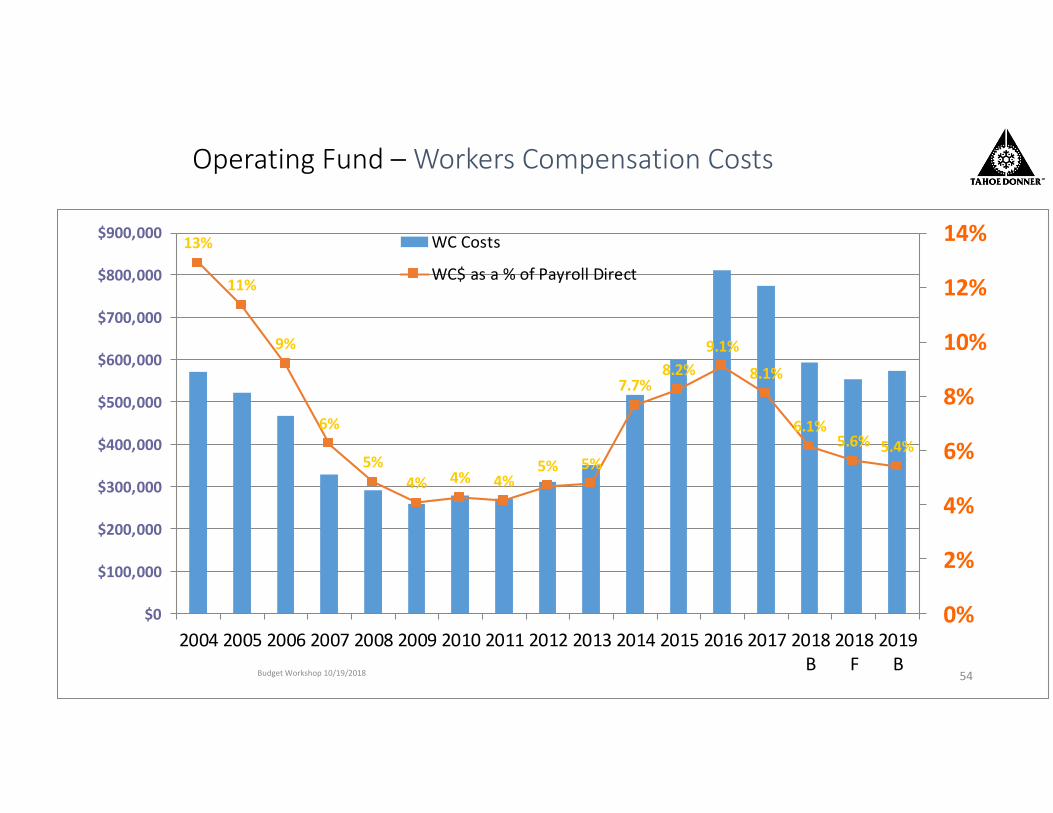
Operating Fund – Workers Compensation Costs
Budget Workshop 10/19/2018 54
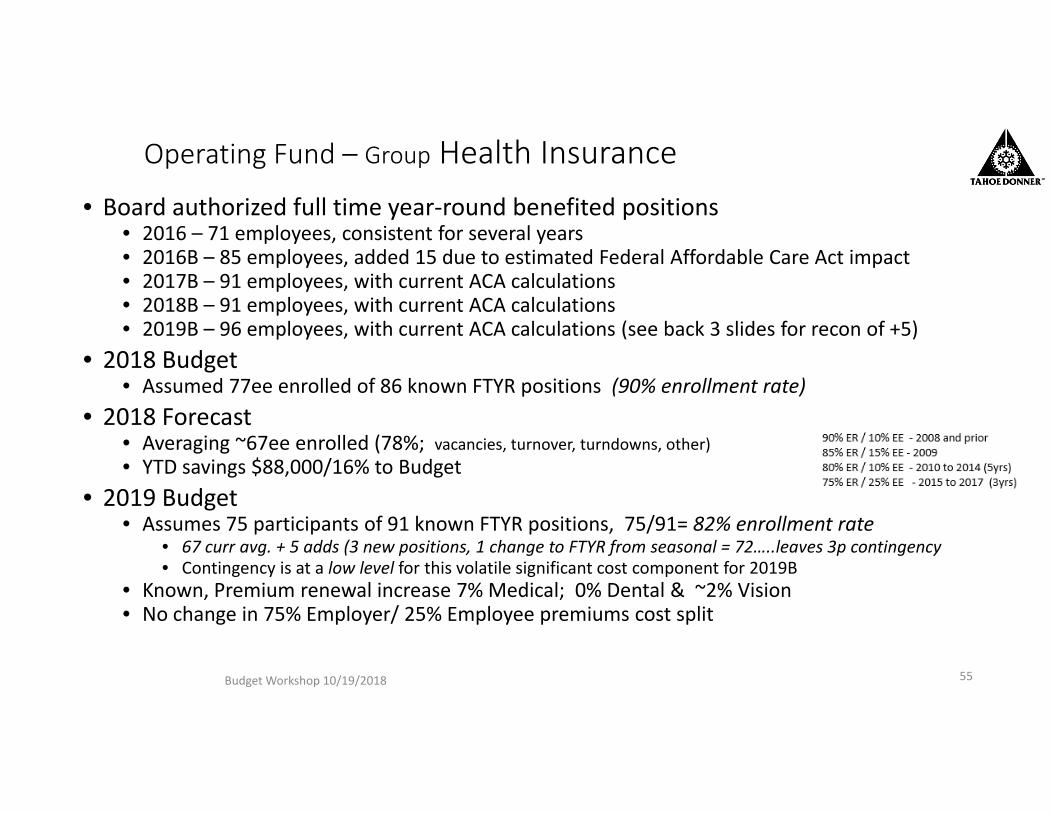
Operating Fund – Group Health Insurance• Board authorized full time year‐round benefited positions
• 2016 – 71 employees, consistent for several years• 2016B – 85 employees, added 15 due to estimated Federal Affordable Care Act impact• 2017B – 91 employees, with current ACA calculations• 2018B – 91 employees, with current ACA calculations• 2019B – 96 employees, with current ACA calculations (see back 3 slides for recon of +5)
• 2018 Budget• Assumed 77ee enrolled of 86 known FTYR positions (90% enrollment rate)
• 2018 Forecast• Averaging ~67ee enrolled (78%; vacancies, turnover, turndowns, other) • YTD savings $88,000/16% to Budget
• 2019 Budget• Assumes 75 participants of 91 known FTYR positions, 75/91= 82% enrollment rate
• 67 curr avg. + 5 adds (3 new positions, 1 change to FTYR from seasonal = 72…..leaves 3p contingency• Contingency is at a low level for this volatile significant cost component for 2019B
• Known, Premium renewal increase 7% Medical; 0% Dental & ~2% Vision• No change in 75% Employer/ 25% Employee premiums cost split
Budget Workshop 10/19/2018 55
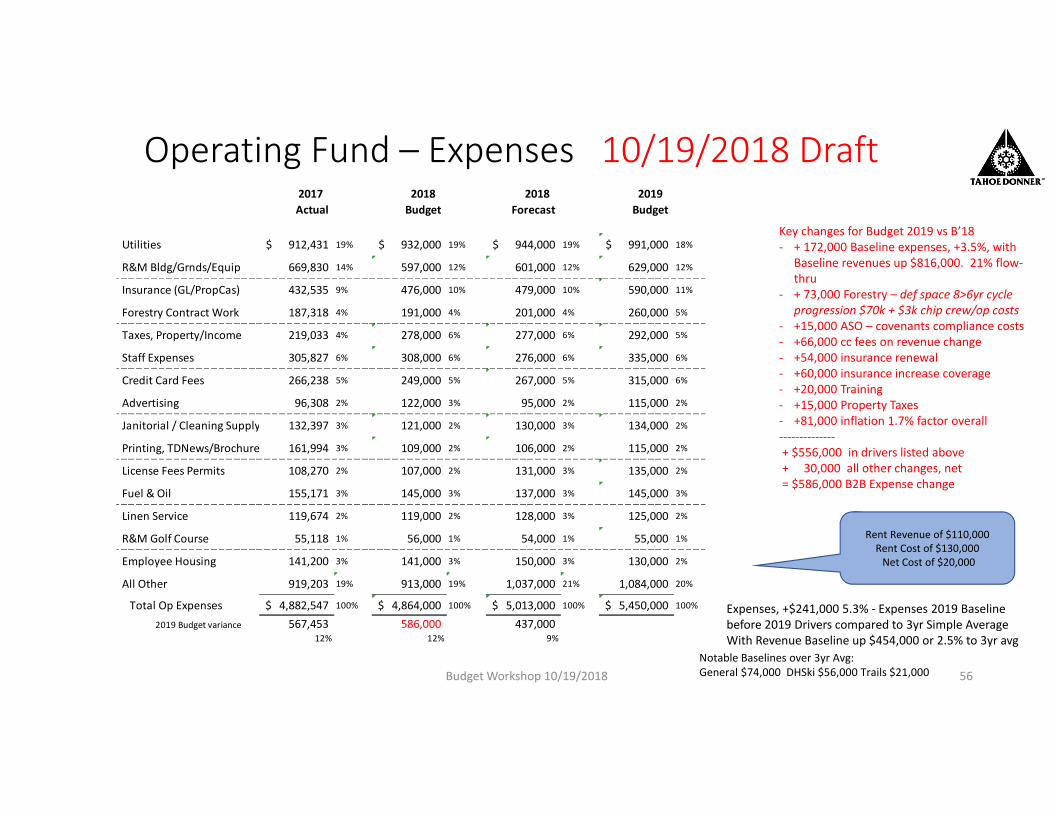
Operating Fund – Expenses 10/19/2018 Draft2017 2018 2018 2019Actual Budget Forecast Budget
Utilities 912,431$ 19% 932,000$ 19% 944,000$ 19% 991,000$ 18%
R&M Bldg/Grnds/Equip 669,830 14% 597,000 12% 601,000 12% 629,000 12%
Insurance (GL/PropCas) 432,535 9% 476,000 10% 479,000 10% 590,000 11%
Forestry Contract Work 187,318 4% 191,000 4% 201,000 4% 260,000 5%
Taxes, Property/Income 219,033 4% 278,000 6% 277,000 6% 292,000 5%
Staff Expenses 305,827 6% 308,000 6% 276,000 6% 335,000 6%
Credit Card Fees 266,238 5% 249,000 5% 267,000 5% 315,000 6%
Advertising 96,308 2% 122,000 3% 95,000 2% 115,000 2%
Janitorial / Cleaning Supply 132,397 3% 121,000 2% 130,000 3% 134,000 2%
Printing, TDNews/Brochure 161,994 3% 109,000 2% 106,000 2% 115,000 2%
License Fees Permits 108,270 2% 107,000 2% 131,000 3% 135,000 2%
Fuel & Oil 155,171 3% 145,000 3% 137,000 3% 145,000 3%
Linen Service 119,674 2% 119,000 2% 128,000 3% 125,000 2%
R&M Golf Course 55,118 1% 56,000 1% 54,000 1% 55,000 1%
Employee Housing 141,200 3% 141,000 3% 150,000 3% 130,000 2%
All Other 919,203 19% 913,000 19% 1,037,000 21% 1,084,000 20%
Total Op Expenses 4,882,547$ 100% 4,864,000$ 100% 5,013,000$ 100% 5,450,000$ 100%
2019 Budget variance 567,453 586,000 437,000 12% 12% 9%
Budget Workshop 10/19/2018 56
Rent Revenue of $110,000Rent Cost of $130,000Net Cost of $20,000
Key changes for Budget 2019 vs B’18‐ + 172,000 Baseline expenses, +3.5%, with
Baseline revenues up $816,000. 21% flow‐thru
‐ + 73,000 Forestry – def space 8>6yr cycle progression $70k + $3k chip crew/op costs
‐ +15,000 ASO – covenants compliance costs‐ +66,000 cc fees on revenue change‐ +54,000 insurance renewal ‐ +60,000 insurance increase coverage‐ +20,000 Training‐ +15,000 Property Taxes‐ +81,000 inflation 1.7% factor overall‐‐‐‐‐‐‐‐‐‐‐‐‐‐+ $556,000 in drivers listed above+ 30,000 all other changes, net= $586,000 B2B Expense change
Expenses, +$241,000 5.3% ‐ Expenses 2019 Baseline before 2019 Drivers compared to 3yr Simple AverageWith Revenue Baseline up $454,000 or 2.5% to 3yr avg
Notable Baselines over 3yr Avg:General $74,000 DHSki $56,000 Trails $21,000
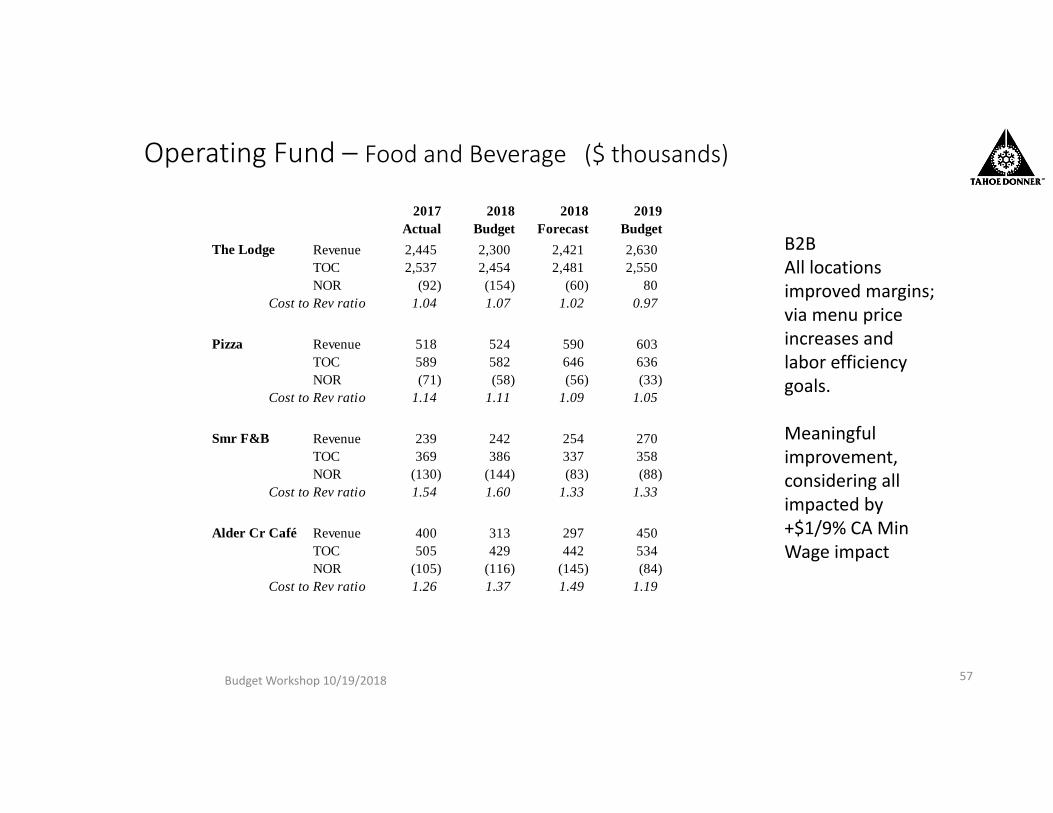
Operating Fund – Food and Beverage ($ thousands)
Budget Workshop 10/19/2018 57
2017 2018 2018 2019Actual Budget Forecast Budget
The Lodge Revenue 2,445 2,300 2,421 2,630 TOC 2,537 2,454 2,481 2,550 NOR (92) (154) (60) 80
Cost to Rev ratio 1.04 1.07 1.02 0.97
Pizza Revenue 518 524 590 603 TOC 589 582 646 636 NOR (71) (58) (56) (33)
Cost to Rev ratio 1.14 1.11 1.09 1.05
Smr F&B Revenue 239 242 254 270 TOC 369 386 337 358 NOR (130) (144) (83) (88)
Cost to Rev ratio 1.54 1.60 1.33 1.33
Alder Cr Café Revenue 400 313 297 450 TOC 505 429 442 534 NOR (105) (116) (145) (84)
Cost to Rev ratio 1.26 1.37 1.49 1.19
B2BAll locations improved margins; via menu price increases and labor efficiency goals.
Meaningful improvement, considering all impacted by +$1/9% CA Min Wage impact
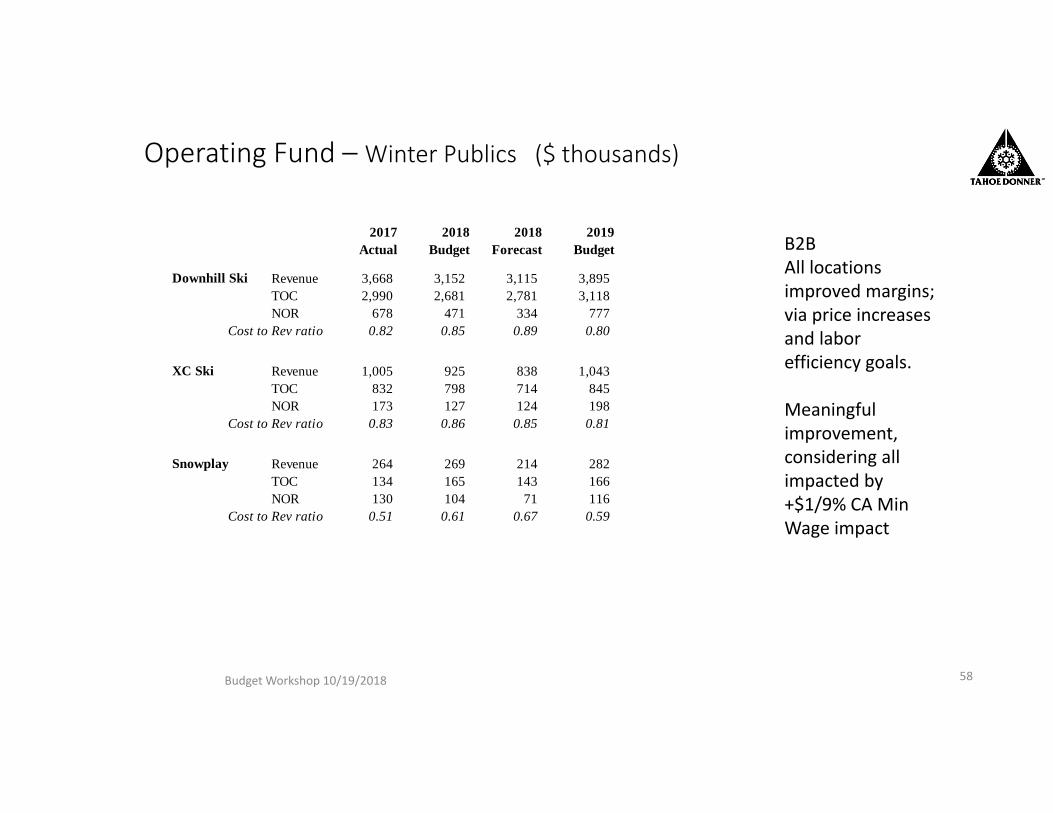
Operating Fund – Winter Publics ($ thousands)
Budget Workshop 10/19/2018 58
2017 2018 2018 2019Actual Budget Forecast Budget
Downhill Ski Revenue 3,668 3,152 3,115 3,895 TOC 2,990 2,681 2,781 3,118 NOR 678 471 334 777
Cost to Rev ratio 0.82 0.85 0.89 0.80
XC Ski Revenue 1,005 925 838 1,043 TOC 832 798 714 845 NOR 173 127 124 198
Cost to Rev ratio 0.83 0.86 0.85 0.81
Snowplay Revenue 264 269 214 282 TOC 134 165 143 166 NOR 130 104 71 116
Cost to Rev ratio 0.51 0.61 0.67 0.59
B2BAll locations improved margins; via price increases and labor efficiency goals.
Meaningful improvement, considering all impacted by +$1/9% CA Min Wage impact
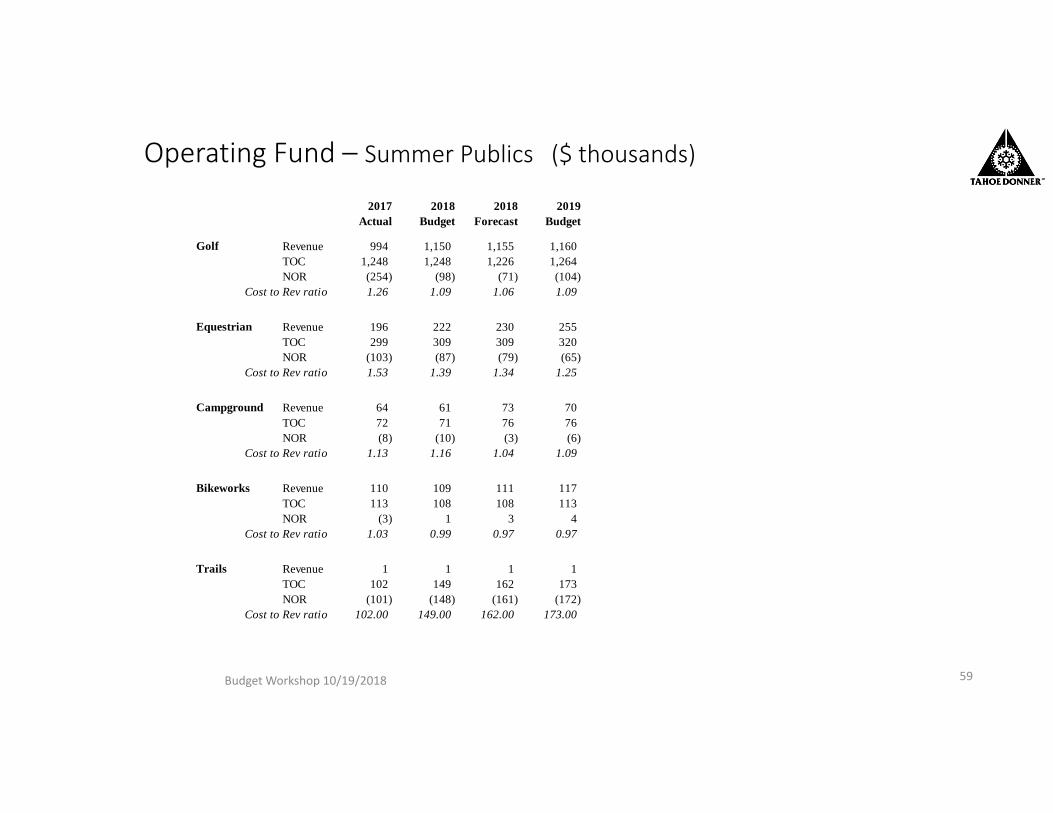
Operating Fund – Summer Publics ($ thousands)
Budget Workshop 10/19/2018 59
2017 2018 2018 2019Actual Budget Forecast Budget
Golf Revenue 994 1,150 1,155 1,160 TOC 1,248 1,248 1,226 1,264 NOR (254) (98) (71) (104)
Cost to Rev ratio 1.26 1.09 1.06 1.09
Equestrian Revenue 196 222 230 255 TOC 299 309 309 320 NOR (103) (87) (79) (65)
Cost to Rev ratio 1.53 1.39 1.34 1.25
Campground Revenue 64 61 73 70 TOC 72 71 76 76 NOR (8) (10) (3) (6)
Cost to Rev ratio 1.13 1.16 1.04 1.09
Bikeworks Revenue 110 109 111 117 TOC 113 108 108 113 NOR (3) 1 3 4
Cost to Rev ratio 1.03 0.99 0.97 0.97
Trails Revenue 1 1 1 1 TOC 102 149 162 173 NOR (101) (148) (161) (172)
Cost to Rev ratio 102.00 149.00 162.00 173.00
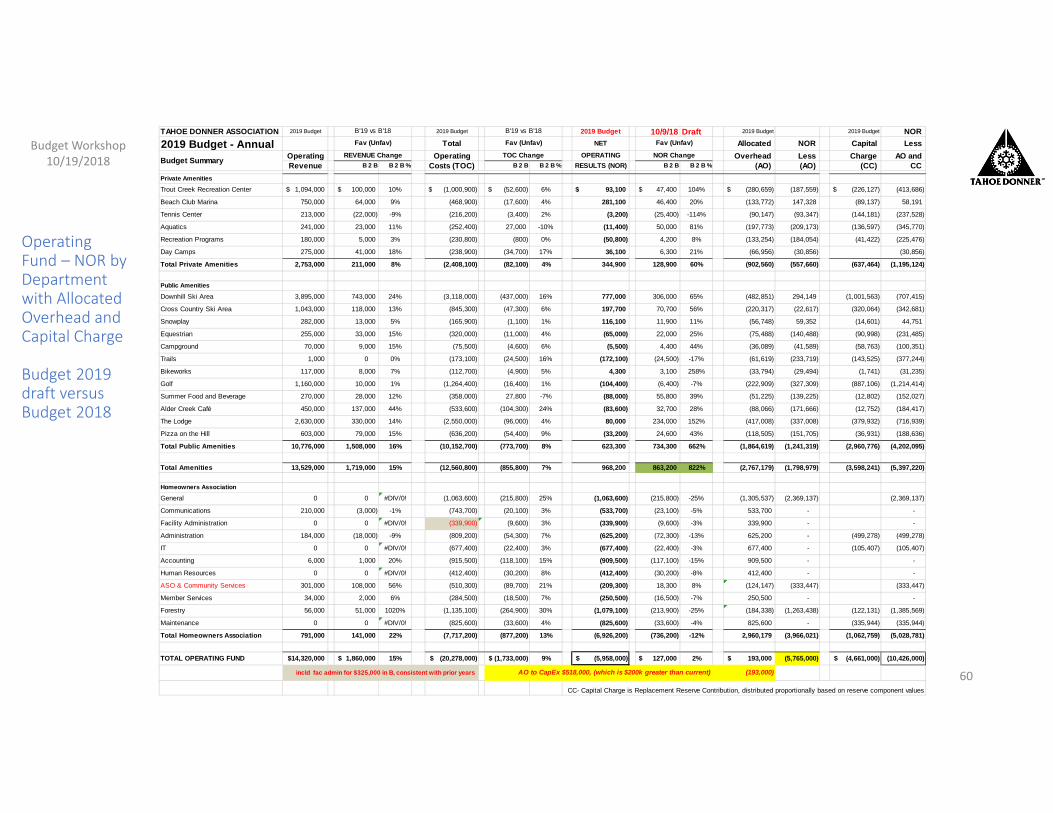
Operating Fund – NOR by Departmentwith Allocated Overhead and Capital Charge
Budget 2019 draft versus Budget 2018
Budget Workshop 10/19/2018
60
TAHOE DONNER ASSOCIATION 2019 Budget 2019 Budget 2019 Budget 10/9/18 Draft 2019 Budget 2019 Budget NOR
2019 Budget - Annual Total ra NET Allocated NOR Capital LessOperating Operating os OPERATING Overhead Less Charge AO andRevenue B 2 B B 2 B % Costs (TOC) l (O B 2 B B 2 B % RESULTS (NOR) B 2 B B 2 B % (AO) (AO) (CC) CC
Total (OCT)Private Amenities
Trout Creek Recreation Center 1,094,000$ 100,000$ 10% (1,000,900)$ (52,600)$ 6% 93,100$ 47,400$ 104% (280,659)$ (187,559) (226,127)$ (413,686)
Beach Club Marina 750,000 64,000 9% (468,900) (17,600) 4% 281,100 46,400 20% (133,772) 147,328 (89,137) 58,191
Tennis Center 213,000 (22,000) -9% (216,200) (3,400) 2% (3,200) (25,400) -114% (90,147) (93,347) (144,181) (237,528)
Aquatics 241,000 23,000 11% (252,400) 27,000 -10% (11,400) 50,000 81% (197,773) (209,173) (136,597) (345,770)
Recreation Programs 180,000 5,000 3% (230,800) (800) 0% (50,800) 4,200 8% (133,254) (184,054) (41,422) (225,476)
Day Camps 275,000 41,000 18% (238,900) (34,700) 17% 36,100 6,300 21% (66,956) (30,856) (30,856)
Total Private Amenities 2,753,000 211,000 8% (2,408,100) (82,100) 4% 344,900 128,900 60% (902,560) (557,660) (637,464) (1,195,124)
Public Amenities
Downhill Ski Area 3,895,000 743,000 24% (3,118,000) (437,000) 16% 777,000 306,000 65% (482,851) 294,149 (1,001,563) (707,415)
Cross Country Ski Area 1,043,000 118,000 13% (845,300) (47,300) 6% 197,700 70,700 56% (220,317) (22,617) (320,064) (342,681)
Snowplay 282,000 13,000 5% (165,900) (1,100) 1% 116,100 11,900 11% (56,748) 59,352 (14,601) 44,751
Equestrian 255,000 33,000 15% (320,000) (11,000) 4% (65,000) 22,000 25% (75,488) (140,488) (90,998) (231,485)
Campground 70,000 9,000 15% (75,500) (4,600) 6% (5,500) 4,400 44% (36,089) (41,589) (58,763) (100,351)
Trails 1,000 0 0% (173,100) (24,500) 16% (172,100) (24,500) -17% (61,619) (233,719) (143,525) (377,244)
Bikeworks 117,000 8,000 7% (112,700) (4,900) 5% 4,300 3,100 258% (33,794) (29,494) (1,741) (31,235)
Golf 1,160,000 10,000 1% (1,264,400) (16,400) 1% (104,400) (6,400) -7% (222,909) (327,309) (887,106) (1,214,414)
Summer Food and Beverage 270,000 28,000 12% (358,000) 27,800 -7% (88,000) 55,800 39% (51,225) (139,225) (12,802) (152,027)
Alder Creek Café 450,000 137,000 44% (533,600) (104,300) 24% (83,600) 32,700 28% (88,066) (171,666) (12,752) (184,417)
The Lodge 2,630,000 330,000 14% (2,550,000) (96,000) 4% 80,000 234,000 152% (417,008) (337,008) (379,932) (716,939)
Pizza on the Hill 603,000 79,000 15% (636,200) (54,400) 9% (33,200) 24,600 43% (118,505) (151,705) (36,931) (188,636)
Total Public Amenities 10,776,000 1,508,000 16% (10,152,700) (773,700) 8% 623,300 734,300 662% (1,864,619) (1,241,319) (2,960,776) (4,202,095)
Total Amenities 13,529,000 1,719,000 15% (12,560,800) (855,800) 7% 968,200 863,200 822% (2,767,179) (1,798,979) (3,598,241) (5,397,220)
Homeowners Association
General 0 0 #DIV/0! (1,063,600) (215,800) 25% (1,063,600) (215,800) -25% (1,305,537) (2,369,137) (2,369,137)
Communications 210,000 (3,000) -1% (743,700) (20,100) 3% (533,700) (23,100) -5% 533,700 - -
Facility Administration 0 0 #DIV/0! (339,900) (9,600) 3% (339,900) (9,600) -3% 339,900 - -
Administration 184,000 (18,000) -9% (809,200) (54,300) 7% (625,200) (72,300) -13% 625,200 - (499,278) (499,278)
IT 0 0 #DIV/0! (677,400) (22,400) 3% (677,400) (22,400) -3% 677,400 - (105,407) (105,407)
Accounting 6,000 1,000 20% (915,500) (118,100) 15% (909,500) (117,100) -15% 909,500 - -
Human Resources 0 0 #DIV/0! (412,400) (30,200) 8% (412,400) (30,200) -8% 412,400 - -
ASO & Community Services 301,000 108,000 56% (510,300) (89,700) 21% (209,300) 18,300 8% (124,147) (333,447) (333,447)
Member Services 34,000 2,000 6% (284,500) (18,500) 7% (250,500) (16,500) -7% 250,500 - -
Forestry 56,000 51,000 1020% (1,135,100) (264,900) 30% (1,079,100) (213,900) -25% (184,338) (1,263,438) (122,131) (1,385,569)
Maintenance 0 0 #DIV/0! (825,600) (33,600) 4% (825,600) (33,600) -4% 825,600 - (335,944) (335,944)
Total Homeowners Association 791,000 141,000 22% (7,717,200) (877,200) 13% (6,926,200) (736,200) -12% 2,960,179 (3,966,021) (1,062,759) (5,028,781)
TOTAL OPERATING FUND 14,320,000$ 1,860,000$ 15% (20,278,000)$ (1,733,000)$ 9% (5,958,000)$ 127,000$ 2% 193,000$ (5,765,000) (4,661,000)$ (10,426,000)
incld fac admin for $325,000 in B, consistent with prior years AO to CapEx $518,000, (which is $200k greater than current) (193,000)
CC- Capital Charge is Replacement Reserve Contribution, distributed proportionally based on reserve component values
B'19 vs B'18 B'19 vs B'18
Fav (Unfav)
Budget SummaryNOR Change
Fav (Unfav)
REVENUE Change
Fav (Unfav)
TOC Change
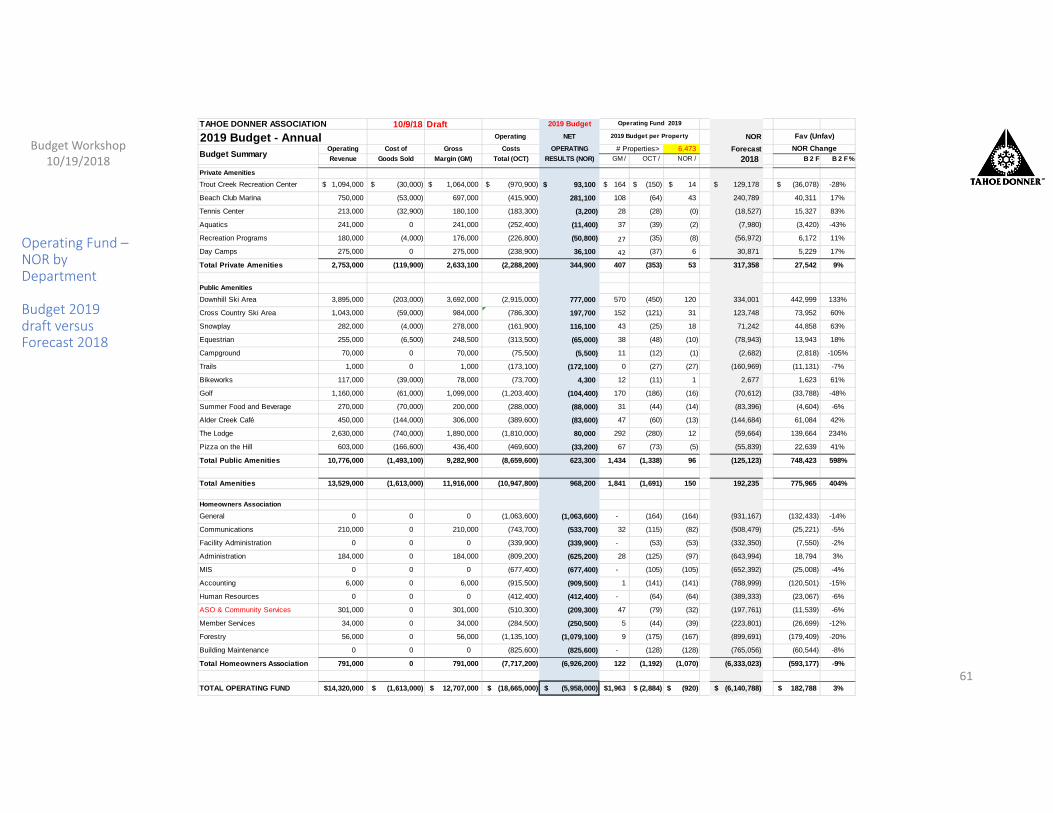
Operating Fund –NOR by Department
Budget 2019 draft versus Forecast 2018
Budget Workshop 10/19/2018
61
TAHOE DONNER ASSOCIATION 10/9/18 Draft 2019 Budget
2019 Budget - Annual Operating NET NOROperating Cost of Gross Costs OPERATING # Properties> 6,473 ForecastRevenue Goods Sold Margin (GM) Total (OCT) RESULTS (NOR) GM / OCT / NOR / 2018 B 2 F B 2 F %
Private Amenities
Trout Creek Recreation Center 1,094,000$ (30,000)$ 1,064,000$ (970,900)$ 93,100$ 164$ (150)$ 14$ 129,178$ (36,078)$ -28%
Beach Club Marina 750,000 (53,000) 697,000 (415,900) 281,100 108 (64) 43 240,789 40,311 17%
Tennis Center 213,000 (32,900) 180,100 (183,300) (3,200) 28 (28) (0) (18,527) 15,327 83%
Aquatics 241,000 0 241,000 (252,400) (11,400) 37 (39) (2) (7,980) (3,420) -43%
Recreation Programs 180,000 (4,000) 176,000 (226,800) (50,800) 27 (35) (8) (56,972) 6,172 11%
Day Camps 275,000 0 275,000 (238,900) 36,100 42 (37) 6 30,871 5,229 17%
Total Private Amenities 2,753,000 (119,900) 2,633,100 (2,288,200) 344,900 407 (353) 53 317,358 27,542 9%
Public Amenities
Downhill Ski Area 3,895,000 (203,000) 3,692,000 (2,915,000) 777,000 570 (450) 120 334,001 442,999 133%
Cross Country Ski Area 1,043,000 (59,000) 984,000 (786,300) 197,700 152 (121) 31 123,748 73,952 60%
Snowplay 282,000 (4,000) 278,000 (161,900) 116,100 43 (25) 18 71,242 44,858 63%
Equestrian 255,000 (6,500) 248,500 (313,500) (65,000) 38 (48) (10) (78,943) 13,943 18%
Campground 70,000 0 70,000 (75,500) (5,500) 11 (12) (1) (2,682) (2,818) -105%
Trails 1,000 0 1,000 (173,100) (172,100) 0 (27) (27) (160,969) (11,131) -7%
Bikeworks 117,000 (39,000) 78,000 (73,700) 4,300 12 (11) 1 2,677 1,623 61%
Golf 1,160,000 (61,000) 1,099,000 (1,203,400) (104,400) 170 (186) (16) (70,612) (33,788) -48%
Summer Food and Beverage 270,000 (70,000) 200,000 (288,000) (88,000) 31 (44) (14) (83,396) (4,604) -6%
Alder Creek Café 450,000 (144,000) 306,000 (389,600) (83,600) 47 (60) (13) (144,684) 61,084 42%
The Lodge 2,630,000 (740,000) 1,890,000 (1,810,000) 80,000 292 (280) 12 (59,664) 139,664 234%
Pizza on the Hill 603,000 (166,600) 436,400 (469,600) (33,200) 67 (73) (5) (55,839) 22,639 41%
Total Public Amenities 10,776,000 (1,493,100) 9,282,900 (8,659,600) 623,300 1,434 (1,338) 96 (125,123) 748,423 598%
Total Amenities 13,529,000 (1,613,000) 11,916,000 (10,947,800) 968,200 1,841 (1,691) 150 192,235 775,965 404%
Homeowners Association
General 0 0 0 (1,063,600) (1,063,600) - (164) (164) (931,167) (132,433) -14%
Communications 210,000 0 210,000 (743,700) (533,700) 32 (115) (82) (508,479) (25,221) -5%
Facility Administration 0 0 0 (339,900) (339,900) - (53) (53) (332,350) (7,550) -2%
Administration 184,000 0 184,000 (809,200) (625,200) 28 (125) (97) (643,994) 18,794 3%
MIS 0 0 0 (677,400) (677,400) - (105) (105) (652,392) (25,008) -4%
Accounting 6,000 0 6,000 (915,500) (909,500) 1 (141) (141) (788,999) (120,501) -15%
Human Resources 0 0 0 (412,400) (412,400) - (64) (64) (389,333) (23,067) -6%
ASO & Community Services 301,000 0 301,000 (510,300) (209,300) 47 (79) (32) (197,761) (11,539) -6%
Member Services 34,000 0 34,000 (284,500) (250,500) 5 (44) (39) (223,801) (26,699) -12%
Forestry 56,000 0 56,000 (1,135,100) (1,079,100) 9 (175) (167) (899,691) (179,409) -20%
Building Maintenance 0 0 0 (825,600) (825,600) - (128) (128) (765,056) (60,544) -8%
Total Homeowners Association 791,000 0 791,000 (7,717,200) (6,926,200) 122 (1,192) (1,070) (6,333,023) (593,177) -9%
TOTAL OPERATING FUND 14,320,000$ (1,613,000)$ 12,707,000$ (18,665,000)$ (5,958,000)$ 1,963$ (2,884)$ (920)$ (6,140,788)$ 182,788$ 3%
Operating Fund 2019
2019 Budget per Property Fav (Unfav)
Budget SummaryNOR Change
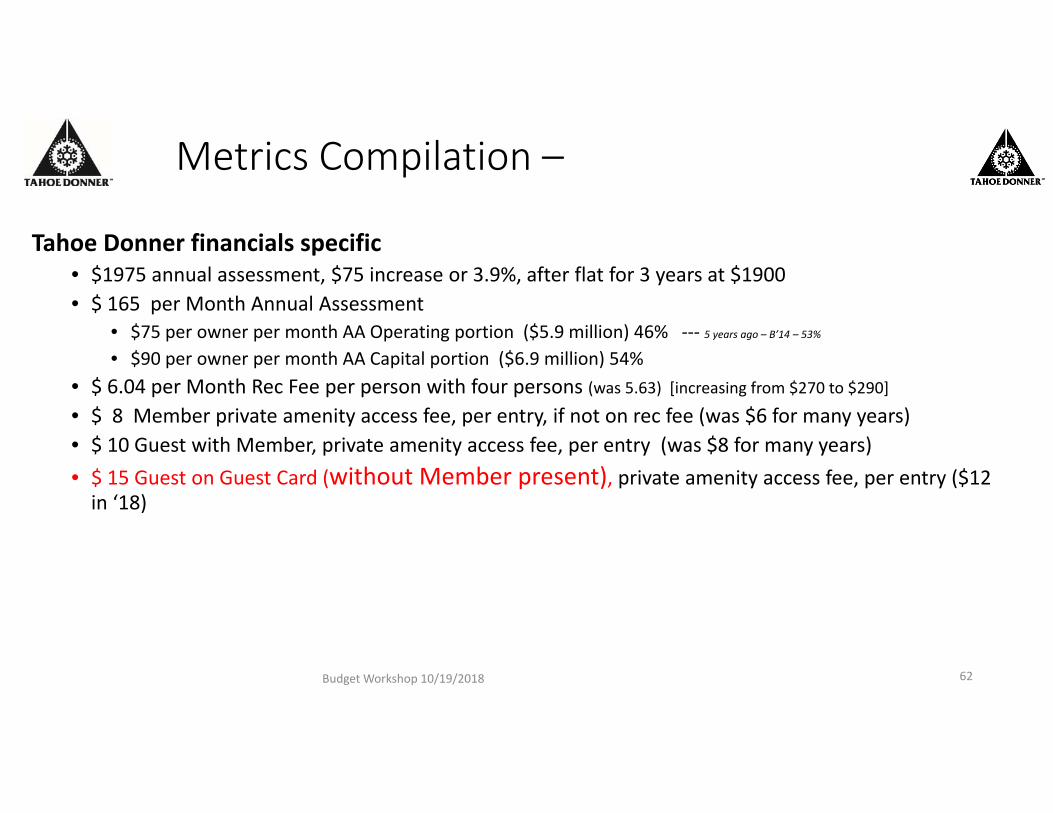
Metrics Compilation –
Tahoe Donner financials specific• $1975 annual assessment, $75 increase or 3.9%, after flat for 3 years at $1900• $ 165 per Month Annual Assessment
• $75 per owner per month AA Operating portion ($5.9 million) 46% ‐‐‐ 5 years ago – B’14 – 53%
• $90 per owner per month AA Capital portion ($6.9 million) 54%• $ 6.04 per Month Rec Fee per person with four persons (was 5.63) [increasing from $270 to $290]
• $ 8 Member private amenity access fee, per entry, if not on rec fee (was $6 for many years)• $ 10 Guest with Member, private amenity access fee, per entry (was $8 for many years)• $ 15 Guest on Guest Card (without Member present), private amenity access fee, per entry ($12 in ‘18)
Budget Workshop 10/19/2018 62

Replacement NewOperating Reserve Development Equipment
Fund Fund Fund Fund Total
940$ 620$ 310$ 30$ 1,900$ 2018 AA per owner(50)$ 100$ 25$ ‐$ 75$ changes‐5.3% 16.1% 8.1% 0.0% 3.9%
890$ 720$ 335$ 30$ 1,975$ 3.9% 2019 AA per owner, draft 10/19 RECOMMENDED5,761,000$ 4,661,000$ 2,168,000$ 194,000$ 12,784,000$ 2019 AA revenue, draft 10/19
(324,000)$ 648,000$ 161,000$ ‐$ 485,000$ 2019 AA revenue change, draft 10/19
OPTIONS for Modifications from Recommended 2019 AA include:S1) (25) (40) (5) (5) (75)$ S1) Drop Financial Analyst $15, drop Insurance
865 680 330 25 1,900 +$25m increase $10 & lower cap funding levels‐8% 10% 6% ‐17% 0% AA change to 2018 AA
S2) ‐ (65) (5) (5) (75)$ S2) lower capital funding levels, mainly RRF890 655 330 25 1,900 ‐5% 6% 6% ‐17% 0% AA change to 2018 AA
S3) ‐ ‐ (60) (15) (75)$ S3) Decrease funding level of DEV Fund890 720 275 15 1,900 and New Equip Fund‐5% 16% ‐11% ‐50% 0% AA change to 2018 AA
Annual Assessment per owner ‐ 2019 10/19/18 draft
Budget Workshop 10/19/2018 63
S1‐S3 options lower the capital funding level not expenditure level. (ie the changes equate to less savings for future capital needs).
With AA flat last 3 years, not increasing for 2019 potentially places greater pressure in 2020 to increase more than 3‐5%; in order to achieve a balanced budget and adequate capital funding levels
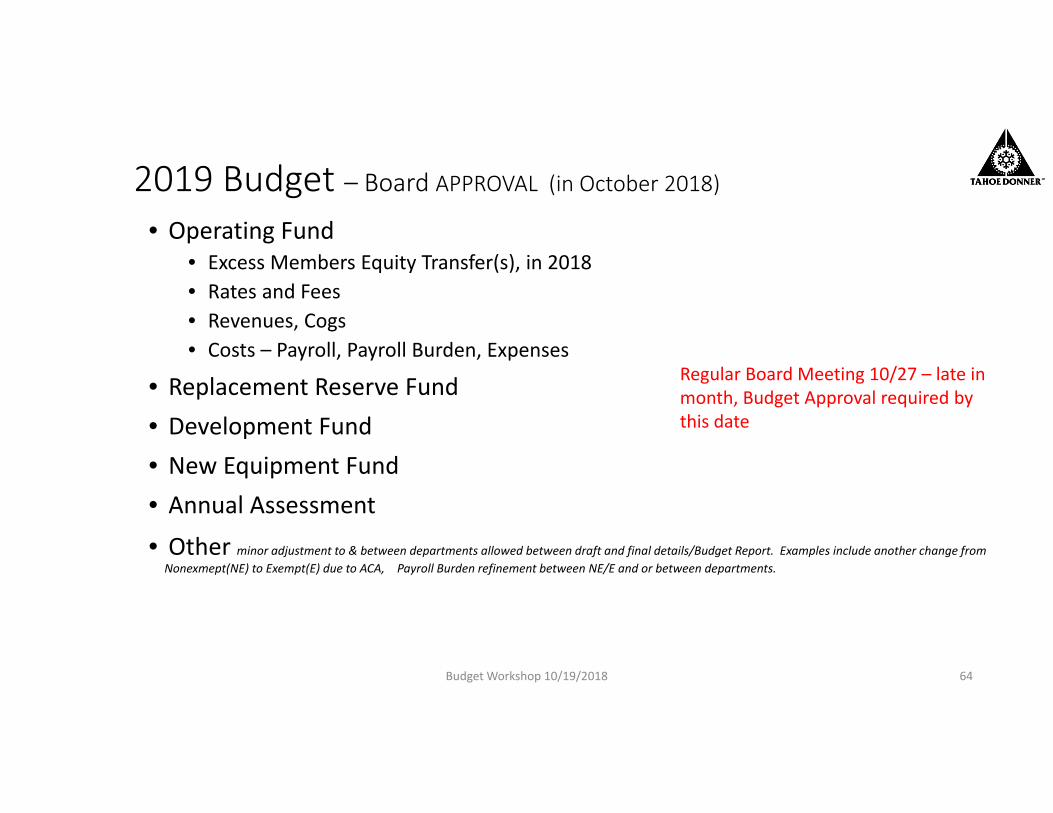
2019 Budget – Board APPROVAL (in October 2018)• Operating Fund
• Excess Members Equity Transfer(s), in 2018• Rates and Fees• Revenues, Cogs• Costs – Payroll, Payroll Burden, Expenses
• Replacement Reserve Fund • Development Fund• New Equipment Fund• Annual Assessment
• Other minor adjustment to & between departments allowed between draft and final details/Budget Report. Examples include another change from Nonexmept(NE) to Exempt(E) due to ACA, Payroll Burden refinement between NE/E and or between departments.
Budget Workshop 10/19/2018
Regular Board Meeting 10/27 – late in month, Budget Approval required by this date
64
2019 Budget – next steps
‐ next … Budget Approval October 27, 2018
•Operating Fund•Board / FC/ GPC / other guidance refinement
•Capital Funds•Board / FC/ GPC / other guidance refinement
Budget Workshop 10/19/2018 65