Embed Size (px)
Citation preview

Age group N Relative Survival 95% LCI 95% UCI N Relative Survival 95% LCI 95% UCI N Relative Survival 95% LCI 95% UCI
All Ages 11,274,474 66.0% 66.0% 66.0% 5,834,452 66.0% 65.9% 66.0% 5,440,022 66.0% 66.0% 66.1%
Ages <45 1,097,660 81.3% 81.3% 81.4% 425,701 76.6% 76.5% 76.8% 671,959 84.3% 84.2% 84.4%
Ages 45-54 1,663,337 72.7% 72.7% 72.8% 756,178 67.3% 67.1% 67.4% 907,159 77.3% 77.2% 77.4%
Ages 55-64 2,729,459 69.3% 69.3% 69.4% 1,539,492 69.0% 68.9% 69.1% 1,189,967 69.8% 69.7% 69.9%
Ages 65-74 2,918,095 65.2% 65.2% 65.3% 1,708,305 67.9% 67.8% 68.0% 1,209,790 61.5% 61.4% 61.6%
Ages 75+ 2,865,923 52.8% 52.7% 52.9% 1,404,776 55.8% 55.7% 56.0% 1,461,147 49.9% 49.8% 50.0%
Ages <65 5,490,456 72.8% 72.8% 72.9% 2,721,371 69.7% 69.7% 69.8% 2,769,085 75.9% 75.8% 75.9%
Ages 65+ 5,784,018 59.2% 59.2% 59.3% 3,113,081 62.6% 62.5% 62.7% 2,670,937 55.3% 55.2% 55.4%
Age group N Relative Survival 95% LCI 95% UCI N Relative Survival 95% LCI 95% UCI N Relative Survival 95% LCI 95% UCI
All Ages 9,467,692 66.3% 66.2% 66.3% 4,890,198 65.9% 65.9% 66.0% 4,577,494 66.6% 66.6% 66.7%
Ages <45 875,485 82.8% 82.7% 82.9% 344,620 78.3% 78.2% 78.5% 530,865 85.7% 85.6% 85.8%
Ages 45-54 1,333,049 74.0% 73.9% 74.0% 601,184 68.1% 68.0% 68.2% 731,865 78.8% 78.7% 78.9%
Ages 55-64 2,243,057 69.9% 69.8% 70.0% 1,254,413 69.1% 69.0% 69.2% 988,644 70.9% 70.8% 71.0%
Ages 65-74 2,480,112 65.3% 65.3% 65.4% 1,446,356 67.5% 67.4% 67.6% 1,033,756 62.3% 62.2% 62.4%
Ages 75+ 2,535,989 53.1% 53.0% 53.2% 1,243,625 55.6% 55.4% 55.7% 1,292,364 50.7% 50.6% 50.8%
Ages <65 4,451,591 73.7% 73.7% 73.7% 2,200,217 70.3% 70.2% 70.4% 2,251,374 77.0% 77.0% 77.1%
Ages 65+ 5,016,101 59.3% 59.2% 59.3% 2,689,981 62.2% 62.1% 62.3% 2,326,120 56.0% 55.9% 56.0%
Age group N Relative Survival 95% LCI 95% UCI N Relative Survival 95% LCI 95% UCI N Relative Survival 95% LCI 95% UCI
All Ages 1,278,517 60.7% 60.6% 60.8% 672,369 63.1% 63.0% 63.3% 606,148 58.0% 57.9% 58.2%
Ages <45 141,517 70.3% 70.0% 70.5% 51,970 63.5% 63.1% 64.0% 89,547 74.2% 73.8% 74.5%
Ages 45-54 238,439 63.3% 63.1% 63.5% 117,439 61.0% 60.7% 61.3% 121,000 65.6% 65.3% 65.9%
Ages 55-64 360,460 63.3% 63.2% 63.5% 215,905 66.0% 65.8% 66.3% 144,555 59.3% 59.0% 59.7%
Ages 65-74 312,598 61.2% 60.9% 61.4% 184,635 66.9% 66.6% 67.2% 127,963 52.9% 52.6% 53.3%
Ages 75+ 225,503 45.9% 45.6% 46.2% 102,420 52.2% 51.7% 52.7% 123,083 40.8% 40.4% 41.2%
Ages <65 740,416 64.7% 64.5% 64.8% 385,314 64.1% 63.9% 64.3% 355,102 65.3% 65.1% 65.5%
Ages 65+ 538,101 55.0% 54.8% 55.2% 287,055 61.9% 61.6% 62.1% 251,046 47.1% 46.9% 47.4%
¶Data compiled from 34 cancer registries (AL, AK, AZ, CA, CO, DE, FL, GA, ID, IL, IN, KS, KY, LA, ME, MD, MI, MN, MS, MT, NE, NH, NJ, NY, NC, ND, OR, PA, RI, SC, VT, WV, WI, and WY) that met the
data quality criteria for survival analysis (covering approximately 70% of the U.S. population), as submitted to CDC’s National Program of Cancer Registries (NPCR) in November 2016. For more
information see USCS technical notes (http://www.cdc.gov/cancer/npcr/uscs/technical_notes/relative_survival/).
*Based on cases diagnosed between 2001-2013 and follow-up of patients through 2013.
Abbreviations: LCI = Lower confidence interval; UCI = Upper confidence interval.
Female
Male and female Male Female
Table 1. Five-Year Relative Survival*, All Cancer Sites Combined, by Race, Sex, and Age Group — National Program of Cancer Registries¶, 2001-2013.
All Cancer Sites Combined
All Cancer Sites Combined
All Cancer Sites Combined
Black
All Races
Male and female Male Female
White
Male and female Male

Age group N Relative Survival 95% LCI 95% UCI N Relative Survival 95% LCI 95% UCI N Relative Survival 95% LCI 95% UCI
All Ages 314,618 60.1% 59.9% 60.3% 219,410 58.9% 58.6% 59.1% 95,208 62.8% 62.4% 63.2%
Ages <45 26,351 77.6% 77.0% 78.1% 16,516 74.6% 73.8% 75.3% 9,835 82.6% 81.7% 83.4%
Ages 45-54 63,984 66.1% 65.7% 66.5% 48,121 64.7% 64.2% 65.2% 15,863 70.4% 69.6% 71.2%
Ages 55-64 90,661 61.2% 60.8% 61.6% 68,773 59.8% 59.3% 60.2% 21,888 65.6% 64.8% 66.3%
Ages 65-74 71,673 55.1% 54.7% 55.6% 50,267 53.4% 52.9% 54.0% 21,406 58.9% 58.1% 59.7%
Ages 75+ 64,767 48.4% 47.7% 49.0% 37,622 47.1% 46.3% 47.9% 27,145 50.0% 49.0% 50.9%
Ages <65 179,882 65.6% 65.3% 65.9% 132,612 63.6% 63.3% 63.9% 47,270 71.0% 70.5% 71.5%
Ages 65+ 135,729 52.0% 51.6% 52.4% 87,475 50.8% 50.3% 51.3% 48,254 54.1% 53.4% 54.7%
Age group N Relative Survival 95% LCI 95% UCI N Relative Survival 95% LCI 95% UCI N Relative Survival 95% LCI 95% UCI
All Ages 267,935 61.5% 61.2% 61.7% 187,437 60.8% 60.5% 61.1% 80,498 63.0% 62.6% 63.5%
Ages <45 19,772 79.3% 78.6% 79.9% 12,589 76.7% 75.9% 77.5% 7,183 83.8% 82.9% 84.7%
Ages 45-54 52,320 68.9% 68.5% 69.4% 39,849 67.8% 67.3% 68.3% 12,471 72.5% 71.5% 73.3%
Ages 55-64 76,737 63.3% 62.9% 63.7% 58,474 62.2% 61.7% 62.7% 18,263 66.9% 66.0% 67.7%
Ages 65-74 62,469 56.7% 56.1% 57.2% 43,789 55.4% 54.8% 56.0% 18,680 59.4% 58.5% 60.3%
Ages 75+ 59,128 48.9% 48.3% 49.6% 34,398 48.0% 47.1% 48.9% 24,730 50.2% 49.2% 51.1%
Ages <65 147,891 67.7% 67.4% 68.0% 110,238 66.1% 65.8% 66.5% 37,653 72.2% 71.7% 72.7%
Ages 65+ 120,938 53.0% 52.6% 53.5% 77,803 52.3% 51.8% 52.8% 43,135 54.3% 53.7% 55.0%
Age group N Relative Survival 95% LCI 95% UCI N Relative Survival 95% LCI 95% UCI N Relative Survival 95% LCI 95% UCI
All Ages 32,158 44.0% 43.4% 44.7% 22,500 39.4% 38.6% 40.2% 9,658 54.7% 53.5% 55.9%
Ages <45 3,707 64.9% 63.1% 66.5% 2,154 57.5% 55.1% 59.8% 1,553 75.0% 72.6% 77.3%
Ages 45-54 8,293 44.8% 43.6% 46.0% 5,952 40.8% 39.4% 42.2% 2,341 55.0% 52.7% 57.3%
Ages 55-64 10,255 42.3% 41.1% 43.4% 7,720 39.1% 37.7% 40.4% 2,535 52.0% 49.6% 54.3%
Ages 65-74 6,555 37.3% 35.7% 38.8% 4,755 33.0% 31.2% 34.7% 1,800 48.2% 45.2% 51.1%
Ages 75+ 3,583 34.8% 32.4% 37.2% 2,082 29.1% 26.1% 32.2% 1,501 42.3% 38.5% 46.0%
Ages <65 22,128 47.3% 46.5% 48.0% 15,739 42.4% 41.5% 43.3% 6,389 59.1% 57.7% 60.4%
Ages 65+ 10,105 36.3% 35.0% 37.6% 6,818 31.8% 30.2% 33.3% 3,287 45.4% 43.1% 47.7%
Oral Cavity and Pharynx Cancer
Black
Table 2. Five-Year Relative Survival*, Oral Cavity and Pharynx Cancer, by Race, Sex, and Age Group — National Program of Cancer Registries¶, 2001-2012.
White
Male and female Male Female
Oral Cavity and Pharynx Cancer
All Races
Male and female Male Female
Oral Cavity and Pharynx Cancer
¶Data compiled from 34 cancer registries (AL, AK, AZ, CA, CO, DE, FL, GA, ID, IL, IN, KS, KY, LA, ME, MD, MI, MN, MS, MT, NE, NH, NJ, NY, NC, ND, OR, PA, RI, SC, VT, WV, WI, and WY) that
met the data quality criteria for survival analysis (covering approximately 70% of the U.S. population), as submitted to CDC’s National Program of Cancer Registries (NPCR) in November
2016. For more information see USCS technical notes (http://www.cdc.gov/cancer/npcr/uscs/technical_notes/relative_survival/).
*Based on cases diagnosed between 2001-2013 and follow-up of patients through 2013.
Male and female Male Female
Abbreviations: LCI = Lower confidence interval; UCI = Upper confidence interval.

Age group N Relative Survival 95% LCI 95% UCI N Relative Survival 95% LCI 95% UCI N Relative Survival 95% LCI 95% UCI
All Ages 140,076 18.2% 17.9% 18.4% 108,910 18.0% 17.7% 18.3% 31,166 18.7% 18.2% 19.3%
Ages <45 3,753 22.4% 21.0% 23.9% 3,040 21.2% 19.7% 22.9% 713 27.6% 24.1% 31.3%
Ages 45-54 16,856 20.9% 20.2% 21.6% 13,943 20.2% 19.5% 21.0% 2,913 24.2% 22.5% 26.0%
Ages 55-64 36,552 20.0% 19.5% 20.5% 30,280 19.6% 19.0% 20.1% 6,272 22.0% 20.8% 23.2%
Ages 65-74 40,742 19.6% 19.1% 20.1% 32,188 19.1% 18.6% 19.7% 8,554 21.2% 20.2% 22.3%
Ages 75+ 42,282 13.4% 12.9% 13.8% 29,541 13.4% 12.8% 14.0% 12,741 13.3% 12.5% 14.1%
Ages <65 57,140 20.4% 20.0% 20.8% 47,247 19.9% 19.5% 20.3% 9,893 23.1% 22.1% 24.0%
Ages 65+ 82,977 16.5% 16.2% 16.8% 61,694 16.5% 16.1% 16.9% 21,283 16.6% 16.0% 17.3%
Age group N Relative Survival 95% LCI 95% UCI N Relative Survival 95% LCI 95% UCI N Relative Survival 95% LCI 95% UCI
All Ages 119,917 18.9% 18.6% 19.1% 94,607 18.7% 18.4% 19.0% 25,310 19.3% 18.7% 19.9%
Ages <45 3,082 23.0% 21.4% 24.7% 2,585 21.5% 19.8% 23.3% 497 31.3% 26.9% 35.8%
Ages 45-54 13,561 22.4% 21.6% 23.2% 11,570 21.6% 20.8% 22.4% 1,991 27.4% 25.2% 29.6%
Ages 55-64 30,147 21.2% 20.6% 21.7% 25,454 20.7% 20.1% 21.3% 4,693 23.7% 22.3% 25.1%
Ages 65-74 35,180 20.3% 19.8% 20.9% 28,201 19.9% 19.3% 20.5% 6,979 21.9% 20.8% 23.1%
Ages 75+ 38,043 13.6% 13.1% 14.1% 26,873 13.6% 13.0% 14.2% 11,170 13.4% 12.6% 14.3%
Ages <65 46,774 21.7% 21.3% 22.1% 39,596 21.0% 20.6% 21.5% 7,178 25.3% 24.1% 26.4%
Ages 65+ 73,179 16.9% 16.6% 17.3% 55,040 16.9% 16.5% 17.4% 18,139 16.8% 16.2% 17.6%
Age group N Relative Survival 95% LCI 95% UCI N Relative Survival 95% LCI 95% UCI N Relative Survival 95% LCI 95% UCI
All Ages 16,460 11.7% 11.1% 12.3% 11,622 10.9% 10.2% 11.6% 4,838 13.7% 12.5% 14.9%
Ages <45 528 15.6% 12.4% 19.1% 345 14.8% 11.0% 19.3% 183 16.9% 11.5% 23.1%
Ages 45-54 2,832 12.4% 11.0% 13.8% 2,004 11.1% 9.7% 12.7% 828 15.4% 12.8% 18.3%
Ages 55-64 5,432 11.9% 10.9% 12.9% 4,073 11.2% 10.1% 12.4% 1,359 13.9% 11.8% 16.2%
Ages 65-74 4,511 12.1% 10.9% 13.3% 3,241 10.9% 9.6% 12.3% 1,270 15.0% 12.7% 17.4%
Ages 75+ 3,168 9.8% 8.4% 11.3% 1,964 9.4% 7.6% 11.4% 1204 10.4% 8.2% 12.9%
Ages <65 8,788 12.3% 11.5% 13.1% 6,420 11.4% 10.5% 12.3% 2,368 14.7% 13.1% 16.4%
Ages 65+ 7,676 11.1% 10.2% 12.0% 5,204 10.3% 9.3% 11.5% 2,472 12.7% 11.1% 14.4%
Abbreviations: LCI = Lower confidence interval; UCI = Upper confidence interval.
*Based on cases diagnosed between 2001-2013 and follow-up of patients through 2013.
¶Data compiled from 34 cancer registries (AL, AK, AZ, CA, CO, DE, FL, GA, ID, IL, IN, KS, KY, LA, ME, MD, MI, MN, MS, MT, NE, NH, NJ, NY, NC, ND, OR, PA, RI, SC, VT, WV, WI, and WY) that
met the data quality criteria for survival analysis (covering approximately 70% of the U.S. population), as submitted to CDC’s National Program of Cancer Registries (NPCR) in November
2016. For more information see USCS technical notes (http://www.cdc.gov/cancer/npcr/uscs/technical_notes/relative_survival/).
Table 3. Five-Year Relative Survival*, Esophageal Cancer, by Race, Sex, and Age Group — National Program of Cancer Registries¶, 2001-2013.
Black
Male and female Male Female
Esophageal Cancer
Esophageal Cancer
All Races
Male and female Male Female
Esophageal Cancer
White
Male and female Male Female

Age group N Relative Survival 95% LCI 95% UCI N Relative Survival 95% LCI 95% UCI N Relative Survival 95% LCI 95% UCI
All Ages 198,450 29.4% 29.2% 29.7% 121,812 27.2% 26.9% 27.5% 76,638 33.0% 32.6% 33.4%
Ages <45 11,659 37.1% 36.2% 38.1% 6,285 33.2% 31.9% 34.5% 5,374 41.7% 40.3% 43.2%
Ages 45-54 23,043 34.4% 33.7% 35.1% 14,645 31.1% 30.2% 31.9% 8,398 40.2% 39.1% 41.4%
Ages 55-64 38,842 32.5% 31.9% 33.0% 26,455 29.8% 29.2% 30.5% 12,387 38.0% 37.0% 39.0%
Ages 65-74 50,936 31.3% 30.8% 31.8% 33,510 28.6% 28.0% 29.2% 17,426 36.3% 35.5% 37.2%
Ages 75+ 74,206 23.5% 23.1% 24.0% 41,058 21.6% 21.0% 22.2% 33,148 25.7% 25.1% 26.4%
Ages <65 73,469 33.8% 33.4% 34.2% 47,341 30.7% 30.2% 31.2% 26,128 39.5% 38.8% 40.2%
Ages 65+ 125,063 26.8% 26.4% 27.1% 74,521 24.9% 24.4% 25.3% 50,542 29.5% 29.0% 30.0%
Age group N Relative Survival 95% LCI 95% UCI N Relative Survival 95% LCI 95% UCI N Relative Survival 95% LCI 95% UCI
All Ages 149,823 28.2% 27.9% 28.5% 94,004 26.0% 25.6% 26.4% 55,819 31.8% 31.4% 32.3%
Ages <45 7,941 36.5% 35.3% 37.6% 4,419 31.9% 30.4% 33.4% 3,522 42.4% 40.6% 44.1%
Ages 45-54 16,097 32.7% 31.9% 33.5% 10,483 29.2% 28.3% 30.2% 5,614 39.2% 37.8% 40.7%
Ages 55-64 28,436 30.9% 30.3% 31.5% 19,857 28.3% 27.6% 29.1% 8,579 36.8% 35.6% 38.0%
Ages 65-74 38,613 30.1% 29.5% 30.6% 26,001 27.6% 26.9% 28.3% 12,612 35.1% 34.1% 36.1%
Ages 75+ 58,904 23.0% 22.5% 23.5% 33,345 21.3% 20.6% 21.9% 25,559 25.2% 24.4% 25.9%
Ages <65 52,425 32.3% 31.9% 32.8% 34,728 29.1% 28.5% 29.6% 17,697 38.7% 37.9% 39.5%
Ages 65+ 97,460 25.9% 25.5% 26.3% 59,313 24.1% 23.7% 24.6% 38,147 28.5% 27.9% 29.1%
Age group N Relative Survival 95% LCI 95% UCI N Relative Survival 95% LCI 95% UCI N Relative Survival 95% LCI 95% UCI
All Ages 32,239 29.4% 28.8% 30.0% 18,306 26.3% 25.5% 27.1% 13,933 33.5% 32.6% 34.5%
Ages <45 2,254 33.6% 31.5% 35.8% 1157 30.3% 27.4% 33.3% 1097 37.1% 34.0% 40.2%
Ages 45-54 4,626 35.0% 33.4% 36.5% 2,835 30.6% 28.6% 32.5% 1,791 41.9% 39.3% 44.4%
Ages 55-64 7,052 32.2% 30.9% 33.6% 4,501 28.8% 27.2% 30.4% 2,551 38.4% 36.2% 40.7%
Ages 65-74 8,155 30.9% 29.6% 32.1% 4,974 27.0% 25.4% 28.6% 3,181 36.8% 34.8% 38.9%
Ages 75+ 10,198 22.3% 21.1% 23.5% 4,864 18.9% 17.3% 20.6% 5,334 25.3% 23.6% 27.0%
Ages <65 13,915 33.4% 32.5% 34.3% 8,485 29.6% 28.5% 30.7% 5,430 39.3% 37.8% 40.8%
Ages 65+ 18,339 26.3% 25.4% 27.1% 9,831 23.2% 22.1% 24.4% 8,508 29.7% 28.4% 31.0%
¶Data compiled from 34 cancer registries (AL, AK, AZ, CA, CO, DE, FL, GA, ID, IL, IN, KS, KY, LA, ME, MD, MI, MN, MS, MT, NE, NH, NJ, NY, NC, ND, OR, PA, RI, SC, VT, WV, WI, and WY) that
met the data quality criteria for survival analysis (covering approximately 70% of the U.S. population), as submitted to CDC’s National Program of Cancer Registries (NPCR) in November
2016. For more information see USCS technical notes (http://www.cdc.gov/cancer/npcr/uscs/technical_notes/relative_survival/).
Abbreviations: LCI = Lower confidence interval; UCI = Upper confidence interval.
Black
Male and female Male Female
*Based on cases diagnosed between 2001-2013 and follow-up of patients through 2013.
Table 4. Five-Year Relative Survival*, Stomach Cancer, by Race, Sex, and Age Group — National Program of Cancer Registries¶, 2001-2013.
Stomach Cancer
White
Male and female Male Female
Stomach Cancer
Stomach Cancer
All Races
Male and female Male Female

Age group N Relative Survival 95% LCI 95% UCI N Relative Survival 95% LCI 95% UCI N Relative Survival 95% LCI 95% UCI
All Ages 1,280,997 63.8% 63.7% 63.9% 653,527 63.3% 63.1% 63.5% 627,470 64.3% 64.2% 64.5%
Ages <45 63,570 68.6% 68.2% 69.0% 32,582 66.9% 66.4% 67.5% 30,988 70.4% 69.8% 70.9%
Ages 45-54 162,286 70.0% 69.7% 70.2% 88,113 68.3% 68.0% 68.7% 74,173 71.9% 71.5% 72.3%
Ages 55-64 255,657 67.5% 67.3% 67.8% 146,473 66.6% 66.3% 66.9% 109,184 68.8% 68.5% 69.1%
Ages 65-74 323,876 65.6% 65.3% 65.8% 178,105 64.6% 64.3% 64.9% 145,771 66.6% 66.3% 67.0%
Ages 75+ 480,117 57.8% 57.6% 58.0% 210,829 57.0% 56.6% 57.3% 269,288 58.4% 58.1% 58.7%
Ages <65 480,418 68.5% 68.4% 68.7% 266,506 67.2% 67.0% 67.4% 213,912 70.1% 69.9% 70.3%
Ages 65+ 801,927 61.0% 60.8% 61.1% 387,839 60.6% 60.3% 60.8% 414,088 61.3% 61.1% 61.6%
Age group N Relative Survival 95% LCI 95% UCI N Relative Survival 95% LCI 95% UCI N Relative Survival 95% LCI 95% UCI
All Ages 1,071,728 64.3% 64.2% 64.4% 550,351 63.8% 63.6% 64.0% 521,377 64.8% 64.6% 65.0%
Ages <45 48,709 69.7% 69.2% 70.2% 25,307 67.8% 67.1% 68.4% 23,402 71.8% 71.1% 72.4%
Ages 45-54 124,507 70.8% 70.5% 71.1% 69,191 69.2% 68.8% 69.6% 55,316 72.7% 72.3% 73.1%
Ages 55-64 203,751 68.2% 67.9% 68.4% 118,680 67.2% 66.9% 67.5% 85,071 69.5% 69.1% 69.8%
Ages 65-74 271,801 66.1% 65.9% 66.4% 151,081 65.3% 64.9% 65.6% 120,720 67.2% 66.9% 67.5%
Ages 75+ 426,748 58.7% 58.4% 58.9% 188,252 57.7% 57.4% 58.1% 238,496 59.3% 59.0% 59.6%
Ages <65 376,108 69.2% 69.1% 69.4% 212,667 67.9% 67.7% 68.2% 163,441 70.9% 70.7% 71.2%
Ages 65+ 696,737 61.6% 61.4% 61.8% 338,366 61.2% 60.9% 61.4% 358,371 62.0% 61.8% 62.2%
Age group N Relative Survival 95% LCI 95% UCI N Relative Survival 95% LCI 95% UCI N Relative Survival 95% LCI 95% UCI
All Ages 153,895 57.8% 57.5% 58.1% 74,391 56.3% 55.8% 56.8% 79,504 59.2% 58.8% 59.7%
Ages <45 10,265 61.3% 60.2% 62.3% 4,931 59.0% 57.4% 60.5% 5,334 63.4% 61.9% 64.8%
Ages 45-54 27,686 63.4% 62.7% 64.0% 13,659 60.1% 59.2% 61.1% 14,027 66.5% 65.5% 67.4%
Ages 55-64 38,836 61.6% 61.0% 62.2% 20,552 59.8% 58.9% 60.6% 18,284 63.5% 62.7% 64.4%
Ages 65-74 38,326 58.8% 58.1% 59.4% 19,464 56.7% 55.8% 57.7% 18,862 60.8% 59.9% 61.7%
Ages 75+ 39,337 47.8% 47.0% 48.6% 16,107 46.6% 45.3% 47.9% 23,230 48.6% 47.6% 49.6%
Ages <65 76,602 62.2% 61.8% 62.6% 39,023 59.8% 59.2% 60.4% 37,579 64.6% 64.1% 65.2%
Ages 65+ 77,482 53.3% 52.8% 53.8% 35,477 52.3% 51.5% 53.0% 42,005 54.2% 53.5% 54.9%
¶Data compiled from 34 cancer registries (AL, AK, AZ, CA, CO, DE, FL, GA, ID, IL, IN, KS, KY, LA, ME, MD, MI, MN, MS, MT, NE, NH, NJ, NY, NC, ND, OR, PA, RI, SC, VT, WV, WI, and WY) that met
the data quality criteria for survival analysis (covering approximately 70% of the U.S. population), as submitted to CDC’s National Program of Cancer Registries (NPCR) in November 2016. For
more information see USCS technical notes (http://www.cdc.gov/cancer/npcr/uscs/technical_notes/relative_survival/).
Abbreviations: LCI = Lower confidence interval; UCI = Upper confidence interval.
*Based on cases diagnosed between 2001-2013 and follow-up of patients through 2013.
Colon and Rectum Cancer
All Races
White
Male and female Male Female
Male and female Male Female
Colon and Rectum Cancer
Black
Table 5. Five-Year Relative Survival*, Colon and Rectum Cancer, by Race, Sex, and Age Group — National Program of Cancer Registries¶, 2001-2013.
Colon and Rectum Cancer
Male and female Male Female

Age group N Relative Survival 95% LCI 95% UCI N Relative Survival 95% LCI 95% UCI N Relative Survival 95% LCI 95% UCI
All Ages 337,323 8.4% 8.3% 8.5% 169,651 8.3% 8.1% 8.5% 167,672 8.5% 8.3% 8.7%
Ages <45 9,002 30.0% 28.9% 31.0% 4,849 24.5% 23.1% 25.8% 4,153 36.4% 34.8% 38.1%
Ages 45-54 32,219 13.7% 13.3% 14.1% 18,938 12.3% 11.8% 12.9% 13,281 15.7% 15.0% 16.4%
Ages 55-64 70,913 9.8% 9.6% 10.1% 40,684 8.9% 8.6% 9.3% 30,229 11.0% 10.6% 11.4%
Ages 65-74 93,005 8.0% 7.8% 8.2% 49,323 7.9% 7.6% 8.2% 43,682 8.1% 7.8% 8.4%
Ages 75+ 132,235 4.8% 4.7% 5.0% 55,887 5.1% 4.8% 5.4% 76,348 4.7% 4.5% 4.9%
Ages <65 112,113 12.6% 12.4% 12.9% 64,457 11.2% 10.9% 11.5% 47,656 14.6% 14.2% 15.0%
Ages 65+ 225,228 6.2% 6.0% 6.3% 105,205 6.4% 6.2% 6.6% 120,023 5.9% 5.8% 6.1%
Age group N Relative Survival 95% LCI 95% UCI N Relative Survival 95% LCI 95% UCI N Relative Survival 95% LCI 95% UCI
All Ages 283,476 8.1% 8.0% 8.3% 144,504 8.1% 7.9% 8.3% 138,972 8.1% 8.0% 8.3%
Ages <45 6,831 29.1% 27.9% 30.3% 3,775 24.2% 22.7% 25.8% 3,056 35.2% 33.3% 37.1%
Ages 45-54 25,140 13.6% 13.1% 14.1% 15,007 12.3% 11.7% 12.9% 10,133 15.6% 14.8% 16.5%
Ages 55-64 57,595 9.7% 9.4% 10.0% 33,472 9.0% 8.6% 9.4% 24,123 10.7% 10.2% 11.1%
Ages 65-74 78,271 7.9% 7.7% 8.1% 42,389 7.8% 7.5% 8.2% 35,882 8.0% 7.6% 8.3%
Ages 75+ 115,681 4.8% 4.6% 4.9% 49,884 5.0% 4.7% 5.3% 65,797 4.6% 4.4% 4.8%
Ages <65 89,549 12.4% 12.1% 12.6% 52,244 11.1% 10.8% 11.4% 37,305 14.1% 13.7% 14.5%
Ages 65+ 193,943 6.1% 5.9% 6.2% 92,270 6.3% 6.1% 6.5% 101,673 5.8% 5.6% 6.0%
Age group N Relative Survival 95% LCI 95% UCI N Relative Survival 95% LCI 95% UCI N Relative Survival 95% LCI 95% UCI
All Ages 41,955 8.7% 8.4% 9.0% 19,317 8.0% 7.5% 8.5% 22,638 9.3% 8.8% 9.7%
Ages <45 1,593 30.9% 28.4% 33.4% 762 22.6% 19.3% 25.9% 831 38.5% 34.8% 42.1%
Ages 45-54 5,769 12.2% 11.2% 13.2% 3,187 10.7% 9.5% 12.1% 2,582 14.0% 12.5% 15.6%
Ages 55-64 10,707 9.0% 8.3% 9.7% 5,810 7.6% 6.8% 8.5% 4,897 10.6% 9.6% 11.7%
Ages 65-74 11,473 7.3% 6.7% 8.0% 5,332 6.8% 6.0% 7.8% 6,141 7.8% 7.0% 8.6%
Ages 75+ 12,420 4.8% 4.2% 5.3% 4,232 5.1% 4.1% 6.1% 8,188 4.6% 4.0% 5.3%
Ages <65 18,066 12.1% 11.5% 12.7% 9,756 9.9% 9.2% 10.6% 8,310 14.6% 13.8% 15.6%
Ages 65+ 23,891 6.0% 5.6% 6.4% 9,562 6.0% 5.4% 6.7% 14,329 6.0% 5.5% 6.5%
*Based on cases diagnosed between 2001-2013 and follow-up of patients through 2013.
¶Data compiled from 34 cancer registries (AL, AK, AZ, CA, CO, DE, FL, GA, ID, IL, IN, KS, KY, LA, ME, MD, MI, MN, MS, MT, NE, NH, NJ, NY, NC, ND, OR, PA, RI, SC, VT, WV, WI, and WY) that
met the data quality criteria for survival analysis (covering approximately 70% of the U.S. population), as submitted to CDC’s National Program of Cancer Registries (NPCR) in November
2016. For more information see USCS technical notes (http://www.cdc.gov/cancer/npcr/uscs/technical_notes/relative_survival/).
Abbreviations: LCI = Lower confidence interval; UCI = Upper confidence interval.
Black
Male and female Male Female
Pancreatic Cancer
Table 6. Five-Year Relative Survival*, Pancreatic Cancer, by Race, Sex, and Age Group — National Program of Cancer Registries¶, 2001-2013.
Pancreatic Cancer
All Races
Male and female Male Female
Pancreatic Cancer
White
Male and female Male Female

Age group N Relative Survival 95% LCI 95% UCI N Relative Survival 95% LCI 95% UCI N Relative Survival 95% LCI 95% UCI
All Ages 112,835 59.3% 59.0% 59.7% 89,866 60.1% 59.7% 60.6% 22,969 56.3% 55.5% 57.1%
Ages <45 3,769 70.9% 69.2% 72.4% 2,642 69.3% 67.4% 71.2% 1127 74.5% 71.5% 77.1%
Ages 45-54 18,257 62.5% 61.7% 63.3% 14,206 62.2% 61.2% 63.1% 4,051 63.5% 61.8% 65.2%
Ages 55-64 34,199 59.8% 59.1% 60.4% 27,465 59.8% 59.1% 60.5% 6,734 59.7% 58.3% 61.1%
Ages 65-74 32,828 58.2% 57.5% 58.9% 26,355 59.9% 59.1% 60.7% 6,473 51.4% 49.9% 52.9%
Ages 75+ 24,044 55.6% 54.5% 56.6% 19,428 58.0% 56.8% 59.2% 4,616 46.2% 44.0% 48.3%
Ages <65 56,144 61.5% 61.0% 61.9% 44,246 61.2% 60.7% 61.7% 11,898 62.5% 61.5% 63.5%
Ages 65+ 56,782 57.1% 56.5% 57.6% 45,702 59.0% 58.4% 59.7% 11,080 49.3% 48.0% 50.5%
Age group N Relative Survival 95% LCI 95% UCI N Relative Survival 95% LCI 95% UCI N Relative Survival 95% LCI 95% UCI
All Ages 93,649 60.5% 60.1% 60.9% 74,441 61.4% 60.9% 61.9% 19,208 57.1% 56.3% 58.0%
Ages <45 3,049 73.8% 72.1% 75.5% 2,121 72.3% 70.1% 74.3% 928 77.3% 74.2% 80.1%
Ages 45-54 14,425 64.6% 63.7% 65.5% 11,210 64.2% 63.2% 65.2% 3,215 66.2% 64.3% 68.1%
Ages 55-64 27,612 61.4% 60.7% 62.1% 22,096 61.6% 60.8% 62.4% 5,516 60.6% 59.1% 62.1%
Ages 65-74 27,609 58.8% 58.1% 59.6% 22,091 60.6% 59.7% 61.4% 5,518 52.0% 50.3% 53.6%
Ages 75+ 21,180 56.2% 55.0% 57.3% 17,120 58.7% 57.4% 59.9% 4,060 46.3% 44.0% 48.5%
Ages <65 45,022 63.4% 62.8% 63.9% 35,375 63.1% 62.5% 63.7% 9,647 64.2% 63.1% 65.3%
Ages 65+ 48,708 57.6% 57.0% 58.3% 39,139 59.7% 59.0% 60.4% 9,569 49.6% 48.3% 50.9%
Age group N Relative Survival 95% LCI 95% UCI N Relative Survival 95% LCI 95% UCI N Relative Survival 95% LCI 95% UCI
All Ages 16,677 51.3% 50.4% 52.3% 13,323 51.6% 50.5% 52.6% 3,354 50.5% 48.4% 52.5%
Ages <45 618 53.8% 49.4% 58.0% 450 53.3% 48.0% 58.2% 168 55.2% 46.6% 63.0%
Ages 45-54 3,394 52.3% 50.4% 54.2% 2,631 52.5% 50.4% 54.7% 763 51.6% 47.5% 55.6%
Ages 55-64 5,862 50.6% 49.0% 52.1% 4,768 49.8% 48.1% 51.6% 1094 53.9% 50.3% 57.4%
Ages 65-74 4,496 52.1% 50.2% 54.1% 3,642 53.2% 51.0% 55.4% 854 47.6% 43.3% 51.8%
Ages 75+ 2,341 49.3% 46.0% 52.6% 1,863 50.8% 46.9% 54.6% 478 44.0% 37.4% 50.3%
Ages <65 9,858 51.5% 50.3% 52.7% 7,835 51.1% 49.8% 52.4% 2,023 53.1% 50.6% 55.7%
Ages 65+ 6,829 51.1% 49.4% 52.8% 5,497 52.4% 50.4% 54.3% 1,332 46.3% 42.7% 49.8%
Male and female Male Female
*Based on cases diagnosed between 2001-2013 and follow-up of patients through 2013.
¶Data compiled from 34 cancer registries (AL, AK, AZ, CA, CO, DE, FL, GA, ID, IL, IN, KS, KY, LA, ME, MD, MI, MN, MS, MT, NE, NH, NJ, NY, NC, ND, OR, PA, RI, SC, VT, WV, WI, and WY)
that met the data quality criteria for survival analysis (covering approximately 70% of the U.S. population), as submitted to CDC’s National Program of Cancer Registries (NPCR) in
November 2016. For more information see USCS technical notes (http://www.cdc.gov/cancer/npcr/uscs/technical_notes/relative_survival/).
Abbreviations: LCI = Lower confidence interval; UCI = Upper confidence interval.
Table 7. Five-Year Relative Survival*, Laryngeal Cancer, by Race, Sex, and Age Group — National Program of Cancer Registries¶, 2001-2013.
Laryngeal Cancer
All Races
Male and female Male Female
Black
Laryngeal Cancer
Laryngeal Cancer
White
Male and female Male Female

Age group N Relative Survival 95% LCI 95% UCI N Relative Survival 95% LCI 95% UCI N Relative Survival 95% LCI 95% UCI
All Ages 187,060 17.3% 17.1% 17.5% 133,662 16.8% 16.6% 17.1% 53,398 18.5% 18.1% 18.9%
Ages <45 8,561 36.7% 35.6% 37.8% 5,733 33.7% 32.4% 35.0% 2,828 42.8% 40.8% 44.8%
Ages 45-54 32,062 20.4% 19.9% 20.9% 25,905 19.1% 18.6% 19.7% 6,157 25.7% 24.4% 26.9%
Ages 55-64 57,322 19.6% 19.2% 20.0% 45,228 18.4% 18.0% 18.9% 12,094 23.7% 22.8% 24.7%
Ages 65-74 44,798 15.1% 14.7% 15.6% 30,933 14.3% 13.8% 14.8% 13,865 16.9% 16.1% 17.7%
Ages 75+ 44,453 9.2% 8.8% 9.6% 25,960 9.3% 8.7% 9.8% 18,493 9.0% 8.5% 9.6%
Ages <65 97,895 21.5% 21.2% 21.8% 76,826 20.0% 19.7% 20.4% 21,069 27.1% 26.4% 27.8%
Ages 65+ 89,217 12.3% 12.0% 12.6% 56,872 12.1% 11.7% 12.5% 32,345 12.5% 12.1% 13.0%
Age group N Relative Survival 95% LCI 95% UCI N Relative Survival 95% LCI 95% UCI N Relative Survival 95% LCI 95% UCI
All Ages 140,363 16.4% 16.2% 16.7% 100,061 16.0% 15.8% 16.3% 40,302 17.4% 16.9% 17.9%
Ages <45 5,368 38.9% 37.5% 40.3% 3,430 35.3% 33.6% 37.1% 1,938 45.2% 42.8% 47.6%
Ages 45-54 22,870 20.5% 19.9% 21.1% 18,592 19.4% 18.7% 20.0% 4,278 25.7% 24.2% 27.3%
Ages 55-64 40,903 19.4% 18.9% 19.9% 32,282 18.3% 17.8% 18.9% 8,621 23.4% 22.3% 24.5%
Ages 65-74 34,324 13.7% 13.2% 14.2% 23,906 13.0% 12.5% 13.6% 10,418 15.3% 14.4% 16.2%
Ages 75+ 36,983 8.4% 8.0% 8.8% 21,908 8.4% 7.9% 9.0% 15,075 8.4% 7.7% 9.0%
Ages <65 69,112 21.5% 21.1% 21.9% 54,282 20.0% 19.6% 20.4% 14,830 27.1% 26.3% 28.0%
Ages 65+ 71,282 11.0% 10.7% 11.4% 45,799 10.9% 10.5% 11.3% 25,483 11.3% 10.8% 11.8%
Age group N Relative Survival 95% LCI 95% UCI N Relative Survival 95% LCI 95% UCI N Relative Survival 95% LCI 95% UCI
All Ages 27,187 14.6% 14.1% 15.2% 19,849 13.2% 12.6% 13.8% 7,338 18.4% 17.3% 19.5%
Ages <45 1,635 27.1% 24.8% 29.5% 1121 24.2% 21.6% 27.0% 514 33.4% 28.9% 38.0%
Ages 45-54 5,771 14.0% 13.0% 15.0% 4,508 12.2% 11.1% 13.3% 1,263 20.6% 18.1% 23.2%
Ages 55-64 11,041 14.7% 13.8% 15.6% 8,796 13.3% 12.3% 14.3% 2,245 20.0% 17.9% 22.2%
Ages 65-74 5,331 13.0% 11.7% 14.2% 3,635 10.7% 9.3% 12.2% 1,696 17.2% 15.0% 19.6%
Ages 75+ 3,434 10.1% 8.7% 11.7% 1,810 10.4% 8.5% 12.7% 1,624 9.7% 7.7% 11.9%
Ages <65 18,434 15.8% 15.2% 16.5% 14,414 14.1% 13.4% 14.8% 4,020 22.2% 20.6% 23.7%
Ages 65+ 8,763 11.8% 10.9% 12.8% 5,443 10.6% 9.5% 11.9% 3,320 13.6% 12.1% 15.3%
Table 8. Five-Year Relative Survival*, Liver Cancer, by Race, Sex, and Age Group — National Program of Cancer Registries¶, 2001-2013.
Liver CancerAll Races
Male and female Male Female
Liver Cancer
White
Male and female Male Female
¶Data compiled from 34 cancer registries (AL, AK, AZ, CA, CO, DE, FL, GA, ID, IL, IN, KS, KY, LA, ME, MD, MI, MN, MS, MT, NE, NH, NJ, NY, NC, ND, OR, PA, RI, SC, VT, WV, WI, and WY) that
met the data quality criteria for survival analysis (covering approximately 70% of the U.S. population), as submitted to CDC’s National Program of Cancer Registries (NPCR) in November
2016. For more information see USCS technical notes (http://www.cdc.gov/cancer/npcr/uscs/technical_notes/relative_survival/).
Abbreviations: LCI = Lower confidence interval; UCI = Upper confidence interval.
*Based on cases diagnosed between 2001-2013 and follow-up of patients through 2013.
Liver Cancer
Black
Male and female Male Female

Age group N Relative Survival 95% LCI 95% UCI N Relative Survival 95% LCI 95% UCI N Relative Survival 95% LCI 95% UCI
All Ages 1,817,936 18.7% 18.6% 18.8% 980,492 15.9% 15.8% 16.0% 837,444 22.0% 21.8% 22.1%
Ages <45 33,839 28.9% 28.4% 29.5% 16,298 25.2% 24.4% 25.9% 17,541 32.5% 31.7% 33.2%
Ages 45-54 165,154 21.9% 21.7% 22.1% 86,868 17.7% 17.4% 18.0% 78,286 26.6% 26.3% 26.9%
Ages 55-64 399,119 20.8% 20.7% 21.0% 222,806 17.3% 17.1% 17.5% 176,313 25.3% 25.0% 25.5%
Ages 65-74 596,881 19.8% 19.7% 19.9% 327,907 16.9% 16.7% 17.0% 268,974 23.3% 23.1% 23.5%
Ages 75+ 632,886 14.6% 14.5% 14.8% 331,231 12.7% 12.5% 12.9% 301,655 16.7% 16.5% 16.9%
Ages <65 596,504 21.6% 21.5% 21.7% 325,258 17.8% 17.7% 18.0% 271,246 26.1% 25.9% 26.3%
Ages 65+ 1,225,308 17.2% 17.1% 17.3% 657,026 14.8% 14.7% 14.9% 568,282 19.9% 19.8% 20.0%
Age group N Relative Survival 95% LCI 95% UCI N Relative Survival 95% LCI 95% UCI N Relative Survival 95% LCI 95% UCI
All Ages 1,572,448 18.8% 18.7% 18.9% 840,474 16.0% 15.9% 16.1% 731,974 22.1% 22.0% 22.2%
Ages <45 26,506 29.7% 29.1% 30.3% 12,631 25.7% 24.9% 26.5% 13,875 33.4% 32.6% 34.3%
Ages 45-54 130,862 22.5% 22.2% 22.7% 67,750 18.2% 17.8% 18.5% 63,112 27.2% 26.8% 27.6%
Ages 55-64 333,371 21.1% 20.9% 21.3% 183,237 17.4% 17.2% 17.6% 150,134 25.6% 25.3% 25.8%
Ages 65-74 521,743 20.0% 19.9% 20.1% 284,240 17.0% 16.9% 17.2% 237,503 23.5% 23.3% 23.7%
Ages 75+ 568,823 14.8% 14.6% 14.9% 296,671 12.8% 12.6% 13.0% 272,152 16.8% 16.7% 17.0%
Ages <65 489,389 21.9% 21.8% 22.1% 263,034 18.0% 17.9% 18.2% 226,355 26.5% 26.3% 26.7%
Ages 65+ 1,086,511 17.3% 17.2% 17.4% 578,999 14.9% 14.8% 15.1% 507,512 20.0% 19.9% 20.2%
Age group N Relative Survival 95% LCI 95% UCI N Relative Survival 95% LCI 95% UCI N Relative Survival 95% LCI 95% UCI
All Ages 194,274 16.1% 15.9% 16.3% 111,226 13.8% 13.6% 14.1% 83,048 19.2% 18.8% 19.5%
Ages <45 5,533 23.1% 21.9% 24.3% 2,801 20.0% 18.4% 21.6% 2,732 26.2% 24.4% 28.0%
Ages 45-54 28,751 18.0% 17.5% 18.5% 16,195 14.6% 14.0% 15.2% 12,556 22.4% 21.6% 23.2%
Ages 55-64 54,262 17.3% 16.9% 17.7% 33,002 15.0% 14.5% 15.5% 21,260 20.9% 20.3% 21.6%
Ages 65-74 59,353 16.2% 15.8% 16.6% 34,625 13.8% 13.4% 14.3% 24,728 19.5% 18.9% 20.1%
Ages 75+ 47,249 12.3% 11.9% 12.7% 25,048 10.8% 10.2% 11.4% 22,201 14.0% 13.4% 14.7%
Ages <65 88,324 17.9% 17.6% 18.2% 51,887 15.1% 14.8% 15.5% 36,437 21.9% 21.4% 22.4%
Ages 65+ 106,295 14.5% 14.2% 14.8% 59,521 12.6% 12.2% 12.9% 46,774 16.9% 16.5% 17.4%
*Based on cases diagnosed between 2001-2013 and follow-up of patients through 2013.
¶Data compiled from 34 cancer registries (AL, AK, AZ, CA, CO, DE, FL, GA, ID, IL, IN, KS, KY, LA, ME, MD, MI, MN, MS, MT, NE, NH, NJ, NY, NC, ND, OR, PA, RI, SC, VT, WV, WI, and WY) that
met the data quality criteria for survival analysis (covering approximately 70% of the U.S. population), as submitted to CDC’s National Program of Cancer Registries (NPCR) in November
2016. For more information see USCS technical notes (http://www.cdc.gov/cancer/npcr/uscs/technical_notes/relative_survival/).
White
Male and female Male Female
Lung and Bronchus Cancer
Black
Male and female Male Female
Abbreviations: LCI = Lower confidence interval; UCI = Upper confidence interval.
Lung and Bronchus Cancer
Table 9. Five-Year Relative Survival*, Lung and Bronchus Cancer, by Race, Sex, and Age Group — National Program of Cancer Registries¶, 2001-2013.
Lung and Bronchus Cancer
All Races
Male and female Male Female

Age group N Relative Survival 95% LCI 95% UCI N Relative Survival 95% LCI 95% UCI N Relative Survival 95% LCI 95% UCI
All Ages 534,289 89.5% 89.4% 89.7% 305,618 87.2% 87.0% 87.4% 228,671 92.5% 92.3% 92.7%
Ages <45 96,819 93.9% 93.8% 94.1% 38,214 90.6% 90.2% 90.9% 58,605 96.2% 96.0% 96.3%
Ages 45-54 94,257 91.3% 91.1% 91.5% 48,733 88.5% 88.2% 88.9% 45,524 94.3% 94.0% 94.5%
Ages 55-64 112,563 89.7% 89.4% 89.9% 69,267 87.9% 87.6% 88.3% 43,296 92.5% 92.1% 92.8%
Ages 65-74 109,813 88.5% 88.2% 88.8% 72,444 87.4% 87.0% 87.8% 37,369 90.5% 90.0% 91.0%
Ages 75+ 125,672 83.8% 83.3% 84.3% 80,360 82.4% 81.7% 83.0% 45,312 86.0% 85.2% 86.8%
Ages <65 302,101 91.6% 91.5% 91.8% 155,310 88.8% 88.6% 89.0% 146,791 94.6% 94.4% 94.7%
Ages 65+ 233,682 86.2% 85.8% 86.5% 151,422 85.0% 84.6% 85.4% 82,260 88.2% 87.7% 88.6%
Age group N Relative Survival 95% LCI 95% UCI N Relative Survival 95% LCI 95% UCI N Relative Survival 95% LCI 95% UCI
All Ages 507,569 89.1% 89.0% 89.3% 292,233 86.7% 86.5% 87.0% 215,336 92.2% 92.0% 92.4%
Ages <45 89,886 93.7% 93.5% 93.9% 35,543 90.2% 89.8% 90.5% 54,343 96.1% 95.9% 96.2%
Ages 45-54 88,736 90.9% 90.7% 91.2% 46,082 88.1% 87.7% 88.4% 42,654 94.1% 93.8% 94.3%
Ages 55-64 106,864 89.3% 89.0% 89.6% 66,075 87.5% 87.2% 87.9% 40,789 92.2% 91.8% 92.5%
Ages 65-74 105,320 88.2% 87.8% 88.5% 69,769 87.0% 86.6% 87.5% 35,551 90.3% 89.8% 90.8%
Ages 75+ 121,531 83.3% 82.8% 83.8% 78,118 81.9% 81.2% 82.5% 43,413 85.6% 84.8% 86.4%
Ages <65 283,981 91.3% 91.2% 91.4% 146,816 88.4% 88.2% 88.6% 137,165 94.4% 94.2% 94.5%
Ages 65+ 225,068 85.7% 85.4% 86.0% 146,523 84.6% 84.2% 84.9% 78,545 87.9% 87.4% 88.3%
Age group N Relative Survival 95% LCI 95% UCI N Relative Survival 95% LCI 95% UCI N Relative Survival 95% LCI 95% UCI
All Ages 3,002 66.4% 64.0% 68.6% 1,297 60.0% 56.2% 63.6% 1,705 71.0% 68.0% 73.9%
Ages <45 523 75.8% 71.5% 79.6% 208 63.8% 55.9% 70.7% 315 83.6% 78.5% 87.6%
Ages 45-54 452 69.4% 64.1% 74.1% 202 63.4% 54.9% 70.7% 250 74.0% 67.0% 79.7%
Ages 55-64 619 65.6% 60.7% 70.1% 297 54.5% 47.1% 61.3% 322 75.9% 69.4% 81.2%
Ages 65-74 635 63.7% 58.3% 68.6% 288 61.6% 53.0% 69.1% 347 65.4% 58.2% 71.7%
Ages 75+ 792 59.0% 52.6% 64.7% 312 57.1% 46.1% 66.6% 480 59.9% 52.0% 66.9%
Ages <65 1,584 70.3% 67.6% 72.9% 703 59.9% 55.3% 64.1% 881 78.6% 75.1% 81.6%
Ages 65+ 1,421 61.2% 57.1% 65.1% 595 59.8% 53.0% 65.9% 826 62.2% 56.9% 67.0%
Table 10. Five-Year Relative Survival*, Melanoma of the Skin, by Race, Sex, and Age Group — National Program of Cancer Registries¶, 2001-2013.
Melanoma of the Skin
All Races
Male and female Male Female
¶Data compiled from 34 cancer registries (AL, AK, AZ, CA, CO, DE, FL, GA, ID, IL, IN, KS, KY, LA, ME, MD, MI, MN, MS, MT, NE, NH, NJ, NY, NC, ND, OR, PA, RI, SC, VT, WV, WI, and WY) that
met the data quality criteria for survival analysis (covering approximately 70% of the U.S. population), as submitted to CDC’s National Program of Cancer Registries (NPCR) in November
2016. For more information see USCS technical notes (http://www.cdc.gov/cancer/npcr/uscs/technical_notes/relative_survival/).
Melanoma of the Skin
White
Male and female Male Female
*Based on cases diagnosed between 2001-2013 and follow-up of patients through 2013.
Abbreviations: LCI = Lower confidence interval; UCI = Upper confidence interval.
Melanoma of the Skin
Black
Male and female Male Female

Age group N Relative Survival 95% LCI 95% UCI N Relative Survival 95% LCI 95% UCI N Relative Survival 95% LCI 95% UCI
All Ages 1,852,132 88.9% 88.8% 88.9% 1,560,763 90.0% 89.9% 90.0% 208,605 79.4% 79.2% 79.7%
Ages <45 208,845 87.6% 87.4% 87.7% 159,337 89.2% 89.0% 89.4% 34,006 78.1% 77.6% 78.6%
Ages 45-54 396,981 89.6% 89.5% 89.7% 320,590 90.9% 90.8% 91.0% 53,157 80.0% 79.6% 80.4%
Ages 55-64 458,287 89.4% 89.3% 89.5% 384,218 90.5% 90.3% 90.6% 53,022 80.3% 79.9% 80.8%
Ages 65-74 407,188 89.8% 89.6% 89.9% 353,256 90.6% 90.4% 90.8% 39,508 81.2% 80.6% 81.8%
Ages 75+ 396,360 87.2% 87.0% 87.5% 356,116 88.1% 87.9% 88.4% 31,144 75.6% 74.7% 76.6%
Ages <65 1,057,166 89.2% 89.1% 89.2% 858,830 90.4% 90.4% 90.5% 138,884 79.7% 79.4% 80.0%
Ages 65+ 799,751 88.5% 88.4% 88.6% 705,992 89.4% 89.2% 89.5% 70,299 78.9% 78.3% 79.4%
¶Data compiled from 34 cancer registries (AL, AK, AZ, CA, CO, DE, FL, GA, ID, IL, IN, KS, KY, LA, ME, MD, MI, MN, MS, MT, NE, NH, NJ, NY, NC, ND, OR, PA, RI, SC, VT, WV, WI, and WY) that met
the data quality criteria for survival analysis (covering approximately 70% of the U.S. population), as submitted to CDC’s National Program of Cancer Registries (NPCR) in November 2016. For
more information see USCS technical notes (http://www.cdc.gov/cancer/npcr/uscs/technical_notes/relative_survival/).
*Based on cases diagnosed between 2001-2013 and follow-up of patients through 2013.
Abbreviations: LCI = Lower confidence interval; UCI = Upper confidence interval.
Table 11. Five-Year Relative Survival*, Female Breast Cancer, by Race, and Age Group — National Program of Cancer Registries¶, 2001-2013.
Female Breast Cancer
All races White Black
Age group N Relative Survival 95% LCI 95% UCI N Relative Survival 95% LCI 95% UCI N Relative Survival 95% LCI 95% UCI
All Ages 114,189 67.8% 67.5% 68.1% 86,535 69.2% 68.8% 69.5% 19,807 58.3% 57.5% 59.1%
Ages <45 44,226 80.1% 79.7% 80.5% 34,635 82.0% 81.5% 82.4% 6,602 68.5% 67.2% 69.7%
Ages 45-54 26,916 68.2% 67.6% 68.8% 20,187 69.6% 68.9% 70.3% 4,802 58.8% 57.2% 60.4%
Ages 55-64 19,879 60.6% 59.9% 61.4% 14,739 60.8% 59.9% 61.7% 3,658 54.7% 52.8% 56.6%
Ages 65-74 12,690 55.2% 54.2% 56.3% 9,297 55.2% 54.0% 56.5% 2,545 50.6% 48.1% 53.0%
Ages 75+ 10,542 39.2% 37.8% 40.5% 7,715 38.3% 36.8% 39.9% 2,221 39.1% 36.2% 42.1%
Ages <65 90,977 72.5% 72.2% 72.8% 69,534 74.1% 73.7% 74.4% 15,048 62.2% 61.3% 63.0%
Ages 65+ 23,225 48.2% 47.3% 49.0% 17,008 47.8% 46.9% 48.8% 4,764 45.4% 43.5% 47.3%
¶Data compiled from 34 cancer registries (AL, AK, AZ, CA, CO, DE, FL, GA, ID, IL, IN, KS, KY, LA, ME, MD, MI, MN, MS, MT, NE, NH, NJ, NY, NC, ND, OR, PA, RI, SC, VT, WV, WI, and WY) that
met the data quality criteria for survival analysis (covering approximately 70% of the U.S. population), as submitted to CDC’s National Program of Cancer Registries (NPCR) in November
2016. For more information see USCS technical notes (http://www.cdc.gov/cancer/npcr/uscs/technical_notes/relative_survival/).
Abbreviations: LCI = Lower confidence interval; UCI = Upper confidence interval.
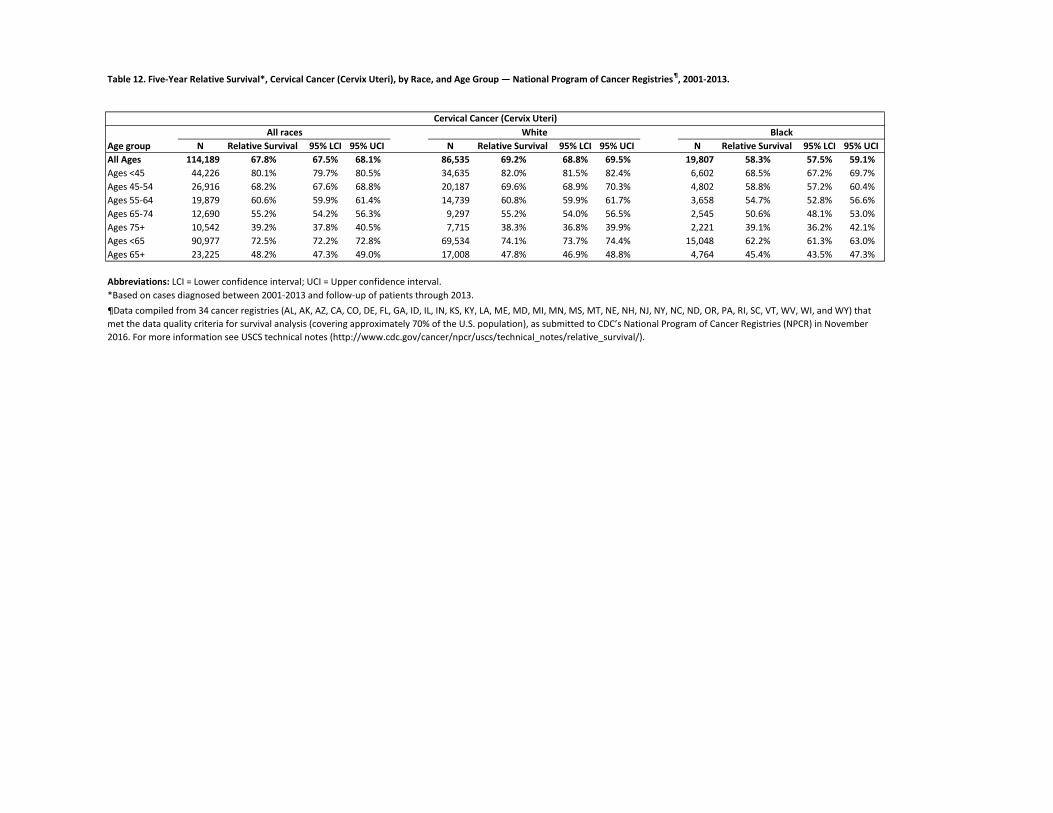
Table 12. Five-Year Relative Survival*, Cervical Cancer (Cervix Uteri), by Race, and Age Group — National Program of Cancer Registries¶, 2001-2013.
Cervical Cancer (Cervix Uteri)
*Based on cases diagnosed between 2001-2013 and follow-up of patients through 2013.
All races White Black

Age group N Relative Survival 95% LCI 95% UCI N Relative Survival 95% LCI 95% UCI N Relative Survival 95% LCI 95% UCI
All Ages 396,849 80.5% 80.3% 80.6% 337,309 82.6% 82.4% 82.8% 41,653 60.7% 60.1% 61.3%
Ages <45 27,394 89.9% 89.4% 90.3% 21,715 90.6% 90.2% 91.1% 3,208 82.3% 80.7% 83.7%
Ages 45-54 69,207 88.1% 87.8% 88.4% 58,757 89.4% 89.1% 89.7% 5,676 72.0% 70.6% 73.3%
Ages 55-64 127,431 84.2% 83.9% 84.4% 108,129 86.5% 86.3% 86.8% 13,525 63.6% 62.6% 64.6%
Ages 65-74 97,747 77.2% 76.8% 77.5% 82,543 80.2% 79.8% 80.5% 12,078 55.9% 54.7% 57.0%
Ages 75+ 75,200 66.7% 66.1% 67.2% 66,264 69.3% 68.6% 69.9% 7,193 42.5% 40.8% 44.2%
Ages <65 223,990 86.2% 86.0% 86.3% 188,570 88.0% 87.8% 88.1% 22,400 68.6% 67.9% 69.4%
Ages 65+ 172,906 72.6% 72.3% 73.0% 148,777 75.3% 75.0% 75.7% 19,261 51.1% 50.1% 52.0%
¶Data compiled from 34 cancer registries (AL, AK, AZ, CA, CO, DE, FL, GA, ID, IL, IN, KS, KY, LA, ME, MD, MI, MN, MS, MT, NE, NH, NJ, NY, NC, ND, OR, PA, RI, SC, VT, WV, WI, and WY) that
met the data quality criteria for survival analysis (covering approximately 70% of the U.S. population), as submitted to CDC’s National Program of Cancer Registries (NPCR) in November
2016. For more information see USCS technical notes (http://www.cdc.gov/cancer/npcr/uscs/technical_notes/relative_survival/).
Abbreviations: LCI = Lower confidence interval; UCI = Upper confidence interval.
*Based on cases diagnosed between 2001-2013 and follow-up of patients through 2013.
Table 13. Five-Year Relative Survival*, Uterine Cancer (Corpus and Uterus, NOS,) by Race, and Age Group — National Program of Cancer Registries¶, 2001-2013.
Uterine Cancer (Corpus and Uterus, NOS)
All races White Black

Age group N Relative Survival 95% LCI 95% UCI N Relative Survival 95% LCI 95% UCI N Relative Survival 95% LCI 95% UCI
All Ages 194,772 45.8% 45.5% 46.0% 168,667 45.8% 45.5% 46.1% 17,209 38.6% 37.7% 39.5%
Ages <45 22,386 75.3% 74.7% 76.0% 17,746 75.4% 74.7% 76.1% 2,714 72.1% 70.2% 74.0%
Ages 45-54 35,724 59.9% 59.3% 60.5% 30,093 61.0% 60.4% 61.6% 3,289 45.7% 43.7% 47.7%
Ages 55-64 45,367 49.3% 48.7% 49.8% 39,243 50.1% 49.5% 50.7% 4,019 36.0% 34.2% 37.8%
Ages 65-74 42,049 38.2% 37.6% 38.7% 36,986 39.1% 38.5% 39.7% 3,677 26.3% 24.5% 28.1%
Ages 75+ 49,299 22.7% 22.2% 23.2% 44,648 22.9% 22.4% 23.5% 3,512 18.2% 16.5% 20.0%
Ages <65 103,450 58.7% 58.4% 59.1% 87,058 59.2% 58.8% 59.6% 10,021 49.5% 48.3% 50.6%
Ages 65+ 91,337 30.0% 29.6% 30.4% 81,623 30.5% 30.1% 30.9% 7,189 22.4% 21.1% 23.6%
¶Data compiled from 34 cancer registries (AL, AK, AZ, CA, CO, DE, FL, GA, ID, IL, IN, KS, KY, LA, ME, MD, MI, MN, MS, MT, NE, NH, NJ, NY, NC, ND, OR, PA, RI, SC, VT, WV, WI, and WY) that
met the data quality criteria for survival analysis (covering approximately 70% of the U.S. population), as submitted to CDC’s National Program of Cancer Registries (NPCR) in November
2016. For more information see USCS technical notes (http://www.cdc.gov/cancer/npcr/uscs/technical_notes/relative_survival/).
Abbreviations: LCI = Lower confidence interval; UCI = Upper confidence interval.
*Based on cases diagnosed between 2001-2013 and follow-up of patients through 2013.
Table 14. Five-Year Relative Survival*, Ovarian Cancer, by Race, and Age Group — National Program of Cancer Registries¶, 2001-2013.
Ovarian Cancer
All races White Black

Age group N Relative Survival 95% LCI 95% UCI N Relative Survival 95% LCI 95% UCI N Relative Survival 95% LCI 95% UCI
All Ages 1,950,961 97.8% 97.8% 97.9% 1,564,193 98.0% 97.9% 98.0% 291,641 95.7% 95.5% 95.9%
Ages <45 11,516 95.6% 95.1% 96.1% 7,569 95.2% 94.6% 95.8% 3,379 96.3% 95.3% 97.1%
Ages 45-54 179,638 97.8% 97.6% 97.9% 131,417 97.9% 97.7% 98.0% 40,296 97.0% 96.7% 97.4%
Ages 55-64 599,750 98.9% 98.8% 99.0% 467,306 99.1% 99.0% 99.1% 104,940 97.6% 97.3% 97.8%
Ages 65-74 727,892 99.5% 99.3% 99.6% 592,386 99.7% 99.5% 99.8% 99,044 97.0% 96.6% 97.3%
Ages 75+ 432,198 93.8% 93.6% 94.1% 365,545 93.9% 93.6% 94.2% 43,985 86.7% 85.8% 87.5%
Ages <65 790,900 98.6% 98.5% 98.6% 606,289 98.7% 98.7% 98.8% 148,614 97.4% 97.2% 97.6%
Ages 65+ 1,160,071 97.4% 97.3% 97.5% 957,912 97.5% 97.4% 97.6% 143,029 93.9% 93.6% 94.3%
¶Data compiled from 34 cancer registries (AL, AK, AZ, CA, CO, DE, FL, GA, ID, IL, IN, KS, KY, LA, ME, MD, MI, MN, MS, MT, NE, NH, NJ, NY, NC, ND, OR, PA, RI, SC, VT, WV, WI, and WY) that met
the data quality criteria for survival analysis (covering approximately 70% of the U.S. population), as submitted to CDC’s National Program of Cancer Registries (NPCR) in November 2016. For
more information see USCS technical notes (http://www.cdc.gov/cancer/npcr/uscs/technical_notes/relative_survival/).
*Based on cases diagnosed between 2001-2013 and follow-up of patients through 2013.
Abbreviations: LCI = Lower confidence interval; UCI = Upper confidence interval.
Table 15. Five-Year Relative Survival*, Prostate Cancer, by Race, and Age Group — National Program of Cancer Registries¶, 2001-2013.
Prostate Cancer
All races White Black

Age group N Relative Survival 95% LCI 95% UCI N Relative Survival 95% LCI 95% UCI N Relative Survival 95% LCI 95% UCI
All Ages 71,978 95.4% 95.2% 95.5% 66,286 95.5% 95.3% 95.7% 2,471 90.0% 88.5% 91.3%
Ages <45 56,887 96.0% 95.8% 96.2% 52,190 96.2% 96.0% 96.4% 1,937 91.5% 89.9% 92.8%
Ages 45-54 10,224 95.1% 94.6% 95.7% 9,549 95.3% 94.8% 95.8% 357 88.3% 83.5% 91.7%
Ages 55-64 3,248 91.4% 89.9% 92.7% 3,030 91.6% 90.0% 92.9% 121 84.1% 71.4% 91.4%
Ages 65-74 1012 84.5% 80.6% 87.7% 955 85.0% 81.0% 88.2% 33 74.6% 50.4% 88.2%
Ages 75+ 640 72.9% 65.3% 79.1% 595 74.7% 66.6% 81.1% 23 28.2% 7.3% 54.3%
Ages <65 70,327 95.7% 95.5% 95.9% 64,737 95.8% 95.6% 96.0% 2,415 90.7% 89.2% 92.0%
Ages 65+ 1,652 80.3% 76.7% 83.4% 1,550 81.3% 77.5% 84.5% 56 58.5% 37.8% 74.4%
ƗRelative Survival not calculated for <16 cases.
Table 16. Five-Year Relative Survival*, Testicular Cancer, by Race, and Age Group — National Program of Cancer Registries¶, 2001-2013.
Testicular Cancer
All races White Black
*Based on cases diagnosed between 2001-2013 and follow-up of patients through 2013.
¶Data compiled from 34 cancer registries (AL, AK, AZ, CA, CO, DE, FL, GA, ID, IL, IN, KS, KY, LA, ME, MD, MI, MN, MS, MT, NE, NH, NJ, NY, NC, ND, OR, PA, RI, SC, VT, WV, WI, and WY)
that met the data quality criteria for survival analysis (covering approximately 70% of the U.S. population), as submitted to CDC’s National Program of Cancer Registries (NPCR) in
November 2016. For more information see USCS technical notes (http://www.cdc.gov/cancer/npcr/uscs/technical_notes/relative_survival/).
Abbreviations: LCI = Lower confidence interval; UCI = Upper confidence interval.

Age group N Relative Survival 95% LCI 95% UCI N Relative Survival 95% LCI 95% UCI N Relative Survival 95% LCI 95% UCI
All Ages 612,129 75.6% 75.4% 75.8% 459,284 76.8% 76.6% 77.0% 152,845 72.0% 71.7% 72.3%Ages <45 13,496 88.0% 87.4% 88.6% 9,529 89.2% 88.5% 89.9% 3,967 85.1% 83.9% 86.3%
Ages 45-54 44,119 83.8% 83.4% 84.2% 32,754 84.6% 84.1% 85.0% 11,365 81.8% 80.9% 82.5%
Ages 55-64 111,982 81.7% 81.4% 82.0% 85,673 82.0% 81.6% 82.3% 26,309 80.6% 80.0% 81.2%
Ages 65-74 178,580 77.4% 77.1% 77.7% 137,977 78.1% 77.7% 78.4% 40,603 75.2% 74.6% 75.7%
Ages 75+ 266,537 68.7% 68.4% 69.0% 195,456 70.5% 70.1% 70.9% 71,081 63.9% 63.3% 64.5%
Ages <65 169,243 82.8% 82.6% 83.0% 127,664 83.2% 83.0% 83.5% 41,579 81.4% 80.9% 81.8%
Ages 65+ 443,730 72.4% 72.2% 72.7% 332,309 73.9% 73.6% 74.1% 111,421 68.2% 67.7% 68.6%
Age group N Relative Survival 95% LCI 95% UCI N Relative Survival 95% LCI 95% UCI N Relative Survival 95% LCI 95% UCI
All Ages 562,789 76.0% 75.8% 76.1% 425,178 76.9% 76.7% 77.1% 137,611 73.1% 72.7% 73.4%
Ages <45 11,701 89.0% 88.4% 89.6% 8,243 89.9% 89.1% 90.6% 3,458 87.0% 85.7% 88.1%
Ages 45-54 39,012 84.7% 84.3% 85.1% 29,057 85.1% 84.6% 85.6% 9,955 83.7% 82.9% 84.5%
Ages 55-64 101,402 82.2% 81.9% 82.5% 77,872 82.3% 81.9% 82.6% 23,530 82.0% 81.4% 82.6%
Ages 65-74 164,231 77.8% 77.5% 78.1% 127,784 78.2% 77.9% 78.6% 36,447 76.2% 75.6% 76.8%
Ages 75+ 248,853 69.1% 68.8% 69.5% 184,209 70.7% 70.2% 71.1% 64,644 64.8% 64.1% 65.4%
Ages <65 151,785 83.4% 83.2% 83.7% 114,901 83.6% 83.3% 83.8% 36,884 82.9% 82.5% 83.4%
Ages 65+ 411,795 72.8% 72.6% 73.1% 310,931 74.0% 73.8% 74.3% 100,864 69.1% 68.6% 69.5%
Age group N Relative Survival 95% LCI 95% UCI N Relative Survival 95% LCI 95% UCI N Relative Survival 95% LCI 95% UCI
All Ages 32,016 63.1% 62.3% 63.9% 21,084 67.8% 66.8% 68.7% 10,932 54.2% 52.9% 55.5%
Ages <45 994 71.9% 68.7% 74.9% 717 77.1% 73.4% 80.3% 277 58.7% 52.2% 64.7%
Ages 45-54 3,308 69.2% 67.3% 71.0% 2,341 73.6% 71.4% 75.7% 967 58.6% 55.0% 62.0%
Ages 55-64 6,922 68.7% 67.3% 70.1% 4,982 72.1% 70.3% 73.7% 1,940 60.3% 57.6% 62.8%
Ages 65-74 9,341 65.0% 63.6% 66.4% 6,350 68.7% 66.9% 70.3% 2,991 57.5% 55.2% 59.7%
Ages 75+ 11,577 54.7% 53.1% 56.3% 6,777 59.4% 57.1% 61.6% 4,800 48.3% 46.0% 50.5%
Ages <65 11,202 69.2% 68.1% 70.2% 8,021 73.0% 71.8% 74.2% 3,181 59.6% 57.6% 61.6%
Ages 65+ 20,849 59.5% 58.5% 60.6% 13,085 64.2% 62.8% 65.5% 7,764 51.9% 50.3% 53.5%
Table 17. Five-Year Relative Survival*, Urinary Bladder Cancer, by Race, Sex, and Age Group — National Program of Cancer Registries¶, 2001-2013.
Urinary Bladder Cancer
All Races
Male and female Male Female
¶Data compiled from 34 cancer registries (AL, AK, AZ, CA, CO, DE, FL, GA, ID, IL, IN, KS, KY, LA, ME, MD, MI, MN, MS, MT, NE, NH, NJ, NY, NC, ND, OR, PA, RI, SC, VT, WV, WI, and WY) that
met the data quality criteria for survival analysis (covering approximately 70% of the U.S. population), as submitted to CDC’s National Program of Cancer Registries (NPCR) in November
2016. For more information see USCS technical notes (http://www.cdc.gov/cancer/npcr/uscs/technical_notes/relative_survival/).
Male Female
Urinary Bladder Cancer
White
Male and female Male Female
Urinary Bladder Cancer
Abbreviations: LCI = Lower confidence interval; UCI = Upper confidence interval.
*Based on cases diagnosed between 2001-2013 and follow-up of patients through 2013.
Black
Male and female

Age group N Relative Survival 95% LCI 95% UCI N Relative Survival 95% LCI 95% UCI N Relative Survival 95% LCI 95% UCI
All Ages 428,203 71.2% 71.0% 71.4% 264,931 70.8% 70.5% 71.0% 163,272 71.9% 71.6% 72.2%
Ages <45 37,817 86.1% 85.7% 86.5% 22,224 84.5% 84.0% 85.1% 15,593 88.4% 87.9% 89.0%
Ages 45-54 68,368 78.7% 78.3% 79.0% 44,505 76.9% 76.4% 77.3% 23,863 82.1% 81.5% 82.6%
Ages 55-64 107,930 73.8% 73.5% 74.1% 70,670 72.4% 72.0% 72.8% 37,260 76.4% 75.8% 76.9%
Ages 65-74 112,758 69.7% 69.3% 70.1% 71,211 69.2% 68.7% 69.7% 41,547 70.4% 69.9% 71.0%
Ages 75+ 102,724 58.5% 58.0% 59.0% 57,294 59.4% 58.7% 60.1% 45,430 57.4% 56.7% 58.2%
Ages <65 213,556 77.6% 77.4% 77.8% 137,016 75.9% 75.6% 76.1% 76,540 80.7% 80.3% 81.0%
Ages 65+ 215,152 64.5% 64.2% 64.8% 128,276 64.9% 64.5% 65.3% 86,876 63.8% 63.3% 64.2%
Age group N Relative Survival 95% LCI 95% UCI N Relative Survival 95% LCI 95% UCI N Relative Survival 95% LCI 95% UCI
All Ages 365,212 71.1% 70.9% 71.3% 227,076 70.7% 70.5% 71.0% 138,136 71.8% 71.5% 72.1%
Ages <45 30,009 87.4% 87.0% 87.9% 17,660 85.9% 85.3% 86.5% 12,349 89.6% 89.0% 90.2%
Ages 45-54 55,984 79.0% 78.6% 79.3% 36,487 77.0% 76.5% 77.5% 19,497 82.6% 82.0% 83.2%
Ages 55-64 90,410 74.0% 73.6% 74.3% 59,533 72.6% 72.1% 73.0% 30,877 76.6% 76.0% 77.1%
Ages 65-74 97,516 69.7% 69.3% 70.1% 62,101 69.3% 68.8% 69.8% 35,415 70.5% 69.8% 71.1%
Ages 75+ 92,388 58.8% 58.3% 59.3% 52,055 59.8% 59.0% 60.5% 40,333 57.6% 56.8% 58.3%
Ages <65 175,987 77.9% 77.6% 78.1% 113,408 76.1% 75.8% 76.4% 62,579 81.1% 80.7% 81.4%
Ages 65+ 189,629 64.5% 64.2% 64.8% 113,959 65.0% 64.6% 65.4% 75,670 63.7% 63.2% 64.2%
Age group N Relative Survival 95% LCI 95% UCI N Relative Survival 95% LCI 95% UCI N Relative Survival 95% LCI 95% UCI
All Ages 48,577 70.5% 69.9% 71.0% 28,805 69.8% 69.0% 70.5% 19,772 71.5% 70.6% 72.3%
Ages <45 5,766 78.8% 77.6% 80.0% 3,340 76.1% 74.4% 77.7% 2,426 82.5% 80.7% 84.1%
Ages 45-54 9,598 75.9% 74.9% 77.0% 6,168 74.5% 73.2% 75.8% 3,430 78.4% 76.7% 80.0%
Ages 55-64 13,747 72.2% 71.2% 73.1% 8,654 70.6% 69.3% 71.8% 5,093 74.8% 73.3% 76.3%
Ages 65-74 11,932 68.9% 67.7% 70.1% 7,030 68.4% 66.7% 70.0% 4,902 69.8% 68.0% 71.5%
Ages 75+ 7,804 55.5% 53.6% 57.3% 3,809 55.9% 53.1% 58.7% 3,995 55.1% 52.6% 57.5%
Ages <65 28,981 74.8% 74.1% 75.4% 18,060 72.9% 72.1% 73.7% 10,921 77.8% 76.8% 78.7%
Ages 65+ 19,685 63.8% 62.7% 64.8% 10,808 64.1% 62.7% 65.5% 8,877 63.3% 61.8% 64.7%
Abbreviations: LCI = Lower confidence interval; UCI = Upper confidence interval.
*Based on cases diagnosed between 2001-2013 and follow-up of patients through 2013.
¶Data compiled from 34 cancer registries (AL, AK, AZ, CA, CO, DE, FL, GA, ID, IL, IN, KS, KY, LA, ME, MD, MI, MN, MS, MT, NE, NH, NJ, NY, NC, ND, OR, PA, RI, SC, VT, WV, WI, and WY) that
met the data quality criteria for survival analysis (covering approximately 70% of the U.S. population), as submitted to CDC’s National Program of Cancer Registries (NPCR) in November
2016. For more information see USCS technical notes (http://www.cdc.gov/cancer/npcr/uscs/technical_notes/relative_survival/).
Table 18. Five-Year Relative Survival*, Kidney and Renal Pelvis Cancer, by Race, Sex, and Age Group — National Program of Cancer Registries¶, 2001-2013.
Black
Male and female Male Female
White
Male and female Male Female
Kidney and Renal Pelvis Cancer
Kidney and Renal Pelvis Cancer
Kidney and Renal Pelvis Cancer
All Races
Male and female Male Female

Age group N Relative Survival 95% LCI 95% UCI N Relative Survival 95% LCI 95% UCI N Relative Survival 95% LCI 95% UCI
All Ages 185,077 32.2% 32.0% 32.5% 102,324 30.9% 30.6% 31.3% 82,753 33.8% 33.4% 34.2%
Ages <45 55,567 68.1% 67.7% 68.5% 30,992 65.9% 65.3% 66.5% 24,575 70.9% 70.3% 71.5%
Ages 45-54 26,814 32.4% 31.8% 33.0% 15,668 29.3% 28.5% 30.1% 11,146 36.7% 35.7% 37.7%
Ages 55-64 35,443 17.5% 17.1% 18.0% 20,429 15.5% 15.0% 16.1% 15,014 20.2% 19.5% 21.0%
Ages 65-74 33,618 10.1% 9.7% 10.5% 18,796 9.0% 8.5% 9.5% 14,822 11.4% 10.8% 12.0%
Ages 75+ 33,740 6.3% 5.9% 6.6% 16,493 5.7% 5.2% 6.2% 17,247 6.8% 6.3% 7.3%
Ages <65 117,737 45.2% 44.8% 45.5% 67,047 42.4% 42.0% 42.9% 50,690 48.7% 48.2% 49.2%
Ages 65+ 67,352 8.2% 7.9% 8.4% 35,285 7.4% 7.1% 7.8% 32,067 8.9% 8.5% 9.3%
Age group N Relative Survival 95% LCI 95% UCI N Relative Survival 95% LCI 95% UCI N Relative Survival 95% LCI 95% UCI
All Ages 163,939 30.9% 30.7% 31.2% 91,055 29.8% 29.5% 30.2% 72,884 32.3% 31.9% 32.7%
Ages <45 46,219 68.6% 68.2% 69.1% 25,999 66.5% 65.8% 67.1% 20,220 71.4% 70.7% 72.1%
Ages 45-54 23,649 31.8% 31.2% 32.5% 13,893 28.8% 27.9% 29.6% 9,756 36.1% 35.1% 37.2%
Ages 55-64 32,011 16.9% 16.4% 17.4% 18,533 15.1% 14.5% 15.7% 13,478 19.4% 18.6% 20.2%
Ages 65-74 30,772 9.6% 9.2% 10.0% 17,268 8.7% 8.1% 9.2% 13,504 10.8% 10.2% 11.4%
Ages 75+ 31,380 5.9% 5.5% 6.2% 15,412 5.4% 4.9% 5.9% 15,968 6.3% 5.8% 6.8%
Ages <65 101,802 44.3% 43.9% 44.6% 58,385 41.7% 41.2% 42.1% 43,417 47.7% 47.2% 48.2%
Ages 65+ 62,146 7.7% 7.4% 8.0% 32,676 7.1% 6.7% 7.5% 29,470 8.4% 8.0% 8.8%
Age group N Relative Survival 95% LCI 95% UCI N Relative Survival 95% LCI 95% UCI N Relative Survival 95% LCI 95% UCI
All Ages 13,860 38.7% 37.8% 39.6% 7,237 36.0% 34.8% 37.3% 6,623 41.6% 40.2% 42.9%
Ages <45 5,861 63.0% 61.6% 64.3% 3,062 60.2% 58.3% 62.1% 2,799 66.0% 64.1% 67.9%
Ages 45-54 2,160 32.4% 30.1% 34.6% 1184 28.1% 25.2% 31.1% 976 37.4% 34.0% 40.8%
Ages 55-64 2,347 20.5% 18.6% 22.4% 1,299 17.5% 15.1% 20.1% 1048 24.1% 21.1% 27.1%
Ages 65-74 1,919 12.1% 10.3% 14.0% 1006 9.3% 7.1% 11.8% 913 15.1% 12.4% 18.1%
Ages 75+ 1,584 10.8% 8.7% 13.1% 690 8.3% 5.6% 11.8% 894 12.5% 9.7% 15.8%
Ages <65 10,359 47.3% 46.2% 48.4% 5,543 43.7% 42.2% 45.2% 4,816 51.4% 49.8% 52.9%
Ages 65+ 3,503 11.4% 10.1% 12.8% 1,696 8.8% 7.0% 10.7% 1,807 13.8% 11.8% 15.9%
¶Data compiled from 34 cancer registries (AL, AK, AZ, CA, CO, DE, FL, GA, ID, IL, IN, KS, KY, LA, ME, MD, MI, MN, MS, MT, NE, NH, NJ, NY, NC, ND, OR, PA, RI, SC, VT, WV, WI, and WY)
that met the data quality criteria for survival analysis (covering approximately 70% of the U.S. population), as submitted to CDC’s National Program of Cancer Registries (NPCR) in
November 2016. For more information see USCS technical notes (http://www.cdc.gov/cancer/npcr/uscs/technical_notes/relative_survival/).
Female
Abbreviations: LCI = Lower confidence interval; UCI = Upper confidence interval.
*Based on cases diagnosed between 2001-2013 and follow-up of patients through 2013.
Table 19. Five-Year Relative Survival*, Brain and Other Nervours System Tumors, by Race, Sex, and Age Group — National Program of Cancer Registries¶, 2001-2013.
Black
Male and female Male Female
Brain and Other Nervous System Tumors
White
Male and female Male Female
Brain and Other Nervous System Tumors
Brain and Other Nervous System Tumors
All Races
Male and female Male

Age group N Relative Survival 95% LCI 95% UCI N Relative Survival 95% LCI 95% UCI N Relative Survival 95% LCI 95% UCI
All Ages 327,046 96.8% 96.7% 96.9% 78,977 93.4% 93.1% 93.7% 248,069 97.8% 97.7% 98.0%
Ages <45 121,134 99.4% 99.4% 99.5% 21,823 98.4% 98.2% 98.6% 99,311 99.7% 99.6% 99.7%
Ages 45-54 77,368 98.3% 98.1% 98.4% 17,620 95.6% 95.1% 96.0% 59,748 99.0% 98.9% 99.2%
Ages 55-64 62,634 96.3% 96.0% 96.5% 18,212 93.0% 92.4% 93.6% 44,422 97.6% 97.3% 97.9%
Ages 65-74 41,507 93.1% 92.6% 93.6% 13,458 89.6% 88.6% 90.5% 28,049 94.8% 94.3% 95.3%
Ages 75+ 24,593 85.4% 84.5% 86.2% 7,923 81.0% 79.0% 82.8% 16,670 86.6% 85.8% 87.5%
Ages <65 261,024 98.4% 98.3% 98.4% 57,627 95.9% 95.6% 96.1% 203,397 99.0% 99.0% 99.1%
Ages 65+ 66,075 90.3% 89.8% 90.8% 21,370 86.4% 85.5% 87.3% 44,705 92.1% 91.6% 92.6%
Age group N Relative Survival 95% LCI 95% UCI N Relative Survival 95% LCI 95% UCI N Relative Survival 95% LCI 95% UCI
All Ages 277,543 96.9% 96.8% 97.0% 69,487 93.5% 93.1% 93.8% 208,056 98.0% 97.9% 98.1%
Ages <45 101,281 99.5% 99.4% 99.5% 18,624 98.5% 98.2% 98.7% 82,657 99.7% 99.6% 99.7%
Ages 45-54 65,470 98.3% 98.1% 98.5% 15,504 95.6% 95.1% 96.1% 49,966 99.2% 99.0% 99.3%
Ages 55-64 53,247 96.4% 96.1% 96.6% 16,118 93.0% 92.3% 93.6% 37,129 97.8% 97.5% 98.1%
Ages 65-74 35,791 93.3% 92.8% 93.8% 12,035 89.7% 88.6% 90.6% 23,756 95.2% 94.6% 95.7%
Ages 75+ 21,921 86.2% 85.3% 87.1% 7,258 81.6% 79.4% 83.5% 14,663 87.4% 86.6% 88.2%
Ages <65 219,896 98.4% 98.3% 98.5% 50,220 95.9% 95.6% 96.1% 169,676 99.1% 99.1% 99.2%
Ages 65+ 57,688 90.7% 90.2% 91.2% 19,283 86.7% 85.7% 87.6% 38,405 92.6% 92.1% 93.1%
Age group N Relative Survival 95% LCI 95% UCI N Relative Survival 95% LCI 95% UCI N Relative Survival 95% LCI 95% UCI
All Ages 25,448 95.4% 94.9% 95.8% 4,564 91.3% 89.9% 92.6% 20,884 96.3% 95.8% 96.7%
Ages <45 8,897 98.9% 98.5% 99.2% 1,255 96.7% 95.0% 97.9% 7,642 99.2% 98.8% 99.5%
Ages 45-54 6,269 97.1% 96.3% 97.7% 1045 93.4% 90.9% 95.2% 5,224 97.8% 97.0% 98.4%
Ages 55-64 5,444 94.8% 93.6% 95.7% 1122 91.0% 87.7% 93.5% 4,322 95.8% 94.5% 96.8%
Ages 65-74 3,310 90.6% 88.6% 92.4% 789 87.0% 82.4% 90.4% 2,521 91.5% 89.2% 93.4%
Ages 75+ 1,541 78.4% 73.9% 82.3% 354 72.4% 61.5% 80.6% 1187 80.2% 75.1% 84.4%
Ages <65 20,603 97.3% 96.9% 97.7% 3,422 94.0% 92.6% 95.1% 17,181 98.0% 97.6% 98.3%
Ages 65+ 4,851 86.8% 84.8% 88.5% 1143 82.5% 78.4% 86.0% 3,708 87.9% 85.7% 89.8%
¶Data compiled from 34 cancer registries (AL, AK, AZ, CA, CO, DE, FL, GA, ID, IL, IN, KS, KY, LA, ME, MD, MI, MN, MS, MT, NE, NH, NJ, NY, NC, ND, OR, PA, RI, SC, VT, WV, WI, and WY)
that met the data quality criteria for survival analysis (covering approximately 70% of the U.S. population), as submitted to CDC’s National Program of Cancer Registries (NPCR) in
November 2016. For more information see USCS technical notes (http://www.cdc.gov/cancer/npcr/uscs/technical_notes/relative_survival/).
Abbreviations: LCI = Lower confidence interval; UCI = Upper confidence interval.
*Based on cases diagnosed between 2001-2013 and follow-up of patients through 2013.
Female
Black
Male and female Male Female
Table 20. Five-Year Relative Survival*, Thyroid Cancer, by Race, Sex, and Age Group — National Program of Cancer Registries¶, 2001-2013.
Male and female Male Female
Thyroid Cancer
Thyroid Cancer
All Races
Male and female Male
Thyroid Cancer
White

Age group N Relative Survival 95% LCI 95% UCI N Relative Survival 95% LCI 95% UCI N Relative Survival 95% LCI 95% UCI
All Ages 77,287 83.3% 83.0% 83.6% 42,318 81.9% 81.5% 82.3% 34,969 84.9% 84.5% 85.4%
Ages <45 45,698 93.0% 92.8% 93.3% 24,260 91.7% 91.3% 92.1% 21,438 94.5% 94.2% 94.9%
Ages 45-54 9,745 85.1% 84.3% 85.9% 6,103 83.2% 82.0% 84.2% 3,642 88.4% 87.1% 89.6%
Ages 55-64 8,038 74.8% 73.6% 75.9% 4,775 73.0% 71.4% 74.6% 3,263 77.3% 75.5% 79.0%
Ages 65-74 6,925 61.1% 59.6% 62.5% 3,879 58.9% 56.8% 60.8% 3,046 63.9% 61.7% 66.0%
Ages 75+ 6,890 42.7% 41.0% 44.4% 3,303 40.9% 38.3% 43.5% 3,587 44.3% 42.0% 46.6%
Ages <65 63,474 89.6% 89.3% 89.9% 35,136 87.8% 87.4% 88.2% 28,338 91.8% 91.5% 92.2%
Ages 65+ 13,814 52.2% 51.0% 53.3% 7,182 50.9% 49.3% 52.5% 6,632 53.5% 51.9% 55.1%
Age group N Relative Survival 95% LCI 95% UCI N Relative Survival 95% LCI 95% UCI N Relative Survival 95% LCI 95% UCI
All Ages 64,449 83.3% 83.0% 83.7% 35,310 82.3% 81.8% 82.8% 29,139 84.5% 84.0% 85.0%
Ages <45 37,138 93.9% 93.6% 94.2% 19,709 92.9% 92.5% 93.3% 17,429 95.0% 94.7% 95.4%
Ages 45-54 7,862 86.4% 85.4% 87.2% 4,943 84.8% 83.6% 86.0% 2,919 89.0% 87.6% 90.3%
Ages 55-64 6,799 75.8% 74.5% 77.0% 4,066 74.8% 73.1% 76.4% 2,733 77.2% 75.3% 79.0%
Ages 65-74 6,241 60.9% 59.4% 62.4% 3,508 58.8% 56.7% 60.9% 2,733 63.5% 61.3% 65.7%
Ages 75+ 6,417 42.7% 40.8% 44.4% 3,086 40.3% 37.6% 43.0% 3,331 44.7% 42.3% 47.1%
Ages <65 51,793 90.5% 90.2% 90.8% 28,716 89.1% 88.6% 89.5% 23,077 92.2% 91.8% 92.6%
Ages 65+ 12,657 51.9% 50.7% 53.1% 6,594 50.5% 48.8% 52.1% 6,063 53.4% 51.7% 55.1%
Age group N Relative Survival 95% LCI 95% UCI N Relative Survival 95% LCI 95% UCI N Relative Survival 95% LCI 95% UCI
All Ages 9,735 81.0% 80.1% 82.0% 5,274 77.1% 75.7% 78.5% 4,461 85.6% 84.4% 86.8%
Ages <45 6,389 86.9% 85.9% 87.8% 3,396 83.2% 81.7% 84.6% 2,993 91.0% 89.8% 92.1%
Ages 45-54 1,578 77.6% 75.0% 80.0% 953 72.7% 69.2% 75.9% 625 85.0% 81.2% 88.0%
Ages 55-64 968 67.2% 63.3% 70.8% 542 60.5% 55.1% 65.4% 426 75.7% 70.1% 80.4%
Ages 65-74 500 61.9% 55.9% 67.3% 251 59.2% 50.4% 66.9% 249 64.7% 56.3% 71.9%
Ages 75+ 301 42.8% 34.7% 50.7% 132 44.3% 31.2% 56.5% 169 40.4% 29.4% 51.1%
Ages <65 8,934 83.2% 82.3% 84.1% 4,891 78.7% 77.4% 80.1% 4,043 88.6% 87.3% 89.7%
Ages 65+ 801 55.3% 50.3% 60.0% 383 55.2% 47.6% 62.1% 418 55.4% 48.7% 61.6%
¶Data compiled from 34 cancer registries (AL, AK, AZ, CA, CO, DE, FL, GA, ID, IL, IN, KS, KY, LA, ME, MD, MI, MN, MS, MT, NE, NH, NJ, NY, NC, ND, OR, PA, RI, SC, VT, WV, WI, and WY)
that met the data quality criteria for survival analysis (covering approximately 70% of the U.S. population), as submitted to CDC’s National Program of Cancer Registries (NPCR) in
November 2016. For more information see USCS technical notes (http://www.cdc.gov/cancer/npcr/uscs/technical_notes/relative_survival/).
Abbreviations: LCI = Lower confidence interval; UCI = Upper confidence interval.
Black
Male and female Male Female
*Based on cases diagnosed between 2001-2013 and follow-up of patients through 2013.
Table 21. Five-Year Relative Survival*, Hodgkin Lymphoma, by Race, Sex, and Age Group — National Program of Cancer Registries¶, 2001-2013.
Hodgkin Lymphoma
White
Male and female Male Female
Hodgkin Lymphoma
Hodgkin Lymphoma
All Races
Male and female Male Female
Age group N Relative Survival 95% LCI 95% UCI N Relative Survival 95% LCI 95% UCI N Relative Survival 95% LCI 95% UCI
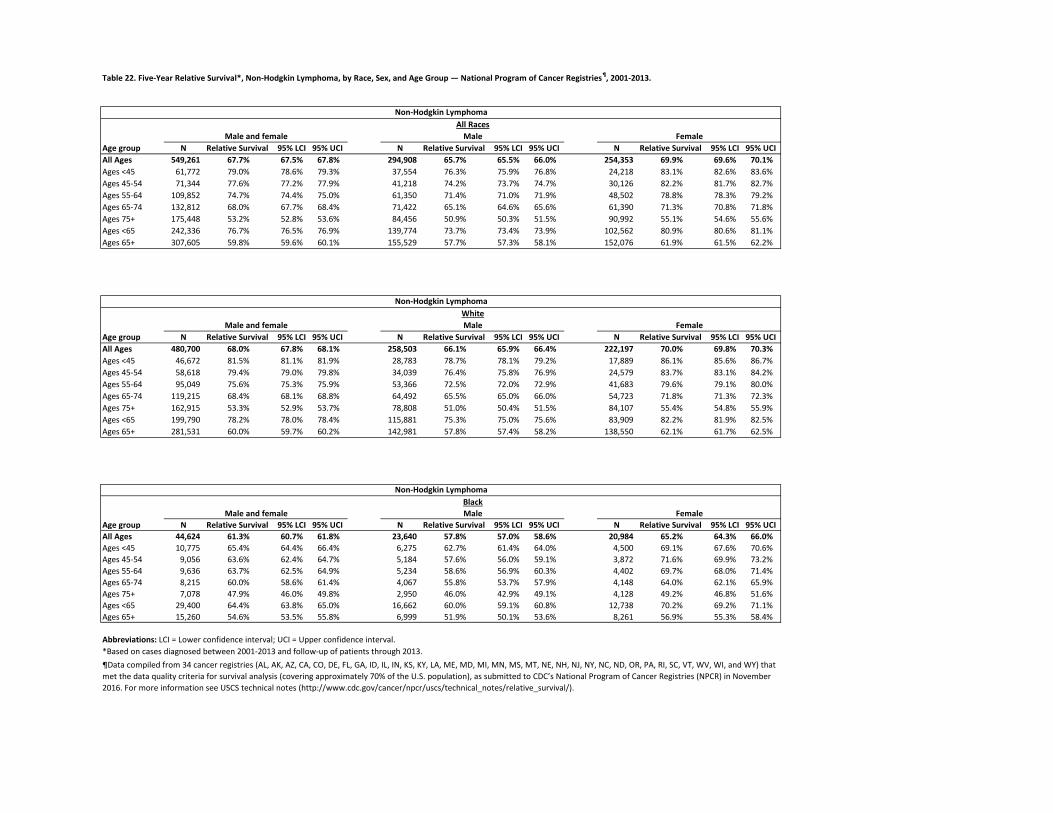
All Ages 549,261 67.7% 67.5% 67.8% 294,908 65.7% 65.5% 66.0% 254,353 69.9% 69.6% 70.1%
Ages <45 61,772 79.0% 78.6% 79.3% 37,554 76.3% 75.9% 76.8% 24,218 83.1% 82.6% 83.6%
Ages 45-54 71,344 77.6% 77.2% 77.9% 41,218 74.2% 73.7% 74.7% 30,126 82.2% 81.7% 82.7%
Ages 55-64 109,852 74.7% 74.4% 75.0% 61,350 71.4% 71.0% 71.9% 48,502 78.8% 78.3% 79.2%
Ages 65-74 132,812 68.0% 67.7% 68.4% 71,422 65.1% 64.6% 65.6% 61,390 71.3% 70.8% 71.8%
Ages 75+ 175,448 53.2% 52.8% 53.6% 84,456 50.9% 50.3% 51.5% 90,992 55.1% 54.6% 55.6%
Ages <65 242,336 76.7% 76.5% 76.9% 139,774 73.7% 73.4% 73.9% 102,562 80.9% 80.6% 81.1%
Ages 65+ 307,605 59.8% 59.6% 60.1% 155,529 57.7% 57.3% 58.1% 152,076 61.9% 61.5% 62.2%
Age group N Relative Survival 95% LCI 95% UCI N Relative Survival 95% LCI 95% UCI N Relative Survival 95% LCI 95% UCI
All Ages 480,700 68.0% 67.8% 68.1% 258,503 66.1% 65.9% 66.4% 222,197 70.0% 69.8% 70.3%
Ages <45 46,672 81.5% 81.1% 81.9% 28,783 78.7% 78.1% 79.2% 17,889 86.1% 85.6% 86.7%
Ages 45-54 58,618 79.4% 79.0% 79.8% 34,039 76.4% 75.8% 76.9% 24,579 83.7% 83.1% 84.2%
Ages 55-64 95,049 75.6% 75.3% 75.9% 53,366 72.5% 72.0% 72.9% 41,683 79.6% 79.1% 80.0%
Ages 65-74 119,215 68.4% 68.1% 68.8% 64,492 65.5% 65.0% 66.0% 54,723 71.8% 71.3% 72.3%
Ages 75+ 162,915 53.3% 52.9% 53.7% 78,808 51.0% 50.4% 51.5% 84,107 55.4% 54.8% 55.9%
Ages <65 199,790 78.2% 78.0% 78.4% 115,881 75.3% 75.0% 75.6% 83,909 82.2% 81.9% 82.5%
Ages 65+ 281,531 60.0% 59.7% 60.2% 142,981 57.8% 57.4% 58.2% 138,550 62.1% 61.7% 62.5%
Age group N Relative Survival 95% LCI 95% UCI N Relative Survival 95% LCI 95% UCI N Relative Survival 95% LCI 95% UCI
All Ages 44,624 61.3% 60.7% 61.8% 23,640 57.8% 57.0% 58.6% 20,984 65.2% 64.3% 66.0%
Ages <45 10,775 65.4% 64.4% 66.4% 6,275 62.7% 61.4% 64.0% 4,500 69.1% 67.6% 70.6%
Ages 45-54 9,056 63.6% 62.4% 64.7% 5,184 57.6% 56.0% 59.1% 3,872 71.6% 69.9% 73.2%
Ages 55-64 9,636 63.7% 62.5% 64.9% 5,234 58.6% 56.9% 60.3% 4,402 69.7% 68.0% 71.4%
Ages 65-74 8,215 60.0% 58.6% 61.4% 4,067 55.8% 53.7% 57.9% 4,148 64.0% 62.1% 65.9%
Ages 75+ 7,078 47.9% 46.0% 49.8% 2,950 46.0% 42.9% 49.1% 4,128 49.2% 46.8% 51.6%
Ages <65 29,400 64.4% 63.8% 65.0% 16,662 60.0% 59.1% 60.8% 12,738 70.2% 69.2% 71.1%
Ages 65+ 15,260 54.6% 53.5% 55.8% 6,999 51.9% 50.1% 53.6% 8,261 56.9% 55.3% 58.4%
¶Data compiled from 34 cancer registries (AL, AK, AZ, CA, CO, DE, FL, GA, ID, IL, IN, KS, KY, LA, ME, MD, MI, MN, MS, MT, NE, NH, NJ, NY, NC, ND, OR, PA, RI, SC, VT, WV, WI, and WY) that
met the data quality criteria for survival analysis (covering approximately 70% of the U.S. population), as submitted to CDC’s National Program of Cancer Registries (NPCR) in November
2016. For more information see USCS technical notes (http://www.cdc.gov/cancer/npcr/uscs/technical_notes/relative_survival/).
Male and female Male Female
Non-Hodgkin Lymphoma
Black
Abbreviations: LCI = Lower confidence interval; UCI = Upper confidence interval.
Male and female Male Female
*Based on cases diagnosed between 2001-2013 and follow-up of patients through 2013.
Table 22. Five-Year Relative Survival*, Non-Hodgkin Lymphoma, by Race, Sex, and Age Group — National Program of Cancer Registries¶, 2001-2013.
Non-Hodgkin Lymphoma
White
Non-Hodgkin Lymphoma
All Races
Male and female Male Female

Age group N Relative Survival 95% LCI 95% UCI N Relative Survival 95% LCI 95% UCI N Relative Survival 95% LCI 95% UCI
All Ages 175,611 44.7% 44.4% 45.0% 95,938 44.9% 44.5% 45.4% 79,673 44.4% 44.0% 44.9%
Ages <45 6,216 69.5% 68.1% 70.8% 3,658 68.2% 66.4% 69.9% 2,558 71.2% 69.2% 73.2%
Ages 45-54 19,618 60.7% 59.9% 61.6% 11,063 58.6% 57.5% 59.7% 8,555 63.5% 62.3% 64.7%
Ages 55-64 38,934 55.0% 54.4% 55.6% 22,167 54.9% 54.1% 55.7% 16,767 55.1% 54.1% 56.0%
Ages 65-74 49,768 44.3% 43.7% 44.8% 27,992 43.5% 42.7% 44.3% 21,776 45.2% 44.4% 46.1%
Ages 75+ 61,280 28.5% 28.0% 29.1% 31,188 28.7% 27.9% 29.5% 30,092 28.3% 27.5% 29.0%
Ages <65 64,683 58.2% 57.8% 58.7% 36,833 57.4% 56.8% 58.0% 27,850 59.3% 58.6% 60.0%
Ages 65+ 111,000 35.9% 35.5% 36.3% 59,155 36.1% 35.6% 36.7% 51,845 35.7% 35.2% 36.3%
Age group N Relative Survival 95% LCI 95% UCI N Relative Survival 95% LCI 95% UCI N Relative Survival 95% LCI 95% UCI
All Ages 133,811 43.8% 43.4% 44.1% 75,311 44.5% 44.0% 45.0% 58,500 42.8% 42.3% 43.4%
Ages <45 3,967 69.4% 67.7% 71.0% 2,500 69.0% 66.9% 71.1% 1,467 69.9% 67.2% 72.5%
Ages 45-54 13,375 62.4% 61.4% 63.3% 7,899 60.5% 59.2% 61.8% 5,476 65.0% 63.5% 66.5%
Ages 55-64 28,013 55.2% 54.5% 55.9% 16,537 55.3% 54.3% 56.2% 11,476 55.1% 54.0% 56.2%
Ages 65-74 38,129 44.1% 43.5% 44.8% 22,023 43.6% 42.7% 44.5% 16,106 44.9% 43.9% 45.8%
Ages 75+ 50,492 27.9% 27.3% 28.5% 26,460 28.6% 27.7% 29.5% 24,032 27.1% 26.3% 27.9%
Ages <65 45,291 58.7% 58.1% 59.2% 26,892 58.2% 57.5% 58.9% 18,399 59.4% 58.5% 60.2%
Ages 65+ 88,579 35.3% 34.8% 35.7% 48,460 35.8% 35.2% 36.5% 40,119 34.6% 33.9% 35.2%
Age group N Relative Survival 95% LCI 95% UCI N Relative Survival 95% LCI 95% UCI N Relative Survival 95% LCI 95% UCI
All Ages 35,468 46.8% 46.1% 47.5% 17,312 45.7% 44.7% 46.7% 18,156 47.8% 46.8% 48.7%
Ages <45 1,908 68.3% 65.8% 70.7% 954 64.7% 61.0% 68.2% 954 71.8% 68.3% 75.0%
Ages 45-54 5,389 55.9% 54.3% 57.5% 2,723 52.0% 49.7% 54.3% 2,666 59.9% 57.6% 62.1%
Ages 55-64 9,339 53.2% 51.8% 54.4% 4,797 52.8% 50.9% 54.6% 4,542 53.6% 51.7% 55.4%
Ages 65-74 9,821 44.0% 42.7% 45.4% 4,992 42.3% 40.4% 44.2% 4,829 45.8% 43.9% 47.6%
Ages 75+ 9,046 30.6% 29.1% 32.1% 3,865 29.1% 26.7% 31.5% 5,181 31.7% 29.8% 33.7%
Ages <65 16,617 55.9% 54.9% 56.8% 8,464 53.9% 52.5% 55.2% 8,153 57.9% 56.6% 59.2%
Ages 65+ 18,862 37.9% 36.9% 39.0% 8,855 37.0% 35.5% 38.5% 10,007 38.8% 37.4% 40.1%
Table 23. Five-Year Relative Survival*, Myeloma, by Race, Sex, and Age Group — National Program of Cancer Registries¶, 2001-2013.
White
Male and female Male Female
Myeloma
All Races
Male and female Male Female
Myeloma
Male and female Male Female
¶Data compiled from 34 cancer registries (AL, AK, AZ, CA, CO, DE, FL, GA, ID, IL, IN, KS, KY, LA, ME, MD, MI, MN, MS, MT, NE, NH, NJ, NY, NC, ND, OR, PA, RI, SC, VT, WV, WI, and WY)
that met the data quality criteria for survival analysis (covering approximately 70% of the U.S. population), as submitted to CDC’s National Program of Cancer Registries (NPCR) in
November 2016. For more information see USCS technical notes (http://www.cdc.gov/cancer/npcr/uscs/technical_notes/relative_survival/).
Myeloma
Black
Abbreviations: LCI = Lower confidence interval; UCI = Upper confidence interval.
*Based on cases diagnosed between 2001-2013 and follow-up of patients through 2013.

Age group N Relative Survival 95% LCI 95% UCI N Relative Survival 95% LCI 95% UCI N Relative Survival 95% LCI 95% UCI
All Ages 362,109 53.9% 53.7% 54.1% 208,291 54.3% 54.1% 54.6% 153,818 53.3% 53.0% 53.6%
Ages <45 57,780 70.8% 70.4% 71.2% 32,780 70.8% 70.3% 71.3% 25,000 70.8% 70.2% 71.4%
Ages 45-54 37,251 65.9% 65.3% 66.4% 21,799 67.9% 67.1% 68.6% 15,452 63.1% 62.2% 63.9%
Ages 55-64 62,968 61.7% 61.3% 62.2% 38,576 62.2% 61.6% 62.8% 24,392 61.0% 60.3% 61.7%
Ages 65-74 82,286 51.5% 51.0% 51.9% 49,771 50.9% 50.3% 51.4% 32,515 52.3% 51.7% 53.0%
Ages 75+ 122,180 37.2% 36.8% 37.6% 65,596 36.4% 35.9% 37.0% 56,584 38.1% 37.5% 38.7%
Ages <65 157,901 66.2% 65.9% 66.4% 93,093 66.7% 66.4% 67.1% 64,808 65.4% 65.0% 65.8%
Ages 65+ 204,334 43.3% 43.0% 43.6% 115,274 43.0% 42.6% 43.4% 89,060 43.6% 43.1% 44.0%
Age group N Relative Survival 95% LCI 95% UCI N Relative Survival 95% LCI 95% UCI N Relative Survival 95% LCI 95% UCI
All Ages 316,201 53.9% 53.6% 54.1% 183,232 54.2% 53.9% 54.5% 132,969 53.4% 53.0% 53.7%
Ages <45 46,022 71.9% 71.5% 72.3% 26,303 71.8% 71.2% 72.4% 19,719 72.0% 71.4% 72.7%
Ages 45-54 30,961 67.0% 66.4% 67.6% 18,232 69.0% 68.2% 69.7% 12,729 64.2% 63.3% 65.1%
Ages 55-64 54,339 62.4% 61.9% 62.9% 33,627 62.8% 62.1% 63.4% 20,712 61.9% 61.1% 62.6%
Ages 65-74 72,982 51.8% 51.4% 52.3% 44,543 51.1% 50.5% 51.7% 28,439 52.9% 52.2% 53.6%
Ages 75+ 112,215 37.5% 37.0% 37.9% 60,735 36.6% 36.0% 37.2% 51,480 38.4% 37.8% 39.0%
Ages <65 131,237 67.0% 66.7% 67.3% 78,109 67.4% 67.0% 67.8% 53,128 66.3% 65.9% 66.8%
Ages 65+ 185,078 43.4% 43.1% 43.8% 105,193 43.1% 42.7% 43.5% 79,885 43.9% 43.4% 44.3%
Age group N Relative Survival 95% LCI 95% UCI N Relative Survival 95% LCI 95% UCI N Relative Survival 95% LCI 95% UCI
All Ages 30,205 48.3% 47.6% 49.0% 16,125 49.1% 48.1% 50.0% 14,080 47.4% 46.4% 48.4%
Ages <45 7,242 61.6% 60.3% 62.8% 3,960 61.4% 59.8% 63.0% 3,282 61.7% 59.9% 63.5%
Ages 45-54 4,195 54.5% 52.7% 56.2% 2,354 55.3% 52.9% 57.6% 1,841 53.4% 50.8% 55.9%
Ages 55-64 5,771 50.7% 49.1% 52.3% 3,223 51.0% 48.9% 53.2% 2,548 50.4% 48.0% 52.7%
Ages 65-74 6,291 42.9% 41.3% 44.5% 3,502 42.2% 39.9% 44.4% 2,789 43.9% 41.5% 46.2%
Ages 75+ 6,739 29.5% 27.8% 31.2% 3,106 29.7% 27.1% 32.3% 3,633 29.3% 27.1% 31.6%
Ages <65 17,195 56.4% 55.6% 57.2% 9,528 56.6% 55.5% 57.8% 7,667 56.1% 54.9% 57.3%
Ages 65+ 13,020 36.3% 35.1% 37.4% 6,602 36.6% 34.9% 38.3% 6,418 35.9% 34.3% 37.5%
*Based on cases diagnosed between 2001-2013 and follow-up of patients through 2013.
¶Data compiled from 34 cancer registries (AL, AK, AZ, CA, CO, DE, FL, GA, ID, IL, IN, KS, KY, LA, ME, MD, MI, MN, MS, MT, NE, NH, NJ, NY, NC, ND, OR, PA, RI, SC, VT, WV, WI, and WY) that
met the data quality criteria for survival analysis (covering approximately 70% of the U.S. population), as submitted to CDC’s National Program of Cancer Registries (NPCR) in November
2016. For more information see USCS technical notes (http://www.cdc.gov/cancer/npcr/uscs/technical_notes/relative_survival/).
Abbreviations: LCI = Lower confidence interval; UCI = Upper confidence interval.
Black
Male and female Male Female
Table 24. Five-Year Relative Survival*, Leukemia, by Race, Sex, and Age Group — National Program of Cancer Registries¶, 2001-2013.
Leukemia
White
Male and female Male Female
Leukemia
Leukemia
All Races
Male and female Male Female