Embed Size (px)
Citation preview

Page 1
Sustainability Option: Application to
BP's Deepwater Horizon Case
*Miriam Pedol, Alternative Risk Transfer and Insurance Linked Securities
Analyst in Assicurazioni Generali S.p.A., Trieste, Italy.
She also wrote with Tony Cabot Quantify Sustainability: a new factor inside
insurance pricing, 2015, published by Argo Group International Holding,
Ltd. This paper is also based on evidences and results of her thesis
Sustainability in the insurance industry connected to the credit and surety
line of business. Governance and pricing: theoretical aspects and
applications with Professor Piera Mazzoleni as thesis supervisor, 2014 -
M.Sc. in Actuarial and Economic Statistical Sciences, Università Cattolica
del Sacro Cuore, Milano.

Page 2
Abstract
Sustainability is a strategy that impacts project value estimation. The aim of
this study is to present a model based on a Real Option approach which
introduces Sustainability in project evaluation using the “Real Option for
Sustainability”. From the purpose of this paper, Sustainability means to invest
in mitigating environmental, social and governance (hereinafter ESG) risks.
Therefore, we find that under our model, sustainable projects present also an
actual value resulting in the mitigation of their ESG risks. This evaluation is
useful for helping Management to take decisions and for all the stakeholders
because it provides further elements when considering projects’ capability of
generating value over time.
This paper is structured as follows: firstly, we present the Sustainability topic
and secondly, we propose a Real Option methodology for sustainable
strategies’ evaluation and a related illustrative case study based on the British
Petroleum's management decisions that caused the Deepwater Horizon disaster
(on 20th April 2010).
Keywords – sustainability; triple bottom line; ESG factors; real option; real
option for sustainability.

Page 3
Introduction
Why should an economic initiative (company or project) adopt a behavior
based on Sustainability? What does it mean when an economic initiative
(company or project) adopts a sustainable behavior?
The Sustainability topic represents a fundamental issue for this century. The
aim of this paper is to introduce a real option to consider Sustainability in the
evaluation of an economic initiative.
The definition of Sustainability is not univocal. This is the reason why, in the
first section, we describe how the “sustainable” concept was developed by
international communities according to UN guidelines.
In particular, for a company/project, the aim of a Sustainability strategy is to
reduce the risks of failure. We adopt the ESG factors and the Triple Bottom
Line concepts and argue about the opportunity to take these factors into
account in economic projects, with the result of affecting positively the
economic performance of a company/ project.
Furthermore, we show that adopting a Sustainability strategy has several points
of strength. For example, investments in safety, the implementation of an early
warning system and alerts, are beneficial to mitigating the impact of expected
loss, to recovery and to the probability of reducing or eliminating adverse
events.
Therefore, there are ex-ante benefits for an organization’s defense against such
events and ex-post benefits arising from pre-qualified intervention plans,
which can help contain losses and can save important intangible assets, such
as the Company’s image and reputation over time.
The aim of the “Real Option for Sustainability”, introduced in this paper in the
second section, is to be a strategic management tool, when it is a risk mitigation
instrument linked with ESG factors.
In particular the real option presented is used for evaluating the opportunity to
invest in covering the risks correlated with ESG factors, establishing, in this
way, a threshold of prevention against a specific adverse event at a given time.
In the third section, we propose an application of the Real Option for
Sustainability in the Oil sector. The reason is that sustainable investments are
deeply relevant in this sector, hence decisions concerning them should be at
the core of the project planning phase. The business study that is analyzed is
the disaster occurred on the Deepwater Horizon of British Petroleum in 2010.
After a screening of the main dynamics of the event, as costs, losses and

Page 4
wrongdoings, we calculate the value of the option of a project of drilling an oil
well, analyzing the benefits that can derive from using sustainable strategies.

Page 5
Section 1
KEY CONCEPTS OF SUSTAINABILITY
The world must be able to cope with present and future challenges brought by
new drivers of change, such as demography, environment, technology and
values in behaviours and contents.
Social sensibility demands companies, and people who work in them, to be
compliant with these drivers of change. The Market’s specific focus on profit
is not enough to reach a competitive advantage based on Sustainability, which
increases the recognition of a company’s reputation through its ability to
operate and do it well.
According to Elkington’s example, four main types of companies, or “value
webs”, are distinguishable along the evolutionary path to a "chrysalis
economy"1.
This concept can be explained with the image of a flowered garden. Four kind
of insects live in that garden. There are locusts that destroy the garden by eating
and ruining the grass and the flowers everywhere. Moreover there are also
caterpillars, called also “eating machines”, that eat leaves voraciously only in
a single point of the garden. Butterflies also live in the garden, but do not
destroy anything and live only one day. Finally, the fourth kind of insects are
honeybees. Honeybees not only do not ruin the garden but also create the
maintenance, they are strongly regenerative, in other words they are
sustainable.
The metaphor is clear, Sustainability is the key to keep going and it is the
fundamental issue of this century.
The definition of Sustainability2 (or sustainable development) is not univocal
and it has developed over time. We chose to adopt the UN definitions for the
purposes of this paper3:
1 The Chrysalis Economy: How Citizen CEOs and Corporations Can Fuse Values and Value
Creation, (2001). Elkington, J., Cannibals with forks: The Triple Bottom Line of 21st Century
Business, Oxford, UK: Capstone, 1998. 2 Sustainability is a topic of greater interest in public argumentations. The etymology of the
term derives from Latin, the verb to sustain is composed by two words sub - it means up
(from below), upward – and tenére – it means to keep, to hold. Thus, sub-tenére means to
hold in high, to hold up, to bring on himself, fig. to wield, to take care, to shield, to retain, to
maintain, to feed. It was used also for to resist/ withstand the enemy or adversity. Thus, the
idea behind sustainability is the possibility to give continuity to something.
(htttp:/www.etimo.it) 3 Our Common Future the Brundtland Commission, 1987, United Nations World Commission
on Environment and Development, Part 1, Chapter 2.

Page 6
Development that meets the needs of the present without compromising the ability of
future generations to meet their own needs. It contains within it two key concepts:
• the concept of needs, in particular the essential needs of the world's poor, to
which overriding priority should be given; and
• the idea of limitations imposed by the state of technology and social
organization on the environment's ability to meet present and future needs.
Therefore, environment, society and governance (ESG) identify the three main
factors in measuring the sustainability.
In the 1980s, new concepts about interactions between financial performance
and “social capital”4 started to diffuse5. Furthermore, new awareness about
environmental issues developed as a result of some disasters, such as oil spills6.
The need of responsible investment products was granted by the investment
market. According to Elkington, non-financial factors must be included in a
company’s performance analysis in order to describe better its real value and
business.
Interconnections between environmental aspects and finance have been
studied by research teams, including the groups of Chris Yates-Smith 7 .
Afterwards, many banks and investment funds in the world started to weigh up
ESG factors in their investments.
4 Coleman J. S., Social Capital in the Creation of Human Capital in the American Journal of
Sociology, 1988. 5 Milton Friedman’s theory had a great impact on economic views during the second half of
20th century. In his works (Friedman, M. – Friedman, R., Free to choose: a personal
statement, London, Secker & Warburg, 1980. Friedman, M., Essays in positive economics,
Chicago, University of Chicago Press, 1966), he disputed the point of view according to
which social responsibility has a positive impact on financial performances of a company;
moreover, he attacked the rule of regulation and interventions of governments, arguing that
these deteriorate the macro economy. Thus, his main idea was that companies' strategies and
choices are based only on profits/costs. Nevertheless, many researches appeared during 20th
and 21st centuries to support the contrary argument. 6 In 1989, 260,000 barrels of crude oil from the Exxon Valdez oil tanker poured on the waters
of Alaska's Prince William Sound. That oil spill covered 1,300 miles (2,100 km) of pristine
coastline. Thus, the redefinitions of risk were revised from the high financial and
environmental cost supported. 7 In 2002, he took part in an informal group The Virtuous Circle, in London. In 2005, he
established a private environmental metrics (researches on environmental accords and ISO
standards) Environmetrics, in Lisbon.

Page 7
Of the three areas concerning ESG, Moskowitz8, a journalist, highlighted the
importance of good governance for corporates in financial performances.
Consequently, he published a list of companies, focusing on corporate
management, in particular on the relationship with the shareholders and on
workers conditions. In fact, he has argued that better corporate governance
practices, if (effectively) implemented with the aim of managing resources and
developing talents, without compromising financial performances, can
positively affect productivity. This intuition was supported by Edmans’
publication9 in which he suggested the one hundred best companies to work
for in America because they had a superior performance than their competitors
– the long-run stock returns were 2-3% greater than the industry benchmarks
a year, over 1984-2009. It is shown that these results were consistent with the
human relations theory:
Firms with high levels of employee satisfaction generate superior long-horizon
returns, even when controlling for industries, factor risk, or a broad set of
observable characteristics10.
Moreover, there is a report, commissioned by the UNEP Financial Initiatives
to Freshfields Bruckhaus Deringer11 regarding investors and ESG issues for
investment companies; the final results saw the integration of those factors as
a fiduciary duty of these companies 12 . Furthermore, other studies were
conducted on this subject. Barnett and Salomon13 analyzed the curvilinear
relationship between financial and social performance, by studying social
screening strategies on a sample of 61 mutual funds that practiced socially
responsible investing from 1972-2000. This research shows that as the number
of social screens used by an SRI fund increases, financial returns decline at
first, but then rebound as the number of screens reaches a maximum14 (as a
curvilinear relationship). Consequently, the application of different kinds of
social screens brings to different financial performances:
8 Moskowitz, M., Choosing socially responsible stocks, Business and Society Review, 1: 71-
75, 1972. Levering, R. - Moskowitz, M. – Katz, M., The 100 Best Companies to Work For in
America, Addison - Wesley, Reading, 1984. Levering, R. - Moskowitz, M. The 100 Best
Companies to Work For in America, Plumbe, New 9 Edmans, A., Does the Stock Market Fully Value Intangibles? Employee Satisfaction and
Equity Prices, Journal of Financial Economics, 101, 2011. 10 Ibidem. 11 It is an international law firm, see http://www.freshfields.com/en/global/. 12 http://www.unepfi.org/fileadmin/documents/freshfields_legal_resp_20051123.pdf, 2005.
13 Barnett, M. - Salomon, R., Beyond Dichotomy: The Curvilinear Relationship between Social
Responsibility and Financial Performance, Strategic Management Journal, 27, 2006. 14 Ibidem.
Page 8
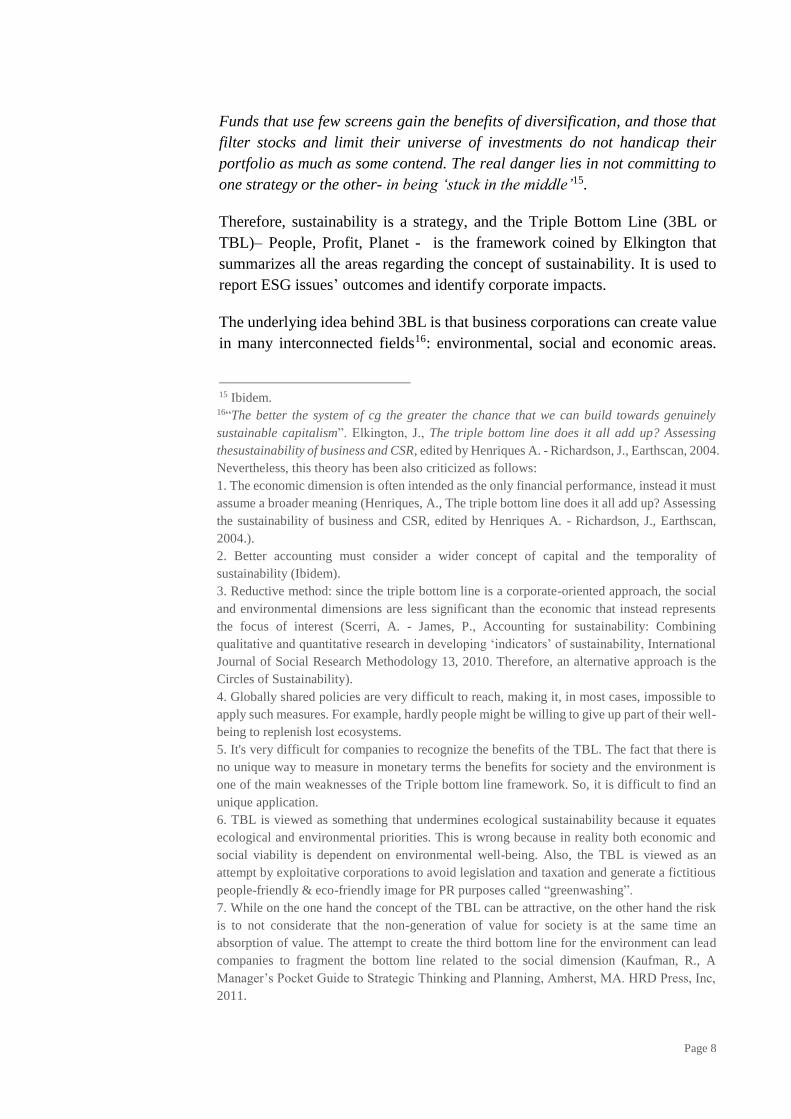
Funds that use few screens gain the benefits of diversification, and those that
filter stocks and limit their universe of investments do not handicap their
portfolio as much as some contend. The real danger lies in not committing to
one strategy or the other- in being ‘stuck in the middle’15.
Therefore, sustainability is a strategy, and the Triple Bottom Line (3BL or
TBL)– People, Profit, Planet - is the framework coined by Elkington that
summarizes all the areas regarding the concept of sustainability. It is used to
report ESG issues’ outcomes and identify corporate impacts.
The underlying idea behind 3BL is that business corporations can create value
in many interconnected fields16: environmental, social and economic areas.
15 Ibidem.
16“The better the system of cg the greater the chance that we can build towards genuinely
sustainable capitalism”. Elkington, J., The triple bottom line does it all add up? Assessing
thesustainability of business and CSR, edited by Henriques A. - Richardson, J., Earthscan, 2004.
Nevertheless, this theory has been also criticized as follows:
1. The economic dimension is often intended as the only financial performance, instead it must
assume a broader meaning (Henriques, A., The triple bottom line does it all add up? Assessing
the sustainability of business and CSR, edited by Henriques A. - Richardson, J., Earthscan,
2004.).
2. Better accounting must consider a wider concept of capital and the temporality of
sustainability (Ibidem).
3. Reductive method: since the triple bottom line is a corporate-oriented approach, the social
and environmental dimensions are less significant than the economic that instead represents
the focus of interest (Scerri, A. - James, P., Accounting for sustainability: Combining
qualitative and quantitative research in developing ‘indicators’ of sustainability, International
Journal of Social Research Methodology 13, 2010. Therefore, an alternative approach is the
Circles of Sustainability).
4. Globally shared policies are very difficult to reach, making it, in most cases, impossible to
apply such measures. For example, hardly people might be willing to give up part of their well-
being to replenish lost ecosystems.
5. It's very difficult for companies to recognize the benefits of the TBL. The fact that there is
no unique way to measure in monetary terms the benefits for society and the environment is
one of the main weaknesses of the Triple bottom line framework. So, it is difficult to find an
unique application.
6. TBL is viewed as something that undermines ecological sustainability because it equates
ecological and environmental priorities. This is wrong because in reality both economic and
social viability is dependent on environmental well-being. Also, the TBL is viewed as an
attempt by exploitative corporations to avoid legislation and taxation and generate a fictitious
people-friendly & eco-friendly image for PR purposes called “greenwashing”.
7. While on the one hand the concept of the TBL can be attractive, on the other hand the risk
is to not considerate that the non-generation of value for society is at the same time an
absorption of value. The attempt to create the third bottom line for the environment can lead
companies to fragment the bottom line related to the social dimension (Kaufman, R., A
Manager’s Pocket Guide to Strategic Thinking and Planning, Amherst, MA. HRD Press, Inc,
2011.

Page 9
Accordingly, Elkington does not speak explicitly of governance, but he argues
that a good equilibrium of these areas is necessarily the consequence of good
governance.
One of the most common framework used by the UN to represent this concept
is:
Bernardez, M., Achieving Business Success by Developing Clients and Community: Lessons
from Leading Companies, Emerging Economies and a Nine-Year Case Study, Performance
Improvement Quarterly 18, 2005.
FIGURE A_IMAGE ADAPTED FROM THE 2002 UNIVERSITY OF
MICHIGAN SUSTAINABILITY ASSESSMENT UNIVERSITY OF MICHIGAN.

Page 10
The meaning is that companies should give greater importance to the various
needs and interests of their stakeholders, rather than maximizing only
shareholder utility. The 3BL model has fostered the criticality and importance
of ESG issues and the responsibility of the impacts of business activities.
The sustainability concept came to be and was developed from the
international challenges especially within the UN and business networks
initiatives 17 , focusing on its relevance in the financial sector, through
‘Principles’. The UN sustainability principles are neither philanthropy nor
simply a cost for societies, but rather a value system that gives the opportunity
to benefit from intangible capital as a support for the economy.
When stakeholders share the UN principles of sustainability, a relationship is
generated which becomes an intangible asset as they put pressure on the other
stakeholders to also adopt a sustainable strategy.
Every stakeholder has a stake that can be only economic (i.e. more profit, less
cost), social (e.g. respect of local people), environmental (e.g. less pollution)
or combinations of these three interests.
In fields such as law, management and human resources, the stakeholder
theory 18 is challenging the usual frameworks, by suggesting we put
stakeholders' needs at the heart of any action or strategy.
An economic sustainable project is the result of interactions among
stakeholders. In order to realize it with a sustainable approach the project must
consider environmental, social and governance factors.
Therefore, sustainability is a common stake, and generates intangible and
tangible value and a good reputation. These conditions create competitive
advantages for those who invest in sustainability. In particular, tangible value
can consist in benefits (or lower costs) also given by financial intermediaries
17 Some examples might be: UN Global Compact Principles (2000), IFC Equator Principles
(project financing 2004), UNEP FI Global Compact Principles for Responsible Investments
(2006), UNEP FI Principles for Sustainable Insurance (Rio +20, 2012). 18 The term stakeholder appeared for the first time on an internal memorandum of Stanford
Research Institute (1963), representing those groups without whose support the organization
would cease to exist. Therefore, Freeman developed the stakeholder theory and thus this
concept began to be used in many different contexts. Moreover, stakeholders are individuals
or groups (or organizations) that affect or are affected by the organization (company or
project) and its processes, activities, and functioning. It is possible in a broader mapping of a
company's stakeholders to assume other entities, such as government legislative bodies,
government tax-collecting agencies, industry trade groups, professional associations, NGOs,
(inter-)national communities, global community and future generations.

Page 11
which recognize a lower risk profile, and the capacity to generate and maintain
value over time19. This advantage increases opportunities for more investments
in sustainability.
19 For example, insurance companies are able to trigger a sustainable approach: the effort of
industry companies to invest in sustainability, which could be seen only as a cost in the short
run, is awarded by a lower cost of insurance products. Accordingly, the majority of the
financial products that are sold are a result of analysis based on creditworthiness (see Pedol
M. - Cabot T., Quantify Sustainability: a new factor inside insurance pricing, 2015,
published by Argo Group International Holding, Ltd.

Page 12
Section 2
HOW TO INTRODUCE SUSTAINABILITY IN
DECISIONS? THE REAL OPTIONS
The idea behind is to have a quantitative tool helpful in measuring the impact
of being sustainable when taking decisions. The starting point could be to use
the real option model20. In general, a real option values a choice associated to
business investment opportunities and focuses on tangible and/or intangible
assets. We can use a real option to value the investment in sustainability as a
risk mitigation technique. The reason is that management can greatly affect
the valuation of investments (or additional investment), and therefore, can
demonstrate the value of sustainability for a project in comparison to that of an
unsustainable project.
The real option approach is developed under some assumptions: uncertainty
creates opportunities but only if management assumes adequate decisions. This
is true if it is possible to complete an identification of the sources of uncertainty,
of the data collection and of the choices/options. The aim is also to find optimal
decision rules with lower exposure to downside risk.
THE OPTION OF SUSTAINABILITY
Now we want to introduce the “sustainability option” (or the Real Option for
Sustainability/ option of sustainability). This real option is not classified as a
typical real option21. Indeed, we have a particular new opportunity: a company
wants to invest in a project and its Management has to decide to invest in
sustainability or not. The Management has two choices. It can either just
finance a basic or unsustainable project or add financing for sustainability with
20 Stewart Myers of the MIT Sloan School of Management wrote about real options in 1977.
In the recent years, this approach has developed an increasingly more important position in
the financial markets.
There are real options when there is the possibility to choose different strategies during the
project’s life and, as a consequence, to change the size, opportunity and risk of a project’s
cash flows. So, these types of options can add (or deduct) value to the project analysis.
Moreover, these options are a good tool to make a project flexible in relation to the market
changes and because they study each scenario identifying the most appropriate corporate
action. 21 Hull, J., Options, Futures and other Derivatives. New York: Prentice Hall, 19936, ed.
2012. Trigeorgis, L., Real in Capital Investment. Models, Strategies and Application,
Greenwood Publishing Group. 1995.
Brasch, M. A., Real Option in practice, Wiley Finance, New Jersey, 2003.

Page 13
the aim of preventing or avoiding loss from adverse events. In this context, we
consider sustainability as risk mitigation. Therefore, the Management’s
decision is to include sustainability factors and to finance them; in essence,
they are choosing to cover the risks correlated with ESG factors. Here, real
options are not only a tool to value a choice, but also a risk management
instrument. In this context, the link between financial options and a real option
is straighter: both can be viewed as hedging functions. Thus, the option of
sustainability can be used to value an added investment that covers risk. In this
case, the option follows a put option ‘logic’ where the time to maturity is the
time of the coverage. The holder/management obtains the right to establish a
threshold of prevention against a specific adverse event at a given time. In
particular, it follows the logic of a long put because the holder fears adverse
events over the life of the project.
Another way22 to classify real options is the nature of the opportunity, such as:
option to grow, contraction option, flexibility option.
Now, we introduce a new category connected to risk mitigation. Indeed, every
project has its probability of failure: if a material adverse event occurs the
project will potentially produce a loss. Taking as an example environmental
risks, environmental adverse events can generate disasters (natural or man-
made) that are often catastrophic, so such events can lead to the default of the
company.
If we consider these events, we can value the opportunity of sustainability as
an investment and not as a cost. The real options approach gives prominence
to the downside risk: uncertainty can make people appreciate the additional
value of sustainability, especially to those who are poised to take advantage of
it.
For the sake of clarity, we offer the example of a European real option. In our
example we consider a Company that is considering an important project. The
cost of the project is X, and the future cash flows are uncertain, so we have
real-world probabilities of certain events happening - or not happening:
- p [0,1] is the probability to have the best scenario and generate a
positive cash flow of S million after T years.
- (1-p) [0,1] is the probability of a negative event connected with an
ESG factor; in this state the cash flow is negative for Z after T years. So, there
is a chance that the project will generate a loss.
If the Company invests in sustainability the initial cost of the project is greater
for C, but if the adverse event occurs the loss is G less than Z.
22 Triantis, A. J., Real options and corporate risk management, Journal of Applied Corporate
Finance, 2000.
Page 14
The discount rate is the minimum return that a Company must earn on the
project that requires a return for the riskiness. It is the Company’s cost of
capital or weighted average cost of capital (WACC) that represents the rate that
the company is expected to pay on average to all its security holders.
In order to assess the optimal investment, we now consider NPV analysis, the
tree analysis and Black–Scholes methods as models to evaluate real options.
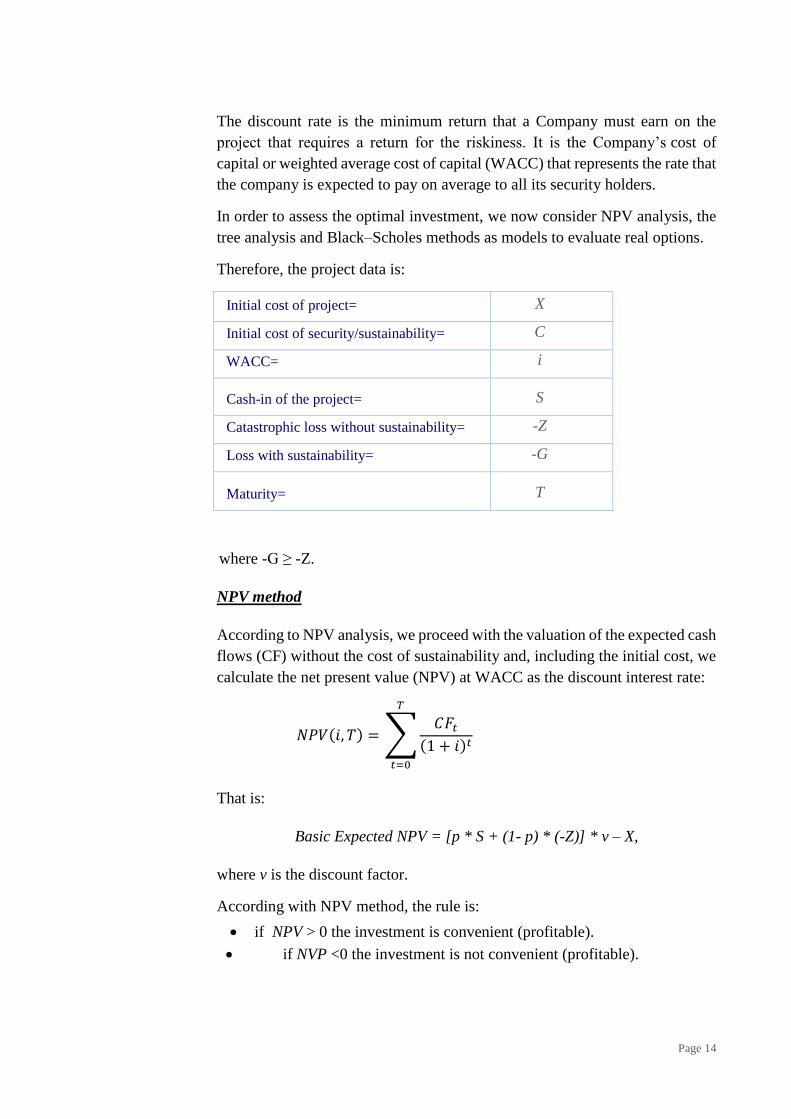
Therefore, the project data is:
Initial cost of project= X
Initial cost of security/sustainability= C
WACC= i
Cash-in of the project= S
Catastrophic loss without sustainability= -Z
Loss with sustainability= -G
Maturity= T
where -G ≥ -Z.
NPV method
According to NPV analysis, we proceed with the valuation of the expected cash
flows (CF) without the cost of sustainability and, including the initial cost, we
calculate the net present value (NPV) at WACC as the discount interest rate:
𝑁𝑃𝑉(𝑖, 𝑇) = ∑𝐶𝐹𝑡
(1 + 𝑖)𝑡
𝑇
𝑡=0
That is:
Basic Expected NPV = [p * S + (1- p) * (-Z)] * v – X,
where v is the discount factor.
According with NPV method, the rule is:
• if NPV > 0 the investment is convenient (profitable).
• if NVP <0 the investment is not convenient (profitable).

Page 15
By considering the value of the option, the assessment analysis would be done
through a what-if analysis of the NPV: how NPV changes when there is
variability in its variables.
With Net Present Value, we cannot value the benefits of the sustainable
option, so we need to use another technique because we analyze only a part
of the project as the following graph shows.
FIGURE B_UNCERTAINTIES AND STRATEGIC ALTERNATIVES.
Tree analysis of the option of sustainability
We can explain by scenario analysis the choices that we can take: to invest in
a project with a sustainable strategy or not. First, we describe the scenario for
the basic project and the scenario for the sustainable project.
FIGURE C_TREE ANALYSIS OF BASIC AND SUSTAINABLE PROJECTS.
(Basic NPV with no investment
t = 0
t=T
t = T
t=T
t = 0
t=T
t = T
t=T

Page 16
where, we recall that-G ≥- Z.
The aim of the second step is to evaluate the expected value of NPVs, such as:
Basic NPV = [p * S + (1- p) * (-Z)] * v – X
Sustainable NPV = [p * S + (1- p) * (-G)] * v –X – C
We can obtain the option pay off as the difference between the cash flows of the
sustainable project and the basic project. The initial cost of the option is the cost
to invest in sustainability. In the basic scenario (with probability p), the pay-off
is null because the cash flows are the same for the two projects that we are
evaluating. In the worst case scenario (with probability (1-p)), there will be the
cash-in opportunity due to the reduced impact of a major loss due to better
security.
Payoffs to Real Option Holders (e.g. the Management) are:
0 if the situation is normal
-G-(-Z) = (Z -G) if the adverse event occurs
FIGURE D_SUSTAINABLE REAL OPTION TREE ANALYSIS.
Thus, it is possible to calculate the value of the real option (RO):
RO = [(1- p)* (Z -G)] * v – C
and the real option pay off is equal to Max[ Z – G ,0] – C.
Black–Scholes method
Now we adopt the Black and Scholes method to price the real option23. This
model has been used for financial instruments24 and in the recent decades has
23 Ibidem. 24 Hull, J., Options, Futures and other Derivatives. New York: Prentice Hall, 19936, ed.
2012.
Trigeorgis, L., Real in Capital Investment. Models, Strategies and Application, Greenwood
Publishing Group. 1995.
t = 0 t = T

Page 17
been adopted within the real option world. However, it is worth noting that
applying Black and Scholes model requires that the random variable
representing the underlying, i.e. the value of the unsustainable project, follows
a log-normal distribution.
Using the information of the project we can attribute a new meaning to the five
variables of the Black-Scholes model, so to evaluate the volatility and riskiness
of the project. The option to invest in a sustainable project aims to hedge the
risk of a loss linked to ESG factors of a specific project with a maturity of T
years. We assume that the time until the option expires in the project is the
same and the discount rate represents its time value of money. The option to
invest in a sustainable project can be represented as a European put option
where, for each t, the stock price is the value (Vt) of an unsustainable project’s
cash flows (gross of X). We consider the value (Vt) of a project’s cash flows,
if beforehand negotiated, as the best estimate of its ‘market value’ at time t;
while, the exercise price is equal to the certainty equivalent of a sustainable
project’s cash flows, assuming risk neutrality. The idea is that that the
possibility of a catastrophic loss event exists and that the Management is
willing to invest C to hedge against risks, so that the expected value of the
project is higher in comparison with of the basic project.
The final step is to find the value of the specific sustainable investment.
To summarize, we have:
Amram, M. – Kulatilaka, N., Real Options. Managing strategic investment in an uncertain
world, Harvard Business School Press, Boston, 1999.
Copeland, T. – Antikarov, V., Opzioni Reali: tecniche di analisi e valutazione, Il Sole 24
Ore, Milano, 2003.
Damodaran, A., The promise and the peril of the real options, Stern School of Business, New
York, 2005.
Dixit, A., Pindyck, R., Invetsment under uncertainty, Princeton University Press, Princeton,
1994.

Page 18
FIGURE E_ELEMENTS OF THE OPTION.
Thus, the option in sustainable project is:
RO (sP, T) = max [E(sP, T) -VT,0] – C
Making a kind of comparison with the financial put option, in the sustainability
put option, the strike price is equal to the certainty equivalent of the sustainable
cash flows in T and the underlying is the value in T of the basic project. The
company gains the value produced by the protection. The catastrophic losses
caused by a specific event are limited thanks to the project prevention.
The elements of the formula are:
sP = sustainable Project
E(sP, T) = certainty equivalent of the cash flows of the sustainable Project
VT = value of the unsustainable Project in T, i.e. the final cashflow of the
unsustainable project (cash-in or catastrophic loss) in T
C = initial cost of investing in sustainability
If the company implements the sustainable project, it will take advantage of the
cover. We need the risk neutral probability to use free-risk discounting, so we
_t

Page 19
calculate the value of the real option analyzing sensitivity in respect of the
investment volatility.
It is important to examine the sensitivity of the results with reference to the
standard deviation of the project because this sensitivity can change the
evaluation of the project.
We have that the value of the sustainable project is equal to the NPV of the
basic project plus the value of the sustainability option and when the project's
risk is higher, the value of the real option increases as well.

Page 20
Section 3
CASE STUDY BRITISH PETROLEUM**
** Please consider that some figures here presented could be reasonable
approximations because the intent of the author is to explain the underlying
reason of the Real Option described in the Section 2 and not give detailed
information of the event here presented.
In order to test our model for the Sustainability option in surety we are going
to analyze the case of the British Petroleum (BP) oil spill of 2010 better known
as the Deepwater Horizon spill. We take into consideration the causes and the
economic impact of this huge disaster that hit the company directly and caused
large damages in environmental, social and economic terms. Application of
the Sustainability option shows that if the company had implemented a
sustainable strategy considering all the variables connected to the operation, it
could have avoided this terrible event. This approach led the decision makers
to choose the best safety strategy even if there were higher costs for exploratory
drilling. These costs could have been more sustainable considering the whole
project and the connection with the Mexican Gulf environment and the
economy of the four key US States in the Gulf.
OVERVIEW OF THE BRITISH PETROLEUM AND THE DEEP
WATER HORIZON PROJECT
Prior to April 2010, BP was one of the six largest multinational companies in
the oil sector. BP’s stock is trading on NYSE at $60.57 and it is the largest
company listed on the London Stock Exchange. The company was founded in
1909 as the Anglo-Persian Oil Company (APOC) after eight years of searching
by the Englishman William Knox d’Arcy struck oil in Iran. After WW1 the
British government bought a stake of 51% in the nearly bankrupt company
with the idea that the sector would become of strategic importance for the army
and the future of the country.
The British government’s majority ownership lasted until 1970 when Prime
Minister Margaret Thatcher started to sell shares of the company to spur better
productivity. In 1987 the government sold its last remaining 31% given the
continuing decline in the performance and share price. In 1992 BP registered
a full-year loss of $811 million. A revised strategy of cost reduction was

Page 21
implemented and thanks to the merger with AMOCO in 1998 and ARCO (the
former Atlantic Richfield) the trend was finally reversed.
The Organizational structure changed in the late 80’s and early 90’s when
Robert Horton was appointed CEO of the company. With the aim to cut costs
of control he removed several layers of management. Horton transformed
hierarchically structured departments into smaller, more flexible teams
charged with maintaining open lines of communication.25
Horton transferred decision making upstream and downstream from the center.
The onsite asset managers26 were in charge of the performance targets of the
site and were managing with all the authority and responsibility. This model
of “Asset federation” was taken on charge when John Browne took over as a
CEO in 1995.
One of the weak points of the model was that there was not any exchange of
experience about risk management among the various exploration sites as
every manager was completely independent.
In 2001 BP started to change and improve its image under the CEO John
Browne with the new tagline “Beyond Petroleum”. The company invested in
alternative energies such as solar cells and wind mills. The investment in
alternative energy between 2005 and 2009 amounted to $4 billion.
In 2007 Tony Hayward replaced John Browne as CEO and changed the
“Beyond Petroleum" strategy to a far reaching and different strategy which
was based on “focus like a laser on safety issues, put the brakes on growth and
slash production targets”27. In the attempt to cut the company’s transactional
costs, Mr. Hayward adopted a less risk adverse approach in the belief that too
many people were involved in decision making.
On the safety site BP reported 63 incidents for misconduct since 1995
(Sheppard, 2013). On March 23, 2005 one of the largest accidents happened
in Texas where the explosion at BP’s City Refinery killed 15 people and
injured 180. It resulted in a financial loss exceeding $1.5 billion. On March
2006 a second disaster occurred in Alaska’s Prudhoe Bay where more than
200.000 gallons of oil poured into the sea from a corroded hole in the pipeline.
It was the largest oil spill on record in Alaska. After an inspection it was
determined that a large section of the steel pipeline had become very thin and
corroded.
25 BP After Horton, The Economist, July 1992. 26 Site manager is the figure in charge to manage a single well site called asset.
27 Hayward, T., BP 2008 strategy presentation, BP Publication, April 2010.

Page 22
In relation with these last incidents BP commissioned several independent
reports to detect causes. The most important of these reports was the Baker
report, which was commissioned by James Baker, former secretary of State
following the explosion in Texas City. The result of Baker report was that it
underlined the lack of safety culture in the company workforce:
“The Panel’s refinery-level interviews, the process safety culture survey, and
some BP documents suggest that significant portions of the U.S. refinery
workforce do not believe that process safety is a core value at BP. As many of
the refinery interviewees pointed out, and as some BP documents and the
process safety culture survey seem to confirm, one of the reasons for this belief
is that BP’s executive and corporate refining management have not
communicated a consistent and meaningful message about the importance of
process safety and a firm conviction that process accidents are not acceptable.
The inability of many in the workforce to perceive a consistent and meaningful
corporate message about process safety is easy to understand given the number
of “values” that BP articulates:
• BP’s 18 “Group values,” only one of which encompasses health and
safety—the company’s broad, aspirational goal of “no accidents, no harm
to people, and no harm to the environment.”
• Four “Brand values,” which BP claims, “underpin everything we do”:
being performance driven, innovative, progressive, and green. None of
these relates to safety.”28
In response to the Baker report and the others that followed it BP took four
major corrective actions to regain control of this glaring lack of safety:
• Leader Visibility: The BP’s CEO met with the company leaders to
reinforce the safety message. Safety training and workshops were done at all
levels of the organization with all American employees.
• Review of employee concerns: Retired United States Judge Stanley
Sporkin was put in charge of establishing a communication program wherein
all employees could voice their concerns.
• Auditing: The Safety and Operation organization was in charge to
conduct an internal and enhanced audit to assess the compliance against a
six point action plan for sustained development.
• Resources for plant, equipment, and systems: $7 billion program was
put in place to substitute infield pipeline in Alaska and to repair US
28 Baker, J., et al.,The Report of the BP U.S. Refineries Independent Safety Review, January
2007 pp82-85.

Page 23
refineries. And another $300 million was announced for a process safety in
refining program.
Between June 2007 and February 2010, 97% (829 of 851) of the willful safety
violations were handed down by the Occupational Safety and Health
Administration to the two BP-owned oil refineries in Texas and Ohio.29
THE MACONDO WELL
The Macondo well is located 52 miles south of the port of Venice, Louisiana
in the Gulf of Mexico. The well is located at a depth of 1524m below the sea
level. Its exploitation appeared to be problematic because of the high level of
natural gas. Notwithstanding the problems for drilling in ultra-deep water, it
was decided to proceed with the Macondo well due to the high price and
projected profitability of crude oil. The expectation for a deep water well was
up to 10.000 barrels a day.
BP acquired concession from US authority and started the Macondo well on
October 2009. A delay of a couple of months was recorded due to the passage
of hurricane Ida. On September 2009 after a BP audit on the Deepwater
Horizon Rig it was determined that the Rig needed at least 390 repairs with
estimated 3500 hours of labor.
On February 3, 2010 the drilling operation started. BP leased the Deep Water
Horizon Rig from Transocean at a daily rate of approximately $500,000. A
first estimation foresaw 51 days to drill the well at a budget of $96 million. By
April 20, 2010 the drilling was still not completed and had already exceeded
80 days, thereby far exceeding the initial budget.
The Deep Water Horizon Rig was just an exploratory vessel. Once the well
was drilled it would have to be tapped and a second facility would be brought
into place to exploit the well.
Closing the Macondo well was to be particularly difficult due to the deep water
and the high levels of natural gas. A series of mistakes took place in choosing
the techniques and the equipment due to competing interests of cost, time and
safety. The result was the largest tragedy in Ocean drilling.
29 Thomas, P.- Jones, L. A. - Cloherty, J.,Ryan, J., BP’s Dismal Safety Record, ABC World
News, 2010.

Page 24
THE DISASTER
On April 20, 2010 the Deepwater Horizon Rig working on Macondo well
exploded. Of the 126 workers on board, 17 were injured and 11 killed. The rig
burned for 36 hours, consuming 700.000 gallons of oil that were on board,
leaving a trail of smoke of over 48km. The Deepwater Horizon sank on April
22, taking with it the top pipe of the well and parts of the system that were
supposed to prevent blowouts from occurring.30
The Macondo well was finally capped on July15, 2010 after discharging nearly
five million barrels (around 779 million liters) of oil into the waters of the Gulf.
THE LOSS BY THE NUMBERS
The disaster resulted in 11 death and 17 injuries among Deepwater Horizon
crew. BP has paid $28 billion of damages with the risk of a final toll of $50
million.
FIGURE F_ DEEPWATER HORIZON OIL SPILL LIT IGATION31.
All the Federal waters were closed for drilling operations for a long period.
Around 2,000 rig worker jobs were lost during this time. The drilling operators
reduced their spending by as much as $1.8 billion. The total cost in lost jobs
for the Gulf Coast amounted to somewhere between 8.000 to 12.000.
30 Ingersoll, C. - Locke, R. M. - Reavis C., BP and Deepwater Horizon disaster of 2010, MIT
Sloan Management, 2011. 31http://sero.nmfs.noaa.gov/deepwater_horizon/index.html

Page 25
FIGURE G_ CLOSURE OF FEDERAL WATERS32.
BP share price collapsed from $60.57 on April 15, 2010 to $ 27.02 on June 25,
2010. Frustration spread among shareholders as the different attempts to cap
the well failed until the middle of July.
FIGURE H_ BP SHARE PRICE33.
The environmental damage of the spill extended to 1,770 km of shore line
impacting 25 national wildlife refuges. Four States were heavily hit by the leak:
Louisiana, Mississippi, Alabama and Florida. The recovery time for crude oil
pollution is estimated in 50 years. From 2010 to 2012, 817 cases of death of
bottlenose dolphins were reported compared to a normal rate of reported deaths
of 100 per year.
32Ibidem. 33Ibidem.

Page 26
FIGURE I_ MARINE LIFE MORTALITY34.
In direct cost the sinking of Deepwater Ocean rig represented $560 million for
Transocean and many insurers including the underwriters at Lloyd’s of London.
Another impact of this event was the increase of the cost of oil rig insurance
by as much as $10,000 to $15,000 per day.
In economic terms many different sectors were severely impacted by this loss:
fishermen, shrimpers, oystermen and many people involved with the tourism
sector. The total lost jobs terms in the Gulf region was estimated at 250.000
jobs.35
In terms of oil, 4.9 million of barrels were lost at an average cost per barrel of
$74.81 (April 2010) this loss amounted to $374 million.
FIGURE J_ DEEPWATER HORIZON OIL BUDGET: BASED ON ESTIMATED RELEASE OF 4.9M BARRELS OF OIL36.
34 Ibidem. 35 Standard and Poor’s Industry Surveys: Oil & Gas, Production and Marketing, August,
2010. 36 Ibidem.

Page 27
AN APPLICATION
In this exercise we consider a Company that is planning to drill an oil well.
We take into consideration the following figures from BP project in Macondo
Well:
10.000 barrels a day is the potential exploitation of the Macondo well. BP
decided to drill the Macondo Well situated at a depth of about 1,500 m
below the sea surface. The decision to exploit a well so deep was taken
considering the high price of oil in that period, which thereby allowed the
company to cover high cost of exploitation. The projected high
performance of the Well compared to some thousand barrels per day of the
shallow water wells was also a major motivating factor to move forward
with this project.
$80 per barrel was the oil price on April 2010
$96 million was the cost of BP operation planned for 51 days
$48 billion was the projected loss that BP sustained
$169,298.39 was the amount BP saved by deciding not to test the cementing
of the well effectively discounting the high risk for gas channeling. They
also would have saved $500.000 if they were able to complete the operation
one day ahead of the projected date.
We are considering these figures to test our model: the cost of the project is
$96 million, but the future cash flows are uncertain. Company estimates a 0.3%
the probability that an environmental disaster occurs. Therefore, there is a 99.7%
probability to have an operating well producing $1.8 billion; considering
10.000 barrels a day for thirty years. In case of a disaster, a total loss of -$43
billion will be recorded in the cash flow of the first year. The weighted average
cost of capital is 15%.
➢ Inputs
All the inputs are resumed in the following tabs:
WACC= 15% Catastrofic loss without sustainability $43.000
Risk-free rate = 2,5% Catastrofic loss with sustainability $0
Initial cost of project= $96 Loss failure $43.000
Initial cost of secutity/sustainability= $1 Cash-in of the project $1.800

Page 28
➢ Net Present Value
Our assumption is that the positive cash flow is equal to the present value as
turnover of the oil well (taking into account the operating cost, it does not
matter if we put the positive CF equal to the NPV37).
The Net Present Value of the drilling operation without sustainability costs is
positive.
If we have to stop at this assessment, we would not be able to incorporate the
value of any investment in sustainability. In fact, considering that investing in
sustainability has an additional initial cost, the investment would not be
convenient.
➢ Decision Tree Analysis for Option of sustainability
Now we suppose to have the option to invest in sustainability, the option
can be seen as a put option as described in section 2, then:
37 In this scenario, the example is true also if the cost is up to 90% of the turnover.
DCF Analysis
Expected cash flows (in millions) without cost of sustainability
Probability Cash Flow Prob. x CF
99,7% $1.800 $1.794,60
0,3% ($43.000) ($129,00)
Expected CF = $1.665,60
NPV (in millions) without cost of sustainability
Time Line Year 0 1
Expected CF ($96) $1.665,60
NPV = $1.352,35

Page 29
The unsustainable project has a Net Present Value of $1,352.35 million and a
coefficient of variation (standard deviation/expected value of NPVs) of 158%.
The project with $0,669 million dollar investment in sustainability, has a Net
Present Value of $1.463, 85 million and a low coefficient of variation, equal to
6%.
1.1 Project without investment in sustainability
NPV of this Probability
Year 0 Year 1 Scenarioa
Probability x NPV
NO Sust O K -$96 $1.800 $1.469,22 99,70% $1.464,81
KO
-$96 -$43.000 -$37.487,30 0,30% -$112,46
100,00%
Expected value of NPVs = $1.352,35
Standard deviation = $2.130,53
Coefficient of variation = 158%
Future Cash Flows
0.003
0.997
1.2 Project with investment in sustainability
Future Cash Flows NPV of this Probability
Year 0 Year 1 Scenariod
Probability x NPV
YES Sust O K -$97 $1.800 $1.468,55 99,70% $1.464,14
KO
-$97 $0 -$96,67 0,30% -$0,29
100,00%
Expected value of NPVs = $1.463,85
Standard deviation = $85,60
Coefficient of variation = 6%
0.003
0.997
1.3 _ INVESTMENT IN SUSTAINABILITY
NPV of this Probability
Year 0 Year 1 Scenario Probability x NPV
Invest Sust O K -$1 $0 -$0,67 99,70% -$0,67
KO
-$1 $43.000 $37.390,64 0,30% $112,17
100,00%
Expected value of NPVs = $111,50
Future Cash Flows
0.003
0.997

Page 30
The value of the option (or option premium) obtained through the difference
of the Net Present Values of sustainable and unsustainable projects is positive
and equal to $111.50 million.
Consequently, the value of the sustainable project is equal to the NPV of the
unsustainable project plus the value of the real option. The sustainable project
is therefore preferred not only because it has a higher NPV but also because it
has a much lower volatility in the cash flows than the unsustainable project.
➢ Black–Scholes method
In this paragraph, we can calculate the real option with Black and Scholes
method where the CE of the cash flows of the sustainable project is equal to
the expected value of the sustainable project’s cash flows. But, we should
assumed either a binomial or a log-normal distribution and we should assumed
to have enough data to calibrate the parameters of the pricing models.
Nevertheless, when dealing with environmental sustainability we often
challenge extreme events and, due to the scarcity of available data, probability
distribution could be better modelled by means of the Extreme Value Theory38.
However, that was not in the scope of the paper which aims to focus on the
real option for sustainability.
38 Embrechts, P. & Klüppelberg, C. & Mikosch, T. (1997). Modelling Extremal Events for Insurance and Finance, Springer Zhou, C. (2009). “Existence and consistency of maximum likelihood estimator for the extreme value index”. Journal of Multivariate Analysis 100:794–815. Zhou, C. (2010). “The extent of the maximum likelihood estimator for the extreme value index”. Journal of Multivariate Analysis 101:971–983.

Page 31
CONCLUSION
With this paper, we demonstrate that we can actually value sustainable
investment when it is a risk mitigation strategy.
In this way, we can correctly evaluate a 'sustainable' project, creating a 'trade-
off' between the need to adopt an approach that takes into account the interests
of all stakeholders and the interest in the development of economic initiatives
by obtaining profits.
Sustainability allows considering stakeholders’ interests through ESG factors
and it can generate value.
The Value of economic initiatives can be evaluated introducing a real option
approach, the Real Option for Sustainability. Accordingly, it is possible to
evaluate the project, in conditions of uncertainty and flexibility, as well as the
current value of savings in case of future losses, considered at the time when
the option is exercised.
This is an innovative tool useful to select optimal strategies for the benefits of
Management and, in general, whoever is interested in evaluating it. Therefore,
the choice is to invest, or not, in a sustainable project.
Through the support of the case study, we have demonstrated that the
sustainable project has an added value: it is equal to the NPV of the
unsustainable project plus the actual value of the Real Option for Sustainability.
For the purpose of this paper we have investigated one-year coverage, but
Sustainability Real Option can be developed also as an American Real option
since the right of the option could be exercised in any time.
This option is a hedge against adverse events; therefore, it reduces the relative
volatility of the project’s cash flows. The evidence is that when the riskiness
of the project increases, so does the Real Option value. Therefore, the Real
Option for Sustainability is a risk mitigation instrument.
With the contribution of this model, we would also like to encourage the
development and the adoption of instruments useful for estimating competitive
advantages for those who invest in sustainability. In so doing they recognize a
lower risk profile, and the capacity to generate and maintain value over time;
value, that is not only intangible but also actually tangible.

Page 32
Disclaimer: The author declares that there is no conflict of interest.
This paper does not necessarily reflect the official policy or position of the
Generali Group on the subject here reported.

Page 33
REFERENCES
Amram, M. – Kulatilaka, N., Real Options. Managing strategic investment in
an uncertain world, Harvard Business School Press, Boston, 1999.
James Baker, J. - et al., The Report of the BP U.S. Refineries Independent
Safety Review, January 2007 pp82-85.
Barnett, M. - Salomon, R., Beyond Dichotomy: The Curvilinear Relationship
between Social Responsibility and Financial Performance, Strategic
Management Journal, 27, 2006
Benn, S. – Bolton, D., Key Concepts in Corporate Social Responsibility, Sage
Publications, 2011 2.
Bernardez, M., Achieving Business Success by Developing Clients and
Community: Lessons from Leading Companies, Emerging Economies and a
Nine Year Case Study, Performance Improvement Quarterly 18, 2005.
Black, F. - Scholes, M., The Pricing of Option and Corporate Liabilities,
Journal of Political Economy, 1973.
Boyer, M. - Christoffersen, P. - Lasserre, P. - Pavlov, A. - Fraser, S., Value
creation, risk management, and real options, CIRANO, Université de
Montréal, McGill University, UQA’M, Simon Fraser University, 2003.
Brasch, M. A., Real Option in practice, Wiley Finance, New Jersey, 2003.
Brown, C., Beyond the bottom line, New York: Macmillan, 1979.
Carroll, A. B. - Näsi, J., Understanding stakeholder thinking: Themes from a
Finnish conference, Business Ethics: A European Review, 6, 46-51., 1997.
Castagnoli, E. - Cigola, M., Ottimizzazione statica e teoria dell'utilità, EGEA,
2005.
Coleman J. S., Social Capital in the Creation of Human Capital, the American
Journal of Sociology, 1988.
Copeland, T. – Antikarov, V., Opzioni Reali: tecniche di analisi e valutazione,
Il Sole 24 Ore, Milano, 2003.
Damodaran, A., The promise and the peril of the real options, Stern School of
Business, New York, 2005.
De Finetti, B. - Machi, A., Smith, A., Theory of Probability: A Critical
Treatment, Wiley, New York, 1990.

Page 34
Dixit, A., Pindyck, R., Invetsment under uncertainty, Princeton University
Press, Princeton, 1994.
Edmans, A., Does the Stock Market Fully Value Intangibles? Employee
Satisfaction and Equity Prices, Journal of Financial Economics, 101, 2011.
Elkington, J., Cannibals with forks: The Triple Bottom Line of 21st Century
Business, Oxford, UK: Capstone, 1998.
Elkington, J., The triple bottom line does it all add up? Assessing the
sustainability of business and CSR, edited by Henriques A. - Richardson,
J.,Earthscan, 2004.
Elkington, J., Towards the sustainable corporation: Win-win-win business
strategies for sustainable development, California Management Review 36, 2,
1994.
Embrechts, P. & Klüppelberg, C. & Mikosch, T. (1997). Modelling Extremal
Events for Insurance and Finance, Springer.
Fisher, I., The Theory of Interest, as Determined by Impatience to Spend
Income and Opportunity to Invest, Macmillan, New York, 1930.
Freeman, R.E., Strategic Management: A Stakeholder Approach, Pitman,
Boston, 1984.
Friedman, M. – Friedman, R., Free to choose: a personal statement, London,
Secker & Warburg, 1980.
Friedman, M., Essays in positive economics, Chicago, University of Chicago
Press, 1966.
Harrison, Wicks, Parmar, De Colle, Stakeholder Theory, State of the Art,
Cambridge University Press, 2010.
Hayward, T., BP 2008 strategy presentation, BP Publication, April 2010.
Henriques, A., The triple bottom line does it all add up? Assessing the
sustainability of business and CSR, edited by Henriques A. - Richardson,
J.,Earthscan, 2004.
Hull, J., Options, Futures and other Derivatives. New York: Prentice Hall,
19936, ed. 2012.
Ingersoll, C. -, Locke, R. M., - Reavis C., BP and Deepwater Horizon disaster
of 2010, MIT Sloan Management, 2011.

Page 35
Kenneth, G., Teoria dei mercati finanziari, il Mulino, Bologna, 1994.
Kaufman, R., A Manager’s Pocket Guide to Strategic Thinking and Planning,
Amherst, MA. HRD Press, Inc. 2011.
Levering, R. - Moskowitz, M. – Katz, M., The 100 Best Companies to Work
For in America, Addison - Wesley, Reading, 1984.
Levering, R. - Moskowitz, M., The 100 Best Companies to Work For in
America, Plume, New York, 1993.
Luehrman, T., What’s it worth? A general manager’s guide to valuation,
Harvard business review, vol.75, p. 132-142, 1997.
Manetti, G., Il triple bottom line reporting, Dal coinvolgimento degli
stakeholder alle verifiche esterne, Franco De Angeli, Milano, 2006.
Mazzoleni, P., Una professione innovativa tra finanza e assicurazione:
l'attuario, Vita e Pensiero, 2002.
Morris, W. A., The frankpledge system, Harvard historical studies 14,
Longmans, Green in New York, 1910.
Moskowitz, M., Choosing socially responsible stocks, Business and Society
Review, 1: 71-75, 1972.
Pedol M. - Cabot T., Quantify Sustainability: a new factor inside insurance
pricing, 2015, published by Argo Group International Holding, Ltd.
Plott, C. R. - Zeiler, K., The willingness to pay – willingness to accept gap, the
endowment effect, subject misconceptions, and experimental procedures for
eliciting valuations, 2005.
Robins, F., The challenge of TBL: A responsibility to whom?, Business &
Society Review, 111, 1, 2006.
Scerri, A. - James, P., Accounting for sustainability: Combining qualitative
and quantitative research in developing ‘indicators’ of sustainability,
International Journal of Social Research Methodology 13, 2010.
Schönbucher, P. J., Credit Derivatives Pricing Models, Wiley Finance, 2003.
Sen, A., Development as freedom, Oxford University Press, 1999.
Standard and Poor’s Industry Surveys: Oil & Gas, Production and Marketing,
August, 2010
The Economist, BP After Horton, July 1992.

Page 36
Thomas, P. - Jones, L. A. - Cloherty, J. - Ryan, J., BP’s Dismal Safety Record,
ABC World News, 2010.
Triantis, A. J., Real options and corporate risk management, Journal of
Applied Corporate Finance, 2000.
Trigeorgis, L., Real in Capital Investment. Models, Strategies and
Application, Greenwood Publishing Group. 1995.
Trigeorgis, L., Real Options: Managerial Flexibility and Strategy in Resource
Allocation, MIT Press. 1996.
Uhlaner, C. J., Relational Goods and Participation: Incorporating Sociability
into a Theory of Rational Action, Public Choice, 1989.
Waddok, S., Building a New Institutional Infrastructure for Corporate
Responsibility, The Academy of Management Perspectives, 2008.
Zhou, C. (2009). “Existence and consistency of maximum likelihood estimator
for the extreme value index”. Journal of Multivariate Analysis 100:794–815.
Zhou, C. (2010). “The extent of the maximum likelihood estimator for the
extreme value index”. Journal of Multivariate Analysis 101:971–983.
http://sustainabledevelopment.un.org/content/documents/Agenda21.pdf.
https://www.unglobalcompact.org.
http://europa.eu/legislation_summaries/internal_market/single_market_servic
es/financial_services_transactions_in_securities/mi0009_it.htm
http://pages.stern.nyu.edu/~eelton/working_papers/corp%20bonds/all%20tab
les%20and%20figures%201.pdf
http://www.airdc.org/articles/UNEP/PSI%20Initiative-
UNEP%20Inquiry%20-%20Global%20consultation%20document%20(final)
http://www.boersennotizbuch.de/credit-ratings-uebersicht-der-rating-
agenturen-sp-moodys-fitch.php - Major rating agencies rating guide.
http://www.cia-ica.ca/docs/default-source/standards/sop-complete-january-1-
2014-%28e%29.pdf
http://www.dfld.de/Presse/PMitt/2009/090130e.pdf
http://sero.nmfs.noaa.gov/deepwater_horizon/index.htmlhttp://www.equator-
principles.com/

Page 37
http://www.etimo.it
http://www.freshfields.com/en/global/.
http://www.undp.org/content/undp/en/home/mdgoverview.html
http://www.unepfi.org
http://www.unepfi.org/fileadmin/documents/freshfields_legal_resp_2005112
3.pdf , 2005
http://www.unepfi.org/psi/
http://www.unepfi.org/psi/wp-content/uploads/2012/06/PSI-document.pdf