Embed Size (px)
Citation preview
Asymmetric Exposure to Foreign-Exchange Risk: Financial and Real Option Hedges Implemented by U.S. Multinational Corporations
by
David A. Cartera, Christos Pantzalisb, and Betty J. Simkinsa
a Department of Finance, College of Business Administration, Oklahoma State University, Stillwater, OK 74078-4011, USA
b Department of Finance, College of Business Administration, University of South Florida, Tampa, Florida 33620-5500, USA
Version of 14 February 2003
Abstract
This study investigates the influence of both financial and operational hedges on the foreign-exchange exposure of U.S. multinational corporations. Three important contributions of our research are: (1) we provide evidence that exposure of U.S. MNCs to foreign-exchange risk is asymmetric; (2) our results demonstrate that both operational and financial hedges can effectively reduce foreign-currency exposure; and (3) we find evidence suggesting that operational hedges serve as real options in that exposure varies not only as to whether the firm is a “net importer” or “net exporter” but also across weak and strong dollar states. Prior research assuming symmetric exposure to foreign-exchange risk may be need to be re-evaluated in light of our finding that many MNCs have asymmetric foreign-exchange exposures. JEL Classification: F30, F31, G15 Key words: Multinational finance, Foreign exchange risk, Operational hedges, Real options, Currency derivatives * Please direct all correspondence to: Betty J. Simkins, Department of Finance, College of Business Administration, Oklahoma State University, Stillwater, OK 74078-4011, (405) 744-8625 (office), (405) 744-5180 (fax), email: [email protected].

2
Asymmetric Exposure to Foreign-Exchange Risk: Financial and Real Option Hedges Implemented by U.S. Multinational Corporations
Abstract
This study investigates the influence of both financial and operational hedges on the foreign-exchange exposure of U.S. multinational corporations. Three important contributions of our research are: (1) we provide evidence that exposure of U.S. MNCs to foreign-exchange risk is asymmetric; (2) our results demonstrate that both operational and financial hedges can effectively reduce foreign-currency exposure; and (3) we find evidence suggesting that operational hedges serve as real options in that exposure varies not only as to whether the firm is a “net importer” or “net exporter” but also across weak and strong dollar states. Prior research assuming symmetric exposure to foreign-exchange risk may be need to be re-evaluated in light of our finding that many MNCs have asymmetric foreign-exchange exposures.
I. Introduction
The practice of corporate risk management has changed dramatically over the past two
decades. Originally, risk management was implemented on an uncoordinated basis across
different units of the firm. The primary focus of these ad hoc risk management programs was to
minimize costs. Today, however, risk management of currency exposure has, in many cases,
evolved to take a broader view of the firm that addresses both short-term and long-term
exposures and encompasses financial as well as operational hedges. The ultimate goal of risk
management is to reduce risk while placing the firm in a position to benefit from opportunities
that arise from exchange rate changes.1 Firms actively using real or financial options in risk
management can hedge downside exposure and take advantage of upside exposure. For
example, Davis and Militello (1995) describe how Union Carbide uses a one-year horizon for
financial hedges (e.g., foreign-exchange derivatives), whereas for longer horizons, the company
relies on operational adjustments in sourcing, utilization of different plant locations, and pricing.
1 See Paul-Choudhury, 1996.

3
We study risk management for multinational corporations (MNCs) by investigating the
impact of both financial and operational hedges on MNCs’ exposure to foreign exchange risk.
Changes in exchange rates can influence MNCs’ current and future expected cash flows and
ultimately, stock prices. The direction and the magnitude of changes in the exchange rate on firm
value are a function of the firm’s corporate hedging policy and the structure of its foreign
currency cash flows. The latter depends on the firm’s competitive position in the industries in
which it operates, while the former consists of operational and financial hedges that MNCs
utilize to manage currency exposure.
Beginning with the seminal study by Jorion (1990), initial research in this area focused
on whether corporations are exposed to foreign exchange risk [see Bodnar and Gentry (1993),
Bartov and Bodnar (1994), Bartov, Bodnar, and Kaul (1996), Chow, Lee, and Solt (1997a,b), and
Martin, Madura, and Akhigbe (1999)]. Allayannis and Ofek (2001) and Simkins and Laux
(1996) investigate the effect of financial hedging on foreign-exchange exposure. More recently,
Pantzalis, Simkins, and Laux (2001) examine the ability of operational hedges to reduce
exposure, while Brown’s (2001) investigation focuses on the exchange rate risk management
practices of a single firm. At present, Allayannis, Ihrig, and Weston (2001) is the only study that
examines the combined influence of both financial and operational hedges on foreign exchange
exposure.
We revisit the issue of the effectiveness of MNCs’ corporate hedging policies that
encompass both financial and operational hedging initiatives. More importantly, we extend
recent evidence on the existence of asymmetric exposures to foreign exchange risk (see Miller
and Reuer, 1998, and Andren, 2001). The above-mentioned studies do not provide evidence on
the possible interdependence between exposure asymmetry and hedging, i.e. whether different
4
corporate hedging practices are consistent with certain types of exposure (symmetric versus
asymmetric). 2 Our research fills this gap in the literature by examining the relationship of
financial and operational hedging programs of U.S.-based MNCs and foreign exchange exposure
separately for combinations of (a) firms classified based on their value-association with real
dollar value changes (i.e. “net exporters” and “net importers”), and (b) weak and strong dollar
states.
It is common practice among firms to use a combination of production and marketing
strategies across the firm’s different operating units (operational hedges) to manage long-term
exposure, whereas foreign exchange derivatives (financial hedges) are more often used to
manage short-term exposure. Long-term operating policy adjustments are costly and difficult to
reverse; therefore, they are most effective when the firm possesses a network of multiple
operating units that span many business and geographic areas. The firm’s ability to implement
operational hedges is measured by examining the network structure of its foreign operations (i.e.,
the MNC network).3 The use of financial hedges is analyzed by utilizing information on
currency derivatives usage. We consider usage of different foreign currency derivatives contracts
such as futures, forwards, swaps, options, forward rate agreements, and other derivative contracts
that have a foreign currency as the underlying commodity. We argue that the use of a
combination of operational and financial hedges should more effectively reduce exposure to
foreign exchange risk, because it addresses the firm’s overall exposure both in the short- and
long-term, respectively.
2 In this study, we focus on what we regard as an important potential source of asymmetric exposure (real options hedging). Other possible sources are asymmetric pricing behavior or hysteresis (see Andren, 2001, and Koutmos and Martin, 2003). 3 An MNC’s network has to do with the number of different foreign nations in which operations are conducted, as well as the concentration of operations in various locations.

5
Our study accounts for the fact that the magnitude of a firm’s exposure to foreign-
exchange risk affects its hedging decisions, and in turn hedging decisions affect the firm’s
exposure to changes in currency values. In other words, we recognize that foreign-exchange risk
exposure and hedging are endogenous. Therefore, we model the determinants of foreign
exchange exposure and hedging simultaneously using three stage least squares (3SLS)
regressions.4
Our major findings are as follows: First, we uncover evidence that exposure to foreign-
exchange risk is asymmetric. Second, we find evidence that the use of financial and operating
hedges is associated with a significant reduction in exchange rate exposure. Third, we find
evidence to support the notion that operational hedges can serve as real options in that some
firms are less exposed to downside risk and more exposed to upside risk. In addition, our results
are robust to alternative methods of measuring currency exposure, operating hedges, and
financial hedges.
This paper proceeds as follows: Section II examines prior research on foreign-exchange
exposure and the use of operational and financial hedging to manage exposure. Section III
discusses the methodology, data sources, and sample we use to investigate the determinants of
foreign-exchange exposure by U.S. multinational firms. Section IV reports our empirical results
and Section V concludes.
II. The Use of Financial and Operational Hedging and Foreign Exchange Exposure
Foreign exchange exposure is an important source of risk for multinational corporations
(MNCs). To effectively manage this exposure, MNCs can utilize financial hedges and
4 However, only financial hedging is treated as endogenous in this investigation. Since a firm’s MNC network, our
6
operational strategies to achieve the optimal hedging outcome. This section describes the way
that exposure affects firm value and how financial and operational hedges can be used to manage
the exposure. Furthermore, we explain how operational hedges are not simply the result of
geographic diversification, but can be viewed as real options. The real option aspect of
multinationality allows the firm to utilize its network structure to increase exposure to favorable
currency movements and minimize exposure to unfavorable currency movements. We argue that
the real option benefits of multinationality have a far greater beneficial impact on exposure than
a simple geographic diversification effect.
A. Foreign Exchange Exposure
Foreign exchange exposure is a measure of the sensitivity of the firm’s cash flows to
changes in exchange rate (see Bodnar and Marston, 2000, Marston, 2001, Levi, 1994, among
others). Theoretically, the value of the firm is defined as the present value of its future cash
flows. Since future cash flows are difficult to estimate, most empirical studies measure exposure
by studying how the firm’s stock price responds to exchange rates.
Bodnar and Marston (2000) develop a simple model of foreign exchange exposure for a
monopoly firm producing two products for two different markets. In their model, the profit (Π)
of the firm consists of net revenue earned on selling both domestic and foreign products as
follows:
Π = X D(X) + S X* D* (X*) – C(X + X*) – S C* (X + X*) + Z F(Z) + S Z* F* (Z*) – K(Z + Z*)
– X K* (Z + Z*) (1)
where: X, X* = unit sales of the domestic good at home and abroad, respectively.
Z, Z* = unit sales of the foreign-produced good at home and abroad, respectively.
D(X), D*(X*) = inverse demand functions for P and P*, respectively, where P is proxy for operational hedging, changes fairly slowly over time, it is assumed here to be exogenous.
7
the price in dollars and P* is the price in foreign currency. S = exchange rate (dollar price of foreign currency, $/foreign currency). C, C* = cost functions, denominated in dollars and foreign currency,
respectively, representing the cost of producing the domestic goods (X + X*), and
K, K* = cost functions, denominated in dollars and foreign currency, respectively, representing the cost of producing the foreign goods (Z + Z*).
Exchange rate exposure is measured by differentiating the profit (Π) with respect to the
exchange rate (S), to obtain:5
dΠ/dS={ [dΠ/dX](dX/dS) + [dΠ/dX*](dX*/dS) + [dΠ/dZ](dZ/dS) + [dΠ/dZ*](dZ*/dS) }+
{ X* D* (X*) – C* (X + X*)] + [Z* F* (Z*) – K* (Z + Z*) } (2)
The above equation shows that there are two ways in which the firm’s profits adjust to
changes in the exchange rate. First, the firm’s output changes in response to the change in the
exchange rate as shown in the first set of brackets, {[dΠ/dX](dX/dS) + [dΠ/dX*](dX*/dS) +
[dΠ/dZ](dZ/dS) + [dΠ/dZ*](dZ*/dS)}, and second, the firm’s profits adjust in proportion to the
initial level of net revenues denominated in foreign currency as shown in the second set of
brackets, {X* D* (X*) – C* (X + X*)] + [Z* F* (Z*) – K* (Z + Z*)}. If output is chosen
optimally to maximize profits, the net effect of exchange rates on the firm reduces to: dΠ/dS =
{X* D* (X*) – C* (X + X*)] + [Z* F* (Z*) – K* (Z + Z*) }.6 In other words, for a firm at a
profit-maximizing equilibrium, exposure is equal to the initial level of net revenues denominated
in foreign currency. Bodnar and Marston (2000) show that this net exposure is dependent on
5 For a complete discussion of this model and how it applies under different forms of competition, refer to Bodnar and Marston (2000) and Marston (2001). 6 The four first-order conditions are equal to zero for the firm to be a profit maximizer (i.e. dΠ/dX, dΠ/dX*, dΠ/dZ, and dΠ/dZ* = 0).

8
only three variables: (1) h1, the percentage of the firm’s revenues denominated in foreign
currency, (2) h2, the percentage of the firm’s expenses denominated in foreign currency, and (3)
r, the firm’s profit rate. They define this as the exposure elasticity, δ, and derive the model:
δ = h1 + (h1 + h2) (1/r – 1) (3)
If the MNC produces enough goods abroad so that h1 = h2 , then the exposure elasticity
for the MNC simplifies to: δ = h1. In essence, theoretical exposure for MNCs is the foreign
currency denominated revenue as a percent of total revenue. While this result assumes a
monopoly firm, Marston (2001) shows that this result continues to hold under some forms of
oligopoly. He demonstrates that industry structure has a major impact on exposure.
In practice, while the MNC is not typically at a profit-maximizing equilibrium, the firm
strives to reach that objective. Therefore, exposure is most broadly described by Equation (2).
MNCs can strive to reach optimal operation by using financial and operational hedges effectively
to manage foreign currency cash flows that are exposed to exchange rate movements. For
example, the monopoly firm described above can adjust sourcing of inputs (reflected by the cost
functions C, C*, K, and K* in Equations (1) and (2) above) and outputs (reflected by unit sales
X, X*, Z, and Z* in equations (1) and (2) above) throughout the network structure to achieve
profit maximization.
B. Managing Foreign Exchange Exposure
Financial and operational hedges are two fundamental ways MNCs can manage exposure.
Flood and Lessard (1986) distinguish between two types of exposure: 1) transaction exposure
and 2) operating exposure. Transaction exposure is the effect of unanticipated changes in real
exchange rates on nominal cash flows. This is primarily a short-term exposure that can be
hedged using financial derivatives. In contrast, operating exposure is the effect of unanticipated
9
changes in exchange rates on the cash flows associated with a firm’s real assets and liabilities.
This is primarily a long-term exposure that amounts to the impact of unexpected changes in the
exchange rate on the firm’s competitive position. Logue (1995) and Chowdhry and Howe
(1999) argue that operating exposure cannot be effectively managed using financial hedges.
Instead, they suggest that long-term strategy adjustments (i.e., operational hedges) are the most
effective way of managing long-run operating exposure. As Ruud Roggekamp, Foreign
Exchange Manager at FMC, states: “We realize that [financial] hedging buys us some time, but
from a long-term perspective what we really need to do is make structural adjustments in our
sourcing and production methods.”7
A firm facing future, contractually fixed, foreign-currency cash flows, in which the only
source of uncertainty is the exchange rate (i.e., transaction exposure), can easily hedge with
swaps or forward contracts.8 However, if the future cash flows are uncertain and not perfectly
correlated with the exchange rate (i.e., operating exposure), financial hedging is likely to be
ineffective.
C. Operating Hedges as Real Options
A firm’s operating exposure to currency risk depends on the effect of unexpected changes
in the exchange rate on the firm’s output prices (e.g., product prices) and input costs (e.g., raw
materials, labor costs, etc.). Since the correlation of prices with exchange rates is determined by
the degree of segmentation of their respective markets, operating exposure depends on whether
input costs and output prices are determined locally or globally. Firms facing substantial
operating exposures, as is often the case for U.S. MNCs, can manage this exposure by devising
7 Quote from The Economist Intelligence Unit (1993). 8 In fact, annual surveys conducted by the Wharton School and Chase Manhattan Bank find that many firms use currency derivatives to manage foreign-exchange risk (see Bodnar, Hayt, and Marston, 1998). Surveys of corporate
10
operating strategies that consist of combinations of different marketing initiatives, such as
market selection or pricing strategy, and production initiatives, such as raw materials sourcing
and production location (see Shapiro, 1996, and Capel, 1997). Thus, operational hedges entail
long-term operating policy adjustments that are implemented within a firm’s network of
operating units. Theoretically, the effectiveness of these policies in managing operating
exposures is enhanced when they can be implemented across different lines of business and
locations.9
Obviously, not every firm will be able to manage currency risk exposure with the same
degree of effectiveness. We argue that firms with operations spread over many currency and
business areas are more insulated from foreign exchange exposure, because they have at their
disposal a larger set of alternatives to devise effective operational hedges.
In effect, because of their operational flexibility across geographic regions, MNCs own a
portfolio of real options not available to purely domestic firms. We identify five different real
option strategies available to the MNC, these being the ability to: (1) shift input sources across
borders or between substitute inputs, (2) shift production locations or factors of production, (3)
exploit inter-and intra-country new product growth options, (4) vary the level of pass-through of
exchange-rate and production-cost changes to sales prices (i.e. pricing flexibility), and (5)
treasurers also reflect a trend toward management, not only of transaction exposure, but also translation exposure and economic exposure broadly construed (Jesswein, Kwok, and Folks, 1995). 9 For example, Cummins Engine Company states they have substantially reduced exposure by building manufacturing plants in three major economic regions of the world – the U.S., Europe, and Japan. National Semiconductor says they take into account economic exposure when selecting manufacturing plant locations (see Davis and Militello, 1995). Williamson (2001) discusses how Japanese automotive companies, after being impacted by a depreciating U.S. dollar following the peak in the middle of the 1980’s, significantly altered their exposure to the dollar by establishing production in the U.S.
11
abandon foreign markets.10 The degree of operating flexibility of a MNC is clearly a function of
the structure of its foreign operations’ network.
We postulate that MNCs that have operations in a large number of geographic regions
will be in a better position to effectively construct operational hedges and take advantage of “real
options” than similar-sized MNCs whose operations are concentrated in few geographic regions.
Of course, shifting sourcing, production, or other activities is not optimal if costs exceed the
gains associated with the real option. Triantis (2000) states: “… if exchange rate volatility is
high and if the production plants are expected to have long lives, it will be even more costly to
purchase financial options that replicate the long-lasting competitive advantage of the real
option.” In essence, the real option value of flexibility is worth more when there is more
uncertainty.
C.1. Shifting input sources
If adjustment costs (i.e., the cost to switch between suppliers such as the costs of
negotiation) and lags (i.e., time lag in switching suppliers) are low, managers can expand
purchases of inputs from suppliers in countries with favorable exchange rates and reduce
purchases from other suppliers. Referring back to Equation (1), this real option allows the
MNC to optimize the cost functions C, C*, K, and K* to raise the firm’s expected cash flows and
manage exposure optimally.
Consider the following example. Suppose a U.S. MNC purchases their inputs at home
and pays in U.S. dollars, but has the ability to purchase abroad and incur foreign currency costs.
This firm has the opportunity to switch to the foreign currency strategy as soon as real exchange
10 For a discussion of the MNCs’ operating flexibility see Kogut (1983), Kogut and Kulatilaka (1995), and Buckley and Casson (1998), among others. For empirical evidence regarding the value of operating flexibility see Allen and Pantzalis (1996).

12
rate developments make it profitable. This strategy is comparable to a call option; the firm has
paid a price, the call option premium (i.e., the investment in flexibility), for the opportunity to
pay a fixed exercise price (the adjustment costs) and obtain inputs from the foreign supplier.
Likewise, if the firm currently purchases from a foreign supplier, it basically owns a put option
(i.e. the opportunity to switch to the domestic supplier). In essence, the firm has “switching
options” to select the home or foreign supplier or to select between different foreign suppliers
based on exchange rate movements.
C.2. Shifting production locations or factors of production
An MNC can manage exposure by varying the capacity utilization of different plants and
investing in various measures that facilitate production reallocation between countries. It is
profitable to diversify production when cost fluctuations between countries are not identical and
the incentive to diversify is inversely related to the correlation coefficient between costs
fluctuations (De Meza and Van Der Ploeg, 1987). In essence, this real option is more valuable
when the correlation between marginal costs in the two countries is decreasing, the
standardization of products is high, switching costs are low, and exchange rate uncertainty is
high (Kogut and Kulatilaka, 1994, and Capel, 1997). The ability to substitute is high if the MNC
hires laborers on a temporary basis from employment agencies or has extra capacity in plants to
make it easier to shift production if exchange rate movements justify it. Furthermore, Mello,
Parsons, and Triantis (1995) theorize that the real operating flexibility option of sourcing
production can increase expected cash flows by enabling the MNC to move outward to a new
production possibilities frontier. However, in many industries, the hindrances to shifting
production are substantial either because of non-standardization of products or because of labor
relations.

13
C.3. Exploit inter-and intra-country new product growth options Investment in a foreign subsidiary network generates the real option ability of an MNC to
introduce new products in foreign countries. Firms with a presence in a country would find it
easier to introduce a new product than a firm without a presence in that country. In essence, by
establishing operations in a new country a firm also acquires the option to expand its product line
at a later point in time.
C.4. Pricing flexibility
Flexibility in pricing is a real option that gives the MNC the ability to vary the level of
pass-through of exchange-rates and production-cost changes to sales prices (see Andren, 2001,
Bodnar, Dumas, and Marston, 2002, and Koutmos and Martin, 2003). Full pass-through of
exchange rates occurs when an exporter fixes the domestic currency sales price and allows
foreign currency sales prices to fluctuate with the exchange rate. While this fixes the profit
margin, sales prices and volumes will fluctuate with production costs. Full pricing-to-market of
exchange-rate and cost changes occurs when the MNC fixes the foreign currency sales price and
accommodates cost changes in the profit margin. This protects the level of sales, but the
domestic currency profit margin will vary with the exchange rate and production costs. By
exploiting the ability to choose the level of pass-through, MNCs that primarily export (what we
call “net exporters”) have the ability to exploit beneficial foreign currency appreciations and cost
decreases if demand is elastic, and mitigate adverse foreign currency depreciations and cost
increases if demand is inelastic. Likewise, MNCs that primarily import (what we call “net
importers”) have the ability to exploit beneficial foreign currency depreciations if demand is
14
elastic, and mitigate adverse foreign currency appreciations if demand is inelastic.11 Under these
conditions, exchange rate exposure should be asymmetric. We predict that such MNCs will be
more exposed in beneficial states and less exposed in adverse states.
C.5. Abandoning foreign markets
Another real option of the MNC is the ability to abandon a foreign market when losses
occur to the extent that the viability of the operations is threatened by such factors as low prices
on outputs, high costs of inputs, or lack of competitiveness in the market relative to other
producers. This real option strategy is comparable to a real option. However, abandoning
markets is associated with costs (i.e. re-entry expenses) if the firm hopes to return in the future.
Customer relations can also be hurt making it difficult to regain market share. Furthermore,
Christophe (1997) and Koutmos and Martin (2003) argue that hysteresis can cause firms to
maintain high sunk-cost investments even when market conditions become unfavorable.
D. Operating Hedges as Real Options and Asymmetric Exposure Outcomes
The option value of multinationality is different from that of the benefits of geographic
diversification. The benefits of diversification for an MNC are created by the reduction in
variance of the overall portfolio of subsidiary cash flows. From portfolio theory, we know that if
the returns on assets are imperfectly correlated, the return on a portfolio of assets is less variable
than the summed variability of the returns on the individual assets. Because different exchange
rates are not perfectly correlated, it can be argued that a firm can reduce exposure impact by
diversifying cash flows over different currencies. However, Jacquillat and Solnik (1978) provide
empirical evidence indicating that this simple diversification effect is of minor value to the MNC
11 It should be noted that price adjustment to changes in exchange rates can be predetermined in contracts and trade credit terms can also include payment adjustment in response to exchange rate changes. The use of such adjustment clauses is not unusual (see Oxelheim, Wilborg, and Lim, 1990).

15
because shareholders can achieve it more efficiently through capital markets. Clearly,
shareholders are unable to replicate the benefits of real options on their own.
Real option theory suggests operational flexibility enables the firm to selectively exploit
favorable currency movements to maximize profit potential and minimize the impact of adverse
currency movements and downside risk. Hence, we predict that a successful hedging program
will result in asymmetric exposures by reducing exposures in “bad” states and increasing
exposure in “good” states. If firms do not possess real options for exposure, we would observe
symmetric exposures for both currency appreciations and depreciations.
To examine whether MNC exposures are symmetric (i.e. the MNC network structure
provides a geographic diversification effect) or asymmetric (i.e. the MNC network structure
provides a real options effect), it is necessary to separate time series data into periods of strong
U.S. dollar appreciations and depreciations and estimate exposures for each firm in each period.
Following that, the relation between the aforementioned estimated exposures and the
multinational network structure can be analyzed separately for good states (dollar appreciations
for net importers and dollar depreciations for net exporters) and bad states (dollar depreciations
for net importers and dollar appreciations for net exporters). We investigate these issues in
Section IV.
E. Related Empirical Evidence
Most recent empirical studies in the risk management area have examined financial
hedging by nonfinancial corporations, including MNCs. For instance, Nance, Smith, and
Smithson (1993), Dolde (1995), and Mian (1996) examine the hedging policies of corporations.
Further, Géczy, Minton, and Schrand (1997) investigate the use of currency derivatives by firms.
They find that corporations with extensive exposure to foreign-exchange risk are more likely to

16
use currency derivatives. While these studies focus on the determinants of a firm’s hedging
policies, they do not investigate the effectiveness of the policies.
To date, only a few studies have investigated the effect of financial hedging on foreign-
exchange exposure. Simkins and Laux, 1996, find that Fortune 500 industrial firms which use
currency derivatives and which are more diversified (as measured by the SIC code), are less
exposed to foreign exchange risk. Allayannis and Ofek, 2001, find that firms use derivatives for
hedging and that derivatives usage significantly reduces the exchange-rate exposure of sample
firms. Additionally, Pantzalis, Simkins, and Laux (2001) document the use of operational
hedges by MNCs seeking to reduce exposure and Allayannis, Ihrig, and Weston (2001) examine
the impact of geographical dispersion on exposure. Brown (2001) studies the management of
foreign-exchange risk by focusing on the practices of a single firm.
Our study contributes to the literature by examining the combined effectiveness of
financial and operating hedges as risk management tools while also accounting for the
endogeneity between foreign exchange exposure and hedging decisions.12 Furthermore, our
paper is the first to investigate whether the benefits of operational hedges are due simply to a
diversification effect or to real option benefits of multinationality.
II. Data Sources and Methodology
A. Data Sources and Sample Selection
Data utilized in this study are obtained from a variety of sources. Firm-specific financial
data used in the cross-sectional regressions are obtained from COMPUSTAT for the year 1996,
the mid-point of our study. We collect the 1996 common equity ownership data from
Disclosure. We select MNCs from the cross-section of NYSE-, AMEX- and NASDAQ-listed

17
U.S.-based mining and manufacturing firms (i.e., firms with SICs of 3999 or less). We first
identify all publicly traded U.S. firms from this group that paid some foreign taxes and had
foreign sales of at least 10 million dollars in 1996 from the Compustat database. This screen
resulted in 620 firms. A MNC is defined as a firm that has at least one majority owned foreign
subsidiary. Data on MNCs’ financial hedging practices are obtained from the SWAPS Monitor
database for 1996 and is available for 350 firms. We compute exposure coefficients for the
intersection of these two data sets that also have available CRSP data. This results in 256 firms.
Finally, a sample size of 208 U.S.-based MNCs, is obtained for all MNCs for which complete
financial, ownership, and subsidiary location data are available.
Stock return data are obtained from the University of Chicago’s CRSP database for the
sample period January 1994 to December 1998. We obtain foreign-exchange data from the U.S.
Federal Reserve Board (FRB). Changes in international trading relationships make it necessary
to select exchange rate indexes comprised of currencies that most accurately reflect U.S.
competitiveness in world markets. Newer indexes created by the FRB focus more directly on the
dollar’s movements in foreign exchange markets against a broader set of currencies and are
designed to reflect the changing structure of trade patterns and exchange rates. The FRB updates
currency weights in their indexes annually to most accurately measure the U.S. dollar’s
competitive value. FRB’s nominal Broad Index, which consists of thirty-five currencies of all
foreign countries or regions that had a share of U.S. non-oil imports or nonagricultural exports of
at least 0.5 percent in 1997, is used in our tests. 13
12 For a study that examines the financial and operational hedging decisions of two firms in the gold mining industry, see Petersen and Thiagarajan (2000). 13 Our results are also robust to using the following two indexes published by the FRB: (1) the nominal Major Index, which includes sixteen currencies traded in deep and relatively liquid financial markets and for which short- and long-term interest rates are readily available, and (2) the real Broad Index, which captures the real (price adjusted) exchange rate value of the Broad Index. The Major is a subset of the Broad Index For more information
18
We use information related to the number of subsidiaries and their geographic location,
extracted from Dunn and Bradstreet’s Who Owns Whom, to create measures of a firm’s
multinational network. This source provides a list of each firm’s domestic and foreign affiliates,
and their location.14
B. Measuring Foreign Exchange Exposure
We use a two-step procedure to investigate the effect of derivatives usage and a firm’s
multinational network structure on its exposure to foreign-exchange risk. We first estimate the
effect of exchange rate changes on the stock returns for our sample firms using a two-factor
market model as shown in Equation (4):
itctimtiiit RRR εγβα +++= , (4)
where: Rit is the rate of return on the ith company’s common stock in month t,
Rmt is the return on the market index,
Rct is the return on the exchange rate index, and
εit is the standard error term.
The exchange rate is measured as the price of the U.S. dollar in foreign currency;
therefore, a positive value for Rct indicates a strengthening dollar. For each firm, the estimated
coefficient γi measures the sensitivity of the firm’s stock returns to changes in foreign-exchange
rates, and can be either positive or negative. We use the exposure coefficients estimated in
Equation (4) as the dependent variables in cross-sectional regressions to identify the factors that
on the currency indexes, refer to Appendix 1 and see Leahy (1998) or go to the Federal Reserve Board website at www.federalreserve.gov. 14 We assume that the MNC’s foreign subsidiaries network remains stable over the study period.
19
affect exposure.15
This methodology is standard in other research examining currency exposure (e.g.,
Jorion, 1990, Bodnar and Gentry, 1993, Bartov and Bodnar, 1994, Choi and Prasad, 1995,
Simkins and Laux, 1996, and Bodnar and Wong, 2000). Furthermore, Griffin and Stulz (2001)
recommend this approach due to the complexity of the effects on firm value of exchange rate
shocks.
The equally weighted CRSP market portfolio return (EWR) is used as the measure of the
market return (Rmt) in the estimation of Equation (4), as recommended by Bodnar and Wong
(2000).16 Bodnar and Wong point out that the value-weighted CRSP market portfolio return
(VWR) can distort the sign and size of the resulting exposures because of an inherent relation
between market capitalization and exposure. They state that exposure studies using the VWR
control not only remove the “macroeconomic” effects from the exposure estimates, but also
cause a distribution shift in the positive direction for exposure estimates. They show that
replacing the VWR with the EWR in Equation (4) results in residual exposures that are more
consistent with the actual cash flow impact of exchange rate changes predicted by corporate
finance models. For this reason, Bodnar and Wong recommend using the EWR control to
correct for the potential bias of the VWR control and to achieve less distortion in the residual
exposures.
We estimate the stock-price sensitivity to changes in exchange rates for our sample firms
15 Jorion (1990) notes that two-step estimation procedures of this type can possibly produce biased standard errors in the second-stage regression. This occurs if errors in (4) are correlated across stocks and exposure coefficients estimated over the same sample period, yielding estimated exposure coefficients that are not independent across equations. However, Jorion reports that most of the correlation is due to stock market movements, and is purged by the inclusion of the market return in Equation (4). 16 We use two different measures of the market return (Rmt) for the estimation of Equation (4): the value-weighted CRSP market portfolio return (VWR) and the equally weighted CRSP market portfolio return (EWR). Our results are similar using both indexes. For brevity, we only report results using the EWR.
20
for the period 1994-98. This sample period is chosen for two reasons. First, we know which
firms actively use currency derivatives over this period based on reporting disclosures and limit
our study to a period where hedging practices are most likely to be consistent. Second, prior
studies by Bartov, Bodnar, and Kaul (1996) and Chow, Lee, and Solt (1997a) find that a firm’s
exposure changes over longer time frames. Among other factors, this is likely due to changes in
a firm’s MNC network. To avoid time-varying exposure coefficients, we limit our study to a
five-year period.
C. Testing for Asymmetric Exchange Rate Exposure and the Effect of Real Options
Most previous research studies in the area of foreign exchange exposure and risk
management have assumed that the impact of positive and negative changes in the value of the
dollar on the firms’ values is symmetric, i.e. that exposures to dollar appreciations and
depreciations are similar. However, we argue that if firms use operational hedging techniques
that resemble real options in that they seek to provide both downside protection as well as the
ability to exploit upside exposures, the exposure to exchange rate changes will be asymmetric.
Recent studies such as Miller and Reuer (1998) and Andren (2001) provide evidence of
asymmetric exposures to exchange rate changes.
Our study examines whether U.S. MNCs are asymmetrically exposed to extreme changes
in value of the dollar. We classify firms as “net importers” (positive exposure coefficient) or
“net exporters” (negative exposure coefficient) based on the sign of the coefficient γ from the
weekly returns regression model (Equation 4). We then identify the top and bottom quarters in
our 5-year study period in terms of changes in the value of the dollar. We re-estimate Equation
(4) using weekly observations within the top and bottom quarters to obtain the exposures to
“strong dollar” and “weak dollar” states, respectively. We follow Miller and Reuer (1998) to

21
examine different patterns of exposure to extreme strengthening and weakening dollar states,
separately for “net importers” and “net exporters”. Firms with asymmetric exposures resulting
from real options hedge programs would enjoy both downside risk protection and the flexibility
of exploiting favorable outcomes. For example, “net importers” that hedge via real options
should display low exposure to weakening dollar states (i.e. unfavorable states) and positive
exposure to strengthening dollar states (i.e. favorable states). Once the distribution of firms
across the possible exposure patterns has been analyzed, we compare the characteristics of the
MNC network across groups of firms exhibiting different exposure patterns. We identify
whether the operational hedges as captured by the MNC network are providing a real option
hedge corresponding to an asymmetric exposure or a portfolio hedge corresponding to a
symmetric exposure.
D. Determinants of Foreign Exchange Exposure
We hypothesize that both financial and operational hedges can be effective in reducing
foreign exchange exposure. To test this hypothesis, we analyze exposure to changes in the
exchange rate separately during strong dollar and weak dollar states by the following cross-
sectional regression :
iiiiiJ
i FSALERMNCDERSIZE ζδδδδδγ +++++= 43210 , (5)
where: J is an indicator of the dollar state, i.e. J can be either “strong dollar” or “weak dollar”,
γi,J is the absolute value of the ith firm’s foreign exchange exposure coefficient,
SIZEi is the natural logarithm of a firm’s end of year market value,

22
DERi is the total notional value of currency derivatives divided by foreign sales,17
MNCi is a measure of a firm’s multinational network (i.e. operational hedging),
FSALERi is the foreign sale ratio, and
εi is the standard error term.
The exposure coefficient, γI,J, is estimated from Equation (4) using observations of
dollar changes in dollar state J. We then compare the coefficients from the weak dollar and
strong dollar states regression model in order to detect whether the impact of hedges on
exposures is symmetric or asymmetric. This comparison is performed separately for firms
previously classified as “net importers” and “net exporters”. The prediction of the real options
hedge hypothesis is that firms’ hedging activities would reduce exposure in adverse states and
increase exposure in beneficial states. If, on the other hand, the MNC network provides a linear
hedge across all states, then the portfolio hedge hypothesis predicts that exposure would be
negatively related to the breadth of the network. In order to make the results easier to compare
across the models estimated for firms with negative and positive overall exposures (i.e. for “net
exporters” and “net importers”, respectively), we use the absolute value of the estimated exposure
coefficient as the left-hand side variable.
The estimation of Equation (5) is conducted using weighted least squares in which we
weight our independent variables by the reciprocal of the squared standard error of the exposure
coefficient from estimating Equation (4) in strong and weak dollar states, respectively. This
procedure gives more weight to the exposure coefficients that are estimated more precisely.
The ability to effectively design and implement operational hedges to reduce operating
exposures is expected to be a function of a MNC’s operating flexibility. As shown by Pantzalis,
Simkins, and Laux (2001), MNCs with greater breadth of operations are better equipped to
17 Wong (2000) finds notional values useful by investors in assessing a firm’s currency exposure.

23
effectively manage their foreign-exchange exposure. Alternatively, MNCs with networks that
are concentrated in a few countries and/or regions should be less capable of effectively reducing
their currency exposures. In our analysis, we use four measures to describe the MNC network of
foreign operations (i.e., the breadth and depth dimensions of the network).18 Our four measures
are: (1) the number of foreign countries in which the MNC has a subsidiary (NFC); (2) number
of foreign regions in which the MNC operates (NFR)19; (3) a Herfindahl index (HERF1)
measuring the concentration of an MNC network’s foreign subsidiaries across different
countries; and (4) a Herfindahl index (HERF2) measuring the concentration of an MNC
network’s foreign countries across different geographic regions. HERF1 and HERF2 are
calculated as follows:
[ ]22
)(
)(1
∑∑=
i i
i i
NFS
NFSHERF and (6a)
[ ]22
)(
)(2
∑∑
=j j
j j
NFC
NFCHERF , (6b)
where: NFSi is the number of foreign subsidiaries in country i and
NFCj is the number of foreign countries in geographic region j.
A higher value for either index, HERF1 or HERF2, indicates a more highly concentrated
network structure and is hypothesized to be associated with increased foreign exchange
18 Breadth describes dispersion of a firm’s operations and is measured by the number of foreign nations in which the MNC has subsidiaries. Depth measures the geographic concentration of an MNC’s foreign subsidiaries. Allen and Pantzalis (1996), Doukas, Pantzalis and Kim (1999), and Pantzalis, Simkins, and Laux (2001) demonstrate the importance of breadth and depth measures in describing a MNC’s network. 19 The foreign subsidiaries were assigned to the following nine major geographic regions, depending on the location of each subsidiary’s host country. The nine different regions are constructed as follows: East Asia, Other Asia, European Union, Other Western Europe, Eastern Europe, NAFTA (U.S. subsidiaries of our sample MNCs are not counted as foreign subsidiaries), Central America and Caribbean, South America, and Africa.
24
exposure.20 A more geographically dispersed operational network (i.e. lower HERF1 or HERF2
index value) is a proxy for high levels of effective operational hedges and, thus, it is
hypothesized to be associated with lower foreign exchange exposure.
Firm size is included to control for any sized-based differences in riskiness, operational
activities, or expertise. The firm’s foreign sales ratio, FSALER, is included to control for the
influence of foreign sales on exposure coefficients (see Allayannis and Ofek, 2001).
We implicitly assume that the derivative use and MNC network variables proxy for the
firm’s financial and operational hedging efforts, respectively. In our estimation of Equation (5),
we test three null hypotheses related to derivatives usage and multinational network. These
hypotheses are:
Hypothesis 1 [H1]: A firm’s use of financial hedges (derivatives) does not affect its exposure to
foreign-exchange risk,
Hypothesis 2 [H2]: A firm’s use of operational hedges (as reflected in the MNC network
structure) does not affect its exposure to foreign-exchange risk, and
Hypothesis 3 [H3]: A firm’s operational and financial hedges have the same effect on exposure
in states of strong and weak dollar.
Rejection of H1 suggests that a firm’s derivatives activities affect its exposure to changes
in foreign-exchange rates. In particular, we expect a negative result indicating that the use of
derivatives reduces exposure to foreign-exchange risk. Further, rejection of H2 implies that a
MNC’s network is an important factor in its exposure to exchange rate risk, consistent with the
notion that it captures a firm’s ability to implement operational hedges. We argue that the MNCs
20 For example, assume a MNC has three subsidiaries located in three different countries, HERF1 would be 0.333 [i.e. (12 + 12 + 12)/ 32) = 0.333]. If all three subsidiaries are located in the same country, HERF1 is 1.0 [i.e. 32/32 = 1.0]. HERF2 is calculated similarly. Note that the highest possible value for HERF1 or HERF2 is 1.0, indicating complete concentration in a single country or region.

25
with operations located in a large number of countries or regions (i.e., MNCs with large breadth
of foreign operations) will have less exposure to foreign-exchange risk. 21 Finally, rejection of
H3 would indicate that the financial and operational hedges do not result in symmetric
exposures, i.e. in a reduction of risk across all possible states of the world as in the case of
diversification. Table 1 provides a summary of the variables used in this study as well as the
expected relationships between these variables and the absolute value of the estimated foreign-
exchange coefficient.
[Insert Table 1 about here.]
Financial risk management decisions and the level of foreign exchange exposure, γi, are
arguably endogenous. On one hand, the magnitude of γi is a function of the firm’s hedging
policies. On the other hand, γi affects the intensity of the firm’s risk management efforts.
Thus, the level of γi and corporate hedging decisions are determined simultaneously. To
control for endogeneity, in the sense that the use of derivatives is a function of MNC network and
exposure, we estimate a system of equations using three-stage least squares (3SLS). The analysis is
performed separately for strong and weak dollar states and for “net exporters” and “net importers”,
respectively. This is done in order to investigate whether the relationship between hedging and
exposure changes consistent with the real options hedging strategy, or whether it implies that
hedging is implemented so as to reduce risk across all states of nature, consistent with the portfolio
diversification analogy. The exposure model is based on Equation (5), but expanded using the
methodology of He and Ng (1998) through the use of an indicator variable D, which takes the value
of 0 when γ is positive and 1 when γ is negative. This is done to capture the differential impact of
21 A firm’s multinational network generally changes slowly over time. For this reason, we treat MNC network as exogenous.
26
the explanatory variables on both firms with positive exposures and those with negative exposures.
Thus, the following system of equations is estimated:
iiiD
iiDiiDiiDiD
iiiiiiiixii
FSALERDMNCDDERDSIZEDD
FSALERDMNCDDERDSIZEDD
ζδδδδδδδδδδγ
+−+−+−+−+−+
++++=
*)1(*)1(*)1(*)1()1(
****
4
3210
43210
(7a)
and corporate hedging decision (i.e., currency derivatives usage):
iiiiiii QRFSALERMNCSIZEDER ωγλλλλλλ ++++++= 543210 (7b)
where: DERi is the total notional value of currency derivatives divided by foreign sales,
SIZEi is the natural logarithm of a firms’ market value,
MNCi is a measure of a firm’s multinational network (i.e. operational hedging),
QRi is the quick ratio for firm i,
FSALEPi is total foreign sales as a percent of total sales for firm i,
γi is the exposure coefficient estimated in Equation (1), and
ωi and ζi are standard error terms.
The independent variables included in Equation (7b) are consistent with those from prior
studies of derivatives usage and hedging behavior. For example, we include size as a proxy for the
firm’s expertise in devising hedges [see Nance, Smith, and Smithson (1993), Mian (1996), and
Géczy, Minton, and Schrand (1997), among others]. The quick ratio, QRi, is included to control for
the fact that firms hedge to reduce the costs of financial distress [see Géczy, Minton, and Schrand
(1997) and Froot, Scharfstein, and Stein (1993)]. The level of foreign sales (TFSALEPi) is added
because the demand for hedging increases with foreign sales [see Géczy, Minton, and Schrand
(1997) and Pantzalis, Simkins, and Laux, (2001)].
27
IV. Empirical Results
A. Estimation of Foreign-Exchange Exposure
The exchange rate exposure of the sample firms is estimated from Equation (4) using
weekly data over a 5-year period for the stock return, the equally-weighted market index (as
recommended by Bodnar and Wong (2000)), and the FRB nominal exchange rate index. The
descriptive statistics for the resulting exposure coefficient, γi, , are shown in Table 2. The mean
value of γi, is –0.0486 indicating that on average, a one percent increase in the dollar’s value
results in a 0.049 percent decline in MNC stock prices. Alternatively, this indicates that the
average U.S. MNC in our sample behaves like a firm that benefits from dollar devaluations. This
is consistent with the macroeconomic evidence for the United States that indicates average firm
profits in the U.S. rising during weak dollar periods. The number of firms with negative
exposures is 119, or about 57% of the sample. Overall, there are 22 firms with significant
exposure (i.e., 10.58 % of the total sample) at the 5 percent level, out of which 15 are negative
and 7 positive. Thus, when estimating exposures over the whole 5-year period, significance is
detected in a relatively small number of firms, as is the case in prior studies.
Table 2 also includes descriptive statistics for the exposure coefficients during strong and
weak dollar states. The mean exposure during strong (weak) dollar periods is 0.0054 (-0.0744),
while there is roughly an equal number of positive and negative exposures during the two
extreme dollar value periods. The number of significant exposure coefficients from the
estimation conducted in the strong and weak dollar subperiods is dramatically higher: there are
65 firms with significant exposures at the five percent level during strong dollar periods, while
there are 79 such cases during weak dollar periods. The number of firms with significant positive
exposures at the 5 percent level is higher than the number of firms with significant negative
28
exposures in the case of strong dollar states (38 positive vs. 27 negative). The opposite is true in
the weak dollar states (51 negative exposures vs. 28 positive). This is a first indication that
exposures may be asymmetric.
[Insert Table 2 about here]
Table 3 provides summary statistics for all explanatory variables used in the regression
analysis, including four alternative measures of the MNC foreign operations network structure.
These measures are used as proxies of the MNC’s ability to devise operational hedges. We
argue that MNCs with networks of operations that span many different countries and/or regions
will be in a better position to adjust operations to effectively hedge their operating exposure. We
use the variables NFC, NFR, HERF1, and HERF2, discussed in the previous section, to describe
the dispersion/concentration of MNCs’ foreign network. Note that higher values for NFC and
NFR denote a more dispersed network. On the other hand, high values of the two alternative
Herfindahl indices indicate a greater degree of concentration of a firm’s operations in a particular
country (HERF1) or region (HERF2). There are wide variations in the number of countries
(NFC), number of regions (NFR), and the two Herfindahl ratios across sample firms. The
average MNC in our sample operates in approximately thirteen foreign countries and four
different geographic regions. The minimum and maximum number of foreign countries (foreign
regions) are 1 and 47 countries (1 and 9 regions), respectively. The average Herfindahl index
ranges from 0.237 (HERF1) to 0.448 (HERF2).
[Insert Table 3 about here]
B. Descriptive Comparisons of Sample Firms’ Exposures
In this section we explore how many of the firms in our sample are symmetrically or
29
asymmetrically exposed to strong and weak dollar states by examining patterns of exposures to
large dollar appreciations and depreciations, respectively. In addition, we examine whether
foreign operations network structures vary significantly between groups of firms classified based
on their patterns of exposure combinations. That helps us shed more light on the important issue
of the type of risk protection firms obtain from operational hedges, and on the type of
multinational network structure that best facilitates a specific type of hedge. On one hand,
operational hedges may provide firms with protection from foreign-exchange risk consistent with
a diversification effect, whereas the firm would obtain an across the board risk reduction, in both
bad and good states. On the other hand, the MNC network could allow the firm to set real option
hedges whereas the firm is protected (i.e., not exposed) during bad states and left unprotected in
the good states (i.e. left exposed to beneficial currency value changes). Moreover, the MNC
network structure of firms that are exposed consistent with a diversification hedge (i.e. firms
with symmetric exposures) may be different than that of firms exposed in a manner consistent
with a real options hedge (i.e. firms with asymmetric exposures).
We follow the framework of Miller and Reuer (1998) and recognize nine possible
combinations of exposures, as shown in the three-by-three matrix in Panel A of Table 4. The
three columns include cases where exposure to strengthening dollar states is negative, zero or
positive. Similarly, the three rows indicate cases where exposure to weakening dollar states is
negative, zero, or positive. Cells I and IX of the exposure matrix indicate cases of symmetric
exposure. Cell V includes firms that are not significantly exposed to either strengthening or
weakening dollar states. The upper right corner cells (i.e., cells II, III and VI) are cases where
exposure is consistent with an optimal hedging strategy. In particular, exposure combinations are
either zero in one state and beneficial in another (cells II and VI), or beneficial in both the strong

30
and the weak dollar states (cell III). Moreover, firms in cells II and VI display exposures
consistent with a real options hedge. “Net importers” (“net exporters”) in cell II (VI) have both
downside risk protection when the dollar weakens (strengthens) and their exposure has a
beneficial effect on their stock price when the dollar strengthens (weakens). At the lower left
corner of the matrix are the three cells (IV, VII and VIII) where exposure is resulting in adverse
effects on the value of the firm.
[Insert Table 4 about here]
We examine the patterns of the distribution across the nine cells of the exposure matrix
separately for “net importers” (Panel B-1) and “net exporters” (Panel C-1). We find that about
half the firms in each of the two groups of firms are not significantly exposed to either strong or
to weak dollar states (38 out of 89 “net importers” and 58 out of 119 “net exporters”). We also
observe that 23 out of 89 “net importers” and 29 out of 119 “net exporters” are classified in cells
VI and II. Thus about a quarter of our sample’s firms have asymmetric exposures consistent with
real options hedges. Moreover if we add the numbers of firms in cells II, III and VI, which are
firms beneficially exposed, or well hedged, we see that they constitute about one third of the total
sample. There are four “net importers” and ten “net exporters” with symmetric exposures (cells
IX and I). Firms that display combinations of exposures consistent with being adversely exposed,
or poorly hedged (see cells IV, VII and VIII), make up a quarter and a tenth of the “net importer”
and the “net exporter” samples, respectively. Overall, the distribution of firms in the exposure
matrix indicates that a substantial number of firms are displaying exposure combinations
consistent with real options hedges. The number of such firms is also four to six times larger than
that of firms with symmetric exposure patterns, indicating that there are many more MNCs
whose exposures are consistent with real options hedges.

31
Next, we examine whether there are differences in the mean values of the MNC network
structure variables among the groups of firms that are utilizing real option hedges or optimal
hedges, and those groups that display no exposure, symmetric exposure, or those that are poorly
hedged. This is done in Panel B-2 for “net importers” and in Panel C-2 for “net exporters”. The
results show that the “net importers” that implement real hedges or are optimally hedged have
MNC networks that are spread out over a larger number of foreign regions and foreign countries,
than the network of firms that are symmetrically exposed and the firms that are poorly hedged. In
addition, the concentration of the foreign operations network (as captured by the two Herfindahl
indexes HERF1 and HERF2) is significantly lower in the case of firms that are asymmetrically
hedged or well hedged. This is consistent with the notion that foreign networks with extensive
“breadth” allow the firms to implement real options hedging programs that result in
asymmetric/beneficial exposures. However, this evidence is not apparent in the case of “net
exporters” where most of the mean differences are insignificant.
C. Regression Results
Table 5 provides evidence on the effectiveness of financial and operational hedges during
adverse and beneficial exchange rate states. The analysis is conducted separately for “net
importers” (Panel A) and “net exporters” (Panel B). We estimate the model in equation (2) for
strong dollar exposures and weak dollar exposures using seemingly unrelated regressions with
robust standard errors (White, 1980) to control for heteroscedasticity. Also reported are the level
of significance (if any) from the difference in coefficients test between the strong dollar and the
weak dollar regressions. The prediction of the “diversification” hedge is an across the board
reduction in risk. In other words, we would expect a negative coefficient in both the adverse and
32
the beneficial states and no significant difference in the coefficients of the derivatives and the
MNC network variables between the adverse and beneficial states’ regressions. The real option
hedge would imply a significantly more negative coefficient for adverse state regressions than in
the case of beneficial states regressions.22 The results in Table 5 are consistent with a real options
hedge for “net importers” and with a diversification hedge for “net exporters”. Both the
derivatives and the operational hedges result in a significant reduction of exposure in weak dollar
(adverse) states for the “net importers”. In addition, there is no significant effect on exposure
during strong dollar (beneficial) states. The difference in coefficients between weak and strong
dollar regressions is significant for the MNC network variables, consistent with the notion that
there is a real options nature to the operational hedges implemented by “net importers”. On the
“net exporters” side, there are no instances of significance in the hedging variables’ coefficients,
except for the number of foreign regions (NFR). Thus, for “net importers” the evidence is
consistent with a symmetric effect of hedging on exposure across weak and strong dollar states
as would be the case in a “diversification” sense.
[Insert Table 5 about here]
Results of our 3SLS regression analysis for different variants of the simultaneous
equations system (7a) and (7b) are presented in Table 6. As shown previously in Table 2, 119 of
the estimated exposure coefficients (γi) are negative, while just 89 are positive. It therefore
makes sense to determine whether the relationships between exposure and our independent
variables are the same for both the positive and negative exposure firms. Following He and Ng
(1998), we use a dummy variable (D) to separately examine the determinants of positive (D=1)
and negative (D=0) exchange rate exposures. Thus, in Table 6, the estimated coefficients for
22 The predicted sign of the Herfindahl indexes, HERF1 and HERF2, is opposite, since larger values of these variables indicate less geographically diversified network structures.

33
positively exposed firms are indicated by the product of D and each independent variable, while
the estimates for negatively exposed firms are indicated by the product of (1-D) and each
independent variable. We report the estimated coefficients and corresponding standard errors for
four regressions, each using a different measure of the MNC network structure. Thus, columns 1
through 4 present findings for the models using operational hedging measures NFC, NFR,
HERF1, and HERF2 respectively. The dependent variable is the absolute value of the foreign-
exchange coefficient estimated from Equation (4) applied separately to weekly exchange rate
index changes during strong and weak dollar states. Thus, in Panel A of Table 6 are the results
for the regressions using the absolute exposure coefficient in the strong dollar states as left-hand
side variable. The dependent variable in the corresponding regressions in Panel B is the absolute
exposure coefficient obtained from Equation (4) estimated during the weak dollar states.
Overall, the estimated models have strong explanatory power with pseudo-R-squared
values in the range of around 57 to 66 percent. In addition, the χ2-statistics indicate that all
models are significant at better than the one-percent level. The results for the strong dollar states
regressions indicate that derivatives (DER) reduce exposure of “net exporters”, consistent with
the notion that financial hedging reduces exposure in adverse states for “net exporters”. Further,
the negative coefficient estimates of DER provide strong evidence that firms are using currency
derivatives to reduce their exposure to foreign-exchange risk. There is no relationship between
exposure and MNC network for either “net exporters” or “net importers” in strong dollar states.
The weak dollar states regressions results (Panel B) indicate that both the financial and the
operational hedges reduce exposures of “net importers”, while generally they are insignificant
for the “net exporters”. The MNC network variables are proxies of the firm’s ability to construct
operational hedges. For positively exposed firms (“net importers”), the estimates for NFC
34
(number of foreign countries) and NFR (number of foreign regions) are negative and significant,
implying that foreign exchange exposure is less for firms operating in a greater number of
countries or regions. In addition, HERF1 and HERF2 (which are variables that measure the
degree of concentration of the MNCs’ foreign operations network) are positive and significant,
suggesting that firms with operations highly concentrated in a few countries or regions have
greater exposure to foreign-exchange risk.
The results in Table 6 are consistent with the evidence from the previous tables; i.e.,
operational hedging ability, reflected in MNCs’ network structure, seems to provide a real
options-type hedge against foreign-exchange risk for “net importers”. In particular, in the case of
“net importers” we find that spread-out foreign operations networks reduce exposure to
unfavorable currency movements only. Finally, foreign sales ratios (FSALER) are positively
related to exposure for both “net exporters” and “net importers”, while lager “net exporters” are
found to be less exposed during weak dollar states.
[Insert Table 6 about here]
Overall, the results support a rejection of the null hypotheses that a firm’s derivatives use
and multinational network do not affect its exposure to foreign-exchange risk (Hypotheses H1
and H2). However these effects are not found to be similar across net exporters and net importers
in strong and weak dollar states. Instead, for the positively exposed firms (“net importers) in our
sample, the results suggest that firms with foreign operations networks dispersed across many
different countries or regions are less exposed to unfavorable dollar value movements. This
finding, which supports a rejection of hypothesis H3 for “net importers”, is consistent with the
notion that “net importer” firms whose operations span a large number of geographic/currency
areas can implement operational hedges that resemble real options hedges. These firms adjust

35
their operating policies so as to offset exposures in different currencies when the dollar value
increases (adverse states), but, at the same time, they are left exposed to beneficial currency
value movements. Interestingly, this is not the case for the negatively exposed firms (“net
exporters”).
VII. Conclusion
This study investigates the influence of both financial and operating hedges on the
foreign-exchange exposure of U.S. multinational corporations. We build on previous studies of
currency exposure to more fully understand how corporate risk management practices can reduce
exposure to exchange-rate risk by managing risk across the firm. The three important
contributions of our research are as follows: (1) we provide evidence that exposure of U.S.
MNCs to foreign-exchange risk is asymmetric. In particular, we find that only a minority of our
sample firms is exposed to both strong and weak dollar states in a similar fashion (i.e. are
symmetrically exposed), while a substantial amount of firms displays exposures similar to those
resulting from real options hedges. (2) After accounting for the endogeneity between exposure
and hedging by using a simultaneous equations model, we present evidence demonstrating that
operational hedges and financial hedges can effectively reduce foreign currency exposure. The
ability to construct operational hedges, reflected in the MNC network structure, and the usage of
various currency derivatives are significant determinants of currency exposure. (3) We find
evidence suggesting that the effectiveness of the operational hedges vary across the “net
importers” and the “net exporters” in our sample, and also, across weak and strong dollar states.
Operational hedges, reflected in the MNC network structure, result in providing “downside” risk
protection while allowing firms to enjoy favorable dollar movements for “net importers” only.

36
Finally, our results suggest that specifications of symmetric regression models of foreign
exchange exposure found in prior research may be inappropriate and that, in light of the large
number of firms with asymmetric exposures, much of the evidence in prior studies has to be re-
evaluated.

37
References
Andren, Niclas, 2001, Essays on Corporate Exposure to Macroeconomic Risk, Lund Business Press (Lund, Sweden).
Allen, Linda and Christos Pantzalis, 1996, Valuation of the operating flexibility of multinational
corporations. Journal of International Business Studies 27: 633-653. Allayannis, George, Jane Ihrig, and James Weston, 2001, Exchange-rate hedging: Financial vs.
operational strategies, American Economic Review Papers & Proceedings 91 (2): 391-395. Allayannis, George and Eli Ofek, 2001, Exchange rate exposure, hedging, and the use of foreign
currency derivatives, Journal of International Money and Finance 20: 273-296. Bartov, Eli and Gordon M. Bodnar, 1994, Firm valuation, earnings expectations, and the
exchange rate exposure effect, The Journal of Finance 44: 1755-1785. Bartov, E., G.M. Bodnar, and A. Kaul, 1996, Exchange rate variability and the riskiness of U.S.
multinational firms: Evidence from the breakdown of the Bretton Woods system, Journal of Financial Economics 42: 105-132.
Bodnar, Gordon M., Bernard Dumas, and Richard C. Marston, 2002, Pass-through and exposure,
The Journal of Finance 57 (1): 199-231. Bodnar, Gordon M. and W.M. Gentry, 1993, Exchange rate exposure and industry
characteristics: Evidence from Canada, Japan and U.S., Journal of International Money and Finance 12: 29-45.
Bodnar, Gordon M. and Richard C. Marston, 2000, A simple model of foreign exchange
exposure, Weiss Center for International Financial Research working paper #00-3, University of Pennsylvania.
Bodnar, Gordon M. and M.H. Franco Wong, 2000, Estimating exchange rate exposures: Issues
in model structure, forthcoming in Financial Management. Bodnar, Gordon M., Gregory S. Hayt, and Richard C. Marston, 1998, 1998 Wharton survey of
financial risk management by U.S.non-financial firms, Financial Management 27: 70-91. Brown, Gregory W., 2001, Managing foreign exchange risk with derivatives, Journal of
Financial Economics 60: 401-448. Buckley, Peter J. and Mark C. Casson, 1998, Models of the multinational enterprise, Journal of
International Business Studies 29: 21-44. Capel, Jeannette, 1997, A real options approach to economic exposure management, Journal of
International Financial Management and Accounting 8 (2): 87-113.
38
Christophe, Stephen E., 1997, Hysteresis and the value of the U.S. multinational corporation,
Journal of Business 70: 435-462. Choi, Jongmoo J. and Anita M. Prasad, 1995, Exchange risk sensitivity and its determinants: A
firm and industry analysis of U.S. multinationals, Financial Management 24: 77-88. Chow, Edward H., Wayne Y. Lee, and Michael E. Solt, 1997a, The economic exposure of U.S.
multinational firms, The Journal of Financial Research 20: 191-210. Chow, Edward H., Wayne Y. Lee, and Michael E. Solt, 1997b, The exchange-rate risk exposure
of asset returns, Journal of Business 70: 105-123. Chowdhry, Bhagwan and Jonathan Howe, 1999, Corporate risk management for multinational
corporations: Financial and operating hedging policies, European Financial Review 2: 229-246.
Christophe, Steve E., 1997, Hysteresis and the value of the U.S. multinational corporation,
Journal of Business 70: 435-462. Davis, Henry A. and Frederick C. Militello, Jr., 1995, Foreign Exchange Risk Management: A
Survey of Corporate Practices, Financial Executives Research Foundation, Morristown, New Jersey.
De Meza, David and Frederick van der Ploeg, 1987, Production flexibility as a motive for
multinationality, Journal of Industrial Economics 35 (3): 343-351. Dolde, Walter, 1995, Hedging, leverage, and primitive risk, The Journal of Financial
Engineering 4: 187-216. Doukas, John, Patricia H. Hall and Larry H.P. Lang, 1999, The pricing of currency risk in Japan,
Journal of Banking and Finance 23: 1-20. Doukas, John, Christos Pantzalis, and Sungsoo Kim, 1999, Intangible assets and the network
structure of MNCs, Journal of International Financial Management and Accounting 10: 1-23.
The Economist Intelligence Unit, 1993, Strategic Financial Risk Management, Research Report. Flood, Eugene and Donald R. Lessard, 1986, On the measurement of operating exposure to
exchange rates: A conceptual approach, Financial Management 15: 25-36. Froot, Kenneth, David Scarfstein, and Jeremy Stein, 1993, Risk management: Coordinating
corporate investment and financing policies, Journal of Finance 48: 1629-1658.

39
Géczy, Christopher, Bernadette A. Minton, and Catherine Schrand, 1997, Why firms use currency derivatives, The Journal of Finance 52: 1323-1354.
Griffin, John M. and René M. Stulz, 2001, International competition and exchange rate shocks:
A cross-country industry analysis of stock returns, Review of Financial Studies 14 (No. 1, Spring): 215-241.
He, Jia and Lilian K. Ng, 1998, The foreign exchange exposure of Japanese multinational
corporations, Journal of Finance 53: 733-753. Jacquillat, Bertrand and Bruno H. Solnik, 1978, Multinationals are poor tools for diversification,
Journal of Portfolio Management (Winter): 8-12. Jesswein, Kurt, Chuck C.Y. Kwok and William R. Folks, Jr., 1995, What new currency risk
products are companies using and why?, Journal of Applied Corporate Finance 8: 103-114. Jorion, Philippe, 1990, The exchange rate exposure of U.S. multinationals, Journal of Business
63: 331-45. Kogut, Bruce, 1983, Foreign direct investment as a sequential process, in C.P.Kindleberger and
D. Audresch, editors, The Multinational Corporation in the 1980’s, Cambridge, Mass.: MIT Press.
Kogut, Bruce, and Nalin Kulatilaka, 1995, Operating flexibility, global manufacturing, and the
option value of a multinational network, Management Science 40: 123-39. Koutmos, Gregory and Anna D. Martin, 2003, Asymmetric exchange rate exposure: Theory and
evidence, forthcoming in Journal of International Money and Finance. La Porta, R., F. Lopez-de-Silanes, A. Schleifer, and R. W. Vishny, 1997, Legal determinants of
external finance, Journal of Finance, 52: 1131-1150. Leahy, Michael P., 1998, New summary measures of the foreign exchange value of the dollar,
Federal Reserve Bulletin, October, 811-818. Levi, Maurice D., 1994, Exchange rates and the valuation of firms, Exchange Rates & Corporate
Performance (Editors: Yakov Amihud and Richard M. Levich), Irwin Professional Publishing, New York: 37-48.
Logue, Dennis, 1995, When theory fails: Globalization as a response to the (Hostile) Market for
Foreign Exchange, Journal of Applied Corporate Finance 8: 39-48. Marston, Richard C., 2001, The effects of industry structure on economic exposure, Journal of
International Money and Finance 20: 149-164.

40
Martin, Anna D., Jeff Madura, and Aigbe Akhigbe, 1999, Economic exchange rate exposure of U.S.-based MNCs operating in Europe, The Financial Review 34: 21-36.
Mello, Antonio S., John E. Parsons, and Alexander Triantis, 1995, An integrated model of
multinational flexibility and hedging policies, Journal of International Economics 33: 41-56. Mian, Shehzad L., 1996, Evidence on corporate hedging policy, Journal of Financial and
Quantitative Analysis 31: 419-39. Miller, Kent D. and Jeffrey J. Reuer, 1998, Asymmetric corporate exposures to foreign exchange
rate changes, Strategic Management Journal 19: 1183-1191. Nance, Deana R., Clifford W. Smith, Jr., and Charles W. Smithson, 1993, On the determinants of
corporate hedging, Journal of Finance 48: 267-284. Oxelheim, Lars, C. Wihlborg and D. Lim, 1990, Contractual price rigidities and exchange rate
adjustments, The International Trade Journal 5 (Fall): 53-75. Pantzalis, Christos, Betty J. Simkins, and Paul Laux, 2001, Operational hedges and the foreign
exchange exposure of U.S. multinational corporations, Journal of International Business Studies 32 (No. 4): 793-812.
Paul-Choudhury, Sumit, 1996, Crossing the divide, Firmwide Risk Management, A Special
Supplement to Risk July, Risk Publications: 2-4. Petersen, Mitchell A. and S. Ramu Thiagarajan, 2000, Risk measurement and hedging: With and
without derivatives, Financial Management 29 (No. 4, Winter): 5-30. Shapiro, Alan C., 1996, Multinational Financial Management, 5th edition, Prentice Hall Inc.,
Upper Saddle River, New Jersey. Simkins, Betty J. and Paul Laux, 1996, Derivative use and the exchange rate risk of large U.S.
corporations, Conference Proceedings: The Second International Finance Conference, Georgia Tech University.
Smith, C.. and René Stulz, 1985, The determinants of firms’ hedging policies, Journal of
Financial and Quantitative Analysis 20: 391-405. Triantis, Alexander J., 2000, Real options and corporate risk management, Journal of Applied
Corporate Finance 13 (2): 64-73. Tufano, Peter, 1996, Who manages risk? An empirical examination of risk management
practices in the gold mining industry, Journal of Finance 51: 1097-1137. Whidbee, David A., and Mark Wohar, 1999, Derivative activities and managerial incentives in
the banking industry, Journal of Corporate Finance 5: 251-276.

41
Williamson, Rohan, 2001, Exchange rate exposure and competition: Evidence from the world automotive industry, Journal of Financial Economics 59: 441-475.
Wong, Franco M. H., 2000, The association between SFAS no. 119 derivatives disclosures and
foreign exchange risk exposure of manufacturing firms, Journal of Accounting Research 38: 387-417.

42
Table 1 Description of Variables and Hypothesized Relations Between MNC Characteristics and
the Absolute Value of the Foreign Exchange Exposure Coefficient
This table provides a description of the variables used in the analysis. All variables are calculated for the year 1996. There are nine different geographic regions used in constructing the operational hedging variables: East Asian region, NAFTA, European Union, Other Asia region, Western Europe region, Eastern Europe region, Central America and Caribbean, South America and Africa.
Variable
Expected Sign
Data Description (Source)
DER - Calculated as the total notional principal amount of currency derivatives/total foreign sales. This variable includes currency derivatives such as forwards, futures, swaps, caps, collars and others. (Swaps Monitor Database)
FWD - Calculated as the total notional principal amount of currency forward contracts/total foreign sales. (Swaps Monitor Database)
Financial Hedges
OTHDER - Calculated as the total notional principal amount of all other currency derivatives. (Swaps Monitor Database)
NFC
- Number of foreign countries in which the MNC has a subsidiary. (Who Owns Whom)
NFR
- Number of foreign regions in which the MNC operates. (Who Owns Whom)
HERF1 + Herfindahl Index 1. The index is calculated as follows: HERF1 = Σ i (NFSi)2/[ Σi (NFSi)]2 , where NFSi is the number of foreign subsidiaries in country i.
Operational Hedges
HERF2
+ Herfindahl Index 2: The index is calculated as follows: HERF2 = Σj (NFSj)2/[Σ j (NFSj)]2 , where NFSj is the number of foreign subsidiaries in geographic region j.
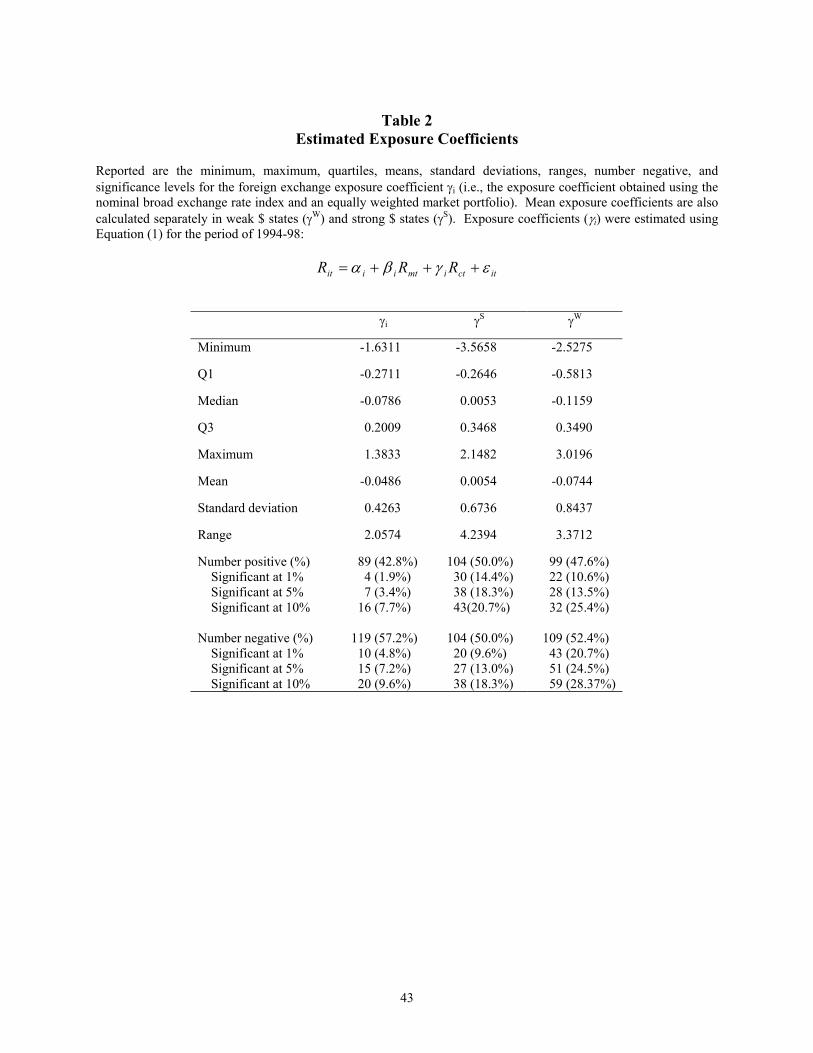
43
Table 2
Estimated Exposure Coefficients Reported are the minimum, maximum, quartiles, means, standard deviations, ranges, number negative, and significance levels for the foreign exchange exposure coefficient γi (i.e., the exposure coefficient obtained using the nominal broad exchange rate index and an equally weighted market portfolio). Mean exposure coefficients are also calculated separately in weak $ states (γW) and strong $ states (γS). Exposure coefficients (γi) were estimated using Equation (1) for the period of 1994-98:
itctimtiiit RRR εγβα +++=
γi γS γW
Minimum -1.6311 -3.5658 -2.5275
Q1 -0.2711 -0.2646 -0.5813
Median -0.0786 0.0053 -0.1159
Q3 0.2009 0.3468 0.3490
Maximum 1.3833 2.1482 3.0196
Mean -0.0486 0.0054 -0.0744
Standard deviation 0.4263 0.6736 0.8437
Range 2.0574 4.2394 3.3712
Number positive (%) Significant at 1% Significant at 5% Significant at 10%
89 (42.8%) 4 (1.9%) 7 (3.4%)
16 (7.7%)
104 (50.0%) 30 (14.4%) 38 (18.3%) 43(20.7%)
99 (47.6%) 22 (10.6%) 28 (13.5%) 32 (25.4%)
Number negative (%) Significant at 1% Significant at 5% Significant at 10%
119 (57.2%) 10 (4.8%) 15 (7.2%) 20 (9.6%)
104 (50.0%) 20 (9.6%) 27 (13.0%) 38 (18.3%)
109 (52.4%) 43 (20.7%) 51 (24.5%) 59 (28.37%)
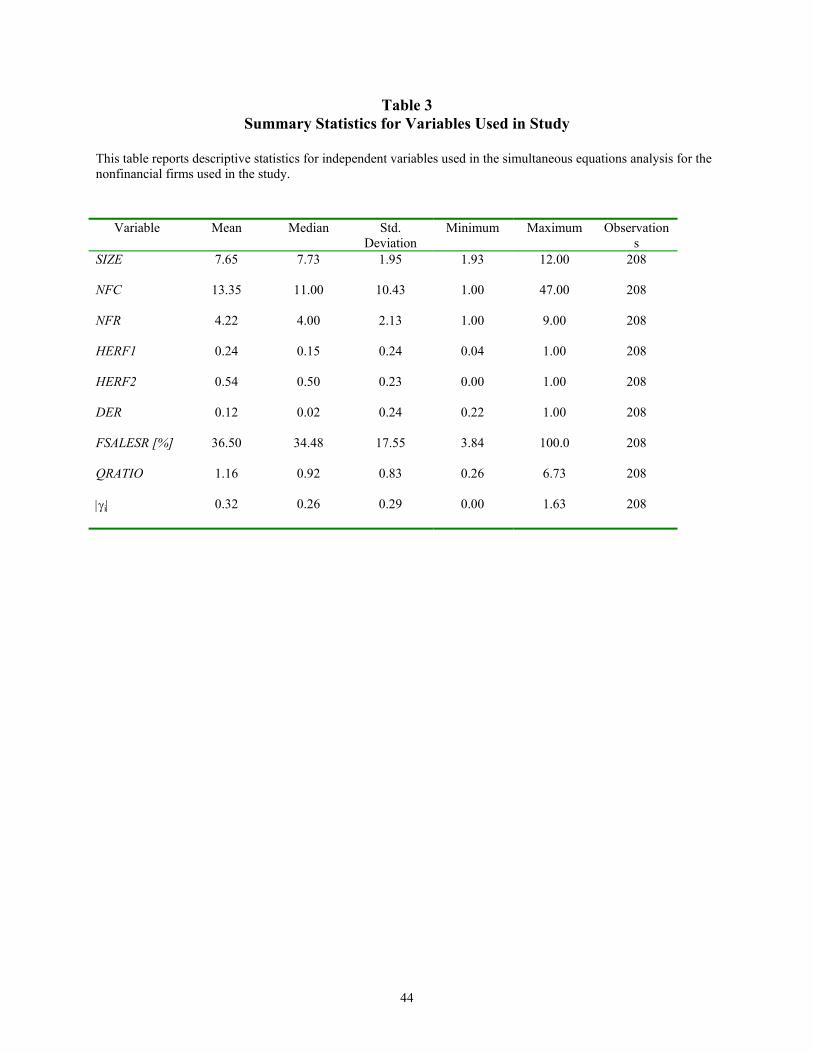
44
Table 3 Summary Statistics for Variables Used in Study
This table reports descriptive statistics for independent variables used in the simultaneous equations analysis for the nonfinancial firms used in the study.
Variable Mean Median Std. Deviation
Minimum Maximum Observations
SIZE
7.65 7.73 1.95 1.93 12.00 208
NFC
13.35 11.00 10.43 1.00 47.00 208
NFR
4.22 4.00 2.13 1.00 9.00 208
HERF1
0.24 0.15 0.24 0.04 1.00 208
HERF2
0.54 0.50 0.23 0.00 1.00 208
DER
0.12 0.02 0.24 0.22 1.00 208
FSALESR [%]
36.50 34.48 17.55 3.84 100.0 208
QRATIO
1.16 0.92 0.83 0.26 6.73 208
|γi|
0.32 0.26 0.29 0.00 1.63 208

45
Table 4
Distribution of firms classified based on their exposures during strong and weak $ states Panel A: Possible combinations of foreign exchange exposures in strong and weak dollar states.
Strong $ states [ ∆RFC/$ > 0 ] Weak $ states [ ∆RFC/$ < 0 ] γ < 0 (adverse effect ) γ = 0 (no effect) γ > 0 (beneficial effect) γ < 0 (beneficial effect)
I. : Symmetric exposure II. : Exposure consistent with real options hedge
III. : Exposure consistent with “optimal” hedge
γ = 0 (no effect )
IV. : Exposure consistent with poor hedge
V. : No exposure VI. : Exposure consistent with real options hedge
γ < 0 (adverse effect)
VII. : Maximum exposure and/or poor hedge
VIII. : Exposure consistent with poor hedge
IX. : Symmetric exposure
Panel B-1: Distribution of firms with positive average residual exposure coefficient (“net importers”) across groups of possible combinations of foreign exchange exposures in strong and weak dollar states.
Strong $ states [ ∆RFC/$ > 0 ] Weak $ states [ ∆RFC/$ < 0 ] γ < 0 (adverse effect ) γ = 0 (no effect) γ > 0 (beneficial effect) γ < 0 (beneficial effect)
I. : [N=0]
II. : [N=2]
III. : [N=2]
γ = 0 (no effect )
IV. : [N=1]
V. : [N=38]
VI. : [N=21]
γ < 0 (adverse effect)
VII. : [N=5]
VIII. : [N=16]
IX. : [N=4]
Panel B-2: Mean values of MNC network variables across groups of “net importers” belonging to different cells in Panel B-1. a, b, c denote that the mean value is significantly different from that of firms that are symmetrically exposed, poorly hedged and not exposed, respectively.
MNC network structure measure Firms belonging to : NFR NFC HERF1 HERF2
Cell VI (i.e., firms utilizing real options hedge) [N=21] 4.86 b, c 15.90 b, c 0.1649 a, b, c 0.4775 b, c
Cells II, III or VI (i.e., firms that are well hedged) [N=25] 4.76 b, c 15.40 b, c 0.1645 a, b, c 0.4749 b, c
Cells I and IX (i.e. firms that are symmetrically exposed) [N=4] 4.25 11.25 0.3507 0.4673
Cells IV, VII or VIII (i.e. firms that are poorly hedged) [N=22] 3.59 10.41 0.3386 0.6169
Cell V (i.e. firms with insignificant exposures) [N=38] 3.5 10.60 0.2772 0.6253
Panel C-1: Distribution of firms with negative average residual exposure coefficient (“net exporters”) across groups of possible combinations of foreign exchange exposures in strong and weak dollar states.
Strong $ states [ ∆RFC/$ > 0 ] Weak $ states [ ∆RFC/$ < 0 ] γ < 0 (adverse effect ) γ = 0 (no effect) γ > 0 (beneficial effect) γ < 0 (beneficial effect)
I. : [N=10]
II. : [N=29]
III. : [N=8]
γ = 0 (no effect )
IV. : [N=8]
V. : [N=58]
VI. : [N=3]
γ < 0 (adverse effect)
VII. : [N=3]
VIII. : [N=0]
IX. : [N=0]
Groups IV, VII or VIII (i.e. firms that are poorly hedged)
Panel C-2: Mean values of MNC network variables across groups of “net importers” belonging to different cells in Panel B-1. a, b, c denote that the mean value is significantly different from that of firms that are symmetrically exposed, poorly hedged and not exposed, respectively.
MNC network structure measure Firms belonging to : NFR NFC HERF1 HERF2
Cell II (i.e., firms utilizing real options hedge) [N=26]
4.73 c 13.27 a, b 0.2041 0.5026
Cells II, III or VI (i.e., firms that are well hedged) [N=37]
4.92 c 14.84 0.1796 0.4841
Cells I and IX (i.e. firms that are symmetrically exposed) [N=10]
4.90 19.5 0.2308 0.4882
Cells IV, VII or VIII (i.e. firms that are poorly hedged) [N=11]
5.46 20.73 0.1567 0.4469
Cell V (i.e. firms with insignificant exposure) [N=61]
3.92 12.16 0.2474 0.5542

46
Table 5 Effectiveness of Financial and Operational Hedges in Adverse and Beneficial Exchange Rate States
This table reports estimates of the determinants of the absolute exchange rate exposure in adverse and beneficial exchange rates. Seemingly unrelated regressions with robust standard errors (White (1980)) are used to control for heteroskedasticity. Significance levels are indicated as follows: *** 1%, ** 5%, * 10%. The independent variables are: SIZE = ln(market value). MNC network = NFC or NFR or HERF1 or HERF2. DER/FS = Derivatives’ notional value / Foreign sales.
iiiiii FSALESRMNCDERSIZE ζδδδδδγ +++++= 43210 , (2)
Panel A: “Net Importers”: This panel reports estimates of the determinants of the absolute exchange rate exposure in adverse (weakening) and beneficial (strengthening) U.S. dollar exchange rates for “net importers”, i.e. for firms with positive exposure coefficients over the period 1994-1998. Variable MNC network (operational hedging ability) is measured by:
NFC NFR
HERF1 HERF2
Strong $ Weak $ Diff of Coeff. Tests
Strong $ Weak $ Diff of Coeff. Tests
Strong $ Weak $ Diff of
Coeff.
Strong $ Weak $ Diff of Coeff. Tests
Intercept
0.5451** (0.027)
0.470 (0.116)
0.5779*** (0.011)
0.6828** (0.014)
0.5470* (0.055)
0.1107 (0.746)
0.7711** (0.021)
0.3516 (0.406)
SIZE
0.0319 (0.422)
0.0509 (0.293)
0.0308 (0.430)
0.0475 (0.317)
0.0224 (0.518)
0.0248 (0.551)
0.0062 (0.853)
-0.0216 (0.608)
MNC network -0.0058 (0.554)
-0.0390*** (0.001)
** -0.0233 (0.567)
-0.1637*** (0.001)
** 0.0746 (0.729)
0.9476*** (0.000)
*** -0.1559 (0.518)
0.5346* (0.081)
*
DER
-0.0260 (0.407)
-0.6251* (0.102)
-0.2580 (0.411)
-0.6109 (0.109)
-0.2695 (0.393)
-0.7512** (0.047)
-0.2403 (0.445)
-0.6834* (0.087)
FSALESR -0.0020 (0.527)
0.0128*** (0.001)
*** -0.0021 (0.494)
0.0121*** (0.001)
*** -0.0026 (0.381)
0.0090*** (0.011)
*** -0.0028 (0.341)
0.0091*** (0.002)
***
N 89 89 89 89 89 89 89 89
Adj.-R2 0.0220 0.2223 0.0218 0.2239 0.0195 0.2428 0.0228 0.157
χ2 2.007 (0.735)
25.439 (0.000)
1.984 (0.7388)
25.676 (0.000)
1.772 (0.778)
28.541 (0.000)
2.075 (0.722)
16.623 (0.002)
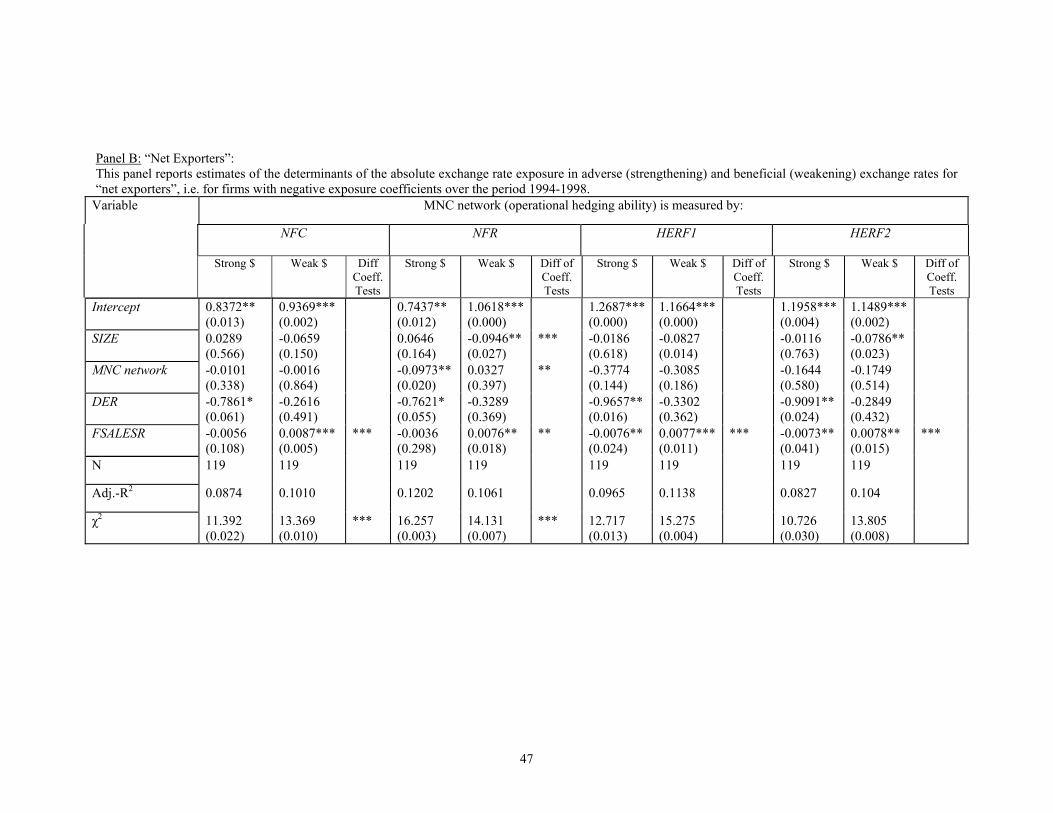
47
Panel B: “Net Exporters”: This panel reports estimates of the determinants of the absolute exchange rate exposure in adverse (strengthening) and beneficial (weakening) exchange rates for “net exporters”, i.e. for firms with negative exposure coefficients over the period 1994-1998.
Variable MNC network (operational hedging ability) is measured by:
NFC NFR
HERF1 HERF2
Strong $ Weak $ Diff Coeff. Tests
Strong $ Weak $ Diff of Coeff. Tests
Strong $ Weak $ Diff of Coeff. Tests
Strong $ Weak $ Diff of Coeff. Tests
Intercept
0.8372** (0.013)
0.9369*** (0.002)
0.7437** (0.012)
1.0618*** (0.000)
1.2687*** (0.000)
1.1664*** (0.000)
1.1958*** (0.004)
1.1489*** (0.002)
SIZE
0.0289 (0.566)
-0.0659 (0.150)
0.0646 (0.164)
-0.0946** (0.027)
*** -0.0186 (0.618)
-0.0827 (0.014)
-0.0116 (0.763)
-0.0786** (0.023)
MNC network -0.0101 (0.338)
-0.0016 (0.864)
-0.0973** (0.020)
0.0327 (0.397)
** -0.3774 (0.144)
-0.3085 (0.186)
-0.1644 (0.580)
-0.1749 (0.514)
DER
-0.7861* (0.061)
-0.2616 (0.491)
-0.7621* (0.055)
-0.3289 (0.369)
-0.9657** (0.016)
-0.3302 (0.362)
-0.9091** (0.024)
-0.2849 (0.432)
FSALESR -0.0056 (0.108)
0.0087*** (0.005)
*** -0.0036 (0.298)
0.0076** (0.018)
** -0.0076** (0.024)
0.0077*** (0.011)
*** -0.0073** (0.041)
0.0078** (0.015)
***
N 119 119 119 119 119 119 119 119
Adj.-R2 0.0874 0.1010 0.1202 0.1061 0.0965 0.1138 0.0827 0.104
χ2 11.392 (0.022)
13.369 (0.010)
*** 16.257 (0.003)
14.131 (0.007)
*** 12.717 (0.013)
15.275 (0.004)
10.726 (0.030)
13.805 (0.008)
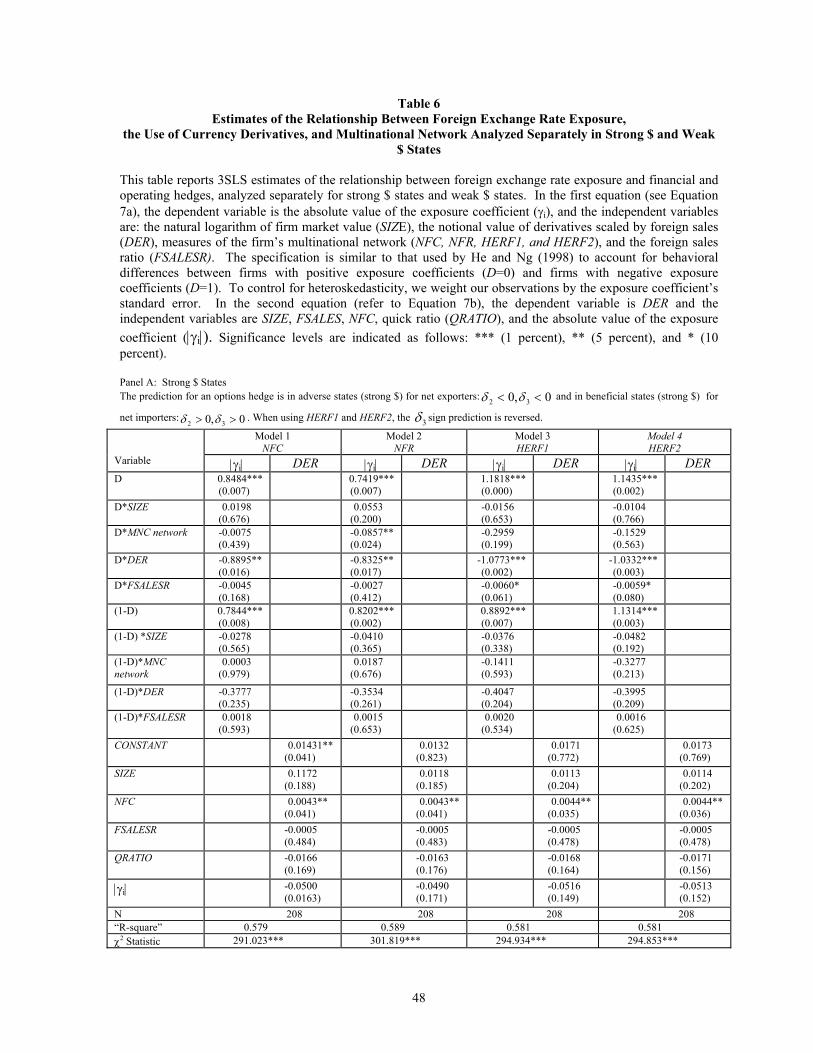
48
Table 6 Estimates of the Relationship Between Foreign Exchange Rate Exposure,
the Use of Currency Derivatives, and Multinational Network Analyzed Separately in Strong $ and Weak $ States
This table reports 3SLS estimates of the relationship between foreign exchange rate exposure and financial and operating hedges, analyzed separately for strong $ states and weak $ states. In the first equation (see Equation 7a), the dependent variable is the absolute value of the exposure coefficient (γi), and the independent variables are: the natural logarithm of firm market value (SIZE), the notional value of derivatives scaled by foreign sales (DER), measures of the firm’s multinational network (NFC, NFR, HERF1, and HERF2), and the foreign sales ratio (FSALESR). The specification is similar to that used by He and Ng (1998) to account for behavioral differences between firms with positive exposure coefficients (D=0) and firms with negative exposure coefficients (D=1). To control for heteroskedasticity, we weight our observations by the exposure coefficient’s standard error. In the second equation (refer to Equation 7b), the dependent variable is DER and the independent variables are SIZE, FSALES, NFC, quick ratio (QRATIO), and the absolute value of the exposure coefficient (|γi|). Significance levels are indicated as follows: *** (1 percent), ** (5 percent), and * (10 percent). Panel A: Strong $ States The prediction for an options hedge is in adverse states (strong $) for net exporters: 0,0 32 << δδ and in beneficial states (strong $) for
net importers: 0,0 32 >> δδ . When using HERF1 and HERF2, the 3δ sign prediction is reversed.
Model 1 NFC
Model 2 NFR
Model 3 HERF1
Model 4 HERF2
Variable |γi| DER |γi| DER |γi| DER |γi| DER D 0.8484***
(0.007) 0.7419***
(0.007) 1.1818***
(0.000) 1.1435***
(0.002)
D*SIZE 0.0198 (0.676)
0.0553 (0.200)
-0.0156 (0.653)
-0.0104 (0.766)
D*MNC network -0.0075 (0.439)
-0.0857** (0.024)
-0.2959 (0.199)
-0.1529 (0.563)
D*DER -0.8895** (0.016)
-0.8325** (0.017)
-1.0773*** (0.002)
-1.0332*** (0.003)
D*FSALESR -0.0045 (0.168)
-0.0027 (0.412)
-0.0060* (0.061)
-0.0059* (0.080)
(1-D) 0.7844*** (0.008)
0.8202*** (0.002)
0.8892*** (0.007)
1.1314*** (0.003)
(1-D) *SIZE -0.0278 (0.565)
-0.0410 (0.365)
-0.0376 (0.338)
-0.0482 (0.192)
(1-D)*MNC network
0.0003 (0.979)
0.0187 (0.676)
-0.1411 (0.593)
-0.3277 (0.213)
(1-D)*DER -0.3777 (0.235)
-0.3534 (0.261)
-0.4047 (0.204)
-0.3995 (0.209)
(1-D)*FSALESR 0.0018 (0.593)
0.0015 (0.653)
0.0020 (0.534)
0.0016 (0.625)
CONSTANT 0.01431** (0.041)
0.0132 (0.823)
0.0171 (0.772)
0.0173 (0.769)
SIZE 0.1172 (0.188)
0.0118 (0.185)
0.0113 (0.204)
0.0114 (0.202)
NFC 0.0043** (0.041)
0.0043** (0.041)
0.0044** (0.035)
0.0044** (0.036)
FSALESR -0.0005 (0.484)
-0.0005 (0.483)
-0.0005 (0.478)
-0.0005 (0.478)
QRATIO -0.0166 (0.169)
-0.0163 (0.176)
-0.0168 (0.164)
-0.0171 (0.156)
|γi| -0.0500 (0.0163)
-0.0490 (0.171)
-0.0516 (0.149)
-0.0513 (0.152)
N 208 208 208 208 “R-square” 0.579 0.589 0.581 0.581 χ2 Statistic 291.023*** 301.819*** 294.934*** 294.853***

49
Panel B: Weak $ States The prediction for an options hedge is in adverse states (weak $) for net importers: 0,0 32 << δδ and in beneficial states (weak $) for
net exporters: 0,0 32 >> δδ . When using HERF1 and HERF2, the 3δ sign prediction is reversed.
Model 1
NFC Model 2
NFR Model 3 HERF1
Model 4 HERF2
Variable |γi| DER |γi| DER |γi| DER |γi| DER D 1.0416***
(0.002) 1.1649***
(0.000) 1.2501***
(0.000) 1.3065***
(0.001)
D*SIZE -0.0796* (0.104)
-0.1090** (0.016)
-0.0929** (0.013)
-0.0919** (0.017)
D*MNC network -0.0014 (0.893)
0.0384** (0.0340)
-0.3035 (0.219)
-0.2458 (0.400)
D*DER -0.4256 (0.307)
-0.5465 (0.175)
-0.5614 (0.161)
-0.5245 (0.195)
D*FSALESR 0.0103*** (0.002)
0.0090*** (0.006)
0.0094*** (0.003)
0.0092*** (0.005)
(1-D) 0.6996** (0.019)
0.8747*** (0.001)
0.4584 (0.206)
0.9407** (0.025)
(1-D) *SIZE 0.0260 (0.596)
0.0260 (0.597)
-0.0007 (0.987)
-0.0575 (0.170)
(1-D)*MNC network
-0.0035*** (0.004)
-0.1420*** (0.005)
0.7488*** (0.010)
0.1645 (0.597)
(1-D)*DER -0.7972** (0.019)
-0.8325** (0.014)
-0.9623*** (0.005)
-0.9269*** (0.007)
(1-D)*FSALESR 0.0109*** (0.006)
0.0102*** (0.008)
0.0071* (0.055)
0.0072* (0.057)
CONSTANT 0.0073 (0.897)
0.0092 (0.870)
0.0104 (0.852)
0.0111 (0.843)
SIZE 0.0107 (0.204)
0.0103 (0.219)
0.0100 (0.232)
0.0099 (0.238)
NFC 0.0039** (0.049)
0.0040** (0.044)
0.0041** (0.039)
0.0041** (0.037)
FSALESR -0.0001 (0.919)
-0.0001 (0.924)
-0.0001 (0.922)
-0.0001 (0.910)
QRATIO -0.0106 (0.325)
-0.0103 (0.342)
-0.0099 (0.357)
-0.0101 (0.348)
|γi| -0.0641** (0.066)
-0.0669* (0.055)
-0.0682** (0.050)
-0.0672* (0.054)
N 208 208 208 208 “R-square” 0.6562 0.6563 0.6549 0.6429 χ2 Statistic 400.789*** 402.970*** 401.541*** 381.510***
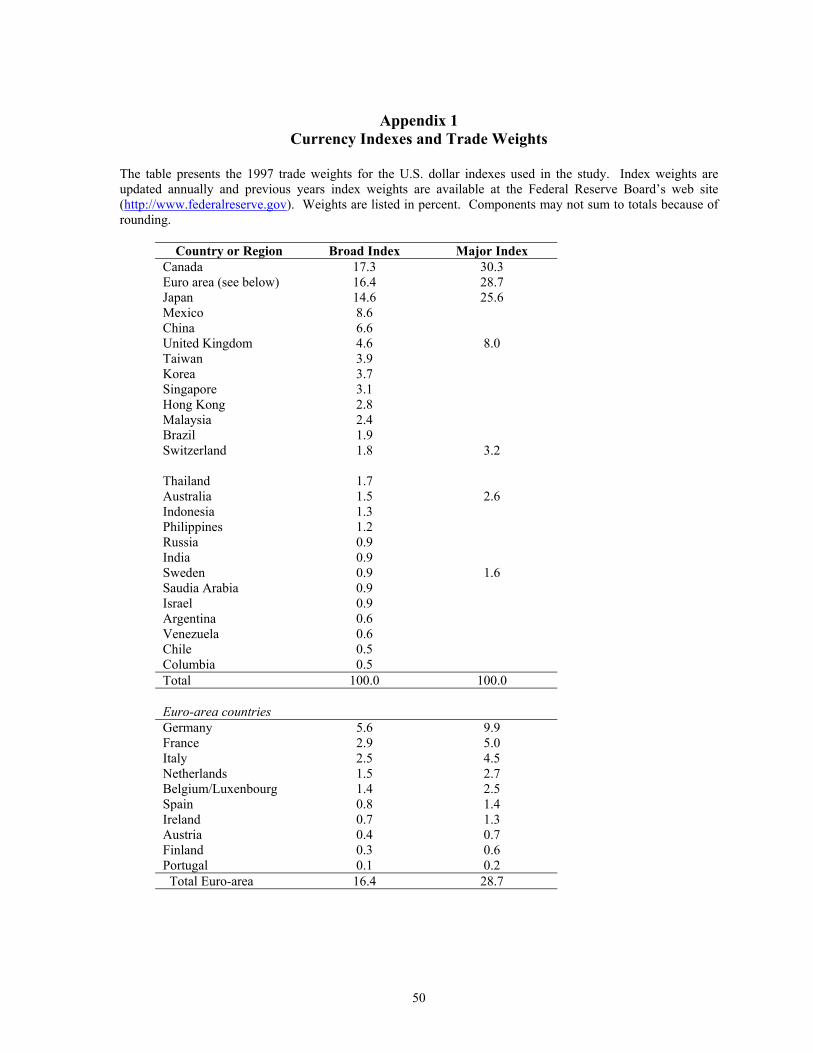
50
Appendix 1
Currency Indexes and Trade Weights
The table presents the 1997 trade weights for the U.S. dollar indexes used in the study. Index weights are updated annually and previous years index weights are available at the Federal Reserve Board’s web site (http://www.federalreserve.gov). Weights are listed in percent. Components may not sum to totals because of rounding.
Country or Region Broad Index Major Index Canada 17.3 30.3 Euro area (see below) 16.4 28.7 Japan 14.6 25.6 Mexico 8.6 China 6.6 United Kingdom 4.6 8.0 Taiwan 3.9 Korea 3.7 Singapore 3.1 Hong Kong 2.8 Malaysia 2.4 Brazil 1.9 Switzerland 1.8 3.2 Thailand 1.7 Australia 1.5 2.6 Indonesia 1.3 Philippines 1.2 Russia 0.9 India 0.9 Sweden 0.9 1.6 Saudia Arabia 0.9 Israel 0.9 Argentina 0.6 Venezuela 0.6 Chile 0.5 Columbia 0.5 Total 100.0 100.0 Euro-area countries Germany 5.6 9.9 France 2.9 5.0 Italy 2.5 4.5 Netherlands 1.5 2.7 Belgium/Luxenbourg 1.4 2.5 Spain 0.8 1.4 Ireland 0.7 1.3 Austria 0.4 0.7 Finland 0.3 0.6 Portugal 0.1 0.2 Total Euro-area 16.4 28.7