Embed Size (px)
Citation preview
1
The Total Survey Error Framework and Survey Quality Controls
in the Data Harmonization Process
Marta Kołczyńska The Ohio State University & Polish Academy of Sciences
Kazimierz M. Slomczynski The Ohio State University & Polish Academy of Sciences
2015 International Total Survey Error Conference
Baltimore, MD, 21 September 2015
2
Outline
1. About the Harmonization Project
2. Target Variables
3. General Schema for Quality Controls
4. Data Structure
5. Data Quality Controls
6. Harmonization Controls
7. Conclusion

3
1. Harmonization Project
Democratic Values and Protest Behavior: Data Harmonization, Measurement Comparability, and Multi-Level Modeling
dataharmonization.org
Funding: Polish National Science Centre (2012/06/M/HS6/00322)
Research Team: Kazimierz M. Slomczynski, J. Craig Jenkins, Irina Tomescu-Dubrow,
Joshua K. Dubrow, Przemek Powałko, Olena Oleksiyenko, Ilona Wysmułek,
Marta Kołczyńska, Marcin W. Zieliński, Matthew Schoene
Institutional support: Cross-national Studies, Interdisciplinary Research and Training Program - CONSIRT, Polish Academy of Sciences and The Ohio State University
consirt.osu.edu
4
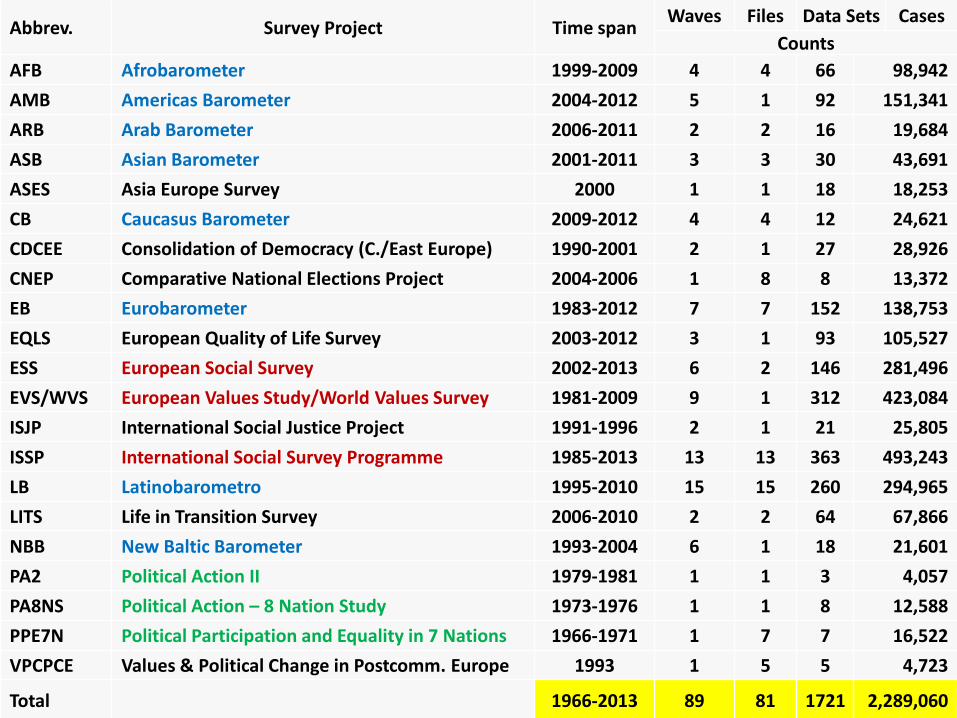
Criteria for selecting survey projects
- contain questions about political attitudes and behavior;
- designed as cross-national, and, preferably, multi-wave;
- with the samples intended as representative of the adult population
of given country or territory;
- non-commercial;
- freely available in the public domain;
- with documentation (description, codebook, questionnaire) in
English.
5
Abbrev. Survey Project Time span Waves Files Data Sets Cases
Counts
AFB Afrobarometer 1999-2009 4 4 66 98,942
AMB Americas Barometer 2004-2012 5 1 92 151,341
ARB Arab Barometer 2006-2011 2 2 16 19,684
ASB Asian Barometer 2001-2011 3 3 30 43,691
ASES Asia Europe Survey 2000 1 1 18 18,253
CB Caucasus Barometer 2009-2012 4 4 12 24,621
CDCEE Consolidation of Democracy (C./East Europe) 1990-2001 2 1 27 28,926
CNEP Comparative National Elections Project 2004-2006 1 8 8 13,372
EB Eurobarometer 1983-2012 7 7 152 138,753
EQLS European Quality of Life Survey 2003-2012 3 1 93 105,527
ESS European Social Survey 2002-2013 6 2 146 281,496
EVS/WVS European Values Study/World Values Survey 1981-2009 9 1 312 423,084
ISJP International Social Justice Project 1991-1996 2 1 21 25,805
ISSP International Social Survey Programme 1985-2013 13 13 363 493,243
LB Latinobarometro 1995-2010 15 15 260 294,965
LITS Life in Transition Survey 2006-2010 2 2 64 67,866
NBB New Baltic Barometer 1993-2004 6 1 18 21,601
PA2 Political Action II 1979-1981 1 1 3 4,057
PA8NS Political Action – 8 Nation Study 1973-1976 1 1 8 12,588
PPE7N Political Participation and Equality in 7 Nations 1966-1971 1 7 7 16,522
VPCPCE Values & Political Change in Postcomm. Europe 1993 1 5 5 4,723
Total 1966-2013 89 81 1721 2,289,060
6
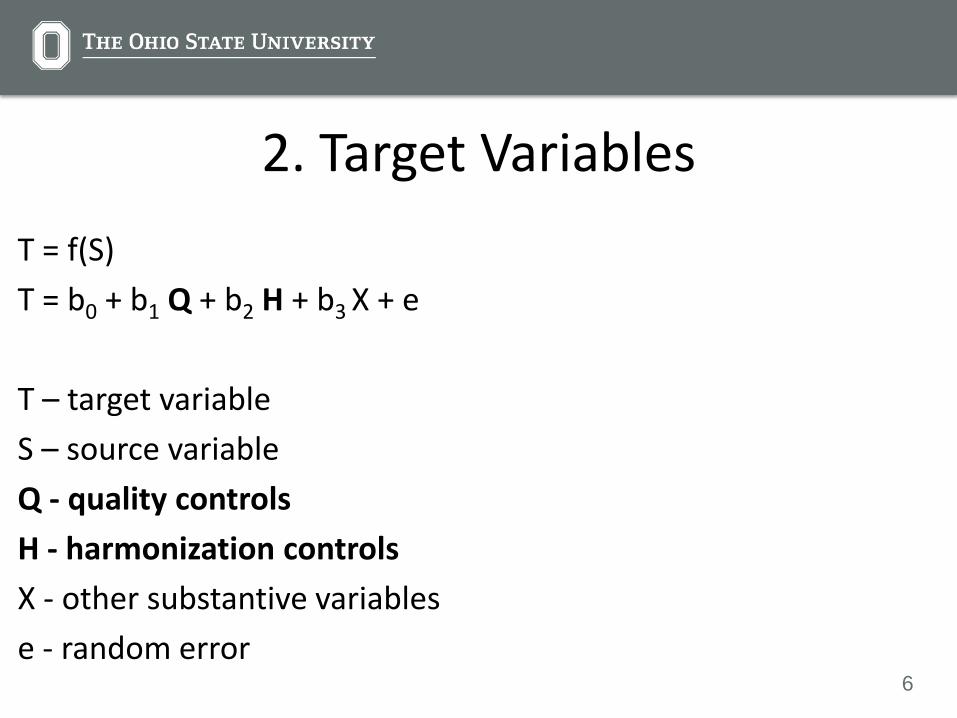
2. Target Variables
T = f(S)
T = b0 + b1 Q + b2 H + b3 X + e
T – target variable
S – source variable
Q - quality controls
H - harmonization controls
X - other substantive variables
e - random error

7
3. General Schema for Quality Controls Quality controls of survey documentation and data files
• Population coverage
• Sampling scheme
• Non-response
• Questionnaire translation
• Pretesting
• Control of fieldwork
• Correspondence of documentation with the data files
• Errors in weights, duplicated (non-unique) records

8
. Total survey error Quality control indicators
Coverage and
Sampling
Target population
Sampling schema
Non-response Non-response
Questionnaire Questionnaire translation
Fieldwork
Pretesting
Control of fieldwork
Processing
Data documentation vs. data files
Errors in weights, duplicated records
9
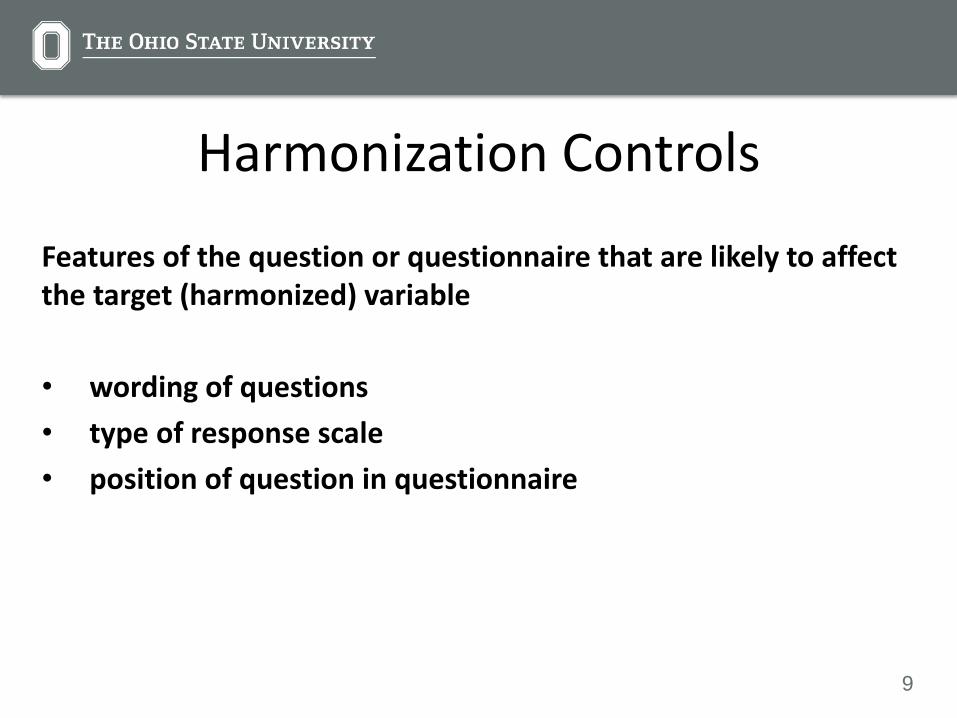
Harmonization Controls
Features of the question or questionnaire that are likely to affect the target (harmonized) variable
• wording of questions
• type of response scale
• position of question in questionnaire

10
4. Data Structure: Survey, Wave, Project
S111 S112 S113 S121 S122 S211 S212 S213 S214 S221 S222 S223 S231 S23 S23 S234
S120 S210 S220 S230 S110
S100 S200
Survey
Wave
Project

11
5. Data Quality Controls 5.1. Coverage and Sampling (ISSP 2011 SI)
Study description (extended)
Target population: adult residents of Slovenia, older than 18 years, living on permanent address. Excluded: Institutionalised people.
Sampling frame: Central Register of Population (a list of names and addresses constantly updated by public administration).
Sampling procedure: two-stage stratified random sample from Central Register of Population, where every population unit has equal probability of selection.
First stage: PSU selection is made by probability proportional to size of CEA (Clusters of Enumeration Areas) (150 PSUs). CEA are stratified according to 12 regions*6 type of settlement.
Second stage: systematic random selection inside CEA brings fixed numbers of persons (150x24) with name and address. Split-halves samples were used for parallel SJM surveys (2x1800).

12
5.1 Coverage and Sampling (ISSP 2011 US)
Study description (simplified)
Multi-stage area probability sample.
13
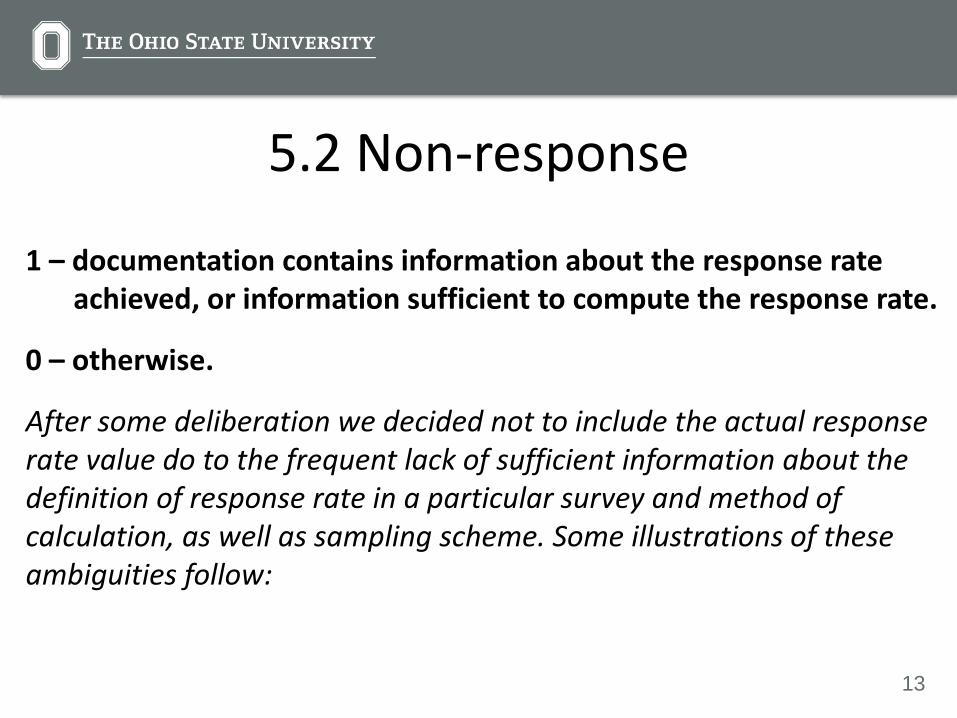
5.2 Non-response
1 – documentation contains information about the response rate achieved, or information sufficient to compute the response rate.
0 – otherwise.
After some deliberation we decided not to include the actual response rate value do to the frequent lack of sufficient information about the definition of response rate in a particular survey and method of calculation, as well as sampling scheme. Some illustrations of these ambiguities follow:

14
5.2 Response Rate: Definition
Response Rate = full interviews / full & partial interviews + non-interviews (refusal + break-off + non-contacts + others) + all cases of unknown eligibility.
4 more definitions of response rates.
4 definitions of cooperation rates.
3 definitions of refusal rates.
3 definitions of contact rates.
Source: Standard Definitions report (7th edition, 2011), aapor.org.
15
5.2 Response Rate: Definition
“For non-probability samples, response rate calculations make little sense, given the broader inferential concerns. Further, for many of these surveys, the denominator is unknown, making the calculation of response rates impossible”
Source: Standard Definitions report (7th edition, 2011), p. 32, aapor.org
16
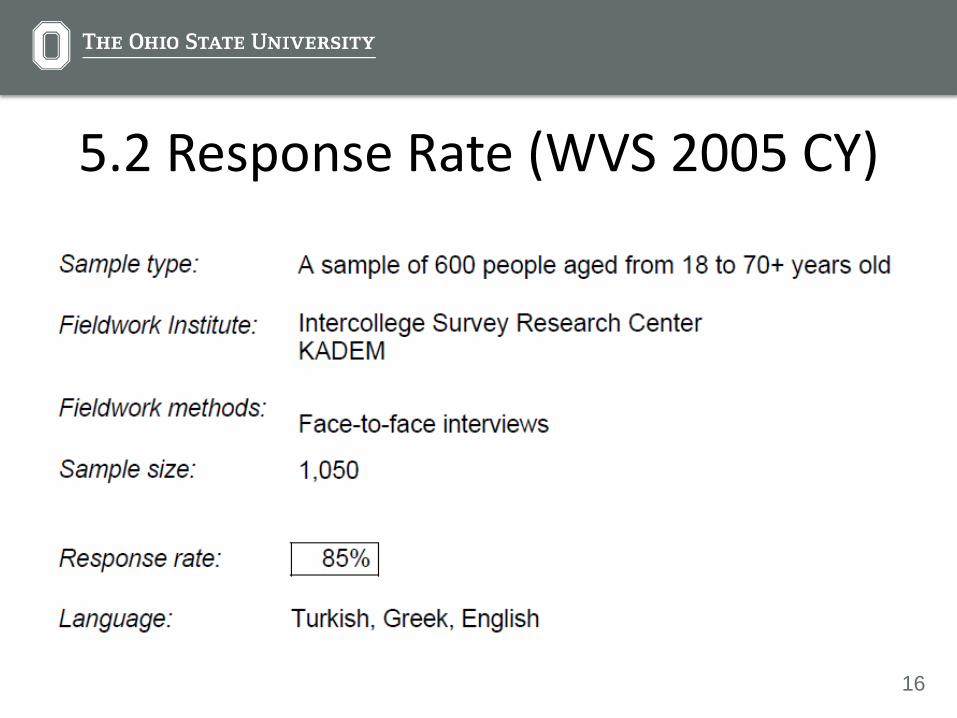
5.2 Response Rate (WVS 2005 CY)
17
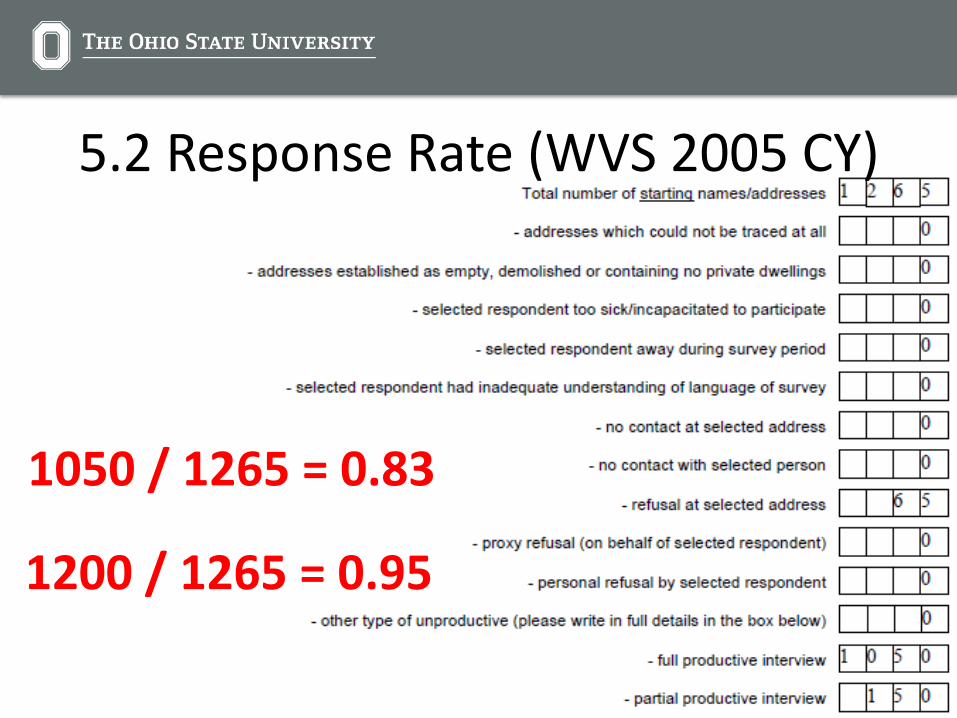
5.2 Response Rate (WVS 2005 CY)
1200 / 1265 = 0.95
1050 / 1265 = 0.83
18
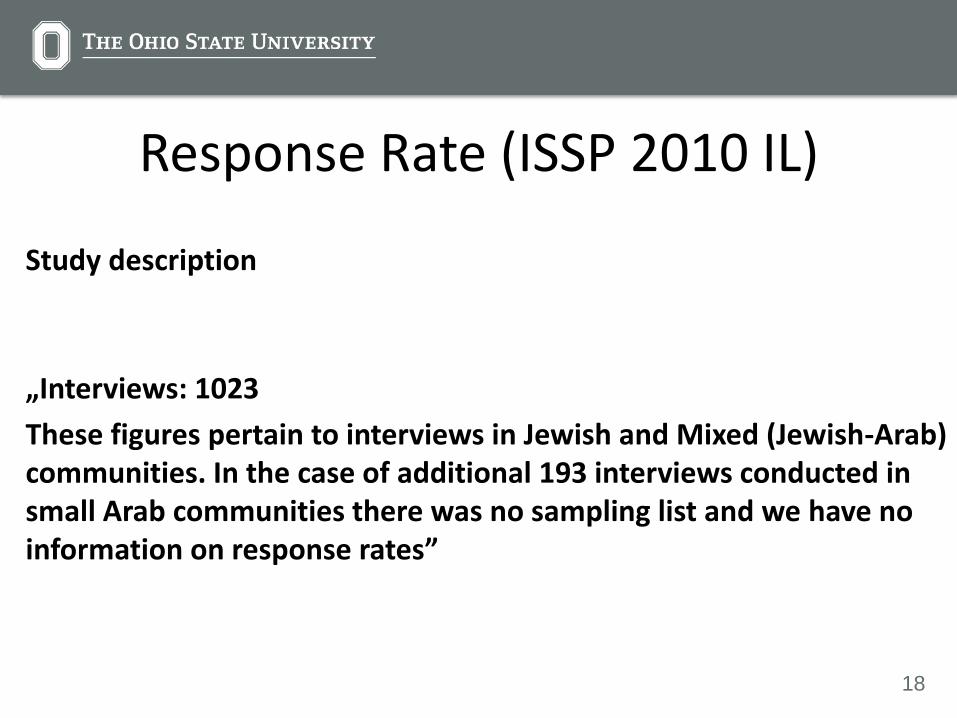
Response Rate (ISSP 2010 IL)
Study description
„Interviews: 1023
These figures pertain to interviews in Jewish and Mixed (Jewish-Arab) communities. In the case of additional 193 interviews conducted in small Arab communities there was no sampling list and we have no information on response rates”
19
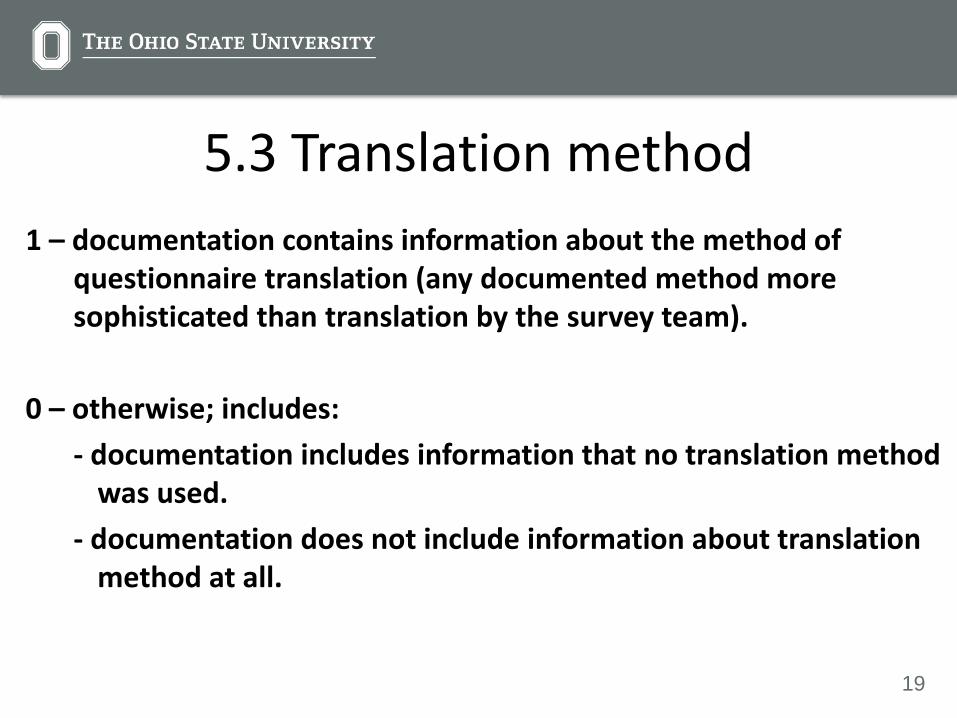
5.3 Translation method
1 – documentation contains information about the method of questionnaire translation (any documented method more sophisticated than translation by the survey team).
0 – otherwise; includes:
- documentation includes information that no translation method was used.
- documentation does not include information about translation method at all.
20
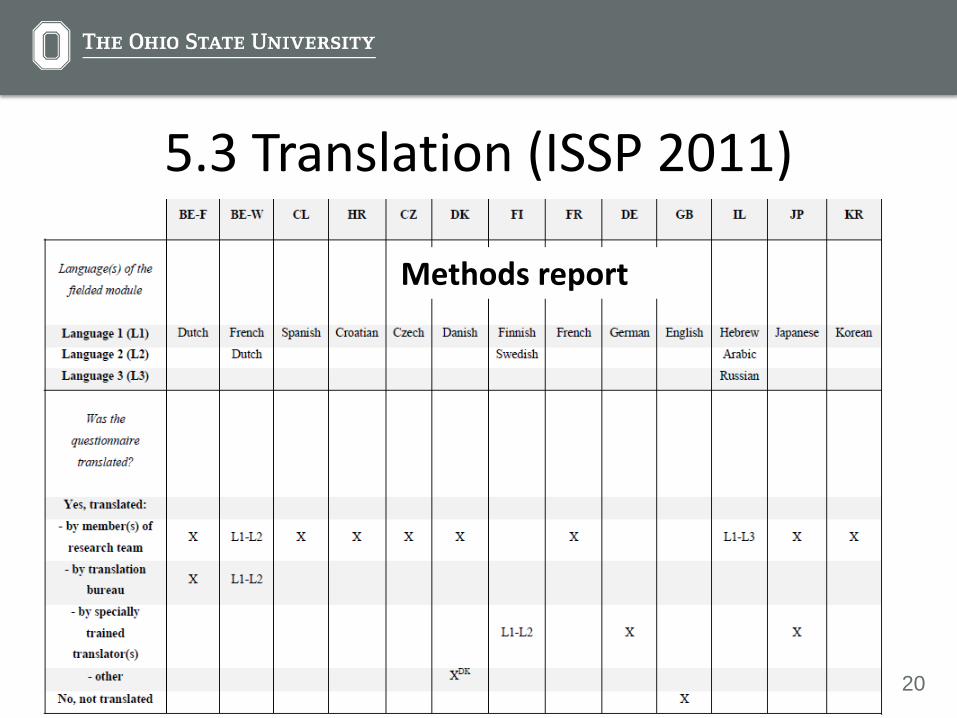
5.3 Translation (ISSP 2011)
Methods report

21
5.4 Pretesting
1 – documentation contains information about pretesting/piloting.
0 – otherwise - includes:
- documentation contains information about no pretesting having been carried out;
- documentation does not contain information about pretesting.
22
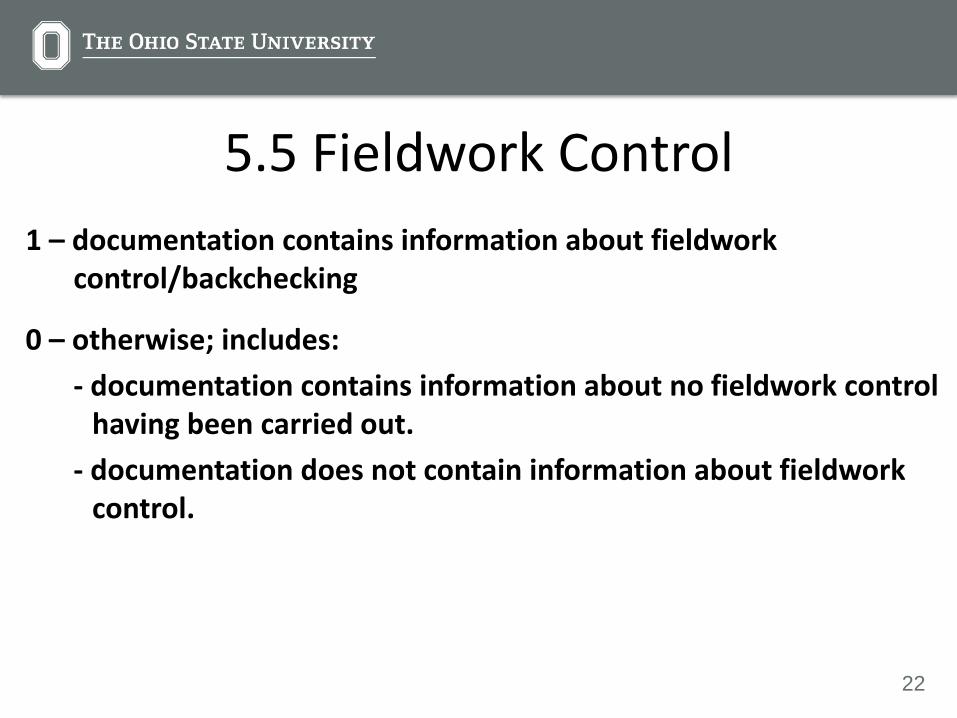
5.5 Fieldwork Control
1 – documentation contains information about fieldwork control/backchecking
0 – otherwise; includes:
- documentation contains information about no fieldwork control having been carried out.
- documentation does not contain information about fieldwork control.
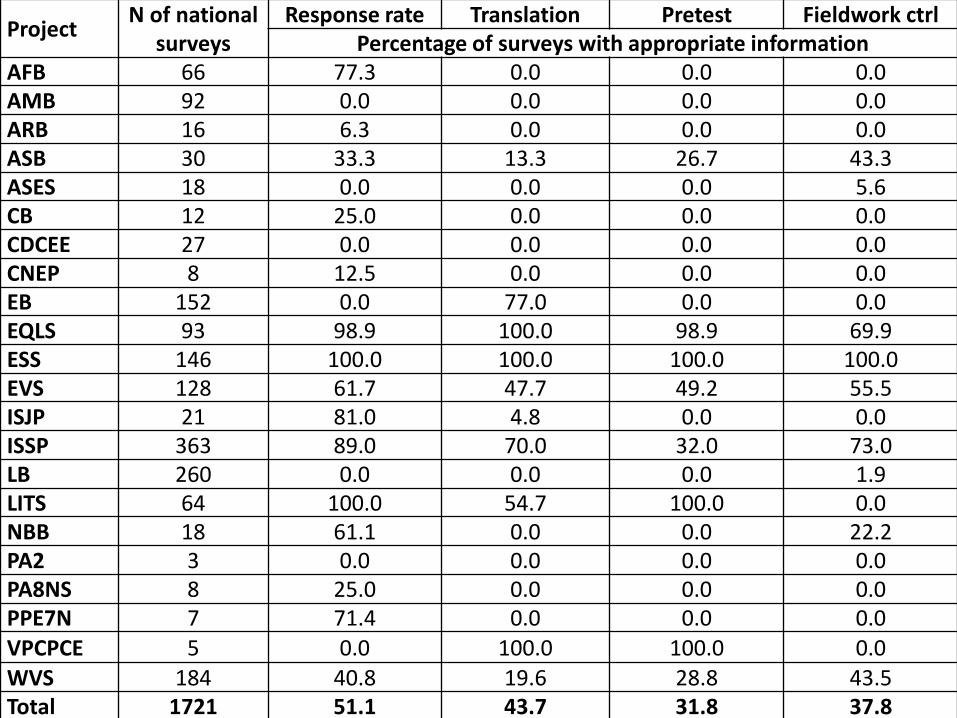
Project N of national
surveys Response rate Translation Pretest Fieldwork ctrl
Percentage of surveys with appropriate information AFB 66 77.3 0.0 0.0 0.0 AMB 92 0.0 0.0 0.0 0.0 ARB 16 6.3 0.0 0.0 0.0 ASB 30 33.3 13.3 26.7 43.3 ASES 18 0.0 0.0 0.0 5.6 CB 12 25.0 0.0 0.0 0.0 CDCEE 27 0.0 0.0 0.0 0.0 CNEP 8 12.5 0.0 0.0 0.0 EB 152 0.0 77.0 0.0 0.0 EQLS 93 98.9 100.0 98.9 69.9 ESS 146 100.0 100.0 100.0 100.0 EVS 128 61.7 47.7 49.2 55.5 ISJP 21 81.0 4.8 0.0 0.0 ISSP 363 89.0 70.0 32.0 73.0 LB 260 0.0 0.0 0.0 1.9 LITS 64 100.0 54.7 100.0 0.0 NBB 18 61.1 0.0 0.0 22.2 PA2 3 0.0 0.0 0.0 0.0 PA8NS 8 25.0 0.0 0.0 0.0 PPE7N 7 71.4 0.0 0.0 0.0 VPCPCE 5 0.0 100.0 100.0 0.0 WVS 184 40.8 19.6 28.8 43.5 Total 1721 51.1 43.7 31.8 37.8
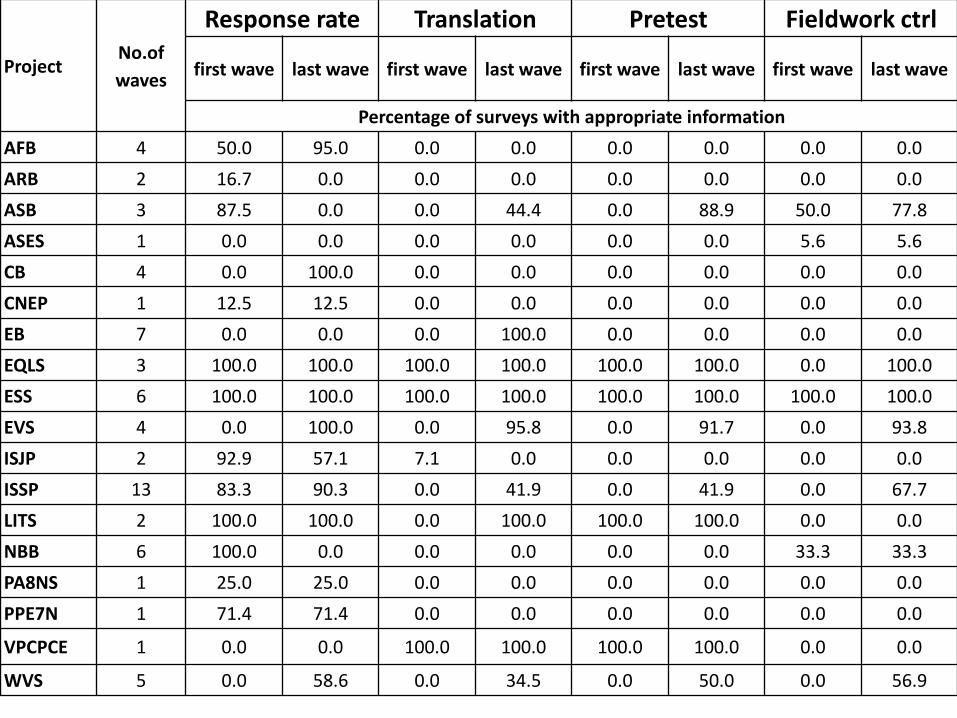
Project No.of
waves
Response rate Translation Pretest Fieldwork ctrl
first wave last wave first wave last wave first wave last wave first wave last wave
Percentage of surveys with appropriate information
AFB 4 50.0 95.0 0.0 0.0 0.0 0.0 0.0 0.0
ARB 2 16.7 0.0 0.0 0.0 0.0 0.0 0.0 0.0
ASB 3 87.5 0.0 0.0 44.4 0.0 88.9 50.0 77.8
ASES 1 0.0 0.0 0.0 0.0 0.0 0.0 5.6 5.6
CB 4 0.0 100.0 0.0 0.0 0.0 0.0 0.0 0.0
CNEP 1 12.5 12.5 0.0 0.0 0.0 0.0 0.0 0.0
EB 7 0.0 0.0 0.0 100.0 0.0 0.0 0.0 0.0
EQLS 3 100.0 100.0 100.0 100.0 100.0 100.0 0.0 100.0
ESS 6 100.0 100.0 100.0 100.0 100.0 100.0 100.0 100.0
EVS 4 0.0 100.0 0.0 95.8 0.0 91.7 0.0 93.8
ISJP 2 92.9 57.1 7.1 0.0 0.0 0.0 0.0 0.0
ISSP 13 83.3 90.3 0.0 41.9 0.0 41.9 0.0 67.7
LITS 2 100.0 100.0 0.0 100.0 100.0 100.0 0.0 0.0
NBB 6 100.0 0.0 0.0 0.0 0.0 0.0 33.3 33.3
PA8NS 1 25.0 25.0 0.0 0.0 0.0 0.0 0.0 0.0
PPE7N 1 71.4 71.4 0.0 0.0 0.0 0.0 0.0 0.0
VPCPCE 1 0.0 0.0 100.0 100.0 100.0 100.0 0.0 0.0
WVS 5 0.0 58.6 0.0 34.5 0.0 50.0 0.0 56.9
25
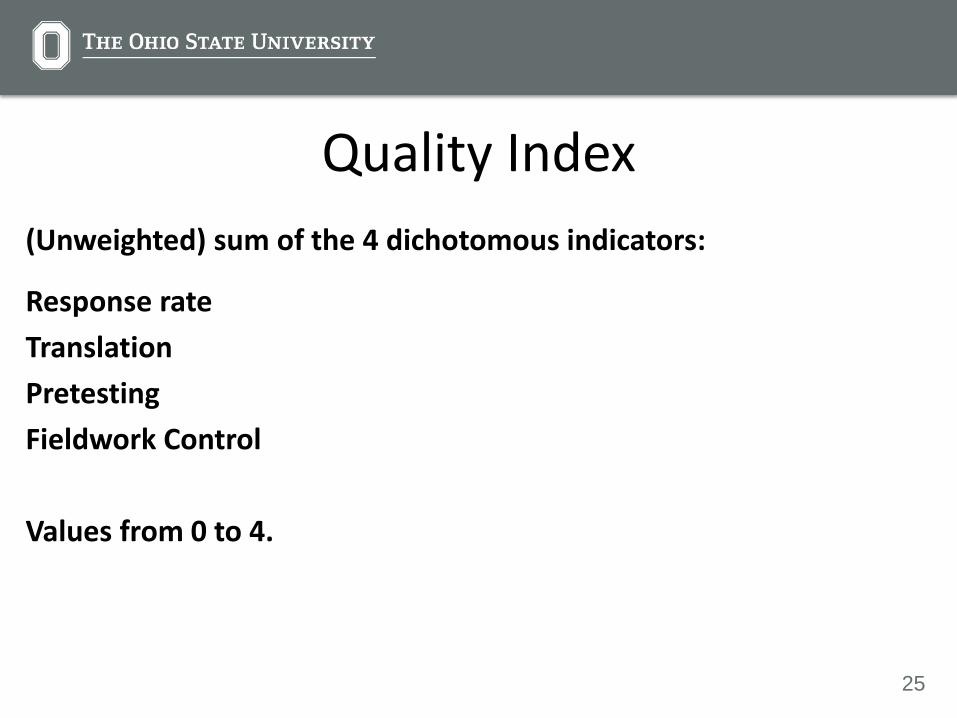
Quality Index
(Unweighted) sum of the 4 dichotomous indicators:
Response rate
Translation
Pretesting
Fieldwork Control
Values from 0 to 4.
26
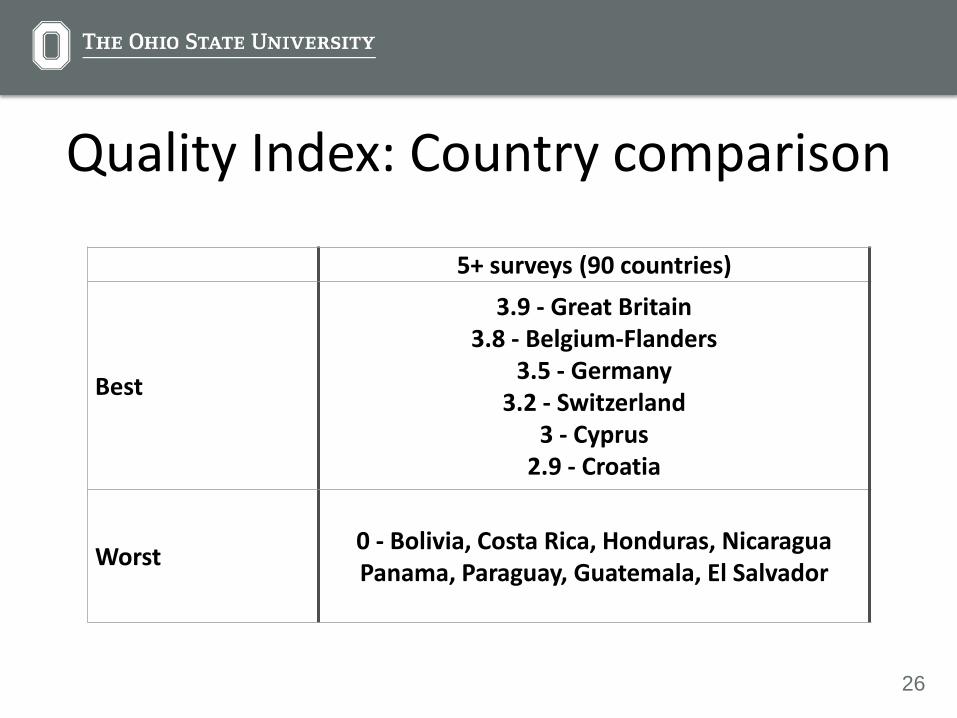
Quality Index: Country comparison
5+ surveys (90 countries)
Best
3.9 - Great Britain 3.8 - Belgium-Flanders
3.5 - Germany 3.2 - Switzerland
3 - Cyprus 2.9 - Croatia
Worst 0 - Bolivia, Costa Rica, Honduras, Nicaragua Panama, Paraguay, Guatemala, El Salvador

27
Quality Index over time
28
6. Harmonization Controls Example: Trust in parliament
18 projects
137 countries/territories
1313 surveys
1.7 million individuals (unweighted)
29
Example: Trust in parliament
Wording, meaning of „trust”
Response options/scale (scale length, direction)
Context of the question (position in questionnaire)

30
Wording
I would like to ask you a question about how much trust you have in certain institutions. For each of the following institutions, please tell me if you tend to trust it or tend not to trust it. (EB 77.3)
In order to get ahead, people need to have confidence and to feel that they can trust themselves and others. To what degree do you think that you trust the following totally, to a certain point, little, or not at all? (CDCEE 2)
Please look at this card and tell me, for each item listed, how much confidence you have in them, is it a great deal, quite a lot, not very much or none at all? (EVS 4)
31
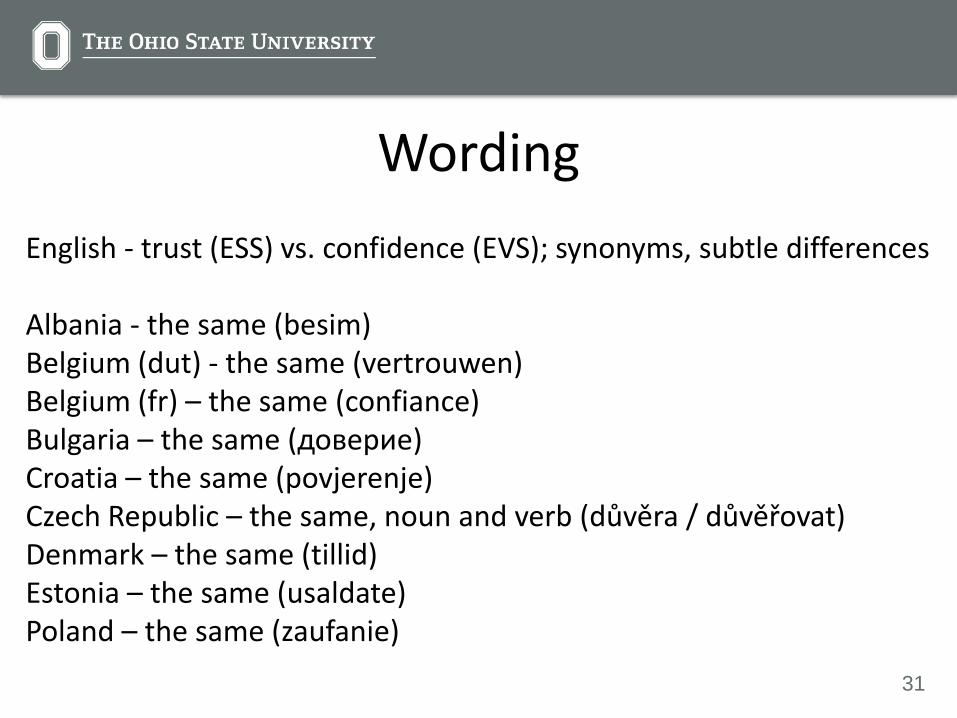
Wording
English - trust (ESS) vs. confidence (EVS); synonyms, subtle differences Albania - the same (besim) Belgium (dut) - the same (vertrouwen) Belgium (fr) – the same (confiance) Bulgaria – the same (доверие) Croatia – the same (povjerenje) Czech Republic – the same, noun and verb (důvěra / důvěřovat) Denmark – the same (tillid) Estonia – the same (usaldate) Poland – the same (zaufanie)
32
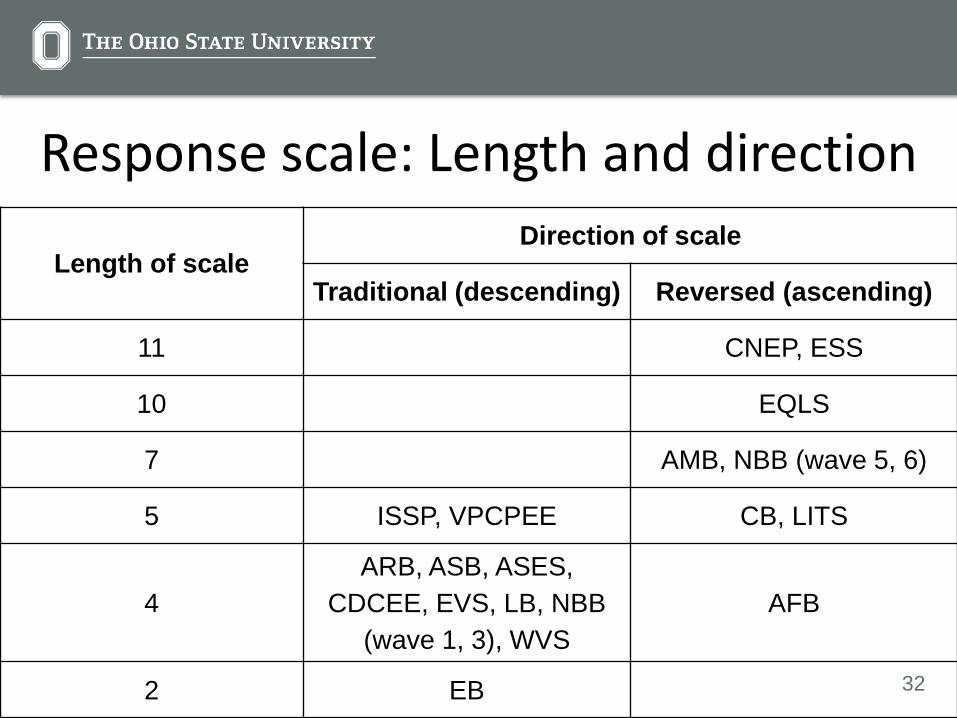
Response scale: Length and direction
Length of scale Direction of scale
Traditional (descending) Reversed (ascending)
11 CNEP, ESS
10 EQLS
7 AMB, NBB (wave 5, 6)
5 ISSP, VPCPEE CB, LITS
4
ARB, ASB, ASES,
CDCEE, EVS, LB, NBB
(wave 1, 3), WVS
AFB
2 EB
33
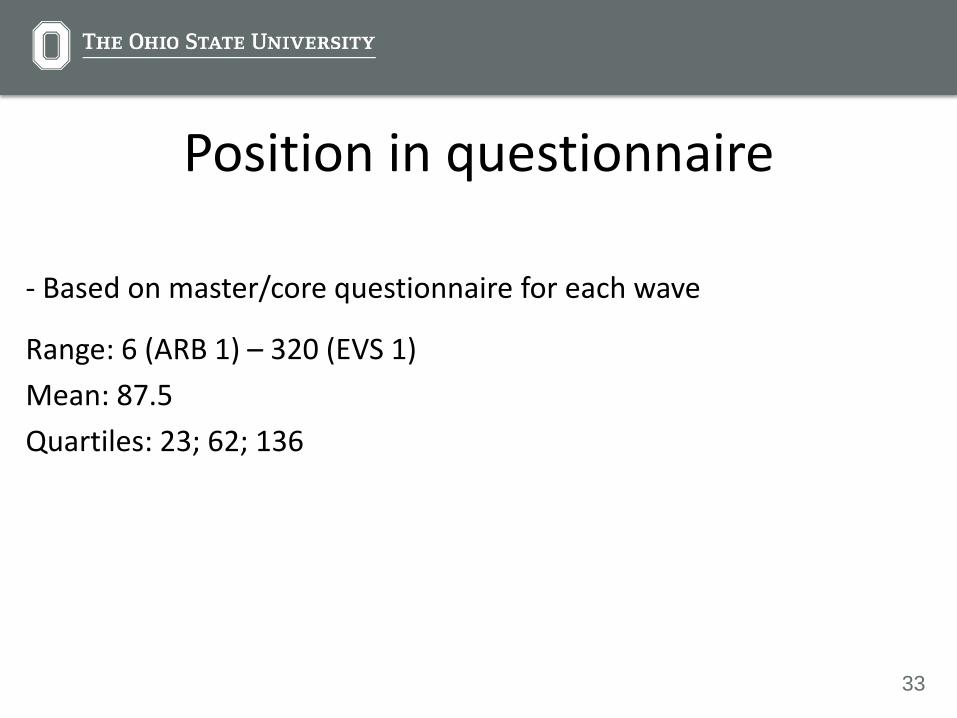
Position in questionnaire
- Based on master/core questionnaire for each wave
Range: 6 (ARB 1) – 320 (EVS 1)
Mean: 87.5
Quartiles: 23; 62; 136
34
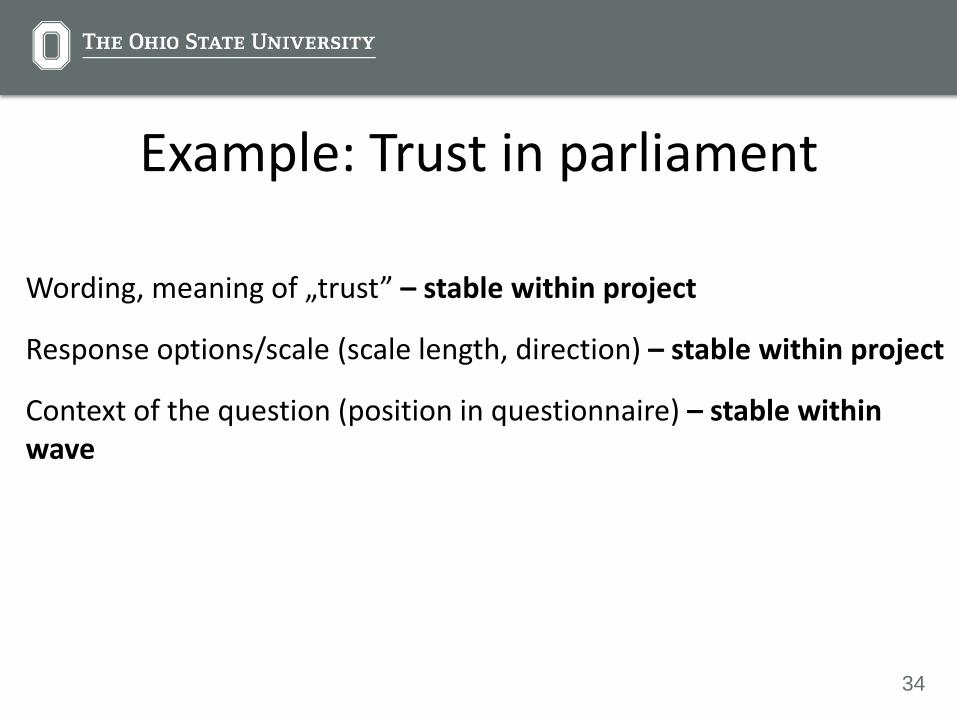
Example: Trust in parliament
Wording, meaning of „trust” – stable within project
Response options/scale (scale length, direction) – stable within project
Context of the question (position in questionnaire) – stable within wave

35
7. Conclusions
- Surveys vary greatly with regard to data and documentation quality and methodology, even within waves of the same survey project
- Joint analysis of data from different surveys requires quality and harmonization controls to account for these differences