Embed Size (px)
Citation preview
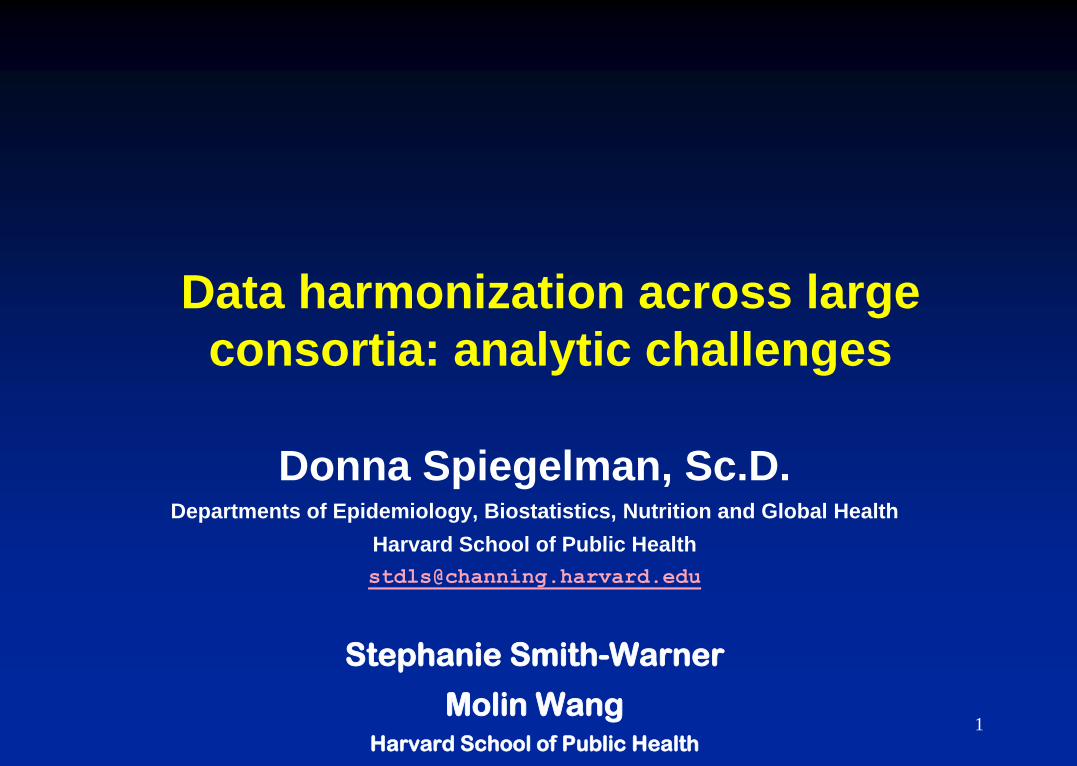
Data harmonization across large
consortia: analytic challenges
Donna Spiegelman, Sc.D. Departments of Epidemiology, Biostatistics, Nutrition and Global Health
Harvard School of Public Health
Stephanie Smith-Warner
Molin Wang Harvard School of Public Health
1
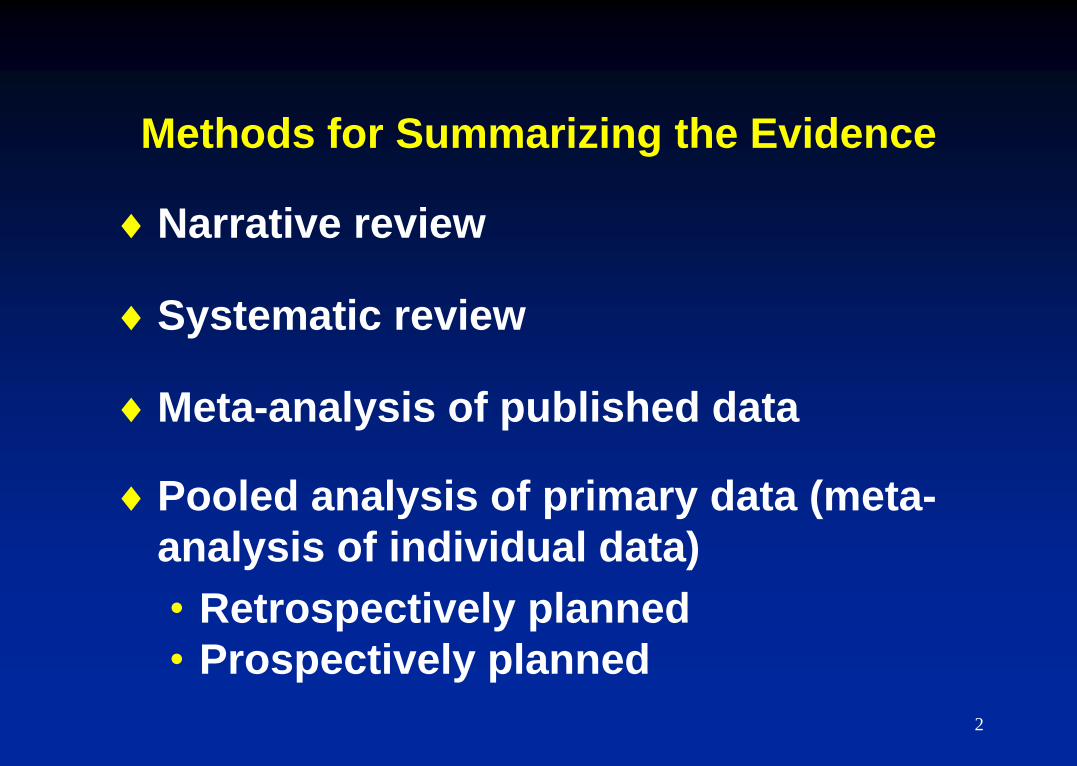
Methods for Summarizing the Evidence
Narrative review
Systematic review
Meta-analysis of published data
Pooled analysis of primary data (meta-
analysis of individual data)
• Retrospectively planned
• Prospectively planned
2
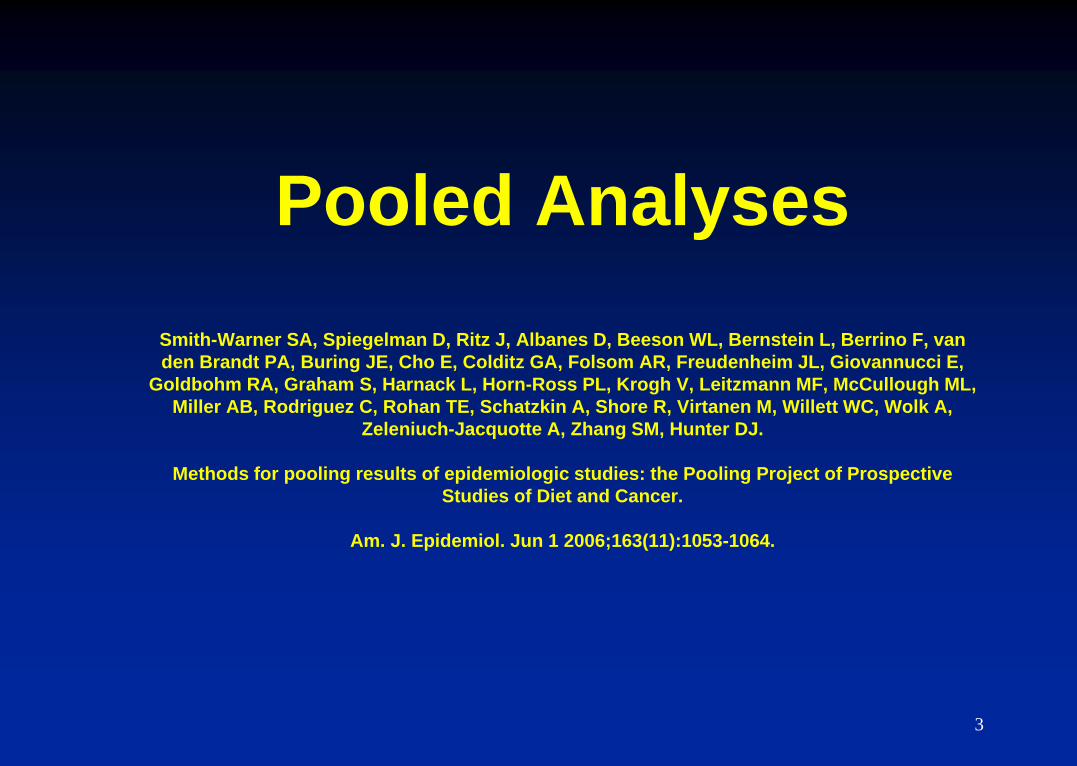
Pooled Analyses
Smith-Warner SA, Spiegelman D, Ritz J, Albanes D, Beeson WL, Bernstein L, Berrino F, van
den Brandt PA, Buring JE, Cho E, Colditz GA, Folsom AR, Freudenheim JL, Giovannucci E,
Goldbohm RA, Graham S, Harnack L, Horn-Ross PL, Krogh V, Leitzmann MF, McCullough ML,
Miller AB, Rodriguez C, Rohan TE, Schatzkin A, Shore R, Virtanen M, Willett WC, Wolk A,
Zeleniuch-Jacquotte A, Zhang SM, Hunter DJ.
Methods for pooling results of epidemiologic studies: the Pooling Project of Prospective
Studies of Diet and Cancer.
Am. J. Epidemiol. Jun 1 2006;163(11):1053-1064.
3
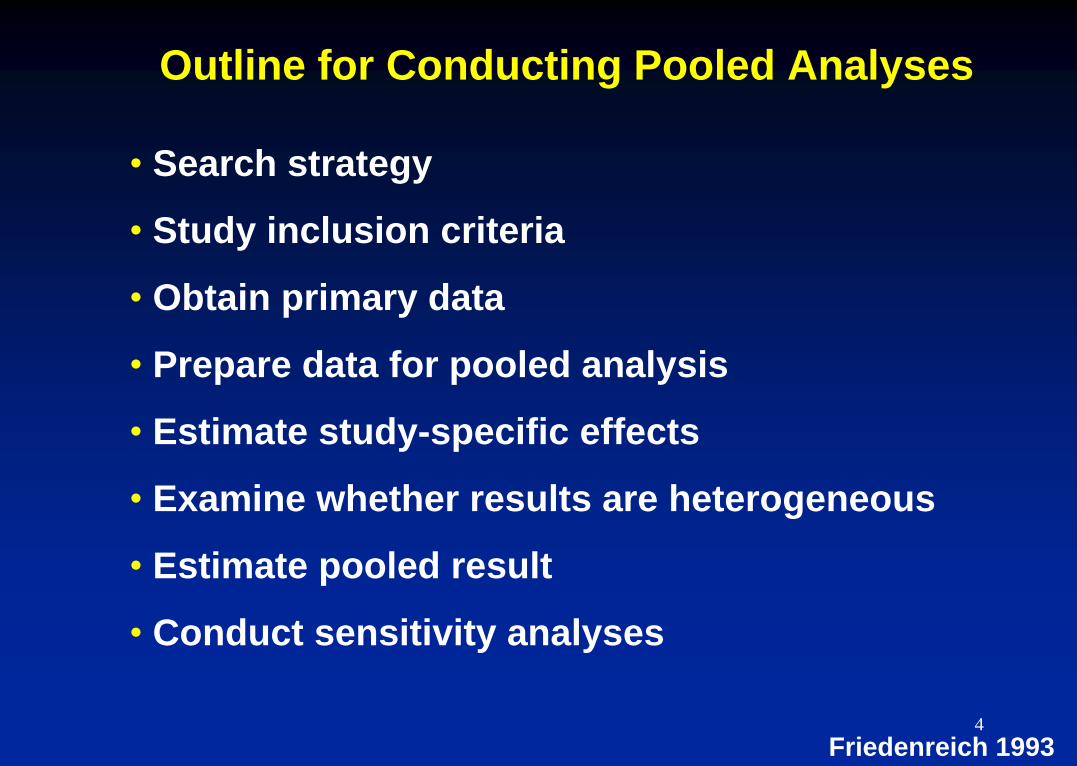
Outline for Conducting Pooled Analyses
• Search strategy
• Study inclusion criteria
• Obtain primary data
• Prepare data for pooled analysis
• Estimate study-specific effects
• Examine whether results are heterogeneous
• Estimate pooled result
• Conduct sensitivity analyses
Friedenreich 1993
4
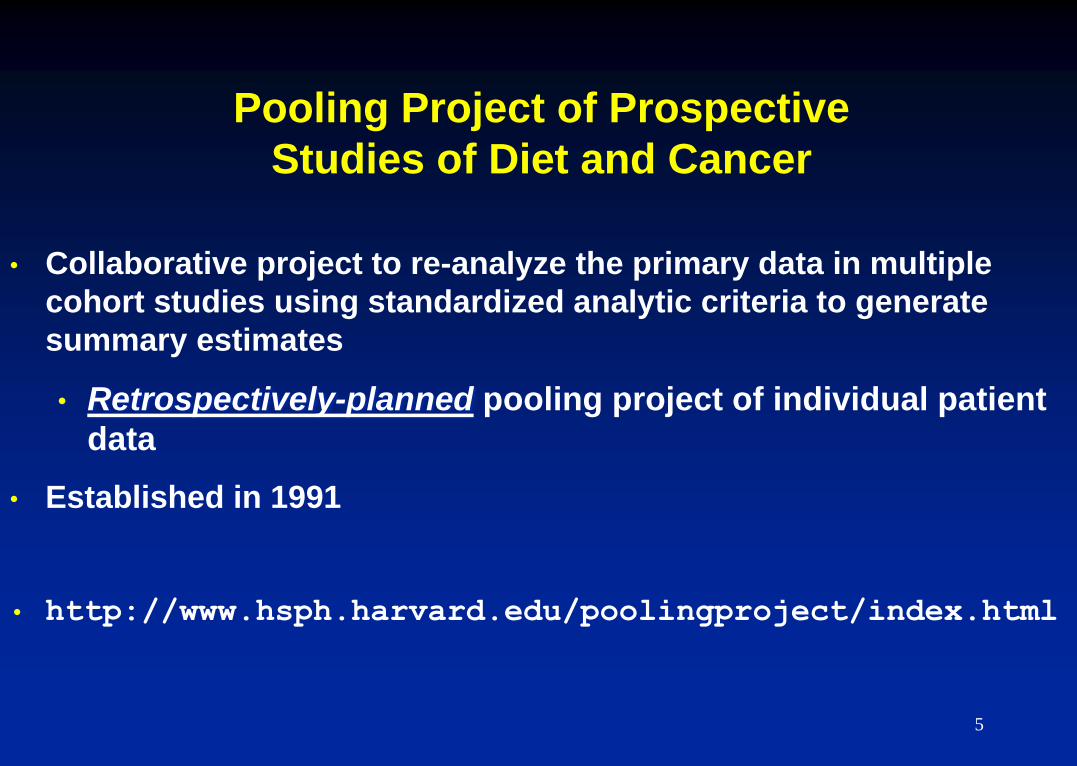
Pooling Project of Prospective
Studies of Diet and Cancer
• Collaborative project to re-analyze the primary data in multiple
cohort studies using standardized analytic criteria to generate
summary estimates
• Retrospectively-planned pooling project of individual patient
data
• Established in 1991
• http://www.hsph.harvard.edu/poolingproject/index.html
5
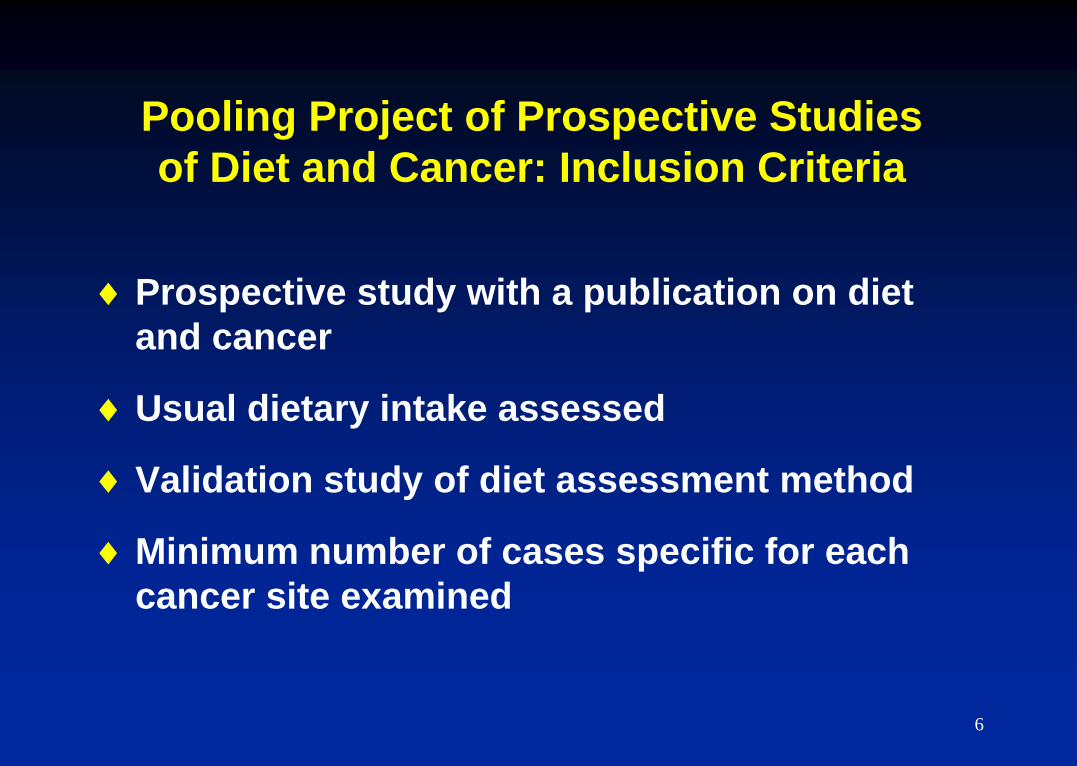
Pooling Project of Prospective Studies
of Diet and Cancer: Inclusion Criteria
Prospective study with a publication on diet
and cancer
Usual dietary intake assessed
Validation study of diet assessment method
Minimum number of cases specific for each
cancer site examined
6
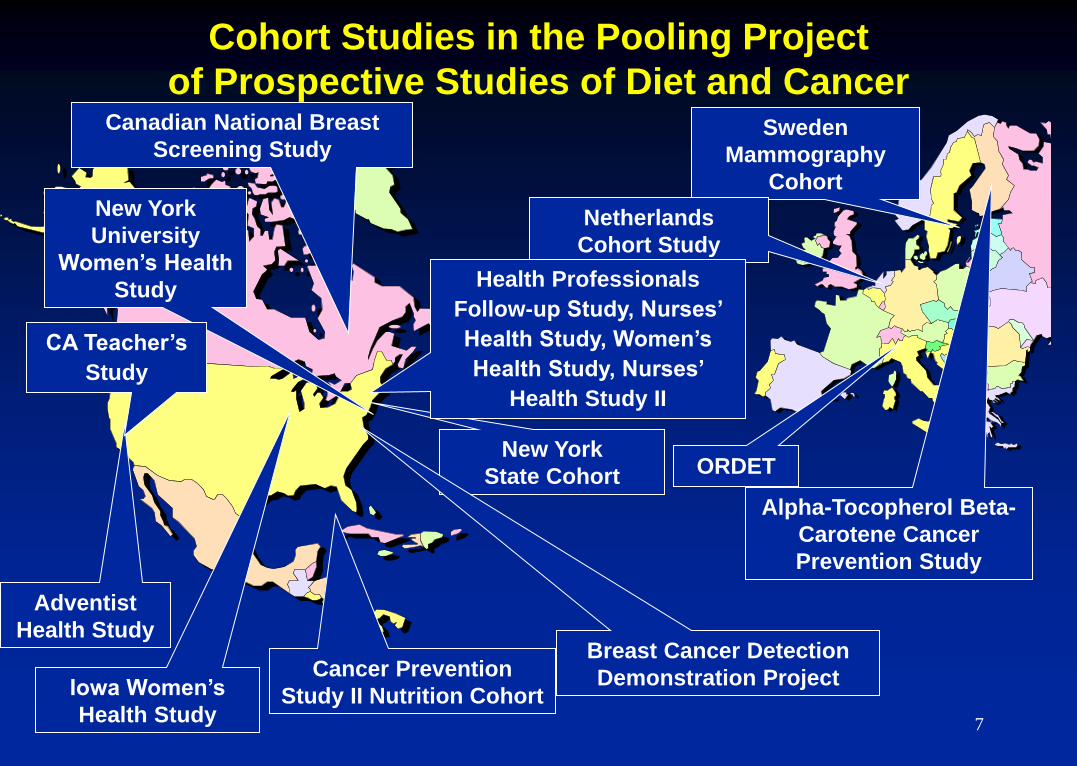
Sweden
Mammography
Cohort
Netherlands
Cohort Study
New York
State Cohort
Iowa Women’s
Health Study
Canadian National Breast
Screening Study
Cohort Studies in the Pooling Project
of Prospective Studies of Diet and Cancer
Cancer Prevention
Study II Nutrition Cohort
Adventist
Health Study
Alpha-Tocopherol Beta-
Carotene Cancer
Prevention Study
New York
University
Women’s Health
Study Health Professionals
Follow-up Study, Nurses’
Health Study, Women’s
Health Study, Nurses’
Health Study II
Breast Cancer Detection
Demonstration Project
ORDET
Total=948,983
CA Teacher’s
Study
7
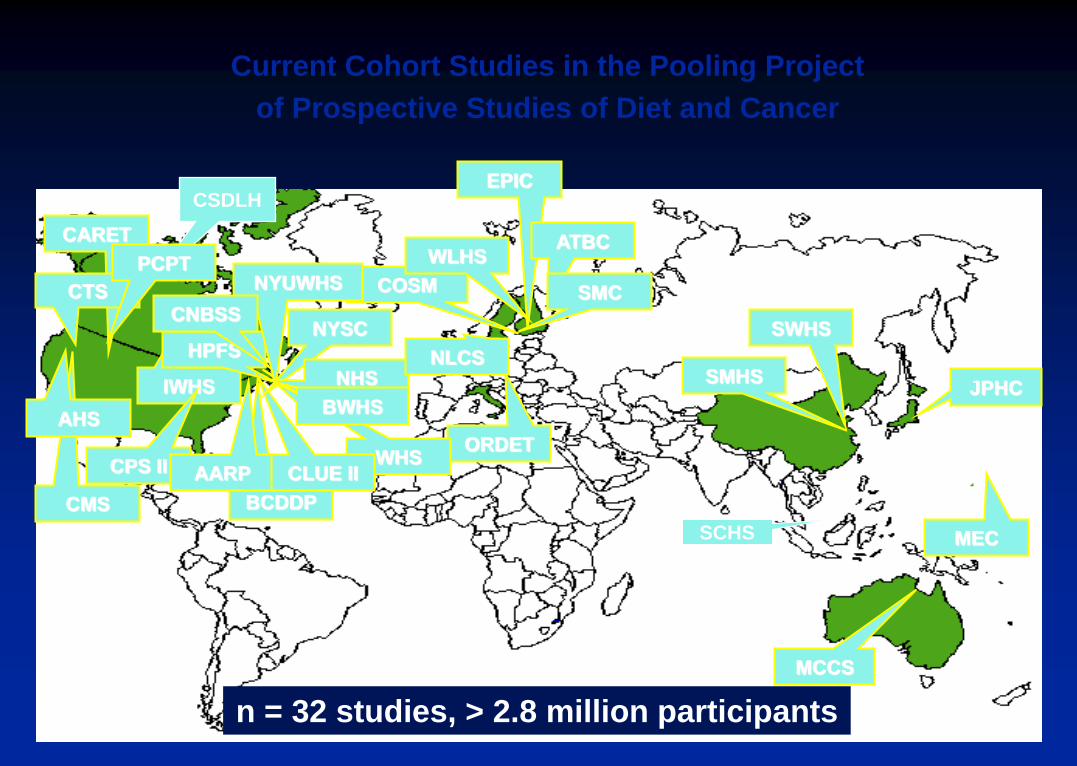
SMHS
EPIC
CMS
COSM
WLHS ATBC
SWHS
SMC
JPHC
MEC
ORDET
MCCS
IWHS
CPS II
BCDDP
HPFS
WHS AARP CLUE II
NYSC
NYUWHS
CNBSS
NHS NLCS
CARET
CTS
AHS
Current Cohort Studies in the Pooling Project
of Prospective Studies of Diet and Cancer
n = 32 studies, > 2.8 million participants
CSDLH
BWHS
PCPT
SCHS
8
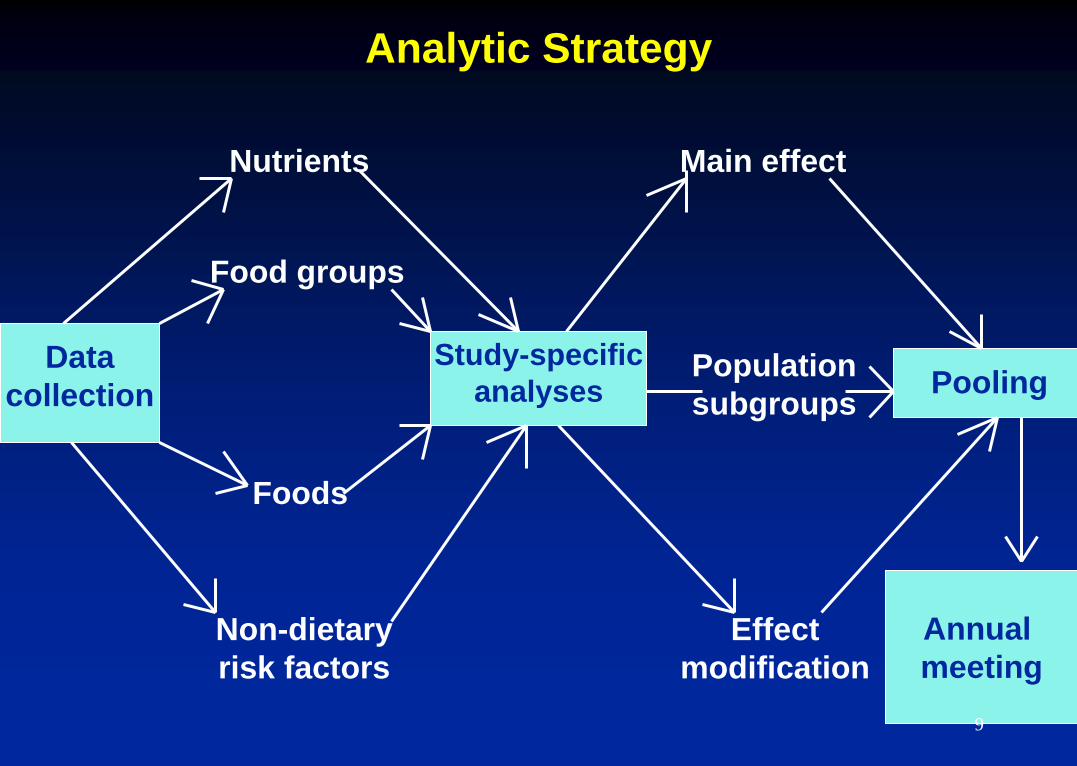
Analytic Strategy
Study-specific
analyses
Data
collection Pooling
Nutrients
Food groups
Foods
Non-dietary
risk factors
Main effect
Population
subgroups
Effect
modification
Annual
meeting
9
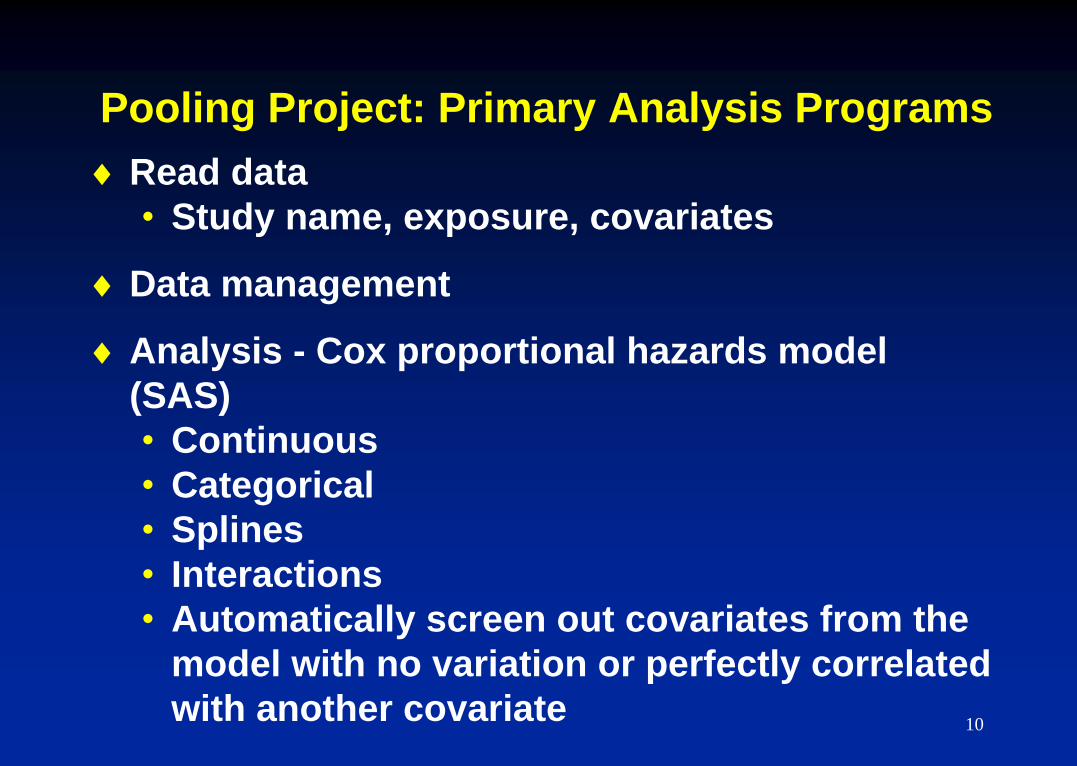
Pooling Project: Primary Analysis Programs
Read data
• Study name, exposure, covariates
Data management
Analysis - Cox proportional hazards model
(SAS)
• Continuous
• Categorical
• Splines
• Interactions
• Automatically screen out covariates from the
model with no variation or perfectly correlated
with another covariate 10
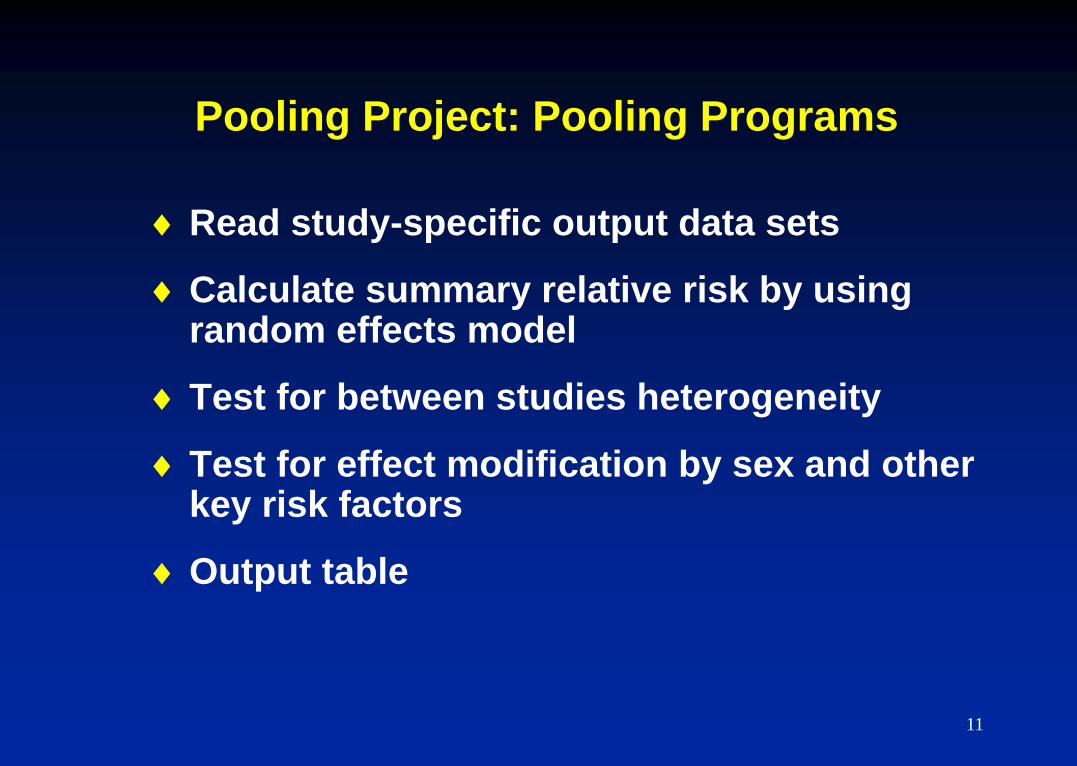
Pooling Project: Pooling Programs
Read study-specific output data sets
Calculate summary relative risk by using random effects model
Test for between studies heterogeneity
Test for effect modification by sex and other key risk factors
Output table
11
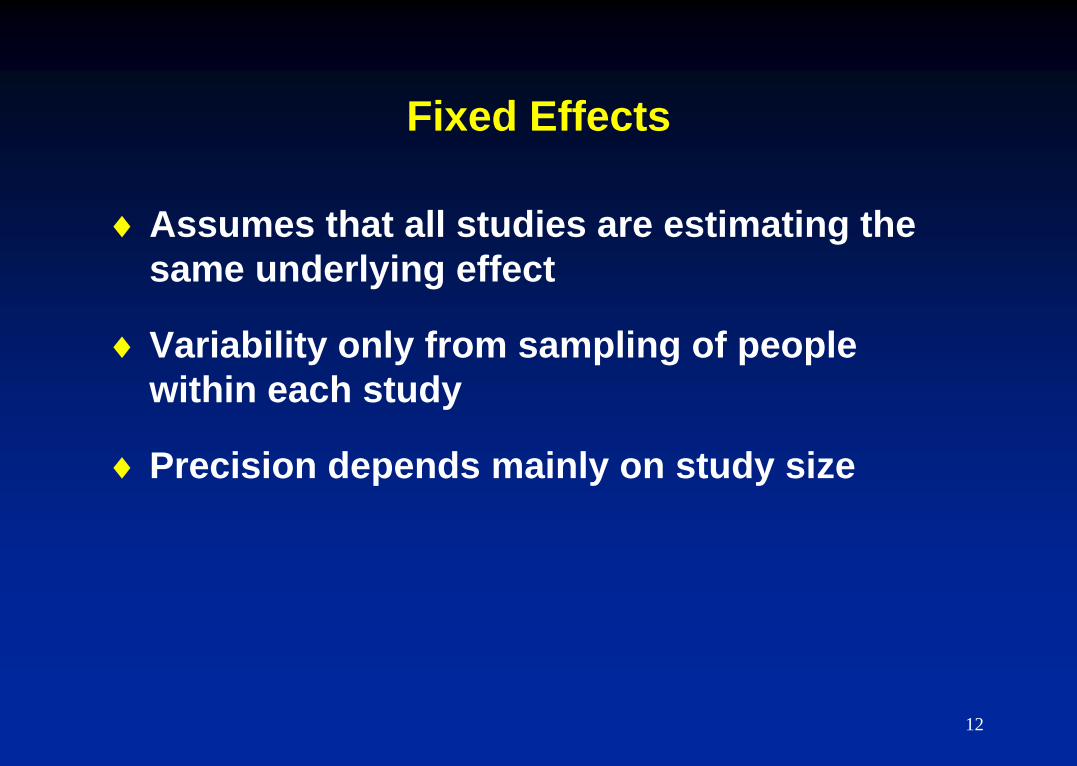
Fixed Effects
Assumes that all studies are estimating the
same underlying effect
Variability only from sampling of people
within each study
Precision depends mainly on study size
12
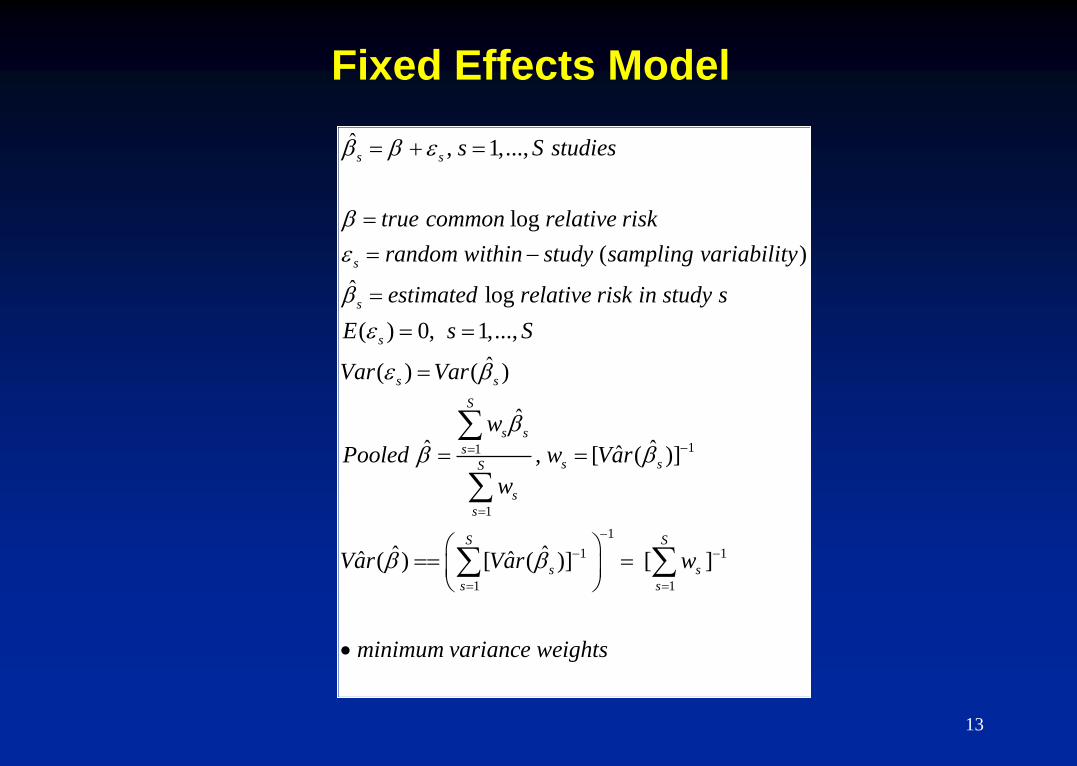
Fixed Effects Model
1
1
ˆ , 1,...,
log
( )
ˆ log
( ) 0, 1,...,
ˆ( ) ( )
ˆ
ˆ ˆˆ, [ (
s s
s
s
s
s s
S
s s
ssS
s
s
s S studies
true common relative risk
random within study sampling variability
estimated relative risk in study s
E s S
Var Var
w
Pooled w Var
w
1
1
1 1
1 1
)]
ˆ ˆˆ ˆ( ) [ ( )] [ ]
s
S S
s s
s s
Var Var w
minimum variance weights
13
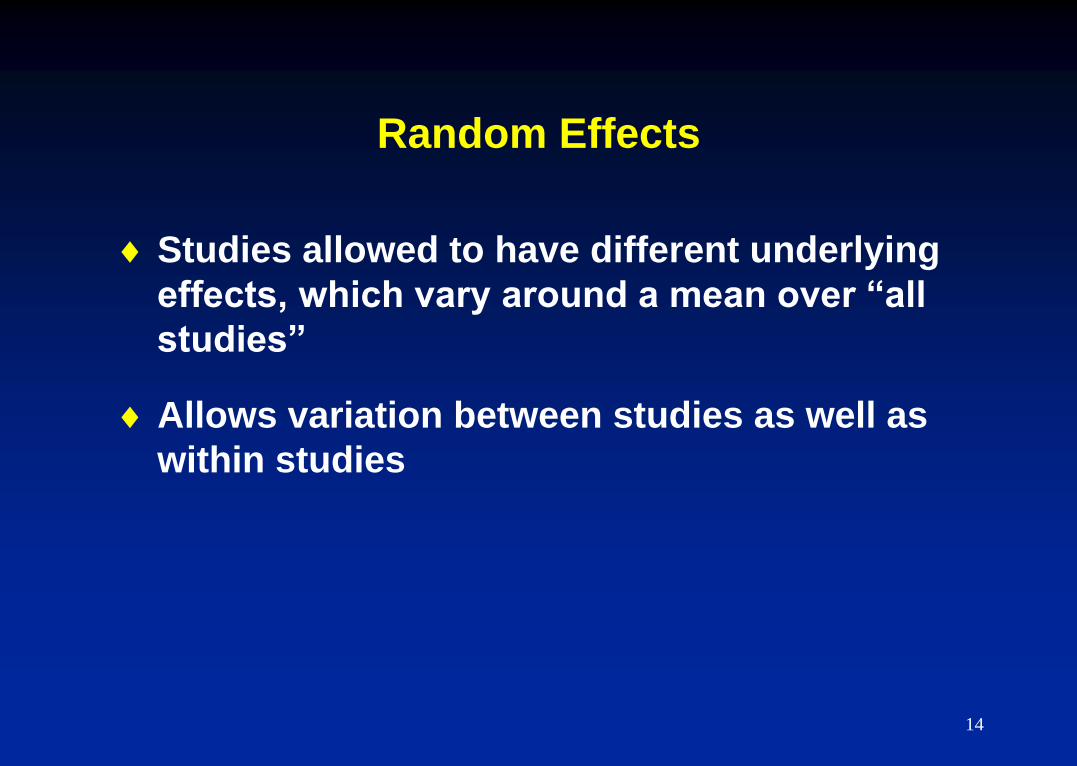
Random Effects
Studies allowed to have different underlying
effects, which vary around a mean over “all
studies”
Allows variation between studies as well as
within studies
14
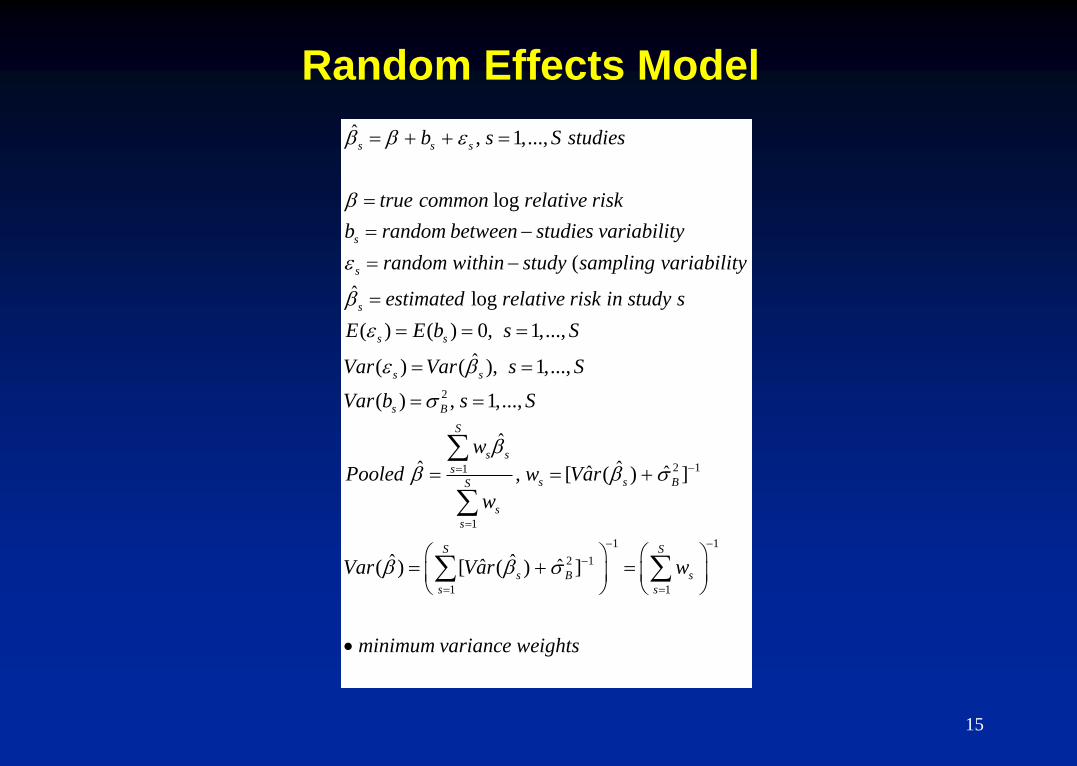
Random Effects Model
ˆ , 1,...,
log
(
ˆ log
( ) ( ) 0, 1,...,
( )
s s s
s
s
s
s s
s
b s S studies
true common relative risk
b random between studies variability
random within study sampling variability
estimated relative risk in study s
E E b s S
Var Va
2
2 11
1
1 1
2 1
1 1
ˆ( ), 1,...,
( ) , 1,...,
ˆ
ˆ ˆˆ ˆ, [ ( ) ]
ˆ ˆˆ ˆ( ) [ ( ) ]
s
s B
S
s s
ss s BS
s
s
S S
s B s
s s
r s S
Var b s S
w
Pooled w Var
w
Var Var w
minimum variance weights
15
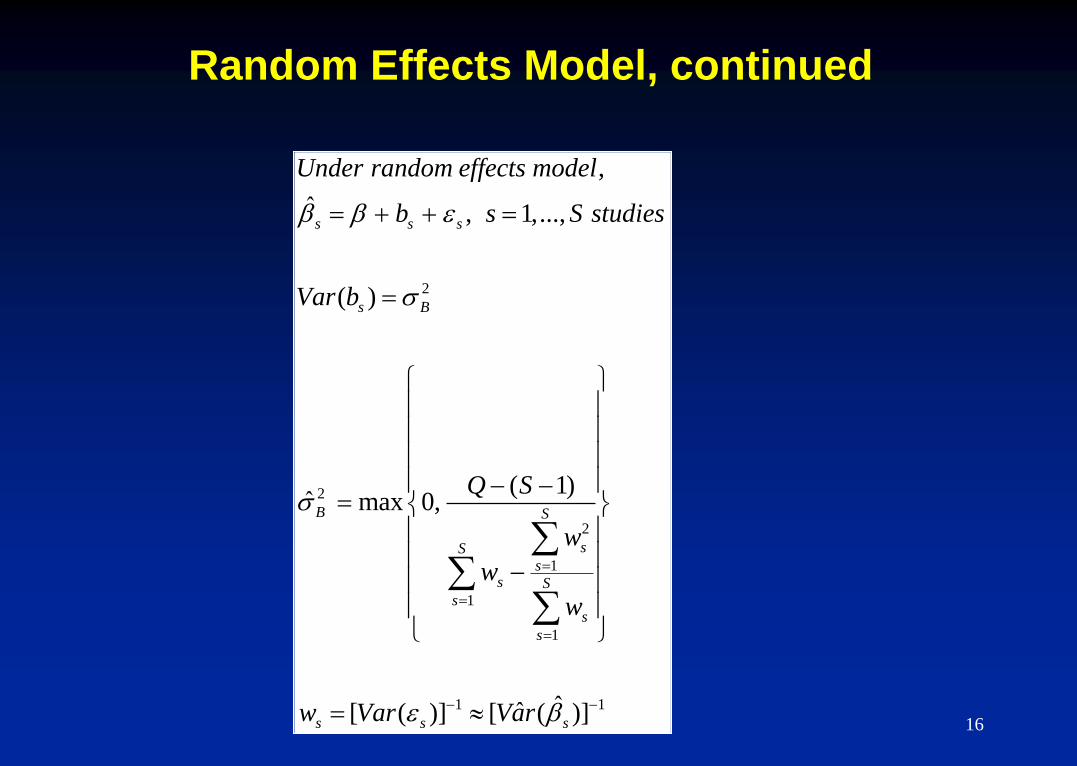
Random Effects Model, continued
2
2
2
1
1
1
1 1
,
ˆ , 1,...,
( )
( 1)ˆ max 0,
ˆˆ[ ( )] [ ( )]
s s s
s B
B S
sSs
s Ss
s
s
s s s
Under random effects model
b s S studies
Var b
Q S
w
w
w
w Var Var
16
Pooling Study-Specific Results vs.
Combining Primary Data into One Dataset
Difficult to distinguish population-specific differences
in true intake from artifactual differences due to
differences in dietary assessment methods
• exception: when the unit of measurement is standard
(e.g. alcohol, body mass index)
Pooling allows for study-specific differences of effects
of confounders (otherwise residual confounding in
aggregated analysis)
When there is no confounding or effect modification,
efficiency of 2 approaches is equivalent (Basagana,
http://cdn1.sph.harvard.edu/wp-content/uploads/sites/271/2012/08/optitxs-The-Design-of-Observational-
Longitudinal-Studies-APPENDIX.pdf, Appendix A.3) 17
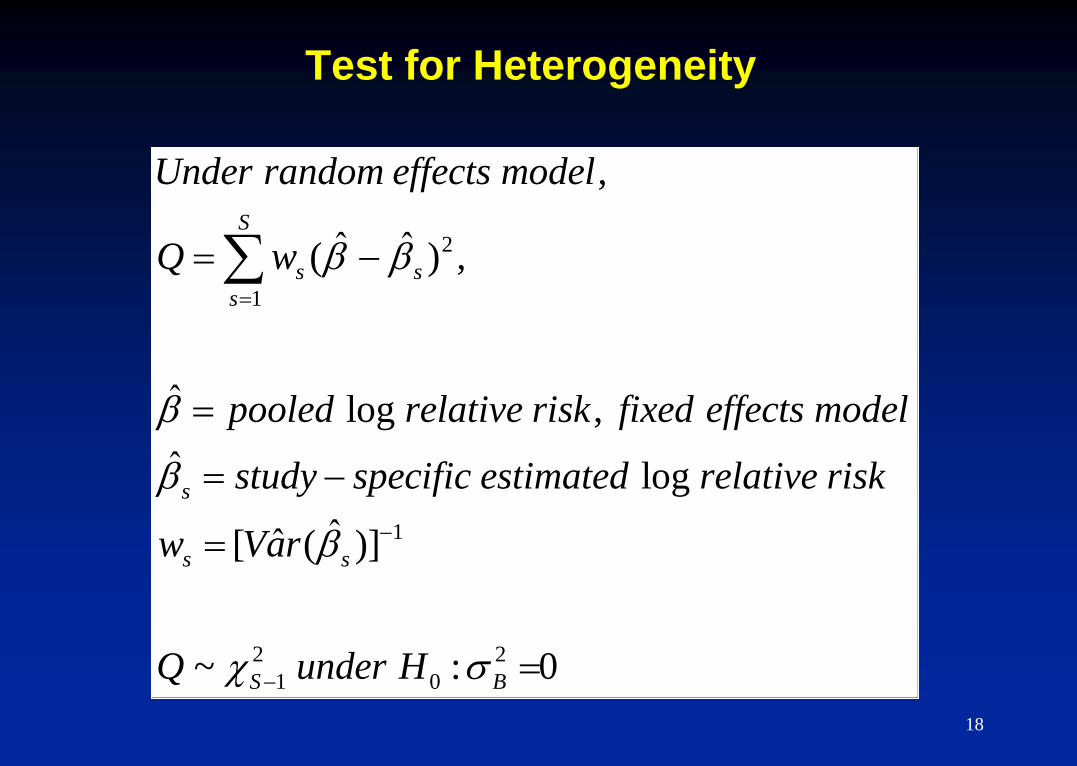
Test for Heterogeneity
2
1
1
2 2
1 0
,
ˆ ˆ( ) ,
ˆ log ,
ˆ log
ˆˆ[ ( )]
~ : 0
S
s s
s
s
s s
S B
Under random effects model
Q w
pooled relative risk fixed effects model
study specific estimated relative risk
w Var
Q under H
18
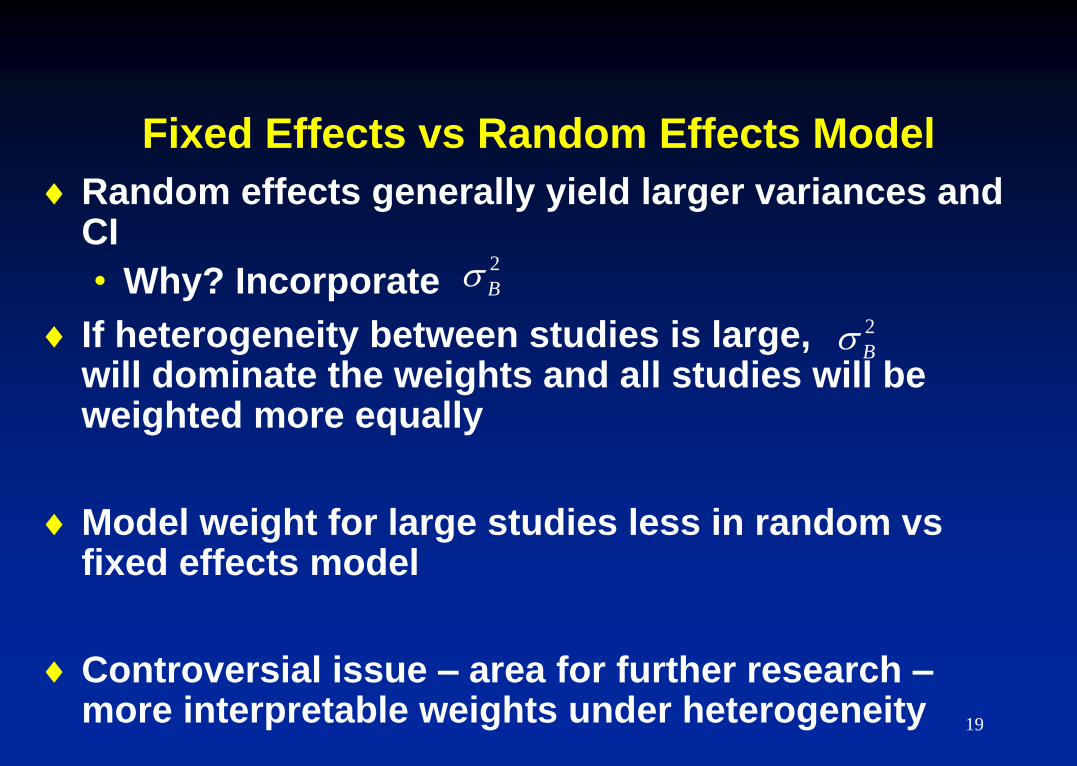
Fixed Effects vs Random Effects Model
Random effects generally yield larger variances and CI
• Why? Incorporate
If heterogeneity between studies is large,
will dominate the weights and all studies will be weighted more equally
Model weight for large studies less in random vs fixed effects model
Controversial issue – area for further research – more interpretable weights under heterogeneity
2
B
2
B
19
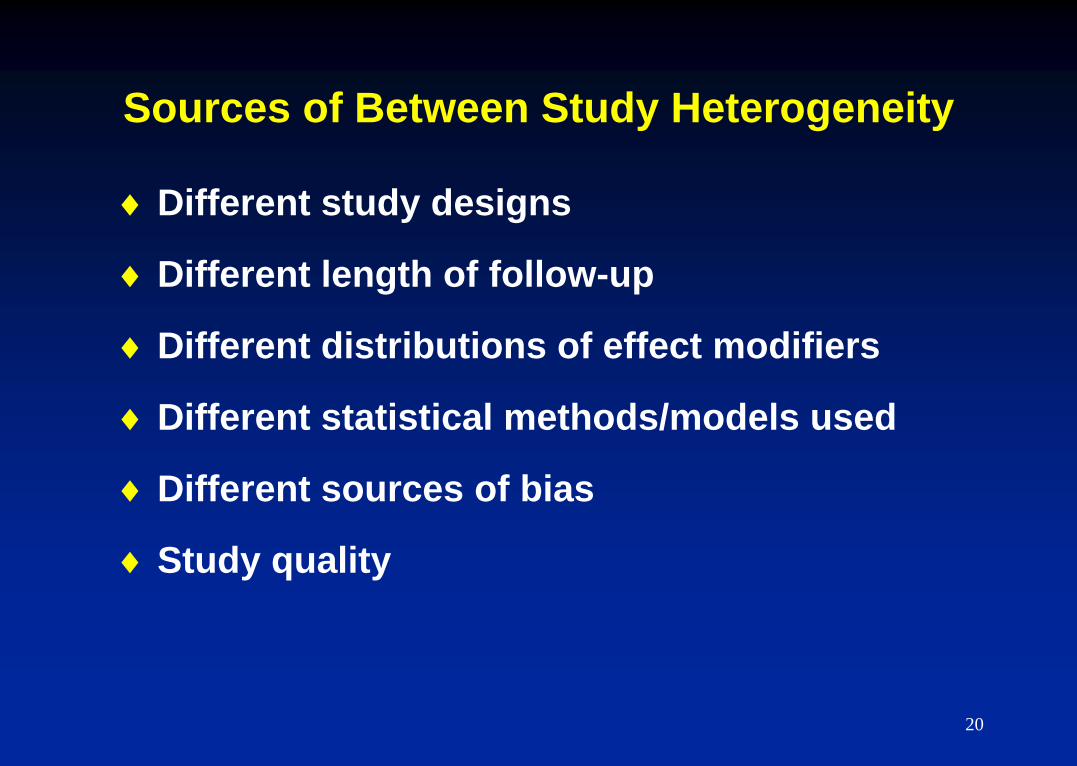
Sources of Between Study Heterogeneity
Different study designs
Different length of follow-up
Different distributions of effect modifiers
Different statistical methods/models used
Different sources of bias
Study quality
20
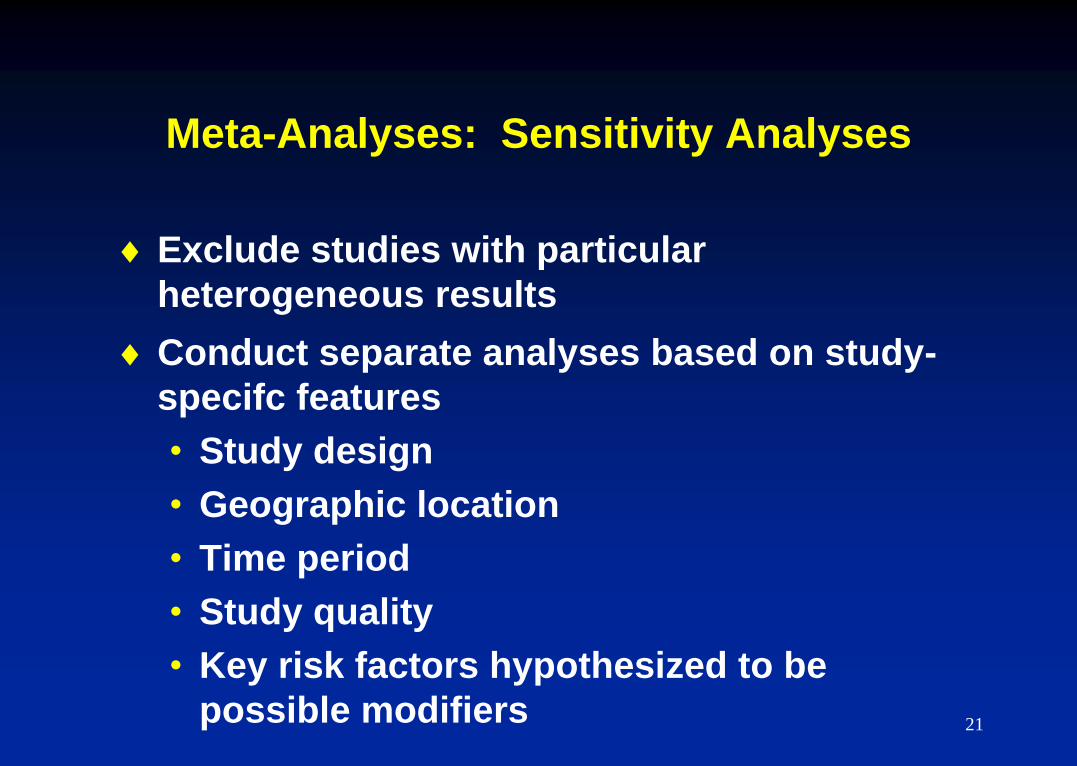
Meta-Analyses: Sensitivity Analyses
Exclude studies with particular
heterogeneous results
Conduct separate analyses based on study-
specifc features
• Study design
• Geographic location
• Time period
• Study quality
• Key risk factors hypothesized to be
possible modifiers 21
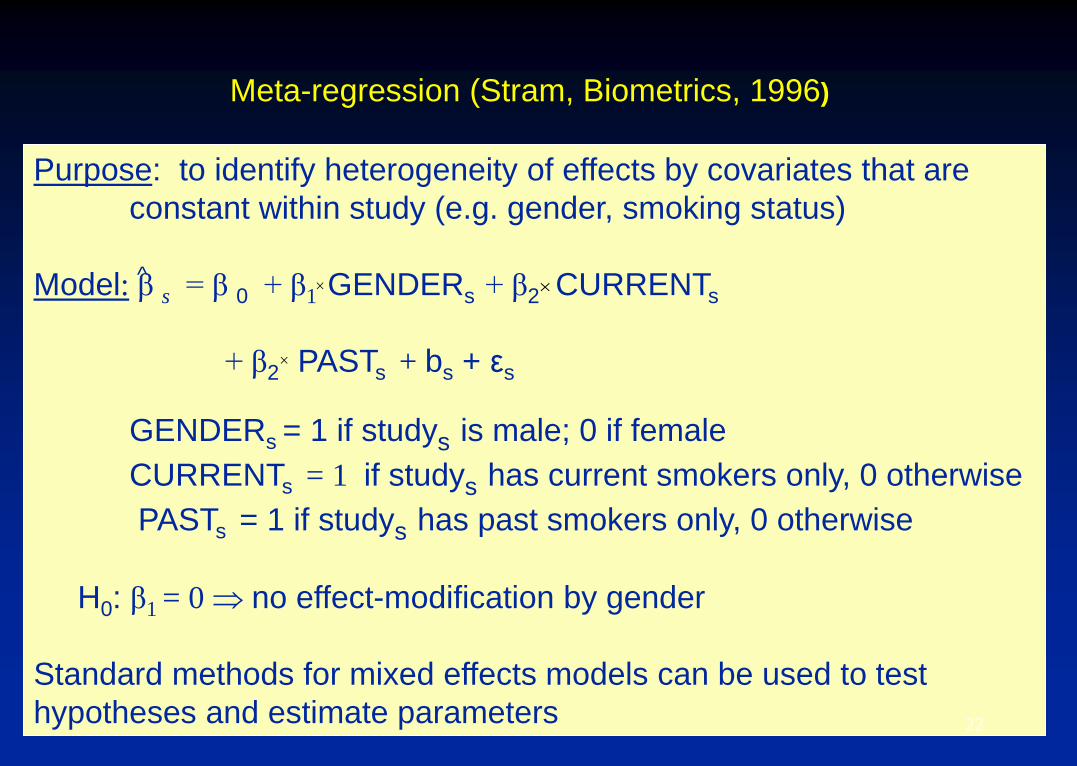
Meta-regression (Stram, Biometrics, 1996)
Purpose: to identify heterogeneity of effects by covariates that are
constant within study (e.g. gender, smoking status)
Model: β s = β 0 + β1 GENDERs + β2 CURRENTs
+ β2 PASTs + bs + εs
GENDERs = 1 if studys is male; 0 if female
CURRENTs = 1 if studys has current smokers only, 0 otherwise
PASTs = 1 if studys has past smokers only, 0 otherwise
H0: β1 = 0 no effect-modification by gender
Standard methods for mixed effects models can be used to test
hypotheses and estimate parameters
^
22

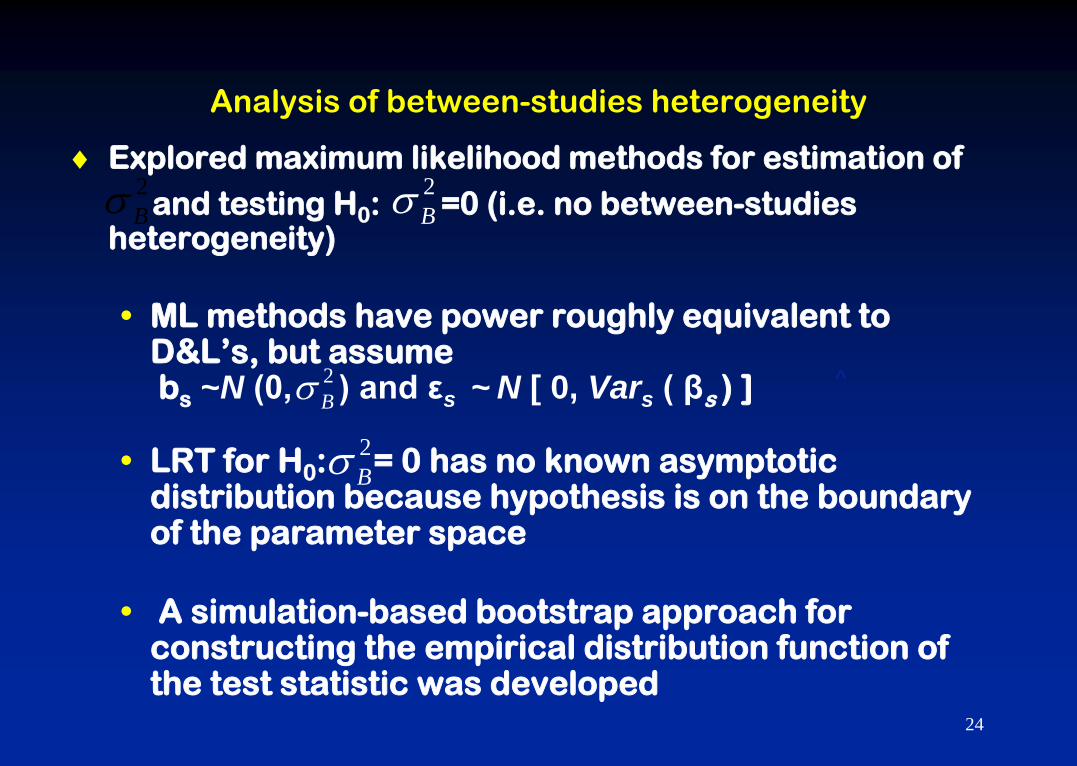
Analysis of between-studies heterogeneity
12
/ | |B BCV
23
Analysis of between-studies heterogeneity
Explored maximum likelihood methods for estimation of
and testing H0: =0 (i.e. no between-studies heterogeneity)
• ML methods have power roughly equivalent to D&L’s, but assume bs ~N (0, ) and εs ~
N [ 0, Vars ( βs ) ]
• LRT for H0: = 0 has no known asymptotic distribution because hypothesis is on the boundary of the parameter space
• A simulation-based bootstrap approach for constructing the empirical distribution function of the test statistic was developed
14
^
2
B
2
B
2
B
2
B
24

Quantification of heterogeneity
1
^
2 2 2 2
1
ˆ/ [ ( ) / ] ( ) /S
B B s
s
R Var S I Q df Q
/ | |B BCV
25
Q
LRT‡
Q*
LRT*
2-
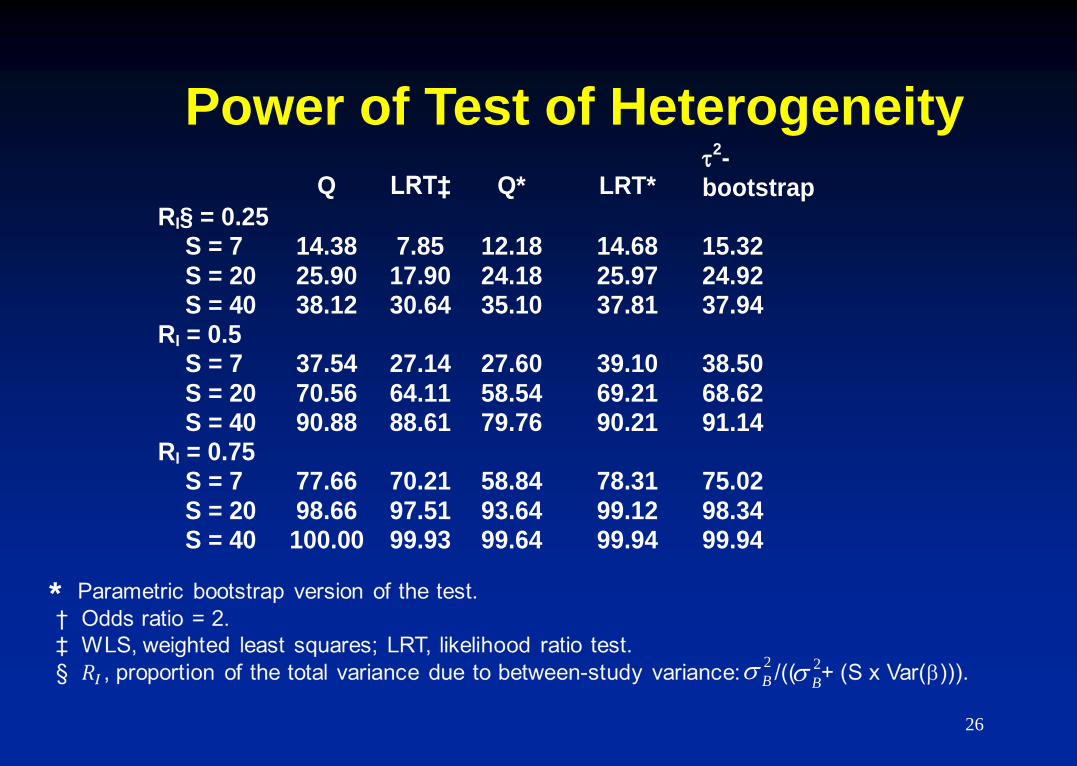
bootstrap RI§ = 0.25 S = 7 S = 20 S = 40
14.38 25.90 38.12
7.85
17.90 30.64
12.18 24.18 35.10
14.68 25.97 37.81
15.32 24.92 37.94
RI = 0.5 S = 7 S = 20 S = 40
37.54 70.56 90.88
27.14 64.11 88.61
27.60 58.54 79.76
39.10 69.21 90.21
38.50 68.62 91.14
RI = 0.75 S = 7 S = 20 S = 40
77.66 98.66 100.00
70.21 97.51 99.93
58.84 93.64 99.64
78.31 99.12 99.94
75.02 98.34 99.94
Power of Test of Heterogeneity
13
2
B 2
B
26
*
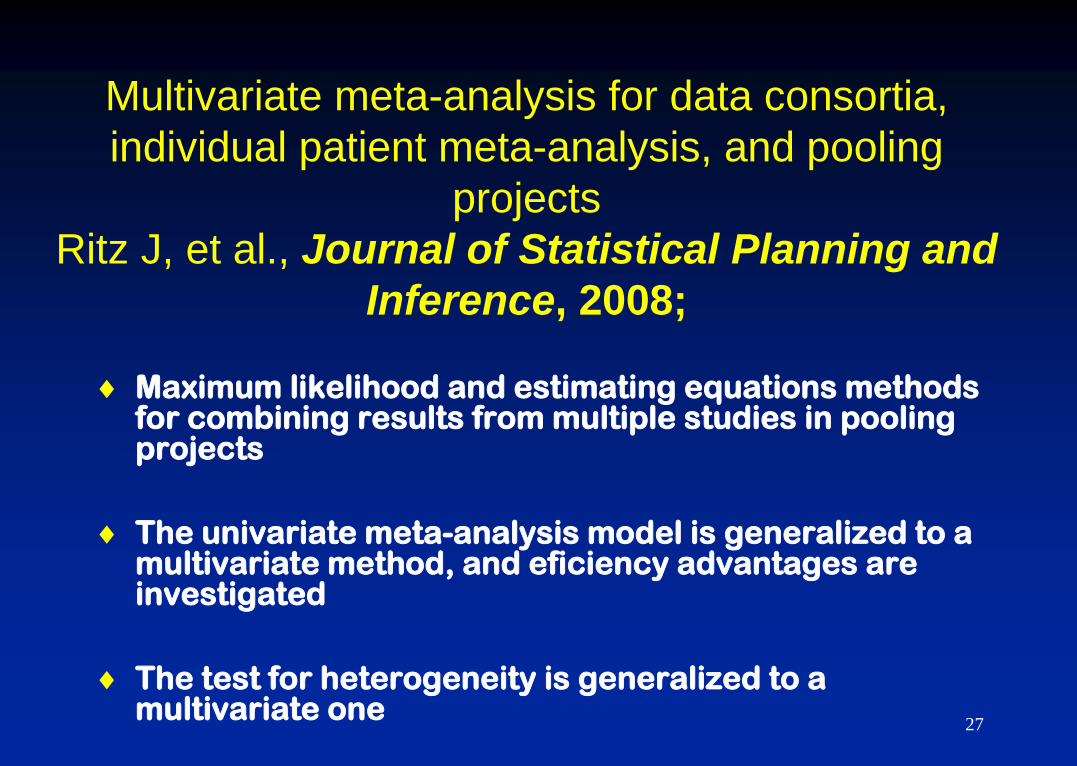
Multivariate meta-analysis for data consortia,
individual patient meta-analysis, and pooling
projects
Ritz J, et al., Journal of Statistical Planning and
Inference, 2008;
Maximum likelihood and estimating equations methods for combining results from multiple studies in pooling projects
The univariate meta-analysis model is generalized to a multivariate method, and eficiency advantages are investigated
The test for heterogeneity is generalized to a multivariate one
4 27
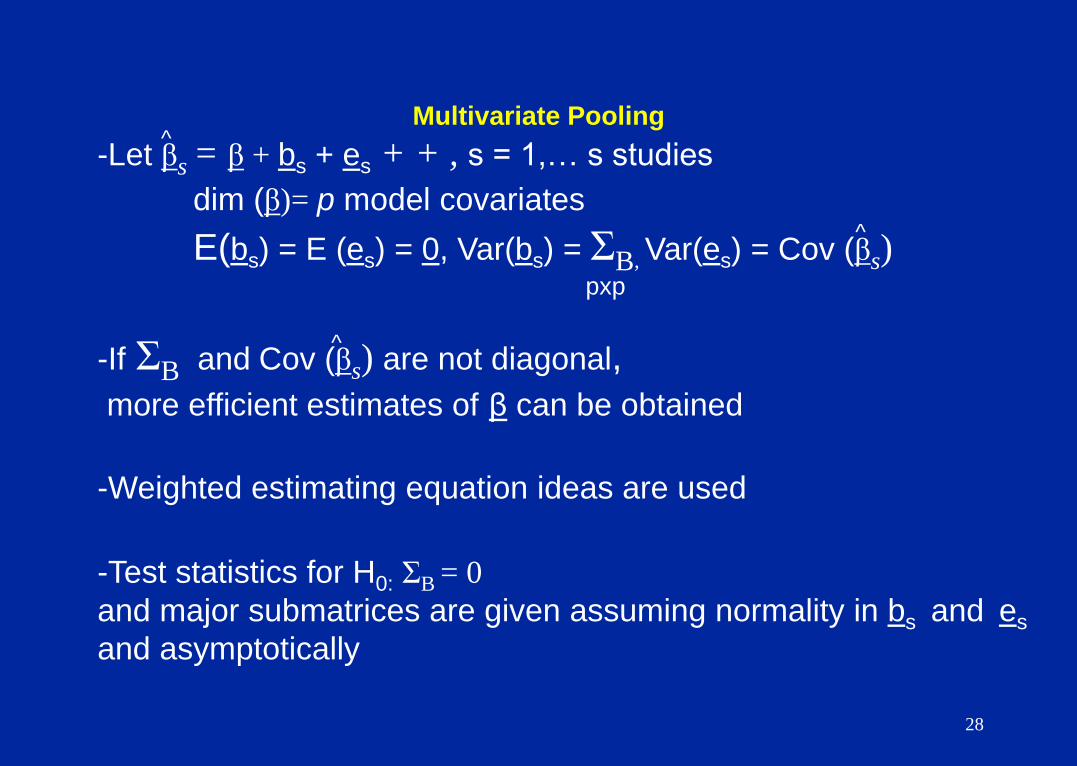
Multivariate Pooling
-Let βs = β + bs + es + + , s = 1,… s studies
dim (β)= p model covariates
E(bs) = E (es) = 0, Var(bs) = ΣB, Var(es) = Cov (βs)
pxp
-If ΣB and Cov (βs) are not diagonal,
more efficient estimates of β can be obtained
-Weighted estimating equation ideas are used
-Test statistics for H0: ΣB = 0
and major submatrices are given assuming normality in bs and es
and asymptotically
^
^
^
28

6 29
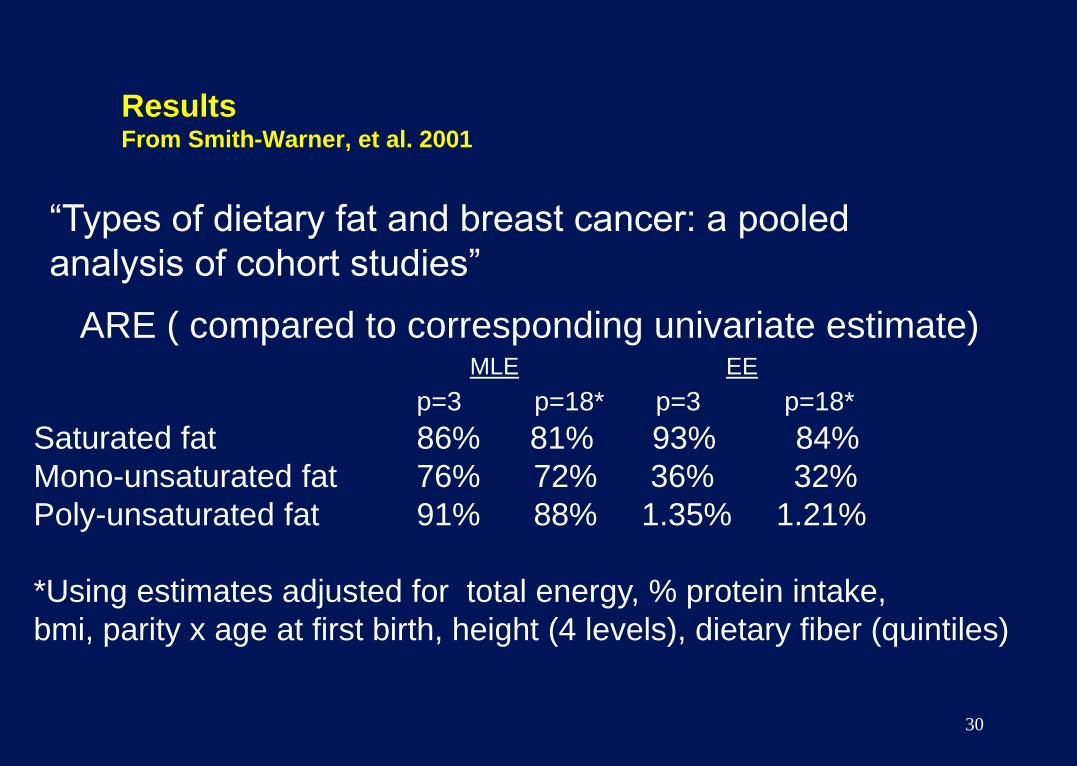
Results From Smith-Warner, et al. 2001
“Types of dietary fat and breast cancer: a pooled
analysis of cohort studies”
ARE ( compared to corresponding univariate estimate)
p=3 p=18* p=3 p=18*
Saturated fat 86% 81% 93% 84%
Mono-unsaturated fat 76% 72% 36% 32%
Poly-unsaturated fat 91% 88% 1.35% 1.21%
*Using estimates adjusted for total energy, % protein intake,
bmi, parity x age at first birth, height (4 levels), dietary fiber (quintiles)
MLE EE
30
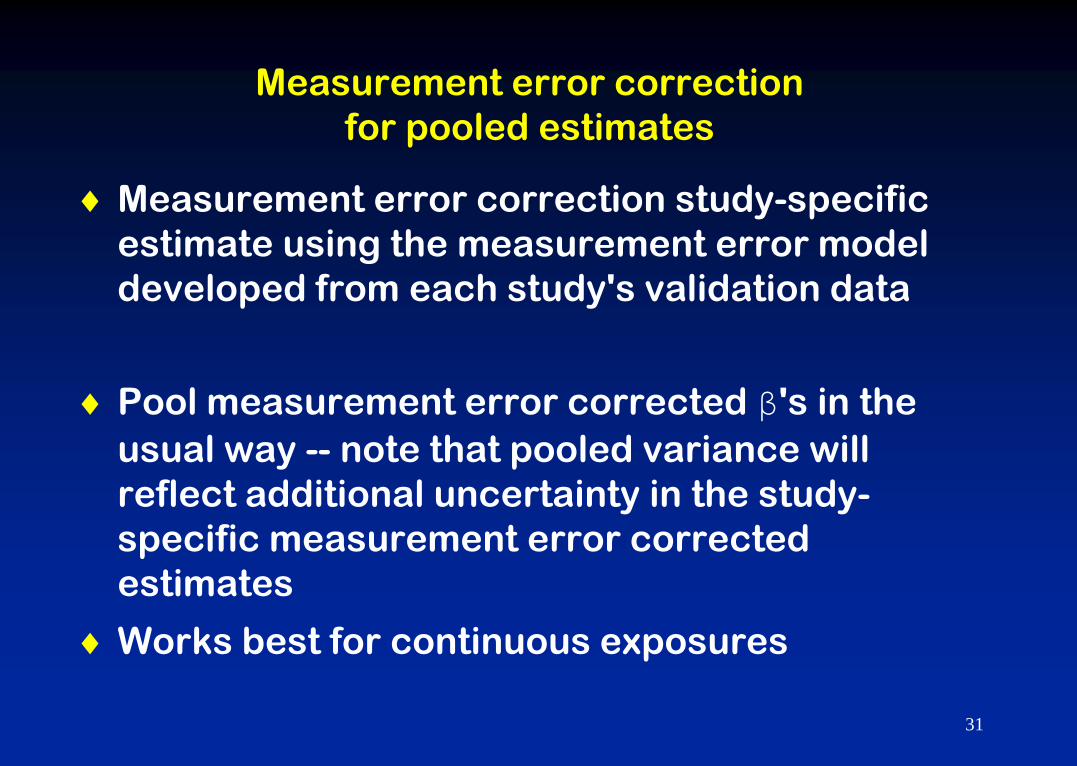
Measurement error correction
for pooled estimates
Measurement error correction study-specific
estimate using the measurement error model
developed from each study's validation data
Pool measurement error corrected β's in the
usual way -- note that pooled variance will
reflect additional uncertainty in the study-
specific measurement error corrected
estimates
Works best for continuous exposures
17 31
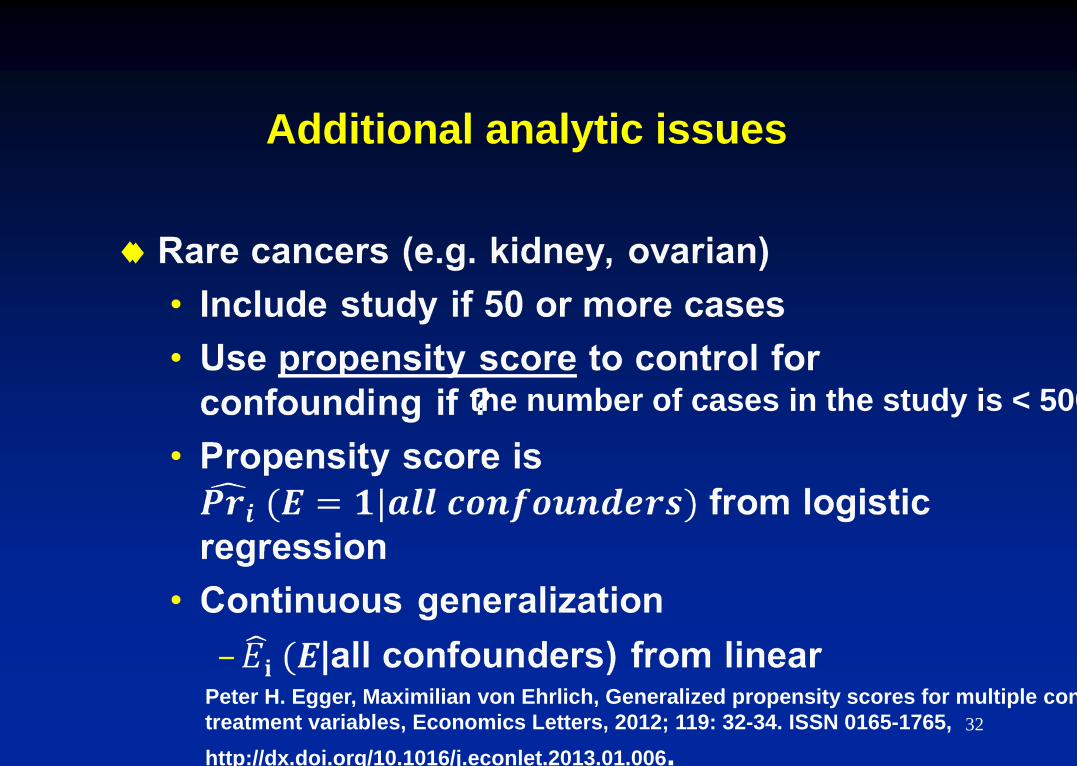
Additional analytic issues
the number of cases in the study is < 500
32
Peter H. Egger, Maximilian von Ehrlich, Generalized propensity scores for multiple continuous
treatment variables, Economics Letters, 2012; 119: 32-34. ISSN 0165-1765,
http://dx.doi.org/10.1016/j.econlet.2013.01.006.
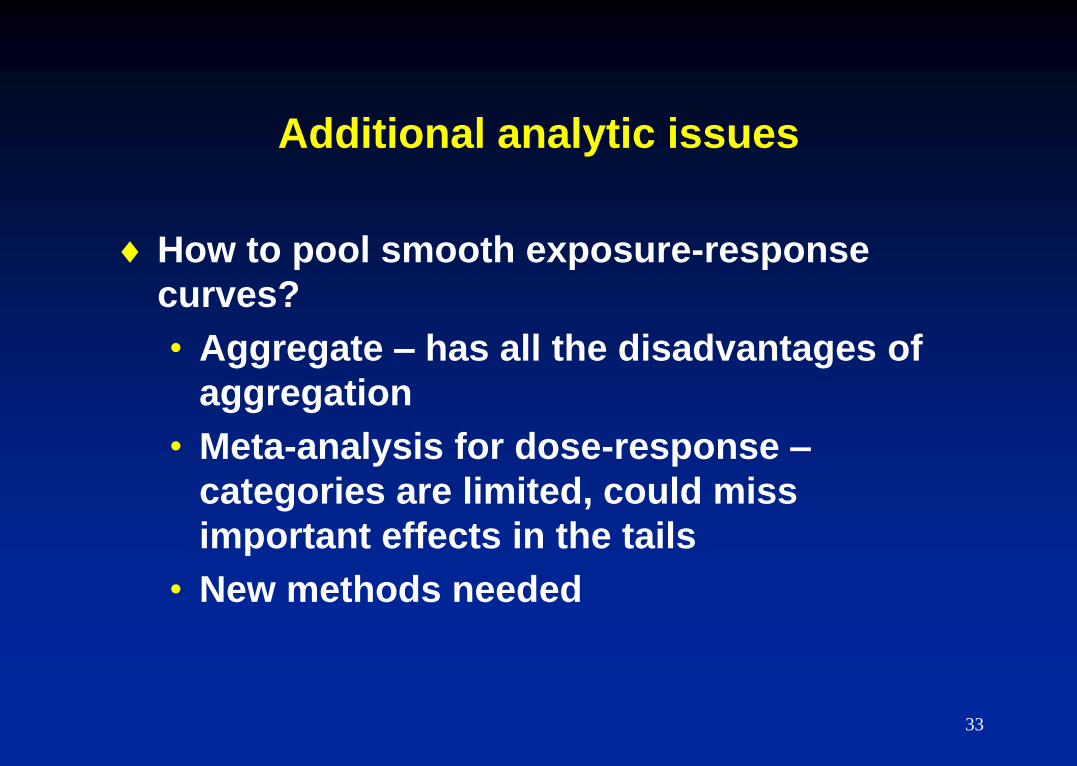
Additional analytic issues
How to pool smooth exposure-response
curves?
• Aggregate – has all the disadvantages of
aggregation
• Meta-analysis for dose-response –
categories are limited, could miss
important effects in the tails
• New methods needed
33
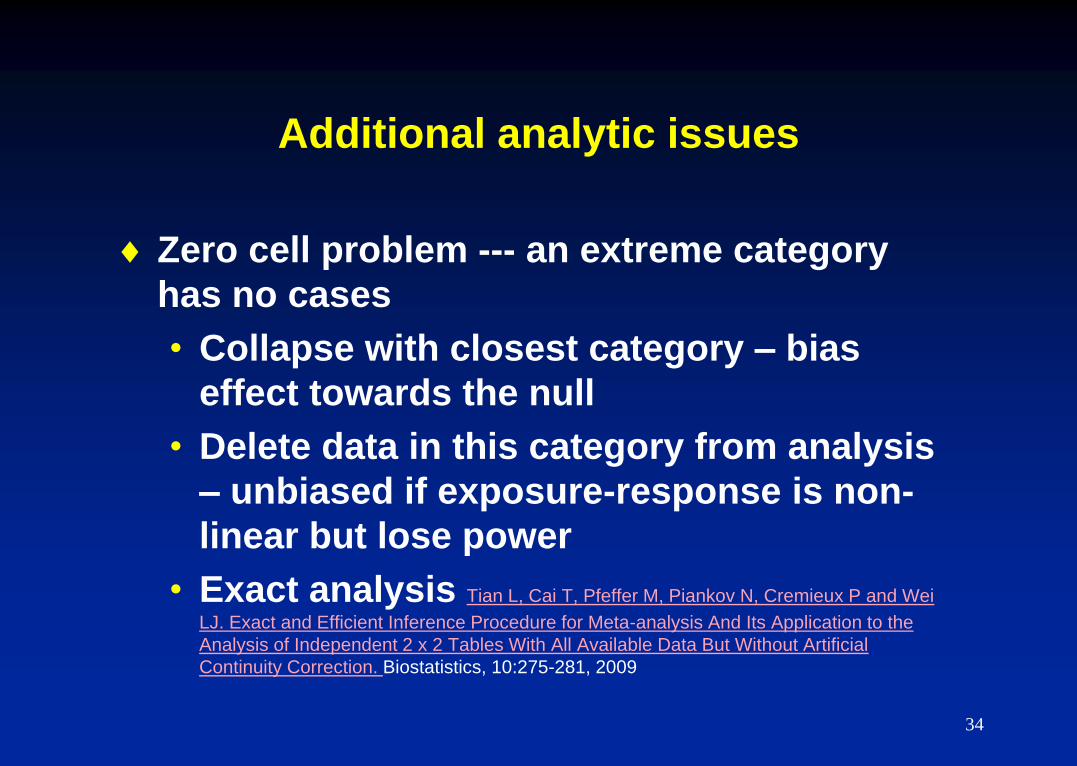
Additional analytic issues
Zero cell problem --- an extreme category
has no cases
• Collapse with closest category – bias
effect towards the null
• Delete data in this category from analysis
– unbiased if exposure-response is non-
linear but lose power
• Exact analysis Tian L, Cai T, Pfeffer M, Piankov N, Cremieux P and Wei
LJ. Exact and Efficient Inference Procedure for Meta-analysis And Its Application to the
Analysis of Independent 2 x 2 Tables With All Available Data But Without Artificial
Continuity Correction. Biostatistics, 10:275-281, 2009
34
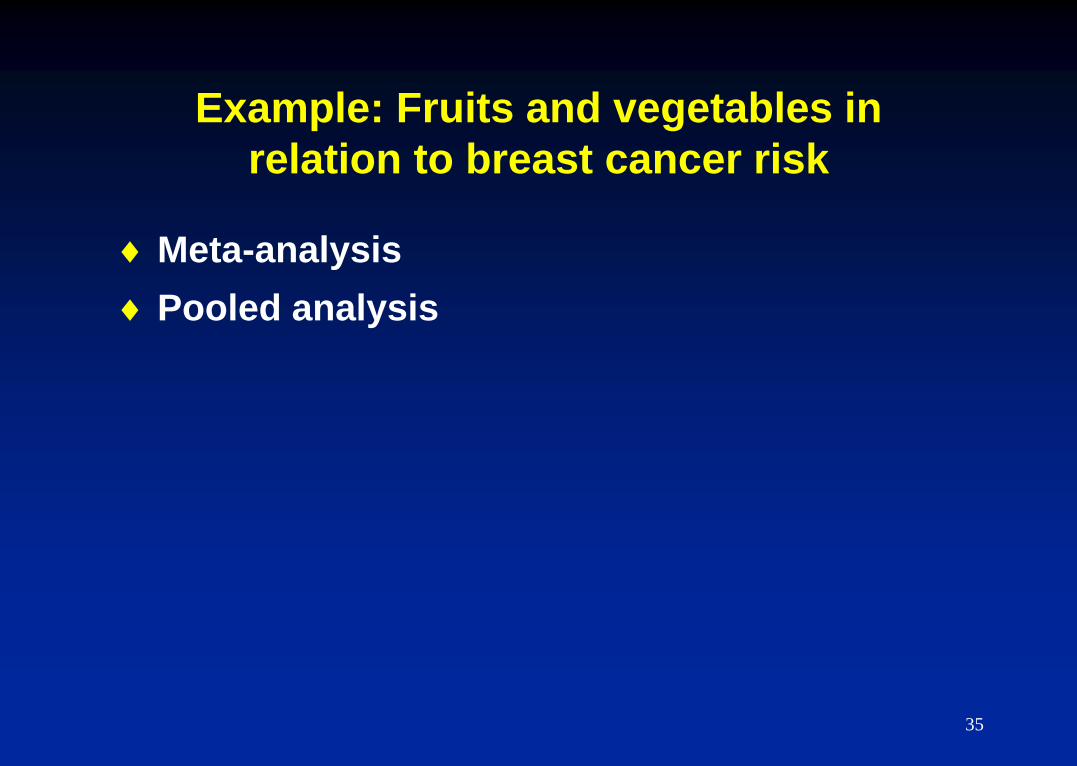
Example: Fruits and vegetables in
relation to breast cancer risk
Meta-analysis
Pooled analysis
35
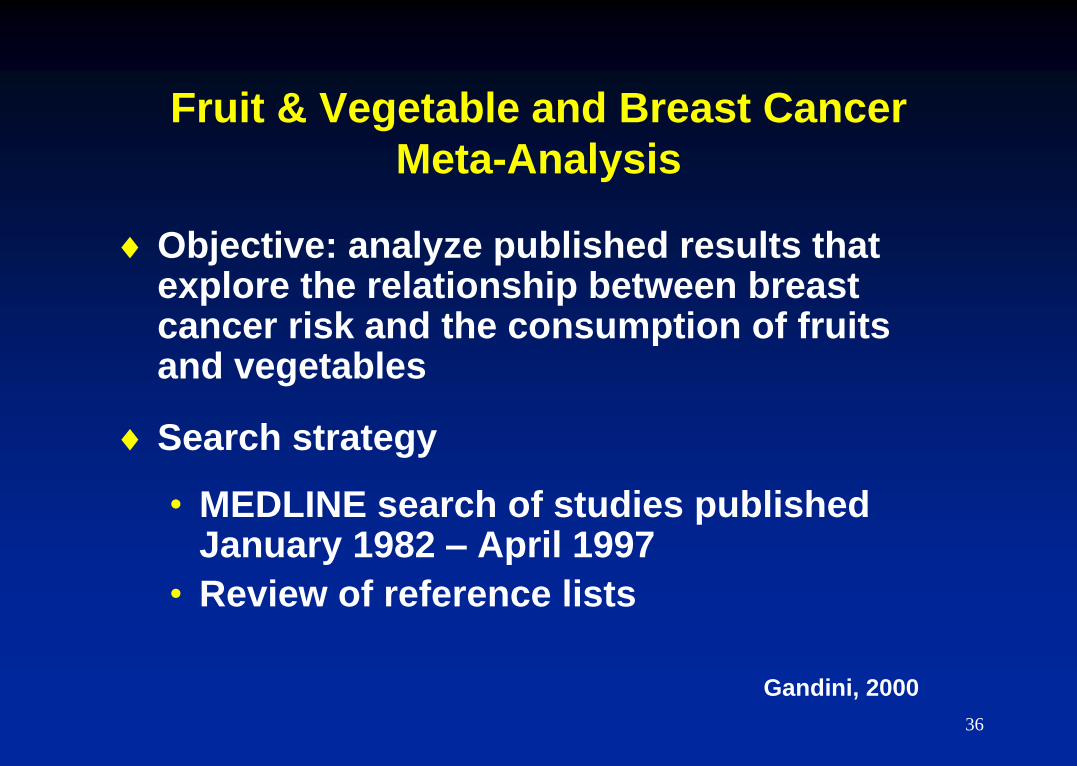
Fruit & Vegetable and Breast Cancer
Meta-Analysis
Objective: analyze published results that explore the relationship between breast cancer risk and the consumption of fruits and vegetables
Search strategy
• MEDLINE search of studies published January 1982 – April 1997
• Review of reference lists
Gandini, 2000
36
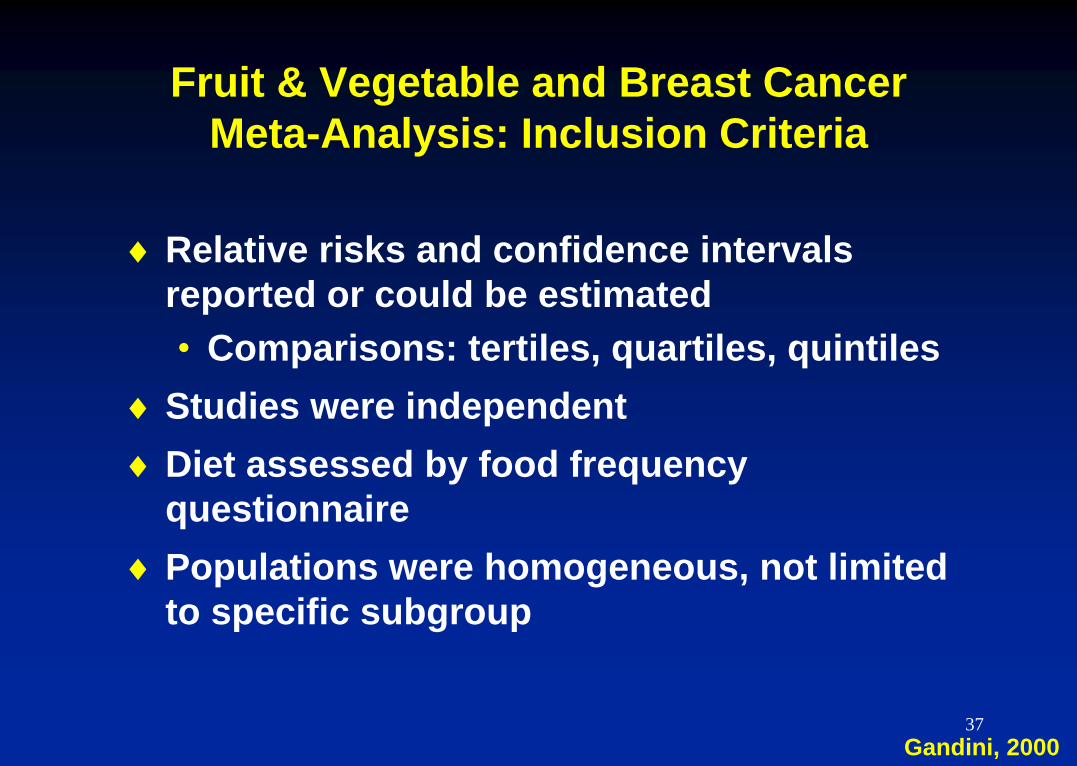
Fruit & Vegetable and Breast Cancer
Meta-Analysis: Inclusion Criteria
Relative risks and confidence intervals
reported or could be estimated
• Comparisons: tertiles, quartiles, quintiles
Studies were independent
Diet assessed by food frequency
questionnaire
Populations were homogeneous, not limited
to specific subgroup
Gandini, 2000 37
Fruit & Vegetable and Breast Cancer
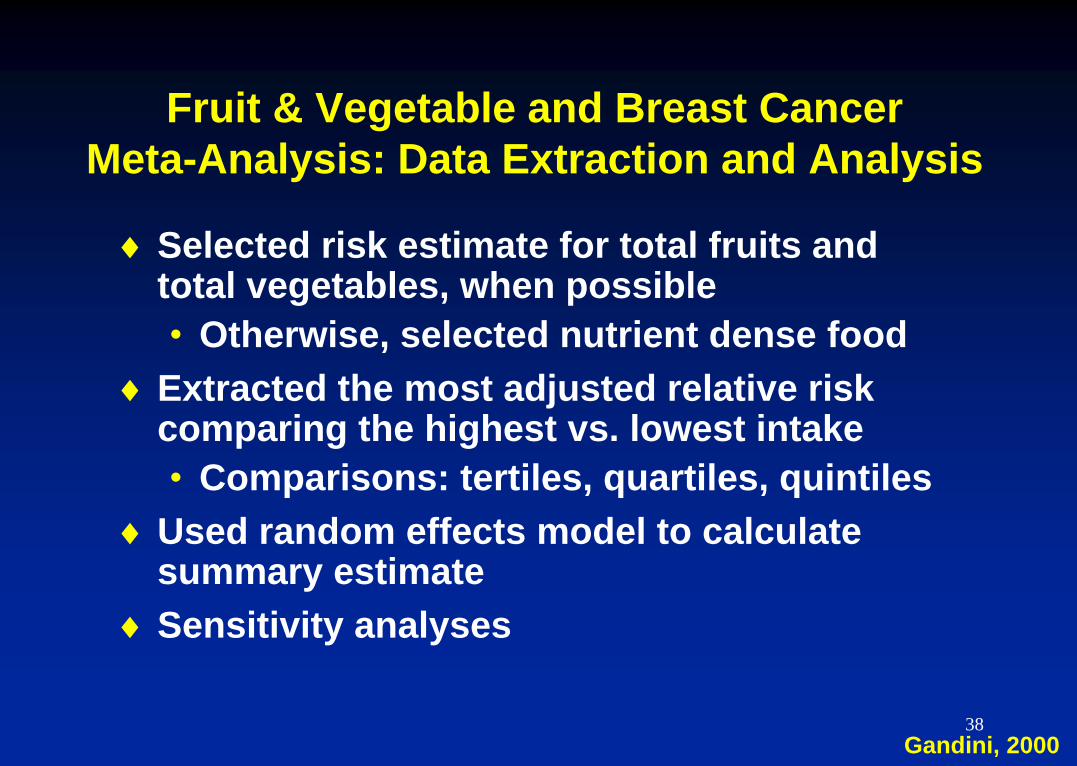
Meta-Analysis: Data Extraction and Analysis
Selected risk estimate for total fruits and total vegetables, when possible
• Otherwise, selected nutrient dense food
Extracted the most adjusted relative risk comparing the highest vs. lowest intake
• Comparisons: tertiles, quartiles, quintiles
Used random effects model to calculate summary estimate
Sensitivity analyses
Gandini, 2000 38
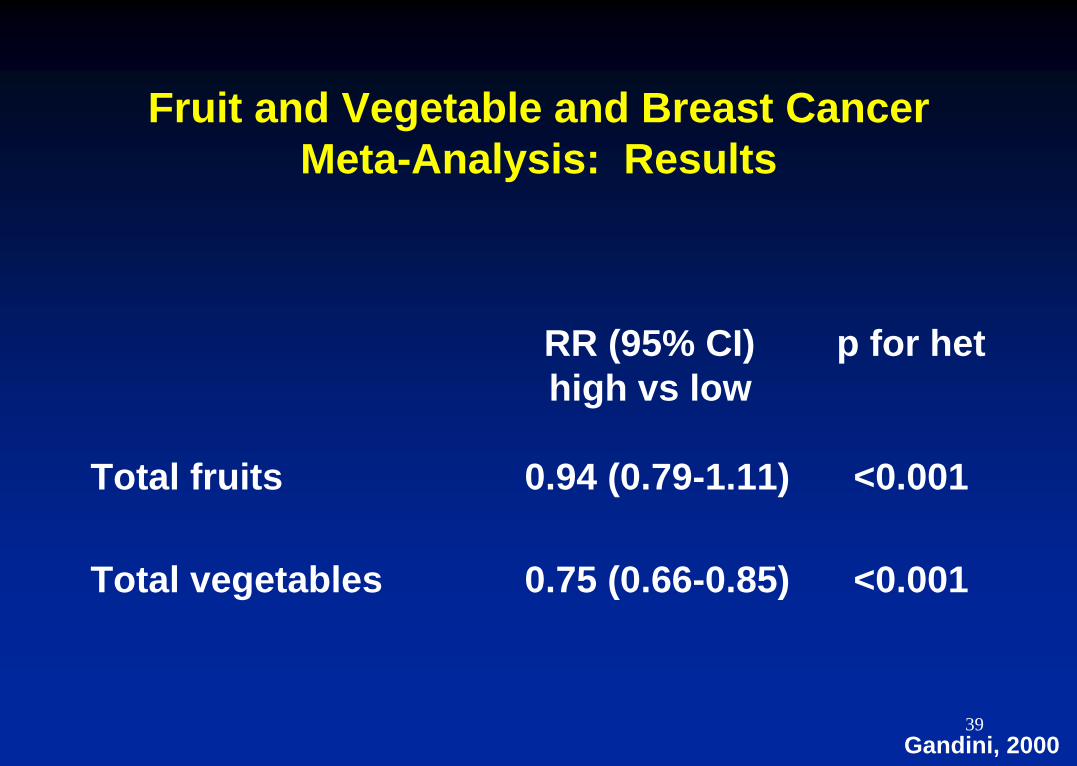
Fruit and Vegetable and Breast Cancer
Meta-Analysis: Results
RR (95% CI) p for het
high vs low
Total fruits 0.94 (0.79-1.11) <0.001
Total vegetables 0.75 (0.66-0.85) <0.001
Gandini, 2000 39
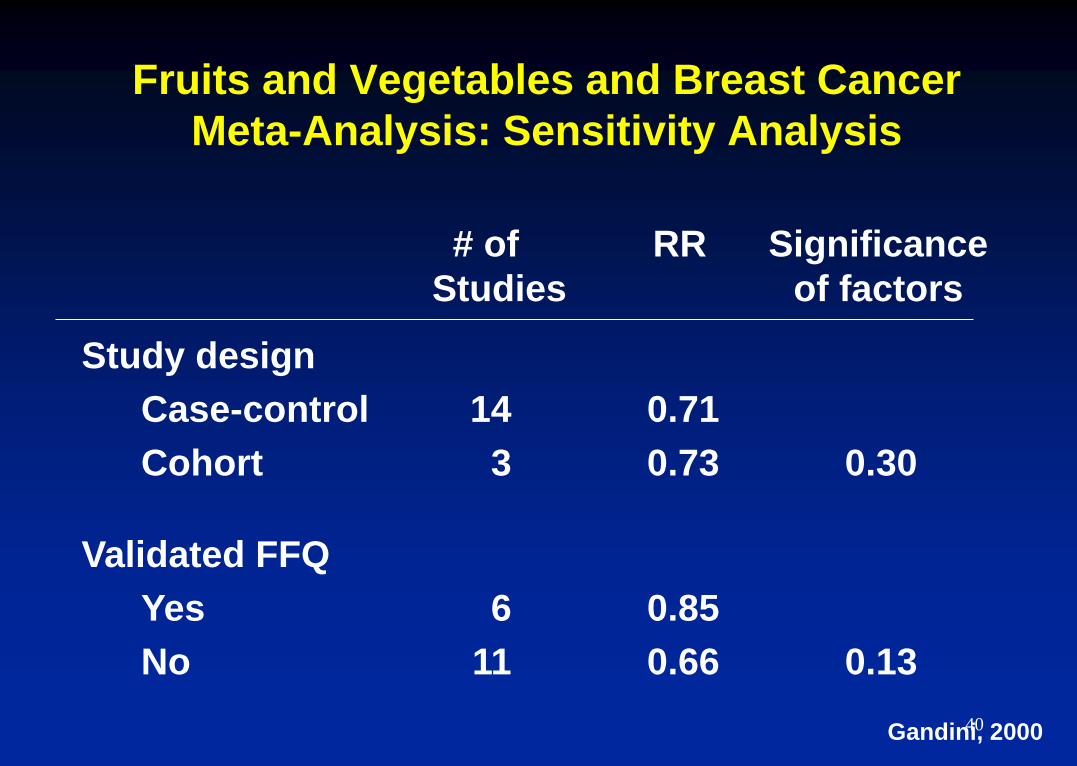
Fruits and Vegetables and Breast Cancer
Meta-Analysis: Sensitivity Analysis
# of RR Significance
Studies of factors
Study design
Case-control 14 0.71
Cohort 3 0.73 0.30
Validated FFQ
Yes 6 0.85
No 11 0.66 0.13
Gandini, 2000 40
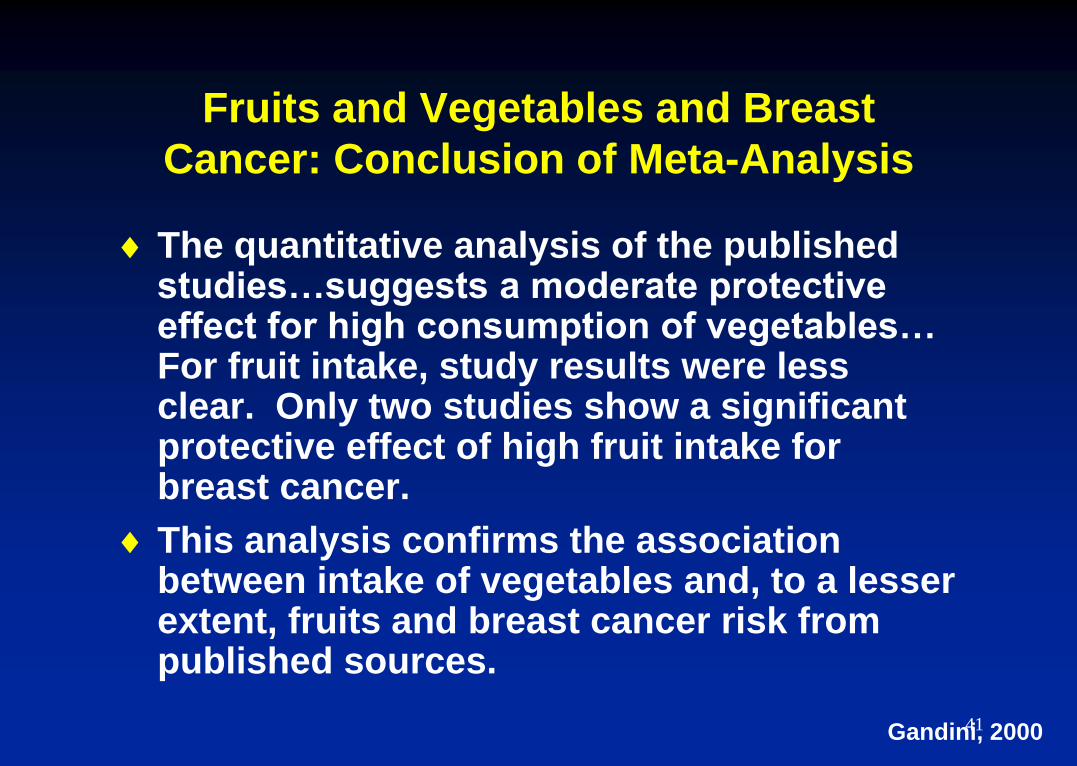
Fruits and Vegetables and Breast
Cancer: Conclusion of Meta-Analysis
The quantitative analysis of the published studies…suggests a moderate protective effect for high consumption of vegetables… For fruit intake, study results were less clear. Only two studies show a significant protective effect of high fruit intake for breast cancer.
This analysis confirms the association between intake of vegetables and, to a lesser extent, fruits and breast cancer risk from published sources.
Gandini, 2000 41
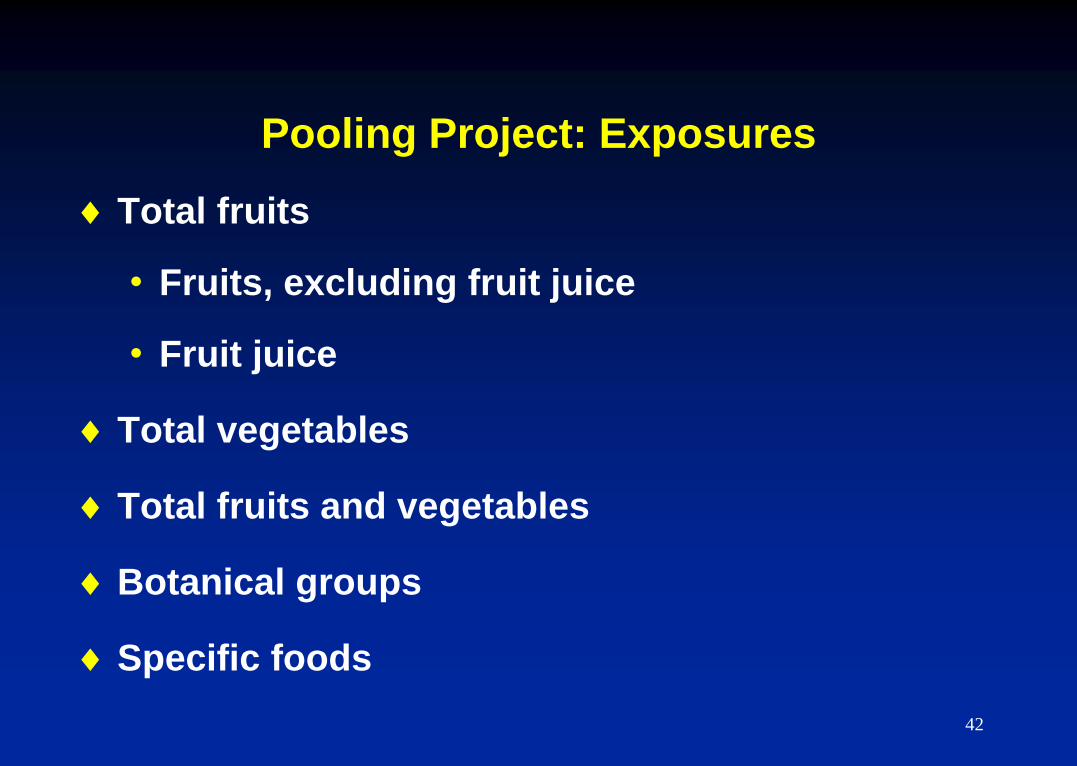
Pooling Project: Exposures
Total fruits
• Fruits, excluding fruit juice
• Fruit juice
Total vegetables
Total fruits and vegetables
Botanical groups
Specific foods
42
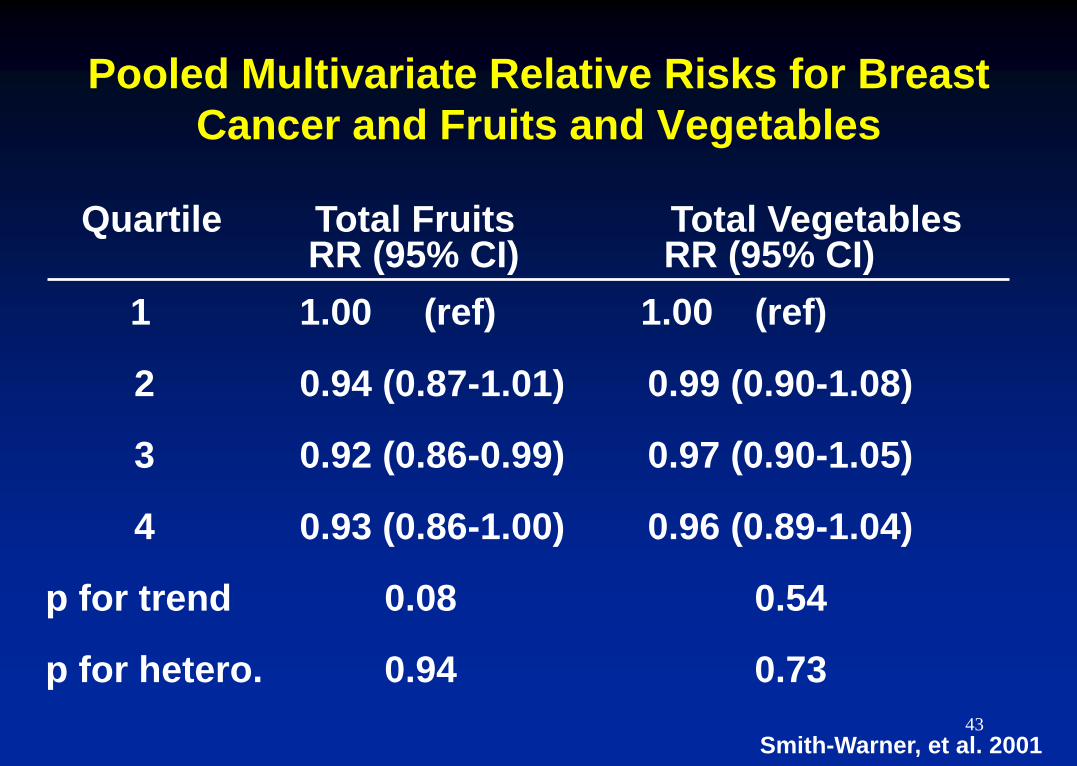
Pooled Multivariate Relative Risks for Breast
Cancer and Fruits and Vegetables
1 1.00 (ref) 1.00 (ref)
2 0.94 (0.87-1.01) 0.99 (0.90-1.08)
3 0.92 (0.86-0.99) 0.97 (0.90-1.05)
4 0.93 (0.86-1.00) 0.96 (0.89-1.04)
p for trend 0.08 0.54
p for hetero. 0.94 0.73
Quartile Total Fruits Total Vegetables RR (95% CI) RR (95% CI)
Smith-Warner, et al. 2001 43
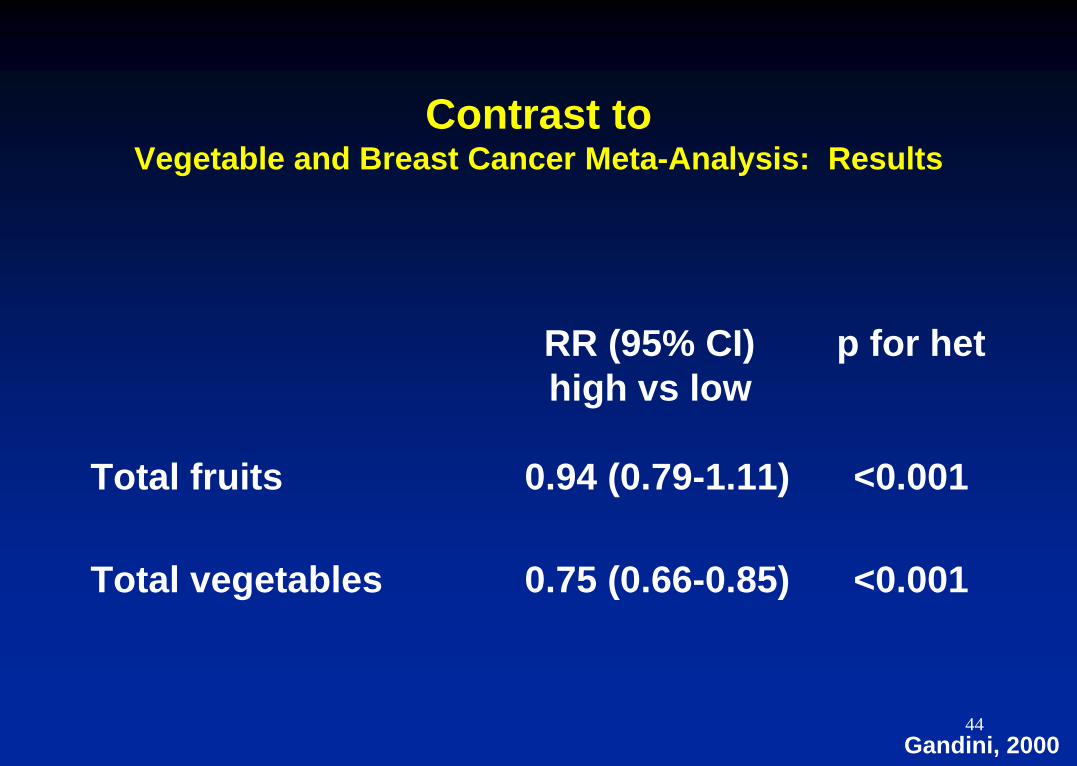
Contrast to Vegetable and Breast Cancer Meta-Analysis: Results
RR (95% CI) p for het
high vs low
Total fruits 0.94 (0.79-1.11) <0.001
Total vegetables 0.75 (0.66-0.85) <0.001
Gandini, 2000 44
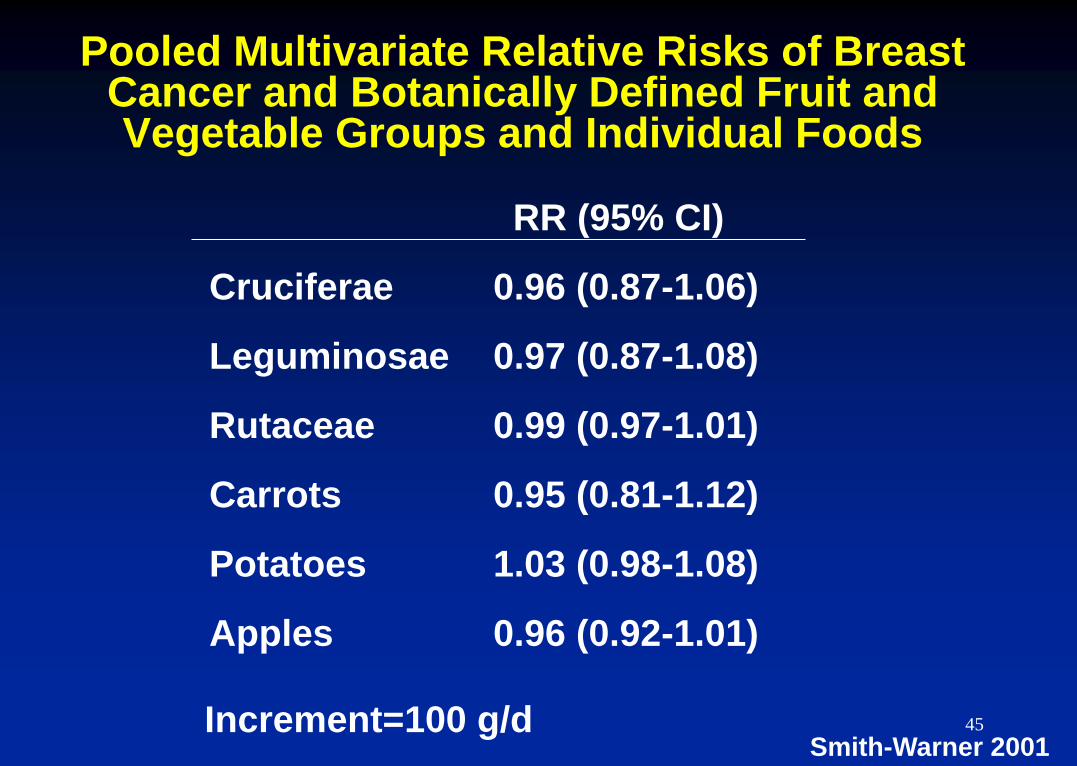
Pooled Multivariate Relative Risks of Breast Cancer and Botanically Defined Fruit and Vegetable Groups and Individual Foods
RR (95% CI)
Cruciferae 0.96 (0.87-1.06)
Leguminosae 0.97 (0.87-1.08)
Rutaceae 0.99 (0.97-1.01)
Carrots 0.95 (0.81-1.12)
Potatoes 1.03 (0.98-1.08)
Apples 0.96 (0.92-1.01)
Increment=100 g/d Smith-Warner 2001
45
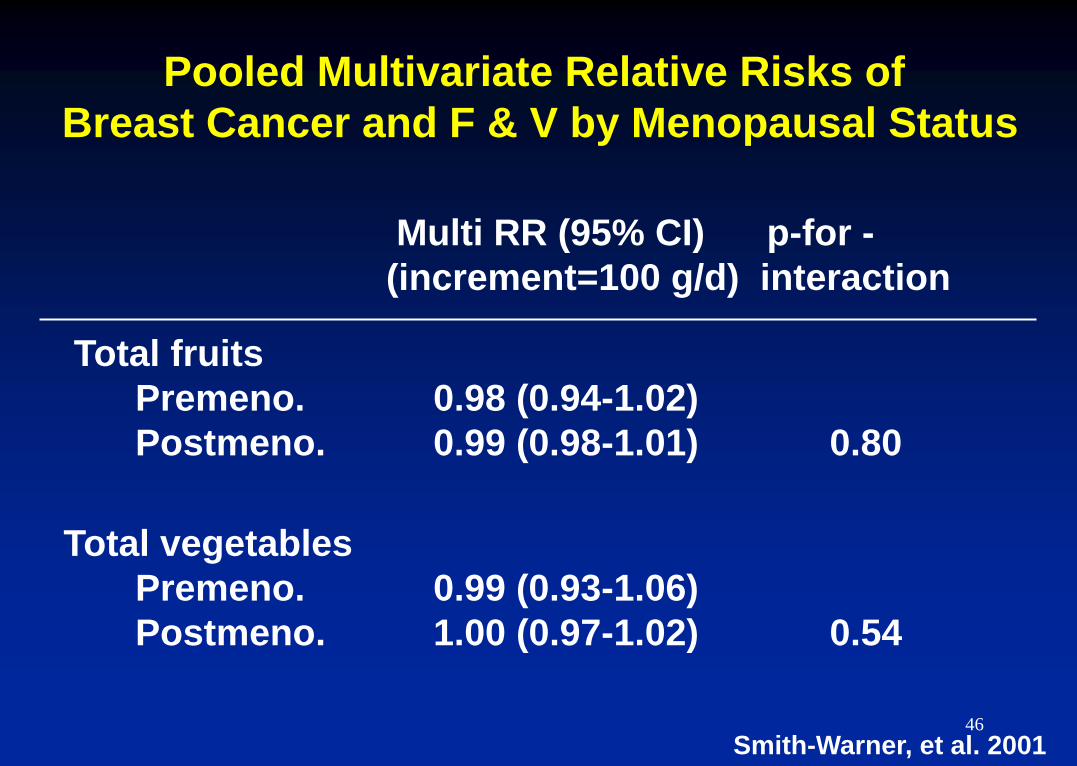
Pooled Multivariate Relative Risks of
Breast Cancer and F & V by Menopausal Status
Multi RR (95% CI) p-for -
(increment=100 g/d) interaction
Total fruits
Premeno. 0.98 (0.94-1.02)
Postmeno. 0.99 (0.98-1.01) 0.80
Total vegetables
Premeno. 0.99 (0.93-1.06)
Postmeno. 1.00 (0.97-1.02) 0.54
Smith-Warner, et al. 2001
46
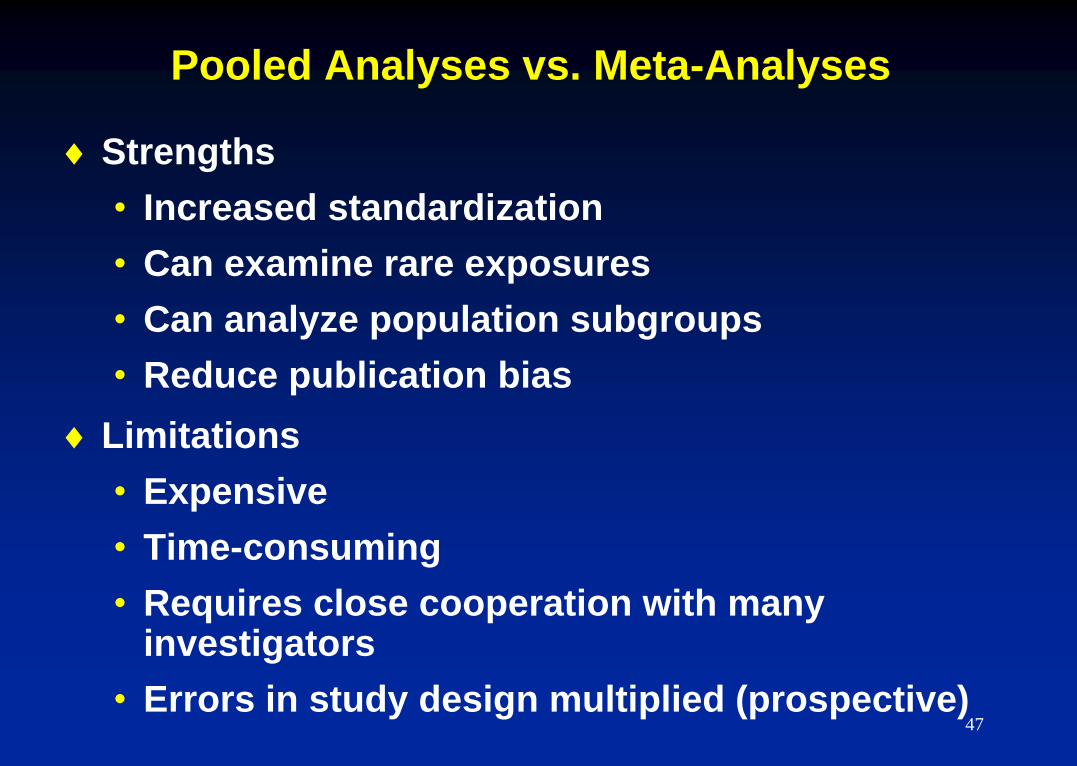
Pooled Analyses vs. Meta-Analyses
Strengths
• Increased standardization
• Can examine rare exposures
• Can analyze population subgroups
• Reduce publication bias
Limitations
• Expensive
• Time-consuming
• Requires close cooperation with many investigators
• Errors in study design multiplied (prospective) 47
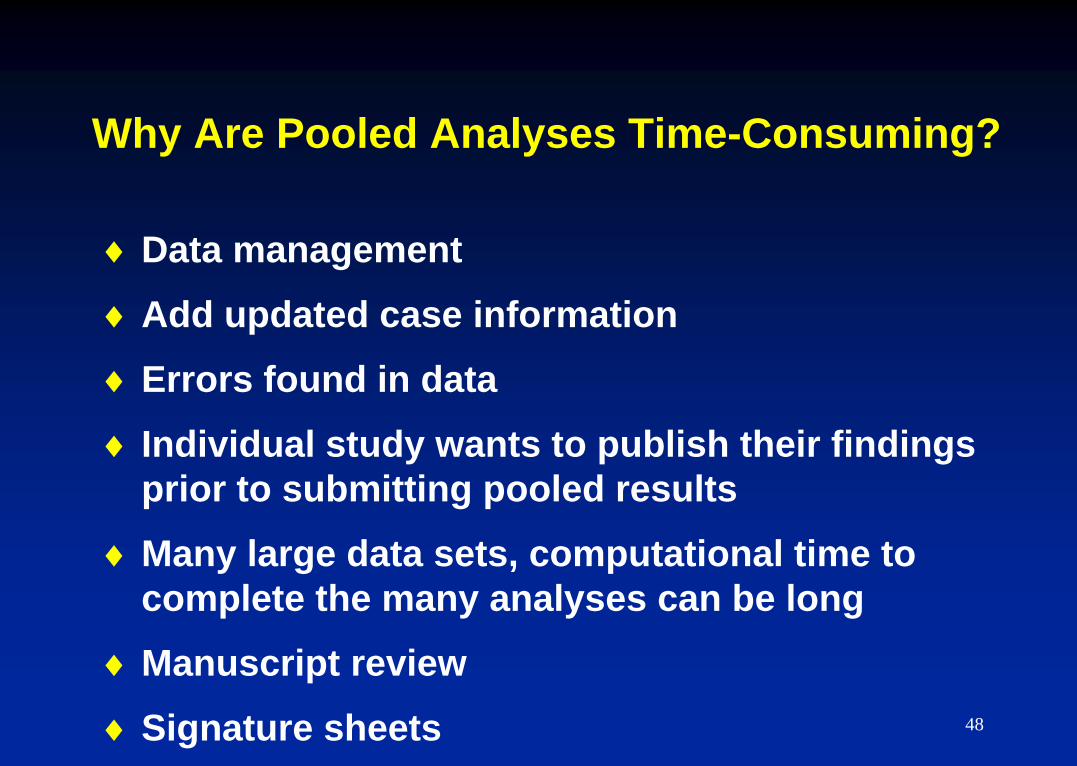
Why Are Pooled Analyses Time-Consuming?
Data management
Add updated case information
Errors found in data
Individual study wants to publish their findings
prior to submitting pooled results
Many large data sets, computational time to
complete the many analyses can be long
Manuscript review
Signature sheets 48
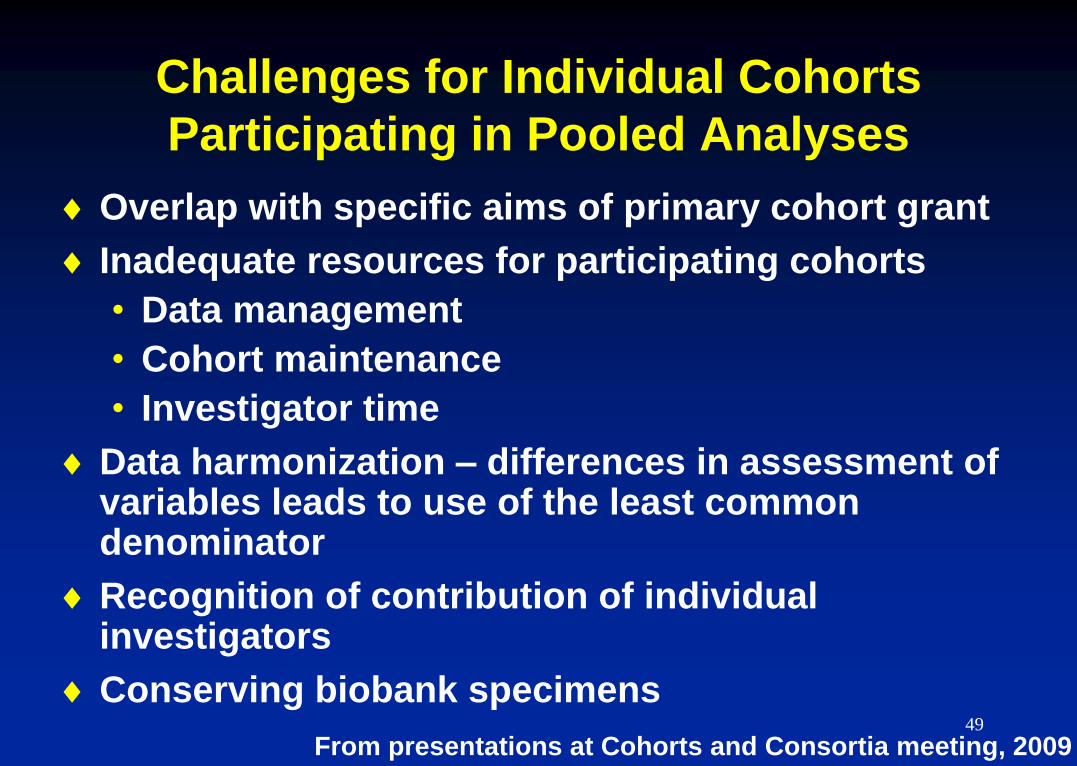
Challenges for Individual Cohorts
Participating in Pooled Analyses
Overlap with specific aims of primary cohort grant
Inadequate resources for participating cohorts
• Data management
• Cohort maintenance
• Investigator time
Data harmonization – differences in assessment of variables leads to use of the least common denominator
Recognition of contribution of individual investigators
Conserving biobank specimens
From presentations at Cohorts and Consortia meeting, 2009 49
REFERENCES
1. Blettner M, Sauerbrei W, Schlehofer B, Scheuchenpflug T, Friedenreich C. Traditional reviews, meta-
analyses and pooled analyses in epidemiology. International Journal of Epidemiology, 1999; 28:1-9.
2. Costa-Bouzas J, Takkouche B, Cadarso-Suárez C, Spiegelman D. HEpiMA: Software for the identification of
heterogeneity in meta-analysis. Computer Methods and Programs in Biomedicine, 2000; 64(2):101-107.
3. DerSimonian R, Laird N. Meta-analysis in clinical trials. Controlled Clinical Trials, 1986; 7:177-188.
4. Friedenreich CM, Methods for pooled analyses of epidemiologic studies. Epidemiology; 1993; 4:295-302.
5. Gandini S, Merzenich H, Robertson C, Boyle P. Meta-analysis of studies on breast cancer risk and diet: the
role of fruit and vegetable consumption and the intake of associated micronutrients. European Journal of
Cancer, 2000; 36:636.
6. Smith-Warner S, Spiegelman D, Adami H, et al. Intake of fruits and vegetables and risk of breast cancer: A
pooled analysis of cohort studies. JAMA, 2001; 285:769-776.
7. Steinberg KK, Smith SJ, Striup DF, et al. Comparison of effect estimates from a meta-analysis of summary
data from published studies and from a meta-analysis using individual patient data for ovarian cancer
studies. American Journal of Epidemiology, 1997; 145:917-925.
8. Stram DO. Meta-analysis of publixhed data using a linear mixed-effects model. Biometrics, 1996; 52:536-
544.
50
9. Takkouche B, Cardarso-Suárez C, Spiegelman D. An evaluation of old and new tests for
heterogeneity in meta-analysis for epidemiologic research. American Journal of Epidemiology,
1999; 150:206-215.
10. World Cancer Research Fund, American Institute for Cancer Research Expert Panel (J.D. Potter,
Chair). Food, nutrition and the prevention of cancer: A global perspective. Washington DC:
American Institute for Cancer Research, 1997.
11. Smith-Warner SA, et al. Types of dietary fat and breast cancer: A pooled analysis of cohort studies.
International Journal of Cancer, 2001; 92:767-774.
12. Ritz J, Demidenko E, Spiegelman D. Multivariate pooling for efficiency. Journal of Statistical
Planning and Inference, 2008; 138:1919-1933.
13. Higgins JPT, T hompson SG, Deeks JJ, Altman DG. Measuring inconsistency in meta-analysis.
British Journal of Medicine, 2003; 327:557-560.
14. Sterne J, Egger M. Funnel plots for detecting bias in meta-analytics: Guidelines in choice of axis.
Journal of Clinical Epidemiology, 2001; 54:1046-1055.
15. Genkinger JM, Hunter DJ, Spiegelman D, Anderson KE, Arslan A, Beeson WL, Buring JE, Fraser
GE, Freudenheim JL, Goldbohm RA, Hankinson SE, Jacobs DR Jr, Koushik A, Lacey JV Jr, Larsson
SC, Leitzmann M, McCullough ML, Miller AB, Rodriguez C, Rohan TE, Schouten LJ, Shore R, Smit
E, Wolk A, Zhang SM, Smith-Warner SA. Dairy products and ovarian cancer: A pooled analysis of 12
cohorts. Cancer Epidemiol Biomarkers Prev, 2006; 15:364-72.
16. Riboli E. The European prospective investigation into cancer and nutrition (EPIC): Plans and
progress. Journal of Nutrition, 2001; 131(1):170S-175S.
51