Embed Size (px)
Citation preview
1
James River Sediment Oxygen and
Nutrient Exchange (SONE) Study
DRAFT
Final Report
Version 1
May 12, 2014
Submitted to
Virginia Department of Environmental Quality
Performing Organization:
Virginia Institute of Marine Science
College of William & Mary
P.O. Box 1346
Gloucester Point, VA 23062
Principal Investigator: Dr. Iris C. Anderson
Authors: Iris C. Anderson and Jennifer W. Stanhope
2
Table of Contents
Purpose/Objectives ......................................................................................................................... 6
Background ..................................................................................................................................... 6
Methods........................................................................................................................................... 6
Site selection ....................................................................................................................... 6
Site characterization ............................................................................................................ 9
Determinations of shallow water benthic and pelagic metabolism and nutrient
fluxes ................................................................................................................................... 9
Statistical analysis ............................................................................................................. 13
Results ........................................................................................................................................... 13
Site Characteristics............................................................................................................ 13
Hourly benthic fluxes for 1 meter sites ............................................................................. 14
Benthic metabolism and daily nutrient fluxes .................................................................. 15
Drivers of benthic metabolism and daily nutrient fluxes .................................................. 16
Pelagic metabolism and daily nutrient fluxes ................................................................... 17
Drivers of pelagic metabolism and daily nutrient fluxes for 1-m sites ............................. 17
Discussion ..................................................................................................................................... 18
Comparison to 1994 James River SONE Study ............................................................... 18
Important factors affecting benthic metabolism and nutrient fluxes ................................ 19
Conclusions ................................................................................................................................... 19
References ..................................................................................................................................... 51
Appendix ....................................................................................................................................... 53
3
List of Figures
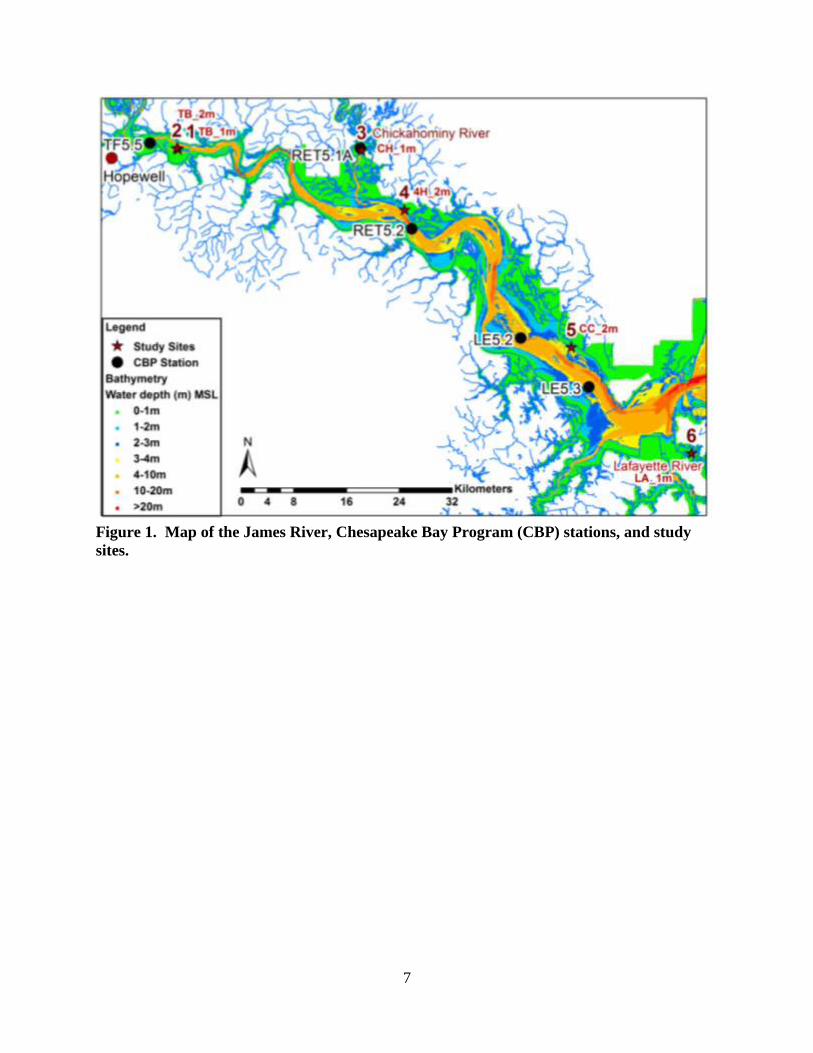
Figure 1. Map of the James River, Chesapeake Bay Program (CBP) stations, and study
sites. ....................................................................................................................................... 7
Figure 2. Measured underwater PAR at the sediment surface during the light incubations
of the experiments for the 1m and 2m sites in August 2012 and April 2013. ..................... 10
Figure 3. Water column chlorophyll a concentrations at 1m and 2m sites in August 2012
and April 2013. .................................................................................................................... 23
Figure 4. Percent incident light that reaches the sediment surface at 1m and 2m sites in
August 2012 and April 2013. ............................................................................................... 23
Figure 5. PCA ordination of mean water column characteristics by site and season and of
the coefficients for the variables .. ....................................................................................... 24
Figure 6. Benthic chlorophyll a and sediment percent organic matter content at 1m and
2m sites in August 2012 and April 2013. ............................................................................ 24
Figure 7. Sediment extractable NH4+ and NOx at 1m and 2m sites in August 2012 and
April 2013. ........................................................................................................................... 25
Figure 8. PCA ordination of mean sediment characteristics by site and season and of the
coefficients for the variables .. ............................................................................................. 25
Figure 9. Benthic hourly DO and DIC fluxes at 1m sites in August 2012 and April 2013 . ....... 26
Figure 10. Benthic hourly light and dark NH4+, NOx, and Si
fluxes at 1m sites in August
2012 and April 2013 ............................................................................................................ 27
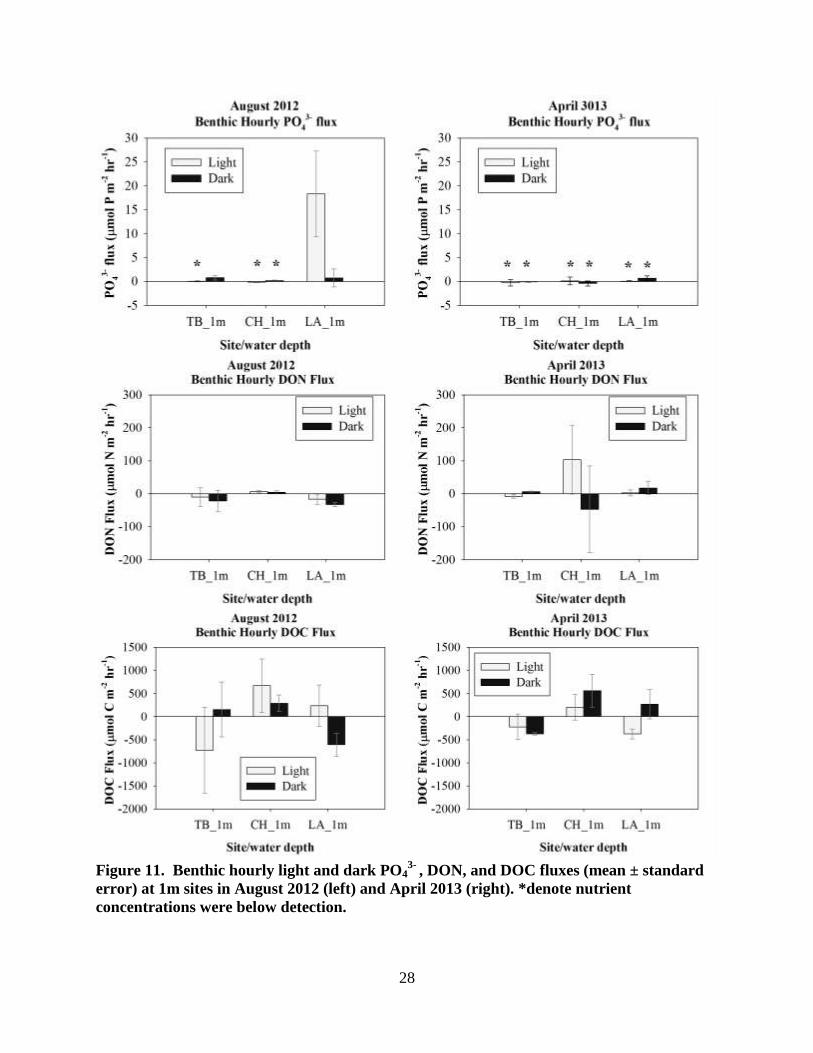
Figure 11. Benthic hourly light and dark PO43-
, DON, and DOC fluxes at 1m sites in
August 2012 and April 2013 .. ............................................................................................. 28
Figure 12. Benthic sediment oxygen demand (SOD) and respiration (R) at 1m and 2m
sites in August 2012 and April 2013.................................................................................... 29
Figure 13. Benthic net community production (NCP) and gross primary production
(GPP) at 1m and 2m sites in August 2012 and April 2013. ................................................. 30
Figure 14. Benthic daily NH4+ and NOx
fluxes at 1m and 2m sites in August 2012 and
April 2013. . ......................................................................................................................... 31
Figure 15. DO, NOx, and NH4+ concentrations in the overlying water of the sediment
cores collected from Tar Bay 2m (TB_2m) during the 24-hour incubation period in
August 2012. ........................................................................................................................ 32
Figure 16. Benthic daily Si and PO43-
fluxes at 1m sites in August 2012 and April 2013
.............................................................................................................................................. 32
Figure 17. Benthic daily DON, and DOC fluxes at 1m sites in August 2012 and April
2013 ..................................................................................................................................... 33
Figure 18. PCA ordination of mean benthic metabolism and daily nutrient flux rates by
site and season and of the coefficients for the variables .. ................................................... 36
4
Figure 19. Benthic respiration (R) versus sediment % organic matter content and benthic
phaeophytin for replicates of all sites in August 2012 and April 2013. .............................. 36
Figure 20. Benthic gross primary production (GPP) versus experimental PAR levels at
the sediment surface during the light incubations for replicates of sites in August
2012 and April 2013. ........................................................................................................... 37
Figure 21. Benthic net community production versus respiration (R) and gross primary
production for replicates of all sites in August 2012 and April 2013 .................................. 37
Figure 22. Benthic daily NH4+, NOx, Si, and PO4
3- fluxes versus and net community
production (NCP) for replicates of all sites in August 2012 and April 2013. ................... 38
Figure 23. Benthic daily DON and DOC fluxes versus and net community production
(NCP) for replicates of all sites in August 2012 and April 2013 ......................................... 38
Figure 24. Pelagic respiration (R), gross primary production, and net community
production at 1m and 2m sites in August 2012 and April 2013. ......................................... 39
Figure 25. Pelagic daily NH4+, NOx, and PO4
3- fluxes at 1m and 2m sites in August 2012
and April 2013. . .................................................................................................................. 40
Figure 26. Pelagic daily Si, DON, and DOC fluxes at 1m and 2m sites in August 2012
and April 2013. . .................................................................................................................. 41
Figure 27. Pelagic gross primary production (GPP) versus water column chlorophyll a
and respiration (R) versus water column phaeophytin for replicates of 1-m sites in
August 2012 and April 2013. ............................................................................................... 42
Figure 28. Pelagic net community production versus respiration (R) and gross primary
production (GPP) for replicates for 1-m sites in August 2012 and April 2013. .................. 42
Figure 29. Pelagic daily NH4+, NOx, Si, PO4
3- , DON, and DOC fluxes versus pelagic net
community production (NCP) for replicates for 1-m sites in August 2012 and April
2013...................................................................................................................................... 43
Figure 30. Locations of the August and May 1994 2m study sties (Meyers, 1995) relative
to this study’s sites. .............................................................................................................. 46
Figure 31. Benthic hourly light and dark DO, NOx, and NH4+ fluxes at 2m sites in
August 2012 and August 1994. ............................................................................................ 47
Figure 32. Benthic hourly light and dark PO43-
and Si fluxes at 2m sites in August 2012
and August 1994 .................................................................................................................. 48
Figure 33. Benthic hourly light and dark DO, NOx, and NH4+ fluxes 2m sites in April
2012 and May 1994. ............................................................................................................ 49
Figure 34. Benthic hourly light and dark PO43-
and Si fluxes at 2m sites in April 2012
and May 1994.. .................................................................................................................... 50

5
List of Tables
Table 1. Study Sites and Chesapeake Bay Program (CBP) station information ........................... 8
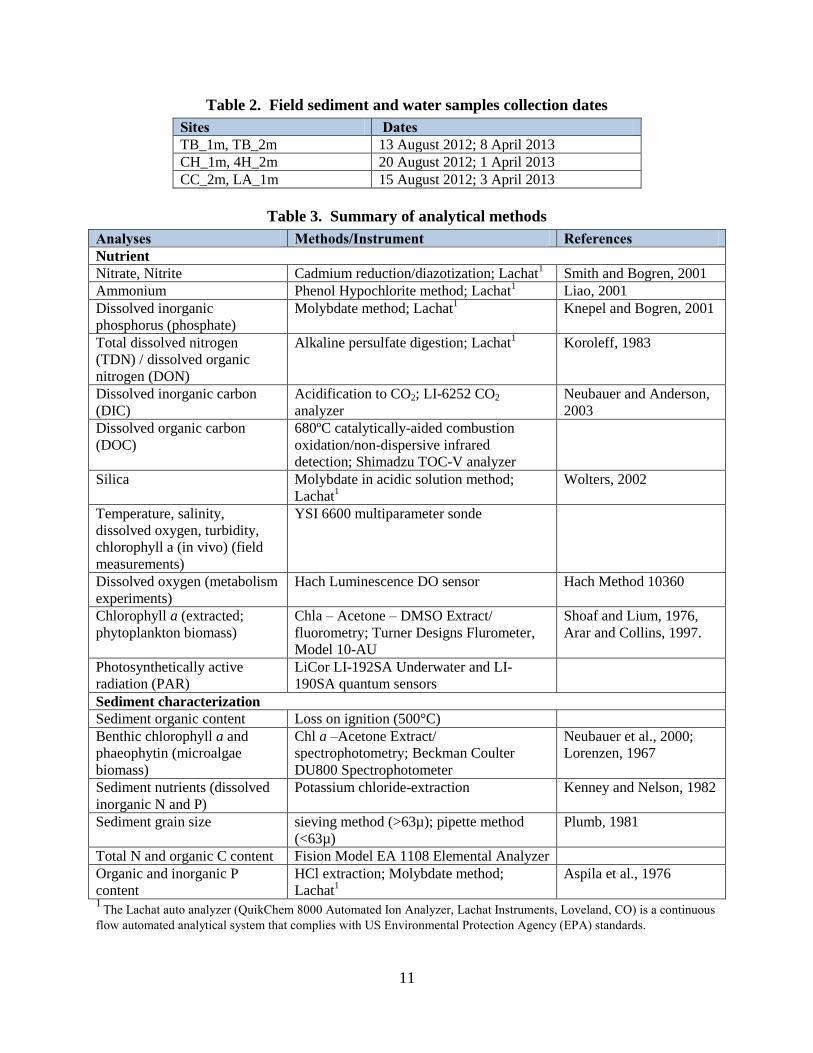
Table 2. Field sediment and water samples collection dates ....................................................... 11
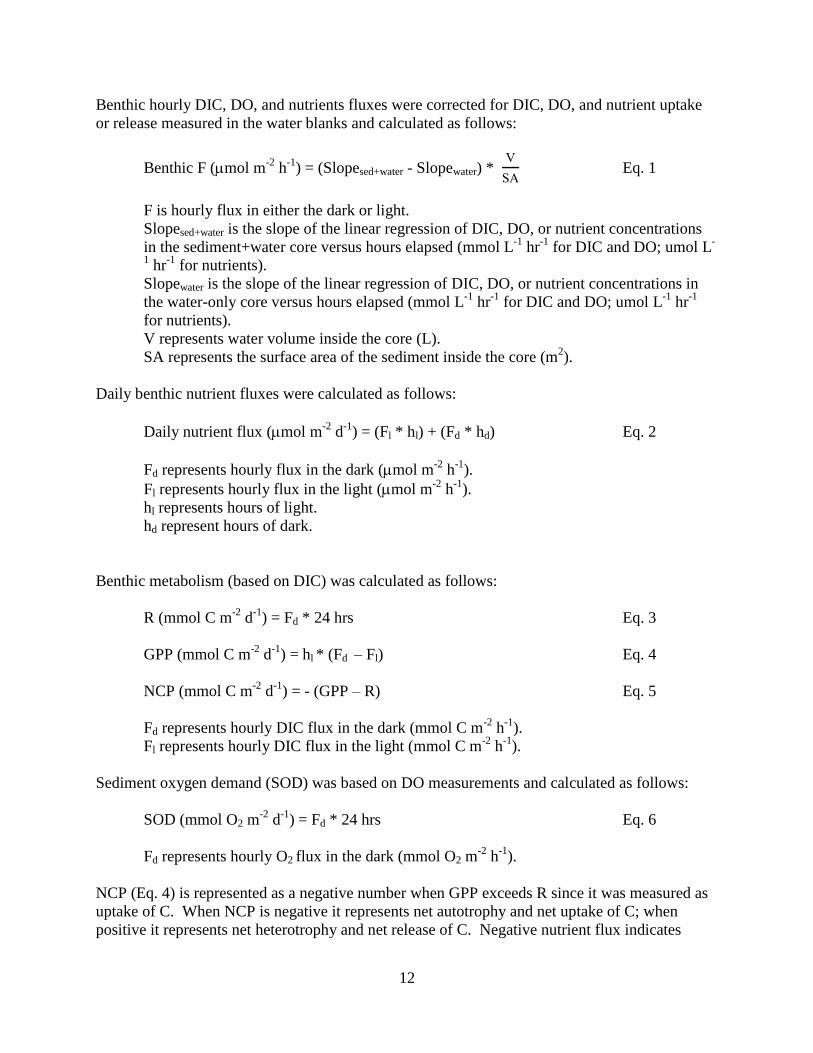
Table 3. Summary of analytical methods .................................................................................... 11
Table 4. Mean mid-water column characteristics ........................................................................ 21
Table 5. Mean sediment characteristics. All sediment properties are for 0-5cm depth
horizon except for chl a and phaeophytin, which is 0-1cm. ......................................................... 22
Table 6. Summary of the two-way ANOVAs of all sites during August 2012 and April
2013 for sediment oxygen demand (SOD), benthic respiration (R), benthic gross primary
production (GPP), and benthic net community production (NCP). .............................................. 34
Table 7. Summary of the two-way ANOVAs of all sites during August 2012 and April
2013 for benthic daily fluxes of NOx, NH4+, PO4
3-, DON (dissolved organic N), DOC
(dissolved organic carbon), and Si. ............................................................................................... 35
Table 8. Summary of the two-way ANOVAs of all sites during August 2012 and April
2013 for pelagic respiration (R), gross primary production (GPP), and net community
production (NCP). ......................................................................................................................... 44
Table 9. Summary of the two-way ANOVAs of all sites during August 2012 and April
2013 for pelagic daily fluxes of NOx, NH4+, PO4
3-, DON (dissolved organic N), DOC
(dissolved organic carbon), and Si. ............................................................................................... 45
6
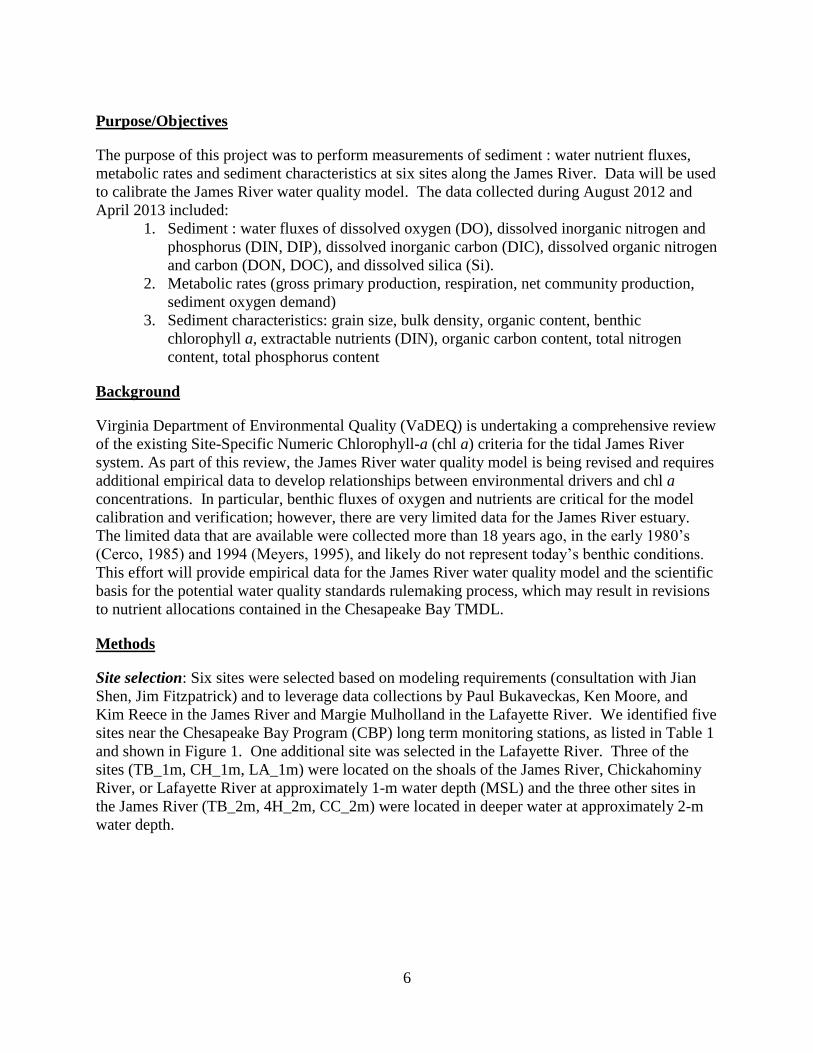
Purpose/Objectives
The purpose of this project was to perform measurements of sediment : water nutrient fluxes,
metabolic rates and sediment characteristics at six sites along the James River. Data will be used
to calibrate the James River water quality model. The data collected during August 2012 and
April 2013 included:
1. Sediment : water fluxes of dissolved oxygen (DO), dissolved inorganic nitrogen and
phosphorus (DIN, DIP), dissolved inorganic carbon (DIC), dissolved organic nitrogen
and carbon (DON, DOC), and dissolved silica (Si).
2. Metabolic rates (gross primary production, respiration, net community production,
sediment oxygen demand)
3. Sediment characteristics: grain size, bulk density, organic content, benthic
chlorophyll a, extractable nutrients (DIN), organic carbon content, total nitrogen
content, total phosphorus content
Background
Virginia Department of Environmental Quality (VaDEQ) is undertaking a comprehensive review
of the existing Site-Specific Numeric Chlorophyll-a (chl a) criteria for the tidal James River
system. As part of this review, the James River water quality model is being revised and requires
additional empirical data to develop relationships between environmental drivers and chl a
concentrations. In particular, benthic fluxes of oxygen and nutrients are critical for the model
calibration and verification; however, there are very limited data for the James River estuary.
The limited data that are available were collected more than 18 years ago, in the early 1980’s
(Cerco, 1985) and 1994 (Meyers, 1995), and likely do not represent today’s benthic conditions.
This effort will provide empirical data for the James River water quality model and the scientific
basis for the potential water quality standards rulemaking process, which may result in revisions
to nutrient allocations contained in the Chesapeake Bay TMDL.
Methods
Site selection: Six sites were selected based on modeling requirements (consultation with Jian
Shen, Jim Fitzpatrick) and to leverage data collections by Paul Bukaveckas, Ken Moore, and
Kim Reece in the James River and Margie Mulholland in the Lafayette River. We identified five
sites near the Chesapeake Bay Program (CBP) long term monitoring stations, as listed in Table 1
and shown in Figure 1. One additional site was selected in the Lafayette River. Three of the
sites (TB_1m, CH_1m, LA_1m) were located on the shoals of the James River, Chickahominy
River, or Lafayette River at approximately 1-m water depth (MSL) and the three other sites in
the James River (TB_2m, 4H_2m, CC_2m) were located in deeper water at approximately 2-m
water depth.
7
Figure 1. Map of the James River, Chesapeake Bay Program (CBP) stations, and study
sites.
8
Table 1. Study Sites and Chesapeake Bay Program (CBP) station information
Site
#
Location
(abbreviation)
Water
Depth
(m;
MSL)
Latitude Longitude CBH Segment
Description
Nearest
CBP
station
Other WQ
Station
1 Tar Bay (TB_1m) 1 37.3058 -77.1847 James River - Tidal Fresh
region
TF5.5 VIMS SAV
(Moore); 1999-
2009
2 Tar Bay (TB_2m) 2 37.3069 -77.1871 James River - Tidal Fresh
region
TF5.5 VIMS SAV
(Moore); 1999-
2009
3 Chickahominy River
near Simpson Island
(CH_1m)
1 37.3095 -76.8707 Chickahominy River -
Tidal Fresh region
RET5.1A
4 Near 4-H Club
above Jamestown
Island and
Jamestown-Scotland
Ferry pier (4H_2m)
2 37.2291 -76.7953 James River -
Oligohaline region
RET5.2 JMS043.78
(CONMON);
2006-2008
5 Near James River
Country Club
(CC_2m)
2 37.0448 -76.5066 James River -
Mesohaline region
between
LE5.2 and
LE5.3
JMS018.23
(CONMON);
2006-2008;
JMS017.96
(CONMON);
2012-present
6 Lafayette River, east
of Hampton Road
Bridge (LA_1m)
1 36.9021 -76.2988 Lafeyette River -
Mesohaline region
9
Site characterization: Sediment and water samples were collected concurrently with
metabolism/nutrient flux sediment cores (described below) during 13-20 August 2012 and 1-8
April 2013 at three randomly selected stations within each of the six sites (Figure 1). Due to
logistical constraints, we collected cores and conducted experiments from two sites at a time (see
Table 2 for dates of field sediment and water samples collections). Parameters, measured in
sediments in the 0-1cm and 1-5cm depth horizons, included: bulk density, organic content, grain
size, DIN (NH4+, NOx [NO3
- + NO2
-]), organic carbon content, total nitrogen content, total and
inorganic phosphorus content. In addition, benthic chl a and phaeophytin concentrations were
determined in the 0-1cm depth horizon. Water column characteristics measured at the time of
core collection at each site included: profiles of temperature, salinity, turbidity, in vivo chl a, and
DO (using a YSI model 6600); underwater photosynthetically active radiation (PAR) at multiple
depths, and vertical light attenuation coefficient [Kd]. Grab samples from mid-water column
depth using a submersible pump were taken for determinations of DIN, DIP (PO43-
), DON, DOC,
silica (Si), and extractable chl a and phaeophytin. Table 3 provides a summary of analytical
methods used for each parameter. Detection limits for NO3-, NH4
-, PO4
3-, and Si were 0.20, 0.36,
0.15, and 0.05 M, respectively.
Determinations of shallow water benthic and pelagic metabolism and nutrient fluxes:
Sediment mesocosm cores (clear acrylic, 13.3 cm inner diameter x 40 cm tall, approximately 20
cm depth of sediment with average surface area to water volume ratio of 4.82 m-1
[standard
error=0.07] and sediment volume to water column volume ratio of 0.93 [standard error=0.03])
were collected at three randomly selected stations at approximately the same water depth within
each of the six sites (Figure 1) and used for concurrent determinations of sediment oxygen
demand (SOD), gross primary production (GPP), respiration (R), net community production
(NCP), and nutrient fluxes (DIN, DIP), DON, DOC, and Si. The mesocosm cores were
incubated in fiberglass chambers filled with site water in an environmental growth chamber
(VIMS) at in-situ temperatures and light. For comparative purposes, the temperature of the
incubations was set based on the first site visited in the season, thus all sites in a season had
approximately similar temperature. After returning from the field and prior to starting the
incubations, cores were uncapped and immersed overnight in the dark. Metabolism and nutrient
flux experiments were initiated the next morning by capping the cores with clear acrylic lids.
Water within the cores was constantly mixed with a magnetic stirrer. Additionally, three cores
with water only from each site were incubated to distinguish water column from sediment
processes. To simulate in situ light at the sediment surface during midday sunny conditions
(estimated as 1600 µE m-2
s-1
) we multiplied the mean % of incident light reaching the sediment
surface in the field (underwater PAR at sediment surface/incident PAR above water surface) by
1600 µE m-2
s-1
to determine the target underwater PAR levels for each set of cores. Light at the
sediment surface inside the fiberglass incubation chambers (filled with site water and the cores)
was adjusted with shade cloth to attain the target PAR levels and measured with a Li-Cor
underwater PAR sensor (model 192A, Li-Cor, Inc., Lincoln, NE) at three locations inside of the
chambers under the shade cloth. These PAR values were adjusted for additional attenuation due
to the core lids (6.5% reduction). The mean PAR measured at the sediment surface during the
light incubations are provided in Figure 2. A linear regression between experiment PAR levels
versus % of incident light measured in the field at the sediment surface at the time of core
collection showed a strong relationship (r2=0.959, p<0.001) verifying that we successfully
simulated in situ field conditions in laboratory incubations.
10
Figure 2. Measured underwater PAR at the sediment surface (mean ± standard error)
during the light incubations of the experiments for the 1m and 2m sites in August 2012 and
April 2013.
To determine the net exchange of nutrients, dissolved inorganic carbon (DIC), and DO
between the sediment and overlying water, water samples were collected during a 24-hour period
at dawn, mid-day, dusk, and dawn (simulated by turning lights on and off in the chamber). The
cores were connected to a reservoir system so that water removed during sampling was replaced
with water from the respective site. Dissolved oxygen concentrations in the sampled water were
measured using a Hach Luminescence DO sensor. Samples for DIC were collected in 8mL
hungate tubes (pre-spiked with 15 µL saturated mercuric chloride) and kept cold under water
until analysis. Samples were also collected from the water reservoirs to correct for dilution in
the cores. Changes in DIC in the light and dark were used for determining rates of benthic and
pelagic metabolism, including R, GPP, and NCP. Changes in DO were used for determining
SOD. Water samples taken concurrently with the DO and DIC measurements were filtered
(Gelman Supor, 0.45 µm) and frozen until analyzed for Si, DIN, DIP, DOC, and DON (Table 3).
Net uptake or release of nutrients from sediment was determined by changes in nutrient
concentrations in the light or dark.
Experimental PAR Light Levels
at Sediment Surface
Site/water depth
TB_1m CH_1m LA_1m
PA
R (
E m
-2 s
-1)
0
100
200
300
400
500
600
700
Aug 2012
April 2013
Experimental PAR Light Levels
at Sediment Surface
Site/water depth
TB_2m 4H_2m CC_2m
PA
R (
E m
-2 s
-1)
0
100
200
300
400
500
600
700
Aug 2012
April 2013
11
Table 2. Field sediment and water samples collection dates
Sites Dates
TB_1m, TB_2m 13 August 2012; 8 April 2013
CH_1m, 4H_2m 20 August 2012; 1 April 2013
CC_2m, LA_1m 15 August 2012; 3 April 2013
Table 3. Summary of analytical methods
Analyses Methods/Instrument References
Nutrient
Nitrate, Nitrite Cadmium reduction/diazotization; Lachat1 Smith and Bogren, 2001
Ammonium Phenol Hypochlorite method; Lachat1 Liao, 2001
Dissolved inorganic
phosphorus (phosphate)
Molybdate method; Lachat1 Knepel and Bogren, 2001
Total dissolved nitrogen
(TDN) / dissolved organic
nitrogen (DON)
Alkaline persulfate digestion; Lachat1 Koroleff, 1983
Dissolved inorganic carbon
(DIC)
Acidification to CO2; LI-6252 CO2
analyzer
Neubauer and Anderson,
2003
Dissolved organic carbon
(DOC)
680ºC catalytically-aided combustion
oxidation/non-dispersive infrared
detection; Shimadzu TOC-V analyzer
Silica Molybdate in acidic solution method;
Lachat1
Wolters, 2002
Temperature, salinity,
dissolved oxygen, turbidity,
chlorophyll a (in vivo) (field
measurements)
YSI 6600 multiparameter sonde
Dissolved oxygen (metabolism
experiments)
Hach Luminescence DO sensor Hach Method 10360
Chlorophyll a (extracted;
phytoplankton biomass)
Chla – Acetone – DMSO Extract/
fluorometry; Turner Designs Flurometer,
Model 10-AU
Shoaf and Lium, 1976,
Arar and Collins, 1997.
Photosynthetically active
radiation (PAR)
LiCor LI-192SA Underwater and LI-
190SA quantum sensors
Sediment characterization
Sediment organic content Loss on ignition (500°C)
Benthic chlorophyll a and
phaeophytin (microalgae
biomass)
Chl a –Acetone Extract/
spectrophotometry; Beckman Coulter
DU800 Spectrophotometer
Neubauer et al., 2000;
Lorenzen, 1967
Sediment nutrients (dissolved
inorganic N and P)
Potassium chloride-extraction Kenney and Nelson, 1982
Sediment grain size sieving method (>63µ); pipette method
(<63µ)
Plumb, 1981
Total N and organic C content Fision Model EA 1108 Elemental Analyzer
Organic and inorganic P
content
HCl extraction; Molybdate method;
Lachat1
Aspila et al., 1976
1 The Lachat auto analyzer (QuikChem 8000 Automated Ion Analyzer, Lachat Instruments, Loveland, CO) is a continuous
flow automated analytical system that complies with US Environmental Protection Agency (EPA) standards.
12
Benthic hourly DIC, DO, and nutrients fluxes were corrected for DIC, DO, and nutrient uptake
or release measured in the water blanks and calculated as follows:
Benthic F (mol m-2
h-1
) = (Slopesed+water - Slopewater) *
Eq. 1
F is hourly flux in either the dark or light.
Slopesed+water is the slope of the linear regression of DIC, DO, or nutrient concentrations
in the sediment+water core versus hours elapsed (mmol L-1
hr-1
for DIC and DO; umol L-
1 hr
-1 for nutrients).
Slopewater is the slope of the linear regression of DIC, DO, or nutrient concentrations in
the water-only core versus hours elapsed (mmol L-1
hr-1
for DIC and DO; umol L-1
hr-1
for nutrients).
V represents water volume inside the core (L).
SA represents the surface area of the sediment inside the core (m2).
Daily benthic nutrient fluxes were calculated as follows:
Daily nutrient flux (mol m-2
d-1
) = (Fl * hl) + (Fd * hd) Eq. 2
Fd represents hourly flux in the dark (mol m-2
h-1
).
Fl represents hourly flux in the light (mol m-2
h-1
).
hl represents hours of light.
hd represent hours of dark.
Benthic metabolism (based on DIC) was calculated as follows:
R (mmol C m-2
d-1
) = Fd * 24 hrs Eq. 3
GPP (mmol C m-2
d-1
) = hl * (Fd – Fl) Eq. 4
NCP (mmol C m-2
d-1
) = - (GPP – R) Eq. 5
Fd represents hourly DIC flux in the dark (mmol C m-2
h-1
).
Fl represents hourly DIC flux in the light (mmol C m-2
h-1
).
Sediment oxygen demand (SOD) was based on DO measurements and calculated as follows:
SOD (mmol O2 m-2
d-1
) = Fd * 24 hrs Eq. 6
Fd represents hourly O2 flux in the dark (mmol O2 m-2
h-1
).
NCP (Eq. 4) is represented as a negative number when GPP exceeds R since it was measured as
uptake of C. When NCP is negative it represents net autotrophy and net uptake of C; when
positive it represents net heterotrophy and net release of C. Negative nutrient flux indicates
13
uptake of nutrient into the sediment and conversely, positive nutrient flux represents release of
nutrients from the sediment.
Pelagic metabolism (R, GPP, NCP) and nutrient fluxes were also calculated using the
equations above (Eq. 2-5), except hourly pelagic light and dark fluxes were scaled to expected
total water depth (1m or 2m) and calculated as follows:
Pelagic F (mol m-2
h-1
) = (Slopewater) * 1000
* Dt Eq. 7
F is hourly flux in either the dark or light
Slopewater is the slope of the linear regression of DIC, DO, or nutrient concentrations in
the water-only core versus hours elapsed (mmol L-1
hr-1
for DIC and DO; umol L-1
hr-1
for nutrients)
Dt is total water depth (m)
Statistical analysis: Preliminary analyses of all data (means, standard errors) were completed
using Microsoft Excel. Minitab 16 (Minitab, Inc., State College, PA) was used to perform linear
regressions and analysis of variance (ANOVA) on metabolism and nutrient flux data to
determine differences by site and season. Interactions between all variables were tested.
evene’s test of homogeneity of variance was conducted to determine if means had similar
variances. If the test was found to be significant (p<0.05), data were natural log transformed.
Tukey’s test was used to evaluate pair-wise comparisons after a significant ANOVA; differences
were considered significant at p<0.05. When significant interactions were found, one-way
ANOVAs were conducted on 1) each site to determine seasonal differences and 2) each season
to determine site differences. Principal Components Analysis (PCA) was conducted using
PRIMER 6 (Primer-E, Inc., Plymouth, UK) (Clarke, 1993; Clarke and Warwick, 2001) after data
were transformed and normalized.
Results
Site Characteristics
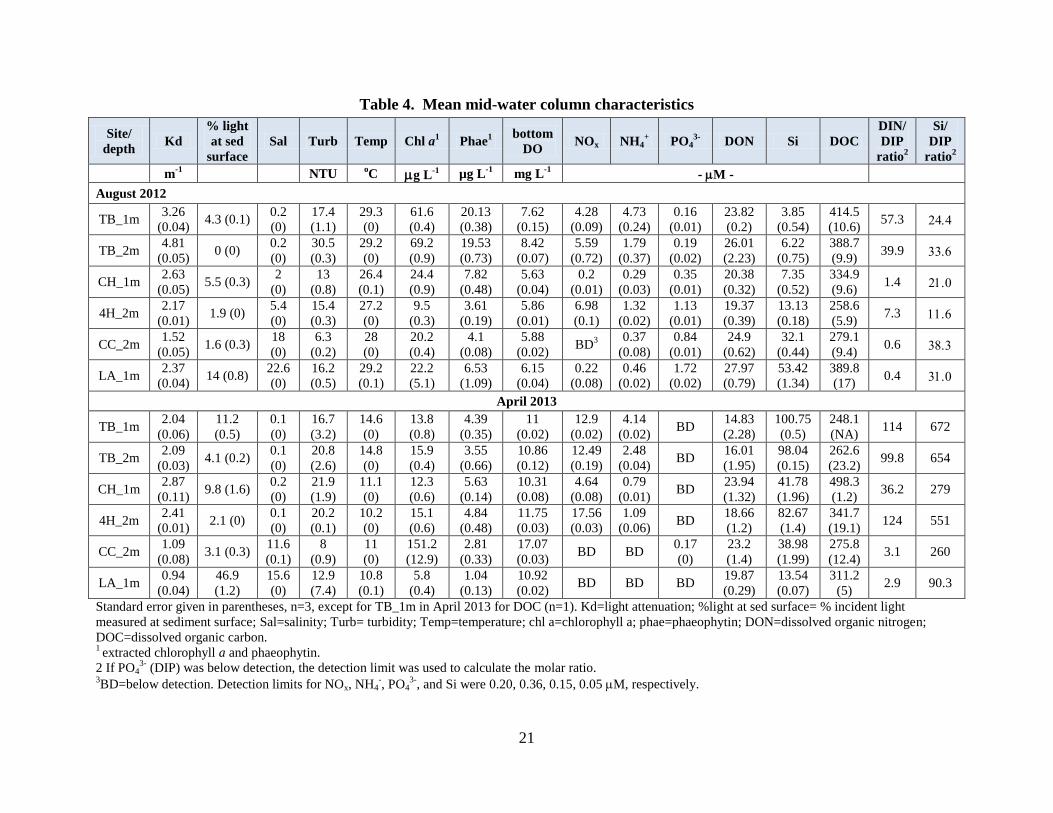
Mean column characteristics for the six sites in the James, Chickahominy, and Lafayette
Rivers are provided in Table 4. We conducted sampling in August 2012 to represent high
temperature conditions during the summer, which ranged from 26.4 to 29.3C. Sampling in
April 2013 was conducted to represent cooler temperatures, which ranged from 10.2 to 14.8 C,
and to assess benthic conditions prior to or during the spring phytoplankton bloom. Salinity was
lower in April (0.1-15.6) than August (0.2-22.6), due to greater freshwater discharge in the
spring. Daily mean USGS discharge at station#2037500 (James River near Richmond, VA)
during the sampling dates had a range of 1490 to 2340 ft3 s
-1 in August and 6450 to 9250 ft
3 s
-1 in
April. Salinity was also lower at the 3 upper James River sites (TB_1m, TB_2m, 4H_2m) and
the Chickahominy River sites (CH_1m) than CC_2m and LA_1m during both seasons. Water
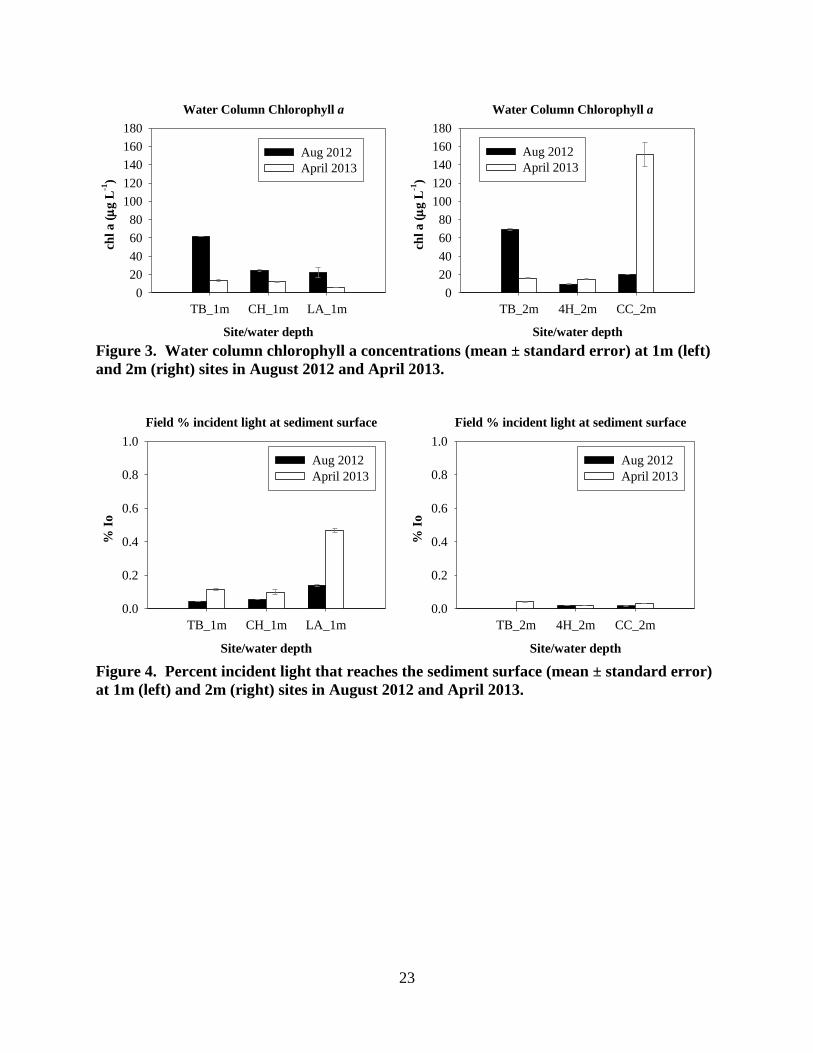
column chlorophyll a (chl a) concentrations were generally higher in August at most sites,
except at CC_2m in April where a phytoplankton bloom was observed with mean chl a
concentration of 151.2 µg L-1
(Figure 3). As a result, DIN and DIP concentrations decreased to
below detection limits at this site (Table 4). NOx and Si concentrations were higher in April at
14
the four lower salinity sites, while DIP concentrations were higher in August at all sites. Both
DIP and Si increased with salinity in August, most likely due to desorption of DIP from
particulates and remineralization. DIN:DIP ratio was above 16 at all sites in April and at TB_1m
and TB_2m in August, indicating potential P limitation for phytoplankton. DIN:DIP ratio was
below 16 in August at the other four downriver sites, suggesting potential N limitation. All sites
had Si:DIP ratios above 16, indicating no potential Si limitations for diatoms; 4H_2m in August
was the exception with a Si:DIP ratio of 11.6 and a mean chl a concentration lower than other
sites. In August, chl a and Si appear to be negatively correlated, suggesting that production of
phytoplankton was likely dominated by diatoms. DON and DOC concentrations were higher in
August at TB_1m, TB_2m, CC_2m, and LA_1m. They were also the dominant form of nutrients
in August at all sites, indicating high remineralization of organic matter. Bottom water DO was
lower in August, consistent with the high summer temperatures. The percent of incident light
that reached the sediment surface (i.e., available light) was higher for the 1-m sites and in April,
when light attenuation was lower (Figure 4, Table 4).
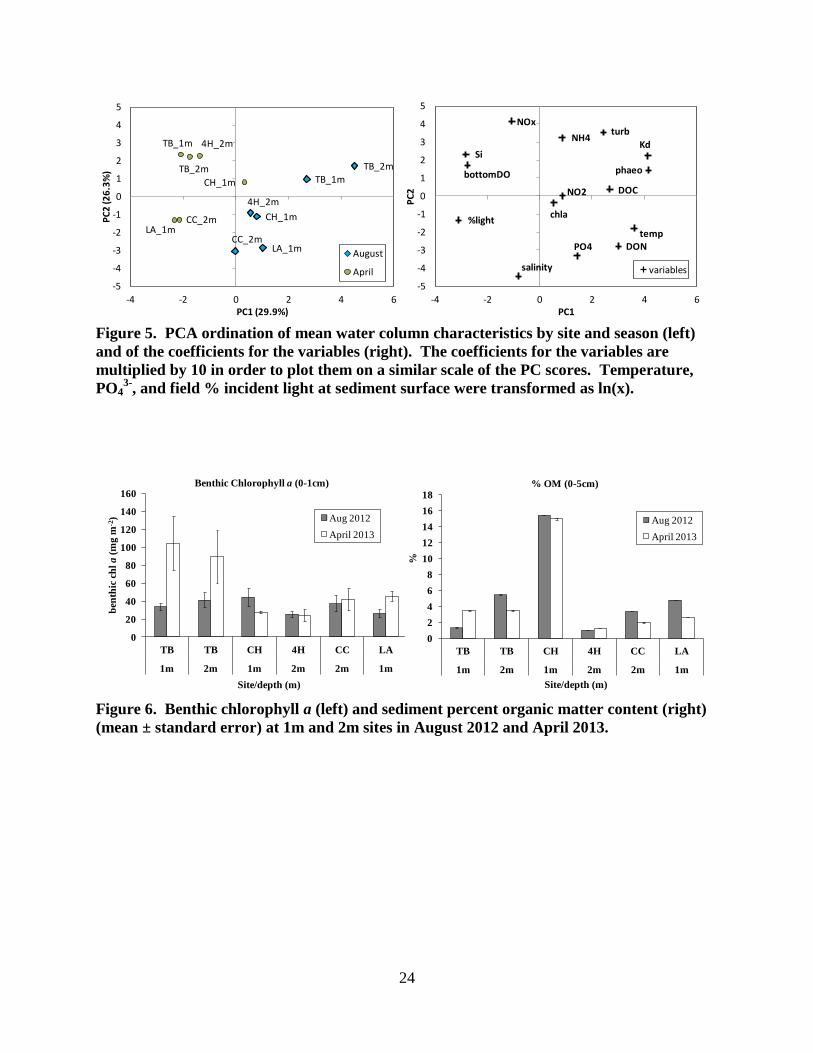
Principal Component Analysis was performed on mean water column characteristics by
site and season; principal components 1 and 2 (PC1, PC2) together explain 56.2% of the variance
of the means (Figure 5). PC1 clearly differentiated the site means by season, where positive
scores were associated with August data and higher temperature, light attenuation, phaeophytin,
DON, and DOC concentrations and lower % incident light at the sediment surface, Si, and
bottom DO concentrations. PC2 differentiated the sites by their position along the estuarine
gradient, in which positive scores were associated with lower salinity and DIP concentrations
and higher NOx and NH4+ concentrations.
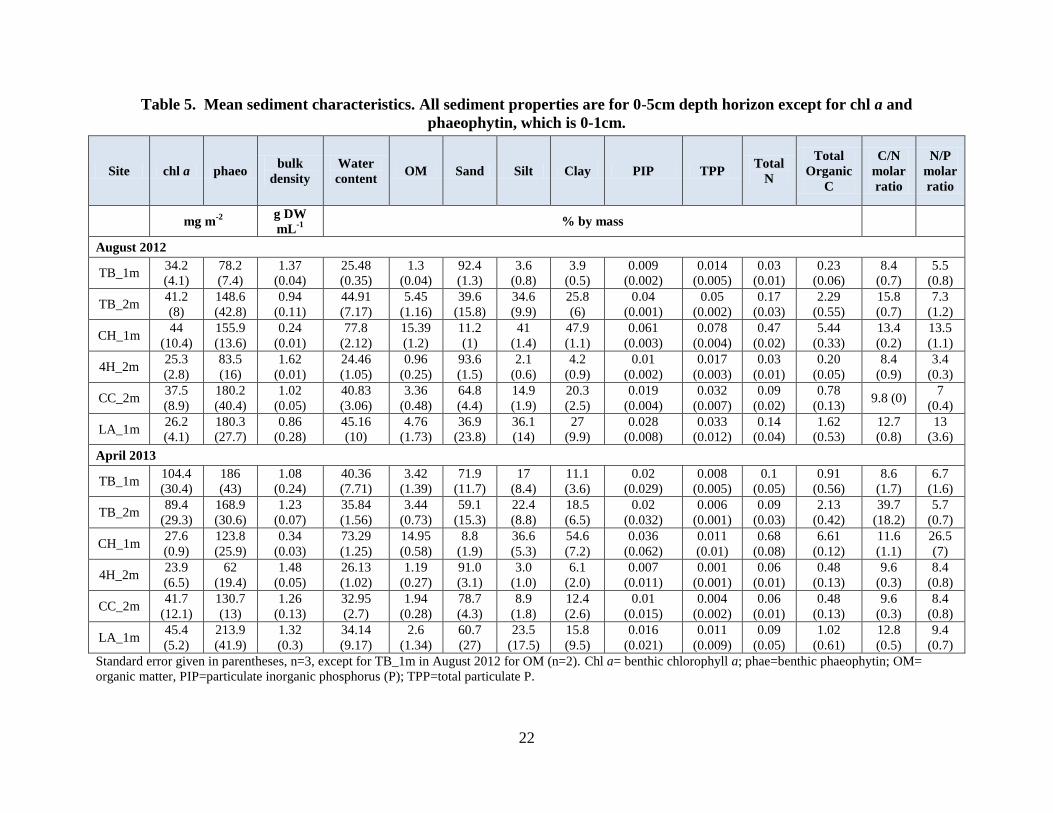
Mean sediment characteristics for the six sites in the James, Chickahominy, and Lafayette
Rivers are provided in Table 5. Benthic chl a concentrations were higher in April at the upriver
sites of TB_1m and TB_2m and in the Lafayette River, LA_1m (Figure 6). Most sites were
sandy with fairly low organic and %N, C, PIP, and TPP content, except CH_1m (Figure 6, Table
5). The % PIP and TPP content were also lower in April at most sites. There was no clear
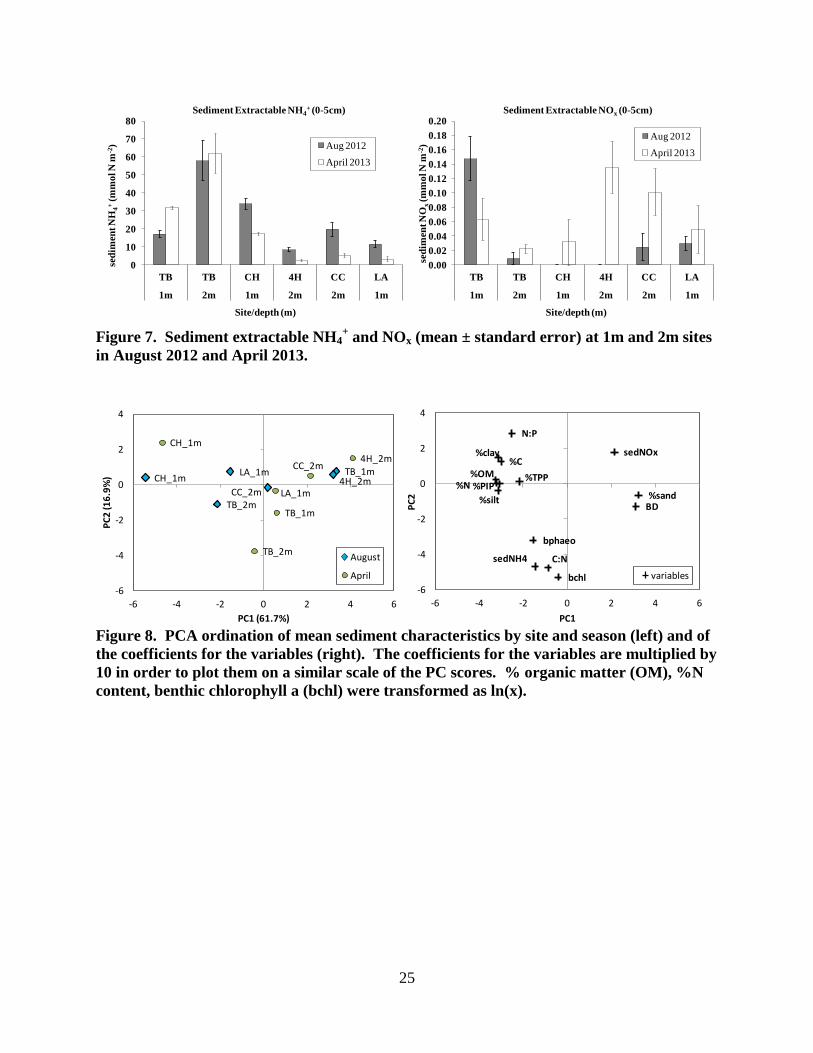
seasonal trend for %N and C content. Sediment extractable NH4+ was generally higher at
TB_2m, while extractable NOx was low at all sites (Figure 7).
Principal Component Analysis was performed on mean sediment characteristics by site
and season and principal components 1 and 2 (PC1, PC2) together explain 78.6% of the variance
of the means (Figure 8). PC1 differentiated sites by nutrient content and grain size; negative
scores were associated with greater organic matter, %N, %C, and %PIP content and silt and clay
fraction. PC2 arranged sites based on benthic chl a and phaeophytin concentrations and
sediment extractable NH4+, in which negative scores had greater concentrations of these
parameters. Unlike the PCA analysis of the water column characteristics, the PCA analysis of
sediment did not indicate a clear seasonal pattern.
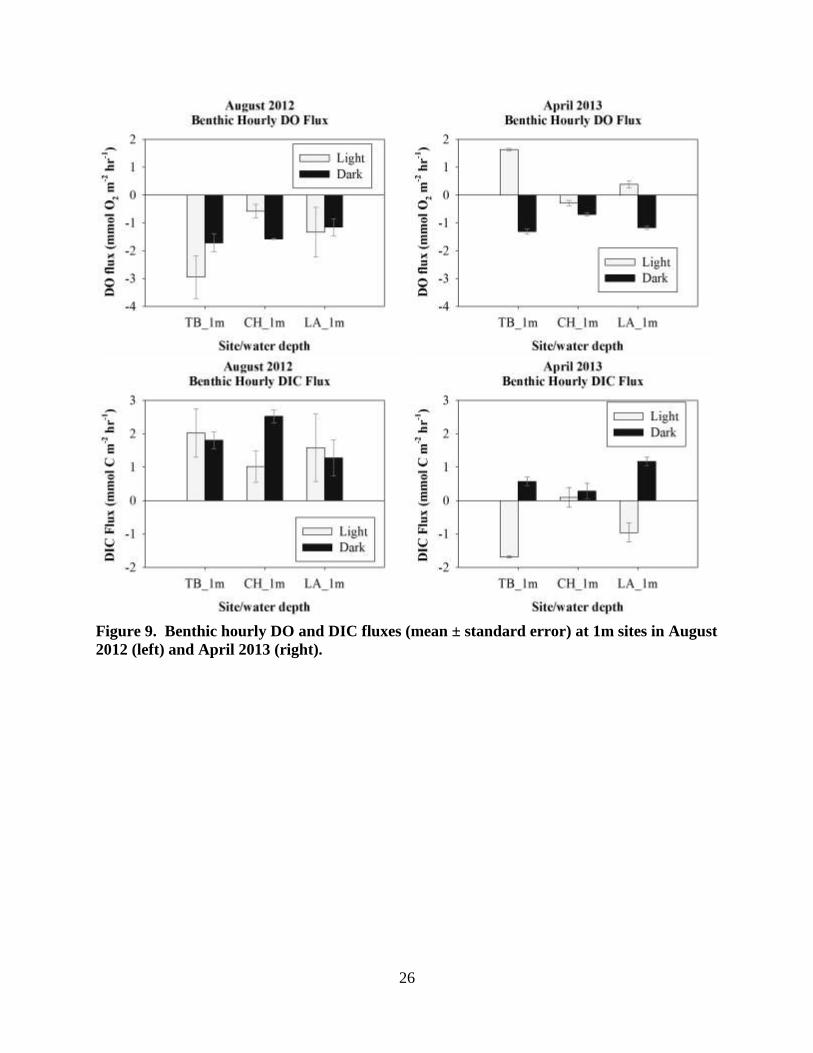
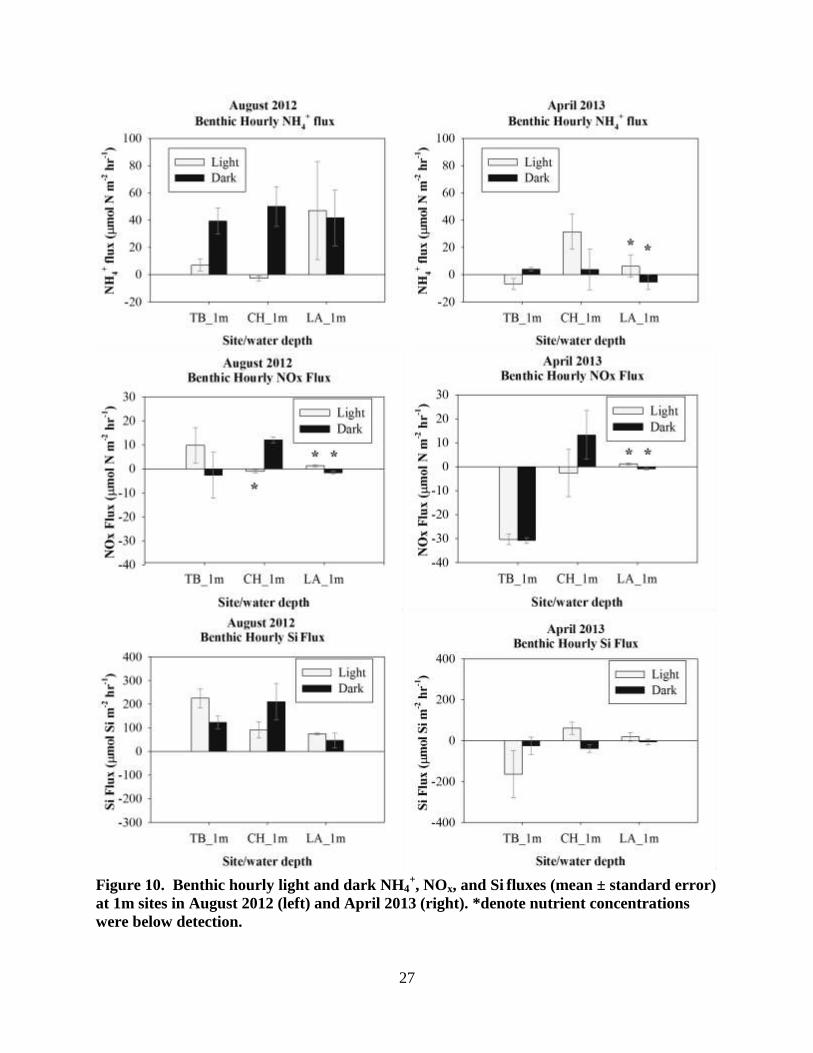
Hourly benthic fluxes for 1 meter sites
The effect of light on hourly benthic fluxes could be assessed for the 1-m sites because
the sediment cores were exposed to greater PAR levels during the light incubations than for the
2-m site cores, in particular during April (Figure 2). The differences between light and dark DO
15
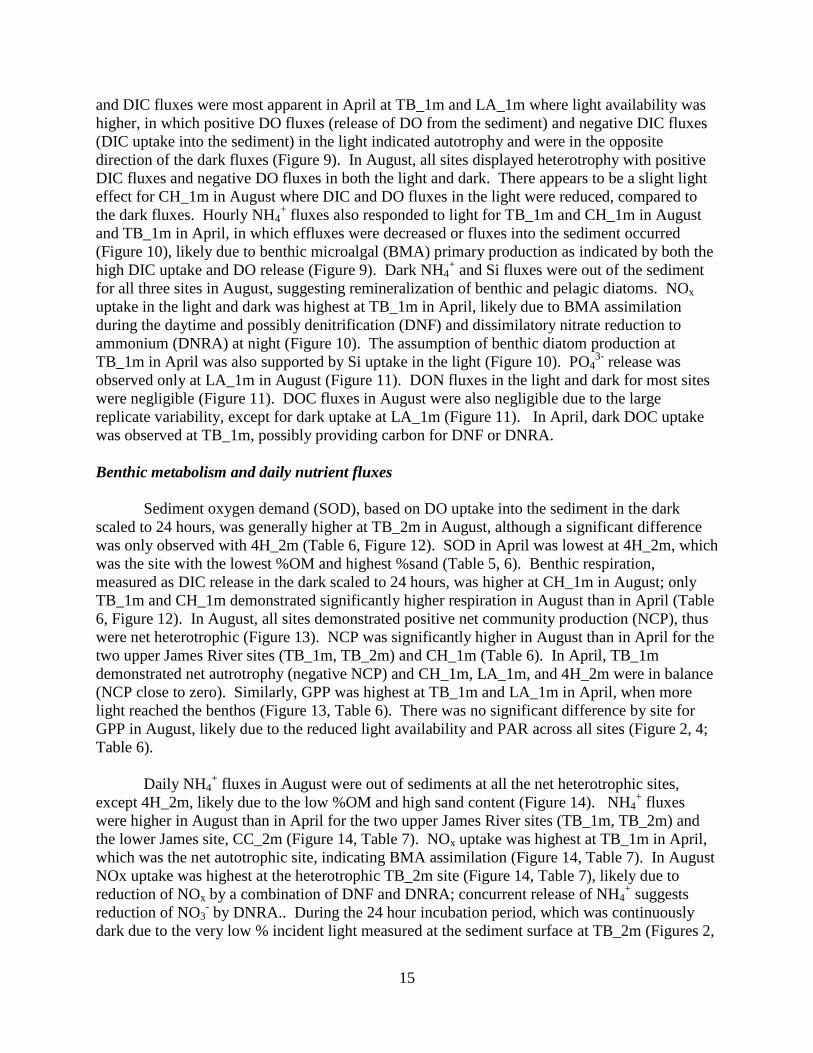
and DIC fluxes were most apparent in April at TB_1m and LA_1m where light availability was
higher, in which positive DO fluxes (release of DO from the sediment) and negative DIC fluxes
(DIC uptake into the sediment) in the light indicated autotrophy and were in the opposite
direction of the dark fluxes (Figure 9). In August, all sites displayed heterotrophy with positive
DIC fluxes and negative DO fluxes in both the light and dark. There appears to be a slight light
effect for CH_1m in August where DIC and DO fluxes in the light were reduced, compared to
the dark fluxes. Hourly NH4+ fluxes also responded to light for TB_1m and CH_1m in August
and TB_1m in April, in which effluxes were decreased or fluxes into the sediment occurred
(Figure 10), likely due to benthic microalgal (BMA) primary production as indicated by both the
high DIC uptake and DO release (Figure 9). Dark NH4+ and Si fluxes were out of the sediment
for all three sites in August, suggesting remineralization of benthic and pelagic diatoms. NOx
uptake in the light and dark was highest at TB_1m in April, likely due to BMA assimilation
during the daytime and possibly denitrification (DNF) and dissimilatory nitrate reduction to
ammonium (DNRA) at night (Figure 10). The assumption of benthic diatom production at
TB_1m in April was also supported by Si uptake in the light (Figure 10). PO43-
release was
observed only at LA_1m in August (Figure 11). DON fluxes in the light and dark for most sites
were negligible (Figure 11). DOC fluxes in August were also negligible due to the large
replicate variability, except for dark uptake at LA_1m (Figure 11). In April, dark DOC uptake
was observed at TB_1m, possibly providing carbon for DNF or DNRA.
Benthic metabolism and daily nutrient fluxes
Sediment oxygen demand (SOD), based on DO uptake into the sediment in the dark
scaled to 24 hours, was generally higher at TB_2m in August, although a significant difference
was only observed with 4H_2m (Table 6, Figure 12). SOD in April was lowest at 4H_2m, which
was the site with the lowest %OM and highest %sand (Table 5, 6). Benthic respiration,
measured as DIC release in the dark scaled to 24 hours, was higher at CH_1m in August; only
TB_1m and CH_1m demonstrated significantly higher respiration in August than in April (Table
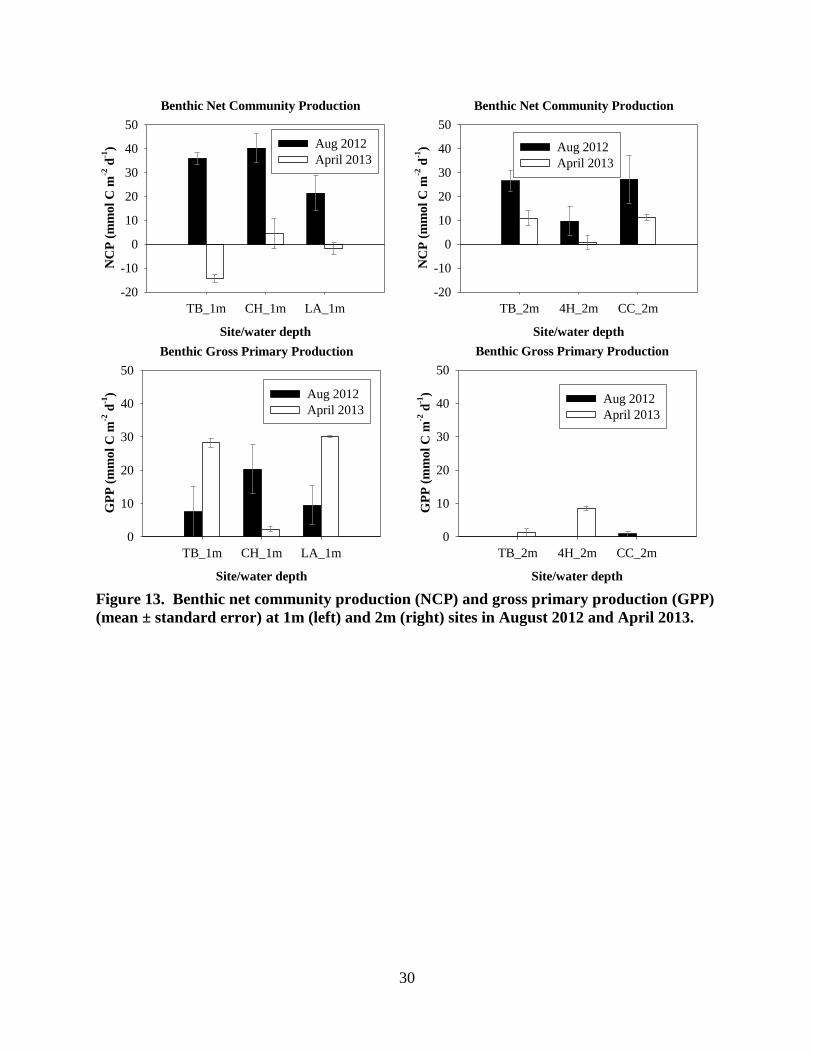
6, Figure 12). In August, all sites demonstrated positive net community production (NCP), thus
were net heterotrophic (Figure 13). NCP was significantly higher in August than in April for the
two upper James River sites (TB_1m, TB_2m) and CH_1m (Table 6). In April, TB_1m
demonstrated net autrotrophy (negative NCP) and CH_1m, LA_1m, and 4H_2m were in balance
(NCP close to zero). Similarly, GPP was highest at TB_1m and LA_1m in April, when more
light reached the benthos (Figure 13, Table 6). There was no significant difference by site for
GPP in August, likely due to the reduced light availability and PAR across all sites (Figure 2, 4;
Table 6).
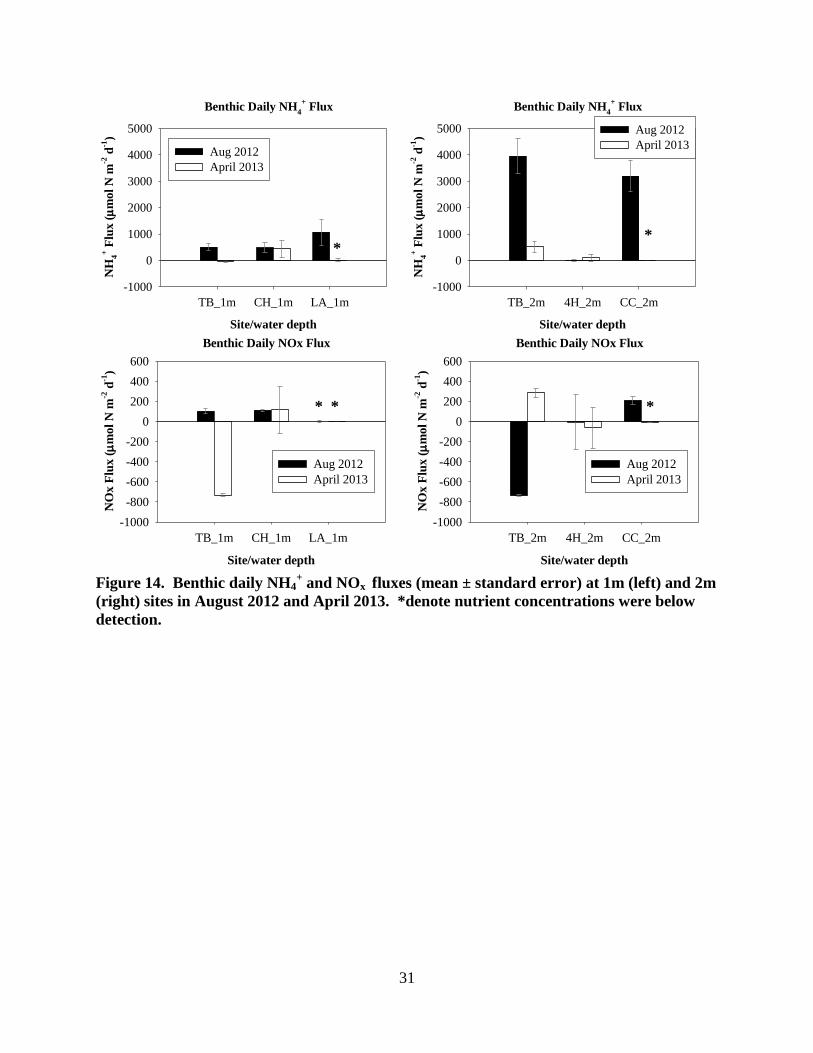
Daily NH4+ fluxes in August were out of sediments at all the net heterotrophic sites,
except 4H_2m, likely due to the low %OM and high sand content (Figure 14). NH4+ fluxes
were higher in August than in April for the two upper James River sites (TB_1m, TB_2m) and
the lower James site, CC_2m (Figure 14, Table 7). NOx uptake was highest at TB_1m in April,
which was the net autotrophic site, indicating BMA assimilation (Figure 14, Table 7). In August
NOx uptake was highest at the heterotrophic TB_2m site (Figure 14, Table 7), likely due to
reduction of NOx by a combination of DNF and DNRA; concurrent release of NH4+ suggests
reduction of NO3- by DNRA.. During the 24 hour incubation period, which was continuously
dark due to the very low % incident light measured at the sediment surface at TB_2m (Figures 2,
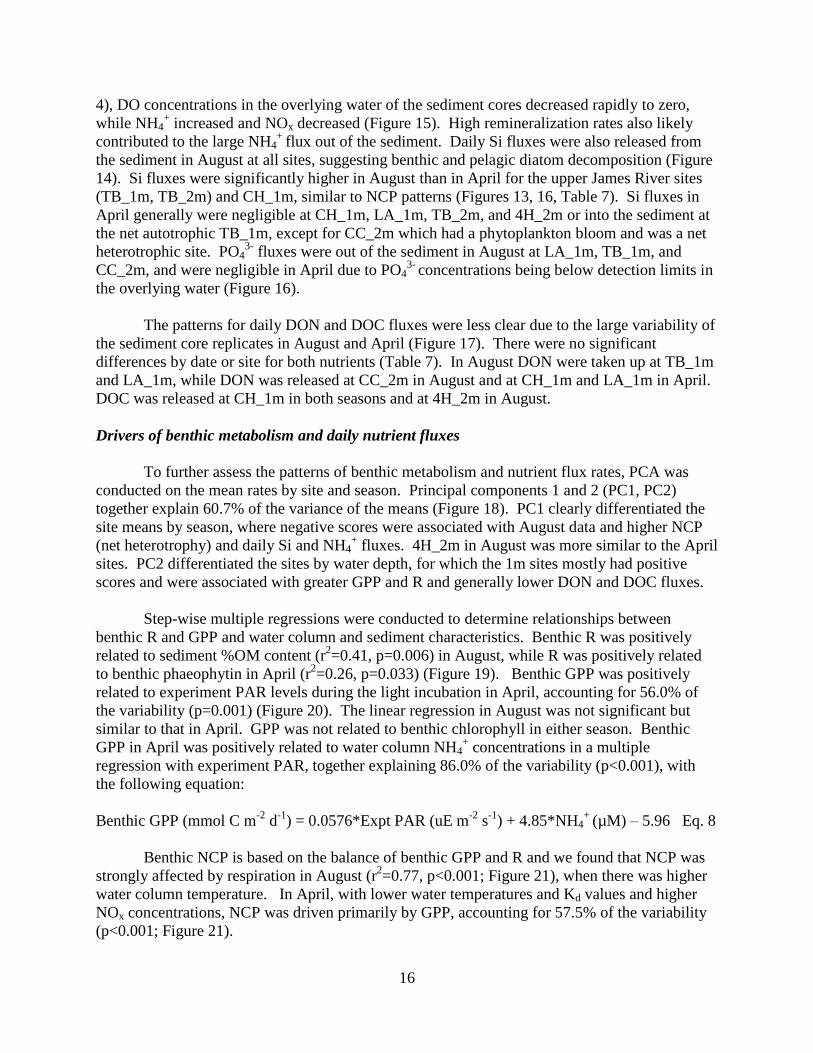
16
4), DO concentrations in the overlying water of the sediment cores decreased rapidly to zero,
while NH4+ increased and NOx decreased (Figure 15). High remineralization rates also likely
contributed to the large NH4+
flux out of the sediment. Daily Si fluxes were also released from
the sediment in August at all sites, suggesting benthic and pelagic diatom decomposition (Figure
14). Si fluxes were significantly higher in August than in April for the upper James River sites
(TB_1m, TB_2m) and CH_1m, similar to NCP patterns (Figures 13, 16, Table 7). Si fluxes in
April generally were negligible at CH_1m, LA_1m, TB_2m, and 4H_2m or into the sediment at
the net autotrophic TB_1m, except for CC_2m which had a phytoplankton bloom and was a net
heterotrophic site. PO43-
fluxes were out of the sediment in August at LA_1m, TB_1m, and
CC_2m, and were negligible in April due to PO43-
concentrations being below detection limits in
the overlying water (Figure 16).
The patterns for daily DON and DOC fluxes were less clear due to the large variability of
the sediment core replicates in August and April (Figure 17). There were no significant
differences by date or site for both nutrients (Table 7). In August DON were taken up at TB_1m
and LA_1m, while DON was released at CC_2m in August and at CH_1m and LA_1m in April.
DOC was released at CH_1m in both seasons and at 4H_2m in August.
Drivers of benthic metabolism and daily nutrient fluxes
To further assess the patterns of benthic metabolism and nutrient flux rates, PCA was
conducted on the mean rates by site and season. Principal components 1 and 2 (PC1, PC2)
together explain 60.7% of the variance of the means (Figure 18). PC1 clearly differentiated the
site means by season, where negative scores were associated with August data and higher NCP
(net heterotrophy) and daily Si and NH4+ fluxes. 4H_2m in August was more similar to the April
sites. PC2 differentiated the sites by water depth, for which the 1m sites mostly had positive
scores and were associated with greater GPP and R and generally lower DON and DOC fluxes.
Step-wise multiple regressions were conducted to determine relationships between
benthic R and GPP and water column and sediment characteristics. Benthic R was positively
related to sediment %OM content (r2=0.41, p=0.006) in August, while R was positively related
to benthic phaeophytin in April (r2=0.26, p=0.033) (Figure 19). Benthic GPP was positively
related to experiment PAR levels during the light incubation in April, accounting for 56.0% of
the variability (p=0.001) (Figure 20). The linear regression in August was not significant but
similar to that in April. GPP was not related to benthic chlorophyll in either season. Benthic
GPP in April was positively related to water column NH4+ concentrations in a multiple
regression with experiment PAR, together explaining 86.0% of the variability (p<0.001), with
the following equation:
Benthic GPP (mmol C m-2
d-1
) = 0.0576*Expt PAR (uE m-2
s-1
) + 4.85*NH4+
(µM) – 5.96 Eq. 8
Benthic NCP is based on the balance of benthic GPP and R and we found that NCP was
strongly affected by respiration in August (r2=0.77, p<0.001; Figure 21), when there was higher
water column temperature. In April, with lower water temperatures and Kd values and higher
NOx concentrations, NCP was driven primarily by GPP, accounting for 57.5% of the variability
(p<0.001; Figure 21).
17
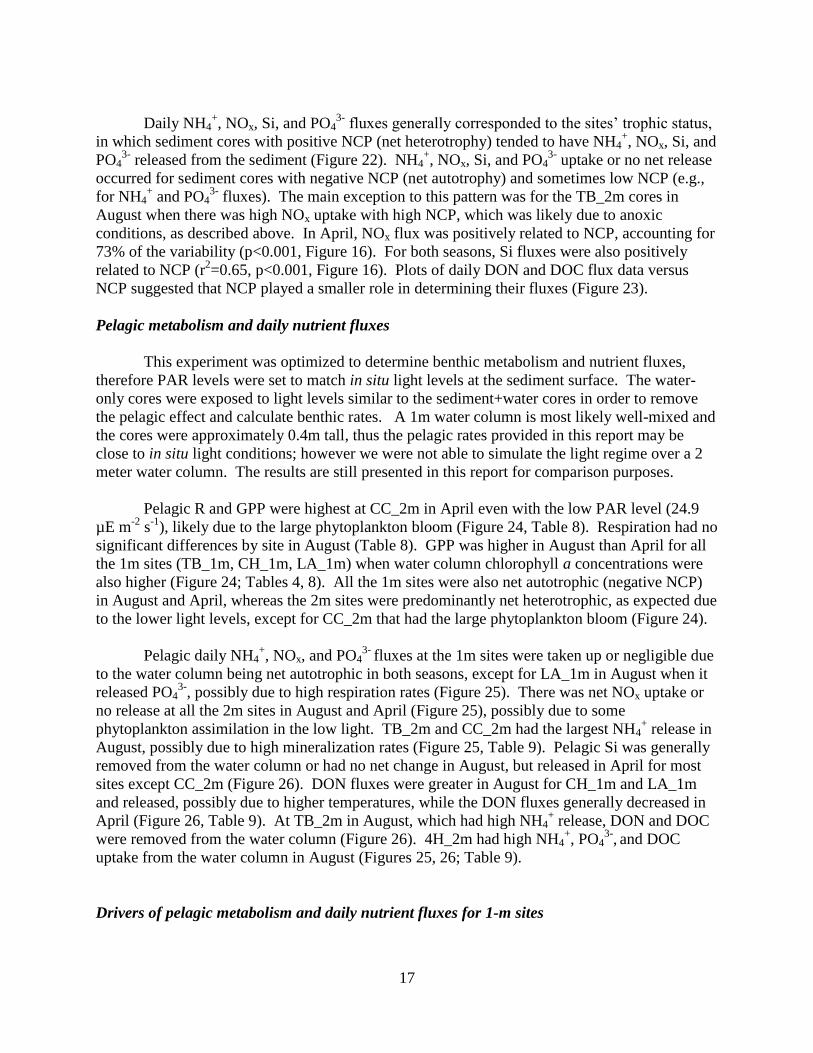
Daily NH4+, NOx, Si, and PO4
3- fluxes generally corresponded to the sites’ trophic status,
in which sediment cores with positive NCP (net heterotrophy) tended to have NH4+, NOx, Si, and
PO43-
released from the sediment (Figure 22). NH4+, NOx, Si, and PO4
3- uptake or no net release
occurred for sediment cores with negative NCP (net autotrophy) and sometimes low NCP (e.g.,
for NH4+ and PO4
3- fluxes). The main exception to this pattern was for the TB_2m cores in
August when there was high NOx uptake with high NCP, which was likely due to anoxic
conditions, as described above. In April, NOx flux was positively related to NCP, accounting for
73% of the variability (p<0.001, Figure 16). For both seasons, Si fluxes were also positively
related to NCP (r2=0.65, p<0.001, Figure 16). Plots of daily DON and DOC flux data versus
NCP suggested that NCP played a smaller role in determining their fluxes (Figure 23).
Pelagic metabolism and daily nutrient fluxes
This experiment was optimized to determine benthic metabolism and nutrient fluxes,
therefore PAR levels were set to match in situ light levels at the sediment surface. The water-
only cores were exposed to light levels similar to the sediment+water cores in order to remove
the pelagic effect and calculate benthic rates. A 1m water column is most likely well-mixed and
the cores were approximately 0.4m tall, thus the pelagic rates provided in this report may be
close to in situ light conditions; however we were not able to simulate the light regime over a 2
meter water column. The results are still presented in this report for comparison purposes.
Pelagic R and GPP were highest at CC_2m in April even with the low PAR level (24.9
µE m-2
s-1
), likely due to the large phytoplankton bloom (Figure 24, Table 8). Respiration had no
significant differences by site in August (Table 8). GPP was higher in August than April for all
the 1m sites (TB_1m, CH_1m, LA_1m) when water column chlorophyll a concentrations were
also higher (Figure 24; Tables 4, 8). All the 1m sites were also net autotrophic (negative NCP)
in August and April, whereas the 2m sites were predominantly net heterotrophic, as expected due
to the lower light levels, except for CC_2m that had the large phytoplankton bloom (Figure 24).
Pelagic daily NH4+, NOx, and PO4
3- fluxes at the 1m sites were taken up or negligible due
to the water column being net autotrophic in both seasons, except for LA_1m in August when it
released PO43-
, possibly due to high respiration rates (Figure 25). There was net NOx uptake or
no release at all the 2m sites in August and April (Figure 25), possibly due to some
phytoplankton assimilation in the low light. TB_2m and CC_2m had the largest NH4+ release in
August, possibly due to high mineralization rates (Figure 25, Table 9). Pelagic Si was generally
removed from the water column or had no net change in August, but released in April for most
sites except CC_2m (Figure 26). DON fluxes were greater in August for CH_1m and LA_1m
and released, possibly due to higher temperatures, while the DON fluxes generally decreased in
April (Figure 26, Table 9). At TB_2m in August, which had high NH4+ release, DON and DOC
were removed from the water column (Figure 26). 4H_2m had high NH4+, PO4
3-, and DOC
uptake from the water column in August (Figures 25, 26; Table 9).
Drivers of pelagic metabolism and daily nutrient fluxes for 1-m sites
18
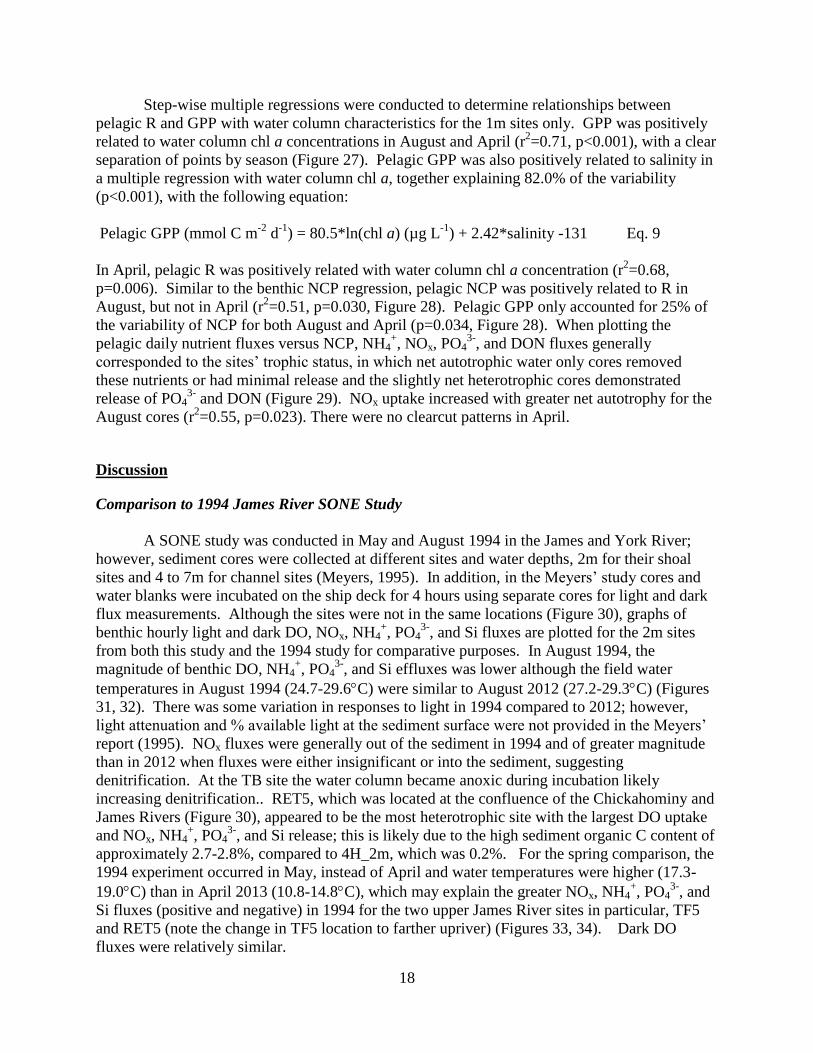
Step-wise multiple regressions were conducted to determine relationships between
pelagic R and GPP with water column characteristics for the 1m sites only. GPP was positively
related to water column chl a concentrations in August and April (r2=0.71, p<0.001), with a clear
separation of points by season (Figure 27). Pelagic GPP was also positively related to salinity in
a multiple regression with water column chl a, together explaining 82.0% of the variability
(p<0.001), with the following equation:
Pelagic GPP (mmol C m-2
d-1
) = 80.5*ln(chl a) (µg L-1
) + 2.42*salinity -131 Eq. 9
In April, pelagic R was positively related with water column chl a concentration (r2=0.68,
p=0.006). Similar to the benthic NCP regression, pelagic NCP was positively related to R in
August, but not in April (r2=0.51, p=0.030, Figure 28). Pelagic GPP only accounted for 25% of
the variability of NCP for both August and April (p=0.034, Figure 28). When plotting the
pelagic daily nutrient fluxes versus NCP, NH4+, NOx, PO4
3-, and DON fluxes generally
corresponded to the sites’ trophic status, in which net autotrophic water only cores removed
these nutrients or had minimal release and the slightly net heterotrophic cores demonstrated
release of PO43-
and DON (Figure 29). NOx uptake increased with greater net autotrophy for the
August cores (r2=0.55, p=0.023). There were no clearcut patterns in April.
Discussion
Comparison to 1994 James River SONE Study
A SONE study was conducted in May and August 1994 in the James and York River;
however, sediment cores were collected at different sites and water depths, 2m for their shoal
sites and 4 to 7m for channel sites (Meyers, 1995). In addition, in the Meyers’ study cores and
water blanks were incubated on the ship deck for 4 hours using separate cores for light and dark
flux measurements. Although the sites were not in the same locations (Figure 30), graphs of
benthic hourly light and dark DO, NOx, NH4+, PO4
3-, and Si fluxes are plotted for the 2m sites
from both this study and the 1994 study for comparative purposes. In August 1994, the
magnitude of benthic DO, NH4+, PO4
3-, and Si effluxes was lower although the field water
temperatures in August 1994 (24.7-29.6C) were similar to August 2012 (27.2-29.3C) (Figures
31, 32). There was some variation in responses to light in 1994 compared to 2012; however,
light attenuation and % available light at the sediment surface were not provided in the Meyers’
report (1995). NOx fluxes were generally out of the sediment in 1994 and of greater magnitude
than in 2012 when fluxes were either insignificant or into the sediment, suggesting
denitrification. At the TB site the water column became anoxic during incubation likely
increasing denitrification.. RET5, which was located at the confluence of the Chickahominy and
James Rivers (Figure 30), appeared to be the most heterotrophic site with the largest DO uptake
and NOx, NH4+, PO4
3-, and Si release; this is likely due to the high sediment organic C content of
approximately 2.7-2.8%, compared to 4H_2m, which was 0.2%. For the spring comparison, the
1994 experiment occurred in May, instead of April and water temperatures were higher (17.3-
19.0C) than in April 2013 (10.8-14.8C), which may explain the greater NOx, NH4+, PO4
3-, and
Si fluxes (positive and negative) in 1994 for the two upper James River sites in particular, TF5
and RET5 (note the change in TF5 location to farther upriver) (Figures 33, 34). Dark DO
fluxes were relatively similar.
19
Important factors affecting benthic metabolism and nutrient fluxes
Seasonally-influenced factors of water temperature, light attenuation, and water column
NH4+ concentration were important drivers of benthic GPP in study sites in the James River,
while sediment %OM and phaeophytin were important drivers of benthic R. Benthic GPP and R
determined benthic NCP, which in turn regulated nutrient fluxes out of or into the sediment. We
observed a clear separation of metabolic status and nutrient response by season; in August, the
sites were all net heterotrophic and released NH4+, NOx, Si, and PO4
3- due to greater water
temperatures and reduced light reaching the sediment surface. Respiration played a greater role
than GPP in determining trophic status. The exception for nutrient release was at TB_2m, when
the water column became anoxic and NOx was taken up by DNRA and DNF. In April, the 1m
sites were net autotrophic or close to being in balance. Nutrients were either taken up by
sediments or efflux was reduced due to increased BMA primary production when light
availability was greater. Water column NH4+ concentrations were another important factor
supporting benthic GPP in April, but not in August when sediment remineralization rather than
the water column likely provided the nitrogen to support benthic GPP. In other shallow estuarine
systems sediment remineralization was similarly observed to be highest during summer
(Anderson et al., 2013). The 2m sites were either net heterotrophic or close to being in balance
due to less light available at the greater water depth. In April GPP was more important in
determining NCP.
In many studies of shallow estuarine systems, where the benthos are in the photic zone,
similar relationships have been observed (Anderson et al., 2013; Alsterberg et al., 2011, 2012;
Sundbäck et al., 2000, 2004; Eyre and Ferguson, 2005; Ferguson et al., 2007). For example in
the New River Estuary (NRE), NC, a shallow system with more than 50% of the estuary at less
than 2m water depth (mean sea level), Anderson et al. (2013) found that light attenuation, water
temperature, benthic chl a, and sediment %OM were important drivers of benthic GPP, R, NH4+
fluxes, and DNF. The shallow sites (0.5m and 1.5m MLW) tended to be net autotrophic and
NCP was a predictor of NH4+ fluxes. In this study BMA biomass (chl a) was not an important
predictor for metabolism and nutrient flux rates, which was likely due to the NRE having
generally lower light attenuation (1.5-3.5 m-1
) and greater benthic chl a concentrations (mean:
48.1-108.8 mg L-1
in the 0-3mm depth horizon) than in the James River (Tables 4, 5).
Conclusions
In conclusion, studies of nutrient and metabolic fluxes conducted in the James River
during August 2012 and April 2013 suggest that:
• Light matters. When sufficient light reaches the benthos, sediments tend to become net
autotrophic and either remove or reduce the flux of mineralized NH4+ to the water
column.
• The benthos matters, at least at 1m MSL. Benthic respiration can contribute as much or
more DIC or DO to the water column as pelagic respiration (scaled to water column
depth).
• Net community production was driven by GPP in April and R in August. NCP indicates
the direction of nutrient fluxes between sediments and water column.

20
• During summer the benthos at all sites was net heterotrophic. Fluxes of NH4+, PO4
3-, and
silicate from sediments to water column were proportional to the degree of benthic net
heterotrophy.
21
Table 4. Mean mid-water column characteristics
Site/
depth Kd
% light
at sed
surface
Sal Turb Temp Chl a1 Phae
1 bottom
DO NOx NH4
+ PO4
3- DON Si DOC
DIN/
DIP
ratio2
Si/
DIP
ratio2
m
-1
NTU
oC g L
-1 µg L-1
mg L-1
- M -
August 2012
TB_1m 3.26
(0.04) 4.3 (0.1)
0.2
(0)
17.4
(1.1)
29.3
(0)
61.6
(0.4)
20.13
(0.38)
7.62
(0.15)
4.28
(0.09)
4.73
(0.24)
0.16
(0.01)
23.82
(0.2)
3.85
(0.54)
414.5
(10.6) 57.3
TB_2m 4.81
(0.05) 0 (0)
0.2
(0)
30.5
(0.3)
29.2
(0)
69.2
(0.9)
19.53
(0.73)
8.42
(0.07)
5.59
(0.72)
1.79
(0.37)
0.19
(0.02)
26.01
(2.23)
6.22
(0.75)
388.7
(9.9) 39.9
CH_1m 2.63
(0.05) 5.5 (0.3)
2
(0)
13
(0.8)
26.4
(0.1)
24.4
(0.9)
7.82
(0.48)
5.63
(0.04)
0.2
(0.01)
0.29
(0.03)
0.35
(0.01)
20.38
(0.32)
7.35
(0.52)
334.9
(9.6) 1.4
4H_2m 2.17
(0.01) 1.9 (0)
5.4
(0)
15.4
(0.3)
27.2
(0)
9.5
(0.3)
3.61
(0.19)
5.86
(0.01)
6.98
(0.1)
1.32
(0.02)
1.13
(0.01)
19.37
(0.39)
13.13
(0.18)
258.6
(5.9) 7.3
CC_2m 1.52
(0.05) 1.6 (0.3)
18
(0)
6.3
(0.2)
28
(0)
20.2
(0.4)
4.1
(0.08)
5.88
(0.02) BD
3
0.37
(0.08)
0.84
(0.01)
24.9
(0.62)
32.1
(0.44)
279.1
(9.4) 0.6
LA_1m 2.37
(0.04) 14 (0.8)
22.6
(0)
16.2
(0.5)
29.2
(0.1)
22.2
(5.1)
6.53
(1.09)
6.15
(0.04)
0.22
(0.08)
0.46
(0.02)
1.72
(0.02)
27.97
(0.79)
53.42
(1.34)
389.8
(17) 0.4
April 2013
TB_1m 2.04
(0.06)
11.2
(0.5)
0.1
(0)
16.7
(3.2)
14.6
(0)
13.8
(0.8)
4.39
(0.35)
11
(0.02)
12.9
(0.02)
4.14
(0.02) BD
14.83
(2.28)
100.75
(0.5)
248.1
(NA) 114 672
TB_2m 2.09
(0.03) 4.1 (0.2)
0.1
(0)
20.8
(2.6)
14.8
(0)
15.9
(0.4)
3.55
(0.66)
10.86
(0.12)
12.49
(0.19)
2.48
(0.04) BD
16.01
(1.95)
98.04
(0.15)
262.6
(23.2) 99.8 654
CH_1m 2.87
(0.11) 9.8 (1.6)
0.2
(0)
21.9
(1.9)
11.1
(0)
12.3
(0.6)
5.63
(0.14)
10.31
(0.08)
4.64
(0.08)
0.79
(0.01) BD
23.94
(1.32)
41.78
(1.96)
498.3
(1.2) 36.2 279
4H_2m 2.41
(0.01) 2.1 (0)
0.1
(0)
20.2
(0.1)
10.2
(0)
15.1
(0.6)
4.84
(0.48)
11.75
(0.03)
17.56
(0.03)
1.09
(0.06) BD
18.66
(1.2)
82.67
(1.4)
341.7
(19.1) 124 551
CC_2m 1.09
(0.08) 3.1 (0.3)
11.6
(0.1)
8
(0.9)
11
(0)
151.2
(12.9)
2.81
(0.33)
17.07
(0.03) BD BD
0.17
(0)
23.2
(1.4)
38.98
(1.99)
275.8
(12.4) 3.1 260
LA_1m 0.94
(0.04)
46.9
(1.2)
15.6
(0)
12.9
(7.4)
10.8
(0.1)
5.8
(0.4)
1.04
(0.13)
10.92
(0.02) BD BD BD
19.87
(0.29)
13.54
(0.07)
311.2
(5) 2.9 90.3
Standard error given in parentheses, n=3, except for TB_1m in April 2013 for DOC (n=1). Kd=light attenuation; %light at sed surface= % incident light
measured at sediment surface; Sal=salinity; Turb= turbidity; Temp=temperature; chl a=chlorophyll a; phae=phaeophytin; DON=dissolved organic nitrogen;
DOC=dissolved organic carbon. 1 extracted chlorophyll a and phaeophytin.
2 If PO43-
(DIP) was below detection, the detection limit was used to calculate the molar ratio. 3BD=below detection. Detection limits for NOx, NH4
-, PO4
3-, and Si were 0.20, 0.36, 0.15, 0.05 M, respectively.
22
Table 5. Mean sediment characteristics. All sediment properties are for 0-5cm depth horizon except for chl a and
phaeophytin, which is 0-1cm.
Site chl a phaeo bulk
density
Water
content OM Sand Silt Clay PIP TPP
Total
N
Total
Organic
C
C/N
molar
ratio
N/P
molar
ratio
mg m
-2
g DW
mL-1
% by mass
August 2012
TB_1m 34.2
(4.1)
78.2
(7.4)
1.37
(0.04)
25.48
(0.35)
1.3
(0.04)
92.4
(1.3)
3.6
(0.8)
3.9
(0.5)
0.009
(0.002)
0.014
(0.005)
0.03
(0.01)
0.23
(0.06)
8.4
(0.7)
5.5
(0.8)
TB_2m 41.2
(8)
148.6
(42.8)
0.94
(0.11)
44.91
(7.17)
5.45
(1.16)
39.6
(15.8)
34.6
(9.9)
25.8
(6)
0.04
(0.001)
0.05
(0.002)
0.17
(0.03)
2.29
(0.55)
15.8
(0.7)
7.3
(1.2)
CH_1m 44
(10.4)
155.9
(13.6)
0.24
(0.01)
77.8
(2.12)
15.39
(1.2)
11.2
(1)
41
(1.4)
47.9
(1.1)
0.061
(0.003)
0.078
(0.004)
0.47
(0.02)
5.44
(0.33)
13.4
(0.2)
13.5
(1.1)
4H_2m 25.3
(2.8)
83.5
(16)
1.62
(0.01)
24.46
(1.05)
0.96
(0.25)
93.6
(1.5)
2.1
(0.6)
4.2
(0.9)
0.01
(0.002)
0.017
(0.003)
0.03
(0.01)
0.20
(0.05)
8.4
(0.9)
3.4
(0.3)
CC_2m 37.5
(8.9)
180.2
(40.4)
1.02
(0.05)
40.83
(3.06)
3.36
(0.48)
64.8
(4.4)
14.9
(1.9)
20.3
(2.5)
0.019
(0.004)
0.032
(0.007)
0.09
(0.02)
0.78
(0.13) 9.8 (0)
7
(0.4)
LA_1m 26.2
(4.1)
180.3
(27.7)
0.86
(0.28)
45.16
(10)
4.76
(1.73)
36.9
(23.8)
36.1
(14)
27
(9.9)
0.028
(0.008)
0.033
(0.012)
0.14
(0.04)
1.62
(0.53)
12.7
(0.8)
13
(3.6)
April 2013
TB_1m 104.4
(30.4)
186
(43)
1.08
(0.24)
40.36
(7.71)
3.42
(1.39)
71.9
(11.7)
17
(8.4)
11.1
(3.6)
0.02
(0.029)
0.008
(0.005)
0.1
(0.05)
0.91
(0.56)
8.6
(1.7)
6.7
(1.6)
TB_2m 89.4
(29.3)
168.9
(30.6)
1.23
(0.07)
35.84
(1.56)
3.44
(0.73)
59.1
(15.3)
22.4
(8.8)
18.5
(6.5)
0.02
(0.032)
0.006
(0.001)
0.09
(0.03)
2.13
(0.42)
39.7
(18.2)
5.7
(0.7)
CH_1m 27.6
(0.9)
123.8
(25.9)
0.34
(0.03)
73.29
(1.25)
14.95
(0.58)
8.8
(1.9)
36.6
(5.3)
54.6
(7.2)
0.036
(0.062)
0.011
(0.01)
0.68
(0.08)
6.61
(0.12)
11.6
(1.1)
26.5
(7)
4H_2m 23.9
(6.5)
62
(19.4)
1.48
(0.05)
26.13
(1.02)
1.19
(0.27)
91.0
(3.1)
3.0
(1.0)
6.1
(2.0)
0.007
(0.011)
0.001
(0.001)
0.06
(0.01)
0.48
(0.13)
9.6
(0.3)
8.4
(0.8)
CC_2m 41.7
(12.1)
130.7
(13)
1.26
(0.13)
32.95
(2.7)
1.94
(0.28)
78.7
(4.3)
8.9
(1.8)
12.4
(2.6)
0.01
(0.015)
0.004
(0.002)
0.06
(0.01)
0.48
(0.13)
9.6
(0.3)
8.4
(0.8)
LA_1m 45.4
(5.2)
213.9
(41.9)
1.32
(0.3)
34.14
(9.17)
2.6
(1.34)
60.7
(27)
23.5
(17.5)
15.8
(9.5)
0.016
(0.021)
0.011
(0.009)
0.09
(0.05)
1.02
(0.61)
12.8
(0.5)
9.4
(0.7)
Standard error given in parentheses, n=3, except for TB_1m in August 2012 for OM (n=2). Chl a= benthic chlorophyll a; phae=benthic phaeophytin; OM=
organic matter, PIP=particulate inorganic phosphorus (P); TPP=total particulate P.
23
Figure 3. Water column chlorophyll a concentrations (mean ± standard error) at 1m (left)
and 2m (right) sites in August 2012 and April 2013.
Figure 4. Percent incident light that reaches the sediment surface (mean ± standard error)
at 1m (left) and 2m (right) sites in August 2012 and April 2013.
Water Column Chlorophyll a
Site/water depth
TB_1m CH_1m LA_1m
chl
a (
g L
-1)
0
20
40
60
80
100
120
140
160
180
Aug 2012
April 2013
Water Column Chlorophyll a
Site/water depth
TB_2m 4H_2m CC_2m
chl
a (
g L
-1)
0
20
40
60
80
100
120
140
160
180
Aug 2012
April 2013
Field % incident light at sediment surface
Site/water depth
TB_1m CH_1m LA_1m
% I
o
0.0
0.2
0.4
0.6
0.8
1.0
Aug 2012
April 2013
Field % incident light at sediment surface
Site/water depth
TB_2m 4H_2m CC_2m
% I
o
0.0
0.2
0.4
0.6
0.8
1.0
Aug 2012
April 2013
24
Figure 5. PCA ordination of mean water column characteristics by site and season (left)
and of the coefficients for the variables (right). The coefficients for the variables are
multiplied by 10 in order to plot them on a similar scale of the PC scores. Temperature,
PO43-
, and field % incident light at sediment surface were transformed as ln(x).
Figure 6. Benthic chlorophyll a (left) and sediment percent organic matter content (right)
(mean ± standard error) at 1m and 2m sites in August 2012 and April 2013.
TB_1m
TB_2m
CH_1m
4H_2m
CC_2mLA_1m
TB_1m
TB_2m
CH_1m
4H_2m
CC_2mLA_1m
-5
-4
-3
-2
-1
0
1
2
3
4
5
-4 -2 0 2 4 6
PC
2 (2
6.3
%)
PC1 (29.9%)
August
April
phaeo
Kd
tempDON
DOC
turb
PO4
NO2
NH4
chla
salinity
NOx
bottomDO
Si
%light
-5
-4
-3
-2
-1
0
1
2
3
4
5
-4 -2 0 2 4 6
PC
2
PC1
variables
0
20
40
60
80
100
120
140
160
TB TB CH 4H CC LA
1m 2m 1m 2m 2m 1m
ben
thic
ch
l a
(mg
m-2
)
Site/depth (m)
Benthic Chlorophyll a (0-1cm)
Aug 2012
April 2013
0
2
4
6
8
10
12
14
16
18
TB TB CH 4H CC LA
1m 2m 1m 2m 2m 1m
%
Site/depth (m)
% OM (0-5cm)
Aug 2012
April 2013
25
Figure 7. Sediment extractable NH4+ and NOx (mean ± standard error) at 1m and 2m sites
in August 2012 and April 2013.
Figure 8. PCA ordination of mean sediment characteristics by site and season (left) and of
the coefficients for the variables (right). The coefficients for the variables are multiplied by
10 in order to plot them on a similar scale of the PC scores. % organic matter (OM), %N
content, benthic chlorophyll a (bchl) were transformed as ln(x).
0
10
20
30
40
50
60
70
80
TB TB CH 4H CC LA
1m 2m 1m 2m 2m 1m
sed
imen
t N
H4+
(mm
ol N
m-2
)
Site/depth (m)
Sediment Extractable NH4+ (0-5cm)
Aug 2012
April 2013
0.00
0.02
0.04
0.06
0.08
0.10
0.12
0.14
0.16
0.18
0.20
TB TB CH 4H CC LA
1m 2m 1m 2m 2m 1m
sed
imen
t N
Ox(m
mo
l N m
-2)
Site/depth (m)
Sediment Extractable NOx (0-5cm)
Aug 2012
April 2013
TB_1m
TB_2m
CH_1m 4H_2mCC_2m
LA_1m
TB_1m
TB_2m
CH_1m
4H_2mCC_2m
LA_1m
-6
-4
-2
0
2
4
-6 -4 -2 0 2 4 6
PC
2 (1
6.9
%)
PC1 (61.7%)
August
April
%OM%N
%clay
%silt
%PIP
%C
N:P
%TPP
bphaeo
sedNH4 C:N
bchl
sedNOx
BD%sand
-6
-4
-2
0
2
4
-6 -4 -2 0 2 4 6
PC
2
PC1
variables
26
Figure 9. Benthic hourly DO and DIC fluxes (mean ± standard error) at 1m sites in August
2012 (left) and April 2013 (right).
27
Figure 10. Benthic hourly light and dark NH4+, NOx, and Si
fluxes (mean ± standard error)
at 1m sites in August 2012 (left) and April 2013 (right). *denote nutrient concentrations
were below detection.
28
Figure 11. Benthic hourly light and dark PO43-
, DON, and DOC fluxes (mean ± standard
error) at 1m sites in August 2012 (left) and April 2013 (right). *denote nutrient
concentrations were below detection.
29
Figure 12. Benthic sediment oxygen demand (SOD) and respiration (R) (mean ± standard
error) at 1m (left) and 2m (right) sites in August 2012 and April 2013.
Sediment Oxygen Demand
Site/water depth
TB_1m CH_1m LA_1m
SO
D (
mm
ol
O2 m
-2 d
-1)
0
20
40
60
80
100
120
Aug 2012
April 2013
Sediment Oxygen Demand
Site/water depth
TB_2m 4H_2m CC_2m
SO
D (
mm
ol
O2 m
-2 d
-1)
0
20
40
60
80
100
120
Aug 2012
April 2013
Benthic Respiration
Site/water depth
TB_1m CH_1m LA_1m
R (
mm
ol
C m
-2 d
-1)
0
10
20
30
40
50
60
70
Aug 2012
April 2013
Benthic Respiration
Site/water depth
TB_2m 4H_2m CC_2m
R (
mm
ol
C m
-2 d
-1)
0
10
20
30
40
50
60
70
Aug 2012
April 2013
30
Figure 13. Benthic net community production (NCP) and gross primary production (GPP)
(mean ± standard error) at 1m (left) and 2m (right) sites in August 2012 and April 2013.
Benthic Net Community Production
Site/water depth
TB_1m CH_1m LA_1m
NC
P (
mm
ol
C m
-2 d
-1)
-20
-10
0
10
20
30
40
50
Aug 2012
April 2013
Benthic Net Community Production
Site/water depth
TB_2m 4H_2m CC_2m
NC
P (
mm
ol
C m
-2 d
-1)
-20
-10
0
10
20
30
40
50
Aug 2012
April 2013
Benthic Gross Primary Production
Site/water depth
TB_1m CH_1m LA_1m
GP
P (
mm
ol
C m
-2 d
-1)
0
10
20
30
40
50
Aug 2012
April 2013
Benthic Gross Primary Production
Site/water depth
TB_2m 4H_2m CC_2m
GP
P (
mm
ol
C m
-2 d
-1)
0
10
20
30
40
50
Aug 2012
April 2013
31
Figure 14. Benthic daily NH4+ and NOx
fluxes (mean ± standard error) at 1m (left) and 2m
(right) sites in August 2012 and April 2013. *denote nutrient concentrations were below
detection.
Benthic Daily NH4
+ Flux
Site/water depth
TB_1m CH_1m LA_1m
NH
4
+ F
lux (
mol
N m
-2 d
-1)
-1000
0
1000
2000
3000
4000
5000
Aug 2012
April 2013
*
Benthic Daily NH4
+ Flux
Site/water depth
TB_2m 4H_2m CC_2m
NH
4
+ F
lux (
mol
N m
-2 d
-1)
-1000
0
1000
2000
3000
4000
5000 Aug 2012
April 2013
*
Benthic Daily NOx Flux
Site/water depth
TB_1m CH_1m LA_1m
NO
x F
lux (
mol
N m
-2 d
-1)
-1000
-800
-600
-400
-200
0
200
400
600
Aug 2012
April 2013
* *
Benthic Daily NOx Flux
Site/water depth
TB_2m 4H_2m CC_2m
NO
x F
lux (
mol
N m
-2 d
-1)
-1000
-800
-600
-400
-200
0
200
400
600
Aug 2012
April 2013
*
32
Figure 15. DO, NOx, and NH4+ concentrations (mean ± standard error) in the overlying
water of the sediment cores collected from Tar Bay 2m (TB_2m) during the 24-hour
incubation period in August 2012.
Figure 16. Benthic daily Si and PO43-
fluxes (mean ± standard error) at 1m sites in August
2012 (left) and April 2013 (right). *denote nutrient concentrations were below detection.
0
5
10
15
20
25
30
35
0.00
0.05
0.10
0.15
0.20
0.25
8/14/12 6:00 AM 8/14/12 6:00 PM 8/15/12 6:00 AM
NO
x a
nd
NH
4+
con
cen
trati
on
(
M)
DO
(m
M)
Date/Time
August 2012: Tar Bay 2m
DO
NOx
NH4
Benthic Daily Si Flux
Site/water depth
TB_1m CH_1m LA_1m
Si
Flu
x (
mo
l S
i m
-2 d
-1)
-4000
-3000
-2000
-1000
0
1000
2000
3000
4000
5000
6000
Aug 2012
April 2013
Benthic Daily Si Flux
Site/water depth
TB_2m 4H_2m CC_2m
Si
Flu
x (
mo
l S
i m
-2 d
-1)
-4000
-3000
-2000
-1000
0
1000
2000
3000
4000
5000
6000
Aug 2012
April 2013
Benthic Daily PO4
3- Flux
Site/water depth
TB_1m CH_1m LA_1m
PO
4
3- F
lux
(
mo
l N
m-2
d-1
)
-100
0
100
200
300
400
Aug 2012
April 2013
* * * * *
Benthic Daily PO4
3- Flux
Site/water depth
TB_2m 4H_2m CC_2m
PO
4
3- F
lux
(
mo
l N
m-2
d-1
)
-100
0
100
200
300
400
Aug 2012
April 2013
* * *
33
Figure 17. Benthic daily DON, and DOC fluxes (mean ± standard error) at 1m sites in
August 2012 (left) and April 2013 (right). *denote nutrient concentrations were below
detection.
Benthic Daily DON Flux
Site/water depth
TB_1m CH_1m LA_1m
DO
N F
lux (
mol
N m
-2 d
-1)
-1000
-500
0
500
1000
1500
2000
2500
Aug 2012
April 2013
Benthic Daily DON Flux
Site/water depth
TB_2m 4H_2m CC_2m
DO
N F
lux (
mol
N m
-2 d
-1)
-1000
-500
0
500
1000
1500
2000
2500
Aug 2012
April 2013
Benthic Daily DOC Flux
Site/water depth
TB_1m CH_1m LA_1m
DO
C F
lux (
x 1
03;
mol
C m
-2 d
-1)
-20
-10
0
10
20
30
40
50
60
70
Aug 2012
April 2013
Benthic Daily DOC Flux
Site/water depth
TB_2m 4H_2m CC_2m
DO
C F
lux (
x 1
03;
mol
C m
-2 d
-1)
-20
-10
0
10
20
30
40
50
60
70
Aug 2012
April 2013
34
Table 6. Summary of the two-way ANOVAs of all sites during August 2012 and April 2013 for sediment oxygen demand
(SOD), benthic respiration (R), benthic gross primary production (GPP), and benthic net community production (NCP).
Parameter n F df Date
p value
Site
p value
Interaction
p value Date Effect Site Effect
SOD* 36
12.05,
10.17,
5.96
1, 5,
5, 24 0.002 <0.001 0.001
TB_1m: NS
Aug: TB_2m > 4H_2m TB_2m: Aug > April
CH_1m: Aug > April
4H_2m: NS April: (TB_1m, CC_2m, & LA_1m)
> (TB_2m & CH_1m) > 4H_2m CC_2m: April > Aug
LA_1m: NS
Respiration* 35 11.09,
2.25, 3.08
1, 5,
5, 23 0.003 0.084 0.029
TB_1m: Aug > April
Aug: CH_1m > 4H_2m TB_2m: NS
CH_1m: Aug > April
4H_2m: NS
April: NS CC_2m: NS
LA_1m: NS
GPP* 35 6.99, 9.03,
6.15
1, 5,
5, 23 0.015 <0.001 0.001
TB_1m: NS
Aug: NS TB_2m: NS
CH_1m: Aug > April
4H_2m: April > Aug April: (TB_1m, LA_1m) > 4H_2m >
(TB_2m, CH_1m, & CC_2m) CC_2m: NS
LA_1m: NS
NCP 35 63.55,
3.10, 4.19
1, 5,
5, 23 <0.001 0.028 0.008
TB_1m: Aug > April
Aug: NS TB_2m: Aug > April
CH_1m: Aug > April
4H_2m: NS April: (TB_2m, CH_1m, & CC_2m)
> TB_1m CC_2m: NS
LA_1m: NS Note: Table provides the parameter evaluated, number of samples (n), the F-statistic (date, site, interaction) and degrees of freedom (date, site, interaction, error),
the probability for each of the main effects (date, site) and interactions term, the significant Tukey's pair-wise comparisons (p<0.05) for the main effects. If the
interaction term is significant, one-way ANOVAs were conducted separately by: 1) site to assess seasonal differences and 2) date to assess site differences
(shaded boxes) and the significant Tukey's pair-wise comparisons for the one-way ANOVAs are provided. See appendix for detailed one-way ANOVA results.
*SOD was transformed as ln(x); R was transformed as ln(x+1); GPP was transformed as ln(x+2). Higher NCP indicates more heterotrophy; greater GPP
indicates more autotrophy.
35
Table 7. Summary of the two-way ANOVAs of all sites during August 2012 and April 2013 for benthic daily fluxes of NOx,
NH4+, PO4
3-, DON (dissolved organic N), DOC (dissolved organic carbon), and Si.
Parameter n F df Date
p value
Site
p value
Interaction
p value Date Effect Site Effect
Daily NOx 36 0.04, 4.14,
12.16
1, 5,
5, 24 0.851 0.007 <0.001
TB_1m: Aug > April
Aug: all sites > TB_2m TB_2m: April > Aug
CH_1m: NS
4H_2m: NS
April: all sites > TB_1m CC_2m: Aug > April
LA_1m: NS
Daily NH4+* 36
46.44,
9.73, 6.06
1, 5,
5, 24 <0.001 <0.001 0.001
TB_1m: Aug > April Aug: (TB_2m & CC_2m) > (TB_1m
& CH_1m) > 4H_2m; LA_1m >
4H_2m
TB_2m: Aug > April
CH_1m: NS
4H_2m: NS
April: TB_2m > TB_1m CC_2m: Aug > April
LA_1m: NS
Daily PO43-
36 7.76, 3.04,
2.57
1, 5,
5, 24 0.01 0.029 0.053 Aug > April LA_1m > 4H_2m
Daily DON 36 0.19, 1.34,
1.29
1, 5,
5, 24 0.668 0.281 0.302 NS NS
Daily DOC 34 3.17, 2.21,
1.06
1, 5,
5, 22 0.089 0.089 0.41 NS NS
Daily Si 36 60.50, 1.90,
5.02
1, 5, 5,
24 <0.001 0.131 0.003
TB_1m: Aug > April
Aug: NS TB_2m: Aug > April
CH_1m: Aug > April
4H_2m: NS
April: CC_2m > TB_1m CC_2m: NS
LA_1m: NS
Note: Table provides the parameter evaluated, number of samples (n), the F-statistic (date, site, interaction) and degrees of freedom (date, site, interaction, error),
the probability for each of the main effects (date, site) and interactions term, the significant Tukey's pair-wise comparisons (p<0.05) for the main effects. If the
interaction term is significant, one-way ANOVAs were conducted separately by: 1) site to assess seasonal differences and 2) date to assess site differences
(shaded boxes) and the significant Tukey's pair-wise comparisons for the one-way ANOVAs are provided. See appendix for detailed one-way ANOVA results.
*NH4+ flux was transformed as ln(x+150). Larger flux for pairwise comparisons indicates either greater efflux from sediment into the water column or lesser
influx to sediment from the water column.
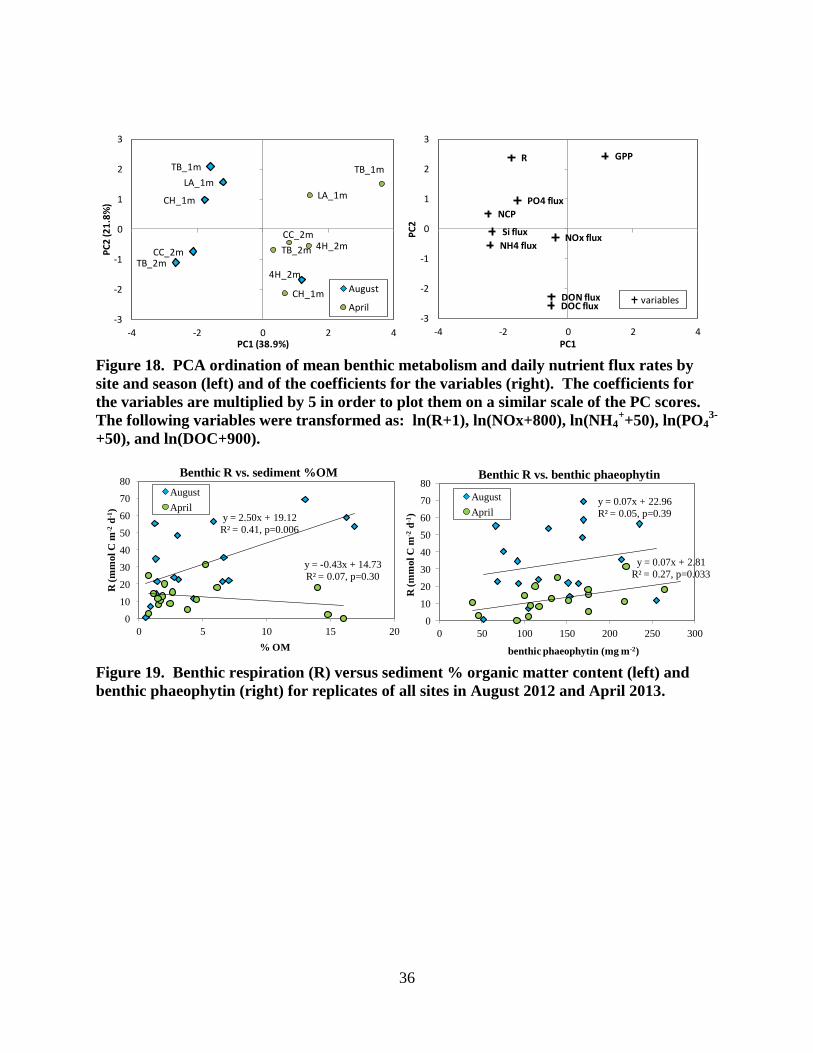
36
Figure 18. PCA ordination of mean benthic metabolism and daily nutrient flux rates by
site and season (left) and of the coefficients for the variables (right). The coefficients for
the variables are multiplied by 5 in order to plot them on a similar scale of the PC scores.
The following variables were transformed as: ln(R+1), ln(NOx+800), ln(NH4++50), ln(PO4
3-
+50), and ln(DOC+900).
Figure 19. Benthic respiration (R) versus sediment % organic matter content (left) and
benthic phaeophytin (right) for replicates of all sites in August 2012 and April 2013.
TB_1m
TB_2m
CH_1m
4H_2m
CC_2m
LA_1m
TB_1m
TB_2m
CH_1m
4H_2mCC_2m
LA_1m
-3
-2
-1
0
1
2
3
-4 -2 0 2 4
PC
2 (2
1.8
%)
PC1 (38.9%)
August
April DOC fluxDON flux
NH4 fluxNOx flux
Si flux
NCP
PO4 flux
R GPP
-3
-2
-1
0
1
2
3
-4 -2 0 2 4
PC
2
PC1
variables
y = 2.50x + 19.12
R² = 0.41, p=0.006
y = -0.43x + 14.73
R² = 0.07, p=0.30
0
10
20
30
40
50
60
70
80
0 5 10 15 20
R (
mm
ol C
m-2
d-1
)
% OM
Benthic R vs. sediment %OM
August
Aprily = 0.07x + 22.96
R² = 0.05, p=0.39
y = 0.07x + 2.81
R² = 0.27, p=0.033
0
10
20
30
40
50
60
70
80
0 50 100 150 200 250 300
R (
mm
ol
C m
-2d
-1)
benthic phaeophytin (mg m-2)
Benthic R vs. benthic phaeophytin
August
April
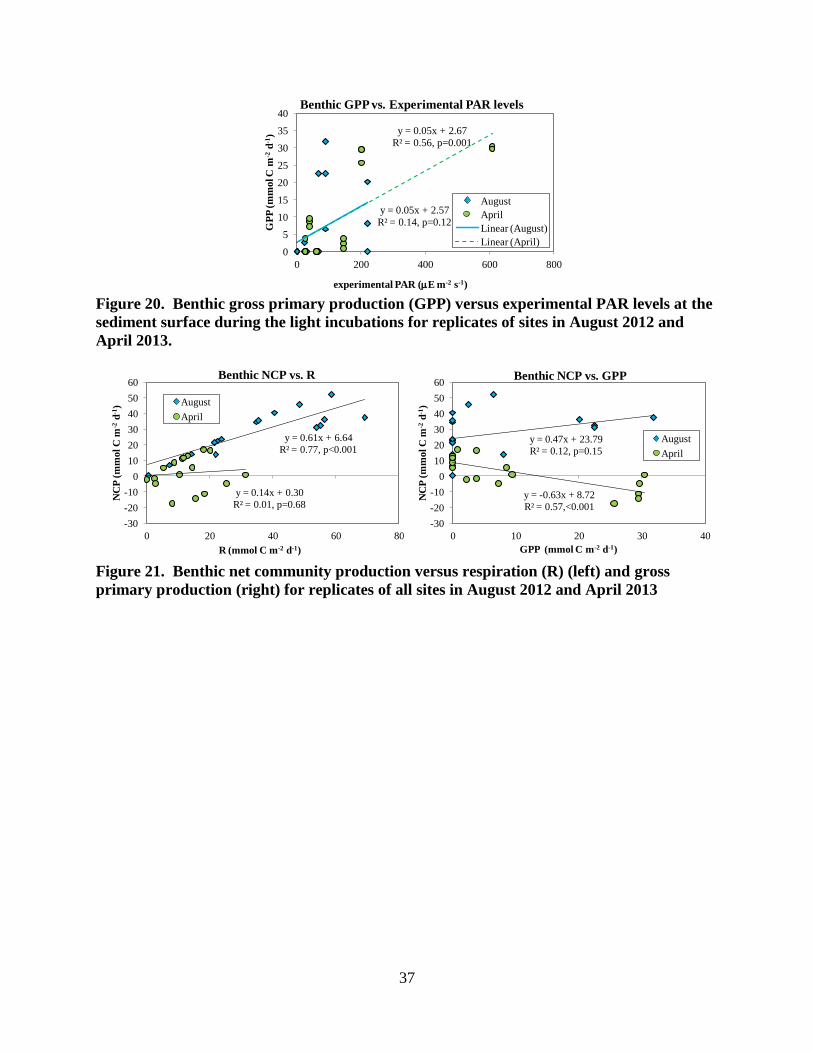
37
Figure 20. Benthic gross primary production (GPP) versus experimental PAR levels at the
sediment surface during the light incubations for replicates of sites in August 2012 and
April 2013.
Figure 21. Benthic net community production versus respiration (R) (left) and gross
primary production (right) for replicates of all sites in August 2012 and April 2013
y = 0.05x + 2.57
R² = 0.14, p=0.12
y = 0.05x + 2.67
R² = 0.56, p=0.001
0
5
10
15
20
25
30
35
40
0 200 400 600 800G
PP
(m
mo
l C m
-2d
-1)
experimental PAR (E m-2 s-1)
Benthic GPP vs. Experimental PAR levels
August
April
Linear (August)
Linear (April)
y = 0.61x + 6.64
R² = 0.77, p<0.001
y = 0.14x + 0.30
R² = 0.01, p=0.68
-30
-20
-10
0
10
20
30
40
50
60
0 20 40 60 80
NC
P (
mm
ol C
m-2
d-1
)
R (mmol C m-2 d-1)
Benthic NCP vs. R
August
April
y = 0.47x + 23.79
R² = 0.12, p=0.15
y = -0.63x + 8.72
R² = 0.57,<0.001
-30
-20
-10
0
10
20
30
40
50
60
0 10 20 30 40
NC
P (
mm
ol C
m-2
d-1
)
GPP (mmol C m-2 d-1)
Benthic NCP vs. GPP
August
April
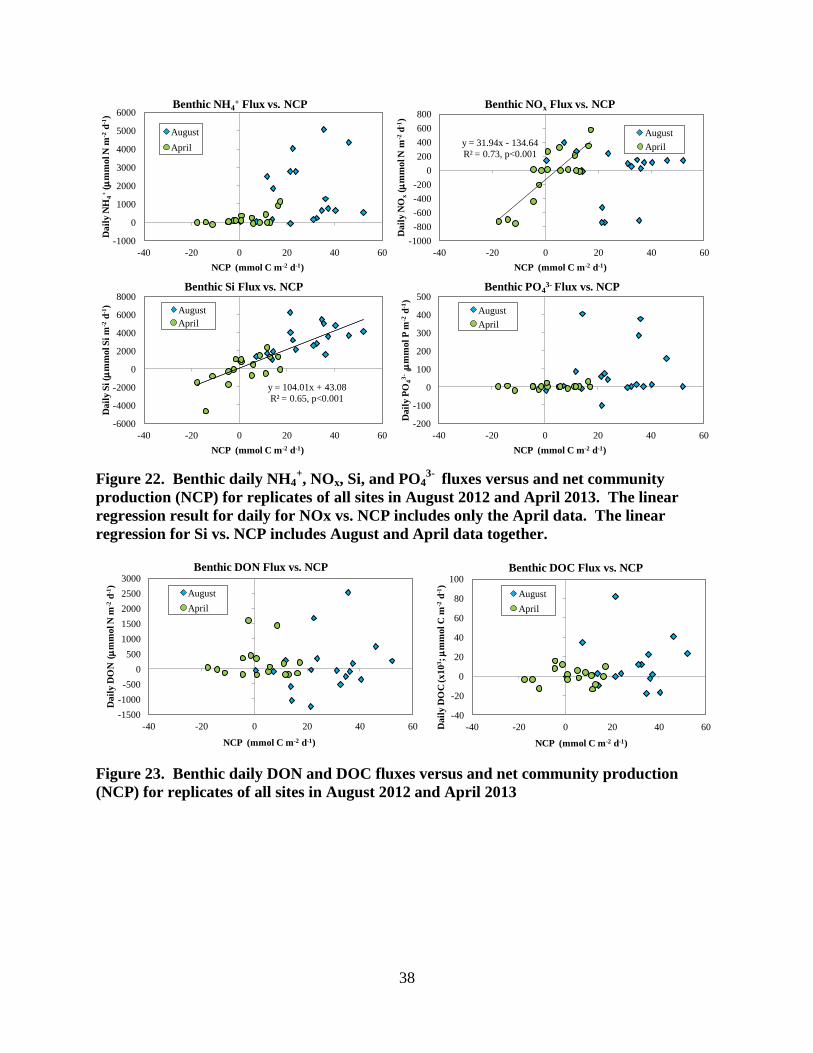
38
Figure 22. Benthic daily NH4+, NOx, Si, and PO4
3- fluxes versus and net community
production (NCP) for replicates of all sites in August 2012 and April 2013. The linear
regression result for daily for NOx vs. NCP includes only the April data. The linear
regression for Si vs. NCP includes August and April data together.
Figure 23. Benthic daily DON and DOC fluxes versus and net community production
(NCP) for replicates of all sites in August 2012 and April 2013
-1000
0
1000
2000
3000
4000
5000
6000
-40 -20 0 20 40 60
Dail
y N
H4
+(
mm
ol N
m-2
d-1
)
NCP (mmol C m-2 d-1)
Benthic NH4+ Flux vs. NCP
August
Aprily = 31.94x - 134.64
R² = 0.73, p<0.001
-1000
-800
-600
-400
-200
0
200
400
600
800
-40 -20 0 20 40 60
Da
ily
NO
x(
mm
ol N
m-2
d-1
)
NCP (mmol C m-2 d-1)
Benthic NOx Flux vs. NCP
August
April
-200
-100
0
100
200
300
400
500
-40 -20 0 20 40 60
Da
ily
PO
43
-(
mm
ol P
m-2
d-1
)
NCP (mmol C m-2 d-1)
Benthic PO43- Flux vs. NCP
August
April
y = 104.01x + 43.08
R² = 0.65, p<0.001
-6000
-4000
-2000
0
2000
4000
6000
8000
-40 -20 0 20 40 60
Dail
y S
i (
mm
ol S
i m
-2d
-1)
NCP (mmol C m-2 d-1)
Benthic Si Flux vs. NCP
August
April
-1500
-1000
-500
0
500
1000
1500
2000
2500
3000
-40 -20 0 20 40 60
Da
ily
DO
N(
mm
ol N
m-2
d-1
)
NCP (mmol C m-2 d-1)
Benthic DON Flux vs. NCP
August
April
-40
-20
0
20
40
60
80
100
-40 -20 0 20 40 60Da
ily
DO
C(x
10
3;
mm
ol
C m
-2d
-1)
NCP (mmol C m-2 d-1)
Benthic DOC Flux vs. NCP
August
April

39
Figure 24. Pelagic respiration (R), gross primary production, and net community
production (mean ± standard error) at 1m (left) and 2m (right) sites in August 2012 and
April 2013.
Pelagic Respiration
Site/water depth
TB_1m CH_1m LA_1m
R (
mm
ol
C m
-2 d
-1)
0
100
200
300
400
500
Aug 2012
April 2013
Pelagic Respiration
Site/water depth
TB_2m 4H_2m CC_2m
R (
mm
ol
C m
-2 d
-1)
0
100
200
300
400
500
Aug 2012
April 2013
Pelagic Gross Primary Production
Site/water depth
TB_1m CH_1m LA_1m
GP
P (
mm
ol
C m
-2 d
-1)
0
100
200
300
400
500
600
700
Aug 2012
April 2013
Pelagic Gross Primary Production
Site/water depth
TB_2m 4H_2m CC_2m
GP
P (
mm
ol
C m
-2 d
-1)
0
100
200
300
400
500
600
700
Aug 2012
April 2013
Pelagic Net Community Production
Site/water depth
TB_1m CH_1m LA_1m
NC
P (
mm
ol
C m
-2 d
-1)
-300
-200
-100
0
100
200
Aug 2012
April 2013
Pelagic Net Community Production
Site/water depth
TB_2m 4H_2m CC_2m
NC
P (
mm
ol
C m
-2 d
-1)
-300
-200
-100
0
100
200
Aug 2012
April 2013
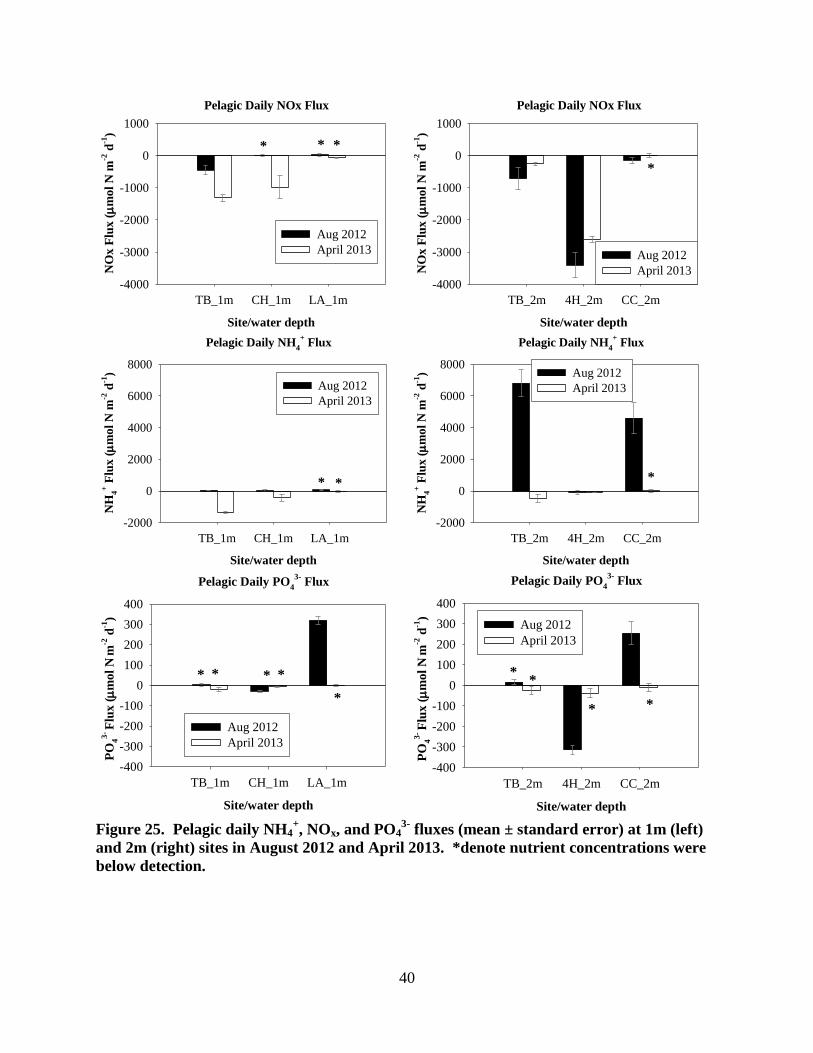
40
Figure 25. Pelagic daily NH4+, NOx, and PO4
3- fluxes (mean ± standard error) at 1m (left)
and 2m (right) sites in August 2012 and April 2013. *denote nutrient concentrations were
below detection.
Pelagic Daily NOx Flux
Site/water depth
TB_1m CH_1m LA_1m
NO
x F
lux (
mol
N m
-2 d
-1)
-4000
-3000
-2000
-1000
0
1000
Aug 2012
April 2013
* * *
Pelagic Daily NOx Flux
Site/water depth
TB_2m 4H_2m CC_2m
NO
x F
lux (
mol
N m
-2 d
-1)
-4000
-3000
-2000
-1000
0
1000
Aug 2012
April 2013
*
Pelagic Daily NH4
+ Flux
Site/water depth
TB_1m CH_1m LA_1m
NH
4
+ F
lux (
mol
N m
-2 d
-1)
-2000
0
2000
4000
6000
8000
Aug 2012
April 2013
* *
Pelagic Daily NH4
+ Flux
Site/water depth
TB_2m 4H_2m CC_2m
NH
4
+ F
lux (
mol
N m
-2 d
-1)
-2000
0
2000
4000
6000
8000Aug 2012
April 2013
*
Pelagic Daily PO4
3- Flux
Site/water depth
TB_1m CH_1m LA_1m
PO
4
3- F
lux
(
mol
N m
-2 d
-1)
-400
-300
-200
-100
0
100
200
300
400
Aug 2012
April 2013
* * * *
*
Pelagic Daily PO4
3- Flux
Site/water depth
TB_2m 4H_2m CC_2m
PO
4
3- F
lux
(
mo
l N
m-2
d-1
)
-400
-300
-200
-100
0
100
200
300
400
Aug 2012
April 2013
**
* *
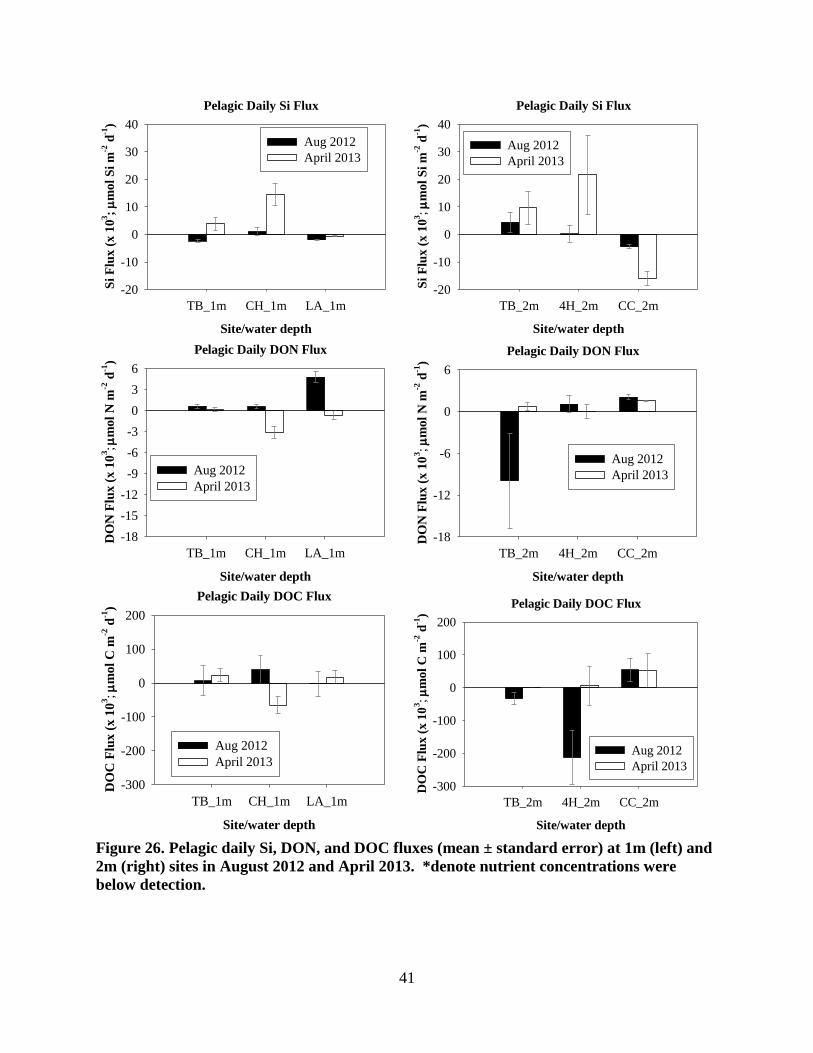
41
Figure 26. Pelagic daily Si, DON, and DOC fluxes (mean ± standard error) at 1m (left) and
2m (right) sites in August 2012 and April 2013. *denote nutrient concentrations were
below detection.
Pelagic Daily Si Flux
Site/water depth
TB_1m CH_1m LA_1m
Si
Flu
x (
x 1
03;
mol
Si
m-2
d-1
)
-20
-10
0
10
20
30
40
Aug 2012
April 2013
Pelagic Daily Si Flux
Site/water depth
TB_2m 4H_2m CC_2m
Si
Flu
x (
x 1
03;
mol
Si
m-2
d-1
)
-20
-10
0
10
20
30
40
Aug 2012
April 2013
Pelagic Daily DON Flux
Site/water depth
TB_1m CH_1m LA_1m
DO
N F
lux (
x 1
03;
mol
N m
-2 d
-1)
-18
-15
-12
-9
-6
-3
0
3
6
Aug 2012
April 2013
Pelagic Daily DON Flux
Site/water depth
TB_2m 4H_2m CC_2m
DO
N F
lux (
x 1
03;
mol
N m
-2 d
-1)
-18
-12
-6
0
6
Aug 2012
April 2013
Pelagic Daily DOC Flux
Site/water depth
TB_1m CH_1m LA_1m
DO
C F
lux
(x
10
3;
mo
l C
m-2
d-1
)
-300
-200
-100
0
100
200
Aug 2012
April 2013
Pelagic Daily DOC Flux
Site/water depth
TB_2m 4H_2m CC_2m
DO
C F
lux (
x 1
03;
mol
C m
-2 d
-1)
-300
-200
-100
0
100
200
Aug 2012
April 2013
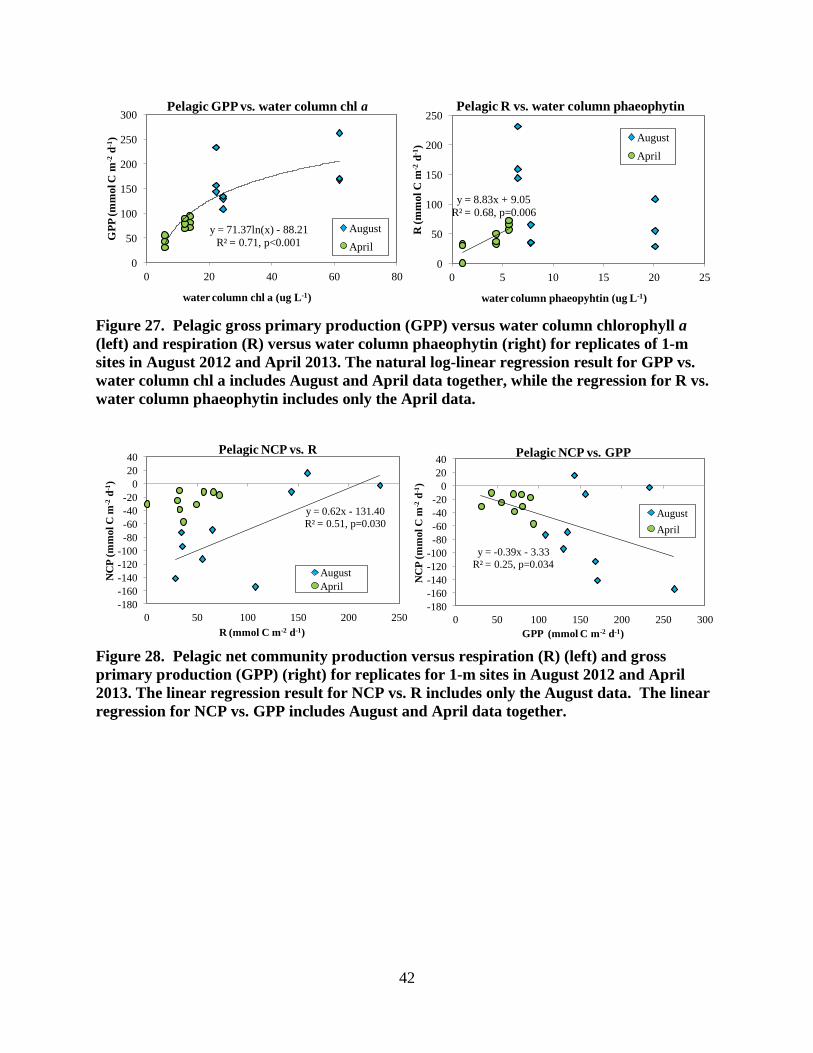
42
Figure 27. Pelagic gross primary production (GPP) versus water column chlorophyll a
(left) and respiration (R) versus water column phaeophytin (right) for replicates of 1-m
sites in August 2012 and April 2013. The natural log-linear regression result for GPP vs.
water column chl a includes August and April data together, while the regression for R vs.
water column phaeophytin includes only the April data.
Figure 28. Pelagic net community production versus respiration (R) (left) and gross
primary production (GPP) (right) for replicates for 1-m sites in August 2012 and April
2013. The linear regression result for NCP vs. R includes only the August data. The linear
regression for NCP vs. GPP includes August and April data together.
y = 71.37ln(x) - 88.21
R² = 0.71, p<0.001
0
50
100
150
200
250
300
0 20 40 60 80
GP
P (
mm
ol C
m-2
d-1
)
water column chl a (ug L-1)
Pelagic GPP vs. water column chl a
August
April
y = 8.83x + 9.05
R² = 0.68, p=0.006
0
50
100
150
200
250
0 5 10 15 20 25
R (
mm
ol
C m
-2d
-1)
water column phaeopyhtin (ug L-1)
Pelagic R vs. water column phaeophytin
August
April
y = 0.62x - 131.40
R² = 0.51, p=0.030
-180
-160
-140
-120
-100
-80
-60
-40
-20
0
20
40
0 50 100 150 200 250
NC
P (
mm
ol C
m-2
d-1
)
R (mmol C m-2 d-1)
Pelagic NCP vs. R
August
April
y = -0.39x - 3.33
R² = 0.25, p=0.034
-180
-160
-140
-120
-100
-80
-60
-40
-20
0
20
40
0 50 100 150 200 250 300
NC
P (
mm
ol
C m
-2d
-1)
GPP (mmol C m-2 d-1)
Pelagic NCP vs. GPP
August
April
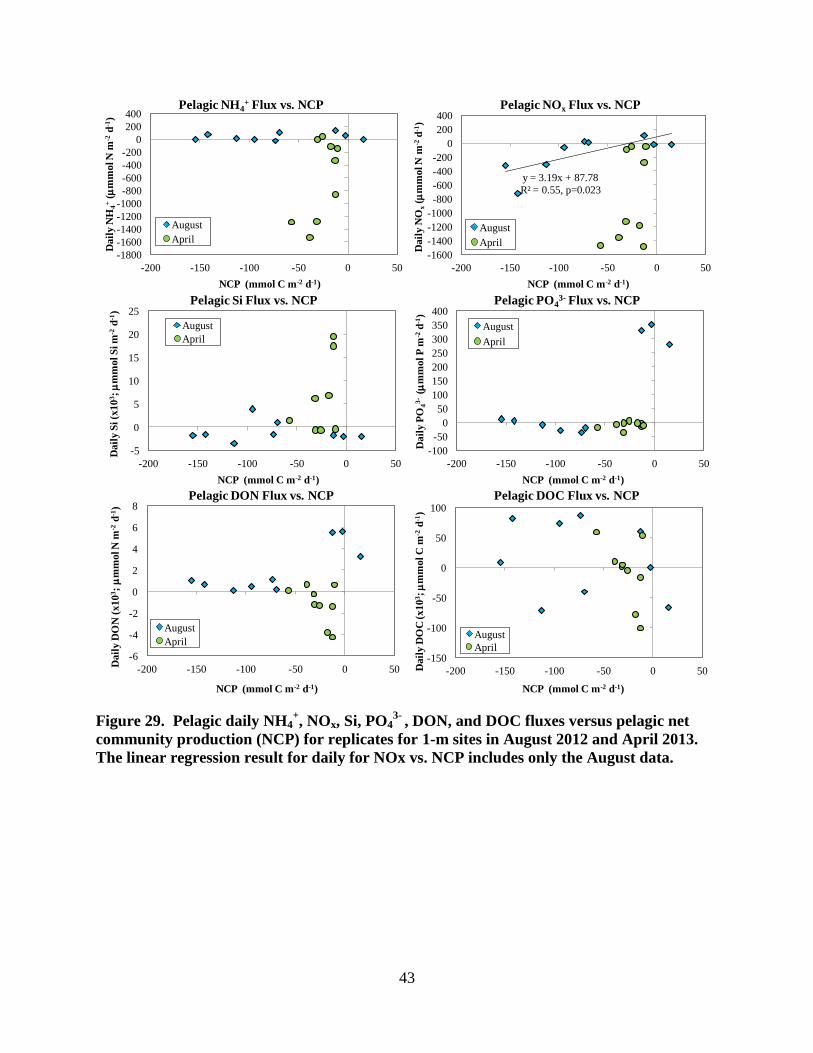
43
Figure 29. Pelagic daily NH4+, NOx, Si, PO4
3- , DON, and DOC fluxes versus pelagic net
community production (NCP) for replicates for 1-m sites in August 2012 and April 2013.
The linear regression result for daily for NOx vs. NCP includes only the August data.
-1800
-1600
-1400
-1200
-1000
-800
-600
-400
-200
0
200
400
-200 -150 -100 -50 0 50
Dail
y N
H4
+(
mm
ol N
m-2
d-1
)
NCP (mmol C m-2 d-1)
Pelagic NH4+ Flux vs. NCP
August
April
y = 3.19x + 87.78
R² = 0.55, p=0.023
-1600
-1400
-1200
-1000
-800
-600
-400
-200
0
200
400
-200 -150 -100 -50 0 50
Da
ily
NO
x(
mm
ol N
m-2
d-1
)
NCP (mmol C m-2 d-1)
Pelagic NOx Flux vs. NCP
August
April
-100
-50
0
50
100
150
200
250
300
350
400
-200 -150 -100 -50 0 50
Da
ily
PO
43
-(
mm
ol P
m-2
d-1
)
NCP (mmol C m-2 d-1)
Pelagic PO43- Flux vs. NCP
August
April
-5
0
5
10
15
20
25
-200 -150 -100 -50 0 50
Da
ily
Si (x
10
3;
mm
ol S
i m
-2d
-1)
NCP (mmol C m-2 d-1)
Pelagic Si Flux vs. NCP
August
April
-6
-4
-2
0
2
4
6
8
-200 -150 -100 -50 0 50
Da
ily
DO
N (
x1
03;
mm
ol N
m-2
d-1
)
NCP (mmol C m-2 d-1)
Pelagic DON Flux vs. NCP
August
April
-150
-100
-50
0
50
100
-200 -150 -100 -50 0 50Da
ily
DO
C(x
10
3;
mm
ol C
m-2
d-1
)
NCP (mmol C m-2 d-1)
Pelagic DOC Flux vs. NCP
August
April
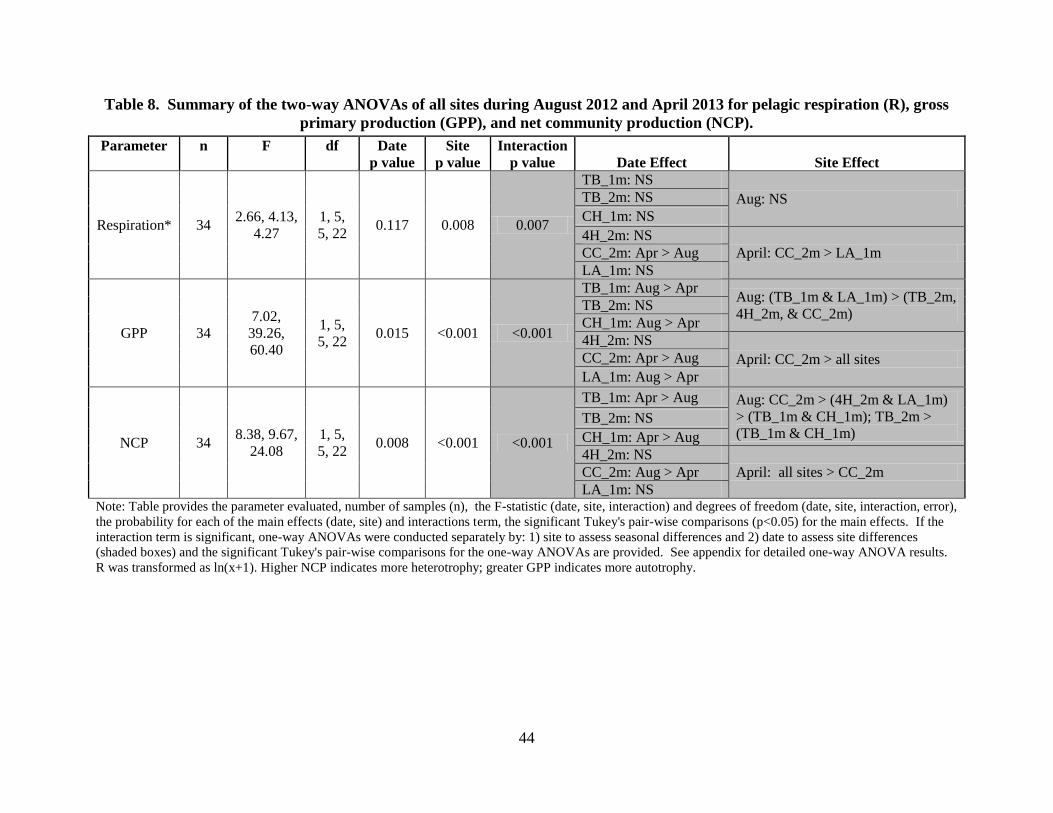
44
Table 8. Summary of the two-way ANOVAs of all sites during August 2012 and April 2013 for pelagic respiration (R), gross
primary production (GPP), and net community production (NCP).
Parameter n F df Date
p value
Site
p value
Interaction
p value Date Effect Site Effect
Respiration* 34 2.66, 4.13,
4.27
1, 5,
5, 22 0.117 0.008 0.007
TB_1m: NS
Aug: NS TB_2m: NS
CH_1m: NS
4H_2m: NS
April: CC_2m > LA_1m CC_2m: Apr > Aug
LA_1m: NS
GPP 34
7.02,
39.26,
60.40
1, 5,
5, 22 0.015 <0.001 <0.001
TB_1m: Aug > Apr Aug: (TB_1m & LA_1m) > (TB_2m,
4H_2m, & CC_2m) TB_2m: NS
CH_1m: Aug > Apr
4H_2m: NS
April: CC_2m > all sites CC_2m: Apr > Aug
LA_1m: Aug > Apr
NCP 34 8.38, 9.67,
24.08
1, 5,
5, 22 0.008 <0.001 <0.001
TB_1m: Apr > Aug Aug: CC_2m > (4H_2m & LA_1m)
> (TB_1m & CH_1m); TB_2m >
(TB_1m & CH_1m) TB_2m: NS
CH_1m: Apr > Aug
4H_2m: NS
April: all sites > CC_2m CC_2m: Aug > Apr
LA_1m: NS Note: Table provides the parameter evaluated, number of samples (n), the F-statistic (date, site, interaction) and degrees of freedom (date, site, interaction, error),
the probability for each of the main effects (date, site) and interactions term, the significant Tukey's pair-wise comparisons (p<0.05) for the main effects. If the
interaction term is significant, one-way ANOVAs were conducted separately by: 1) site to assess seasonal differences and 2) date to assess site differences
(shaded boxes) and the significant Tukey's pair-wise comparisons for the one-way ANOVAs are provided. See appendix for detailed one-way ANOVA results.
R was transformed as ln(x+1). Higher NCP indicates more heterotrophy; greater GPP indicates more autotrophy.
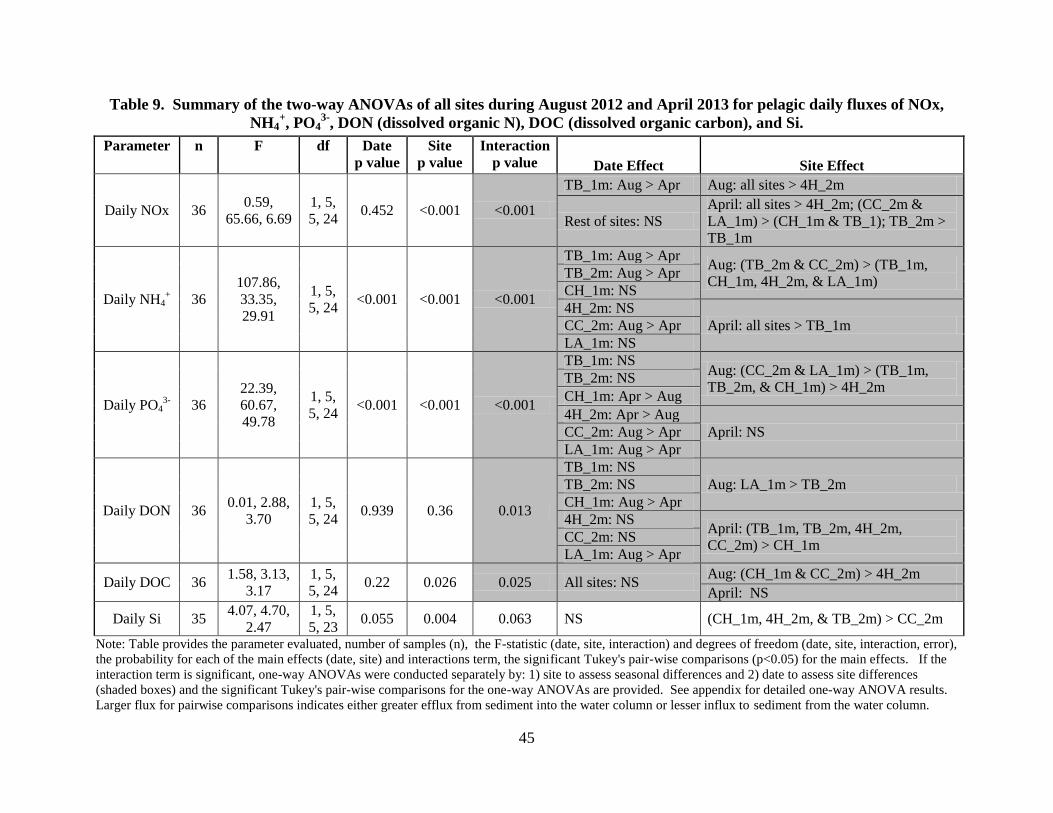
45
Table 9. Summary of the two-way ANOVAs of all sites during August 2012 and April 2013 for pelagic daily fluxes of NOx,
NH4+, PO4
3-, DON (dissolved organic N), DOC (dissolved organic carbon), and Si.
Parameter n F df Date
p value
Site
p value
Interaction
p value Date Effect Site Effect
Daily NOx 36 0.59,
65.66, 6.69
1, 5,
5, 24 0.452 <0.001 <0.001
TB_1m: Aug > Apr Aug: all sites > 4H_2m
Rest of sites: NS
April: all sites > 4H_2m; (CC_2m &
LA_1m) > (CH_1m & TB_1); TB_2m >
TB_1m
Daily NH4+
36
107.86,
33.35,
29.91
1, 5,
5, 24 <0.001 <0.001 <0.001
TB_1m: Aug > Apr Aug: (TB_2m & CC_2m) > (TB_1m,
CH_1m, 4H_2m, & LA_1m) TB_2m: Aug > Apr
CH_1m: NS
4H_2m: NS
April: all sites > TB_1m CC_2m: Aug > Apr
LA_1m: NS
Daily PO43-
36
22.39,
60.67,
49.78
1, 5,
5, 24 <0.001 <0.001 <0.001
TB_1m: NS Aug: (CC_2m & LA_1m) > (TB_1m,
TB_2m, & CH_1m) > 4H_2m TB_2m: NS
CH_1m: Apr > Aug
4H_2m: Apr > Aug
April: NS CC_2m: Aug > Apr
LA_1m: Aug > Apr
Daily DON 36 0.01, 2.88,
3.70
1, 5,
5, 24 0.939 0.36 0.013
TB_1m: NS
Aug: LA_1m > TB_2m TB_2m: NS
CH_1m: Aug > Apr
4H_2m: NS April: (TB_1m, TB_2m, 4H_2m,
CC_2m) > CH_1m CC_2m: NS
LA_1m: Aug > Apr
Daily DOC 36 1.58, 3.13,
3.17
1, 5,
5, 24 0.22 0.026 0.025 All sites: NS
Aug: (CH_1m & CC_2m) > 4H_2m
April: NS
Daily Si 35 4.07, 4.70,
2.47
1, 5,
5, 23 0.055 0.004 0.063 NS (CH_1m, 4H_2m, & TB_2m) > CC_2m
Note: Table provides the parameter evaluated, number of samples (n), the F-statistic (date, site, interaction) and degrees of freedom (date, site, interaction, error),
the probability for each of the main effects (date, site) and interactions term, the significant Tukey's pair-wise comparisons (p<0.05) for the main effects. If the
interaction term is significant, one-way ANOVAs were conducted separately by: 1) site to assess seasonal differences and 2) date to assess site differences
(shaded boxes) and the significant Tukey's pair-wise comparisons for the one-way ANOVAs are provided. See appendix for detailed one-way ANOVA results.
Larger flux for pairwise comparisons indicates either greater efflux from sediment into the water column or lesser influx to sediment from the water column.
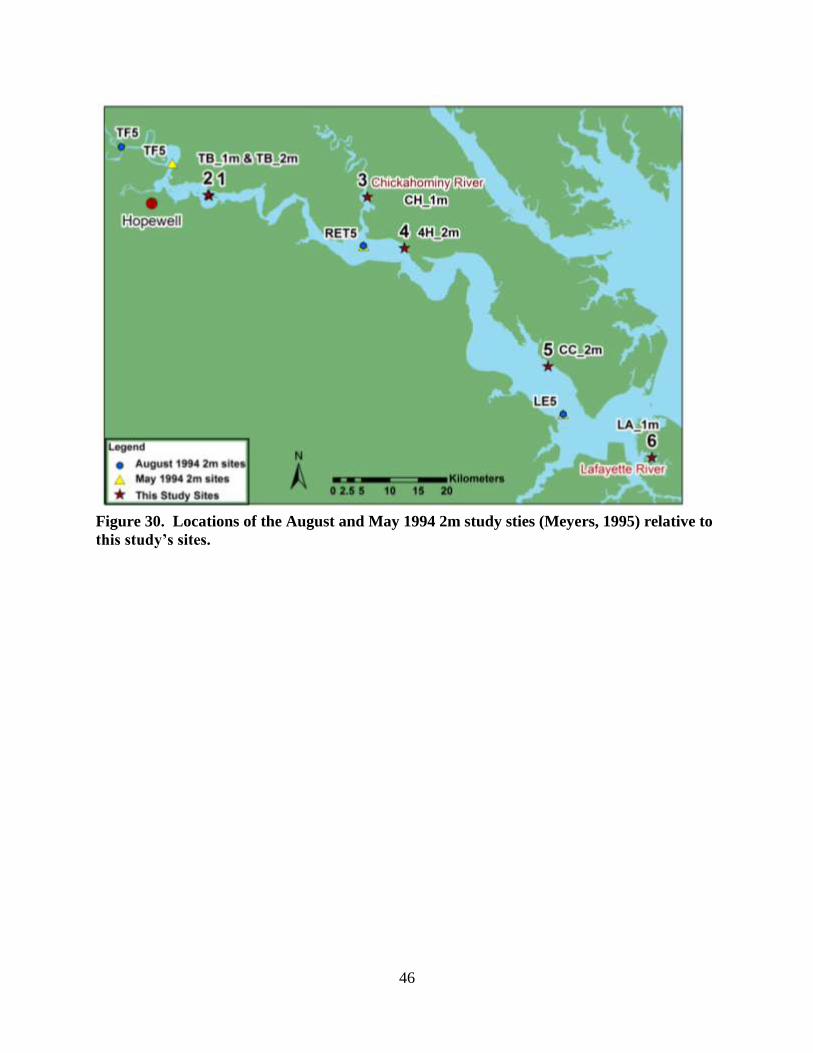
46
Figure 30. Locations of the August and May 1994 2m study sties (Meyers, 1995) relative to
this study’s sites.
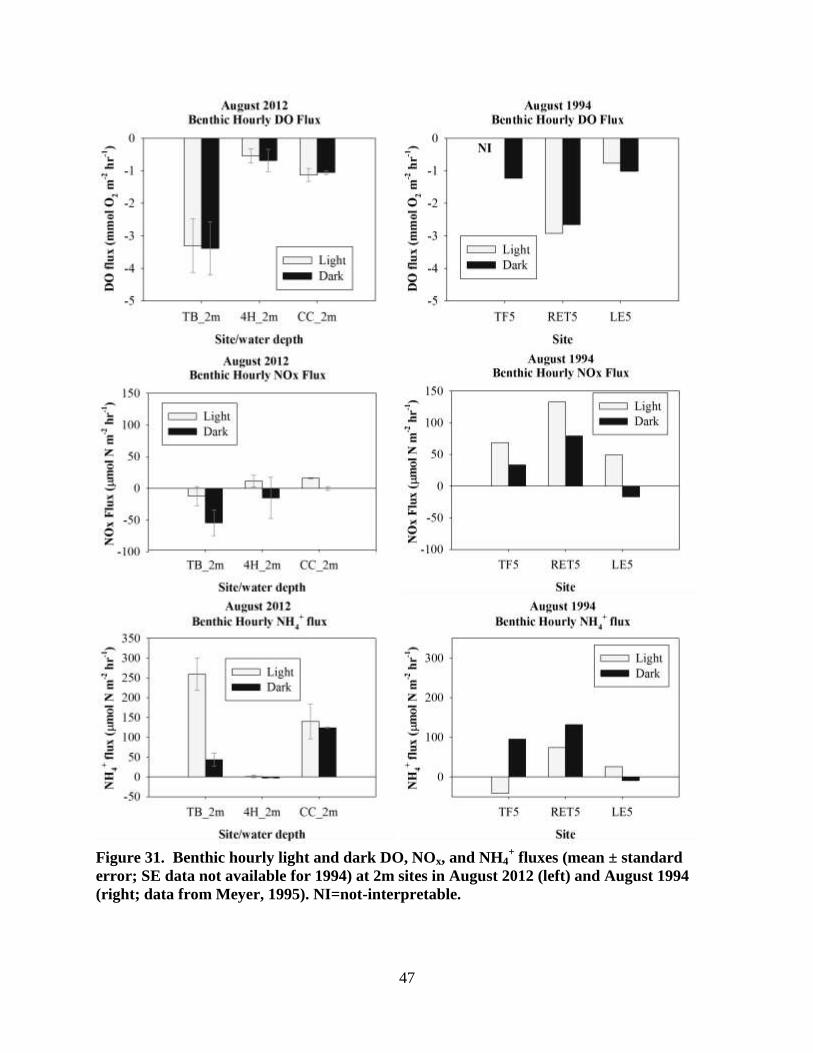
47
Figure 31. Benthic hourly light and dark DO, NOx, and NH4+ fluxes (mean ± standard
error; SE data not available for 1994) at 2m sites in August 2012 (left) and August 1994
(right; data from Meyer, 1995). NI=not-interpretable.
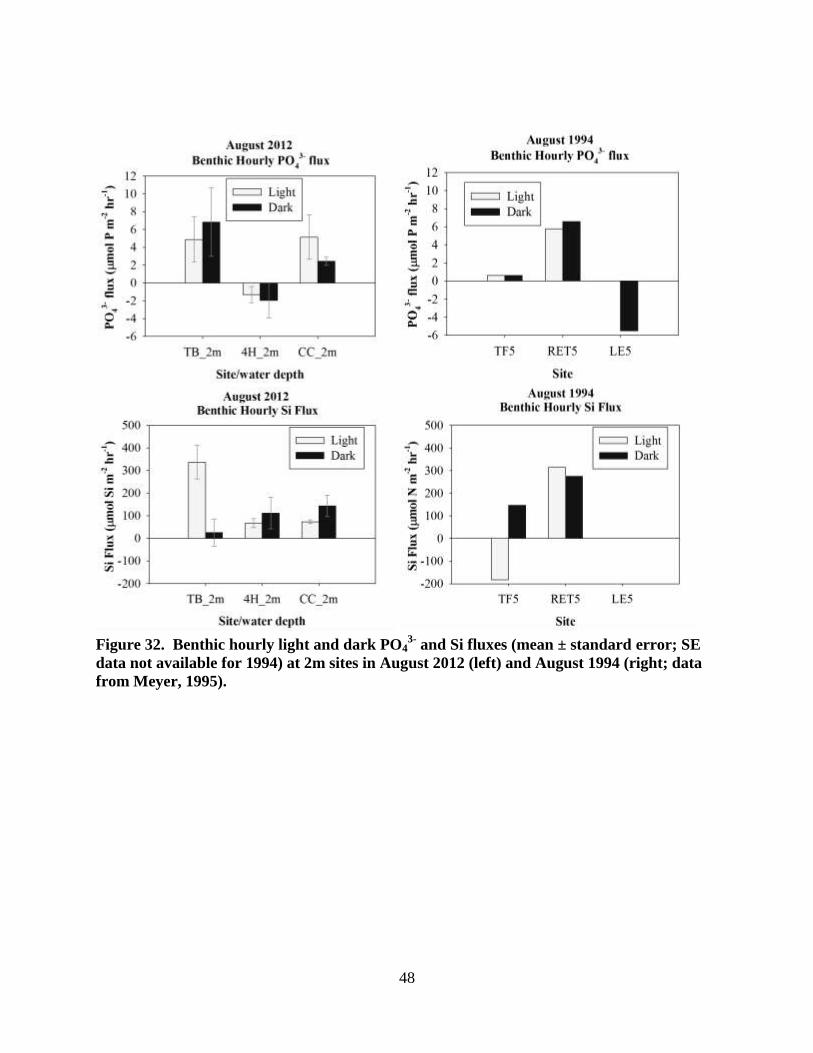
48
Figure 32. Benthic hourly light and dark PO43-
and Si fluxes (mean ± standard error; SE
data not available for 1994) at 2m sites in August 2012 (left) and August 1994 (right; data
from Meyer, 1995).
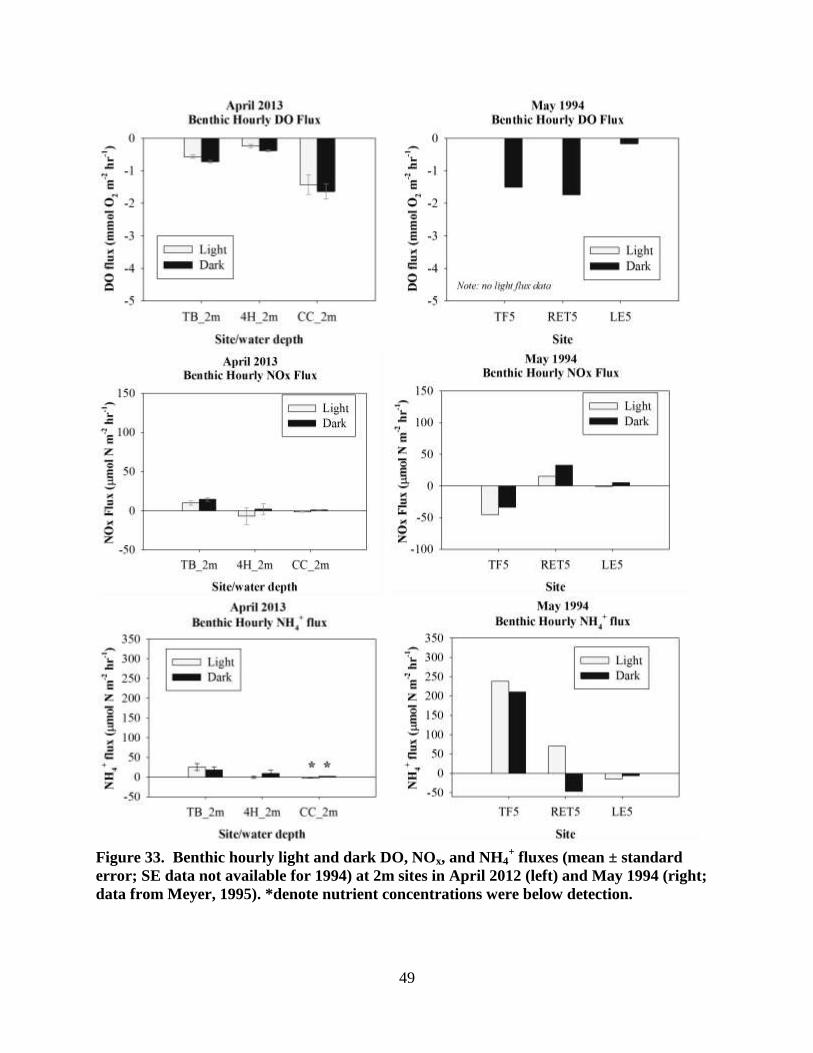
49
Figure 33. Benthic hourly light and dark DO, NOx, and NH4+ fluxes (mean ± standard
error; SE data not available for 1994) at 2m sites in April 2012 (left) and May 1994 (right;
data from Meyer, 1995). *denote nutrient concentrations were below detection.
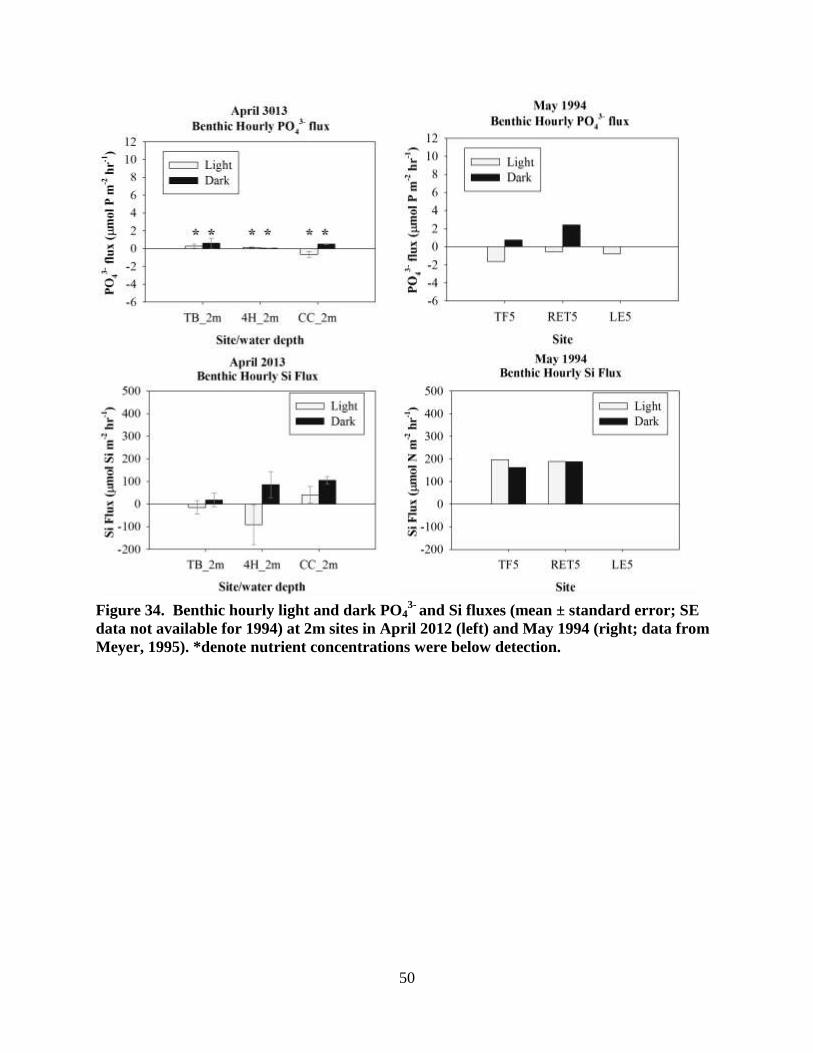
50
Figure 34. Benthic hourly light and dark PO43-
and Si fluxes (mean ± standard error; SE
data not available for 1994) at 2m sites in April 2012 (left) and May 1994 (right; data from
Meyer, 1995). *denote nutrient concentrations were below detection.
51
References
Anderson. I.C., M. J. Brush, M. F. Piehler, C. A. Currin, J. W. Stanhope, A. R. Smyth, J. D.
Maxey, M. L. Whitehead. 2014. Impacts of climate related drivers on the benthic nutrient
filter in a shallow photic estuary. Estuaries and Coasts 37: S46-S62.
Anderson, I.C., K.J. McGlathery, and A.C. Tyler. 2003. Microbial mediation of “reactive”
nitrogen in a temperate lagoon. Marine Ecology Progress Series 246:73–84.
Arar, E.J. and Collins, G.B, 1997. In Vitro Determination of Chlorophyll a and Phaeophytin a in
Marine and Freshwater Algae by Fluorescence. Method 445.0, Revision 1.2. National
Exposure Research Laboratory, Office of Research and Development, U.S. Environmental
Protection Agency, Cincinnati, OH.
Aspila, K. I., H. Agemian, and A. S. Chau. 1976. A semi-automated method for the
determination of inorganic, organic and total phosphate in sediments. Analyst 101: 187-
197.Keeney, D.R. and D.W. Nelson. 1982. Nitrogen-Inorganic forms. p. 643-693. In A.L.
Page et al. (ed.) Methods of soil analysis. 2nd ed. ASA, CSSA, and SSSA, Madison, WI.
Cerco, C. F. 1985. Sediment-water column exchanges of nutrients and oxygen in the tidal James
and Appomattox rivers. National Tech. Information Service, PB85-242915 XAB. 110 pp.
Eyre, B.D., and A.J.P. Ferguson. 2005. Benthic metabolism and nitrogen cycling in a subtropical
east Australian estuary Brunswick: Temporal variability and controlling factors.
Limnology and Oceanography 50:81–96.
Ferguson A., B. Eyre, J. Gay, N. Emtage, and L. Brooks. 2007. Benthic metabolism and nitrogen
cycling in a sub-tropical coastal embayment: spatial and seasonal variation and
controlling factors. Aquatic Microbial Ecology 48:175-195.
Knepel, K. and K. Bogren. 2001. Revised 2002. Determination of orthophosphate by flow
injection analysis. QuikChem Method 31-115-01-1-H. Lachat Instruments, Milwaukee, WI,
USA.
Koroleff, F. 1983. Total and organic nitrogen. Pp. 162-169, In: Methods of Seawater Analysis
(K. Grasshoff, M. Ehrhardt, and K. Kremling, eds). Verlag-Chemie, Weinheim, Germany.
Liao, N. 2001. Revised 2002. Determination of ammonia in brackish or seawater by flow
injection analysis. QuikChem Method 31-107-06-1-B. Lachat Instruments, Milwaukee, WI,
USA.
Lorenzen, C. 1967. Determination of chlorophyll and phaeopigments: Spectrophotometric
equations. Limnol. Oceanogr. 12: 343-346.
Meyer, M.B. 1995. irginia’s enhanced tributary monitoring and modeling program: sediment
oxygen and nutrient exchange project. 1994 Final Report. Submitted to Virginia
Department of Environmental Quality. 49 pp.
52
Neubauer, S. C. and Anderson, I. C. 2003. Transport of dissolved inorganic carbon from a tidal
freshwater marsh to the York and Pamunkey river estuary. Limnol. Oceanogr. 48:299-307.
Neubauer, S.C., Miller, W.D., and Anderson, I.C. 2000. Carbon cycling in a tidal freshwater
marsh ecosystem: A gas flux study.Mar. Ecol. Prog. Ser. 199: 13-30.
Plumb, R.H. Jr. 1981. Procedure for Handling and Chemical Analysis of Sediment and Water
Samples. Technical Report. EPA/CE-81-1. Prepared by Great Lakes Laboratory, State
University College at Buffalo, NY for the U.S. Environmental Protection Agency/ Corps of
Engineers Technical Committee on Criteria for Dredged and Filled Material:
Environmental Laboratory, U.S. Army Waterways Experiment Station, Vicksburg, MS.
403 pp.
Shoaf W.T. and B.W. Lium. 1976. Improved extraction of chlorophyll a and b from algae using
dimethylsulfoxide. Limnol Oceanogr 21:926–928
Smith, P. and K. Bogren. 2001. Determination of nitrate and/or nitrite in brackish or seawater by
flow injection analysis colorimetry. QuikChem Method 31-107-04-1-E. Lachat Instruments,
Milwaukee, WI, USA.
Sundbäck, K., A. Miles, and E.Göransson. 2000. Nitrogen fluxes, denitrification and the role of
microphytobenthos in microtidal shallow-water sediments: an annual study. Marine
Ecology Progress Series 200:59-76.
Sundbäck, K., F. Linares, F. Larson, A. Wulff, and A. Engelsen. 2004. Benthic nitrogen fluxes
along a depth gradient in a microtidal fjord: The role of denitrification and
microphytobenthos. Limnology and Oceanography 49:1095–1107.
Wolters, M. 2002. Determination of silicate in brackish or seawater by flow injection analysis.
QuikChem Method 31-114-27-1-D. Lachat Instruments, Milwaukee, WI, USA.
53
Appendix
Table A1. Date and location of each replicate sediment core collected for each site
Site#-replicate#
Site
abbreviation Date collected
Latitude
(DD)
Longitude
(DD)
1-1 TB_1m 8/13/2012 37.30583 -77.18508
1-2 TB_1m 8/13/2012 37.30575 -77.18472
1-3 TB_1m 8/13/2012 37.30572 -77.18444
2-1 TB_2m 8/13/2012 37.30733 -77.18828
2-2 TB_2m 8/13/2012 37.30692 -77.18706
2-3 TB_2m 8/13/2012 37.30625 -77.18492
3-1 CH_1m 8/20/2012 37.31061 -76.86958
3-2 CH_1m 8/20/2012 37.30950 -76.87067
3-3 CH_1m 8/20/2012 37.30883 -76.87089
4-1 4H_2m 8/20/2012 37.22906 -76.79528
4-2 4H_2m 8/20/2012 37.22694 -76.79175
4-3 4H_2m 8/20/2012 37.22547 -76.79117
5-1 CC_2m 8/15/2012 not reported not reported
5-2 CC_2m 8/15/2012 37.04481 -76.50661
5-3 CC_2m 8/15/2012 37.04481 -76.50661
6-1 LA_1m 8/15/2012 36.90308 -76.30008
6-2 LA_1m 8/15/2012 36.90214 -76.29883
6-3 LA_1m 8/15/2012 36.90214 -76.29886
1-1 TB_1m 4/9/2013 37.30650 -77.18656
1-2 TB_1m 4/9/2013 37.30581 -77.18456
1-3 TB_1m 4/9/2013 37.30556 -77.18403
2-1 TB_2m 4/9/2013 37.30578 -77.18300
2-2 TB_2m 4/9/2013 37.30558 -77.18258
2-3 TB_2m 4/9/2013 37.30519 -77.18017
3-1 CH_1m 4/1/2013 37.31097 -76.86956
3-2 CH_1m 4/1/2013 37.31200 -76.86744
3-3 CH_1m 4/1/2013 37.30867 -76.86883
4-1 4H_2m 4/1/2013 37.22894 -76.79536
4-2 4H_2m 4/1/2013 37.22728 -76.79372
4-3 4H_2m 4/1/2013 37.22550 -76.79133
5-1 CC_2m 4/3/2013 37.04506 -76.50694
5-2 CC_2m 4/3/2013 37.04461 -76.50539
5-3 CC_2m 4/3/2013 37.04458 -76.50533
6-1 LA_1m 4/3/2013 36.90192 -76.29864
6-2 LA_1m 4/3/2013 36.90194 -76.29750
6-3 LA_1m 4/3/2013 36.90181 -76.29697
54
Table A2. Mean (standard error [SE]) benthic light and dark dissolved oxygen (DO) fluxes and sediment oxygen demand
(SOD) by site and date. Site
abbreviation Date light DO flux SE
dark DO
flux SE SOD SE
mmol O2 m-2
h-1
mmol O2 m-2
d-1
TB_1m August 2012 -2.95 0.77 -1.72 0.32 41.17 7.65
TB_2m August 2012 -3.30 0.82 -3.38 0.82 81.22 19.69
CH_1m August 2012 -0.57 0.24 -1.57 0.02 37.76 0.40
4H_2m August 2012 -0.54 0.22 -0.68 0.34 16.42 8.16
CC_2m August 2012 -1.13 0.20 -1.06 0.05 25.34 1.31
LA_1m August 2012 -1.33 0.89 -1.15 0.30 27.68 7.27
TB_1m April 2013 1.63 0.04 -1.31 0.10 31.33 2.29
TB_2m April 2013 -0.57 0.05 -0.72 0.04 17.40 1.05
CH_1m April 2013 -0.29 0.10 -0.69 0.06 16.60 1.37
4H_2m April 2013 -0.24 0.05 -0.38 0.03 9.19 0.64
CC_2m April 2013 -1.43 0.30 -1.64 0.23 39.40 5.56
LA_1m April 2013 0.38 0.13 -1.17 0.06 28.11 1.46
Table A3. Mean (standard error [SE]) benthic light and dark dissolved inorganic carbon (DIC) fluxes, respiration, net
community production (NCP), and gross primary production (GPP) by site and date. Site abbreviation Date light DIC flux SE dark DIC flux SE Respiration SE NCP SE GPP SE
mmol C m-2
h-1
mmol O2 m-2
d-1
TB_1m August 2012 2.03 0.73 1.81 0.25 43.37 6.09 35.87 2.34 7.51 7.51
TB_2m August 2012 2.52 0.19 1.10 0.19 26.43 4.53 26.43 4.53 0.00 0.00
CH_1m August 2012 1.02 0.47 2.52 0.19 60.49 4.57 40.22 6.21 20.28 7.41
4H_2m August 2012 0.77 0.19 0.40 0.26 9.68 6.21 9.68 6.21 0.00 0.00
CC_2m August 2012 1.77 0.43 1.17 0.45 27.99 10.83 27.16 10.04 0.84 0.84
LA_1m August 2012 1.59 1.01 1.28 0.54 30.76 12.95 21.35 7.39 9.41 5.85
TB_1m April 2013 -1.68 0.04 0.58 0.13 13.82 3.05 -14.39 1.83 28.21 1.29
TB_2m April 2013 0.69 0.08 0.51 0.18 12.15 4.30 10.90 3.18 1.26 1.26
CH_1m April 2013 0.10 0.29 0.28 0.24 6.76 5.65 4.46 6.35 2.30 0.87
4H_2m April 2013 -0.29 0.11 0.38 0.14 9.17 3.38 0.71 2.96 8.46 0.62
CC_2m April 2013 1.76 0.22 0.46 0.05 11.09 1.29 11.09 1.29 0.00 0.00
LA_1m April 2013 -0.95 0.28 1.17 0.13 28.19 3.03 -1.88 2.64 30.07 0.39
55
Table A3. Mean (standard error [SE]) benthic light and dark NOx fluxes and daily NOx flux by site and date. Site
abbreviation Date
light NOx
flux SE
dark NOx
flux SE
Daily NOx
flux SE
µmol N m-2
h-1
µmol N m-2
d-1
TB_1m August 2012 9.73 7.45 -2.67 9.59 103.30 26.13
TB_2m August 2012 -12.34 15.21 -54.31 20.19 -736.75 9.32
CH_1m August 2012 BD
12.01 1.24 112.31 11.99
4H_2m August 2012 11.39 9.40 -15.07 32.60 -4.51 275.74
CC_2m August 2012 15.78 1.15 -0.14 2.89 211.51 38.45
LA_1m August 2012 BD
BD
BD
TB_1m April 2013 -30.34 2.23 -30.82 1.16 -733.76 16.97
TB_2m April 2013 9.79 2.58 14.46 2.21 288.68 43.80
CH_1m April 2013 -2.65 9.86 13.20 10.17 118.72 233.62
4H_2m April 2013 -7.04 10.50 2.09 6.77 -63.98 206.12
CC_2m April 2013 -1.66 0.25 1.14 0.32 BD
LA_1m April 2013 BD
BD
BD
BD=below detection.
Table A4. Mean (standard error [SE]) benthic light and dark NH4+ fluxes and daily NH4
+ flux by site and date.
Site
abbreviation Date
light NH4+
flux SE
dark NH4+
flux SE
Daily NH4+
flux SE
µmol N m-2
h-1
µmol N m-2
d-1
TB_1m August 2012 7.00 4.33 39.29 9.65 507.10 144.40
TB_2m August 2012 259.23 40.77 43.18 16.17 3952.96 669.21
CH_1m August 2012 -2.74 1.84 49.96 14.72 487.56 175.47
4H_2m August 2012 1.07 2.96 -2.50 0.53 -11.78 34.37
CC_2m August 2012 140.27 43.99 124.17 1.79 3197.53 582.49
LA_1m August 2012 47.06 36.00 41.73 20.54 1073.43 496.24
TB_1m April 2013 -6.90 4.13 4.04 1.33 -39.78 38.41
TB_2m April 2013 25.30 8.89 17.82 8.15 521.25 204.85
CH_1m April 2013 31.47 12.87 3.80 14.94 437.09 332.73
4H_2m April 2013 -0.72 2.54 8.78 8.34 91.94 121.69
CC_2m April 2013 BD
BD
BD
LA_1m April 2013 BD
BD
BD
BD=below detection.
56
Table A5. Mean (standard error [SE]) benthic light and dark PO43-
fluxes and daily PO43-
flux by site and date. Site
abbreviation Date
light PO43-
flux SE
dark PO43-
flux SE
Daily PO43-
flux SE
µmol P m-2
h-1
µmol P m-2
d-1
TB_1m August 2012 BD
0.78 0.45 8.77 4.48
TB_2m August 2012 4.89 2.52 6.82 3.84 137.60 74.11
CH_1m August 2012 BD
BD
BD
4H_2m August 2012 -1.31 0.90 -1.97 1.96 -38.31 32.65
CC_2m August 2012 5.15 2.49 2.43 0.45 95.01 34.30
LA_1m August 2012 18.34 8.95 0.76 1.87 255.64 133.09
TB_1m April 2013 BD
BD
BD
TB_2m April 2013 BD
BD
BD
CH_1m April 2013 BD
BD
BD
4H_2m April 2013 BD
BD
BD
CC_2m April 2013 BD
BD
BD
LA_1m April 2013 BD
BD
BD
BD=below detection.
Table A6. Mean (standard error [SE]) benthic light and dark dissolved organic nitrogen (DON) fluxes and daily DON flux by
site and date. Site
abbreviation Date
light DON
flux SE
dark DON
flux SE
Daily DON
flux SE
µmol N m-2
h-1
µmol N m-2
d-1
TB_1m August 2012 -10.23 28.06 -21.94 31.59 -368.51 73.51
TB_2m August 2012 15.30 74.36 74.52 19.54 989.00 1149.28
CH_1m August 2012 6.15 3.42 4.07 4.77 125.68 95.90
4H_2m August 2012 3.27 5.85 -9.71 7.55 -57.79 14.38
CC_2m August 2012 22.40 9.58 14.24 5.87 451.99 141.61
LA_1m August 2012 -16.97 16.23 -32.88 6.58 -574.36 275.76
TB_1m April 2013 -8.55 5.53 6.39 1.39 -33.41 53.75
TB_2m April 2013 -5.98 5.67 5.65 2.70 -9.85 99.69
CH_1m April 2013 102.90 103.64 -46.98 131.16 745.98 425.66
4H_2m April 2013 -17.38 6.98 9.05 7.43 -113.21 87.29
CC_2m April 2013 3.47 2.87 27.11 50.63 355.08 546.32
LA_1m April 2013 2.45 8.91 17.09 20.42 227.20 123.40
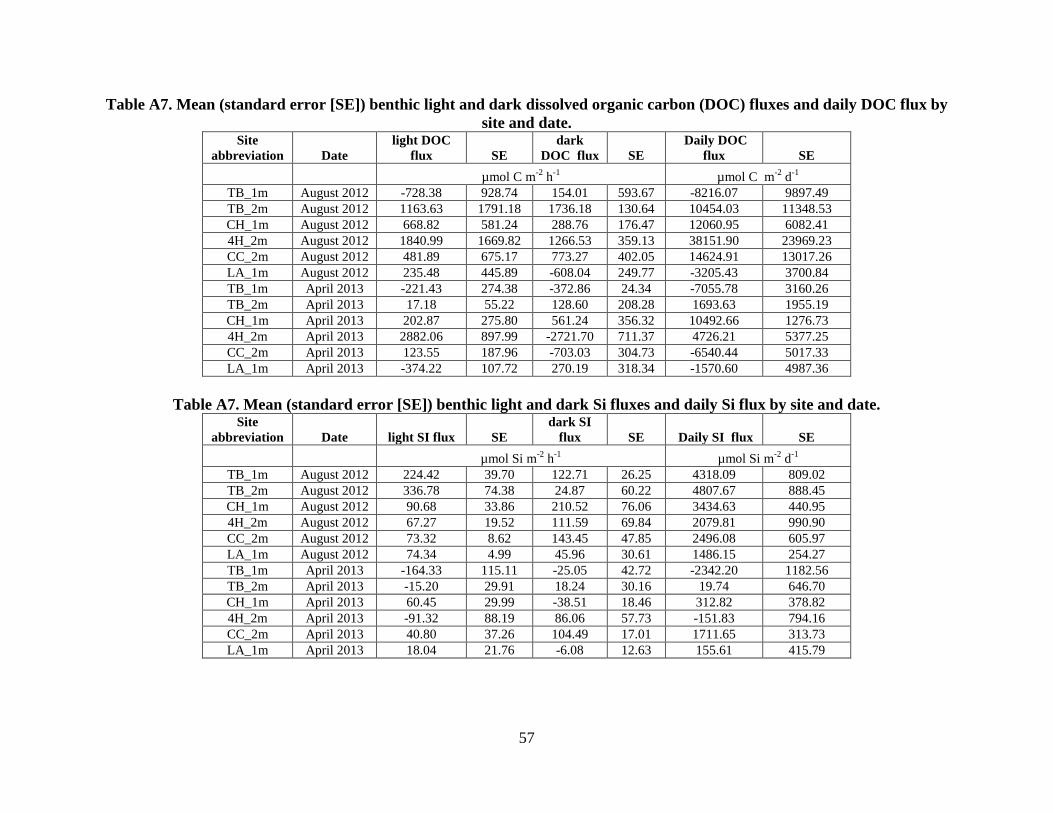
57
Table A7. Mean (standard error [SE]) benthic light and dark dissolved organic carbon (DOC) fluxes and daily DOC flux by
site and date. Site
abbreviation Date
light DOC
flux SE
dark
DOC flux SE
Daily DOC
flux SE
µmol C m-2
h-1
µmol C m-2
d-1
TB_1m August 2012 -728.38 928.74 154.01 593.67 -8216.07 9897.49
TB_2m August 2012 1163.63 1791.18 1736.18 130.64 10454.03 11348.53
CH_1m August 2012 668.82 581.24 288.76 176.47 12060.95 6082.41
4H_2m August 2012 1840.99 1669.82 1266.53 359.13 38151.90 23969.23
CC_2m August 2012 481.89 675.17 773.27 402.05 14624.91 13017.26
LA_1m August 2012 235.48 445.89 -608.04 249.77 -3205.43 3700.84
TB_1m April 2013 -221.43 274.38 -372.86 24.34 -7055.78 3160.26
TB_2m April 2013 17.18 55.22 128.60 208.28 1693.63 1955.19
CH_1m April 2013 202.87 275.80 561.24 356.32 10492.66 1276.73
4H_2m April 2013 2882.06 897.99 -2721.70 711.37 4726.21 5377.25
CC_2m April 2013 123.55 187.96 -703.03 304.73 -6540.44 5017.33
LA_1m April 2013 -374.22 107.72 270.19 318.34 -1570.60 4987.36
Table A7. Mean (standard error [SE]) benthic light and dark Si fluxes and daily Si flux by site and date. Site
abbreviation Date light SI flux SE
dark SI
flux SE Daily SI flux SE
µmol Si m-2
h-1
µmol Si m-2
d-1
TB_1m August 2012 224.42 39.70 122.71 26.25 4318.09 809.02
TB_2m August 2012 336.78 74.38 24.87 60.22 4807.67 888.45
CH_1m August 2012 90.68 33.86 210.52 76.06 3434.63 440.95
4H_2m August 2012 67.27 19.52 111.59 69.84 2079.81 990.90
CC_2m August 2012 73.32 8.62 143.45 47.85 2496.08 605.97
LA_1m August 2012 74.34 4.99 45.96 30.61 1486.15 254.27
TB_1m April 2013 -164.33 115.11 -25.05 42.72 -2342.20 1182.56
TB_2m April 2013 -15.20 29.91 18.24 30.16 19.74 646.70
CH_1m April 2013 60.45 29.99 -38.51 18.46 312.82 378.82
4H_2m April 2013 -91.32 88.19 86.06 57.73 -151.83 794.16
CC_2m April 2013 40.80 37.26 104.49 17.01 1711.65 313.73
LA_1m April 2013 18.04 21.76 -6.08 12.63 155.61 415.79
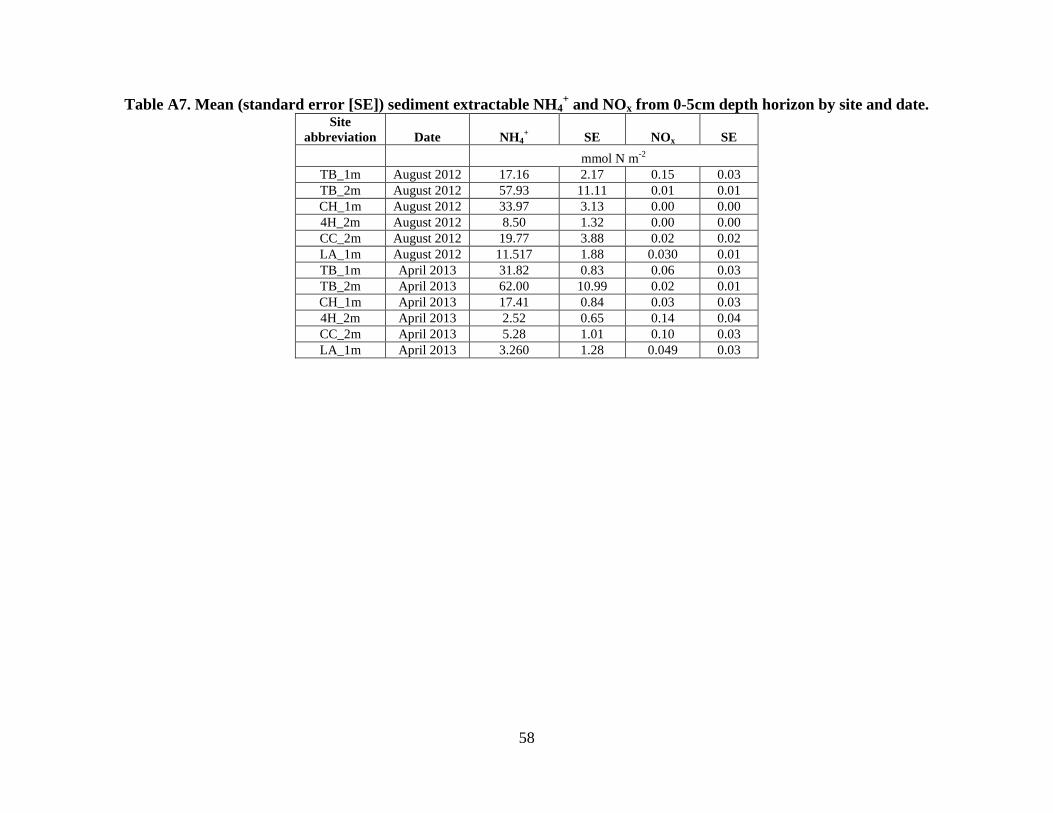
58
Table A7. Mean (standard error [SE]) sediment extractable NH4+ and NOx from 0-5cm depth horizon by site and date.
Site
abbreviation Date NH4+
SE NOx SE
mmol N m-2
TB_1m August 2012 17.16 2.17 0.15 0.03
TB_2m August 2012 57.93 11.11 0.01 0.01
CH_1m August 2012 33.97 3.13 0.00 0.00
4H_2m August 2012 8.50 1.32 0.00 0.00
CC_2m August 2012 19.77 3.88 0.02 0.02
LA_1m August 2012 11.517 1.88 0.030 0.01
TB_1m April 2013 31.82 0.83 0.06 0.03
TB_2m April 2013 62.00 10.99 0.02 0.01
CH_1m April 2013 17.41 0.84 0.03 0.03
4H_2m April 2013 2.52 0.65 0.14 0.04
CC_2m April 2013 5.28 1.01 0.10 0.03
LA_1m April 2013 3.260 1.28 0.049 0.03