Embed Size (px)
Citation preview
J. Serb. Chem. Soc. 76 (5) 757–768 (2011) UDC 666.762.8+541.183+546.21: JSCS–4157 544.723.3+544.032.4 Original scientific paper
757
Characterisation of surface oxygen groups on different carbon materials by the Boehm method and
temperature-programmed desorption ANA M. KALIJADIS1*#, MARIJA M. VUKČEVIĆ2#, ZORAN M. JOVANOVIĆ1#,
ZORAN V. LAUŠEVIĆ1# and MILA D. LAUŠEVIĆ2#
1Laboratory of Physics, Vinča Institute of Nuclear Sciences, P. O. Box 522, 11000 Belgrade and 2Faculty of Technology and Metallurgy, University of Belgrade, Karnegijeva 4,
11000 Belgrade, Serbia
(Received 24 December 2009, revised 27 October 2010)
Abstract: The surface characteristics of different carbon materials: activated carbon, carbon felt, glassy carbon and a porous carbon monolith were inves-tigated. The specific surface area was examined by the BET method with N2 adsorption, the amount and the type of surface oxygen groups by Boehm tit-ration as well as by temperature-programmed desorption (TPD). By comparing the results obtained using BET analysis with those of TPD and the Boehm method, it was found that the number of surface groups was not proportional to the specific surface area. The total amount of oxygen groups, obtained by TPD, is higher than the amount obtained by Boehm’s method for porous samples. The inconsistencies between these results originate from the fact that the Boehm method is limited to the determination of acidic and basic groups, whereas TPD provides information on the total number of all surface oxygen groups. In addition, the presence of porosity could reduce the solvent-acces-sible surface in the Boehm method. The TPD profiles of CO evolution showed the presence of a low temperature maximum, below 650 K, which originates from CO2 reduction on the carbon material surface.
Keywords: carbon materials; surface oxygen groups; temperature programmed desorption.
INTRODUCTION
Many applications of carbon materials are strongly influenced by their sur-face chemistry. Thus, their uses in catalysis,1 adsorption in solution or electro-chemical processes2,3 are the examples of the influence of surface chemistry on
* Corresponding author. E-mail: [email protected] # Serbian Chemical Society member. doi: 10.2298/JSC091224056K
___________________________________________________________________________________________________________________________________________
2011 Copyright (CC) SCS
Available online at www.shd.org.rs/JSCS
758 KALIJADIS et al.
the performance of materials. Many properties of carbon materials are decisively influenced by chemisorbed oxygen, which can be bound in the form of various functional groups. The surface of carbons is heterogeneous and consists of the faces of basal planes and of edges of such layers. The edge sites are much more reactive than the atoms in the interior of the basal planes, and they represent active sites for oxygen chemisorptions. Therefore, surface oxygen groups are pre-dominantly located on the edges.4,5
Surface oxygen groups on carbon materials are usually determined by titra-tions in aqueous solutions. One of the standard methods is the Boehm method.5–7. Additionally, temperature programmed desorption (TPD),8–12 X-ray photoelec-tron spectroscopy (XPS),13,14 or methods involving diffuse reflectance FTIR (DRIFTS)15,16 can also be used.
In the present study, both the Boehm titration and the TPD method were em-ployed for the determination of oxygen groups on the surface of different carbon materials: activated carbon (AC), carbon felt (CF), glassy carbon (GC) and po-rous glassy carbon monolith (CM). TPD provides quantitative information on the total number of surface oxygen groups, while the Boehm titration method gives both qualitative and quantitative information only about basic and acidic groups (in the form of carboxyl, lactone and phenol). Surface oxygen complexes on car-bon materials decompose upon heating by releasing CO and CO2, thus, the TPD peaks of CO and CO2 at different temperatures correspond to specific oxygen groups. For example, CO2 is released by decomposition of carboxylic groups at 373–673 K,17,18 or lactone groups at 463–923 K.18,19 Both CO and CO2 peaks originate from the decomposition of carboxylic anhydrides in the temperature range of 623–900 K.17,18 Phenols, ethers, carbonyls and quinones give rise to CO at 973–1253 K.18,20 The quantities of CO and CO2 released during the TPD ex-periments correspond to the total amount of surface oxygen groups. The decom-position temperature is related to the bound strength of specific oxygen-contain-ing groups. Thus, the position of the peak maximum at a defined temperature corresponds to a specific oxygen complex at the surface. Deconvolution of the TPD profiles gives qualitative information about surface oxygen groups.
The surface oxygen groups on a carbon with acidic (carboxyl, lactone, phe-nol) as well as basic properties can be determined by the Boehm method. These groups differ in their acidities and can be distinguished by neutralisation with dif-ferent solutions:HCl (for basic groups) and NaHCO3, Na2CO3 and NaOH (for acidic groups).
The objective of this work was to characterize the active sites at the surfaces of different carbon materials by comparison of the results obtained by these two methods.
___________________________________________________________________________________________________________________________________________
2011 Copyright (CC) SCS
Available online at www.shd.org.rs/JSCS
ACTIVE SITES OF DIFFERENT CARBON MATERIALS 759
EXPERIMENTAL
Materials
Four different carbon materials were used: – activated carbon was obtained from Trayal (Krusevac, Serbia) with granulation of
0.25–1 mm; – carbon monolith was purchased from Fractal Carbon (London, UK) in the shape of a
cylinder (L = 3.0 cm, d = 1.8 cm) containing 8600 capillaries inside the material. This is a composite material consisting of glassy carbon bed and activated carbon on the inner capillary walls;
– carbon felt and glassy carbon were produced at the Institute “Vinča” (Serbia). Viscose felt was impregnated with ZnCl2 and NH4Cl, carbonised at 1173 K in order to obtain carbon felt, and activated with CO2 from 873 K to 1173 K.
– GC plates (10 mm×5 mm×0.8 mm) were produced by polymerisation of poly(furfuryl alcohol) and carbonisation of the polymer in an electric oven at 1273 K under a nitrogen at-mosphere with a heating rate of 0.2 K min-1.
Measurements
The TPD method in combination with mass spectrometry was used to investigate the nature and thermal stability of the surface oxygen groups of the carbon materials. A custom- -built set-up for temperature programmed desorption was used. A quartz tube was placed inside an electrical furnace and coupled with an Extorr 3000 quadrupole mass spectrometer (Extorr Inc.), which was used as a detector for the gases evolved from the surface of the carbon materials. Data acquisition during the heating time was achieved using appropriate software (Extorr Inc.). The signals, as partial pressures (torr), at m/z 28 and 44 (CO and CO2) were simultaneously recorded as a function of time (s). The instrument was calibrated using analytical grade calcium carbonate and calcium oxalate (amounts in the range of 15–60 μmol). Accurately measured amounts of the chemicals were placed in the quarts tube, outgassed at room temperature to 10-7 torr and then subjected to TPD at a linear heating rate of 10 K min-1 to 1173 K. A calibration of the instrument was necessary to calculate the constants of the ex-perimental system (Kco2 and Kco). These constant represent the coefficient of proportionality between the amount of examined evolved gases (mol g-1) and the integration area under the corresponding TPD profiles (torr s). The constants of the experimental system were calculated from the obtained results as described in the literature.21 The TPD profiles of samples of the carbon material (0.1 g) were obtained under identical experimental conditions as those em-ployed for the calibration measurements. The TPD plots obtained were deconvoluted using multiple Gaussian functions, taking the position of the peak centre as the initial estimate. CO2 reduction during TPD experiment was examined by comparing TPD profile of CaCO3 and of the same amount of CaCO3 in the presence of GC. For this purpose, the GC was preheated to remove all surface oxygen groups and to obtain a reasonably clean carbon surface before mixing with CaCO3.
The specific surface areas of carbon materials were determined by nitrogen adsorption at liquid nitrogen temperature using a Micromeritics ASAP 2020 MP apparatus. The nitrogen adsorption isotherms were analysed using the Brunnauer, Emmett and Teller (BET) method.22
The oxygen groups on a carbon material surface that has acidic or basic properties are conveniently determined by titration methods. The surface groups of the studied carbon materials were determined by the Boehm method. The acidic sites were determined by mixing small quantities (0.1 g) of each carbon material with 10 ml of different bases (0.1 M NaOH,
___________________________________________________________________________________________________________________________________________
2011 Copyright (CC) SCS
Available online at www.shd.org.rs/JSCS
760 KALIJADIS et al.
0.1 M NaHCO3 or 0.05 M NaCO3) in 25 ml beakers. The beakers were sealed and shaken for 24 h. The solutions were then filtered and titrated with 0.05 M H2SO4. Similarly, the basic sites were determined by mixing 0.1 g of each carbon material with 10 ml of 0.1 M HCl. The obtained solutions were titrated with 0.1 M NaOH.
RESULTS AND DISCUSSION
Surface characteristics of different carbon materials were investigated by comparing the results obtained by BET, the Boehm method and TPD.
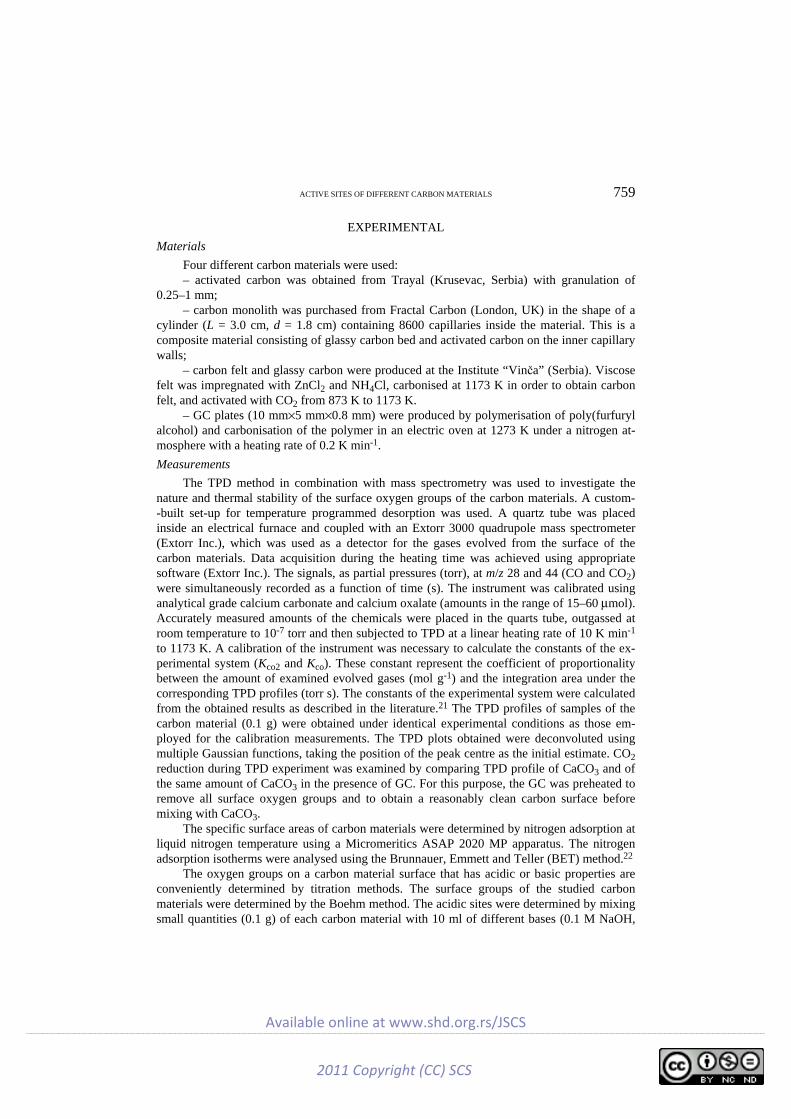
Initially, the possibility of CO2 reduction, as a secondary reaction on a car-bon surface, was investigated by recording TPD profiles of CaCO3 and CaCO3 mixed with GC (CaCO3/GC). For this experiment, the GC was preheated. Thus, the total amounts of CO2 and CO released could only originate from CaCO3 de-composition. Two possible reactions could be the source of CO evolution. One is CO2+ fragmentation in the ion source of the mass spectrometer and the second is the reduction of CO2 gas on the carbon material in the furnace of the TPD appa-ratus. A typical TPD profile for the thermal decomposition of calcium carbonate is shown in Fig. 1. The major peak at m/z = 44, originates from the parent ion CO2+ and the minor peak at m/z = 28 represents CO+ formed by fragmentation of CO2+ in the ion source.
Fig. 1. TPD Profiles for the thermal decomposition of calcium carbonate.
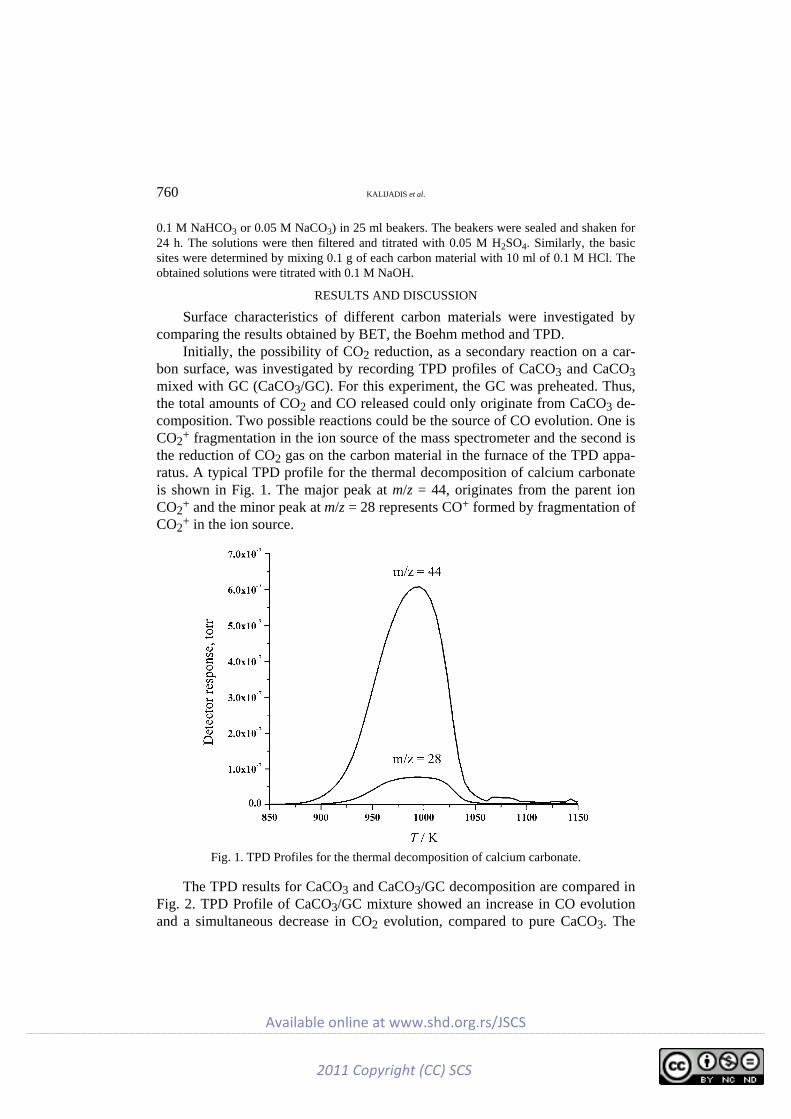
The TPD results for CaCO3 and CaCO3/GC decomposition are compared in Fig. 2. TPD Profile of CaCO3/GC mixture showed an increase in CO evolution and a simultaneous decrease in CO2 evolution, compared to pure CaCO3. The
___________________________________________________________________________________________________________________________________________
2011 Copyright (CC) SCS
Available online at www.shd.org.rs/JSCS
ACTIVE SITES OF DIFFERENT CARBON MATERIALS 761
peak areas of CO (ICO) and CO2 (ICO2) were calculated for both measurements. For CaCO3 decomposition, ICO/ICO2 was 0.13 and in the presence of GC, the ratio was 0.22, due to the increased amount of CO released. Thus, it can be assumed that CO2 reduction on the carbon surface occurred.
(a)
(b)
Fig. 2. A comparison of the TPD profiles for the thermal decomposition of CaCO3 and CaCO3/GC; a) m/z = 44 and b) m/z = 28.
___________________________________________________________________________________________________________________________________________
2011 Copyright (CC) SCS
Available online at www.shd.org.rs/JSCS
762 KALIJADIS et al.
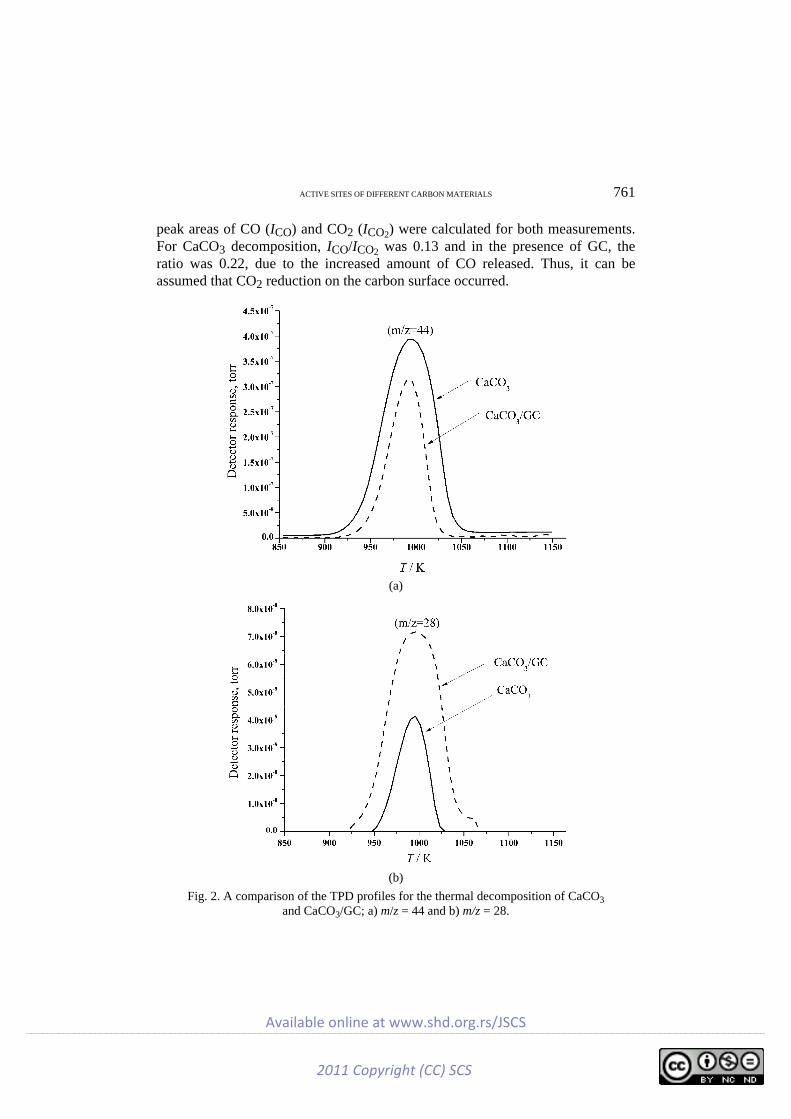
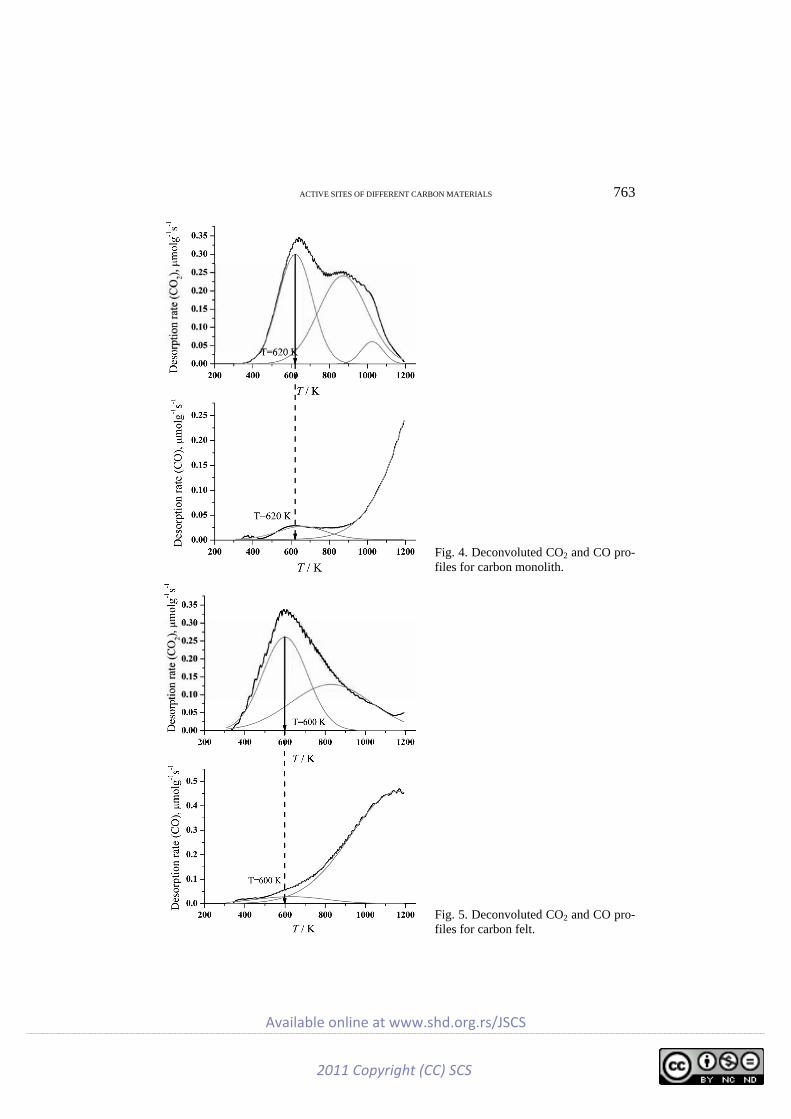
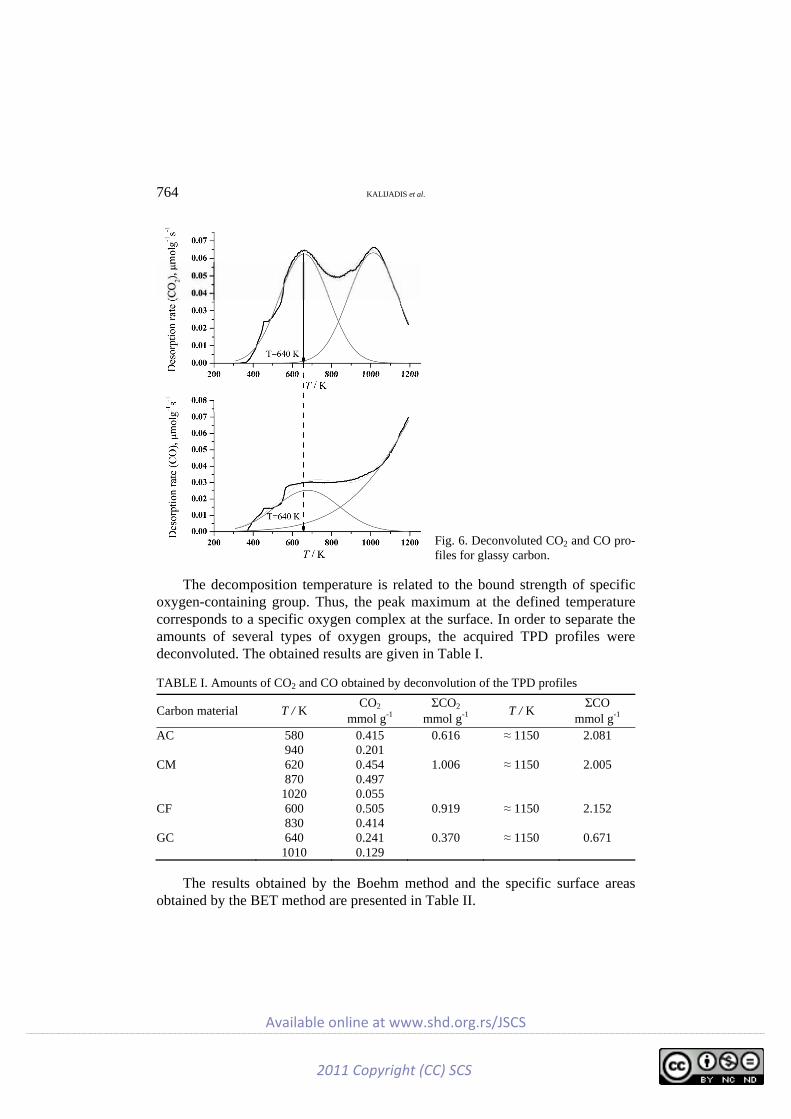
The TPD profiles of the examined carbon materials are presented in Figs. 3–6. The CO2 profiles of all samples show a first maximum in the temperature range from 580 to 640 K, which is very likely due to the decomposition of carboxylic groups. The second maximum appears in the range 880–1030 K, which origina-tes from the more stable anhydrides or lactone groups.
Fig. 3. Deconvoluted CO2 and CO profiles for activated carbon.
The CO profiles for all carbon material samples had a maximum above 1100 K, which could suggest the existence of anhydride, although it could also be at-tributed to phenols, ethers, carbonyls or quinones.17,18,20 TPD profiles also show a local CO maximum at a relatively low temperature, around 600 K (Figs. 3–6), which is unlikely to originate from the decomposition of oxygen complexes. This appearance of this peak could be related to CO2 reduction on the carbon surface. At higher temperatures, the amount of CO released was relatively high; hence, the overall contribution of CO from CO2 reduction was not significant and it has a negligible effect on quantitative representation of the TPD results. The origin of the incomplete high temperature process of CO evolution is the temperature li-mitation of the instrument. The employed instrumental setup has a temperature li-mit of 1173 K, although surface oxygen groups, that give rise to CO, thermally decompose in temperature range 973–1253 K.18,20
___________________________________________________________________________________________________________________________________________
2011 Copyright (CC) SCS
Available online at www.shd.org.rs/JSCS
ACTIVE SITES OF DIFFERENT CARBON MATERIALS 763
Fig. 4. Deconvoluted CO2 and CO pro-files for carbon monolith.
Fig. 5. Deconvoluted CO2 and CO pro-files for carbon felt.
___________________________________________________________________________________________________________________________________________
2011 Copyright (CC) SCS
Available online at www.shd.org.rs/JSCS
764 KALIJADIS et al.
Fig. 6. Deconvoluted CO2 and CO pro-files for glassy carbon.
The decomposition temperature is related to the bound strength of specific oxygen-containing group. Thus, the peak maximum at the defined temperature corresponds to a specific oxygen complex at the surface. In order to separate the amounts of several types of oxygen groups, the acquired TPD profiles were deconvoluted. The obtained results are given in Table I.
TABLE I. Amounts of CO2 and CO obtained by deconvolution of the TPD profiles
Carbon material T / K CO2
mmol g-1 ΣCO2
mmol g-1 T / K ΣCO
mmol g-1
AC 580 940
0.415 0.201
0.616 ≈ 1150 2.081
CM 620 870
1020
0.454 0.497 0.055
1.006 ≈ 1150 2.005
CF 600 830
0.505 0.414
0.919 ≈ 1150 2.152
GC 640 1010
0.241 0.129
0.370 ≈ 1150 0.671
The results obtained by the Boehm method and the specific surface areas obtained by the BET method are presented in Table II.
___________________________________________________________________________________________________________________________________________
2011 Copyright (CC) SCS
Available online at www.shd.org.rs/JSCS
ACTIVE SITES OF DIFFERENT CARBON MATERIALS 765
TABLE II. Surface characteristics of the carbon materials obtained by the BET and Boehm method
Carbon material BET m2 g-1
Basic groups mmol g-1
Acidic groups, mmol g-1
Total Carboxyl Lactone Phenol AC CM CF GC
960 150 831 < 5
0.683 0.776 0.842 0.683
0.282 0.388 0.684 0.434
0.210 0.228 0.342 0.401
0.043 0.050 0.207
0
0.029 0.110 0.135 0.034
Due to the lack of the open porosity, the specific area of the GC sample was below the detection limit of the instrument. From the results obtained by the Boehm titration method, it can be observed that the amount of basic groups was significantly higher than total amount of acidic groups. These results suggest that all carbon materials had a basic character. The largest amount of oxygen groups obtained by the Boehm method was found at the carbon felt surface and the smallest at the activated carbon surface.
The total amount of CO and CO2 (ΣCO2 + ΣCO) released in TPD measure-ments due to decomposition of oxygen complexes follows the order CF > CM > > AC > GC, while the total amount of surface groups obtained in the Boehm titrations follows the order CF > CM > GC > AC (Table III).
TABLE III. Total amount of surface groups obtained by TPD and the Boehm method
Carbon material TPD method ΣCO2 + ΣCO, mmol g-1
Boehm method Basic + acidic groups, mmol g-1
AC 2.697 0.965 CM 3.011 1.164 CF 3.071 1.526 GC 1.041 1.117
Comparing the results obtained by these two methods, agreement for the to-tal amount of oxygen groups was found only for the porous materials (AC, CM and CF). Although the TPD results follow the same trend as those of the Boehm method, total amounts of surface groups found were twofold higher than those obtained by the Boehm method. The difference in the results can originate from limitations of the Boehm titration method, which enables the detection of acidic group in the form of carboxylic, lactones, phenols and basic species. However, this method cannot assess the other acidic and neutral groups.
Another reason for the discrepancies in the quantitative results could origi-nate from the fact that in the Boehm method, the presence of porosity could re-duce the solvent-accessible surface. Only the GC sample gave comparable results obtained using both methods. GC has no open porosity, and solution can react with the whole surface. In addition, the Boehm method showed that there were no lactone groups at the GC surface; therefore, the CO2 released from the GC
___________________________________________________________________________________________________________________________________________
2011 Copyright (CC) SCS
Available online at www.shd.org.rs/JSCS
766 KALIJADIS et al.
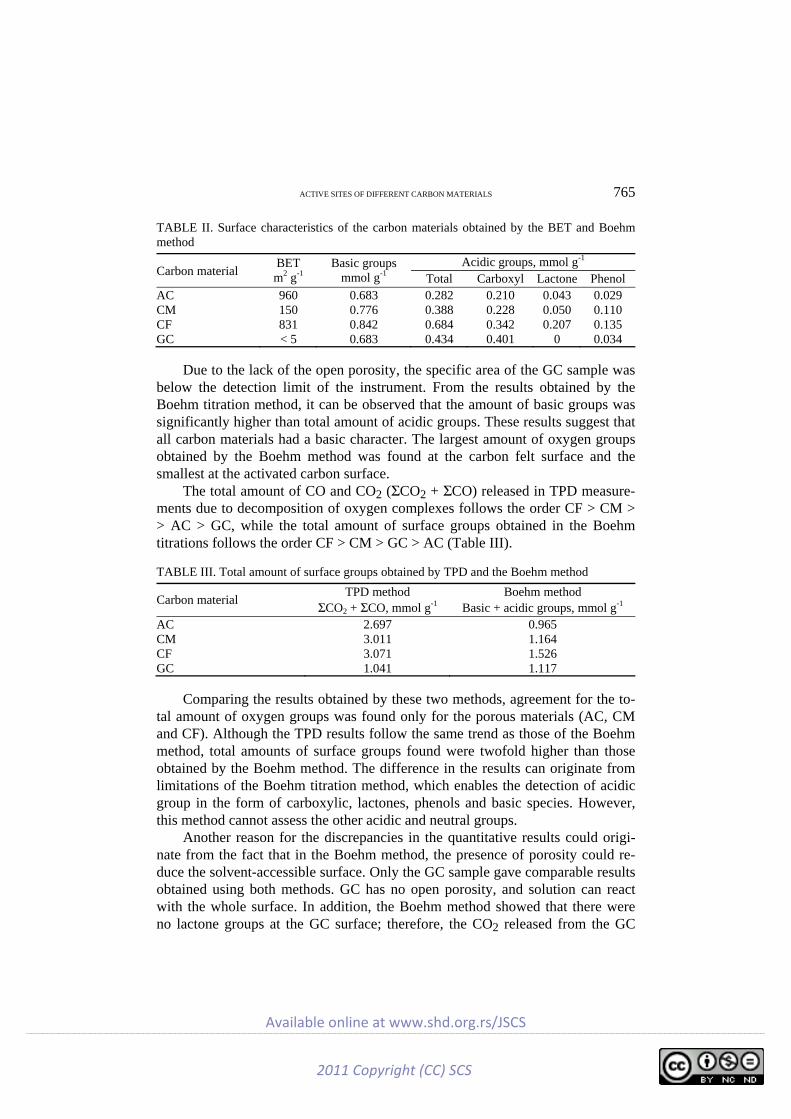
surface at higher temperatures during the TPD experiments could be assigned to the decomposition of anhydrides. Because anhydride groups can be hydrolysed (Fig. 7) in aqueous solution, as in the Boehm method, rendering two carboxylic groups,23 it was concluded that the results obtained by TPD and the Boehm me-thod showed acceptable agreement for the carboxylic groups.
Fig. 4. Hydrolysis of anhydride groups in aqueous solution
The values of the specific surface areas of the different samples were com-pared with the amounts of surface oxygen groups obtained by the Boehm’s me-thod and TPD. It can be observed that the number of oxygen groups was not pro-portional to the specific area, since the expected increase of the amount of the oxygen groups with the increased specific surface area was not observed. For example, the GC sample, with a low specific area, encloses a large number of oxygen containing groups. According to obtained results, it was found that the specific surface area has no crucial influence on the amount of surface oxygen groups. The number of active sites located at the edges of the basal plane defines the amount of chemisorbed oxygen and has more influence on the amount of surface oxygen groups than the specific surface area.
CONCLUSIONS
The objective of this work was to characterize the surface chemistry of dif-ferent carbon materials with different porous textures. All the tested carbon ma-terials had a basic character. The results obtained by the Boehm method showed the highest amount of surface oxygen groups on the carbon felt and the lowest on the activated carbon. Comparing the results obtained using BET analysis with those obtained by TPD and the Boehm titration method, it was found that the number of surface groups was not proportional to the specific surface area, but more likely influenced by the number of active sites located at the edges of basal planes. For the non-porous GC sample, the total amount of all oxygen groups obtained by both methods was similar. However, the total amounts of oxygen groups on the porous carbon surface (AC, CM and CF) obtained by TPD were higher than the amounts obtained by the Boehm titration method because of li-mitations of the latter method. The secondary reaction of CO2 reduction on the carbon surface had a negligible effect on the determination of the surface oxygen groups. The integration of the results obtained by both the Boehm method and
___________________________________________________________________________________________________________________________________________
2011 Copyright (CC) SCS
Available online at www.shd.org.rs/JSCS
ACTIVE SITES OF DIFFERENT CARBON MATERIALS 767
TPD enabled the provision of unique information about the surface chemistry of the samples.
Acknowledgements. Authors acknowledge the financial support of this work provided by the Ministry of Science and Technological Development of the Republic Serbia through the projects “Physics and Chemistry with Ion Beams”, No. 151005B, and “Basic Research in Chemistry”, No. 142002.
И З В О Д
КАРАКТЕРИЗАЦИЈА ПОВРШИНСКИХ КИСЕОНИЧНИХ ГРУПА РАЗЛИЧИТИХ КАРБОНСКИХ МАТЕРИЈАЛА БЕМОВОМ (BOEHM) МЕТОДОМ И ТЕМПЕРАТУРСКИ
ПРОГРАМИРАНОМ ДЕСОРПЦИЈОМ
АНА М. КАЛИЈАДИС1, МАРИЈА М. ВУКЧЕВИЋ2, ЗОРАН М. ЈОВАНОВИЋ1, ЗОРАН В. ЛАУШЕВИЋ1
и МИЛА Д. ЛАУШЕВИЋ2
1Laboratorija za fiziku, Institut za nuklearne nauke Vin~a, p. pr. 522, 11000 Beograd i 2Tehnolo{ko–metalur{ki fakultet, Univerzitet u Beogradu, Karnegijeva 4, 11000 Beograd
Испитиване су површинске особине различитих карбонских материјала: активног угља, карбонског филца, стакластог угљеника и порозног карбон монолита. Специфична површина узорака испитивана је BET методом, а количина и тип површинских група Бемовим титра-цијама и температурски програмираном десорпцијом (TPD). Поредећи резултате добијене BET методом са резултатима TPD-а и Бемове титрације, закључено је да број површинских група није пропорционалан специфичној површини узорака. Укупан број кисеоничних група код порозних узорака, добијен на основу TPD-а, је већи него у случају Бемових титрација. Разлог неслагања резултата ових двеју метода потиче из чињенице да је Бемов метод ограни-чен на одређивање само киселих и базних група, док TPD даје информацију о укупном броју свих кисеоничних група. Такође, код Бемовог метода, постојање порозности може смањити раствору доступну површину. TPD спектри издвајања СО показали су ниско-температурски максимум, испод 650 K, који потиче од редукције СО2 на површини карбонског материјала.
(Примљено 24. децембра 2009, ревидирано 27. октобра 2010)
REFERENCES
1. A. F. Pérez-Cadenas, F. Kapteijn, J. A. Moulijn, F. J. Maldonado-Hódar, F. Carrasco-Marín, C. Moreno-Castilla, Carbon 44 (2006) 2463
2. C. Brasquet, B. Rousseau, H. Estrade-Szwarckopf, P. Le Cloirec, Carbon 38 (2000) 407 3. B. F. Abramović, V. J. Guzsvány, F. F. Gaál, Z. V. Laušević, J. Serb. Chem. Soc. 66
(2001) 179 4. K. Kinoshita, Carbon, electrochemical and physicochemical properties, 1st ed., Wiley,
New York, 1988, p. 86 5. H. P. Boehm, Carbon 40 (2002) 145 6. H. P. Boehm, Carbon 32 (1994) 759 7. T. Vasiljević, M. Baćić, M. Laušević, A. Onjia, Mat. Sci. Forum 453 (2004) 163 8. S. Haydar, C. Moreno-Castilla, M. A. Ferro-García, F. Carrasco-Marín, J. Rivera-Utrilla,
A. Perrard, J. P. Joly, Carbon 38 (2000) 1297 9. G. S. Szymański, Z. Karpiński, S. Biniak, A. Świątkowski, Carbon 40 (2002) 2627
10. M. F. R. Pereira, S. F. Soares, J. J. M. Órfão, J. L. Figueiredo, Carbon 41 (2003) 811
___________________________________________________________________________________________________________________________________________
2011 Copyright (CC) SCS
Available online at www.shd.org.rs/JSCS
768 KALIJADIS et al.
11. J.-H. Zhou, Z.-J. Sui, J. Zhu, P. Li, D. Chen, Y.-C. Dai, W.-K. Yuan, Carbon 45 (2007) 785
12. A. A. Perić-Grujić, O. M. Nešković, M. V. Veljković, Z. V. Laušević, M. D. Laušević, Bull. Mater. Sci. 30 (2007) 587
13. C. Kozlowski, P. M. A. Sherwood, Carbon 24 (1986) 357 14. J. B. Donnet, G. Guilpain, Carbon 27 (1989) 749 15. A. Dandekar, R. T. K. Baker, M. A. Vannice, Carbon 36 (1998) 1821 16. J. L. Figueiredo, M. F. R. Pereira, M. M. A. Freitas, J. J. M. Órfão, Carbon 37 (1999)
1379 17. Y. Otake, R. G. Jenkins, Carbon 31 (1993) 109 18. U. Zielke, K. J. Hüttinger, W. P. Hoffman, Carbon 34 (1996) 983 19. B. Marchon, J. Carrazza, H. Heinemann, G. A. Somorjai, Carbon 36 (1988) 507 20. D. M. Nevskaia, A. Santianes, V. Muñoz, A. Guerrero-Ruíz, Carbon 37 (1999) 1065 21. J. Wang, B. McEnaney, Thermochim. Acta 190 (1991) 143 22. S. Brunauer, P. H. Emmett, E. Teller, J. Am. Chem. Soc. 60 (1938) 309 23. M. Domingo-García, F. J. López Garzón, M. J. Pérez-Mendoza, J. Colloid. Interface Sci.
248 (2002) 116.
___________________________________________________________________________________________________________________________________________
2011 Copyright (CC) SCS
Available online at www.shd.org.rs/JSCS