Embed Size (px)
Citation preview

DEVELOPMENT AND USE OF A NEW CURVATURE RELAXATION TECHNIQUE TO MEASURE THE IN SITU OXYGEN SURFACE EXCHANGE
COEFFICIENTS AND STRESS OF LANTHANUM STRONTIUM FERRITE FILMS
By
Qing Yang
A DISSERTATION
Submitted to
Michigan State University in partial fulfillment of the requirements
for the degree of
Materials Science and Engineering—Doctor of Philosophy
2014

ABSTRACT
DEVELOPMENT AND USE OF A NEW CURVATURE RELAXATION TECHNIQUE TO MEASURE THE IN SITU OXYGEN SURFACE EXCHANGE COEFFICIENTS AND STRESS
OF LANTHANUM STRONTIUM FERRITE FILMS
By
Qing Yang
Solid oxide fuel cells (SOFCs) provide fuel flexibility and the highest efficiency of any
chemical- to-electrical energy conversion technology. Unfortunately, slow oxygen transport,
especially that caused by low surface exchange kinetics at the cathode, limits overall SOFC
performance. In the common SOFC material La0.6Sr0.4FeO3-δ (LSF64) efforts to engineer and
understand oxygen surface exchange have been complicated by the 5 orders of magnitude
chemical surface exchange coefficient (k) discrepancy reported in the literature. To help remedy
this discrepancy, a new bilayer curvature relaxation technique utilizing the mechano-chemical
coupling of LSF64 was developed in this work. This technique provides reliable, in-situ,
electrode-free, simultaneous measurement of film stress and k as a function of temperature and
oxygen partial pressure. This is demonstrated here by measuring LSF64 films prepared via
sputter deposition, pulsed laser deposition, and colloidal spray deposition. The similarities and
differences between these films are systematically investigated across multiple thermal cycles,
and correlated to the microstructure, stress state and sample preparation/testing history. Further,
the k of LSF64 films was measured here below 500oC for the first time, and distinct lattice-
dominated and grain-boundary-dominated chemical stress responses were identified.

iii
ACKNOWLEDGMENTS
I am deeply grateful to those who have provided motivation, help and support throughout
the course my doctoral study. First, I would like to thank my advisor, Dr. Jason D. Nicholas, for
the tremendous help in research project blueprinting, laboratory construction, and encouragement
on all aspects of being a researcher (especially when things don’t go smoothly as one would
like). I’m also grateful to my dissertation committee members Dr. Donald Morelli, Dr. Eldon
Case and Dr. Ruby Ghosh for their guidance and support. I sincerely thank my past and present
group members/lab-mates Lin Wang, Ted Burye, Andrew Flegler, Peter Su, Laura Bartow-
Goudie, Vasiliy Sharikov-Bass and Tridip Das for their helpful discussions and routine lab
assistance on a regular basis. I also appreciate Dr. Richard Lunt, Chris Traverse and Vasiliy
Sharikov-Bass for assistance in sputtered thin film fabrication, and Dr. William Chueh and
Sylvia Paris for assistance in PLD thin film fabrication. Valuable contributions from other
collaborators Dr. Xiaofeng Fan, Dr. Per Askeland, Mr. Edward Timm and Mr. Scott Bankroff are
also appreciated.
I would also like to acknowledge the generous financial support provided by the Army
Research Office under contract number W911NF-13-0404, a Michigan State University faculty
startup grant to Dr. Jason D. Nicholas, and fellowships from the Michigan State Graduate
School, the College of Engineering, and the Department of Chemical Engineering and Materials
Science. Support for the Composite Materials and Structures Center, provided by the NSF-MRI
program and Michigan State University, is also acknowledged.

iv
Finally, my special thanks go to my parents, who flew all the way from the other side of
the planet and stayed with me during the last months of my doctoral study. I am forever indebted
to their unconditional love, and this dissertation is dedicated to them.

v
TABLE OF CONTENTS
LIST OF TABLES ..........................................................................................................................viii
LIST OF FIGURES ........................................................................................................................... ix
KEY TO SYMBOLS AND ABBREVIATIONS ............................................................................... xiv
1. Motivation and Project Overview .................................................................................................. 1 1.1. Energy Challenges ..................................................................................................................1 1.2 Fuel Cells...............................................................................................................................1
1.2.1 Applications .................................................................................................................1 1.2.2 Types of Fuel Cells .......................................................................................................2 1.2.3. SOFC Overview .........................................................................................................26
1.2.3.1 Components and Operating Principles .............................................................26 1.2.3.2 Materials and Requirements of SOFC Components ..........................................27
1.2.3.2.1 Cathode ..........................................................................................27 1.2.3.2.2 Anode ............................................................................................28 1.2.3.2.3 Electrolyte ......................................................................................28 1.2.3.2.4 Interconnect ....................................................................................30
1.3 Technological Progress of SOFCs..........................................................................................30 1.4 Current Challenges at the SOFC Cathode ...............................................................................30 1.5 Hypothesis and Aim of this Work ..........................................................................................32
2 Literature Review ....................................................................................................................... 34 2.1 Mechano-Chemical Coupling in Solid Oxide Fuel Cell Materials.............................................34
2.1.1 Strain in Electro-ceramic Devices ................................................................................34 2.1.2 Chemical Expansion in MIEC Materials.......................................................................35 2.1.3 Utilizing Mechano-chemical Coupling .........................................................................37
2.2 Oxygen Surface Exchange and its Measurement .....................................................................37 2.2.1 The Characteristic Thickness .......................................................................................38 2.2.2 The Different Types of Oxygen Surface Exchange Coefficients .....................................38
2.2.2.1 Chemical Exchange Coefficient ......................................................................38 2.2.2.2 Tracer Exchange Coefficient ...........................................................................40 2.2.2.3 Electrically Determined Surface Exchange ......................................................40
2.2.3 Literature Oxygen Surface Exchange Coefficient Measurement Techniques ...................41 2.2.3.1 Oxygen Permeation ........................................................................................43 2.2.3.2 Ionic Conductivity..........................................................................................43 2.2.3.3 Isotope Exchange Depth Profiling ...................................................................44 2.2.3.4 Electrical Conductivity Relaxation ..................................................................45 2.2.3.5 In situ Isothermal Isotope Exchange ................................................................46 2.2.3.6 Electrical Titration .........................................................................................46 2.2.3.7 Thermogravimetric Relaxation ........................................................................47 2.2.3.8 Optical Absorption Relaxation ........................................................................47 2.2.3.9 Strain Relaxation by X-ray Diffraction ............................................................48
2.3 The Factors Governing Oxygen Surface Exchange..................................................................48 2.3.1 Material Composition (Dopants and Doping Level) ......................................................49

vi
2.3.2 Oxygen Partial Pressure ..............................................................................................50 2.3.3 Surface and Interface Structure ....................................................................................51 2.3.4 Grain Size ..................................................................................................................51 2.3.5 Electronic structure .....................................................................................................52 2.3.6 Strain .........................................................................................................................52 2.3.7 Dislocations ...............................................................................................................53
3 Experimental Methods ................................................................................................................ 55 3.1 The Bilayer Curvature Relaxation Technique .........................................................................55
3.1.1 Theoretical Background ..............................................................................................55 3.1.2 Experimental Setup.....................................................................................................57 3.1.3 Flush Time Considerations ..........................................................................................60 3.1.4 Film Stress Measurement ............................................................................................61 3.1.5 Substrate Selection .....................................................................................................62 3.1.6 Error Analysis ............................................................................................................63 3.1.7 Summary ...................................................................................................................64
3.2 Sample Preparation ...............................................................................................................65 3.2.1 Powder Processing......................................................................................................65 3.2.2 Sputtering Target Preparation ......................................................................................65 3.2.3 Sputter Deposition ......................................................................................................66 3.2.4 Pulsed Laser Deposition (PLD) ...................................................................................66 3.2.5 Colloidal Spray Deposition .........................................................................................66
3.3 Dilatometry ..........................................................................................................................67 3.4 Structural, Morphological and Compositional Characterization................................................68
3.4.1 X-ray Diffraction ........................................................................................................68 3.4.2 Focused Ion Beam-Scanning Electron Miscroscopy (FIB-SEM) ....................................68 3.4.3 X-ray Photoelectron Spectroscopy (XPS) .....................................................................69
4. Dilatometry Measurements on Bulk LSF64 .................................................................................. 70 4.1 Introduction .........................................................................................................................70 4.2 Experimental ........................................................................................................................70 4.3 Results and Discussion..........................................................................................................71 4.4 Conclusions .........................................................................................................................74
5. Oxygen Surface Exchange and Stress Measurements on Sputtered LSF64 Dense Thin Films .......... 76 5.1 Introduction .........................................................................................................................76 5.2 Experimental ........................................................................................................................77
5.2.1 Sample Preparation .....................................................................................................77 5.2.2 Curvature Relaxation (κR) Measurements ....................................................................78 5.2.3 Structural and Compositional Characterization .............................................................78
5.3 Results and Discussion..........................................................................................................79 5.4 Conclusions .........................................................................................................................95
6. Oxygen Surface Exchange and Stress Measurements on Pulsed Laser Deposited LSF64 Dense Thin Films……………………………………………………………………………………………………….96
6.1 Introduction .........................................................................................................................96 6.2 Experimental ........................................................................................................................96
6.2.1 Sample Fabrication .....................................................................................................96 6.2.2 Curvature Relaxation Measurements ............................................................................97 6.2.3 Structural and Compositional Characterization .............................................................97
6.3 Results and Discussion..........................................................................................................98

vii
6.3.1 LSF64|YSZ ................................................................................................................98 6.3.2 LSF64|SDC|YSZ ...................................................................................................... 108
6.4 Conclusions ....................................................................................................................... 116
7. Oxygen Surface Exchange and Stress Measurements on Spray Deposited LSF64 Porous Thick Films.. ………………………………………………....…………………………………………………….117
7.1 Introduction ....................................................................................................................... 117 7.2 Experimental ...................................................................................................................... 117
7.2.1 Sample Fabrication ................................................................................................... 117 7.2.2 Porous Pellet Dilatometry.......................................................................................... 117 7.2.3 Curvature Relaxation Measurements .......................................................................... 118 7.2.4 Structural and Morphological Characterization ........................................................... 118
7.3 Results and Discussion........................................................................................................ 119 7.4 Conclusions ....................................................................................................................... 135
8. Dissertation Summary .............................................................................................................. 136
APPENDIX ................................................................................................................................... 140
REFERENCES .............................................................................................................................. 144
viii
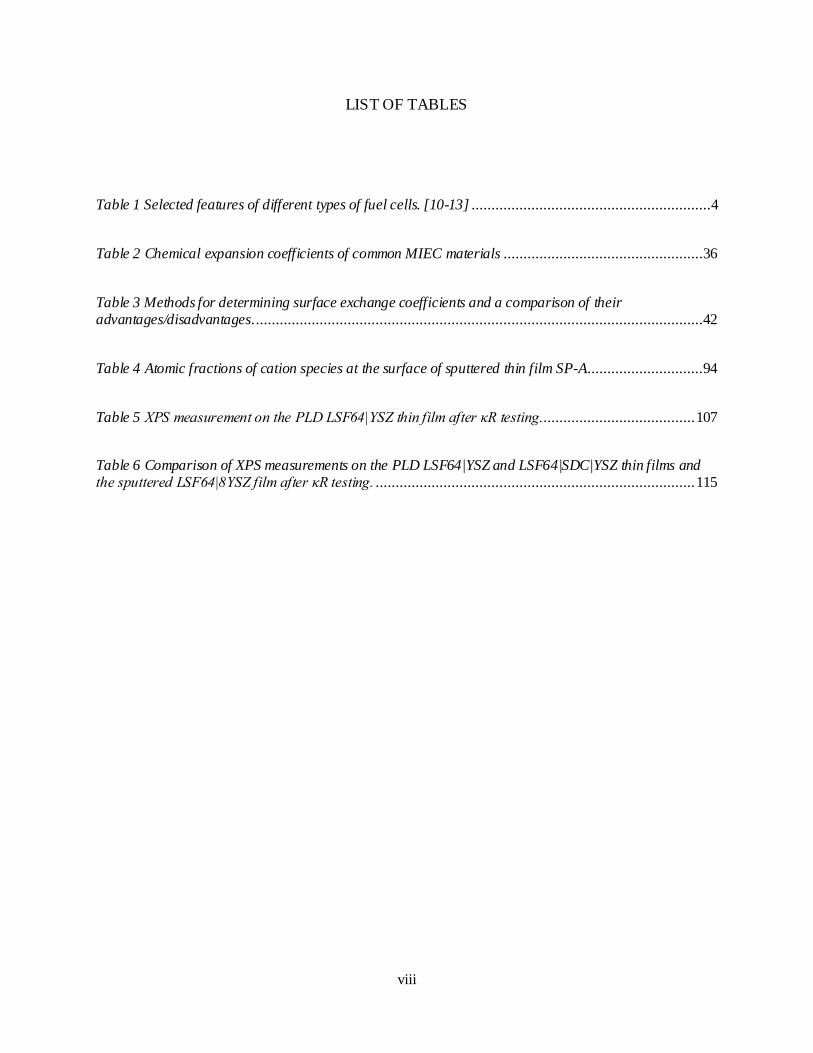
LIST OF TABLES
Table 1 Selected features of different types of fuel cells. [10-13] ............................................................4
Table 2 Chemical expansion coefficients of common MIEC materials ..................................................36
Table 3 Methods for determining surface exchange coefficients and a comparison of their advantages/disadvantages. ................................................................................................................42
Table 4 Atomic fractions of cation species at the surface of sputtered thin film SP-A .............................94
Table 5 XPS measurement on the PLD LSF64|YSZ thin film after κR testing....................................... 107
Table 6 Comparison of XPS measurements on the PLD LSF64|YSZ and LSF64|SDC|YSZ thin films and the sputtered LSF64|8YSZ film after κR testing. ................................................................................ 115

ix
LIST OF FIGURES
Figure 1.1 Fuel cell market growth from 2009 to 2013. [4] ...................................................................2
Figure 1.2 Planar (left) and tubular (right) design of SOFCs and their components. .............................26
Figure 1.3 Ionic conductivity of common SOFC electrolyte materials. Practical application requires area
specific resistance (ASR) values 0.15 2cm . Therefore, a minimum target conductivity value of 0.01
Scm-1
is necessary so inexpensive colloidal fabrication techniques producing dense electrolyte films 15 µm thick can be used. This helps dictate the necessary SOFC operating temperature. This figure was reproduced from Ref. [3]...................................................................................................................29
Figure 1.4 Voltage drop of a typical SOFC operated at 100 mA/cm2 and various temperatures [53]. .....31
Figure 3.1 Curvature relaxation measurement apparatus schematic. ...................................................57
Figure 3.2 A 3×3 array of laser spots detected by the MOSS CCD camera ...........................................58
Figure 3.3 Temperature calibration of the furnace controller between 200oC and 700
oC using actual
sample chamber temperature measurements. ......................................................................................59
Figure 4.1 X-ray diffraction scans of calcined LSF64 powder. Peak indexing was performed using LSF64 PDF # 01-082-1961. .........................................................................................................................71
Figure 4.2 Bulk, dense LSF64 sample dilatometry under pO2=0.21 (black), pO2=0.021 (blue), pO2=0.0005 (orange) and N2 (red). The dashed line represents the fitted linear thermal expansion. .......72
Figure 4.3 Bulk, porous LSF64 sample dilatometry in air (pO2=0.21). The dashed line denotes the temperature schedule and the solid line denotes the measured linear strain. .........................................74
Figure 5.1 (a) Macroscale morphology of YSZ substrates with (left) and without (right) a LSF64 film. (b) cross section and (c) 45
o view of the fracture surface morphology of the LSF64|YSZ bilayer after κR
testing. .............................................................................................................................................79
Figure 5.2 X-ray diffraction scans of YSZ substrates (a) without any coating, (b) with as-sputtered with LSF64 film, (c) with a 4-day MOSS tested LSF64 film [203] and (d) with a 60-day MOSS tested LSF64

x
film (this study). Peak indexing was obtained from PDF # 01-082-1961 for LSF64, 01-070-4436 for cubic YSZ (c-YSZ) and 01-070-4431 for tetragonal YSZ (t-YSZ)....................................................................80
Figure 5.3 Representative multiple curvature relaxation cycles between pO2=0.21 (air) and pO2=0.021 (N2-air) at 525
oC and 475
oC. The difference in equilibrium curvature levels between the two temperatures
stems from the film-substrate thermal expansion mismatch [193, 205]. ................................................81
Figure 5.4 Normalized curvature relaxation data (dots) of the LSF64 film SP-C on reduction at 525oC
(left) and on oxidation at 375oC (right). The top line is the combined fit to the data, while the lower lines
show the separate contributions of each relaxation rate. .....................................................................82
Figure 5.5 The κR data of 525oC on reduction plotted on a semi-log plot to inllustrate that two relaxation
times, τ1 and τ2, are present. .............................................................................................................83
Figure 5.6 Schematic of the surface exchange process in the sputtered thin film. k1 and k2, can be attributed to bulk grains and grain boundaries, respectively. ...............................................................84
Figure 5.7 A1 values of the sputtered LSF64 thin film SP-C as a function of temperature across all seven thermal segments. Each value is averaged from its corresponding oxidation and reduction relaxation processes. ........................................................................................................................................84
Figure 5.8 Arrhenius plots of both k1 and k2 in LSF64 thin film sample SP-B under oxidation and reduction conditions. Segment numbers follow the chronological order of the experiment. Segments 1, 3, 5 and 7 were measurements as the sample was cooling down, while segments 2, 4 and 6 were measurements as the sample was heating up.......................................................................................85
Figure 5.9 Arrhenius plot of both k1 and k2 of LSF64 thin film sample SP-C under oxidation and reduction conditions. ........................................................................................................................87
Figure 5.10 κR-determined k1 values of sputtered LSF64 thin film samples SP-A, SP-B and SP-C as a function of inverse temperature across multiple thermal cycles. k values are averaged from oxidation and reduction k’s. ...................................................................................................................................88
Figure 5.11 κR-determined k2 values of sputtered LSF64 thin film samples SP-A, SP-B and SP-C as a function of inverse temperature across multiple thermal cycles. k values are averaged from oxidation and reduction k’s. ...................................................................................................................................89
Figure 5.12 LSF64 κR-determined k 1 values compared with those in the literature [47-50]. Open symbols denote literature values. ....................................................................................................................90

xi
Figure 5.13 Average equilibrium stress levels of the LSF64 film as a function of pO2 and temperature. The dashed lines represent thermal expansion mismatch induced stress, based on coefficient of thermal expansion (CTE) and elastic constants of YSZ and LSF64 available in the literature [193, 205]. ...........91
Figure 5.14 Chemical stress of sputtered LSF64 films induced by pO2 changes between 0.21 and 0.021 as a function of temperature. .................................................................................................................93
Figure 5.15 X-ray photoelectron spectroscopy (XPS) measurements on the sputtered LSF64 thin film SP-A after κR testing. .............................................................................................................................94
Figure 6.1 Fracture surface morphology of the PLD LSF64|YSZ bilayer after κR testing. .....................98
Figure 6.2 X-ray diffraction scans of the PLD LSF64|YSZ before and after R testing. Peak indexing was performed using LSF64 PDF # 01-082-1961 for LSF64 and cubic YSZ PDF# 01-070-4436. .................99
Figure 6.3 Multiple curvature relaxation cycles of the LSF64|YSZ sample at 700oC and 750
oC between
pO2=0.21 and pO2=0.021. The difference in equilibrium curvature levels between the two temperatures is a result of the film-substrate thermal expansion mismatch. ................................................................ 100
Figure 6.4 Representative κR data of 700oC on reduction shown in Figure 6.3 replotted on a semi-log
plot, and showing only one time constant. κR data of other temperatures showed similar single time constant behavior. .......................................................................................................................... 101
Figure 6.5 κR-measured surface exchange coefficients of LSF64|YSZ as a function of temperature and flow rate......................................................................................................................................... 102
Figure 6.6 κR-measured k values of LSF64|YSZ across multiple thermal segments at a flow rate of 100 sccm. ............................................................................................................................................. 103
Figure 6.7 κR-determined k values of LSF64|YSZ compared with those in the literature [47-50] and the sputtered thin films in this work. ...................................................................................................... 104
Figure 6.8 Average equilibrium stress levels of the PLD LSF64 thin film as a function of pO2 and temperature. The dashed lines represent thermal expansion mismatch induced stress, based on coefficient of thermal expansion (CTE) and elastic constants of YSZ and LSF64 available in the literature [193, 194]. 700
oC was chosen as the stress-free state in line with the film deposition temperature. ............... 105
Figure 6.9 Chemical stress of the PLD thin film LSF64|YSZ induced by pO2 changes between 0.21 and 0.021 as a function of temperature. .................................................................................................. 106
xii
Figure 6.10 X-ray photoelectron spectroscopy (XPS) measurements of a PLD LSF64|YSZ sample. ...... 107
Figure 6.11 X-ray diffraction scans of the PLD LSF64|SDC|YSZ before and after R test. Peak indexing was obtained from PDF # 01-082-1961 for LSF64 and 01-070-4436 for YSZ...................................... 108
Figure 6.12 Multiple curvature relaxation cycles of the LSF64|SDC|YSZ sample at 700oC and 750
oC
between pO2=0.21 and pO2=0.021. The difference in equilibrium curvature levels between the two temperatures is a result of the film-substrate thermal expansion mismatch. ........................................ 109
Figure 6.13 Representative κR data of 700oC on reduction shown in Figure 6.14 replotted on a semi-log
plot, and showing only one time constant. κR data of other temperatures showed similar single time constant behavior. .......................................................................................................................... 110
Figure 6.14 κR-measured k values of LSF64|SDC|YSZ across multiple thermal segments at a flow rate of 100 sccm. ....................................................................................................................................... 111
Figure 6.15 κR-determined k values of PLD LSF64 thin films compared with those in the literature [47-50] and the sputtered thin films in this work. .................................................................................... 112
Figure 6.16 Average equilibrium stress levels of the PLD thin film LSF64|SDC|YSZ as a function of pO2 and temperature. The dashed lines represent thermal expansion mismatch induced stress, based on coefficient of thermal expansion (CTE) and elastic constants of YSZ and LSF64 available in the literature [193, 215]. 700
oC was chosen as the stress-free state in line with the film deposition temperature. ...... 113
Figure 6.17 Chemical stress of the PLD thin film LSF64|SDC|YSZ induced by pO2 changes between 0.21 and 0.021 as a function of temperature............................................................................................. 114
Figure 6.18 X-ray photoelectron spectroscopy (XPS) measurements of a PLD LSF64|SDC|YSZ sample....................................................................................................................................................... 115
Figure 7.1 (a) Picture of the top surface of a κR-tested LSF64 porous thick film on a 25.4 mm diameter YSZ substrate, (b) SEM image of the top surface of a LSF film, and (c) a FIB-SEM 3D reconstruction. The film thickness is 5 µm and aligned in the upward direction.......................................................... 119
Figure 7.2 X-ray diffraction of (a) the LSF64 powder after calcination at 1000oC for 1h, (b) a LSF64|YSZ
bilayer before κR testing and (c) a LSF64|YSZ bilayer after κR testing. XRD peak indexing was performed using LSF64 PDF # 01-082-1961 and YSZ PDF # 01-077-2114. ....................................................... 121
Figure 7.3 Multiple curvature relaxation cycles between pO2=0.21 and pO2=0.021, at 375oC (top) and
325oC (bottom). .............................................................................................................................. 122

xiii
Figure 7.4 Representative κR data of 325oC on reduction shown in Figure 7.3 replotted on a semi-log
plot, and showing only one time constant. κR data of other temperatures showed similar single time constant behavior. .......................................................................................................................... 123
Figure 7.5 k measurements (a) under 500 sccm flow rate across multiple thermal segments κR1 -κR5 and (b) under different flow rates at κR3. Errors of k’s are smaller than the symbols. The numbers are in chronological order of experiments, where 1, 3 and 5 are measurements during sample cooling, 2 and 4 are during sample heating. Open and solid symbols denote k measurements with and without flush time limitations, respectively. As indicated by the grayed out region, reliable k measurements could not be obtained above 375oC due to reactor flush time limitations. .............................................................. 124
Figure 7.6 Surface exchange coefficients (averaged over the oxidation and reduction k’s) of the porous thick film LSF64 under 500 sccm for κR3 compared to other literature measurements [47, 49, 50, 220], as well as the sputtered and PLD thin films measured in this work. Only k1 values are shown. ............. 125
Figure 7.7 Estimated LSF64 thickness averaged film stress. Curvature/stress level of the bilayer prior to sintering (at room temperature) was chosen as reference of stress-free state. ..................................... 126
Figure 7.8 Thickness average film stress of the LSF64 porous thick films compared to representative film stresses as found in the sputtered and PLD thin films measured in this work....................................... 128
Figure 7.9 Chemical stress of spray deposited porous thick films LSF64 between pO2=0.21 and pO2=0.021 as a function of temperature. .......................................................................................... 129
Figure 7.10 Replot of the Figure 7.9 data on an Arrhenius scale, illustrating two regimes with different activation energies. The dashed lines are linear fits to the data. .......................................................... 130
Figure 7.11 Summary of the chemical stress found in sputtered thin film SP-A, PLD thin film LSF|YSZ and the porous thick film PT-A measured at 500
oC and 600
oC as a function of inverse grain size (G.S.)
...................................................................................................................................................... 132
Figure 7.12 Summary of the k1 values found in sputtered thin film SP-A, PLD thin film LSF|YSZ and the porous thick film PT-A measured at 450
oC and 500
oC as a function of inverse grain size (G.S.)........... 133
Figure 7.13 Possible surface exchange pathways. The dotted box represents the grain boundary region that induces the sub-525
oC chemical stresses observed in this work. .................................................. 134

xiv
KEY TO SYMBOLS AND ABBREVIATIONS
a particle radius
Ai area fraction corresponding to a distinct oxygen surface exchange pathway
coefficient of chemical expansion
coefficient of thermal expansion (CTE)
AFC alkaline fuel cell
ASR area specific resistance
bE material dependent constant for Young’s modulus-porosity relations
BSCF Ba0.5Sr0.5Co0.8Fe0.2O3-δ
0c
initial oxygen concentration
b gc
natural background concentration of 18O
gc
18O concentration of the intentionally enriched atmosphere applied
c
final oxygen concentration
Oc
oxygen concentration
( )c t
instantaneous oxygen concentration
c(x,t) instantaneous 18O concentration
Vc
oxygen vacancy concentration
CHP combined heat and powder
δ oxygen nonstoichiometry
initial film oxygen nonstoichiometry
new-pO2-equilibrated film oxygen nonstoichiometry

xv
∆ change in
fitting
error for the exponential fitting obtained from Origin ©
D oxygen diffusion coefficient
Dchem chemical diffusion coefficient
D tracer difussion coefficient
DMFC direct methanol fuel cell
d instantaneous average inter-spot spacing
do initial average inter-spot spacing
DBT dibutyl phthalate
EC electronic conductor
ECR electrical conductivity relaxation
chemical strain
dilatometry-measured thermo-chemical strain
e' electron
EC electronic conductor
ECR electrical conductivity relaxation
E0 Young’s modulus of a dense sample bE is a material dependent constant
fE
film Young’s modulus
substrate Young’s modulus
angle of reflection
v,to t gas flow rate
F Faraday’s constant
FIB-SEM focused ion beam-scanning electron microscope

xvi
O
surface permeability
Gf activation energy for oxygen vacancy formation
g(t) normalized changes in relaxation experiments
g(x,t) normalized 18O concentration
GDC gadolinium doped ceria
GNP glycine-nitrate process
h * / *k D
film thickness
substrate thickness
I current
IC ionic conductor
IEDP isotope exchange depth profile
IIE isothermal isotope exchange
IPA isopropanol
IT intermediate temperature
Oj
net flux of oxygen
2Oj
net flux of oxygen molecules
0
exj
exchange current density
k surface exchange coefficient
kchem chemical surface exchange coefficient
ki an individual surface exchange coefficient corresponding to a distinct surface
exchange pathway
k tracer surface exchange coefficient

xvii
qk electrically determined surface exchange coefficient
instantaneous bilayer curvature
initial bilayer curvature
new- -equilibrated curvature
curvature relaxation
chemical stress
film stress
thickness averaged film stress derived from Stoney’s equation
sample length
L
L0 distance between the bilayer and the CCD camera
characteristic thickness
LSCrM La1-xSrxCr1-yMyO3-δ
LSF lanthanum strontium iron oxide
LSF64 La0.6Sr0.4FeO3-δ
LSGM lanthanum strontium gallium magnesium
LSM lanthanum strontium manganese oxide
LT low temperature
µO oxygen chemical potential
2O chemical potential change of an oxygen molecule
2
int
O oxygen chemical potential difference at the gas-solid interface
film biaxial modulus
substrate biaxial modulus

xviii
tM amount of oxygen ions diffused at time t
M
total amount of diffused oxygen ions
MCFC molten carbonate fuel cell
MIEC mixed ionic electronic conductor
MOSFET metal-oxide-semiconductor field-effect transistor
MOSS multi-beam optical stress sensor
aN
Avogadro’s number
film Poisson’s ratio
substrate Poisson’s ratio
ORR oxygen reduction reaction
P volume fraction porosity
PAFC phosphoric acid fuel cell
PDF powder diffraction file
PEMFC proton exchange membrane fuel cell
PLD pulsed laser deposition
pO2 oxygen partial pressures
ppm parts per million ( i.e. x 10-6)
Q charge
f
film relative density
R ideal gas constant
electrical surface resistance
total electrical conductivity
i
ionic conductivity

xix
( )t instantaneous electrical conductivity
0
initial electrical conductivity
final electrical conductivity
oxygen vacancy ionic conductivity
sccm standard cubic centimeters per minute (i.e. mL/min)
SIMS secondary ion mass spectroscopy
SOFC solid oxide fuel cell
SDC scandium doped ceria
SSC Sm0.5Sr0.5CoO3
specific pore surface area
t time
f
chamber flush time
i time constant corresponding to a distinct surface exchange pathway
temperature
rT
reactor temperature
ST PT room temperature
TGR thermo-gravimetric relaxation
TPB triple phase boundary
V voltage
rV reactor volume
mV
molar volume
OV
oxygen vacancy

xx
volume fraction porosity
VLSI very large scale integrated
Ow thermodynamic factor
XPS X-ray photoelectron spectroscopy
XRD X-ray diffraction
YSZ yttrium stabilized zirconia
8YSZ (Y2O3)0.08(ZrO2)0.92
13YSZ (Y2O3)0.13(ZrO2)0.87
c-YSZ cubic YSZ
t-YSZ tetragonal YSZ
z distance from the substrate midplane

1
1. Motivation and Project Overview
1.1. Energy Challenges
The demand for energy is essential for humanity, and it continues to rise as
industrialization and population growth increase [1]. Fossil fuels, such as coal, petroleum and
natural gas, are non-renewable energy sources that provide power for manufacturing,
transportation, and other aspects of modern society [1, 2]. Traditional energy production
technologies (such as internal combustion engines) have low efficiencies and inherent
environmental drawbacks (such as pollution and climate change). Therefore, advanced energy
conversion devices are needed to improve energy efficiency and minimize negative
environmental impacts.
1.2 Fuel Cells
1.2.1 Applications
Fuel cells are energy conversion devices that directly convert chemical energy into
electricity, and are recognized as a superior energy conversion technology to internal combustion
engines and coal- fired power plants because of their higher efficiency and lower environmental
impacts [3]. They find applications in portable devices (such as auxiliary power units), stationary
power generation (such as power plants and uninterruptible power supplies) and transportation
(such as fuel cell electric vehicles). The past five years have seen a steady growth of both
shipments and megawatts of fuel cell systems, as shown in Figure 1.1.

2
Figure 1.1 Fuel cell market growth from 2009 to 2013. [4]
1.2.2 Types of Fuel Cells
Based on the nature of the electrolyte, fuel cells can generally be categorized into proton
exchange membrane fuel cells (PEMFCs), direct methanol fuel cells (DMFCs), alkaline fuel
cells (AFCs), phosphoric-acid fuel cells (PAFCs), molten-carbonate fuel cells (MCFCs) and
solid-oxide fuel cells (SOFCs). A comparison of the mobile ions, operating temperatures,
electrode reactions, efficiencies and practical problems between these fuel cell types is
summarized in Table 1. Among these devices, SOFCs have the highest efficiencies (45% to 65%
for stand-alone applications and 70-90% for combined heat and powder (CHP) applications [5,

3
6]) and fuel flexibility. As it remains challenging to produce and store hydrogen in a sustainable
and cost-effective way [7, 8], SOFCs can serve as a bridge from the current hydrocarbon-based
economy to a hydrogen or biofuel based economy (using hydrocarbons fuels derived from fossil
fuels, biomass and solid waste) while using existing infrastructure (such as the natural gas
distribution grid) [9].

4
Table 1 Selected features of different types of fuel cells. [10-13]
Type Common
Electrolyte
Operating
Temperature Fuel
Mobile
Ion
Typical Electrode
Reactions
Electrical/
CHP
Efficiency
Practical
Problems
PEMFC NafionTM 70–110°C H2 (H2O)nH+ 2 ( ) 2
12 '
2g
O H e H O
2 ( )2 2
gH H e
40-50%/NA H2O
management;
CO intolerant
DMFC NafionTM 70–110°C CH3OH (H2O)nH+ 2 ( ) 2
36 6 ' 3
2g
O H e H O
3 2 26 6C H O H H O C O H e
40-50%/NA H2O
management;
CO intolerant
AFC Aqueous
KOH 100–250°C H2 OH-
2 ( ) 2 ( )
12 ' 2
2g g
O H O e O H
2 ( ) 2 ( )2 2 2 '
g gH OH H O e
50%/NA CO2 intolerant
PAFC H3PO4 150–250°C H2 H+ 2 ( ) 2
12 '
2g
O H e H O
2 ( )2 2
gH H e
40%/NA liquid
electrolyte
leaks
MCFC (Na,K)2CO3 500–700°C HCs,
CO CO3
2-
2
2 ( ) 2 ( ) 3
12 '
2g g
O C O e C O
2
2 ( ) 3 2 2 ( )2 '
g gH CO H O CO e
50%/80% Longer start-up; corrosive
electrolyte
SOFC (Zr,Y)O2-δ 600–1000°C
H2,
HCs,
CO
O2-
2
2 ( )
12 '
2g
O e O
2
2 ( ) 22
gH O H O e
45-
65%/90%
Longer start-
up; high temperature degradation
26
1.2.3. SOFC Overview
1.2.3.1 Components and Operating Principles
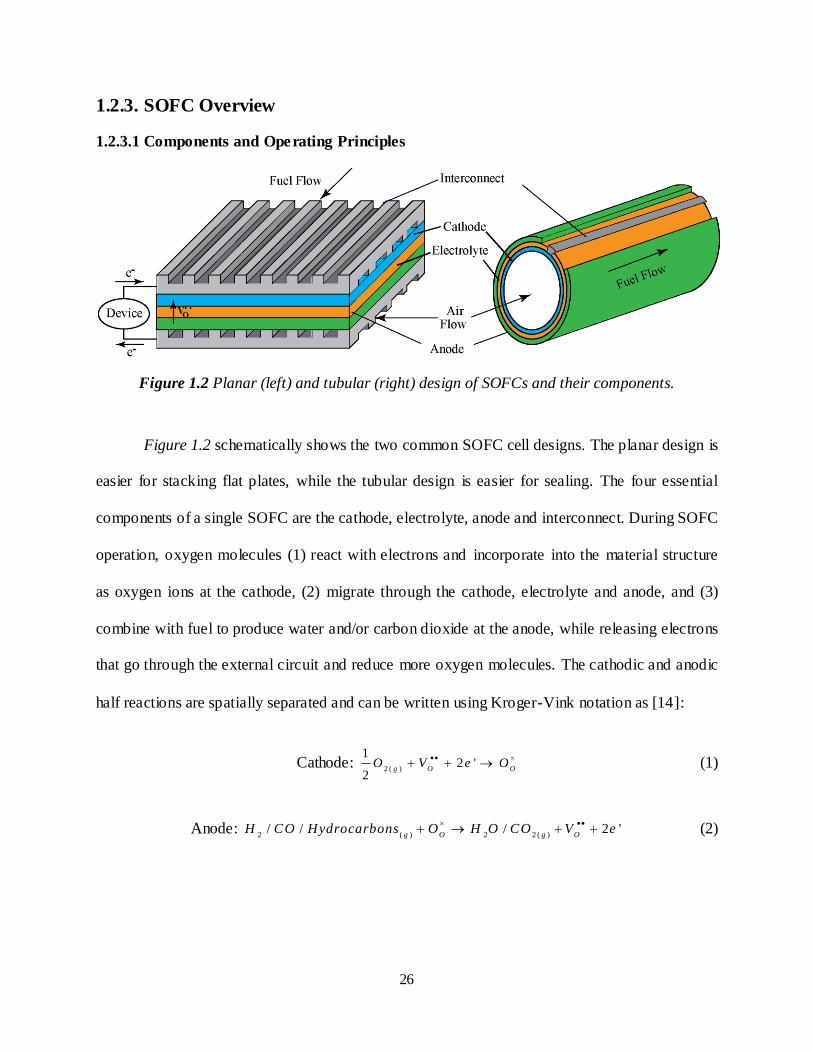
Figure 1.2 Planar (left) and tubular (right) design of SOFCs and their components.
Figure 1.2 schematically shows the two common SOFC cell designs. The planar design is
easier for stacking flat plates, while the tubular design is easier for sealing. The four essential
components of a single SOFC are the cathode, electrolyte, anode and interconnect. During SOFC
operation, oxygen molecules (1) react with electrons and incorporate into the material structure
as oxygen ions at the cathode, (2) migrate through the cathode, electrolyte and anode, and (3)
combine with fuel to produce water and/or carbon dioxide at the anode, while releasing electrons
that go through the external circuit and reduce more oxygen molecules. The cathodic and anodic
half reactions are spatially separated and can be written using Kroger-Vink notation as [14]:
Cathode: 2 ( )
12 '
2g O O
O V e O
(1)
Anode: 2 ( ) 2 2 ( )
/ / / 2 'g O g O
H CO Hydrocarbons O H O CO V e
(2)

27
The oxygen ion conducting capability of the solid electrolyte allows for direct fuel flexibility in
SOFC, compared to some of the other fuel cells (eg. PEMFCs, AFCs) that require hydro gen as
an exclusive fuel source, or the use of external reformers.
1.2.3.2 Materials and Requirements of SOFC Components
1.2.3.2.1 Cathode
The SOFC cathode is required to have a high electronic conductivity, a high oxygen
surface exchange coefficient, and a high activity for oxygen reduction. Traditionally, an SOFC
cathode is composed of a porous layer of electronic conductor (EC), such as Pt or Lanthanum
Strontium Manganese oxide (LSM), on a dense, ionic conducting (IC) electrolyte, such as
yttrium stabilized zirconia (YSZ) [10, 15]. Alternatively, a two-phase, porous EC-IC composite
on a dense IC electrolyte can be used to provide better ionic conductivity [3, 15]. In either
scenario, the oxygen reduction reaction (ORR) takes place at the triple-phase-boundary (TPB),
where the gas, EC and IC phases meet. The resulting oxygen ions are then transported through
the IC phase to the electrolyte.
In order to increase the surface area over which the ORR reaction can occur, mixed ionic
electronic conductors (MIECs) have been introduced to replace EC-IC cathodes [15]. The
capability of conducting both electrons and ions in a single material allows the oxygen to be
transported through the bulk of the cathode particles, thus extending the reaction sites over a
much larger surface compared to the triple phase boundary width. Numerous studies have been
conducted in the past two decades to develop MIEC oxides that considerably improve SOFC
performance [16-20]. By optimizing dopants and/or doping levels in perovskite-type oxides such
as Ln1-xSrxFe1-yCoyO3-δ (where Ln=La, Sm, Nd, etc.) [21], Sm0.5Sr0.5CoO3 (SSC) [22] and
Ba0.5Sr0.5Co0.8Fe0.2O3-δ (BSCF) [23], lower interfacial resistance and overpotential in the cathode

28
can be achieved. These MIECs can be used in single-phase porous cathodes, micron-sized
MIEC-IC composites, or infiltrated nano-composite cathodes [24]. Thin film MIEC
microelectrodes with well-defined geometries have also been made to elucidate oxygen
reduction kinetics [25, 26].
1.2.3.2.2 Anode
Ni-YSZ cermets are commonly used as SOFC anodes as they provide high electronic and
ionic conductivity, as well as chemical/thermal compatibility with YSZ electrolytes. For the
same reason as SOFC cathodes, however, the catalytic anode reactions are limited to TPB
regions in SOFC anode cermets.
Recent studies have investigated oxide based MIEC materials such as La1-xSrxCr1-yMyO3-δ
(LSCrM, where M is a transition metal such as V, Cr, Fe, Mn, Co, Ni, Cu, etc), as replacements
for Ni-based anodes [27-32]. These materials have excellent redox stability and catalytic activity
toward methane reforming. They also have good electrical conductivity and mechanical stability
in reducing atmospheres, which are all required for SOFC anodes.
1.2.3.2.3 Electrolyte
The primary requirement for SOFC electrolytes is sufficiently high ionic conductivity
and minimal electronic conductivity. Considering a target value of the area specific resistance
(ASR) of 0.15 Ωcm2, and the practical lower limit of electrolyte thickness of ~15 µm by
traditional colloidal fabrication techniques, the ionic conductivity must be greater than 0.01
1Scm
[3], as shown in Figure 1.3. This requires an operating temperature ≥700oC for traditional
YSZ electrolytes. In order to reduce the operating temperatures to ~500oC (a temperature
desirable to minimize degradation and allow the use of cheaper metallic interconnect
components), other electrolytes, such as gadolinium doped ceria (GDC) and lanthanum strontium
29
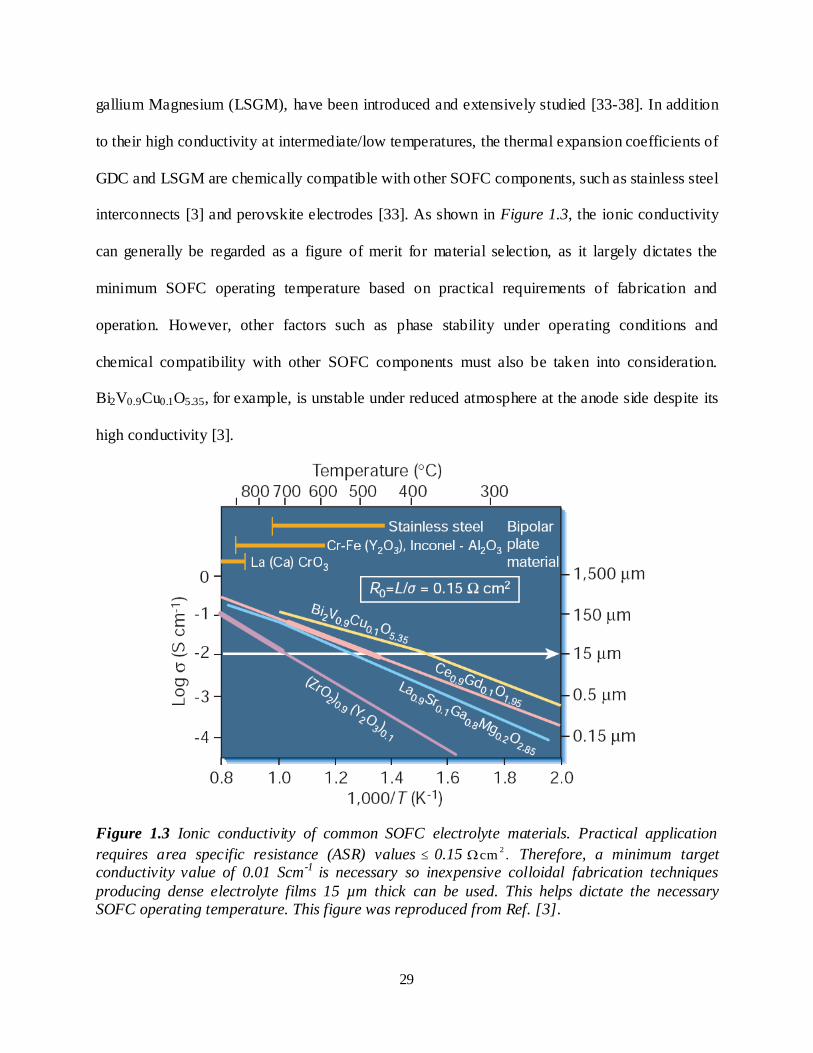
gallium Magnesium (LSGM), have been introduced and extensively studied [33-38]. In addition
to their high conductivity at intermediate/low temperatures, the thermal expansion coefficients of
GDC and LSGM are chemically compatible with other SOFC components, such as stainless steel
interconnects [3] and perovskite electrodes [33]. As shown in Figure 1.3, the ionic conductivity
can generally be regarded as a figure of merit for material selection, as it largely dictates the
minimum SOFC operating temperature based on practical requirements of fabrication and
operation. However, other factors such as phase stability under operating conditions and
chemical compatibility with other SOFC components must also be taken into consideration.
Bi2V0.9Cu0.1O5.35, for example, is unstable under reduced atmosphere at the anode side despite its
high conductivity [3].
Figure 1.3 Ionic conductivity of common SOFC electrolyte materials. Practical application
requires area specific resistance (ASR) values 0.15 2cm . Therefore, a minimum target
conductivity value of 0.01 Scm-1 is necessary so inexpensive colloidal fabrication techniques
producing dense electrolyte films 15 µm thick can be used. This helps dictate the necessary SOFC operating temperature. This figure was reproduced from Ref. [3].

30
1.2.3.2.4 Interconnect
Interconnect materials have to be electronically conductive and also serve as sealants to
spatially separate the fuel and air chambers. For reasons similar to those mentioned above, they
also need to be chemically stable during SOFC operating conditions, as well as
chemically/thermo-mechanically compatible with other SOFC components. Sub-600oC operating
temperatures would allow the use of alloys, such as stainless steel, that are cheaper and easier to
machine [10]. This, coupled with the reduced staring times and improved thermodynamic
efficiencies are driving the development of low temperature (i.e. <600oC) SOFCs.
1.3 Technological Progress of SOFCs
The first operating SOFC was developed in 1937 by Bauer and Preis [39]. Since then,
SOFC research and development activities have made significant progress in terms of lowering
SOFC operating temperatures from 1000oC to the intermediate temperature (IT) (650oC to
800oC) range, and even down to the low temperature (LT) (<600oC) regime, while maintaining a
desirable power density of >1W/cm2 [3, 9, 40, 41]. SOFC lifetimes have also been extended to
more than 5 years [42, 43]. These major advances are largely attributed to the development of
new materials, the advancement of fabrication techniques, and the optimization of electrode
microstructures [9, 41, 42, 44-46].
1.4 Current Challenges at the SOFC Cathode
Despite the encouraging improvements made during the past two decades, many
technological challenges still remain in SOFCs. These challenges usually involve competing
situations: (1) high operating temperatures enhance the oxygen surface exchange and diffusion
kinetics but increases the long-term degradation of SOFC components, and (2) low operating

31
temperatures improve the long-term stability but aggravates electrode polarization losses. One of
the key issues that has driven research but remains poorly understood is the reaction kinetics of
oxygen reduction at the cathode. This can be demonstrated by scattered, sometimes conflicting
experimental results on nominally identical bulk and thin film samples made with different
fabrication techniques [47-50]. Contradictory observations on the effect of lattice strain on the
oxygen surface exchange kinetics of MIEC oxides also exists in the literature [51, 52].
Figure 1.4 Voltage drop of a typical SOFC operated at 100 mA/cm2 and various temperatures [53].
As depicted in Figure 1.4, among the three main components of SOFCs, the cathode is
the most resistive part of the cell. The overpotential losses due to oxygen transport at the cathode
are significant, especially when the operating temperature is lowered in order to reduce cost and
maintain long-term mechanical/chemical integrity.
In general, oxygen transport can generally be considered as a combination of the
following elementary steps: (1) oxygen gas diffusion, (2) oxygen surface exchange at the gas-
solid interface, (3) oxygen ion diffusion through the MIEC cathode, and (4) oxygen
32
incorporation across the cathode/electrolyte interface. Multiple models [54, 55] show that for
traditional SOFC cathodes, oxygen surface exchange is the most resistive process.
1.5 Hypothesis and Aim of this Work
Due to its important role in determining SOFC cathode performance, oxygen surface
exchange has attracted great attention in the literature in terms of its fundamental mechanisms,
how to measure it, and how to improve it. However, there are great discrepancies/contradictions
in the literature, and debate exists on the oxygen surface exchange rates of even the most
common MIEC materials. In La0.6Sr0.4FeO3-δ (LSF64), for instance, chemical oxygen surface
exchange coefficient (kchem) discrepancies of up to 5 orders of magnitude are common at
identical temperature and oxygen partial pressure conditions [47, 50]. Similar discrepancies have
been observed for other MIEC materials such as reduced cerium oxide [56-59], lanthanum
strontium cobaltite [60-62] and lanthanum strontium cobalt iron oxide [63-66].
In fact, many of the literature studies, despite investigating materials of interest with the
same chemical compositions, prepare and measure the samples using different techniques. These
various techniques can introduce large variations in microstructure, stress states, electrode
impacts, etc. These complicating effects are hypothesized to contribute to the large surface
exchange discrepancies seen in the literature. The objective of the work presented in this
thesis is to evaluate the hypothesis that (1) reliable surface exchange measurements of
MIEC films can be obtained via a curvature relaxation technique (κR) based on the
mechano-chemical coupling of these materials, and (2) that factors such as preparation
technique and/or microstructure affect surface exchange.

33
Of the following chapters, Chapter 2 reviews the mechano-chemical coupling in SOFC
materials and the traditional oxygen surface exchange coefficient measurement techniques.
Chapter 3 provides the theoretical development of the curvature relaxation (κR) technique and
summarizes the experimental methods used throughout this work. Chapter 4 reports the
mechano-chemical behavior of bulk La0.6Sr0.4FeO3-δ (LSF64), an archetypal MIEC material.
Chapters 5, 6 and 7 use the κR technique to experimentally investigate the surface exchange
coefficients and stress of LSF64 films fabricated by sputtering, pulsed laser deposition, and
colloidal spray deposition, respectively. Finally, Chapter 8 provides a summary of the important
conclusions that can be drawn from this work.

34
2 Literature Review
2.1 Mechano-Chemical Coupling in Solid Oxide Fuel Cell
Materials
In order to better understand how oxygen surface exchange in MIEC materials can be
investigated using the curvature relaxation technique developed in this work, a general
background summary on mechano-chemical coupling in electroceramics is provided in this
chapter.
2.1.1 Strain in Electro-ceramic Devices
The functional ceramics used in energy, automotive and chemical applications are usually
nonstoichiometric, ionically or electronically conductive, and capable of exchanging electrons or
ions with the enviroment. These unique features allow them to: a) catalyze the removal of x
N O ,
C O and unreacted hydrocarbons from combustion gas streams [67], b) sense oxygen partial
pressures for fuel-efficient engine operation [68], c) catalyze the dissociation of 2
H O or 2
CO for
alternative fuel production [69, 70], e) separate oxygen for gas purification applications [71], and
f) serve as catalytically-active SOFC electrode materials [27], among other uses.
During fabrication and operation, many electronic/ionic devices undergo undesirable
stress development, which is oftentimes induced by mechanical, thermal or electrochemical
effects (or combinations thereof). In Li ion batteries, for example, the charge-discharge
operations rely on the lithiation and delithiation of the electrodes. This repeated compositional
change result in repeated volume changes that may cause large stress development and
irreversible structural changes/failure [72]. In SOFCs, different components are usually
manufactured under particular temperature/pressure conditions and subsequently used at others.

35
This can leave inherent stress caused by the constrained sintering of individual components or
the thermal expansion mismatch between neighboring components. Due to the relatively high
operating temperature and the varying oxygen partial pressure across an SOFC device, rapid
start-up and cool-down can also cause SOFC mechanical failure [73-75].
2.1.2 Chemical Expansion in MIEC Materials
Due to the presence of multivalent cations and accomodating crystal structures, many
MIEC materials can alter their bulk oxygen vacancy concentration (V
c ) by changing their cation
oxidation state. In bulk lanthanum strontium iron oxide (LSF), for example, these changes can
be summarized via the defect reaction:
2 ( )
12 2
2Fe gO O Fe
Fe O O V Fe (3)
at temperatures below 625oC and oxygen partial pressures ranging from 1 to ~1x10⁻⁷
atm [76]. In addition to altering cation and anion defect concentrations, these internal redox
reactions can affect overall lattice strain. For instance, in lanthanum strontium ferrite [49, 77],
cerium oxide [78-80], lanthanum strontium cobaltite [81, 82], lanthanum strontium chromate
[83], lanthanum manganate [84], lanthanum strontium cobalt iron oxide [82, 85], barium
strontium cobalt iron oxide [86], strontium iron titantate [87], and other MIEC materials, the
operation of reactions such as Equation (3) results in lattice expansion as the oxygen
nonstoichiometry (δ) increases. This mechano-chemical coupling can be summarized as a
chemically induced strain (c
) given as:
Δ
Δc c
T
l
l (4)

36
where l is sample length, T is the temperature, and c
is defined as the chemical expansion
coefficient. is related to the oxygen vacancy concentration via:
/v a m
c N V (5)
where a
N is Avogadro’s number and m
V is the molar volume. As shown in Table 2, many MIEC
oxides exhibit positive c
values, meaning that increases in δ result in overall expansion of the
lattice.
Table 2 Chemical expansion coefficients of common MIEC materials
Material Measured Temperature (oC) c
0.9 0.1 1.95C e G d O
700-900 0.14 [88, 89] †
2C eO 800 0.10 [80, 89]
0.3 0.7 3La Sr FeO
650-875 0.017-0.047 [90]
0.6 0.4 0.8 0.2 3La Sr Co Fe O
700-900 0.031 [91, 92]
1 3x xLa Sr CoO
0.2 x 0.8 600-900 0.023-0.024 [91, 93]
1 3x xSrFe Ti O
0.25 x 0.7 23 0.03 [94]
0.6 0.4 0.8 0.2 3Ba Sr Co Fe O
600-900 0.026-0.016 [95]
1 3x xLa Sr CrO
0.16 x 0.3 1000 0.024 [96]
3
LaM nO
600-1000 0.024 [84]
† For 0 ≤ δ ≤ 0.05. Although nonlinear above 0.05, c
is linear for Δ 0.01 [88]
As is shown by the many studies listed in Table 2, the chemical expansion provides
additional strain compared to pure thermal expansion and can lead to challenging stress
development across the device. Understanding this combined “thermo-chemical” effect is
therefore critical in material selection and system design.

37
2.1.3 Utilizing Mechano-chemical Coupling
Notwithstanding the challenges resulting from chemical expansion, it is also possible to
take advantage of mechano-chemical coupling to improve material properties and device
performance through strain engineering.
Previous experimental and computational studies have suggested that stress can affect the
ionic defect concentrations [97-99], oxygen ion diffusion [100], carrier mobility [101-103], free-
surface dopant/impurity buildup [104-106], catalytic activity [107], and oxygen surface exchange
kinetics [100, 101, 106, 108-110] of electrochemically active ceramics. As detailed in Section
2.3.6, many of these properties can be positively impacted with intentionally induced tensile
strain.
While bulk or micro-scale materials can sustain limited stress and therefore are more
susceptible for degradation and failure, nano-scale thin films can withstand stress levels on the
order of several GPa [111]. One of the main objectives of this work is the utilization of mechano-
chemical coupling and the development of the curvature relaxation technique to measure MIEC
films fabricated by various techniques, as detailed in Chapters 5-7.
2.2 Oxygen Surface Exchange and its Measurement
As mentioned in Chapter 1, high oxygen surface exchange kinetics is the key to the
activity of nano-composite and thin film MIEC cathodes, and therefore the overall performance
and commercial viability of low temperature SOFCs. This section provides a literature review on
the definitions, derivations and traditional measurement techniques of oxygen surface exchange
coefficients.

38
2.2.1 The Characteristic Thickness
In comparison to traditional EC cathode materials, MIEC cathodes are advantageous in
that oxygen ion diffusion through the bulk is significantly enhanced. On the other hand, in MIEC
materials, oxygen surface exchange, which also contributes to the overall oxygen transport in the
cathode, can become rate limiting. It is therefore important to distinguish between these two
processes and identify the conditions where they control the oxygen transport kinetics. The
characteristic thickness, Lc, indicates the dimension where a sample is under mixed control (i.e.
both bulk and surface). A given sample with thickness l, is essentially limited by surface
exchange when l/Lc<100 and limited by bulk diffusion when l/Lc>100 [112]. The characteristic
thickness can be expressed as the ratio of oxygen diffusivity over the surface exchange
coefficient [112]:
c
DL
k (6)
2.2.2 The Different Types of Oxygen Surface Exchange Coefficients
2.2.2.1 Chemical Exchange Coefficient
When the environmental pO2 changes by a small amount, ∆pO2, a corresponding oxygen
chemical potential change ∆µO, and a net flux of oxygen, O
j , occur at the surface, These two
parameters are related by:
2
2
O0 0 O2 2 4
O O ex exj j j j
RT RT
(7)

39
where 2O
j is the net flux of oxygen molecules,
0
exj is the exchange current density,
2O is the
chemical potential change of an oxygen molecule at the surface. Given the thermodynamic factor
derived by Weppner et al. [113] as:
O
O
O
1
lnw
RT c
(8)
Oj
can be rewritten as:
0
O
O O
O
4ex
j wj c
c (9)
where O
c is the oxygen concentration change across the surface. Assuming first order kinetics,
the rate constant of the surface reaction, kchem, is then given by:
0
O O
chem
O O
4ex
j j wk
c c
(10)
Or alternatively,
O O
chem
O O
j RTwk
c
(11)
where the constant O O
( / )j is termed as the surface permeability, O
[114]. This expression
defines the rate constant for the ambipolar diffusion of oxygen (i.e. the combined diffusion of
oxygen vacancies and electrons) through an MIEC material, in the absence of an external
electrical circuit.

40
2.2.2.2 Tracer Exchange Coefficient
If a sample is at chemical but not isotopic equilibrium (i.e. O
j =0), tracer surface
exchange occurs. The rate constant in this situation is termed as the tracer surface exchange
coefficient ( k ) and is defined as:
O
O
RTk
c
(12)
Unlike chem
k which depends on the ambipolar diffusion of both electrons and oxygen vacancies,
k is only dependent on the diffusion of oxygen vacancy species, since there is no change in the
electronic concentration within the material.
2.2.2.3 Electrically Determined Surface Exchange
If a sample is under a small, steady-state applied electrical field and only ionic current is
allowed through the sample, an electrically determined surface exchange coefficient defined as :
O
O
q q RTk
c (13)
Like chem
,k during a qk measurement, changes in the electronic concentration are occurring.
However, since these concentration gradients are not generated by or relieved by electron
movement within the material (these small electron concentration gradients are extremely
imposed), the resulting oxygen flux is not dependent on electron diffusion through the material.
Although relationships exist between the three types of k’s [66], their different definitions
imply the different situations they are applied to, their magnitudes (even for the same sample)
can be very different , and usually different techniques are used to measure them, as detailed in
the following section.

41
2.2.3 Literature Oxygen Surface Exchange Coefficient Measurement
Techniques
As summarized in Table 3, there are a number of measurement techniques used for
determining the various surface exchange coefficients discussed in Section 2.2.1. Due to various
instrumental and/or mechanistic restrictions, some of the techniques have a limited temperature
range, some require electrodes to be deposited on the sample (which can complicate accurate k
measurements, especially in low-conductivity films), some are ex-situ techniques that may not
reflect sample behavior under operating conditions, and some need voluminous samples so that
resolvable signals can be obtained. An ideal film k measurement technique would be electrode-
free, in-situ and suitable for both thin film and thick film analysis across a large temperature
window for as many materials as possible. As discussed in Section 3.1, the curvature relaxation
technique developed in this work is such a technique.

42
Table 3 Methods for determining surface exchange coefficients and a comparison of their advantages/disadvantages.
Method Oxygen
Permeation Ionic
Conductivity Tracer Depth
Profiling Conductivity Relaxation
Isothermal Isotope
Exchange
Electrical Titration
Gravimetric Relaxation
Optical Relaxation
Strain Relaxation
Curvature
Relaxation
Measures the:
surface dominated through-sample surface
resistivity
partial ionic conductivity
using blocking
electrodes or impedance
spectroscopy
to obtain
Oc depth
profile of a sample
equilibrating to changes in
O2 isotope ratios
electrical conductivity of a sample
equilibrating to pO2
changes
gas composition
around a sample
equilibrating to changes in
O2 isotope ratios
or of a cell coupled to a sample
equilibrating to
electrically
imposed O
c
changes
weight change of a
sample equilibratin
g to pO2
changes
optical properties of
a sample equilibrating
to pO2
changes
lattice strain of a
sample equilibratin
g to pO2
changes
lattice strain of a sample
equilibrating to pO2
changes
Reference [115] [116] [117] [118] [119] [120] [121] [122] [123] This Work
Type of k kchem qk k
kchem k kchem kchem kchem kchem kchem
Pros
Electde-free, Suitable for
in situ analysis
below 500oC
Suitable for in situ
analysis Electrode-free
Suitable for in situ
analysis
Electrode-free
Suitable for in situ
analysis below 500
oC
Electrode-free,
Suitable for in situ thick
film analysis
Electrode-free, suitable
for in situ analysis
Electrode-free,
suitable for in situ
analysis
Electrode-free, suitable
for in situ
analysis
Cons
Glass seals prevent higher
temperature experiments
Requires electrode
High vacuum prevents in situ
measurements
Requires electrode
Voluminous samples are required to noticeably alter gas
composition
Requires electrode. Glass seals
prevent higher
temperature experiments
Voluminous samples
are required to
noticeably alter weight
Requires optical defects
influenced by a change in
defect concentration
Only probes the
lattice response
Cannot separate the
behavior of different
local parts
of the film
Symbol Key: q
k , kand kchem = electrically determined, tracer determined, and chemically determined k , respectively. = oxygen exchange
surface resistance, = ideal gas constant, = temperature in Kelvin, F= Faraday’s Constant, I= current, and V= voltage.
43
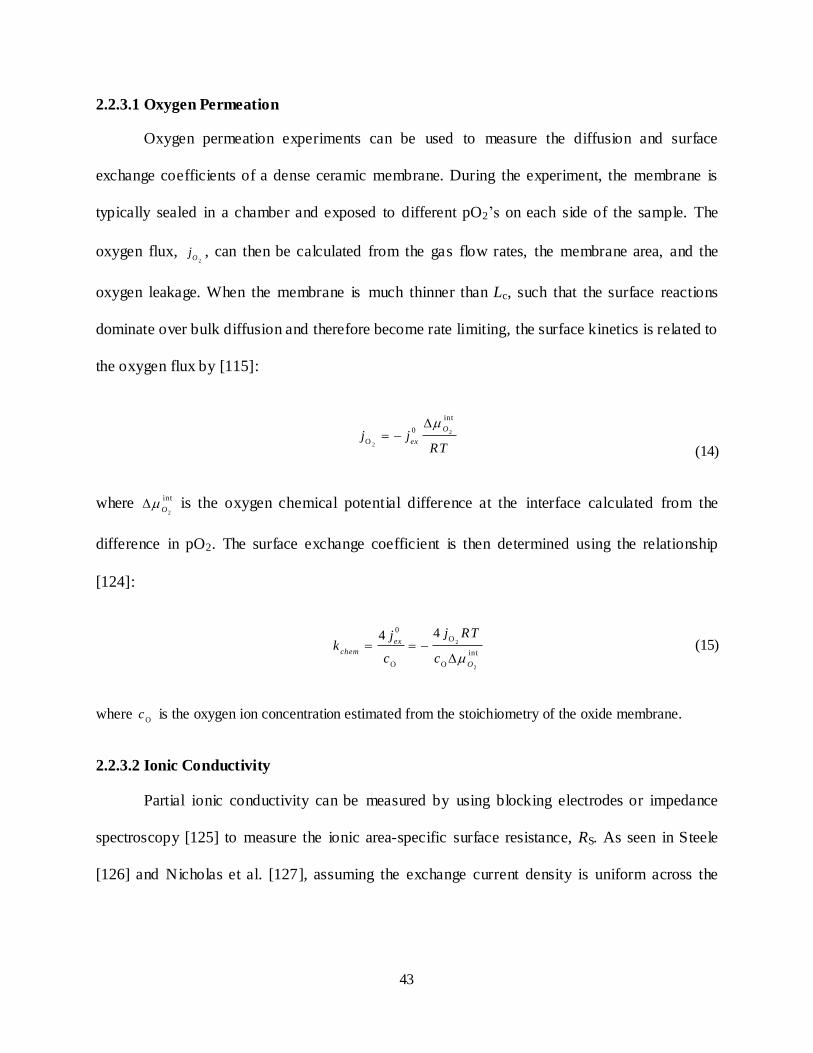
2.2.3.1 Oxygen Permeation
Oxygen permeation experiments can be used to measure the diffusion and surface
exchange coefficients of a dense ceramic membrane. During the experiment, the membrane is
typically sealed in a chamber and exposed to different pO2’s on each side of the sample. The
oxygen flux, 2O
j , can then be calculated from the gas flow rates, the membrane area, and the
oxygen leakage. When the membrane is much thinner than Lc, such that the surface reactions
dominate over bulk diffusion and therefore become rate limiting, the surface kinetics is related to
the oxygen flux by [115]:
2
2
int
0
O
O
exj j
RT
(14)
where 2
int
O is the oxygen chemical potential difference at the interface calculated from the
difference in pO2. The surface exchange coefficient is then determined using the relationship
[124]:
2
2
0
O
int
O O
44ex
chem
O
j RTjk
c c
(15)
where O
c is the oxygen ion concentration estimated from the stoichiometry of the oxide membrane.
2.2.3.2 Ionic Conductivity
Partial ionic conductivity can be measured by using blocking electrodes or impedance
spectroscopy [125] to measure the ionic area-specific surface resistance, RS. As seen in Steele
[126] and Nicholas et al. [127], assuming the exchange current density is uniform across the

44
sample, the product of RS and the ionic conductivity, i
, can be related to the characteristic
thickness:
/S i C
R L D k (16)
Employing the Nernst-Einstein Equation (2.6), it follows that:
2
4
q
S O
RTk
F R c (17)
where qk is the electrically determined surface exchange coefficient defined in Equation (13),
and O
c is the oxygen ion concentration estimated from the stoichiometry of the oxide membrane.
Using Equation (17), one can therefore measure qk in an ionic conductivity experiment by
measuring RS and O
c from the impedance arc width and height, respectively.
2.2.3.3 Isotope Exchange Depth Profiling
The Isotope Exchange Depth Profile (IEDP) method can be used to determine both the
oxygen tracer surface exchange coefficient (k*) and the oxygen tracer diffusion coefficient (D*)
[117]. In this technique, a dense specimen is pre-annealed in an atmosphere with normal oxygen
isotopic abundance. 18O/16O isotope exchange experiments are then carried out in an atmosphere
with enriched 18O2. After sample quenching, the 18O concentration profile is analyzed by
Secondary Ion Mass Spectroscopy (SIMS). k* and D* can be extracted from least-square fit of
the concentration data to a solution of Fick’s Second Law [117]:
2
( , )( , ) erfc exp( )erfc
2 2
bg
g bg
c x t c x xg x t hx h D t h D t
c c D t D t
(18)
45
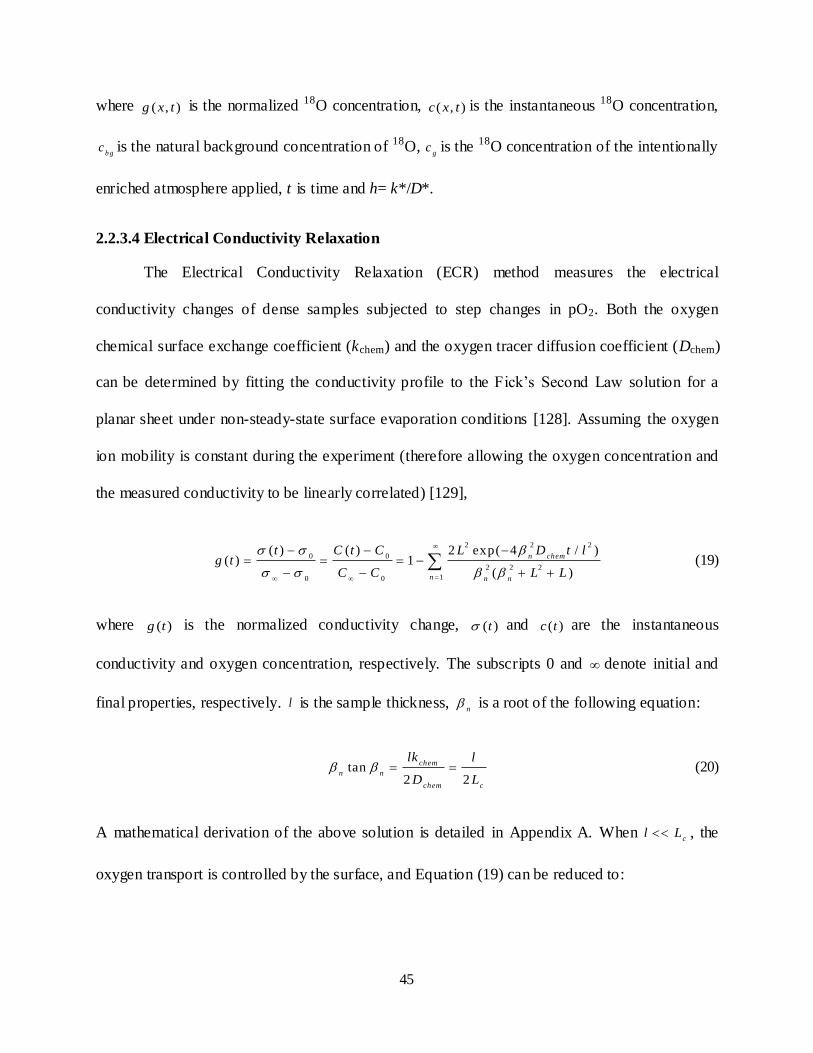
where ( , )g x t is the normalized 18O concentration, ( , )c x t is the instantaneous 18O concentration,
b gc is the natural background concentration of 18O,
gc is the 18O concentration of the intentionally
enriched atmosphere applied, t is time and h= k*/D*.
2.2.3.4 Electrical Conductivity Relaxation
The Electrical Conductivity Relaxation (ECR) method measures the electrical
conductivity changes of dense samples subjected to step changes in pO2. Both the oxygen
chemical surface exchange coefficient (kchem) and the oxygen tracer diffusion coefficient (Dchem)
can be determined by fitting the conductivity profile to the Fick’s Second Law solution for a
planar sheet under non-steady-state surface evaporation conditions [128]. Assuming the oxygen
ion mobility is constant during the experiment (therefore allowing the oxygen concentration and
the measured conductivity to be linearly correlated) [129],
2 2 2
0 0
2 2 2
10 0
( ) ( ) 2 exp( 4 / )( ) 1
( )
n chem
n n n
t C t C L D t lg t
C C L L
(19)
where ( )g t is the normalized conductivity change, ( )t and ( )c t are the instantaneous
conductivity and oxygen concentration, respectively. The subscripts 0 and denote initial and
final properties, respectively. l is the sample thickness, n
is a root of the following equation:
tan2 2
chem
n n
chem c
lk l
D L (20)
A mathematical derivation of the above solution is detailed in Appendix A. When c
l L , the
oxygen transport is controlled by the surface, and Equation (19) can be reduced to:

46
0 0
10 0
( ) ( )( ) 1 exp
n
i
i
i
t C t C tkg t A
C C l
(21)
where each individual oxygen surface exchange coefficient i
k corresponds to a distinct oxygen
surface exchange pathway [130-132].
2.2.3.5 In situ Isothermal Isotope Exchange
The Isothermal Isotope Exchange (IIE) technique integrates the principles of IEDP and
ECR, and provides an in situ method to measure surface exchange kinetics of powders and bulk
samples [63]. It takes a similar approach to ECR, but instead measures the relaxation of oxygen
concentration in the gas stream following an abrupt change in pO2 (it is therefore an indirect
measurement of oxygen concentration in the sample). The fitting equation then takes the form:
2 2 2
0
2 2
10
( ) 6 exp( / )( ) 1
[ ( 1)]
n
n n n
c t c L D t ag t
c c L L
(22)
cot 1 0n n
L (23)
*
*
c
k a aL
D L (24)
where a is the radius of the particle modeled as a sphere. When using this technique to measure
k*, nanoparticles are generally used to ensure that c
a L and oxygen surface exchange
dominates.
2.2.3.6 Electrical Titration
In electrical titration measurements, a solid-state electrochemical cell is coupled to the
sealed atmosphere surrounding a sample. In response to a small potential step in the

47
electrochemical cell, an alteration in the atmospheric pO2 is created, which, in turn, induces a
corresponding oxygen vacancy concentration and therefore a current relaxation in the sample
[120, 133, 134]. The surface exchange coefficient is then obtained by fitting a solution to Fick’s
Second Law:
2 2 2
2 2 2
1
8 exp( 4 / )( )
[ ]
n
n n
L D D t lI t Q
l L L
(25)
where Q is the total charge passed as t approaches infinity, l is the sample thickness, n
is a root
of the following equation:
tann n
L (26)
where L is defined by:
2 2
chem
chem c
lk lL
D L (27)
2.2.3.7 Thermogravimetric Relaxation
Thermo-Gravimetric Relaxation (TGR) measures the weight change of a sample in
response to a step pO2 change [121]. Since the oxygen is the only species exchanging with the
atmosphere, and the oxygen content of the sample is linearly re lated to the sample weight, the
time constant for this process can then be calculated for the determination of kchem and Dchem
using Equations (19)-(20) where the conductivity is replaced by the sample weight.
2.2.3.8 Optical Absorption Relaxation
The optical absorption relaxation technique is based on the fact that oxygen concentration
changes in some MIEC materials are directly correlated with the changes of cation oxidation

48
state (such as Fe4+/Fe3+), and that certain cations have absorption bands corresponding to visible
light [135]. During these experiments, a monochromatic light passes through the sample sealed
in a controlled atmosphere. As a stepwise oxygen partial pressure change is applied, the change
of the absorption coefficient is recorded by a spectrometer (typically a CCD camera). The time
constant for this process can then be calculated for the determination of kchem and Dchem using
Equations (19)-(21) where the conductivity is replaced by the absorption coefficient.
2.2.3.9 Strain Relaxation by X-ray Diffraction
Recently, a time-resolved X-ray Diffraction (XRD) technique has been developed to
measure surface exchange kinetics of epitaxial thin films subjected to pO2 changes [123]. This
methodology is based on the chemical expansion of these materials accompanied with the
variation of transition metal ion oxidation state that result in changes in the lattice parameter.
Assuming linear chemical expansion (i.e. the lattice strain is linearly proportional to the oxygen
defect concentration, c), the time constant for this process can then be calculated for the
determination of kchem and Dchem using Equations (19)-(21) where the conductivity is replaced by
the film lattice parameter.
2.3 The Factors Governing Oxygen Surface Exchange
With the development of new materials and optimized microstructures, researchers have
measured the surface exchange coefficients of a variety of MIEC materials, using the techniques
listed in Section 2.2.3. Many studies have systematically investigated factors (such as material
composition, surface structure, crystal orientation, mechanical strain, etc.) that govern the
oxygen surface exchange kinetics. However, due to varying fabrication and characterizing
techniques adopted among different research groups, it is often difficult to perform direct

49
comparison among different data sets and draw clear conclusions. Therefore, great ambiguity
still remains in terms of the k’s of many SOFC materials. A brief review and some examples of
the various proposed factors affecting surface exchange are given below.
2.3.1 Material Composition (Dopants and Doping Level)
The perovskite crystal structure ABO3-δ is known for its phase stability when large A-site
and/or B-site substitutional cations are present and a significant amount of oxygen vacancies are
generated. This enables a wide range of dopants and doping levels to be selected to tailor the
oxygen nonstoichiometry, and subsequently the surface exchange kinetics.
As an archetypal family of A-site doped perovskite-type materials, LaxSr1-xBO3-δ have
been extensively studied (B=Mn, Fe, Ti, Ga, etc.) [47, 136-138]. In order to maintain charge
neutrality, the substitution of La3+ by divalent cation Sr2+ is generally accompanied by the
generation of oxygen vacancies or electron holes, as described by the following defect reactions:
' 1
2La O OSrO Sr O V
(28)
'
B La O BB SrO Sr O B
(29)
and LaxSr1-xBO3-δ materials are therefore generally p-type semiconductors. In general, a higher
vacancy concentration corresponds to faster oxygen diffusion and surface exchange in that more
vacancy sites facilitate the absorption and transport of oxygen ions [117]. In addition, a higher
electronic conductivity is usually correlated with faster oxygen surface exchange in that more
electronic carriers facilitate surface reactions that involves charge transfer in oxygen
molecules/ions [15]. This is demonstrated by literature studies [139, 140] in which an increase of

50
the Sr content is associated with an increased oxygen surface exchange coefficient and/or
decreased oxygen surface exchange activation energy.
B-site doped perovskites, such as LaxSr1-xMn1-yCoyO3-δ, have also been systematically
studied [117]. Similar trends are observed in that increasing Co site fraction increases the surface
exchange coefficient. This can be understood by the fact that an oversized Co cation actually
increases the opening between A and B cations where oxygen ions pass through (i.e. lowers the
saddle point energy [141]). This can explain the slow oxygen surface exchange and diffusion of
Mn-rich perovskites and the fact that LaxSr1-xMnO3-δ is essentially an electronic conductor.
The composition Ba0.5Sr0.5Co0.8Fe0.2O3-δ has also attracted great attention and was
suggested as a high-performance cathode due to its low ASR of 0.055–0.071 Ωcm2 at 600°C
[23]. The measured surface exchange coefficients of BSCF films are 1-3 orders of magnitude
larger than contemporary, much studied lanthanum strontium cobaltites [142]. These desirable
properties are attributed to mixed occupation of Ba and Sr on the A-site that provides unusually
large oxygen nonstoichiometry (δ) that can exceed 0.5 without destabilizing the perovskite phase
[23, 143-145].
2.3.2 Oxygen Partial Pressure
The pO2 dependence of the surface exchange coefficient has been studied for a variety of
perovskite materials, such as La1-xSrxFeO3-δ and La1-xSrxCoO3-δ using electrical conductivity
relaxation [47, 146, 147]. It has been reported that a power law exists between kchem and pO2
(kchem ~[pO2]n, where n is between 0.65 and 0.85 for La1-xSrxFeO3-δ [47]) across the temperature
range of 600-950°C, indicating that kchem decreases with decreasing pO2. Since one would expect
that lower pO2 corresponds to higher oxygen vacancy concentration that would increase k, as

51
seen in Equation (3), it is suggested that electronic species dominate the surface exchange rate in
that electron transfer at the oxide surface can be the rare- limiting step [148], especially at low
pO2.
2.3.3 Surface and Interface Structure
A great number of studies have demonstrated that the cathode surface structure plays a
key role in oxygen surface exchange. For instance, Imanishi and co-workers [149] used pulsed
laser ablation techniques to epitaxially to grow LSM and LSC thin films on single crystal YSZ
substrates with different crystal orientations and found that the impedance spectroscopy-
measured surface resistance of the films for the (111) surface was less than the (110) surface,
which was less than the (100) surface. Yan et al. [150] also measured the surface exchange rates
of LSM film with these orientations, but on SrTiO3 substrates. Varying k values (1x10⁻⁶ to
6.5x10⁻⁵ cm/s) and activation energies 0.8 to 1.2 eV were found. Tsuchiya et al. studied the
different surface exchange coefficients of textured ((111) and (110)) and polycrystalline ceria
films grown by molecular beam synthesis and electron beam evaporation, respectively. The
polycrystalline film showed five times larger k values than the textured films, but had very
similar activation energy. This indicates that both films had similar rate limiting steps and the
different surface exchange kinetics was attributed to (1) limited oxygen adsorption site at ((111)
and (110) planes, and (2) the accumulation of oxygen vacancies at grain boundaries of
polycrystalline films.
2.3.4 Grain Size
As shown in ion conductors such as doped zirconia and ceria [151-155], grain size can
also dramatically alter mass and charge transport properties. This is explained by a space charge
effect in which significant accumulation of electron carriers and depletion of the oxygen

52
vacancies occur near the grain boundary. One can therefore engineer the conductivity by
changing the grain size, as the width of the space charge layer is on the order of a few
nanometers, which is comparable to the nanostructured grains. Sase et al. studied the effect of
grain size on the surface resistance of La1-xSrxCoO3-δ thin films and observed ~5 times
performance enhancement for the nanosized film (30–50 nm grain size) compared to sub-
micron-sized film (300–500 nm grain size) [156].
2.3.5 Electronic structure
The impact of the electronic structure on surface exchange kinetics has been extensively
studied. The d-band model has been successful in describing the metal catalysts surface
reactivity, but is not a good descriptor for oxide catalysts [157, 158]. The oxygen 2p band center
energy [159] and carrier density of minority electronic species in the conduction band [160]
have recently been proposed to describe the surface catalytic activity of oxides, but neither have
been found to be universally applicable [161]. In (La,Sr)CoO3 and (La,Sr)MnO3 thin films at
high temperature, higher density of states is observed in tensile strained films compared to
compressive strained films, indicating easier charge transfer at surfaces under tension.
2.3.6 Strain
Both theoretical and experimental studies have shown that stress can affect electronic and
ionic properties. In fact, strain engineering has been a common practice in the semiconductor
industry, where tensile strained (up to 1GPa [162]) silicon [163] and indium gallium arsenide
[164] for Metal-Oxide-Semiconductor Field-Effect Transistor (MOSFET) and Very Large Scale
Integrated (VLSI) computer logic chips have achieved threefold or fourfold electronic
conductivity. These enhancements can generally be understood by strain- induced electronic

53
band-wrapping, Jahn-Teller distortion band splitting, and/or inter-band carrier redistribution
[162].
In addition, strain has been proposed to significantly impact the ionic defect
concentrations [97-99], electronic structure [165], oxygen ion diffusion [100], carrier mobilities
[101-103], free-surface dopant/impurity buildup [104-106], catalytic activity [107], and oxygen
surface exchange kinetics [100, 101, 106, 108-110] of electrochemically active ceramics. When
thin film geometries are adopted, stresses can easily be induced from film-substrate lattice
mismatch [52, 100, 166], and stress level in the order of several GPa can be maintained [111]. It
is generally understood that tensile strain promotes greater oxygen vacancy concentration,
mobility and oxygen surface coverage [166]. That said, excessive tensile strain is reported to
cause negative effects in that oxygen ion mobility is inhibited due to cation-oxygen bonding
[166]. It may also be possible to improve surface exchange properties by controlling the amount
of stress- induced cation surface segregation.
2.3.7 Dislocations
In addition to strain effects, misfit dislocations in ionic thin films, which act as a stress
relaxation mechanism, have also been suggested to impact the ion conduction kinetics [51].
Sillassen et al. [167] attributed the 1000 times enhancement of conductivity to the fast
conduction along epitaxial YSZ|MgO interfaces compared to bulk conductivity, especially at
temperatures below 350oC, which suggested the positive effects of misfit dislocations. Li et al.,
[168] however, observed a 5 times greater conductivity of YSZ|Gd2Zr2O7 films compared to
YSZ|Ceria films. The YSZ|Gd2Zr2O7 films had less lattice mismatch strain and were controlled
so that they were dislocation free, as opposed to the YSZ|Ceria films. Further investigation on

54
the mechanisms of stress relaxation through dislocation formation is needed to understand the
experimental inconsistencies and optimize strain enhanced transport properties.
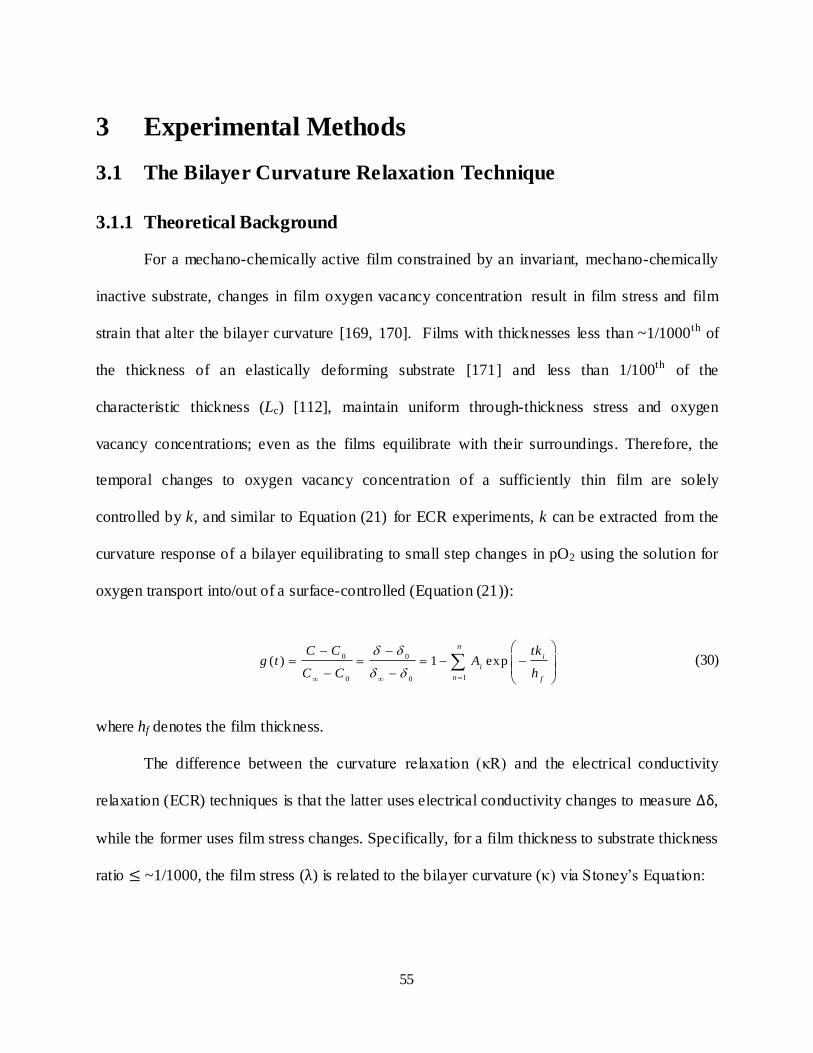
55
3 Experimental Methods
3.1 The Bilayer Curvature Relaxation Technique
3.1.1 Theoretical Background
For a mechano-chemically active film constrained by an invariant, mechano-chemically
inactive substrate, changes in film oxygen vacancy concentration result in film stress and film
strain that alter the bilayer curvature [169, 170]. Films with thicknesses less than ~1/1000th of
the thickness of an elastically deforming substrate [171] and less than 1/100th of the
characteristic thickness (Lc) [112], maintain uniform through-thickness stress and oxygen
vacancy concentrations; even as the films equilibrate with their surroundings. Therefore, the
temporal changes to oxygen vacancy concentration of a sufficiently thin film are solely
controlled by k, and similar to Equation (21) for ECR experiments, k can be extracted from the
curvature response of a bilayer equilibrating to small step changes in pO2 using the solution for
oxygen transport into/out of a surface-controlled (Equation (21)):
0 0
10 0
( ) 1 exp
n
i
i
n f
C C tkg t A
C C h
(30)
where hf denotes the film thickness.
The difference between the curvature relaxation (κR) and the electrical conductivity
relaxation (ECR) techniques is that the latter uses electrical conductivity changes to measure ∆δ,
while the former uses film stress changes. Specifically, for a film thickness to substrate thickness
ratio ~1/1000, the film stress (λ) is related to the bilayer curvature (κ) via Stoney’s Equation:

56
2
=6 (1 )
S S
f S
st
E h
h
(31)
where S
E is the substrate Young’s modulus, S
h is the substrate thickness, and S
is the
substrate Poisson’s ratio [171]. To determine the relationship between and for a linear elastic
bilayer, Hooke’s Law and Equation (4) can be combined with Equation (31) to yield:
2(1 )
6 (1 )
S S f
c f f f S
E h
E h
(32)
wheref
, f
, and f
E are the film relative density, the film Poisson’s ratio, and the film
Young’s modulus, respectively. Assuming the product in parentheses remains constant and non-
zero during a small step change in atmospheric , Equation (30) can be rewritten using
Equation (32) as:
0
10
1 exp
n
i
i
n f
tkA
h
(33)
Equation (33) indicates that the κR method can reliably be used to measure k as long as
fh is known, the film and substrate both deform elastically, the substrate is compositionally
invariant to pO2 changes, oxygen vacancy concentration changes are the only stress relaxation
mechanism in the film, and the film chemical expansion coefficient and elastic properties are
roughly constant over each pO2 step [172-175]. As shown in Equation (33), quantitative
knowledge of the film’s elastic properties and/or chemical expansion coefficient is not required
to measure k in experiments. That said, as shown in Equation (32), a large film chemical
expansion coefficient, a large film Young’s Modulus, and a small film Poisson ratio are desirable

57
because they result in large, easily-resolvable, -induced equilibrium bilayer curvature
changes.
For porous films, the effective film thickness can be expressed as the ratio of volume
fraction of pores to the specific pore surface area of the film, and a fitting equation equivalent to
Equation (33) can be used [176]:
0
10
( ) 1 exp1
n
i
i
Vn
V
k tg t A
V
S
(34)
where V
V is the volume fraction porosity, V
S is the specific pore surface area, and the other
symbols have their previously defined meanings, to extract k’s by fitting the ECR response of
porous films with average particles sizes << LC [177].
3.1.2 Experimental Setup
Figure 3.1 Curvature relaxation measurement apparatus schematic.

58
Figure 3.1 schematically shows the experimental setup for the bilayer technique. The
multi-beam optical stress sensor (MOSS) measures the bilayer curvature based on the change of
spacing between neighboring laser spots, as well as geometric parameters of the system through
the following relationship [178]:
0 0
cos1
2
d
L d
(35)
where is the angle of reflection, L0 is the distance between the bilayer and the CCD camera, d
and do are the instantaneous and initial average inter-spot spacing, respectively. A snapshot of
the multibeam laser array is shown in Figure 3.2. Values for and the ratio in the first set of
parentheses were obtained by taking MOSS measurements on flat and =0.1 m-1 calibration
mirrors placed in the sample location prior to κR experiments.
Figure 3.2 A 3×3 array of laser spots detected by the MOSS CCD camera
The multi-beam feature in MOSS analysis is beneficial in that sample vibrations have
little effect on the accuracy of curvature measurements, as the inter-spot spacing remains
unchanged due to the entire array of spots moving together during vibrations. Individual beam

59
positions are determined by the kSA MOS software package (k-Space Associates, Inc.) using a
Gaussian peak profile fitting of the spot intensity. It is therefore important to have circular spots
and a symmetric intensity profile, the maximum of which is at the center.
Figure 3.3 Temperature calibration of the furnace controller between 200oC and 700oC using
actual sample chamber temperature measurements.
To observe in-situ curvature relaxations at controlled temperature and atmosphere, the
bilayer samples were placed on a platform inside a sealed quartz reactor in a vertically mounted
tube furnace. The outer cover of this quartz reactor contained a three meter long spiral of 1/4”
quartz tubing (1.2 meters of which was in the furnace hot zone) used to preheat the incoming
gas. The furnace controller temperature was calibrated by placing a thermocouple located within
the sample chamber, as shown in Figure 3.3. On average, the deviation between the two
temperature readings was 15oC, which is the offset value used throughout the κR experiments in
this work. A Swagelok® four-way valve (not shown) was used to switch the gas flow of

60
different pO2’s. An oxidizing to reducing oxygen partial pressure ratio of 10 (a standard pO2 step
size used in ECR experiments [179, 180]) was utilized in this work. Previous studies on
lanthanum strontium cobaltite have shown that the assumption of linear exchange kinetics
implicit in Equations (30) and (33) is valid for oxidizing to reducing oxygen partial pressure
ratios less than 20 [147].
3.1.3 Flush Time Considerations
The reactor volume was determined to be ~10 mL through the flush-time dominated κR
experiments detailed in Chapter 5. Specifically, for a continuously stirred reactor, a
characteristic time (f
) needed to flush a reactor with volume (r
V ) has the following relationship
[181]:
v,tot
r STP
f
r
V T
T
(36)
where v,to t
is the gas flow rate, r
T is the temperature of the reactor and ST P
T is the room
temperature. By analyzing the apparent activation energy of a κR-measured k values on an
Arrhenius plot and comparing that to the apparent activation energy of Equation (36), one can
determine the reactor flush time. As detailed in Chapter 5 on sputtered LSF|YSZ, the flush time
dominated experiments had an activation energy of 0.07 eV at temperatures from 625-725oC
with a gas flow rate of 100 sccm. A ~10 mL sample chamber volume (a reactor size commonly
used in ECR experiments) [181, 182] was then determined using Equation (36).
As show in [181], only 1.83% of the original gas volume in the reactor is left after a time
lapse of 4 f . Therefore, the total duration of each curvature relaxation experiment was at least 5
times the largest fitted time constant (i
):

61
/i i f
k h (37)
for that particular relaxation. k values were then determined by performing a least-squares
regression fit of Equation (33) to normalized curvature relaxation data using the Origin ©
computer program.
3.1.4 Film Stress Measurement
As shown by the Stoney’s Equation, Equation (31), in addition to measuring k, the κR
technique also simultaneously measures the film stress as a function of temperature and oxygen
partial pressure (pO2), without requiring electronic current collecting layers or knowledge of the
elastic properties of the MIEC film [183]. This provides important measurements of chemical
expansion and how it is correlated with external effects like temperature, pO2 and stress.
For dense thick films that are thicker than 1/1000th of the substrate, stresses can be
rigorously extracted from bilayer curvature measurements using a modified version of Stoney’s
Equation [178]:
0
( ) ( )f m
z M z (38)
where
1 2 3 4 22
2 3 4 21 1 4 6 4
6
f f f f f f f f fS S
m
f f S S S S S S S S S
h h M h M h M h Mh M
h M h h M h M h M h M
(39)
13 2 3 4 2
0 3 2 3 4 21 1 4 6 4
f f f f f f f f f f f f
m
S S S S S S S S S S S S
h M h M h M h M h M h M
h M h M h M h M h M h M
(40)
z is the distance from the substrate midplane, fM is the film biaxial modulus defined as
/ (1 )f f
E , is the substrate biaxial modulus defined as / (1 )S S
E , and the other variables
have their previously defined meanings [178, 184].
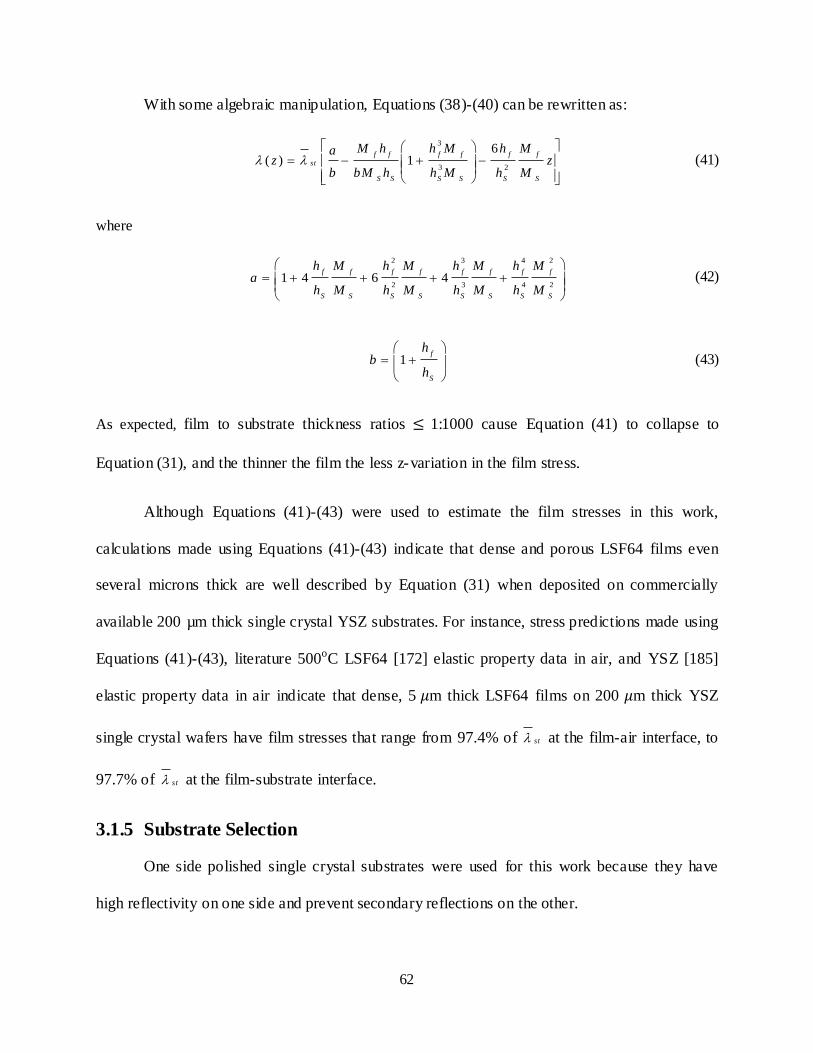
62
With some algebraic manipulation, Equations (38)-(40) can be rewritten as:
3
3 2
6( ) 1
f f f f f f
st
S S S S S S
M h h M h Maz z
b bM h h M h M
(41)
where
2 3 4 2
2 3 4 21 4 6 4
f f f f f f f f
S S S S S S S S
h M h M h M h Ma
h M h M h M h M
(42)
1f
S
hb
h
(43)
As expected, film to substrate thickness ratios 1:1000 cause Equation (41) to collapse to
Equation (31), and the thinner the film the less z-variation in the film stress.
Although Equations (41)-(43) were used to estimate the film stresses in this work,
calculations made using Equations (41)-(43) indicate that dense and porous LSF64 films even
several microns thick are well described by Equation (31) when deposited on commercially
available 200 µm thick single crystal YSZ substrates. For instance, stress predictions made using
Equations (41)-(43), literature 500oC LSF64 [172] elastic property data in air, and YSZ [185]
elastic property data in air indicate that dense, 5 m thick LSF64 films on 200 m thick YSZ
single crystal wafers have film stresses that range from 97.4% of st at the film-air interface, to
97.7% of st at the film-substrate interface.
3.1.5 Substrate Selection
One side polished single crystal substrates were used for this work because they have
high reflectivity on one side and prevent secondary reflections on the other.

63
25.4 mm diameter, circular substrates were chosen in this work to avoid edge effects that
may complicate the stress distribution in the bilayer and the curvature measurements [178, 186].
As discussed in Freund and Suresh [178], these edge effects only become significant when film
thickness to width ratios are >50. For reference, a 5 m film on a 25.4 mm diameter wafer has a
film thickness to width ratio of 0.0002. In addition, the 25.4 mm diameter is large enough so that
the approximately 6 mm by 6 mm MOSS laser array shown in Figure 3.2 is smaller than the
sample, but the sample is small enough to fit into a quartz sample reactor with minimal chamber
volume.
To prevent complications during curvature relaxation measurements, the substrates were
chosen to be chemically insensitive to the gas composition, chemically compatible with the film,
have high yield stress to ensure a purely elastic response, have known elastic properties, and
maintain phase stability in the temperature measurement range.
3.1.6 Error Analysis
In order to analyze the measurement error of the surface exchange coefficients, standard
error propagation rules were utilized [187]:
2
2 2
1 2( , , , ..., )
i i
i
ff x x x K x
x
(44)
where i
x ’s are independent variables, K is a constant, and quantities represent absolute errors.
Therefore, based on Equations (33) and (34) for surface exchange coefficients and
Equation (44), the relative error of k’s can be estimated to be:
2 2( ) ( )
f
fitting
f
hk
k h
(45)

64
and
2 2 2( ) ( ) ( )
V V
fitting
V V
V Sk
k V S
(46)
for dense and porous films, respectively. fitting
is the error for the exponential fitting obtained
from Origin ©. Given the maximum errors of fitting (6.4%), film thickness (1.2%), porosity
(5%) and surface area (5%), the k errors in this work are estimated to be less than 10%.
Similarly, based on the Stoney’s Equation (31) and assuming the elastic properties are
constants without error, the relative error of the film stress measurement can be estimated by:
2 2 2( ) ( ) ( )
fS
S f
hh
h h
(47)
As shown by Stoney’s Equation (31), a smaller substrate thickness results in greater
bilayer sample curvature changes, and hence improves the signal resolution. Even though the
manufacturer specified radius of curvature resolution is 15 km, the practical error in the
curvature measurements is approximately 5×10⁻⁵ m-1 ( ) due to environmental vibration and
gas convection. A commercially available 200-μm-thick YSZ substrate with 250-nm-thick film
results in a stress resolution that can be as small as 0.38 MPa.
3.1.7 Summary
In summary, the κR technique is one of the few experimental methods to allow in-situ k
measurements on both MIEC thin films and thick films, as shown in Table 3. Further, this
technique has the benefit of being an electrode-free method that avoids the necessity of
interdigitated electrodes for low conductivity films measurements that may: (1) cause

65
complicated stress distributions in an underlying MIEC film, (2) cause preferential oxygen
incorporation at the MIEC-electrode-air triple phase boundary, resulting in a k measurement that
reflects the properties of the triple-phase-boundary and not the MIEC surface, and/or (3)
chemically react with the underlying MIEC film.
3.2 Sample Preparation
3.2.1 Powder Processing
LSF64 powder was synthesized using the glycine-nitrate process (GNP) [188].
Stoichiometric metal nitrates (>99% pure, Alfa Aesar) were dissolved in Milli-Q deionized water
and mixed with glycine powder (>99% pure) in a 1:1 ratio. The solution was then transferred to a
stainless steel vessel and placed on a hot plate pre-heated to 350oC to transform it on to an ash-
like powder after combustion. The powder was calcined in an alumina crucible (AD-998,
Coorstek) at 1000oC for 1 hour at 5oC/min heating and cooling rates.
3.2.2 Sputtering Target Preparation
A 76 mm diameter LSF64 sputtering target was prepared by hot pressing GNP-prepared
LSF64 powder at 60 MPa in a nitrogen atmosphere using a graphite die. The hot pressing
temperature was ramped to 300oC at 20oC/min, held there for 30 minutes, ramped to 600oC at
20oC/min, ramped to 1200oC at 10oC/min, held there for 120 minutes, and finally ramped to
room temperature at a nominal cooling rate of 10oC/min in a graphite die. The as-pressed target
was polished down to 600 grit SiC sandpaper to reduce surface roughness and remove surface
contamination.
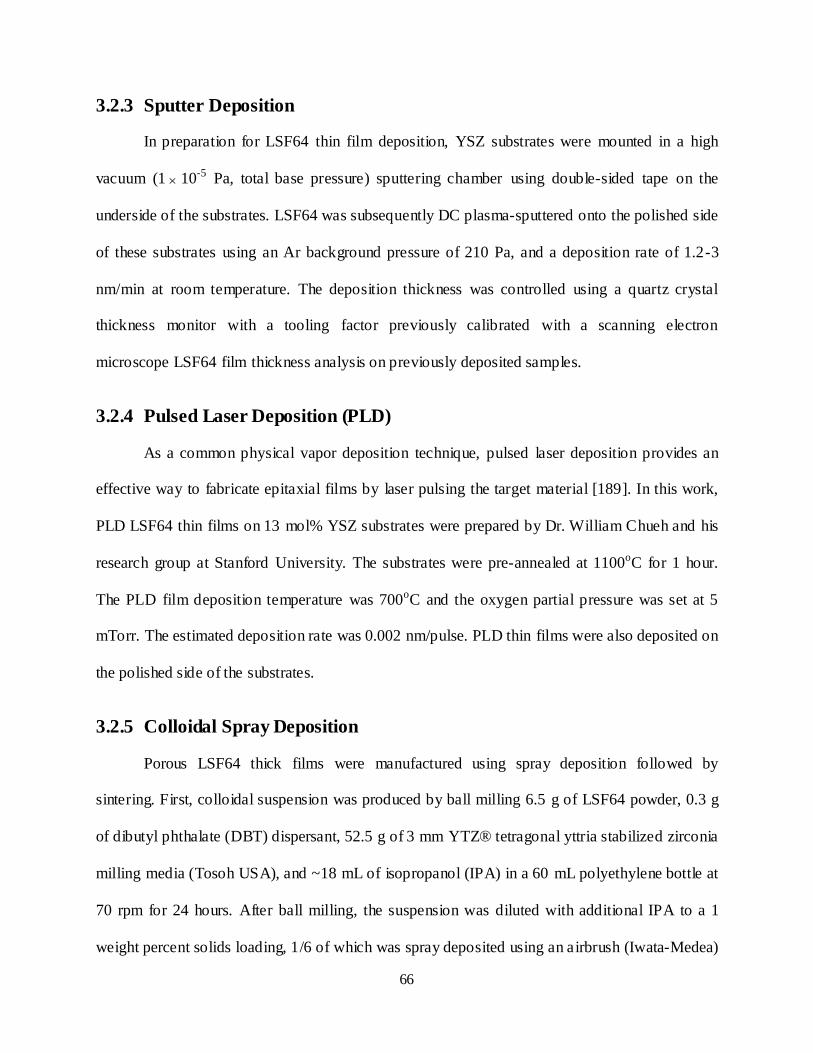
66
3.2.3 Sputter Deposition
In preparation for LSF64 thin film deposition, YSZ substrates were mounted in a high
vacuum (1 10-5 Pa, total base pressure) sputtering chamber using double-sided tape on the
underside of the substrates. LSF64 was subsequently DC plasma-sputtered onto the polished side
of these substrates using an Ar background pressure of 210 Pa, and a deposition rate of 1.2-3
nm/min at room temperature. The deposition thickness was controlled using a quartz crystal
thickness monitor with a tooling factor previously calibrated with a scanning electron
microscope LSF64 film thickness analysis on previously deposited samples.
3.2.4 Pulsed Laser Deposition (PLD)
As a common physical vapor deposition technique, pulsed laser deposition provides an
effective way to fabricate epitaxial films by laser pulsing the target material [189]. In this work,
PLD LSF64 thin films on 13 mol% YSZ substrates were prepared by Dr. William Chueh and his
research group at Stanford University. The substrates were pre-annealed at 1100oC for 1 hour.
The PLD film deposition temperature was 700oC and the oxygen partial pressure was set at 5
mTorr. The estimated deposition rate was 0.002 nm/pulse. PLD thin films were also deposited on
the polished side of the substrates.
3.2.5 Colloidal Spray Deposition
Porous LSF64 thick films were manufactured using spray deposition followed by
sintering. First, colloidal suspension was produced by ball milling 6.5 g of LSF64 powder, 0.3 g
of dibutyl phthalate (DBT) dispersant, 52.5 g of 3 mm YTZ® tetragonal yttria stabilized zirconia
milling media (Tosoh USA), and ~18 mL of isopropanol (IPA) in a 60 mL polyethylene bottle at
70 rpm for 24 hours. After ball milling, the suspension was diluted with additional IPA to a 1
weight percent solids loading, 1/6 of which was spray deposited using an airbrush (Iwata-Medea)

67
onto the rough side of one-side-polished, 200-μm-thick, single crystal, (100)-oriented
(Y2O3)0.13(ZrO2)0.87 (YSZ) substrates (University Wafer) preheated to 100oC. The roughness of
the unpolished side of the YSZ substrates was approximately 0.5 μm. To produce bonding
between the film and the substrate, the porous film was sintered at 1050oC for 1 hour inside the
MOSS apparatus prior to κR experiments.
3.3 Dilatometry
To prepare dense LSF64 samples for bulk dilatometry, a rectangular bar of 2.5 mm × 2.5
mm × 7.65 mm was cut from a hot pressed pellet (fabrication method detailed in Section 3.2.2)
using a diamond saw. It was then loaded into a Netzsch DIL 402 C dilatometer along the
longitudinal axis, followed by flushing with 50 sccm of air (pO2=0.21), air-N2 mixtures with
pO2= 0.021 and 0.0005, or research-grade pure N2 (pO2<5×10⁻⁶). New, >95% dense alumina
spacers were placed adjacent to both ends of the sample to prevent dilatometer contamination.
Linear dilatometry experiments were performed from room temperature to 1050oC at a heating
rate of 1oC/min, during a 10 minute hold at 1050oC, and during cooling down to room
temperature at a nominal rate of 1oC/min.
To prepare porous LSF64 samples for bulk dilatometry, calcined LSF64 powder was
uniaxiallly cold pressed in a 1.27 mm diameter stainless steel die. The resulting 9.25 mm-long
cylindrical pellet had an initial relative density of 30%, and was then loaded into the dilatometer,
followed by 1050oC sintering for 1 hour, with heating and cooling rates both 5oC/min.
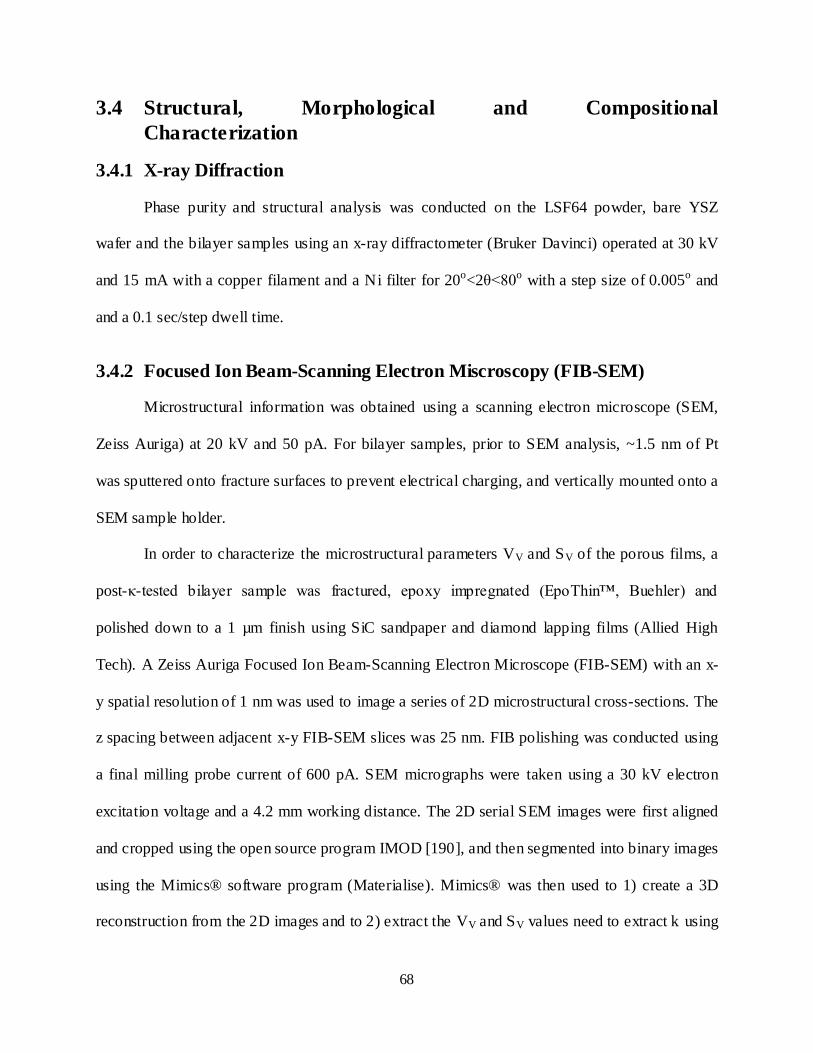
68
3.4 Structural, Morphological and Compositional
Characterization
3.4.1 X-ray Diffraction
Phase purity and structural analysis was conducted on the LSF64 powder, bare YSZ
wafer and the bilayer samples using an x-ray diffractometer (Bruker Davinci) operated at 30 kV
and 15 mA with a copper filament and a Ni filter for 20o<2θ<80o with a step size of 0.005o and
and a 0.1 sec/step dwell time.
3.4.2 Focused Ion Beam-Scanning Electron Miscroscopy (FIB-SEM)
Microstructural information was obtained using a scanning electron microscope (SEM,
Zeiss Auriga) at 20 kV and 50 pA. For bilayer samples, prior to SEM analysis, ~1.5 nm of Pt
was sputtered onto fracture surfaces to prevent electrical charging, and vertically mounted onto a
SEM sample holder.
In order to characterize the microstructural parameters VV and SV of the porous films, a
post-κ-tested bilayer sample was fractured, epoxy impregnated (EpoThin™, Buehler) and
polished down to a 1 µm finish using SiC sandpaper and diamond lapping films (Allied High
Tech). A Zeiss Auriga Focused Ion Beam-Scanning Electron Microscope (FIB-SEM) with an x-
y spatial resolution of 1 nm was used to image a series of 2D microstructural cross-sections. The
z spacing between adjacent x-y FIB-SEM slices was 25 nm. FIB polishing was conducted using
a final milling probe current of 600 pA. SEM micrographs were taken using a 30 kV electron
excitation voltage and a 4.2 mm working distance. The 2D serial SEM images were first aligned
and cropped using the open source program IMOD [190], and then segmented into binary images
using the Mimics® software program (Materialise). Mimics® was then used to 1) create a 3D
reconstruction from the 2D images and to 2) extract the VV and SV values need to extract k using

69
Equation (34). For all the samples, the 25 nm z resolution was less than 1/15th of the particle
size, ensuring 3D reconstruction VV and SV errors less than 5% [191].
3.4.3 X-ray Photoelectron Spectroscopy (XPS)
As a highly sensitive tool suitable for investigating solid-state surfaces, X-ray
photoelectron spectroscopy (XPS) is a commonly used quantitative technique to probe the
elemental composition at the surface by measuring the kinetic energy of escaped electrons from
the top 2 to 5 atomic layers of the material optically excited by soft X-rays [192]. In this work, a
Perkin Elmer Phi 5400 ESCA system with a magnesium Kα X-ray source was used for XPS
experiments. Samples were analyzed at pressures between 10-9 and 10-8 Torr with a pass energy
of 29.35 eV and a take-off angle of 45°. The areal spot size was roughly 250 μm2. Atomic
concentrations were determined using previously determined sensitivity factors. All peaks were
referenced to the signature C1s peak for adventitious carbon at 284.6 eV.

70
4. Dilatometry Measurements on Bulk LSF64
4.1 Introduction
Before measuring the oxygen surface exchange and stress of mechano-chemically
coupled films using the curvature relaxation technique, a better understanding of the chemical
expansion of bulk material with the same composition is desirable. This chapter investigates the
linear dilatometric behavior of La0.6Sr0.4FeO3-δ (LSF64) between room temperature and 1000oC
under various oxygen partial pressures. The results are fit to a thermo-chemical model, and used
to extract both the thermal and chemical expansion coefficients.
4.2 Experimental
A 2.5 mm × 2.5 mm × 7.65 mm rectangular dilatometry sample was prepared by cutting
a sample from a hot pressed, GNP-processed LSF64 puck, as detailed in Sections 3.2.1 and 3.2.2.
The sample density prior to dilatometry was determined to be 95% using mass and dimension
measurements.
Dilatometry measurements were performed following the procedures detailed in Section
3.3. Between individual measurements with different pO2, a single dilatometry experiment was
conducted in air under identical heating/cooling schedules. This was done to ensure the same
starting level of initial LSF sample oxygen nonstoichiometry in each experiment.
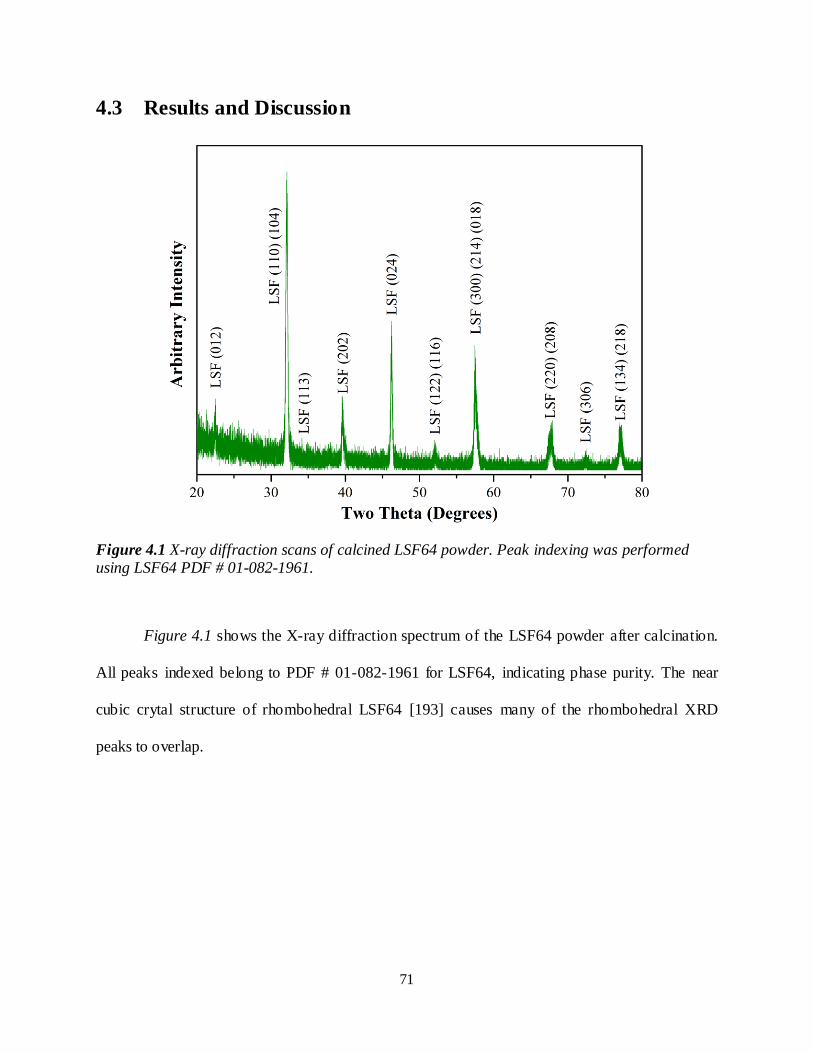
71
4.3 Results and Discussion
Figure 4.1 X-ray diffraction scans of calcined LSF64 powder. Peak indexing was performed using LSF64 PDF # 01-082-1961.
Figure 4.1 shows the X-ray diffraction spectrum of the LSF64 powder after calcination.
All peaks indexed belong to PDF # 01-082-1961 for LSF64, indicating phase purity. The near
cubic crytal structure of rhombohedral LSF64 [193] causes many of the rhombohedral XRD
peaks to overlap.

72
Figure 4.2 Bulk, dense LSF64 sample dilatometry under pO2=0.21 (black), pO2=0.021 (blue), pO2=0.0005 (orange) and N2 (red). The dashed line represents the fitted linear thermal expansion.
Figure 4.2 shows the one-dimensional dilatometry data of the bulk LSF64 sample under
various oxygen partial pressures. It is clearly seen that for all the dilatometry curves, strain
becomes non-linear at elevated temperatures, indicating the presence of chemical expansion as
oxygen vacancies become prevalent. For the experiment under pO2=0.21, the onset temperature
of chemical expansion (where the deviation from pure thermal expansion occurs) is ~525oC. The
oxygen partial pressure in the testing atmosphere also impacts the chemical expansion (which is
related to the distance from the extrapolation of the thermal expansion curve), which at first
increases and then decreases as the pO2 decreases. It also demonstrates that the thermal
expansion coefficient of LSF64 is essentially independent of the pO2 used in the film stress
estimations in the following chapters.

73
Using the data in Figure 4.2, the thermal expansion coefficient ( ) and the chemical
expansion coefficient ( ) of bulk LSF64 under pO2=0.21 and pO2=0.021 were fit using a
thermo-chemical model proposed in the literature [82, 85] for mechano-chemically coupled
materials:
22
T C
T C
pOpOT T
(48)
where is the thermo-chemical expansion directly measured from dilatometry. Based on the
linear regime of the dilatometry curves in Figure 4.2 and a chemical expansion onset
temperature of 525oC, was determined to be 12.4 ppm/K by analyzing both expansion data
sets from 100oC to 500oC. The temperature dependence of
was estimated by analyzing the
oxygen nonstoichiometry data from Mosleh et al. [50] and Equation (48). The first derivative of
the thermo-chemical expansion data between 500oC and 1000oC was then fitted to Equation (48)
and was determined to be 0.0101 and 0.00867 for pO2=0.21 and pO2=0.021, respectively.
These and are comparable to literature reports on similar LSF systems, such as
La0.6Sr0.4FeO3-δ at 500-900oC ( 11.052 ppm/K, 0.01994) [194] and La0.3Sr0.7FeO3-δ
( 12.98 ppm/K at 25-500oC, 0.017-0.047 at 650-900oC) [195].
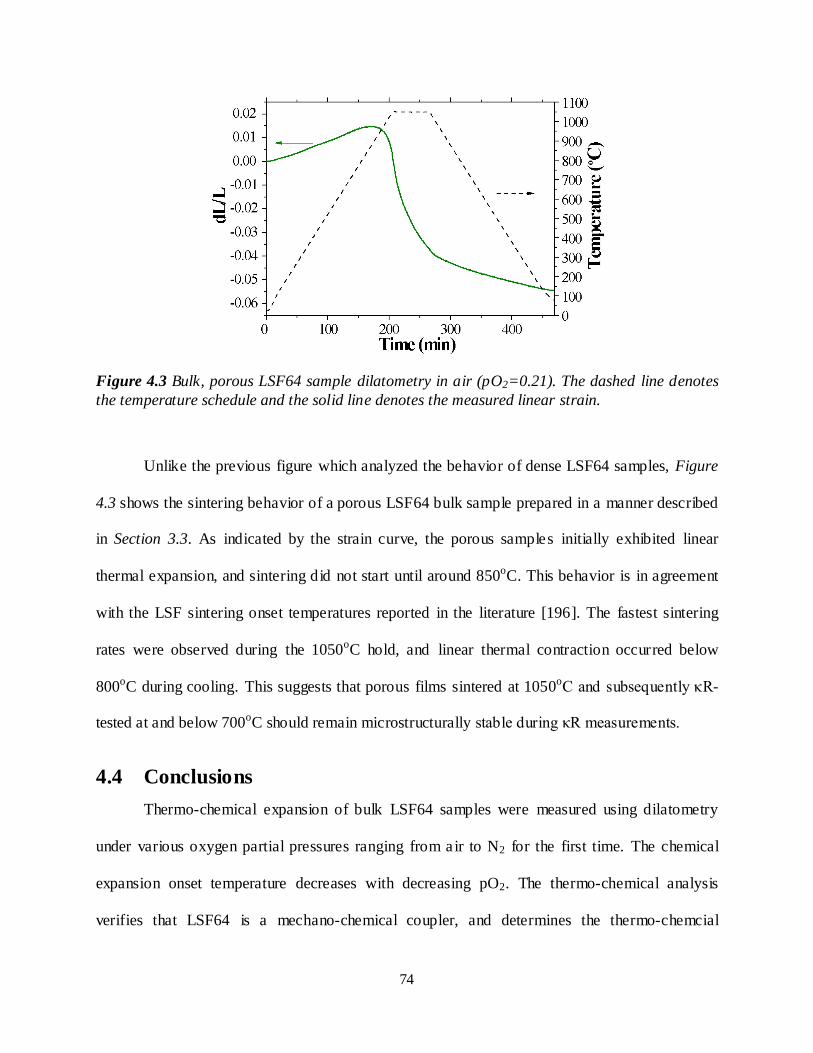
74
Figure 4.3 Bulk, porous LSF64 sample dilatometry in air (pO2=0.21). The dashed line denotes
the temperature schedule and the solid line denotes the measured linear strain.
Unlike the previous figure which analyzed the behavior of dense LSF64 samples, Figure
4.3 shows the sintering behavior of a porous LSF64 bulk sample prepared in a manner described
in Section 3.3. As indicated by the strain curve, the porous samples initially exhibited linear
thermal expansion, and sintering did not start until around 850oC. This behavior is in agreement
with the LSF sintering onset temperatures reported in the literature [196]. The fastest sintering
rates were observed during the 1050oC hold, and linear thermal contraction occurred below
800oC during cooling. This suggests that porous films sintered at 1050oC and subsequently κR-
tested at and below 700oC should remain microstructurally stable during κR measurements.
4.4 Conclusions
Thermo-chemical expansion of bulk LSF64 samples were measured using dilatometry
under various oxygen partial pressures ranging from air to N2 for the first time. The chemical
expansion onset temperature decreases with decreasing pO2. The thermo-chemical analysis
verifies that LSF64 is a mechano-chemical coupler, and determines the thermo-chemcial

75
expansion coefficient for bulk LSF-64 ( =12.4 ppm/K, is 0.0101 and 0.00867 for pO2=0.21
and pO2=0.021, respectively). As it relates to the discussions in the following chapters, chemical
expansion is not expected to occur in bulk LSF64 samples until 525oC in air. These results help
inform the curvature relaxation experiments on LSF64 thin films under controlled temperature
and oxygen partial pressure.

76
5. Oxygen Surface Exchange and Stress
Measurements on Sputtered LSF64 Dense Thin Films
5.1 Introduction
In this chapter, the curvature relaxation technique was used to simultaneously measure
reliable surface exchange and stress of sputtered La0.6Sr0.4FeO3-δ (LSF64) thin films. LSF64 was
chosen for these experiments because:
(1) It has high oxygen ion ionic conductivity and oxygen exchange coefficient, which makes it
important as a solid oxide fuel cell cathode material [197-199].
(2) As a common oxygen exchange material, its chemical expansion coefficient ( 0.01994C
)
[200] suggests large strains with small pO2 changes, making it suitable for curvature
relaxation measurements.
(3) It has a single-phase rhombohedral crystal structure over the 25-800oC and 12
21 10 1pO
atm range [193, 200, 201], avoiding phase transformations due to temperature and oxygen
partial pressure variations during the curvature relaxation experiments.
(4) Its Young’s modulus and Poisson’s ratio are known as a function of temperature and2
pO
over the 25-900oC and 4 1
21 10 1 10pO
atm range [172], allowing literature-based
thermo-chemical strain measurements to be converted in to film stress measurements.

77
5.2 Experimental
5.2.1 Sample Preparation
LSF64 powder synthesis and sputtering target fabrication techniques were detailed in
Sections 3.2.1 and 3.2.2.
For the experiments in this chapter, 25.4 mm diameter, 200 thick, single crystal, 100-
oriented (Y2O3)0.08(ZrO2)0.92 (8YSZ) wafers were used as substrates for thin film LSF deposition.
The smoothness of the polished deposition surface of the YSZ substrate (the root mean square
polished side roughness was 1 nm according to manufacturer specifications) ensured desirable
film uniformity and allowed high quality beam reflection during the κR experiments. Single
crystal YSZ was chosen as a substrate material because:
(1) It is chemically compatible with LSF. LSF-YSZ cation intermixing and/or interphase
formation only occurs above 1000oC in air [202].
(2) It has a high yield stress (>400 MPa below 800oC in air) [174], which ensured the
elasticity of the substrate during the bilayer curvature experiments.
(3) It has a fixed oxygen stoichiometry and a known elastic modulus in the 25-800oC and
25
21 10 1pO
atm range [175].
Prior to thin film deposition, the 8YSZ substrates were annealed at 1100oC for 1 hour to
relieve residual stress within the substrates. To ensure adequate residual stress relaxation within
the substrates during the annealed process, previously annealed bare 8YSZ wafers were tested
from 25-800oC and showed no curvature changes with heating.
Experimental conditions for LSF64 thin film deposition are detailed in Section 3.2.3. For
the experiments reported here, three simultaneously-prepared sputtered samples (SP-A, SP-B and

78
SP-C) with 250 nm thick LSF64 films were prepared by the Richard Lunt research group at
Michigan State University.
5.2.2 Curvature Relaxation (κR) Measurements
Prior to κR experiments, LSF64|YSZ samples were annealed in the MOSS setup at 600oC
for 1 hour to crystallize the as-deposited, amorphous LSF64. κR experiments were then
conducted at various temperatures by switching the atmosphere between pure air (Zero grade,
Airgas, pO2=0.21) and a gas mixture (pO2=0.021) composed of pure air and pure nitrogen
(99.9995% Research grade, Airgas) by abruptly turning a four-way valve. The duration of each
relaxation experiment was more than five times the time constants fitted at a given temperature,
ensuring the sufficient equilibration of the film to a new pO2 (as explained in den Otter et al.
[181]) and a good fit for transient kinetic analysis. The normalized LSF64|YSZ bilayer curvature
vs. time was then plotted and least square fitted to Equation (33), using the Origin computer
program, to extract surface exchange coefficients. Equilibrium stresses of all samples were
measured using Stoney’s equation (31) and averaging the equilibrium curvature values at each
temperature, pO2 and thermal segment, and plugging into. Of the 3 samples from the same batch,
SP-A was κR-tested for only one thermal segment, while SP-B and SP-C were κR-tested for a
total of 7 thermal segments.
5.2.3 Structural and Compositional Characterization
After in-situ testing, microstructural information was obtained on the fracture surface of
each bilayer sample using a scanning electron microscope. Crystal structure characterization was
also conducted on the top surface of the bilayer samples before and after MOSS tests, using an
X-ray diffractometer. The experimental conditions used for both techniques are detailed in
Section 3.4.

79
5.3 Results and Discussion
Figure 5.1 (a) Macroscale morphology of YSZ substrates with (left) and without (right) a LSF64 film. (b) cross section and (c) 45o view of the fracture surface morphology of the LSF64|YSZ bilayer after κR testing.

80
As shown in Figure 5.1 (a), the LSF64 films studied here had a brown color and were
translucent, while the bare 25.4 mm diameter YSZ substrates were colorless and transparent.
Figure 5.1 (b) and (c) show the microstructure of the LSF64|YSZ cross section, indicating a
uniform, crack-free film thickness of 250 ± 3 nm.
Figure 5.2 X-ray diffraction scans of YSZ substrates (a) without any coating, (b) with as-
sputtered with LSF64 film, (c) with a 4-day MOSS tested LSF64 film [203] and (d) with a 60-day MOSS tested LSF64 film (this study). Peak indexing was obtained from PDF # 01-082-1961 for
LSF64, 01-070-4436 for cubic YSZ (c-YSZ) and 01-070-4431 for tetragonal YSZ (t-YSZ).
As shown in Figure 5.2, the sputtered LSF64 films were initially amorphous, and became
phase pure after crystallization at 600oC. All the indexed peak intensities were consistent with

81
the major peaks in LSF64 Powder Diffraction File (PDF) # 01-082-1961, indicating that the films
were polycrystalline and without preferred orientation. While the x-ray diffraction profiles of the
YSZ substrates before and after a short-term κR test were consistent with the (100)-oriented
single crystal specification, the long-term tested sample showed a cubic-to-tetragonal phase
transformation (known to occur for 8 mol% YSZ [204]) after long times at elevated temperature,
indicated by YSZ peak splitting in Figure 5.2(d). No other peaks other than those belonging to
LSF and YSZ were observed, indicating that the film and the YSZ substrate had good chemical
compatibility. Additional tests on 13 mol% YSZ substrates (not shown) gave identical k results
as those reported here, but did not show a cubic-to-tetragonal phase transformation.
Figure 5.3 Representative multiple curvature relaxation cycles between pO2=0.21 (air) and pO2=0.021 (N2-air) at 525oC and 475oC. The difference in equilibrium curvature levels between the two temperatures stems from the film-substrate thermal expansion mismatch [193, 205].

82
Figure 5.3 shows multiple κR cycles upon switching between pO2=0.21 and pO2=0.021.
Reproducible relaxation kinetics and equilibrium curvature levels were observed for multiple
isothermal relaxations. This indicates that the LSF64 oxygen nonstoichiometry changes were
reversible as the atmosphere pO2 changed, and that no significant film cracking or delamination
occurred. The different equilibrium curvatures at different temperature were as expected from
the thermal expansion mismatch between the LSF64 (~14 ppm/K [193]) and the YSZ (9.4-
9.5ppm/K [205]). Also shown is the clear temperature dependence of the relaxation time.
Figure 5.4 Normalized curvature relaxation data (dots) of the LSF64 film SP-C on reduction at 525oC (left) and on oxidation at 375oC (right). The top line is the combined fit to the data, while the lower lines show the separate contributions of each relaxation rate.
Figure 5.4 shows representative normalized curvature spectra at 525oC on reduction and
375oC on oxidation. Surprisingly, at all tested temperatures, (i.e. between 350oC and 600oC, the
κR spectra were well fit to two surface exchange coefficients (k1 and k2) using Equation (33),
indicating the presence of two distinct oxygen incorporation pathways.
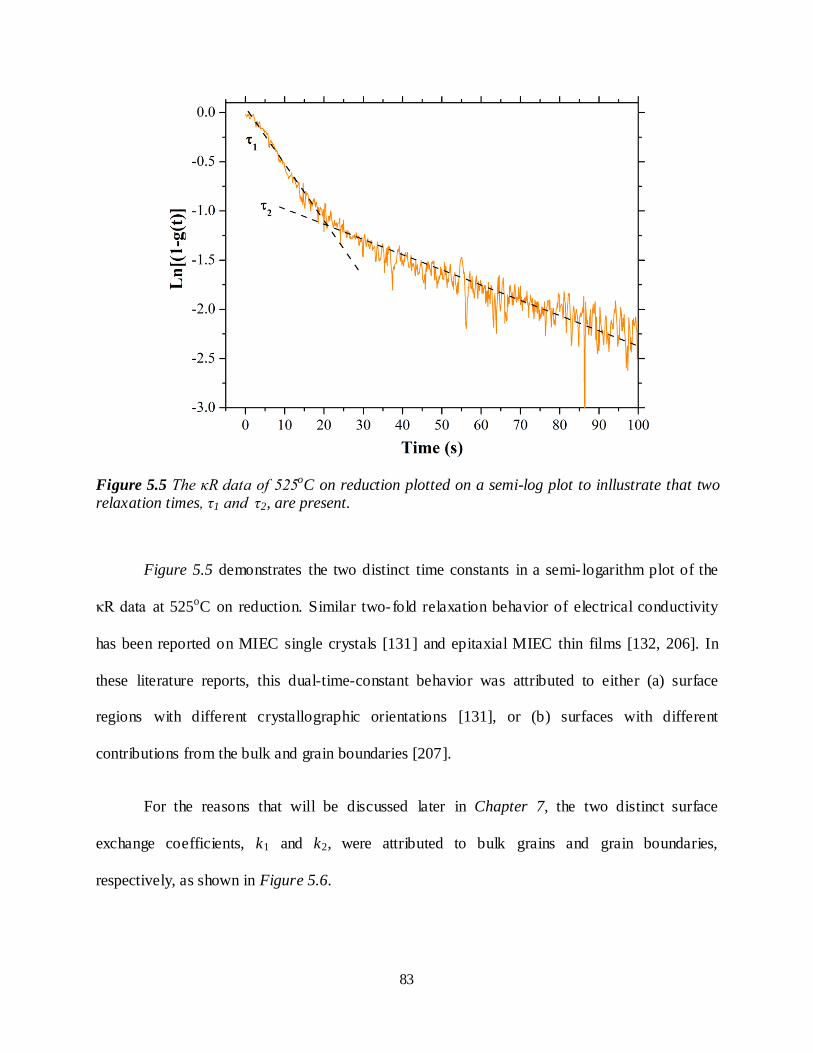
83
Figure 5.5 The κR data of 525oC on reduction plotted on a semi-log plot to inllustrate that two relaxation times, τ1 and τ2, are present.
Figure 5.5 demonstrates the two distinct time constants in a semi- logarithm plot of the
κR data at 525oC on reduction. Similar two-fold relaxation behavior of electrical conductivity
has been reported on MIEC single crystals [131] and epitaxial MIEC thin films [132, 206]. In
these literature reports, this dual-time-constant behavior was attributed to either (a) surface
regions with different crystallographic orientations [131], or (b) surfaces with different
contributions from the bulk and grain boundaries [207].
For the reasons that will be discussed later in Chapter 7, the two distinct surface
exchange coefficients, k1 and k2, were attributed to bulk grains and grain boundaries,
respectively, as shown in Figure 5.6.

84
Figure 5.6 Schematic of the surface exchange process in the sputtered thin film. k 1 and k2, can be
attributed to bulk grains and grain boundaries, respectively.
Figure 5.7 A1 values of the sputtered LSF64 thin film SP-C as a function of temperature across all seven thermal segments. Each value is averaged from its corresponding oxidation and
reduction relaxation processes.
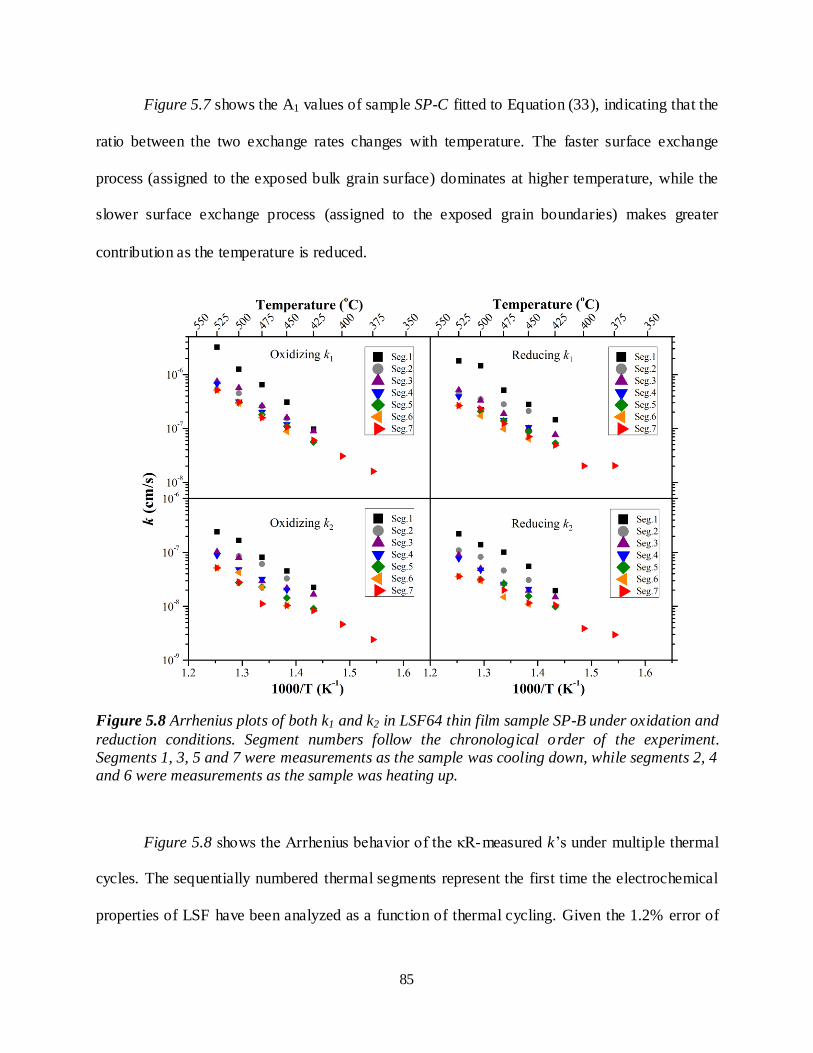
85
Figure 5.7 shows the A1 values of sample SP-C fitted to Equation (33), indicating that the
ratio between the two exchange rates changes with temperature. The faster surface exchange
process (assigned to the exposed bulk grain surface) dominates at higher temperature, while the
slower surface exchange process (assigned to the exposed grain boundaries) makes greater
contribution as the temperature is reduced.
Figure 5.8 Arrhenius plots of both k1 and k2 in LSF64 thin film sample SP-B under oxidation and
reduction conditions. Segment numbers follow the chronological order of the experiment. Segments 1, 3, 5 and 7 were measurements as the sample was cooling down, while segments 2, 4 and 6 were measurements as the sample was heating up.
Figure 5.8 shows the Arrhenius behavior of the κR-measured k’s under multiple thermal
cycles. The sequentially numbered thermal segments represent the first time the electrochemical
properties of LSF have been analyzed as a function of thermal cycling. Given the 1.2% error of
86
the film thickness estimated from the standard deviation of SEM measurements at 5 different
locations and the <6.4% error of the fitting procedure of the normalized curvature data according
to Origin ©, the estimated error bars of all data points based on the error analysis method in
Section 3.1.6 are smaller than the size of the symbols.
As shown in Figure 5.8, degradations of up to a factor of 8 in the oxygen surface
coefficient were observed with multiple thermal segments. The activation energies of both k1 and
k2 measured in this study, ~1.1 ± 0.3 eV, were reproducible across multiple thermal segments,
and are close to the 1.3 eV of bulk LSF64 sample measured by ten Elshof et al. [47]. Although
there is considerable spread in some of the data, it seems that after an initial break- in period
during the first thermal segment (a common occurrence for MIEC materials [198]), subsequent
thermal cycling between 425 and 525oC only produced minor changes in k.

87
Figure 5.9 Arrhenius plot of both k1 and k2 of LSF64 thin film sample SP-C under oxidation and
reduction conditions.
Similar measurements were conducted on sample SP-C and similar magnitude oxygen
surface exchange coefficients were observed, as shown in Figure 5.9. Further, like sample SP-B,
k did not degrade with multiple thermal cycling when cycled between 525 and 425oC, but did
experience k degradation when cycled below 425oC and heated back up to elevated temperature.
This indicates some irreversible changes occurred in the film are possibly associated with
inelastic deformation at higher stress states. This idea is discussed in detail in the stress
measurements of Figure 5.13. The similar behavior between both samples indicates the
reproducibility of measurements on samples prepared simultaneously.

88
Figure 5.10 κR-determined k1 values of sputtered LSF64 thin film samples SP-A, SP-B and SP-C as a function of inverse temperature across multiple thermal cycles. k values are averaged from
oxidation and reduction k’s.

89
Figure 5.11 κR-determined k2 values of sputtered LSF64 thin film samples SP-A, SP-B and SP-C
as a function of inverse temperature across multiple thermal cycles. k values are averaged from oxidation and reduction k’s.
Figure 5.10 and Figure 5.11 summarize the surface exchange coefficient measurements
of three sputtered samples from the same batch. Compared to the 5 orders of magnitude k
variation observed for LSF64 in the literature, the k’s obtained here agree well with each other.

90
Figure 5.12 LSF64 κR-determined k1 values compared with those in the literature [47-50]. Open
symbols denote literature values.
Figure 5.12 shows how the k1 values (lattice surface exchange coefficients) of sputtered
LSF64 thin films obtained here via κR compared to those available in the literature. The
activation energy of the sputtered thin films ranges from 1.2 eV to 1.4 eV. These values are close
to the 1.3 eV activation energy observed for bulk LSF64 by ten Elshof et al. [47]. These ~1.3 eV
activation energies, which were very different than the apparent 0.07 eV expected for an
atmospheric flushing process [181], indicate that reactor volume flushing limitations were not
present in these κR experiments. The sputtered films tested here exhibited k1 values that were
consistent with low-temperature extrapolations of bulk LSF64 k values [47, 49], and inconsistent
with literature pulsed laser deposited LSF64 films [48, 208]. The close k agreement between the
sputtered films and bulk samples may be because the non-epitaxial, polycrystalline sputtered

91
films tested here without electrodes more closely resembled the structure of the bulk LSF64
samples [49, 208] than the epitaxial PLD thin films [48, 208] previously measured via ECR in
the literature. For example, these literature films may have had a different surface structure or
stress state because of the electrodes used to measure them, their epitaxial nature, and/or a
different stress/strain history.
Figure 5.13 Average equilibrium stress levels of the LSF64 film as a function of pO2 and
temperature. The dashed lines represent thermal expansion mismatch induced stress, based on coefficient of thermal expansion (CTE) and elastic constants of YSZ and LSF64 available in the
literature [193, 205].
Figure 5.13 shows the equilibrium stress of samples SP-A, SP-B and SP-C as a function
of temperature compared to the stress expected from the coefficient of thermal expansion (CTE)
mismatch between LSF64 [193] and YSZ [194]. The observed chemical stress induced by pO2
changes is in agreement with the chemical expansion effect, where reducing pO 2 causes
expansion of the LSF film, thus inducing less tensile stress in the film. Given the ~1.2% error of

92
the film thickness and the ~1% error of the substrate thickness estimated from the standard
deviation of SEM measurements at 5 different locations, and the <0.1% standard error of the
equilibrium curvature measurement across the temperature range, the estimated error bars of all
data points based on the error analysis method in Section 3.1.6 are smaller than the size of the
symbols.
General agreement is observed compared to the CTE mismatch predictions, except for
deviations below 425oC. This indicates that the bilayer started to deform inelastically, as the thin
film stress became larger than ~200 MPa. This behavior is consistent with the 100 MPa yield
stress measured in bulk LSF64 [209]. This may have been caused by (a) Sr segregation to the
surface of LSF64, (b) ferroelastic domain switching occurring at higher level of stress (which has
been observed in LSF64 [210, 211], (c) dislocation formation as a stress relaxation mechanism,
or a combination of multiple effects. This may also explain why reproducible k’s were observed
in samples that were cycled between 600oC and 425oC, but were not obtained in samples colled
down below 425oC and then retested at elevated temperatures.

93
Figure 5.14 Chemical stress of sputtered LSF64 films induced by pO2 changes between 0.21 and
0.021 as a function of temperature.
Figure 5.14 shows the chemical stress induced by switching between pO2=0.21 and
pO2=0.021 across the temperature measurement range, which decreases with decreasing
temperature. Similar to the film stress measurement, the chemical stresses of samples SP-A, SP-
B and SP-C are generally consistent with each other. In contrast to dilatometry measurements in
Chapter 4 and literature thermo-chemical studies [49, 193] on bulk samples indicating that
mechano-chemical coupling in LSF64 only occurs above 525oC, non-zero chemical stresses were
observed as low as 350oC in the sputtered films measured here. As will be discussed further in
Chapter 7, this is likely due to grain boundaries and grain interiors displaying different chemical
expansion behavior.

94
Figure 5.15 X-ray photoelectron spectroscopy (XPS) measurements on the sputtered LSF64 thin
film SP-A after κR testing.
Table 4 Atomic fractions of cation species at the surface of sputtered thin film SP-A
La Sr Fe Y La:Sr:Fe ratio
Atomic Fraction
(%)
Nominal -- -- -- -- 0.6 : 0.4 : 1
LSF64|8YSZ (SP-A)
after κR test 2.66 3.30 2.24 0.11 1.19 : 1.47 : 1
Figure 5.15 and Table 4 show the XPS measurements on the sputtered thin film SP-A,
which was κR-tested for only 1 thermal segment. La and Sr surface enrichment were observed
after the κR-test. A small amount of Y impurities were also detected. Although XPS
measurements on SP-B and SP-C were not performed, cation segregation of sputtered LSF64
thin films may be one of the reasons for the degradation in surface exchange kinetics with
multiple thermal cycling, as discussed in Section 2.3.6. Future XPS measurements on samples
analyzed before and after κR are needed.
95
5.4 Conclusions
Here, for the first time, in situ stress and oxygen surface exchange coefficients were
simultaneously measured on an MIEC thin film using the curvature relaxation technique. In
addition, mechano-chemical coupling of LSF64 was observed below 525oC for the first time.
Sub-525oC k values were reported for this material for the first time, and were consistent with
low temperature extrapolations of bulk LSF64 sample behavior reported in the literature. A slight
degradation in the measured surface exchange coefficients was observed over multiple thermal
cycles for all samples from different batches, and was attributed to inelastic deformation in the
film possibly caused by Sr segregation, ferroelastic domain switching, and/or dislocation
formation. This significant amount of chemical stress observed at low temperatures in the
sputtered films was in contrast to chemical expansion behavior of bulk LSF64, and was
attributed to the small grain size of the sputtered LSF64. This small grain size also allowed the
k’s for oxygen exchange directly into the lattice and the grain boundaries to be observed. As
demonstrated here, the κR technique provides insights towards understanding the surface
exchange mechanisms and their relation to internal and external stress, as well as opportunit ies to
characterize a range of mechano-chemically coupled ion-exchange materials.

96
6. Oxygen Surface Exchange and Stress
Measurements on Pulsed Laser Deposited LSF64 Dense Thin Films
6.1 Introduction
In this Chapter, the κR technique was used to simultaneously measure the in situ stress
and k of pulsed laser deposited (PLD) thin films LSF64 on 13mol% YSZ substrates. The results
demonstrate the applicability of the κR method on thin films produced via various deposition
techniques, and provide a deeper insight into how different processing histories and/or stress
states that alter oxygen surface exchange kinetics.
6.2 Experimental
6.2.1 Sample Fabrication
Two types of PLD LSF64 thin films were prepared by Dr. William Chueh and his
research group at Stanford University. The first type was deposited directly on (100) oriented
13mol% YSZ (LSF64|YSZ), and the second type was deposited on a (100) oriented 13mol%
YSZ substrate coated with a 5-nm layer of scandium doped ceria (LSF64|SDC|YSZ) to prevent
cation diffusion from the YSZ substrate to the surface of the LSF film. All YSZ substrates were
pre-annealed at 1100oC for 1 hour. The annealing procedures of the YSZ substrates were
identical to those listed in Chapter 6, the PLD film deposition temperature was 700oC and the
oxygen partial pressure was set at 5 mTorr. The estimated deposition rate was 0.002 nm/pulse.
Even though the stress evolution behavior of the annealed bare 13 mol% YSZ wafers were not
tested, because a 1-hour hold at 1100oC was enough to remove the residual stress in the 8 mol%

97
YSZ wafers of Chapter 5, the same annealing schedule was assumed to have a similar effect on
the 13 mol% YSZ wafers.
6.2.2 Curvature Relaxation Measurements
Details about the experimental setup of the curvature relaxation (κR) technique can be
found in Section 3.1. Prior to κR experiments, the LSF64|YSZ samples were heated to 800oC at a
rate of 5oC/min, and the first thermal segment was conducted during cool-down. The bilayer
samples were subjected to abrupt switching between air (Airgas, pO2=0.21) and 2.1% O2-97.9%
N2 mixture (Airgas, pO2=0.021) controlled by a four-way valve. Relaxation experiments under
both 100 and 500 sccm flow rate were also conducted to determine if there were reactor flush
time limitations. The normalized curvature data processing was done in the same manner as the
sputtered films.
6.2.3 Structural and Compositional Characterization
SEM, XRD and XPS experiments adopted the same conditions as those for the sputtered
films, as shown in Section 5.2.3.

98
6.3 Results and Discussion
6.3.1 LSF64|YSZ
Figure 6.1 Fracture surface morphology of the PLD LSF64|YSZ bilayer after κR testing.
Figure 6.1 shows the microstructure of a LSF64|YSZ cross section, indicating a uniform
film thickness of 135 ± 3 nm, and a columnar grain structure.

99
Figure 6.2 X-ray diffraction scans of the PLD LSF64|YSZ before and after R testing. Peak
indexing was performed using LSF64 PDF # 01-082-1961 for LSF64 and cubic YSZ PDF# 01-070-4436.
As shown in Figure 6.2, the PLD thin film LSF64 exhibits epitaxial features with (110)
(104) as the main orientation. From the indexed d-spacings of LSF64 (110) (2.7636 o
A ) and YSZ
(200) (2.5689 o
A ), a ~7.5% mismatch between the film and the substrate was estimated. Small
peaks corresponding to (024) of LSF64 were also observed, indicating formation of limited
polycrystals. No impurity phase peaks were observed. The grain size was estimated to be ~52 nm
using the William-Hall method [212].

100
Figure 6.3 Multiple curvature relaxation cycles of the LSF64|YSZ sample at 700oC and 750oC between pO2=0.21 and pO2=0.021. The difference in equilibrium curvature levels between the
two temperatures is a result of the film-substrate thermal expansion mismatch.
Figure 6.3 shows multiple κR cycles upon switching between pO2=0.21 and pO2=0.021
at 700oC and 750oC. Reproducible relaxation kinetics and equilibrium curvature levels were
observed for multiple isothermal relaxations. This indicates that oxygen nonstoichiometry
changes in the PLD LSF64|YSZ thin film were reversible as the atmosphere pO2 was changed,
and that no significant film cracking or delamination occurred. Similar to the sputtered thin
films, the different equilibrium curvatures at different temperature were as expected from the
thermal expansion mismatch between the LSF64 and the YSZ. In contrast to the sputtered films
described in Chapter 5, only one relaxation time constant was observed at all temperatures, as
demonstrated in Figure 6.4, indicating that only one surface exchange process dominated during
the κR experiments. Given the larger grain size of the PLD films (52 nm) compared to those of
the sputtered films (43 nm), this k was assigned to oxygen incorporation directly into the grain

101
interior lattice (i.e. not into the grain boundaries). Identical Ln[1-g(t)] analysis at all other tested
temperatures yielded similar results.
Figure 6.4 Representative κR data of 700oC on reduction shown in Figure 6.3 replotted on a semi-log plot, and showing only one time constant. κR data of other temperatures showed similar
single time constant behavior.

102
Figure 6.5 κR-measured surface exchange coefficients of LSF64|YSZ as a function of
temperature and flow rate.
As shown in Figure 6.5, the κR-determined surface exchange coefficients were relatively
insensitive to the flow rate, indicating that reactor flush time was not an issue at temperatures as
high as 750oC. This is also demonstrated by the measured time constants (10 to 5500 s between
500oC and 800oC at 100 sccm, and 5 to 800 s between 625oC and 800oC at 500 sccm), which are
5 times smaller than their respective reactor flush times of 1.7-2.3 s and 0.3-0.4 s estimated from
the reactor volume calculations and Equation (36).

103
Figure 6.6 κR-measured k values of LSF64|YSZ across multiple thermal segments at a flow rate of 100 sccm.
Figure 6.6 shows the κR-measured oxygen surface exchange coefficients as a function of
inverse temperature with multiple thermal cycling between 800oC and 500oC. Hysteresis of the
measured k values was observed across multiple thermal segments, where k values of the two
cooling segments (kR1 and kR3) were similar but 0.5-1 order of magnitude larger than the
heating segment (kR2). Although further study is needed, this phenomenon may be related to
changes of electronic structure, cation segregation, and/or dislocation density in the film, all of
which can impact the ionic transport kinetics, as discussed in Section 2.3 [51, 165, 166, 168, 213,
214]. In-situ investigations on the compositional and structure changes at the film surface are
also needed to provide better understanding of this behavior.

104
Figure 6.7 κR-determined k values of LSF64|YSZ compared with those in the literature [47-50]
and the sputtered thin films in this work.
Figure 6.7 shows how the k values of the PLD LSF64|YSZ thin films obtained via κR
compared to those available in the literature, as well as a representative dataset of the sputtered
thin films from Chapter 5. The PLD k values are almost 2 orders of magnitude lower than those
of the sputtered thin films, and 2 orders of magnitude lower than low temperature extrapolations
of the literature bulk samples. However, the PLD k’s measured via the κR technique are similar
in magnitude to the PLD thin film measurements from the literature. Due to the hysteresis
behavior, the activation energy of the PLD thin film k’s is not constant across the entire
temperature range (1.2 eV, 1.0 eV and 1.6 eV for kR1, kR2 and kR3, respectively), but generally
shows similar values below 700oC compared to sputtered thin films and bulk samples in the
literature. Still, these activation energies are much smaller than the incredibly large 4.7 eV

105
activation energy reported for PLD thin films in the literature. Effects such as film stress state
and substrate identity are possible reasons for this discrepancy, but further study is needed to
understand these differences.
Figure 6.8 Average equilibrium stress levels of the PLD LSF64 thin film as a function of pO2 and temperature. The dashed lines represent thermal expansion mismatch induced stress, based on coefficient of thermal expansion (CTE) and elastic constants of YSZ and LSF64 available in
the literature [193, 194]. 700oC was chosen as the stress-free state in line with the film deposition temperature.
Figure 6.8 shows the equilibrium stress of the PLD thin film as a function of temperature
compared to the stress expected from the coefficient of thermal expansion (CTE) mismatch
between LSF64 [193] and YSZ [215]. 700oC was chosen as the stress- free state because this was
the deposition temperature of the film. General agreement is observed between the measured and
the CTE mismatch predicted stresses. The stress level at 800oC and pO2 =0.021 approached
nearly 180 MPa in compressive nature, in contrast to a tensile stress of ~220 MPa at 475oC. The

106
slight drift of the stress state towards the compressive direction was observed from kR1 to kR3,
which may be caused by one or more of the effects (changes of electronic structure, cation
segregation, and/or dislocation density in the film) discussed previously.
Figure 6.9 Chemical stress of the PLD thin film LSF64|YSZ induced by pO2 changes between 0.21 and 0.021 as a function of temperature.
Figure 6.9 shows the chemical stress of the PLD LSF64 thin film induced by switching
between pO2=0.21 and pO2=0.021 across all three thermal segments. Consistent with the
behavior of large-grained LSF shown in Chapter 5 and in the literature [49, 193], a nearly linear
relationship between the chemical stress and the temperature is observed above 525oC. The sub-
525oC chemical stresses are smaller than those of the sputtered films, consistent with (1) the
interpretation that the sub-525oC chemical stress is controlled by grain boundary expansion, and
(2) the larger grain size of the PLD films (~52 nm) compared to those of the sputtered films (43

107
nm). For unknown reasons, a slight reduction of chemical stress was also shown fo r the third
thermal segment (kR3) compared to kR1 and kR2.
Figure 6.10 X-ray photoelectron spectroscopy (XPS) measurements of a PLD LSF64|YSZ
sample.
Table 5 XPS measurement on the PLD LSF64|YSZ thin film after κR testing.
La Sr Fe Y La:Sr:Fe ratio
Atomic
Fraction (%)
0.78 7.46 2.61 1.06 0.30: 2.86 : 1
Figure 6.10 and Table 5 show the XPS measurement on the PLD LSF64|YSZ sample.
Significant Sr enrichment and La depletion were measured at the surface, a commonly observed
phenomenon in the literature [213, 216, 217]. In addition, a significant amount of Y was also
found at the surface, indicating cation diffusion from the YSZ substrate. Compared to the

108
La:Sr:Fe ratio of 1.19:1.47:1 observed for the sputtered thin film SP-A, a greater amount of Sr
surface segregation was observed in the PLD film.
6.3.2 LSF64|SDC|YSZ
Figure 6.11 X-ray diffraction scans of the PLD LSF64|SDC|YSZ before and after R test. Peak
indexing was obtained from PDF # 01-082-1961 for LSF64 and 01-070-4436 for YSZ.
As shown in Figure 6.11, PLD thin film LSF64|SDC|YSZ exhibits epitaxial features
similar to LSF64|YSZ, with (110) (104) as the main orientations. Small peaks corresponding to
the (024) orientation of LSF64 were also observed. No impurity phase peaks were observed.
Williamson-Hall grain size estimation was not available for this sample due to the LSF-YSZ
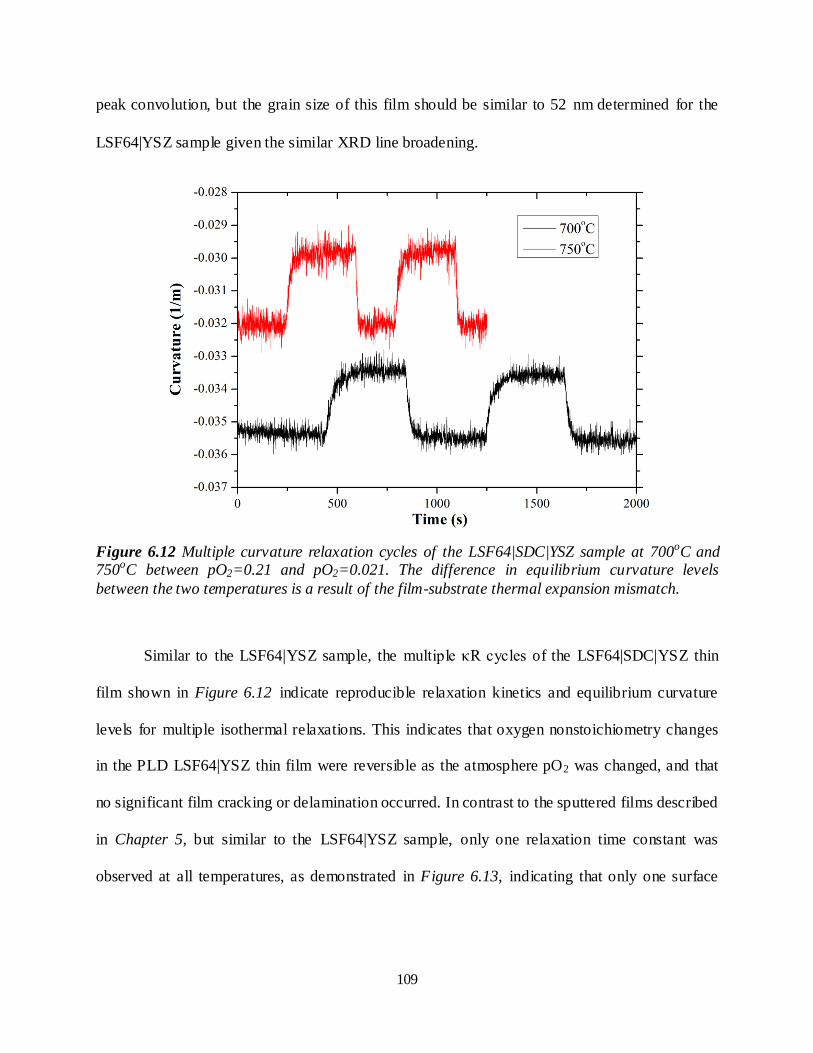
109
peak convolution, but the grain size of this film should be similar to 52 nm determined for the
LSF64|YSZ sample given the similar XRD line broadening.
Figure 6.12 Multiple curvature relaxation cycles of the LSF64|SDC|YSZ sample at 700oC and 750oC between pO2=0.21 and pO2=0.021. The difference in equilibrium curvature levels
between the two temperatures is a result of the film-substrate thermal expansion mismatch.
Similar to the LSF64|YSZ sample, the multiple κR cycles of the LSF64|SDC|YSZ thin
film shown in Figure 6.12 indicate reproducible relaxation kinetics and equilibrium curvature
levels for multiple isothermal relaxations. This indicates that oxygen nonstoichiometry changes
in the PLD LSF64|YSZ thin film were reversible as the atmosphere pO2 was changed, and that
no significant film cracking or delamination occurred. In contrast to the sputtered films described
in Chapter 5, but similar to the LSF64|YSZ sample, only one relaxation time constant was
observed at all temperatures, as demonstrated in Figure 6.13, indicating that only one surface

110
exchange process dominated during the κR experiments. Identical Ln[1-g(t)] analysis at all other
tested temperatures yielded similar results.
Figure 6.13 Representative κR data of 700oC on reduction shown in Figure 6.14 replotted on a semi-log plot, and showing only one time constant. κR data of other temperatures showed similar single time constant behavior.

111
Figure 6.14 κR-measured k values of LSF64|SDC|YSZ across multiple thermal segments at a
flow rate of 100 sccm.
Figure 6.14 shows the κR-measured k’s of LSF|SDC|YSZ as a function of inverse
temperature. Comparing to LSF|YSZ, reduced hysteresis behavior of the measured k values was
observed in the LSF|SDC|YSZ sample across multiple thermal segments.

112
Figure 6.15 κR-determined k values of PLD LSF64 thin films compared with those in the literature [47-50] and the sputtered thin films in this work.
Figure 6.15 shows the comparison between the k values of the two PLD LSF64 thin films
obtained via κR and those available in the literature, as well as a representative dataset of the
sputtered thin films in this study. The magnitude of k’s was similar between LSF64|YSZ and
LSF64|SDC|YSZ, and also close to the PLD thin film measurements from the literature. The
activation energy of LSF64|SDC|YSZ k’s below 700oC was 1.1 eV, 1.0 eV and 1.4 eV for kR1,
kR2 and kR3, respectively and similar to those of LSF64|YSZ. However, the LSF|SDC|YSZ
sample showed slightly less hysteresis during the second thermal segment (kR2). Possible
reasons for this behavior are found in the XPS results presented later in this section.

113
Figure 6.16 Average equilibrium stress levels of the PLD thin film LSF64|SDC|YSZ as a
function of pO2 and temperature. The dashed lines represent thermal expansion mismatch induced stress, based on coefficient of thermal expansion (CTE) and elastic constants of YSZ and LSF64 available in the literature [193, 215]. 700oC was chosen as the stress-free state in line
with the film deposition temperature.
Figure 6.16 shows the equilibrium stress of the PLD thin film LSF64|SDC|YSZ as a
function of temperature compared to the stress expected from the coefficient of thermal
expansion (CTE) mismatch between LSF64 and YSZ. For lack of an absolute reference, 700oC
was chosen as the stress- free state because this was the deposition temperature of the film.
General agreement is observed compared to the CTE mismatch predictions, as well as the
LSF64|YSZ sample.
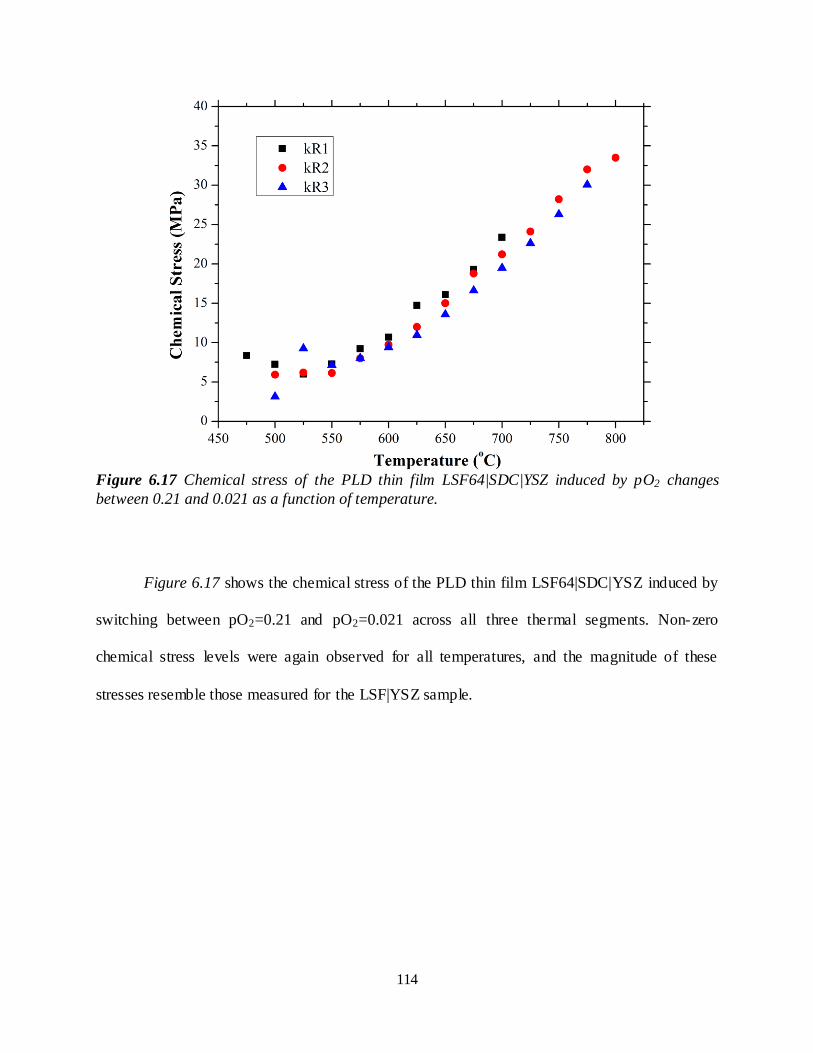
114
Figure 6.17 Chemical stress of the PLD thin film LSF64|SDC|YSZ induced by pO2 changes
between 0.21 and 0.021 as a function of temperature.
Figure 6.17 shows the chemical stress of the PLD thin film LSF64|SDC|YSZ induced by
switching between pO2=0.21 and pO2=0.021 across all three thermal segments. Non-zero
chemical stress levels were again observed for all temperatures, and the magnitude of these
stresses resemble those measured for the LSF|YSZ sample.

115
Figure 6.18 X-ray photoelectron spectroscopy (XPS) measurements of a PLD LSF64|SDC|YSZ sample.
Table 6 Comparison of XPS measurements on the PLD LSF64|YSZ and LSF64|SDC|YSZ thin films and the sputtered LSF64|8YSZ film after κR testing.
La Sr Fe Y La:Sr:Fe ratio
Atomic
Fraction (%)
LSF64|8YSZ (SP-A)
after κR test 2.66 3.30 2.24 0.11 1.19 : 1.47 : 1
LSF64|YSZ
after κR testing 0.78 7.46 2.61 1.06 0.30: 2.86 : 1
LSF64|SDC|YSZ after κR testing
0.60 5.12 2.10 0.92 0.29 : 2.44 : 1
Figure 6.18 and Table 6 show the XPS measurement on the PLD LSF64|SDC|YSZ
sample, and compare the atomic fractions of cations between LSF64|SDC|YSZ and LSF|YSZ as
well as the sputtered thin film LSF|YSZ. Significant Sr segregation was also observed at the
surface of LSF|SDC|YSZ. The similarities and differences of surface composition between the

116
two PLD films indicate that the hysteresis behavior observed in k measurements may be caused
by Sr and/or Y surface segregation. Additional work is needed to understand the underlying
causes for the hysteresis behavior observed in PLD LSF64 thin films
6.4 Conclusions
Stress and oxygen surface exchange coefficients were simultaneously measured on
pulsed laser deposited LSF64 thin films using the curvature relaxation technique developed in
this work. The stress and oxygen surface exchange coefficients of PLD LSF64 thin films were
measured with thermal cycling first time. The magnitude of the PLD k values were consistent
with literature reported PLD thin films with the same composition, but are 2 orders of magnitude
lower than the sputtered thin films measured in this work as well as literature bulk LSF64 sample
low temperature extrapolations. This indicates that the 5-order of magnitude k discrepancies in
the literature is not caused by the electrodes used previously measure the k’s of LSF64 PLD
films. A hysteresis behavior in k values was observed for the first time in both PLD thin films
LSF|YSZ and LSF|SDC|YSZ upon thermal cycling, and may be caused by cation segregation to
the surface of the film. Although the measured film stress levels were similar to sputtered films
in magnitude, ferroelastic domain switching due to film yielding was not present, as indicated by
the linear temperature dependence of the film stress. This is consistent with the single (110)
dominated orientation of the films.
These κR experiments demonstrate how microstructure and processing techniques may
affect the stress and surface exchange kinetics of MIEC thin films with the same chemical
composition, and provide additional insights towards understanding the relationship between
surface exchange mechanisms and the microstructure.

117
7. Oxygen Surface Exchange and Stress
Measurements on Spray Deposited LSF64 Porous Thick Films
7.1 Introduction
In this chapter, stress and k were simultaneously measured on porous MIEC thick films
for the first time. Specifically, the κR technique was used on LSF64|13YSZ bilayers to gain a
deeper understanding of the k variations resulting from LSF64 films with different processing
histories, morphologies, and stress states.
7.2 Experimental
7.2.1 Sample Fabrication
LSF64 powder synthesis and porous film fabrication procedures were detailed in Sections
3.2.1 and 3.2.5. 13YSZ substrates were chosen to avoid the cubic-to-tetragonal transformation of
the substrate (which is known to occur in yttria doping levels below 8%) [204] that could
complicate the curvature and film stress measurement.
7.2.2 Porous Pellet Dilatometry
In order to understand the densification behavior of the porous LSF film and ensure that
no sintering occurred during κR experiments, a porous, 12.7 mm diameter cylindrical pellet was
prepared by uniaxiallly cold pressing the calcined LSF64 powder at 13 MPa in a stainless steel
die. The resulting 9.25 mm-long pellet was then loaded into the dilatometer, followed by the
same sintering schedule as the porous film (1050oC for 1 hour, with heating and cooling rates
both 5oC/min), under 50 sccm continuously flowing air.

118
7.2.3 Curvature Relaxation Measurements
Immediately after sintering at 1050oC for 1 hour inside the MOSS apparatus, the bilayers
were cooled down to 700oC in air followed by κR experiments between air (Airgas, pO2=0.21)
and of 2.1% O2-97.9% N2 mixture (Airgas, pO2=0.021) controlled by a four-way valve.
Relaxation experiments under both a 100 sccm and a 500 sccm flow rate were conducted to
identify the temperature range where reactor flush time limitations were present. At temperatures
between 700oC and 400oC, the 10 mL chamber reactor volume determined from Chapter 5
corresponded to a flush time ranging from 1.8 seconds to 2.7 seconds for 100 standard cubic
centimeters/ minute (sccm) and from 0.37 seconds to 0.53 seconds for 500 sccm flow rate [181].
Based on the need for a relaxation time larger than 5 times the reactor volume flush time in order
to correctly extract oxygen surface exchange coefficients [181], these reactor flush times allowed
accurate k measurements to be obtained in those situations where the relaxation time constants
were larger than 11 seconds and 2 seconds for the 100 sccm and 500 sccm flow rates,
respectively.
For the porous thick films studied here, k was extracted from κR data using the measured
film porosity, the film surface area, and Equation (34). Thickness-averaged film stresses were
obtained using the modified version of Stoney’s Equation for arbitrary film thickness shown in
Equations (38)-(40).
7.2.4 Structural and Morphological Characterization
SEM and XRD analysis before and after κR experiments utilized the same conditions as
those for the sputtered films, described in Section 5.2.3. Grain size was estimated using the line
intercept method on micrographs of the film surface after κR testing. FIB-SEM 3D

119
reconstructions were performed using the procedures detailed in Section 3.4.2 to obtain
microstructure parameters (VV and SV) of the porous films.
7.3 Results and Discussion
The sintering behavior of a porous LSF bulk sample (as shown in Figure 4.3) undergoing
similar thermal conditions as the porous thick film indicated that no sintering occurred during
porous film κR measurements between 250-700oC.
Figure 7.1 (a) Picture of the top surface of a κR-tested LSF64 porous thick film on a 25.4 mm
diameter YSZ substrate, (b) SEM image of the top surface of a LSF film, and (c) a FIB-SEM 3D reconstruction. The film thickness is 5 µm and aligned in the upward direction.
Figure 7.1 shows the morphology and microstructure of a κR-tested LSF64 film on the
rough side of a 25.4 mm diameter, one side polished 13YSZ substrate. The porous film was
crack-free, uniform in thickness, and had well-necked particles. The size of these particles were

120
well below the reported characteristic thickness of LSF64, which is >100 µm below 800oC [47,
49]. With rapid gas transport through the pores, this ensured that surface exchange dominated
oxygen transport in the film (i.e. transport of oxygen through the bulk of the particles was
significantly quicker than that across the gas/particle interface) in the temperature range of this
study, and therefore the use of Equation (30) was legitimate to extract k [218]. From the FIB-
SEM 3D reconstruction of the porous film, it was determined that VV = 50.7% and SV = 0.024
nm-1. Reconstruction of halves and quarters of the volume showed consistent VV and SV values
within the margin of error (i.e. <5%), indicating that the volume in Figure 7.1 (c) is
microstructurally representative. The particle size of the porous film after κR testing was
determined to be 400 ± 10 nm using the line intercept method on Figure 7.1 (b).

121
Figure 7.2 X-ray diffraction of (a) the LSF64 powder after calcination at 1000oC for 1h, (b) a
LSF64|YSZ bilayer before κR testing and (c) a LSF64|YSZ bilayer after κR testing. XRD peak indexing was performed using LSF64 PDF # 01-082-1961 and YSZ PDF # 01-077-2114.
Figure 7.2 shows X-ray diffraction data for a) the GNP-produced LSF64 powder after
calcination, b) the as-deposited LSF64 thick film atop a YSZ substrate, and c) a κR-tested LSF64
thick film atop a YSZ substrate. Peak indexing indicated that both the LSF64 powder and the
LSF64 films were polycrystalline and consistent with all major peaks listed in LSF64 PDF # 01-
082-1961. The (200) and (400) planes of the YSZ substrate were observed in κR-tested thick
film, but were not present in the as-deposited film. This is assumed to be caused by the reduced
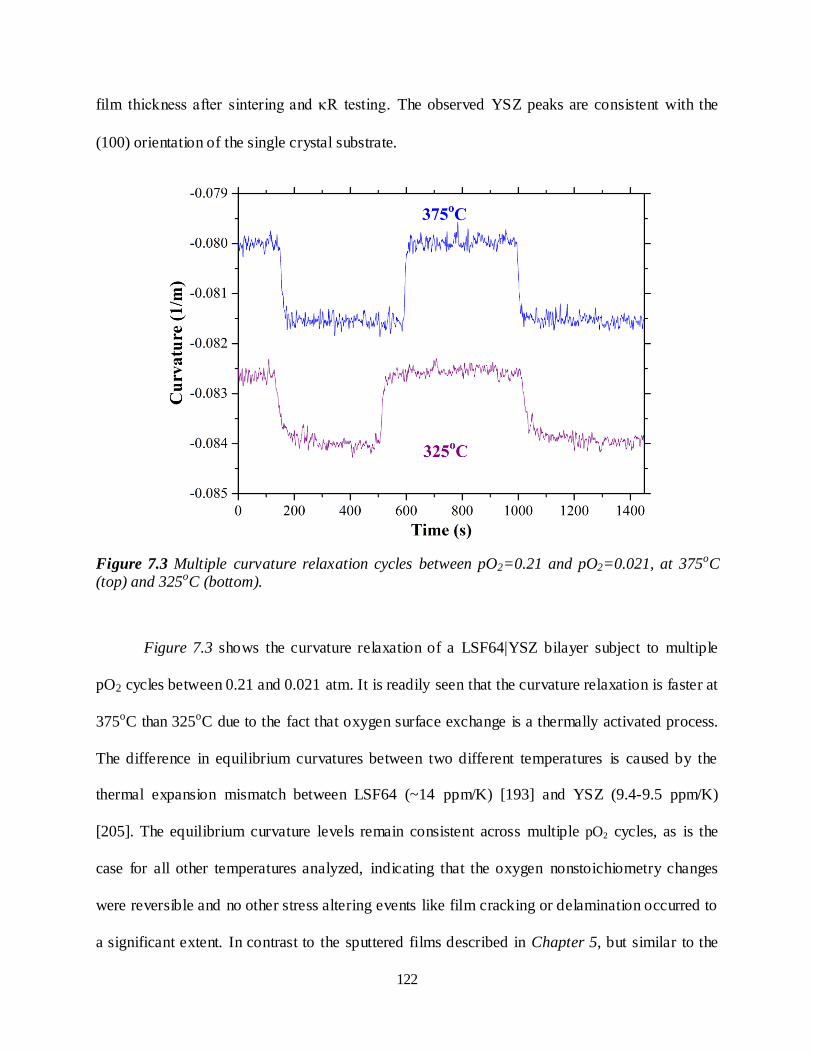
122
film thickness after sintering and κR testing. The observed YSZ peaks are consistent with the
(100) orientation of the single crystal substrate.
Figure 7.3 Multiple curvature relaxation cycles between pO2=0.21 and pO2=0.021, at 375oC (top) and 325oC (bottom).
Figure 7.3 shows the curvature relaxation of a LSF64|YSZ bilayer subject to multiple
pO2 cycles between 0.21 and 0.021 atm. It is readily seen that the curvature relaxation is faster at
375oC than 325oC due to the fact that oxygen surface exchange is a thermally activated process.
The difference in equilibrium curvatures between two different temperatures is caused by the
thermal expansion mismatch between LSF64 (~14 ppm/K) [193] and YSZ (9.4-9.5 ppm/K)
[205]. The equilibrium curvature levels remain consistent across multiple pO2 cycles, as is the
case for all other temperatures analyzed, indicating that the oxygen nonstoichiometry changes
were reversible and no other stress altering events like film cracking or delamination occurred to
a significant extent. In contrast to the sputtered films described in Chapter 5, but similar to the

123
PLD films described in Chapter 6, only one relaxation time constant was observed. This is
demonstrated in Figure 7.4, which shows that only one surface exchange rate was recorded
during the κR experiment. Identical analysis at all tested temperatures (i.e. between 250oC to
700oC) yielded similar results.
Figure 7.4 Representative κR data of 325oC on reduction shown in Figure 7.3 replotted on a semi-log plot, and showing only one time constant. κR data of other temperatures showed similar
single time constant behavior.

124
Figure 7.5 k measurements (a) under 500 sccm flow rate across multiple thermal segments κR1-
κR5 and (b) under different flow rates at κR3. Errors of k’s are smaller than the symbols. The numbers are in chronological order of experiments, where 1, 3 and 5 are measurements during
sample cooling, 2 and 4 are during sample heating. Open and solid symbols denote k measurements with and without flush time limitations, respectively. As indicated by the grayed out region, reliable k measurements could not be obtained above 375oC due to reactor flush time
limitations.
Figure 7.5 shows that k measurements across multiple thermal cycles were generally
reproducible. This suggests that phase transitions [193], ferroelastic domain switching [209],
irreversible cation surface segregation [219], and other unaccounted for possible stress relaxation

125
processes did not occur with thermal cycling between 250-700oC, and therefore had no
significant effect on k.
Further, as indicated by the identical k values for a 100 and 500 sccm flow rate below
325oC and a single, 500 sccm k slope below 375oC, flush time limitations are not present below
375oC when a 500 sccm gas flow is used. Above 375oC, the measured k’s exhibit an activation
energy of 0.16 eV and 0.18 eV for 100 sccm and 500 sccm flow rates, respectively, which is
close to the theoretical 0.07 eV estimated from the reactor flush time limitation [181]. This
indicates a reactor flush time dominated regime for temperatures 375oC. At lower temperatures
where the flush time is much shorter than the time constants of the relaxations, reliable k
measurements were obtained.
Figure 7.6 Surface exchange coefficients (averaged over the oxidation and reduction k’s) of the
porous thick film LSF64 under 500 sccm for κR3 compared to other literature measurements [47, 49, 50, 220], as well as the sputtered and PLD thin films measured in this work. Only k1
values are shown.

126
Figure 7.6 shows the Arrhenius behavior of the k’s measured by the κR technique in
comparison with other literature measurements on bulk and thin film LSF64 using various
techniques. As shown in Figure 7.6 and reported in Yang and Nicholas [221], at temperatures
375oC, the porous thick film k’s exhibit an activation energy of 1.3 eV, consistent with the 1.3
eV activation energy reported by ten Elshof et al. on bulk LSF64, and the 1.1~1.4 eV activation
energies reported by Yang et al. [220] and in Chapter 5 on sputtered thin film LSF64. This
similarity may be because the polycrystalline, non-epitaxial nature of the porous thick film
structurally resembles the bulk and sputtered LSF64 samples.
Figure 7.7 Estimated LSF64 thickness averaged film stress. Curvature/stress level of the bilayer prior to sintering (at room temperature) was chosen as reference of stress-free state.
Figure 7.7 shows thickness-averaged film stress measurements, z , extracted from
equilibrium curvature levels based on Equation (41). These thickness-averaged film stresses do

127
not account for local stress variations caused by microstructure induced stress concentration
through film particle necks. The elastic modulus of the porous film is estimated based on an
exponential relationship with respect to the porosity, as seen in various studies on perovskite and
fluorite materials [222-225]:
0
exp( )E
E E b P (49)
where P is the volume fraction porosity, E0 is the elastic modulus at P=0 and bE is a material
dependent constant. For the LSF64 porous film studied here, E0 values of dense samples are
obtained from Kimura et al., [226] and bE is estimated to be 3.6 from that of
La0.6Sr0.4Co0.2Fe0.8O3-δ [222].
According to Equations (38)-(40), the thickness variation in z resulted in stress variation
across the thickness of the film of less than 0.1 MPa between the LSF64|YSZ interface and the
film top surface (not shown in plots here). This small effect introduces variations of stress
measurements smaller than the symbol size. Linear stress levels are generally observed at
temperatures between 725oC and 600oC, which is consistent with the relative linearity of the
thermal expansion mismatch between LSF64 and YSZ. At temperatures below 600oC, the stress
levels start to bend over and eventually become more compressive (less tensile) with decreasing
temperature. This unexpected variation of the stress may be due to the small residual stress in the
YSZ substrate that becomes noticeable in the porous thick films because these films are at much
smaller stress states than the sputtered or PLD LSF64 films. The unusual low temperature stress-
temperature behavior of theses films, which varied from sample to sample, suggests that the
1100oC, 1-hour pre-deposition annealing cycle was not sufficient to relieve all the residual stress
in the YSZ substrates. Future studies will investigate films deposited on higher temperature
annealed YSZ wafers.
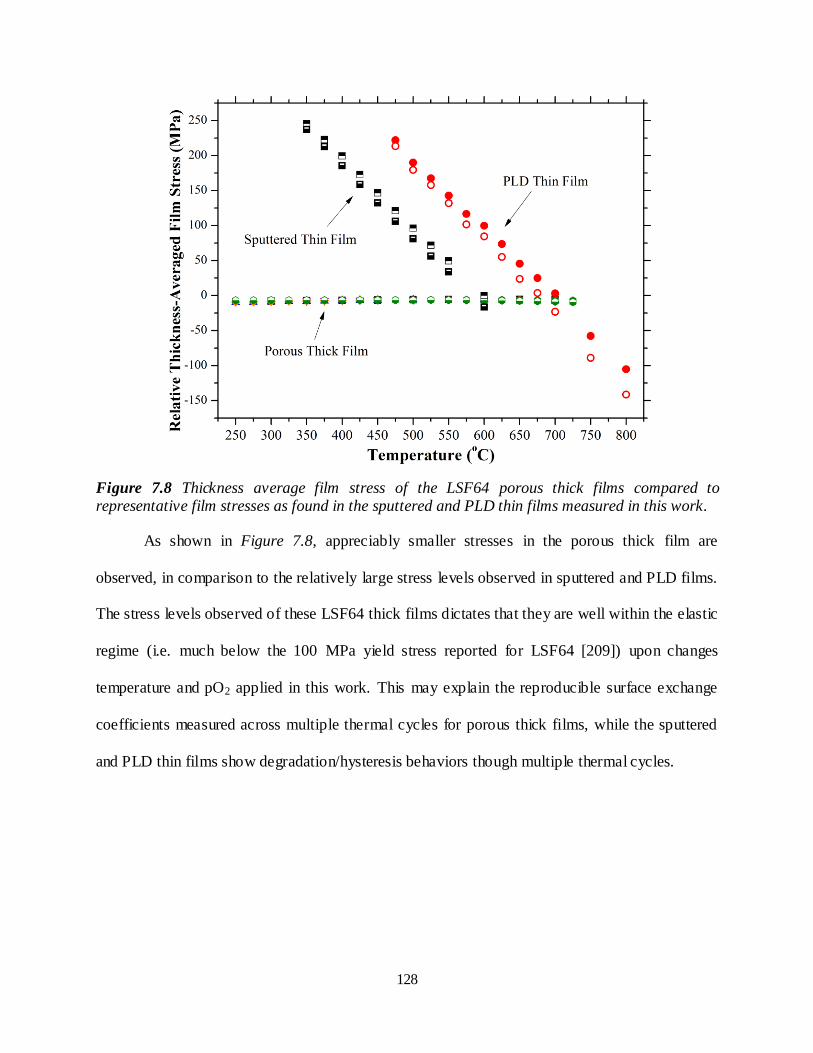
128
Figure 7.8 Thickness average film stress of the LSF64 porous thick films compared to representative film stresses as found in the sputtered and PLD thin films measured in this work.
As shown in Figure 7.8, appreciably smaller stresses in the porous thick film are
observed, in comparison to the relatively large stress levels observed in sputtered and PLD films.
The stress levels observed of these LSF64 thick films dictates that they are well within the elastic
regime (i.e. much below the 100 MPa yield stress reported for LSF64 [209]) upon changes
temperature and pO2 applied in this work. This may explain the reproducible surface exchange
coefficients measured across multiple thermal cycles for porous thick films, while the sputtered
and PLD thin films show degradation/hysteresis behaviors though multiple thermal cycles.

129
Figure 7.9 Chemical stress of spray deposited porous thick films LSF64 between pO2=0.21 and pO2=0.021 as a function of temperature.
The porous thick film chemical stresses shown in Figure 7.9 are calculated from the
different stress levels at pO2=0.21 and pO2=0.021 for each temperature, and show significant increase
starting at 525oC, indicating significant increase of the oxygen nonstoichiometry above 525
oC. At
temperatures below 525oC, the chemical stress shows a slight decrease with decreasing
temperature, but still remains small and non-zero at the lowest measurement temperature of
250oC.

130
Figure 7.10 Replot of the Figure 7.9 data on an Arrhenius scale, illustrating two regimes with
different activation energies. The dashed lines are linear fits to the data.
The chemical stress Arrhenius plot in Figure 7.10 displays a pronounced kink at 525oC.
Curiously, this chemical expansion kink happens at the same temperature as the onset of
chemical expansion in the large grained bulk samples of Figure 4.2. This suggests that LSF64
exhibits a distinct lattice-dominated chemical stress response above 525oC and a distinct grain-
boundary-dominated chemical stress response below 525oC. Although more data is needed, a
525oC chemical stress kink is consistent with the sputtered LSF64 chemical stress measurements
of Figure 5.14 and the PLD LSF64 chemical stress measurements of Figure 6.9 and Figure 6.17.

131
Given the definition of chemically induced strain in Equation (4) as well as Hooke’s
Law, the change in film stress is linearly proportionally to the change in oxygen
nonstoichiometry:
Δ Δf f c
M (50)
The application of Equation (50) and the assumption of temperature- independent f
M and c
values allows the activation energies for oxygen vacancy formation (∆Gf) to be extracted from
the chemical stress activation energies shown in Figure 7.10. The assumption of temperature-
independent f
M values is a good one, since LSF64 f
M values only change gradually by ~15%
between 275 and 700oC [172] and can therefore not account for the exponential changes shown
in Figure 7.10. The assumption of temperature- independent c
values is a good assumption
above 500oC, as indicated by large grained chemical expansion and nonstoichiometry data
extracted from Kuhn et al. [200]. The assumption of temperature- independent c
values below
500oC is more suspect, since no c
data at these temperatures exist in the literature (i.e. no
chemical expansion and nonstoichiometry experiments have been performed on small grain sized
LSF64 samples). However, assuming that c
remains constant from 275-500oC (i.e. assuming
that only differences produce chemical stress differences, as has been assumed in studies on
ceria [170] and anatase [227]) results in a grain boundary ∆Gf = 0.07 eV and a lattice ∆Gf = 0.5
eV. These ∆Gf values show it is much easier to form oxygen vacancies at the LSF64 grain
boundaries than inside the LSF64 lattice.

132
Figure 7.11 Summary of the chemical stress found in sputtered thin film SP-A, PLD thin film LSF|YSZ and the porous thick film PT-A measured at 500oC and 600oC as a function of inverse
grain size (G.S.)
Figure 7.11 shows the correlation between film grain size and measured chemical stress
at 500oC and 600oC for 3 different samples prepared by all three techniques in this work.
Samples SP-B and SP-C, which were fabricated simultaneously with SP-A, were assumed to
have the same grain size and chemical stresses as SP-A. As seen in the figures showing the
temperature dependence of chemical stress throughout this dissertation, 525oC is the common
temperature below which chemical stress starts to level off, but maintains a non-zero level.
Further, this low temperature chemical stress increases as the grain size of the film decreases.
This phenomenon is consistent with large compositional stress contribution from the grain
boundaries in the nano-crystalline ceria films reported by Sheldon et al. [207]. At higher
temperatures, chemical stress is largely induced by changes of oxygen vacancy concentration in

133
bulk grains. As the temperature is reduced, grain boundary induced chemical stress starts to take
over the contribution from the bulk, and eventually dominates the entire chemical stress at low
temperature. As the grain size dictates the ratio between grain boundary and grains, samples with
smaller grain sizes are capable of causing more chemical stress at low temperature.
Figure 7.12 Summary of the k1 values found in sputtered thin film SP-A, PLD thin film LSF|YSZ
and the porous thick film PT-A measured at 450oC and 500oC as a function of inverse grain size (G.S.).
Figure 7.12 summarizes the surface exchange coefficients of films fabricated by all three
techniques as a function of their respective inverse grain size. Although the measured k1 values
span up to 4 orders of magnitude among these films, no apparent dependence on grain size is
observed, suggesting that factors other than grain size (such as differences in surface orientation,
surface chemistry, etc.) control the oxygen surface exchange coefficients of the samples tested
here. Additional experiments to understand this behavior are needed.

134
Figure 7.13 Possible surface exchange pathways. The dotted box represents the grain boundary region that induces the sub-525oC chemical stresses observed in this work.
Interestingly, although the oxygen nonstoichiometry in bulk grains becomes minimal at
below 525oC, the lattice oxygen surface exchange coefficient (k1) is still measurable in all the
films tested here. This can be understood by considering that even though the lattice no longer
changes its oxygen vacancy concentration below 525oC, the faster k1 across the lattice surface,
and the large surface area fraction of the lattice surface compared to the grain boundaries (at least
for large grained samples) provides the dominant path for oxygen surface exchange, even as the
grain boundaries alone alter their oxygen vacancy concentration at low temperature. Since the
grain size is much smaller than the characteristic thickness, bulk diffusion through the lattice to
the grain boundary is not rate- limiting. Interestingly, in the smallest grain size samples tested
here, two exchange coefficients were observed. In these small grain sized samples, the large
areal fraction of both the grain boundaries and the bulk may be the reason two oxygen
incorporation processes, corresponding to oxygen incorporation at the exposed grain surfaces
and the exposed grain boundaries, are observed.

135
7.4 Conclusions
The curvature relaxation technique was used to measure the oxygen chemical surface
exchange coefficients and stresses of porous thick film La0.6Sr0.4FeO3-δ. For the first time,
chemical expansion and measurable k values were obtained as low as 275oC, and are consistent
with bulk LSF64 extrapolations below 400oC. The activation energy of the porous thick film is
comparable to that of bulk and sputtered thin film LSF64 samples reported in the literature and in
this work, but is very different than PLD thin films. Reproducible k values were obtained across
multiple thermal segments, which were attributed to the noticeably small stress levels in these
porous thick films. Similar to sputtered and PLD thin films, non-zero chemical stress were
observed throughout the temperature range, and displayed a temperature-induced transition from
grain boundary dominated chemical expansion to lattice dominated chemical expansion. This is
the first time such a chemical stress transition has been observed. The low temperature chemical
stresses measured in various films in this work were found to increase with decreasing grain size,
suggesting that grain boundaries have enhanced oxygen vacancy concentration gradient. The
grain size dependence of chemical stress observed in κR-measured films suggests that large
grained SOFC electrodes may help the mechanical redox stability of SOFC materials.

136
8. Dissertation Summary
The aim of this dissertation was to demonstrate that a novel curvature relaxation
technique could be utilized to 1) measure the in situ stress and oxygen surface exchange of
MIEC films, and 2) provide insights on the factors such as processing techniques, microstructure,
grain size, sample history and/or stress that presumably affect the surface exchange behavior.
Below is a list of the conclusions from this dissertation:
(1) The curvature relaxation technique developed in this work provides reliable,
simultaneous, in situ measurement of the oxygen surface exchange coefficient and stress
states of mechano-chemically active films.
(2) Thermo-chemical expansion of bulk LSF64 samples were measured using dilatometry
under various oxygen partial pressures ranging from air to N2 for the first time. The
chemical expansion onset temperature decreases with decreasing pO2, and chemical
expansion in bulk LSF64 only becomes active above 525oC in air. The bulk LSF64 25-
1000oC thermal expansion coefficient is 12.4 ppm/K, while the 525-1000oC chemical
expansion coefficient in air (pO2=0.21) and 10% N2-diluted air (pO2=0.021) are 0.0101
and 0.00867, respectively.
(3) The surface exchange coefficients of LSF64 vary among films prepared by different
techniques. Thin films prepared by sputter deposition and porous thick films prepared by
colloidal spray deposition have similar oxygen surface exchange coefficient magnitudes
and activation energies. Further, these k’s are similar to those expected from low
temperature extrapolations of bulk LSF64 reported in literature. In contrast, the PLD
LSF64 thin films measured here have k’s that are much less than the bulk, sputtered, or

137
spray deposited films. Thin films prepared here by PLD have similar magnitude of
surface exchange coefficients compared to PLD LSF64 films reported in literature. This
behavior suggests that the 5-order of magnitude discrepancy reported in the literature is
not related to artifacts such as the presence of electrodes or testing geometries, but rather
due to other effects such as microstructure or surface chemistry.
(4) The thickness-average film stress of sputtered and PLD thin films generally agree with
the stress predictions of thermal expansion mismatch between LSF64 and YSZ, and can
exceed 200 MPa below 400oC. However, the porous thick films tested here exhibited
stress levels below 10 MPa throughout the 250oC to 725oC measurement range.
(5) Degradation of surface exchange coefficients across multiple thermal cycles was
observed in both sputtered and PLD thin films, while reproducible k measurements were
obtained for the porous thick films. This degradation behavior could be caused by events
such as ferroelastic domain switching, dislocation formation and/or cation segregation
under stresses greater than ~200 MPa.
(6) The observed correlation between the low temperature chemical stress and the film grain
size suggests that enhanced grain boundary effects are responsible for the larger low
temperature (i.e. <525oC) chemical stress observed in films with smaller grains.
(7) While lattice dominated chemical expansion was observed above 525oC in all LSF64
films and large grained bulk samples, mechano-chemical coupling in LSF64 films was
measured below 525oC (and as low as 250oC) for the first time using the κR technique.
This sub-525oC response is attributed to grain boundary dominated chemical expansion.

138
The transition between these two distinct regimes has been observed for the first time,
and the associated lattice and grain boundary oxygen vacancy formation energies have
been measured to be 0.5 eV and 0.07 eV, respectively.

139
APPENDIX

140
APPENDIX
Derivation of Surface Exchange Coefficient Fitting Equations used
in Relaxation Experiments
In this appendix, the oxygen transport across the cathode membrane is modeled as a
surface evaporation/uptaking process of moisture of a solid-state planar sheet, as seen in Crank
[128].
Consider a planar sheet with a thickness of l and in-plane dimensions much larger than l .
The sheet is initially equilibrated with the atmosphere in terms of the oxygen chemical potential,
and has an initial oxygen concentration, 0
C . When a new oxygen atmosphere surrounding the
sheet is introduced stepwise, the oxygen concentration of sheet undergoes a relaxation and
eventually reaches a new equilibrium, C
. The mass transport in/out of the sheet corresponds to
a nonsteady state diffusion process, which can be described by the Fick’s second law assuming
constant diffusion coefficient, chem
D :
2
2
( , ) ( , )chem
C x t C x tD
t x
(51)
( , )C x t is the instantaneous oxygen concentration at position x in the sheet, where the origin is
defined at the central plane. The initial condition is given as:
0
( , 0)C x C (52)
The first boundary condition concerns the uniform oxygen concentration in the bulk of the sheet:

141
0
( , )0
x
C x t
t
(53)
The second boundary condition concerns the outer surface of the sheet, where first order kinetics
of the surface reaction is assumed:
/ 2
( , )( ( , ) )
chem x l chem
C x tD k C x t C
x
(54)
The solution to the diffusion equation can then be written as [128]:
2 2 2
2 2 2
1
2 exp( 4 / )1
( )
t n chem
n n n
M L D t l
M L L
(55)
where tM
M
denotes the normalized amount of oxygen ions diffused at time t , n
is a root of the
following equation
tann n
L (56)
where L is a unitless variable defined by
2 2
chem
chem c
lk lL
D L (57)
When c
l L , i.e. the diffusion distance is large such that the bulk diffusion is much slower than
the surface reaction, Equation (A.5) reduces to:
2 2
2 2 2
1
(2 1)81 exp
(2 1)
t chem
n
M n D t
M n l
(58)
When c
l L , i.e. the diffusion distance is small such that the bulk diffusion is much faster than
the surface reaction, Equation (55) reduces to:

142
1 expt chem
M tk
M l
(59)
Since the number of sites occupied by oxygen ions is proportional to the oxygen concentration
[228], a normalized quantity, ( )g t , can be defined as:
2 2 2
0
2 2 2
10
( ) 2 exp( 4 / )( ) 1
( )
t n chem
n n n
C t C M L D t lg t
C C M L L
(60)
As the oxygen concentration is linearly correlated to a variety of measurable quantities, such as
electrical conductivity, weight, strain and optical properties, the solutions above are widely used
in relaxation techniques measuring oxygen transport.

143
REFERENCES

144
REFERENCES
1. International Energy Outlook . 2013, U.S. Energy Information Administration.
2. Annual Energy Review. 2012, U.S. Energy Information Administration.
3. Steele, B.C.H. and A. Heinzel, Materials for Fuel-Cell Technologies. Nature, 2001.
414(6861): p. 345-352.
4. The Fuel Cell Industry Review. 2013, Fuel Cell Today.
5. Hexis Inc. Galileo 1000 N Brochure. Available from:
http://www.hexis.com/sites/default/files/media/publikationen/130524_hexis_broschuere_galileo_e_web.pdf.
6. Hosoi, K. and M. Nakabaru, Status of National Project for SOFC Development in Japan. ECS Transactions, 2009. 25(2): p. 11-20.
7. Bauen, A. and D. Hart, Assessment of the Environmental Benefits of Transport and
Stationary Fuel Cells. Journal of Power Sources, 2000. 86(1-2): p. 482-494.
8. Schlapbach, L. and A. Zuttel, Hydrogen-storage Materials for Mobile Applications.
Nature, 2001. 414(6861): p. 353-358.
9. Wachsman, E.D. and K.T. Lee, Lowering the Temperature of Solid Oxide Fuel Cells. Science, 2011. 334(6058): p. 935-939.
10. Haile, S.M., Fuel Cell Materials and Components. Acta Materialia, 2003. 51: p. 5981-6000.
11. O'Hayre, R.P., Fuel Cell Fundamentals. 2006: John Wiley & Sons.
12. Carrette, L., K.A. Friedrich, and U. Stimming, Fuel Cells: Principles, Types, Fuels, and Applications. Chemphyschem, 2000. 1(4): p. 162-193.
13. Molten Carbonate Fuel Cell Technology. 2011, U.S. Department of Energy.
14. Kroger, F.A. and H.J. Vink, Relations between the Concentrations of Imperfections in Crystalline Solids. Solid State Physics-Advances in Research and Applications, 1956. 3:
p. 307-435.
15. Adler, S.B., Factors Governing Oxygen Reduction in Solid Oxide Fuel Cell Cathodes.
Chemical Reviews, 2004. 104(10): p. 4791-4843.

145
16. Steele, B.C.H., K.M. Hori, and S. Uchino, Kinetic Parameters Influencing the Performance of IT-SOFC Composite Electrodes. Solid State Ionics, 2000. 135(1–4): p.
445-450.
17. Godickemeier, M., K. Sasaki, L.J. Gauckler, and I. Riess, Perovskite Cathodes for Solid
Oxide Fuel Cells Based on Ceria Electrolytes. Solid State Ionics, 1996. 86-88: p. 691-701.
18. Maguire, E., B. Gharbage, F.M.B. Marques, and J.A. Labrincha, Cathode Materials for
Intermediate Temperature SOFCs. Solid State Ionics, 2000. 127: p. 329-335.
19. Colomer, M.T., B.C.H. Steele, and J.A. Kilner, Structural and Electrochemical
Properties of the Sr0.8Ce0.1Fe0.7Co0.3O3-delta Perovskite as Cathode Material for ITSOFCs. Solid State Ionics, 2002. 147: p. 41-48.
20. Shao, Z. and S.M. Haile, A High-Perfromance Cathode for the Next Generation of Solid
Oxide Fuel Cells. Nature, 2004. 431: p. 170-173.
21. Skinner, S.J., Recent Advances in Perovskite-type Materials for Solid Oxide Fuel Cell
Cathodes. International Journal of Inorganic Materials, 2001. 3(2): p. 113-121.
22. Xia, C., W. Rauch, F. Chen, and M. Liu, Sm0.5Sr0.5CoO3 Cathodes for Low-temperature SOFCs. Solid State Ionics, 2002. 149(1-2): p. 11-19.
23. Shao, Z.P. and S.M. Haile, A High-performance Cathode for the Next Generation of Solid-Oxide Fuel Cells. Nature, 2004. 431(7005): p. 170-173.
24. Nicholas, J.D., L. Wang, A.V. Call, and S.A. Barnett, Use of the Simple Infiltrated Microstructure Polarization Loss Estimation (SIMPLE) Model to Describe the Performance of Nano-composite Solid Oxide Fuel Cell Cathodes. Physical Chemistry
Chemical Physics, 2012.
25. Baumann, F.S., J. Fleig, G. Cristiani, B. Stuhlhofer, H.-U. Habermeier, and J. Maier,
Quantitative Comparison of Mixed Conducting SOFC Cathode Materials by Means of Thin Film Model Electrodes. Journal of the Electrochemical Society, 2007. 154(9): p. B931-B941.
26. Baumann, F.S., J. Fleig, H.U. Habermeier, and J. Maier, Impedance Spectroscopic Study on Well-defined (La,Sr)(Co,Fe)O3-delta Model Electrodes. Solid State Ionics, 2006.
177(11-12): p. 1071-1081.
27. Atkinson, A., S.A. Barnett, R.J. Gorte, J.T.S. Irvine, A.J. McEvoy, M.B. Mogensen, S. Singhal, and J. Vohs, Advanced Anodes for High Temperature Fuel Cells. Nature
Materials, 2004. 3: p. 17-27.
28. Oishi, M., K. Yashiro, K. Sato, J. Mizusaki, and T. Kawada, Oxygen Nonstoichiometry
and Defect Structure Analysis of B-site Mixed Perovskite-type Oxide (La, Sr)(Cr, M)O3-

146
delta (M = Ti, Mn and Fe). Journal of Solid State Chemistry, 2008. 181(11): p. 3177-3184.
29. Tao, S.W., J.T.S. Irvine, and S.M. Plint, Methane Oxidation at Redox Stable Fuel Cell Electrode La0.75Sr0.25Cr0.5Mn0.5O3-delta. Journal of Physical Chemistry B, 2006.
110(43): p. 21771-21776.
30. Boukamp, B.A., The Amazing Perovskite Anode. Nature Materials, 2003. 2(5): p. 294-296.
31. Wan, J., J.H. Zhu, and J.B. Goodenough, La0.75Sr0.25Cr0.5Mn0.5O3-delta+Cu Composite Anode Running on H-2 and CH4 Fuels. Solid State Ionics, 2006. 177(13-14):
p. 1211-1217.
32. Tao, S. and J.T.S. Irvine, A Redox-Stable, Efficient Anode For Solid-Oxide Fuel Cells. Nature Materials, 2003. 2: p. 320-323.
33. Doshi, R., V.L. Richards, J.D. Carter, X. Wang, and M. Krumpelt, Development of Solid Oxide Fuel Cells That Operate at 500C. J. Electrochem. Soc., 1999. 146: p. 1273-1278.
34. Huijsmans, J.P.P., F.P.F. van Berkel, and G.M. Christie, Intermediate Temperature SOFC - A Promise for the 21st Century. Journal of Power Sources, 1998. 71(1-2): p. 107-110.
35. Ralph, J.M., A.C. Schoeler, and M. Krumpelt, Materials for Lower Temperature Solid Oxide Fuel Cells. Journal of Materials Science, 2001. 36(5): p. 1161-1172.
36. Huang, K.Q., R.S. Tichy, and J.B. Goodenough, Superior Perovskite Oxide-ion Conductor; Strontium- and Magnesium-doped LaGaO3: I, Phase Relationships and Electrical Properties. Journal of the American Ceramic Society, 1998. 81(10): p. 2565-
2575.
37. Huang, K.Q., R.S. Tichy, and J.B. Goodenough, Superior Perovskite Oxide-ion
Conductor; Strontium- and Magnesium-doped LaGaO3: II, AC Impedance Spectroscopy. Journal of the American Ceramic Society, 1998. 81(10): p. 2576-2580.
38. Huang, K.Q., R. Tichy, and J.B. Goodenough, Superior Perovskite Oxide-ion Conductor;
Strontium- and Magnesium-doped LaGaO3: III, Performance Tests of Single Ceramic Fuel Cells. Journal of the American Ceramic Society, 1998. 81(10): p. 2581-2585.
39. Baur, E. and H. Preis, On fuel Chains with Fixed Cables. Zeitschrift Fur Elektrochemie Und Angewandte Physikalische Chemie, 1937. 43: p. 727-732.
40. Oishi, N., A. Atkinson, N.P. Brandon, J.A. Kilner, and B.C.H. Steele, Fabrication of an
Anode-Supported Gadolinium-Doped Ceria Solid Oxide Fuel Cell and Its Operation at 550°C. Journal of the American Ceramic Society, 2005. 88(6): p. 1394-1396.

147
41. Suzuki, T., Z. Hasan, Y. Funahashi, T. Yamaguchi, Y. Fujishiro, and M. Awano, Impact of Anode Microstructure on Solid Oxide Fuel Cells. Science, 2009. 325(5942): p. 852-
855.
42. Tu, H. and U. Stimming, Advances, Aging Mechanisms and Lifetime in Solid-Oxide Fuel
Cells. Journal of Power Sources, 2004. 127(1–2): p. 284-293.
43. Blum, L., U. Packbier, I.C. Vinke, and L.G.J. de Haart, Long-Term Testing of SOFC Stacks at Forschungszentrum Jülich. Fuel Cells, 2013. 13(4): p. 646-653.
44. Kleitz, M. and F. Petitbon, Optimized SOFC Electrode Microstructure. Solid State Ionics, 1996. 92(1-2): p. 65-74.
45. Gourba, E., A. Ringuede, M. Cassir, A. Billard, J. Paiviasaari, J. Niinisto, M. Putkonen, and L. Niinisto, Characterisation of thin films of ceria-based electrolytes for IntermediateTemperature - Solid oxide fuel cells (IT-SOFC). Ionics, 2003. 9(1-2): p. 15-
20.
46. Huang, H., M. Nakamura, P.C. Su, R. Fasching, Y. Saito, and F.B. Prinz, High-
performance ultrathin solid oxide fuel cells for low-temperature operation. Journal of the Electrochemical Society, 2007. 154(1): p. B20-B24.
47. tenElshof, J.E., M.H.R. Lankhorst, and H.J.M. Bouwmeester, Oxygen Exchange and
Diffusion Coefficients of Strontium-doped Lanthanum Ferrites by Electrical Conductivity Relaxation. Journal of the Electrochemical Society, 1997. 144(3): p. 1060-1067.
48. Sogaard, M., A. Bieberle-Hutter, P.V. Hendriksen, M. Mogensen, and H.L. Tuller, Oxygen Incorporation in Porous Thin Films of Strontium Doped Lanthanum Ferrite. Journal of Electroceramics, 2011. 27(3-4): p. 134-142.
49. Sogaard, M., P.V. Hendriksen, and M. Mogensen, Oxygen Nonstoichiometry and Transport Properties of Strontium Substituted Lanthanum Ferrite. Journal of Solid State
Chemistry, 2007. 180(4): p. 1489-1503.
50. Mosleh, M., M. Sogaard, and P.V. Hendriksen, Kinetics and Mechanisms of Oxygen Surface Exchange on La0.6Sr0.4FeO3-delta Thin Films. Journal of the Electrochemical
Society, 2009. 156(4): p. B441-B457.
51. Yildiz, B., “Stretching” the Energy Landscape of Oxides—Effects on Electrocatalysis
and Diffusion. Mrs Bulletin, 2014. 39(02): p. 147-156.
52. Kushima, A., S. Yip, and B. Yildiz, Competing Strain Effects in Reactivity of LaCoO3 with Oxygen. Physical Review B, 2010. 82(11).
53. Ivers-Tiffee, E., A. Weber, and D. Herbstritt, Materials and Technologies for SOFC-components. Journal of the European Ceramic Society, 2001. 21(10-11): p. 1805-1811.
148
54. Adler, S.B., J.A. Lane, and B.C.H. Steele, Electrode Kinetics of Porous Mixed Conducting Oxygen Electrodes. Journal of the Electrochemical Society, 1996. 143(11): p.
3554-3564.
55. Shah, M., J.D. Nicholas, and S.A. Barnett, Prediction of infiltrated solid oxide fuel cell
cathode polarization resistance. Electrochemistry Communications, 2009. 11(1): p. 2-5.
56. Tsuchiya, M., N.A. Bojarczuk, S. Guha, and S. Ramanathan, Microstructural Effects on Electrical Conductivity Relaxation in Nanoscale Ceria Thin Films. Journal of Chemical
Physics, 2009. 130(17).
57. Rupp, J.L.M. and L.J. Gauckler, Microstructures and Electrical Conductivity of
Nanocrystalline Ceria-based Thin Films. Solid State Ionics, 2006. 177(26-32): p. 2513-2518.
58. Chiang, Y.M., E.B. Lavik, I. Kosacki, H.L. Tuller, and J.Y. Ying, Defect and Transport
Properties of Nanocrystalline CeO2-x. Applied Physics Letters, 1996. 69(2): p. 185-187.
59. Karthikeyan, A. and S. Ramanathan, Oxygen Surface Exchange Studies in Thin Film Gd-
doped Ceria. Applied Physics Letters, 2008. 92(24).
60. Mutoro, E., E.J. Crumlin, M.D. Biegalski, H.M. Christen, and Y. Shao-Horn, Enhanced oxygen reduction activity on surface-decorated perovskite thin films for solid oxide fuel
cells. Energy & Environmental Science, 2011. 4(9): p. 3689-3696.
61. Lane, J.A., S.J. Benson, D. Waller, and J.A. Kilner, Oxygen Transport in
La0.6Sr0.4Co0.2Fe0.8O3−δ. Solid State Ionics, 1999. 121(1–4): p. 201-208.
62. Zomorrodian, A., H. Salamati, Z.G. Lu, X. Chen, N.J. Wu, and A. Ignatiev, Electrical Conductivity of Epitaxial La0.6Sr0.4Co0.2Fe0.8O3-delta Thin Films Grown by Pulsed
Laser Deposition. International Journal of Hydrogen Energy, 2010. 35(22): p. 12443-12448.
63. Armstrong, E.N., K.L. Duncan, D.J. Oh, J.F. Weaver, and E.D. Wachsman, Determination of Surface Exchange Coefficients of LSM, LSCF, YSZ, GDC Constituent Materials in Composite SOFC Cathodes. Journal of the Electrochemical Society, 2011.
158(5): p. B492-B499.
64. Simrick, N.J., A. Bieberle-Hutter, T.M. Ryll, J.A. Kilner, A. Atkinson, and J.L.M. Rupp,
An Investigation of the Oxygen Reduction Reaction Mechanism of La0.6Sr0.4Co0.2Fe0.8O3 Using Patterned Thin Films. Solid State Ionics, 2012. 206: p. 7-16.
65. Li, Y.H., K. Gerdes, T. Horita, and X.B. Liu, Surface Exchange and Bulk Diffusivity of LSCF as SOFC Cathode: Electrical Conductivity Relaxation and Isotope Exchange
Characterizations. Journal of the Electrochemical Society, 2013. 160(4): p. F343-F350.

149
66. Dalslet, B.T., M. Sogaard, and P.V. Hendriksen, Determination of Oxygen Transport Properties from Flux and Driving Force Measurements. Journal of the Electrochemical
Society, 2007. 154(12): p. B1276-B1287.
67. Trovarelli, A., Catalytic Properties of Ceria and CeO2-containing Materials. Catalysis
Reviews: Science and Engineering, 1996. 38: p. 439-509.
68. Stefanik, T.S. and H.L. Tuller, Ceria-Based Gas Sensors. Journal of the European Ceramic Society, 2001. 21(10–11): p. 1967-1970.
69. Chueh, W.C., C. Falter, M. Abbott, D. Scipio, P. Furler, S.M. Haile, and A. Steinfeld, High-Flux Solar-Driven Thermochemical Dissociation of CO2 and H2O Using
Nonstoichiometric Ceria. Science, 2010. 330(6012): p. 1797-1801.
70. Primo, A., T. Marino, A. Corma, R. Molinari, and H. Garcia, Efficient Visible-Light Photocatalytic Water Splitting by Minute Amounts of Gold Supported on Nanoparticulate
CeO2 Obtained by a Biopolymer Templating Method. Journal of the American Chemical Society, 2011. 133(18): p. 6930-6933.
71. Bouwmeester, H.J.M. and A.J. Burggraff, Dense Ceramic Membranes for Oxygen Separation, in The CRC Handbook of Solid State Electrochemistry, P.J. Gellings and H.J.M. Bouwmeester, Editors. 1997, CRC Press: New York. p. 481-554.
72. Woodford, W.H., W.C. Carter, and Y.M. Chiang, Design Criteria for Electrochemical Shock Resistant Battery Electrodes. Energy & Environmental Science, 2012. 5(7): p.
8014-8024.
73. Atkinson, A., Chemically-Induced Stresses in Gadolinium-Doped Ceria Solid Oxide Fuel Cell Electrolytes. Solid State Ionics, 1997. 95: p. 249-258.
74. Pei, S., M.S. Kleefisch, T.P. Kobylinski, J. Faber, C.A. Udovich, V. Zhangmccoy, B. Dabrowski, U. Balachandran, R.L. Mieville, and R.B. Poeppel, Failure Mechanisms of
Ceramic Membrane Reactors in Partial Oxidation of Methane to Synthesis Gas. Catalysis Letters, 1995. 30(1-4): p. 201-212.
75. Li, Y.P., E.R. Maxey, and J.W. Richardson, Structural Behavior of Oxygen Permeable
SrFe0.2Co0.8Ox Ceramic Membranes with and without pO(2) Gradients. Journal of the American Ceramic Society, 2005. 88(5): p. 1244-1252.
76. Mizusaki, J., M. Yoshihiro, S. Yamauchi, and K. Fueki, Nonstoichiometry and Defect
Structure of the Perovskite-Type Oxides La1-xSrxFeO3-. Journal of Solid State Chemistry,
1985. 58(2): p. 257-266.
77. Kharton, V.V., A.A. Yaremchenko, M.V. Patrakeev, E.N. Naumovich, and F.M.B.
Marques, Thermal and Chemical Induced Expansion of La0.3Sr0.7(Fe,Ga)O3- Ceramics.
Journal of the European Ceramic Society, 2003. 23(9): p. 1417-1426.

150
78. Bishop, S.R., K.L. Duncan, and E.D. Wachsman, Surface and Bulk Oxygen Non-stoichiometry and Bulk Chemical Expansion in Gadolinium-doped Cerium Oxide. Acta
Materialia, 2009. 57(12): p. 3596-3605.
79. Bishop, S.R., K.L. Duncan, and E.D. Wachsman, Defect Equilibria and Chemical
Expansion in Non-stoichiometric Undoped and Gadolinium-doped Cerium Oxide. Electrochemica Acta, 2009. 54(5): p. 1436-1443.
80. Chiang, H.W., R.N. Blumenthal, and R.A. Fournelle, A High-temperature Lattice-
Parameter and Dilatometer Study of the Defect Structure of Nonstoichiometric Cerium Dioxide. Solid State Ionics, 1993. 66(1-2): p. 85-95.
81. Chen, X.Y., J.S. Yu, and S.B. Adler, Thermal and Chemical Expansion of Sr-doped
Lanthanum Cobalt Oxide (La-1-xSrxCoO3-). Chemistry of Materials, 2005. 17(17): p.
4537-4546.
82. Bishop, S.R., K.L. Duncan, and E.D. Wachsman, Thermo-Chemical Expansion in Strontium-Doped Lanthanum Cobalt Iron Oxide. Journal of the American Ceramic
Society, 2010. 93(12): p. 4115-4121.
83. Larsen, P.H., P.V. Hendriksen, and M. Mogensen, Dimensional Stability and Defect
Chemistry of Doped Lanthanum Chromites. Journal of Thermal Analysis, 1997. 49(3): p. 1263-1275.
84. Miyoshi, S., J.O. Hong, K. Yashiro, A. Kaimai, Y. Nigara, K. Kawamura, T. Kawada,
and J. Mizusaki, Lattice Expansion upon Reduction of Perovskite-type LaMnO3 with Oxygen-Deficit Nonstoichiometry. Solid State Ionics, 2003. 161(3-4): p. 209-217.
85. Adler, S.B., Chemical Expansivity of Electrochemical Ceramics. Journal of the American Ceramic Society, 2001. 84(9): p. 2117-2119.
86. McIntosh, S., J.F. Vente, W.G. Haije, D.H.A. Blank, and H.J.M. Bouwmeester, Oxygen
Stoichiometry and Chemical Expansion of Ba0.5Sr0.5Co0.8Fe0.2O3- Measured by In Situ Neutron Diffraction. Chemistry of Materials, 2006. 18(8): p. 2187-2193.
87. Vracar, M., A. Kuzmin, R. Merkle, J. Purans, E.A. Kotomin, J. Maier, and O. Mathon,
Jahn-Teller Distortion around Fe(4+) in SrFexTi1-xO3- from X-ray Absorption
Spectroscopy, X-ray Diffraction, and Vibrational Spectroscopy. Physical Review B, 2007. 76(17): p. 174107-1 to 144107-10.
88. Bishop, S.R., K.L. Duncan, and E.D. Wachsman, Surface and Bulk Oxygen Non-stoichiometry and Bulk Chemical Expansion in Gadolinium-doped Cerium Oxide. Acta Mater., 2009. 57(12): p. 3596-3605.
89. Bishop, S.R., K.L. Duncan, and E.D. Wachsman, Defect Equilibria and Chemical Expansion in Non-stoichiometric Undoped and Gadolinium-doped Cerium Oxide.
Electrochem. Acta, 2009. 54(5): p. 1436-1443.

151
90. Kharton, V.V., A.A. Yaremchenko, M.V. Patrakeev, E.N. Naumovich, and F.M.B.
Marques, Thermal and Chemical Induced Expansion of La0.3Sr0.7(Fe,Ga)O3- Ceramics.
J. Eur. Ceram. Soc., 2003. 23(9): p. 1417-1426.
91. Bishop, S.R., K.L. Duncan, and E.D. Wachsman, Thermo-Chemical Expansion in
Strontium-Doped Lanthanum Cobalt Iron Oxide. J. Am Cer. Soc., 2010. 93(12): p. 4115-4121.
92. Adler, S.B., Chemical Expansivity of Electrochemical Ceramics. J. Am Cer. Soc., 2001. 84(9): p. 2117-2119.
93. Chen, X.Y., J.S. Yu, and S.B. Adler, Thermal and Chemical Expansion of Sr-doped
Lanthanum Cobalt Oxide (La-1-xSrxCoO3-). Chem. Mater., 2005. 17(17): p. 4537-4546.
94. Vracar, M., A. Kuzmin, R. Merkle, J. Purans, E.A. Kotomin, J. Maier, and O. Mathon,
Jahn-Teller Distortion around Fe(4+) in SrFexTi1-xO3- from X-ray Absorption Spectroscopy, X-ray Diffraction, and Vibrational Spectroscopy. Phys. Rev. B, 2007.
76(17): p. 174107-1 - 174107-12.
95. McIntosh, S., J.F. Vente, W.G. Haije, D.H.A. Blank, and H.J.M. Bouwmeester, Oxygen
Stoichiometry and Chemical Expansion of Ba0.5Sr0.5Co0.8Fe0.2O3- Measured by In Situ Neutron Diffraction. Chem. Mater., 2006. 18(8): p. 2187-2193.
96. Larsen, P.H., P.V. Hendriksen, and M. Mogensen, Dimensional Stability and Defect Chemistry of Doped Lanthanum Chromites. J. Therm. Anal., 1997. 49(3): p. 1263-1275.
97. Atkinson, A. and T.M.G.M. Ramos, Chemically-Induced Stresses in Ceramic Oxygen
Ion-Conducting Membranes. Solid State Ionics, 2000. 129(1-4): p. 259-269.
98. Mandowara, S., Grain Boundary Induced Compositional Stresses in Non-stoichiometric
Oxide Films, in Division of Engineering. 2009, Brown University: Providence, RI. p. 257.
99. Mandowara, S. and B.W. Sheldon, Compositional Stresses in Polycrystalline Ceria
Films. Electrochem. Soc. Trans., 2008. 11(33): p. 191-196.
100. Chroneos, A., B. Yildiz, A. Tarancon, D. Parfitt, and J.A. Kilner, Oxygen diffusion in
solid oxide fuel cell cathode and electrolyte materials: mechanistic insights from atomistic simulations. Energy & Environmental Science, 2011. 4(8): p. 2774-2789.
101. Azad, S., O.A. Marina, C.M. Wang, L. Saraf, V. Shutthanandan, D.E. McCready, A. El-
Azab, J.E. Jaffe, M.H. Engelhard, C.H.F. Peden, and S. Thevuthasan, Nanoscale Effects on Ion Conductance of Layer-by-layer Structures of Gadolinia Doped Ceria and
Zirconia. Appl. Phys. Lett., 2005. 86(13): p. 131906-1 - 131906-3.
102. Rushton, M.J.D., A. Chroneos, S.J. Skinner, J.A. Kilner, and R.W. Grimes, Effect of Strain on the Oxygen Diffusion in Yttria and Gadolinia Co-doped Ceria. Solid State
Ionics, 2012: p. In Press.

152
103. De Souza, R.A., A. Ramadan, and S. Horner, Modifying the Barriers for Oxygen-vacancy Migration in Fluorite-structured CeO2 Electrolytes through Strain: A Computer
Simulation Study. Energy & Environmental Science, 2012. 5(1): p. 5445-5453.
104. Avila-Paredes, H.J. and S. Kim, The Effect of Segregated Transition Metal Ions on the
Grain Boundary Resistivity of Gadolinium Doped Ceria: Alteration of the Space Charge Potential. Solid State Ionics, 2006. 177: p. 3075-3080.
105. la O, G.J., S.J. Ahn, E. Crumlin, Y. Orikasa, M.D. Biegalski, H.M. Christen, and Y.
Shao-Horn, Catalytic Activity Enhancement for Oxygen Reduction on Epitaxial Perovskite Thin Films for Solid-Oxide Fuel Cells. Angew. Chem.-Intl. Ed., 2010. 49(31):
p. 5344-5347.
106. Santiso, J. and M. Burriel, Deposition and Characterisation of Epitaxial Oxide Thin Films for SOFCs. J. Solid State Electrochem., 2011. 15(5): p. 985-1006.
107. Sayle, T.X.T., M. Cantoni, U.M. Bhatta, S.C. Parker, S.R. Hall, G. Mobus, M. Molinari, D. Reid, S. Seal, and D.C. Sayle, Strain and Architecture-Tuned Reactivity in Ceria
Nanostructures; Enhanced Catalytic Oxidation of CO to CO2. Chem. Mater., 2012. 24(10): p. 1811-1821.
108. Solis, C., W. Jung, H.L. Tuller, and J. Santiso, Defect Structure, Charge Transport
Mechanisms, and Strain Effects in Sr(4)Fe(6)O(12+delta) Epitaxial Thin Films. Chem. Mater., 2010. 22(4): p. 1452-1461.
109. Kushima, A. and B. Yildiz, Oxygen Ion Diffusivity in Strained Yttria Stabilized Zirconia: Where is the Fastest Strain? J. Mater. Chem., 2010. 20(23): p. 4809-4819.
110. Kubicek, M., Z.H. Cai, W. Ma, B. Yildiz, H. Hutter, and J. Fleig, Tensile Lattice Strain
Accelerates Oxygen Surface Exchange and Diffusion in La1-xSrxCoO3-delta Thin Films. Acs Nano, 2013. 7(4): p. 3276-3286.
111. Kuru, Y., D. Marrocchelli, S.R. Bishop, D. Chen, B. Yildiz, and H.L. Tuller, Anomalous Chemical Expansion Behavior of Pr0.2Ce0.8O2-delta Thin Films Grown by Pulsed Laser Deposition. Journal of the Electrochemical Society, 2012. 159(11): p. F799-F803.
112. Bouwmeester, H.J.M., H. Kruidhof, and A.J. Burggraaf, Importance of the Surface Exchange Kinetics as Rate-Limiting Step in Oxygen Permeation through Mixed-
Conducting Oxides. Solid State Ionics, 1994. 72: p. 185-194.
113. Weppner, W. and R.A. Huggins, Determination of Kinetic and Thermodynamic Parameters of Mixed-Conducting Electrodes, and Application to System Li-Sb. Journal of
the Electrochemical Society, 1977. 124(3): p. C135-C135.
114. Leonhardt, M., R.A. De Souza, J. Claus, and J. Maier, Surface Kinetics of Oxygen
Incorporation into SrTiO3. Journal of the Electrochemical Society, 2002. 149(2): p. J19-J26.
153
115. Smith, J.B. and T. Norby, On the Steady-state Oxygen Permeation through La2NiO4+delta Membranes. Journal of the Electrochemical Society, 2006. 153(2): p.
A233-A238.
116. Jamnik, J. and J. Maier, Treatment of the Impedance of Mixed Conductors - Equivalent
Circuit Model and Explicit Approximate Solutions. J. Electrochem Soc., 1999. 146(11): p. 4183-4188.
117. De Souza, R.A. and J.A. Kilner, Oxygen Transport in La1-xSrxMn1-yCoyO3+/-[delta]
Perovskites: Part II. Oxygen Surface Exchange. Solid State Ionics, 1999. 126(1-2): p. 153-161.
118. tenElshof, J.E., M.H.R. Lankhorst, and H.J.M. Bouwmeester, Chemical Diffusion and
Oxygen Exchange of La0.6Sr0.4Co0.6Fe0.4O3-. Solid State Ionics, 1997. 99(1-2): p. 15-22.
119. Armstrong, E.N., K.L. Duncan, D.J. Oh, J.F. Weaver, and E.D. Wachsman, Determination of Surface Exchange Coefficients of LSM, LSCF, YSZ, GDC Constituent Materials in Composite SOFC Cathodes. J. Electrochem Soc., 2011. 158(5): p. B492-
B499.
120. Diethelm, S. and J. Van herle, Electrochemical Characterisation of Oxygen
Nonstoichiometry and Transport in Mixed Conducting Oxides - Application to La0.4Ba0.6Fe0.8Co0.2O3-delta. Solid State Ionics, 2004. 174(1-4): p. 127-134.
121. Katsuki, M., S. Wang, K. Yasumoto, and M. Dokiya, The Oxygen Transport in Gd-doped
Ceria. Solid State Ionics, 2002. 154–155(0): p. 589-595.
122. Noll, F., W. Munch, I. Denk, and J. Maier, SrTiO3 as a Prototype of a Mixed Conductor.
Conductivities, Oxygen Diffusion and Boundary Effects. Solid State Ionics, 1996. 86-8: p. 711-717.
123. Moreno, R., P. Garcia, J. Zapata, J. Roqueta, J. Chaigneau, and J. Santiso, Chemical
Strain Kinetics Induced by Oxygen Surface Exchange in Epitaxial Films Explored by Time-Resolved X-ray Diffraction. Chemistry of Materials, 2013. 25(18): p. 3640-3647.
124. Gellings, P.J. and H.J.M. Bouwmeester, The CRC Handbook of Solid State Electrochemistry. 1997, Boca Raton, FL: CRC Press, Inc.
125. Jamnik, J. and J. Maier, Treatment of the Impedance of Mixed Conductors - Equivalent
Circuit Model and Explicit Approximate Solutions. Journal of the Electrochemical Society, 1999. 146(11): p. 4183-4188.
126. Steele, B.C.H., Interfacial Reactions Associated with Ceramic Ion-Transport Membranes. Solid State Ionics, 1995. 75: p. 157-165.
127. Nicholas, J.D. and S.A. Barnett, Finite-Element Modeling of Idealized Infiltrated
Composite Solid Oxide Fuel Cell Cathodes. Journal of the Electrochemical Society, 2009. 156(4): p. B458-B464.

154
128. Crank, J., The Mathematics of Diffusion. 1975, Oxford, UK: Oxford University Press.
129. Yasuda, I. and T. Hikita, Precise Determination of The Chemical Diffusion Coefficient of
Calcium-Doped Lanthanum Chromites by Means of Electrical Conductivity Relaxation. Journal of the Electrochemical Society, 1994. 141(5): p. 1268-1273.
130. Kim, G., S. Wang, A.J. Jacobson, and C.L. Chen, Measurement of Oxygen Transport Kinetics in Epitaxial LaNiO4+delta Thin Films by Electrical Conductivity Relaxation. Solid State Ionics, 2006. 177(17-18): p. 1461-1467.
131. Kerman, K., C.H. Ko, and S. Ramanathan, Orientation Dependent Oxygen Exchange Kinetics on Single Crystal SrTiO3 Surfaces. Physical Chemistry Chemical Physics, 2012.
14(34): p. 11953-11960.
132. Ko, C.H., A. Karthikeyan, and S. Ramanathan, Studies on Oxygen Chemical Surface Exchange and Electrical Conduction in Thin Film Nanostructured Titania at High
Temperatures and Varying Oxygen Pressure. Journal of Chemical Physics, 2011. 134(1).
133. Diethelm, S., A. Closset, K. Nisancioglu, J. Van herle, A.J. McEvoy, and T.M. Gur,
Simultaneous Determination of Chemical Diffusion and Surface Exchange Coefficients of Oxygen by the Potential Step Technique. Journal of the Electrochemical Society, 1999. 146(7): p. 2606-2612.
134. Diethelm, S., A. Closset, J. Van herle, and K. Nisancioglu, Determination of chemical diffusion and surface exchange coefficients of oxygen by electrochemical impedance
spectroscopy. Journal of the Electrochemical Society, 2002. 149(11): p. E424-E432.
135. Bieger, T., J. Maier, and R. Waser, An Optical in-Situ Method to Study Redox-Kinetics in Srtio3. Berichte Der Bunsen-Gesellschaft-Physical Chemistry Chemical Physics, 1993.
97(9): p. 1098-1104.
136. Huang, P.N. and A. Petric, Superior Oxygen Ion Conductivity of Lanthanum Gallate
Doped with Strontium and Magnesium. Journal of the Electrochemical Society, 1996. 143(5): p. 1644-1648.
137. Yasuda, I. and M. Hishinuma, Electrical Conductivity and Chemical Diffusion
Coefficient of Strontium-doped Lanthanum Manganites. Journal of Solid State Chemistry, 1996. 123(2): p. 382-390.
138. Marina, O.A., N.L. Canfield, and J.W. Stevenson, Thermal, Electrical, and Electrocatalytical Properties of Lanthanum-doped Strontium Titanate. Solid State Ionics, 2002. 149(1-2): p. 21-28.
139. Kim, M.C., S.J. Park, H. Haneda, J. Tanaka, and S. Shirasaki, High-Temperature Electrical-Conductivity of La1-xSrxFeO3-Delta (x-Greater-Than-0.5). Solid State Ionics,
1990. 40-1: p. 239-243.

155
140. Mizusaki, J., M. Yoshihiro, S. Yamauchi, and K. Fueki, Nonstoichiometry and Defect Structure of the Perovskite-Type Oxides La1-Xsrxfeo3-Delta. Journal of Solid State
Chemistry, 1985. 58(2): p. 257-266.
141. Kilner, J.A. and R.J. Brook, A Study of Oxygen Ion Conductivity in Doped
Nonstoichiometric Oxides. Solid State Ionics, 1982. 6(3): p. 237-252.
142. Wang, L., R. Merkle, J. Maier, T. Acarturk, and U. Starke, Oxygen Tracer Diffusion in Dense Ba0.5Sr0.5Co0.8Fe0.2O3-delta Films. Applied Physics Letters, 2009. 94(7).
143. Zeng, P.Y., Z.H. Chen, W. Zhou, H.X. Gu, Z.P. Shao, and S.M. Liu, Re-evaluation of Ba0.5Sr0.5Co0.8Fe0.2O3-delta Perovskite as Oxygen Semi-permeable Membrane.
Journal of Membrane Science, 2007. 291(1-2): p. 148-156.
144. McIntosh, S., J.F. Vente, W.G. Haije, D.H.A. Blank, and H.J.M. Bouwmeester, Oxygen Stoichiometry and Chemical Expansion of Ba0.5Sr0.5Co0.8Fe0.2O3-δ Measured by in
Situ Neutron Diffraction. Chemistry of Materials, 2006. 18(8): p. 2187-2193.
145. Bucher, E., A. Egger, P. Ried, W. Sitte, and P. Holtappels, Oxygen Nonstoichiometry and
Exchange Kinetics of Ba0.5Sr0.5Co0.8Fe0.2O3-delta. Solid State Ionics, 2008. 179(21-26): p. 1032-1035.
146. van der Haar, L.M., M.W. den Otter, M. Morskate, H.J.M. Bouwmeester, and H.
Verweij, Chemical Diffusion and Oxygen Surface Transfer of La1-xSrxCoO3-delta Studied with Electrical Conductivity Relaxation. Journal of the Electrochemical Society,
2002. 149(3): p. J41-J46.
147. Wang, S., A. Verma, Y.L. Yang, A.J. Jacobson, and B. Abeles, The Effect of the Magnitude of the Oxygen Partial Pressure Change in Electrical Conductivity Relaxation
Measurements: Oxygen Transport Kinetics in La0.5Sr0.5CoO3-delta. Solid State Ionics, 2001. 140(1-2): p. 125-133.
148. Feng, Z.A., F. El Gabaly, X. Ye, Z.-X. Shen, and W.C. Chueh, Fast Vacancy-mediated Oxygen Ion Incorporation across the Ceria-gas Electrochemical Interface. Nat Commun, 2014. 5.
149. Imanishi, N., T. Matsumura, Y. Sumiya, K. Yoshimura, A. Hirano, Y. Takeda, D. Mori, and R. Kanno, Impedance Spectroscopy of Perovskite Air Electrodes for SOFC Prepared
by Laser Ablation Method. Solid State Ionics, 2004. 174(1-4): p. 245-252.
150. Yan, L., K.R. Balasubramaniam, S.L. Wang, H. Du, and P.A. Salvador, Effects of Crystallographic Orientation on the Oxygen Exchange Rate of La0.7Sr0.3MnO3 Thin
Films. Solid State Ionics, 2011. 194(1): p. 9-16.
151. Jin-Phillipp, N.Y., N. Sata, J. Maier, C. Scheu, K. Hahn, M. Kelsch, and M. Ruhle,
Structures of BaF2-CaF2 Heterolayers and their Influences on Ionic Conductivity. Journal of Chemical Physics, 2004. 120(5): p. 2375-2381.

156
152. Karthikeyan, A., C.L. Chang, and S. Ramanathan, High Temperature Conductivity Studies on Nanoscale Yttria-doped Zirconia Thin Films and Size Effects. Applied Physics
Letters, 2006. 89(18).
153. Kosacki, I., C.M. Rouleau, P.F. Becher, J. Bentley, and D.H. Lowndes, Surface Interface-
related Conductivity in Nanometer Thick YSZ Films. Electrochemical and Solid State Letters, 2004. 7(12): p. A459-A461.
154. Guo, X., W. Sigle, J. Fleig, and J. Maier, Role of Space Charge in the Grain Boundary
Blocking Effect in Doped Zirconia. Solid State Ionics, 2002. 154: p. 555-561.
155. Guo, X., W. Sigle, and J. Maier, Blocking Grain Boundaries in Yttria-doped and
Undoped Ceria Ceramics of High Purity. Journal of the American Ceramic Society, 2003. 86(1): p. 77-87.
156. Sase, M., J. Suzuki, K. Yashiro, T. Otake, A. Kaimai, T. Kawada, J. Mizusaki, and H.
Yugami, Electrode Reaction and Microstructure of La0.6Sr0.4CoO3-delta Thin Films. Solid State Ionics, 2006. 177(19-25): p. 1961-1964.
157. Mavrikakis, M., B. Hammer, and J.K. Norskov, Effect of Strain on the Reactivity of Metal Surfaces. Physical Review Letters, 1998. 81(13): p. 2819-2822.
158. Suntivich, J., H.A. Gasteiger, N. Yabuuchi, H. Nakanishi, J.B. Goodenough, and Y.
Shao-Horn, Design Principles for Oxygen-Reduction Activity on Perovskite Oxide Catalysts for Fuel Cells and Metal-Air Batteries. Nature Chemistry, 2011. 3(7): p. 546-
550.
159. Lee, Y.L., J. Kleis, J. Rossmeisl, Y. Shao-Horn, and D. Morgan, Prediction of solid oxide fuel cell cathode activity with first-principles descriptors. Energy & Environmental
Science, 2011. 4(10): p. 3966-3970.
160. Jung, W. and H.L. Tuller, A New Model Describing Solid Oxide Fuel Cell Cathode
Kinetics: Model Thin Film SrTi1-xFexO3-d Mixed Conducting Oxides-a Case Study. Advanced Energy Materials, 2011. 1(6): p. 1184-1191.
161. Swallow, J.G., W.H. Woodford, Y. Chen, Q. Lu, J.J. Kim, D. Chen, Y.M. Chiang, W.C.
Carter, B. Yildiz, H.L. Tuller, and K.J. Van Vliet, Chemomechanics of ionically conductive ceramics for electrical energy conversion and storage. Journal of
Electroceramics, 2014. 32(1): p. 3-27.
162. Chu, M., Y.K. Sun, U. Aghoram, and S.E. Thompson, Strain: A Solution for Higher Carrier Mobility in Nanoscale MOSFETs. Annu. Rev. Mater. Res., 2009. 39: p. 203-229.
163. Baykan, M.O., S.E. Thompson, and T. Nishida, Strain Effects on Three-Dimensional, Two-Dimensional, and One-Dimensional Silicon Logic Devices: Predicting the Future of
Strained Silicon. J. Appl. Phys., 2010. 108(9): p. 093716-1 - 093716-24.

157
164. Kim, S., M. Yokoyama, N. Taoka, R. Nakane, T. Yasuda, O. Ichikawa, N. Fukuhara, M. Hata, M. Takenaka, and S. Takagi, Strained In0.53Ga0.47As Metal-Oxide-Semiconductor
Field-Effect Transistors with Epitaxial Based Biaxial Strain. Appl. Phys. Lett., 2012. 100(19): p. 193510-1 - 193510-3.
165. Cai, Z.H., Y. Kuru, J.W. Han, Y. Chen, and B. Yildiz, Surface Electronic Structure Transitions at High Temperature on Perovskite Oxides: The Case of Strained La0.8Sr0.2CoO3 Thin Films. Journal of the American Chemical Society, 2011. 133(44):
p. 17696-17704.
166. Han, J.W. and B. Yildiz, Enhanced one Dimensional Mobility of Oxygen on Strained
LaCoO3 (001) Surface. Journal of Materials Chemistry, 2011. 21(47): p. 18983-18990.
167. Sillassen, M., P. Eklund, N. Pryds, E. Johnson, U. Helmersson, and J. Bottiger, Low-Temperature Superionic Conductivity in Strained Yttria-Stabilized Zirconia. Advanced
Functional Materials, 2010. 20(13): p. 2071-2076.
168. Li, B., J.M. Zhang, T. Kaspar, V. Shutthanandan, R.C. Ewing, and J. Lian, Multilayered
YSZ/GZO Films with Greatly Enhanced Ionic Conduction for Low Temperature Solid Oxide Fuel Cells. Physical Chemistry Chemical Physics, 2013. 15(4): p. 1296-1301.
169. Bhatia, S. and B.W. Sheldon, Compositional Stresses in Polycrystalline Titania Films. J.
Am. Cer. Soc., 2008. 91(12): p. 3986-3993.
170. Sheldon, B.W., S. Mandowara, and J. Rankin, Grain Boundary Induced Compositional
Stress in Nanocrystalline Ceria Films. Solid State Ionics, 2013. 233(0): p. 38-46.
171. Freund, L.B. and S. Suresh, Thin Film Materials: Stress, Defect Formation and Surface Evolution. 2003, New York, NY: Cambridge University Press.
172. Kimura, Y., T. Kushi, S.- i. Hashimoto, K. Amezawa, and T. Kawada, Influences of Temperature and Oxygen Partial Pressure on Mechanical Properties of La0.6Sr0.4Co1-
yFeyO3-. Journal of the American Ceramic Society, 2012. 95(8): p. 2608-2613.
173. Kuhn, M., S. Hashimoto, K. Sato, K. Yashiro, and J. Mizusaki, Thermo-chemical Lattice
Expansion in La0.6Sr0.4Co1-yFeyO3-δ. Solid State Ionics, 2013. 241(0): p. 12-16.
174. Messerschmidt, U., D. Baither, B. Baufeld, and M. Bartsch, Plastic Deformation of Zirconia Single Crystals: A Review. Materials Science and Engineering A-Structural
Materials Properties Microstructure and Processing, 1997. 233(1-2): p. 61-74.
175. Wang, Y., K. Duncan, E.D. Wachsman, and F. Ebrahimi, The Effect of Oxygen Vacancy
Concentration on the Elastic Modulus of Fluorite-Structured Oxides. Solid State Ionics, 2007. 178(1-2): p. 53-58.
176. Ganeshananthan, R. and A.V. Virkar, Measurement of surface exchange coefficient on
porous La0.6Sr0.4CoO3-delta samples by conductivity relaxation. Journal of The Electrochemical Society, 2005. 152(8): p. A1620-A1628.

158
177. Ganeshananthan, R. and A.V. Virkar, Measurement of Surface Exchange Coefficient on
Porous La0.6Sr0.4CoO3- Samples by Conductivity Relaxation. Journal of the
Electrochemical Society, 2005. 152(8): p. A1620-A1628.
178. Freund, L.B. and S. Suresh, Thin Film Materials: Stress, Defect Formation, and Surface
Evolution. 2003, New York, NY: Cambridge University Press. xviii, 750 p.
179. Yan, L., K.R. Balasubramaniam, S. Wang, H. Du, and P.A. Salvador, Effects of
Crystallographic Orientation on the Oxygen Exchange Rate of La0.7Sr0.3MnO3 Thin Films. Solid State Ionics, 2011. 194(1): p. 9-16.
180. Kim, S., S. Wang, X. Chen, Y.L. Yang, N. Wu, A. Ignatiev, A.J. Jacobson, and B.
Abeles, Oxygen Surface Exchange in Mixed Ionic Electronic Conductors: Application La0.5Sr0.5Fe0.8Ga0.2O3-delta. Journal of the Electrochemical Society, 2000. 147(6): p.
2398-2406.
181. den Otter, M.W., H.J.M. Bouwmeester, B.A. Boukamp, and H. Verweij, Reactor Flush Time Correction in Relaxation Experiments. Journal of the Electrochemical Society,
2001. 148(2): p. J1-J6.
182. Karthikeyan, A. and S. Ramanathan, Oxygen Surface Exchange Studies in Thin Film Gd-
doped Ceria. Applied Physics Letters, 2008. 92(24): p. 243109-1 - 243109-3.
183. Yang, Q., R.R. Lunt, and J.D. Nicholas, Low Temperature Lanthanum Strontium Ferrite Thin Film Stress and Oxygen Surface Exchange Coefficient Measurements. ECS
Transactions, 2013. 58(3): p. 37-46.
184. Klein, C.A., How Accurate are Stoney's Equation and Recent Modifications. Journal of
Applied Physics, 2000. 88(9): p. 5487-5489.
185. Kushi, T., K. Sato, A. Unemoto, S. Hashimoto, K. Amezawa, and T. Kawada, Elastic Modulus and Internal Friction of SOFC Electrolytes at High Temperatures under
Controlled Atmospheres. Journal of Power Sources, 2011. 196(19): p. 7989-7993.
186. Alben, S., B. Balakrisnan, and E. Smela, Edge Effects Determine the Direction of Bilayer
Bending. Nano Letters, 2011. 11(6): p. 2280-2285.
187. Meyer, S.L., Data Analysis for Scientists and Engineers. 1992: Peer Management Consultants, Limited.
188. Chick, L.A., L.R. Pederson, G.D. Maupin, J.L. Bates, L.E. Thomas, and G.J. Exarhos, Glycine-Nitrate Combustion Synthesis of Oxide Ceramic Powders. Materials Letters,
1990. 10: p. 6-12.
189. Eason, R., Pulsed Laser Deposition of Thin Films: Applications-led Growth of Functional Materials. 2007: Wiley-Interscience.

159
190. Kremer, J.R., D.N. Mastronarde, and J.R. McIntosh, Computer Visualization of Three-dimensional Image Data Using IMOD. Journal of Structural Biology, 1996. 116(1): p.
71-76.
191. Ritter, M. and P.A. Midgley, A Practical Approach to Test the Scope of FIB-SEM 3D
Reconstruction. Journal of Physics: Conference Series, 2010. 241(1): p. 012081.
192. Brandon, D. and W.D. Kaplan, Microstructural Characterization of Materials. 2008: Wiley.
193. Fossdal, A., M. Menon, I. Waernhus, K. Wiik, M.A. Einarsrud, and T. Grande, Crystal Structure and Thermal Expansion of La1-xSrxFeO3-delta. Journal of the American
Ceramic Society, 2004. 87(10): p. 1952-1958.
194. Kuhn, M., S. Hashimoto, K. Sato, K. Yashiro, and J. Mizusaki, Oxygen Nonstoichiometry, Thermo-chemical Stability and Lattice Expansion of La0.6Sr0.4FeO3-
delta. Solid State Ionics, 2011. 195(1): p. 7-15.
195. Kharton, V.V., A.A. Yaremchenko, M.V. Patrakeev, E.N. Naumovich, and F.M.B.
Marques, Thermal and Chemical Induced Expansion of La0.3Sr0.7(Fe,Ga)O3-delta Ceramics. Journal of the European Ceramic Society, 2003. 23(9): p. 1417-1426.
196. Sagdahl, L.T., M.-A. Einarsrud, and T. Grande, Sintering Behaviour of
La1−xSrxFeO3−δ Mixed Conductors. Journal of the European Ceramic Society, 2006. 26(16): p. 3665-3673.
197. Bahteeva, J.A., I.A. Leonidov, M.V. Patrakeev, E.B. Mitberg, V.L. Kozhevnikov, and K.R. Poeppelmeier, High-temperature Ion Transport in La1-xSrxFeO3-delta. Journal of Solid State Electrochemistry, 2004. 8(9): p. 578-584.
198. Jacobson, A.J., Materials for Solid Oxide Fuel Cells. Chemistry of Materials, 2010. 22(3): p. 660-674.
199. Bongio, E.V., H. Black, F.C. Raszewski, D. Edwards, C.J. McConville, and V.R.W. Amarakoon, Microstructural and High-temperature Electrical Characterization of La1-xSrxFeO3-delta. Journal of Electroceramics, 2005. 14(3): p. 193-198.
200. Kuhn, M., S. Hashimoto, K. Sato, K. Yashiro, and J. Mizusaki, Oxygen Nonstoichiometry, Thermo-chemical Stability and Lattice Expansion of La0.6Sr0.4FeO3-δ.
Solid State Ionics, 2011. 195(1): p. 7-15.
201. Dann, S.E., D.B. Currie, M.T. Weller, M.F. Thomas, and A.D. Alrawwas, The Effect of Oxygen Stoichiometry on Phase-Relations and Structure in the System La1-Xsrxfeo3-
Delta (0-Less-Than-or-Equal-to-X-Less-Than-or-Equal-to-1, 0-Less-Than-or-Equal-to-Delta-Less-Than-or-Equal-to-0.5). Journal of Solid State Chemistry, 1994. 109(1): p.
134-144.

160
202. Simner, S.P., J.P. Shelton, M.D. Anderson, and J.W. Stevenson, Interaction between La(Sr)FeO3 SOFC Cathode and YSZ Electrolyte. Solid State Ionics, 2003. 161(1-2): p.
11-18.
203. Yang, Q., T.E. Burye, R.R. Lunt, and J.D. Nicholas, In Situ Oxygen Surface Exchange
Coefficient Measurements on Lanthanum Strontium Ferrite Thin Films via a New Curvature Relaxation Method. Solid State Ionics, 2013.
204. Chevalier, J., L. Gremillard, A.V. Virkar, and D.R. Clarke, The Tetragonal-Monoclinic
Transformation in Zirconia: Lessons Learned and Future Trends. Journal of the American Ceramic Society, 2009. 92(9): p. 1901-1920.
205. Selçuk, A., G. Merere, and A. Atkinson, The Influence of Electrodes on the Strength of Planar Zirconia Solid Oxide Fuel Cells. Journal of Materials Science, 2001. 36(5): p. 1173-1182.
206. Kim, G., S. Wang, A.J. Jacobson, and C.L. Chen, Measurement of Oxygen Transport
Kinetics in Epitaxial La2NiO4+ Thin Films by Electrical Conductivity Relaxation. Solid
State Ionics, 2006. 177(17-18): p. 1461-1467.
207. Sheldon, B.W., S. Mandowara, and J. Rankin, Grain Boundary Induced Compositional
Stress in Nanocrystalline Ceria Films. Solid State Ionics, 2013. 233: p. 38-46.
208. Mosleh, M., M. Sogaard, and P.V. Hendriksen, Kinetics and Mechanisms of Oxygen
Surface Exchange on La0.6Sr0.4FeO3- Thin Films. Journal of the Electrochemical Society,
2009. 156(4): p. B441-B457.
209. Orlovskaya, N., H. Anderson, M. Brodnikovskyy, M. Lugovy, and M.J. Reece, Inelastic
Deformation Behavior of La0.6Sr0.4FeO3 Perovskite. Journal of Applied Physics, 2006. 100(2).
210. Araki, W. and J. Malzbender, Ferroelastic Deformation of La0.58Sr0.4Co0.2Fe0.8O3-delta under Uniaxial Compressive Loading. Journal of the European Ceramic Society, 2013. 33(4): p. 805-812.
211. Araki, W. and J. Malzbender, Electrical Conductivity of La0.58Sr0.4Co0.2Fe0.8O3-delta during Ferroelastic Deformation under Uniaxial Compressive Loading. Solid State
Ionics, 2013. 233: p. 67-72.
212. Williamson, G.K. and W.H. Hall, X-ray Line Broadening from Filed Aluminium and Wolfram. Acta Metallurgica, 1953. 1(1): p. 22-31.
213. Lussier, A., J. Dvorak, S. Stadler, J. Holroyd, M. Liberati, E. Arenholz, S.B. Ogale, T. Wu, T. Venkatesan, and Y.U. Idzerda, Stress Relaxation of La1/2Sr1/2MnO3 and
La2/3Ca1/3MnO3 at Solid Oxide Fuel Cell Interfaces. Thin Solid Films, 2008. 516(6): p. 880-884.
161
214. Sillassen, M., P. Eklund, N. Pryds, E. Johnson, U. Helmersson, and J. Bottiger, Low-Temperature Superionic Conductivity in Strained Yttria-Stabilized Zirconia (vol 20, pg
2071, 2010). Advanced Functional Materials, 2010. 20(19): p. 3194-3194.
215. Selcuk, A., G. Merere, and A. Atkinson, The influence of electrodes on the strength of
planar zirconia solid oxide fuel cells. Journal of Materials Science, 2001. 36(5): p. 1173-1182.
216. Chen, Y., W. Jung, Z.H. Cai, J.J. Kim, H.L. Tuller, and B. Yildiz, Impact of Sr
Segregation on the Electronic Structure and Oxygen Reduction Activity of SrTi1-xFexO3 Surfaces. Energy & Environmental Science, 2012. 5(7): p. 7979-7988.
217. Fister, T.T., D.D. Fong, J.A. Eastman, P.M. Baldo, M.J. Highland, P.H. Fuoss, K.R. Balasubramaniam, J.C. Meador, and P.A. Salvador, In Situ Characterization of Strontium Surface Segregation in Epitaxial La(0.7)Sr(0.3)MnO(3) Thin Films as a Function of
Oxygen Partial Pressure. Applied Physics Letters, 2008. 93(15).
218. Fischer, E. and J.L. Hertz, Measurability of the Diffusion and Surface Exchange
Coefficients using Isotope Exchange with Thin Film and Traditional Samples. Solid State Ionics, 2012. 218: p. 18-24.
219. Jung, W. and H.L. Tuller, Investigation of Surface Sr Segregation in Model Thin Film
Solid Oxide Fuel Cell Perovskite Electrodes. Energy & Environmental Science, 2012. 5(1): p. 5370-5378.
220. Yang, Q., T.E. Burye, R.R. Lunt, and J.D. Nicholas, In situ Oxygen Surface Exchange Coefficient Measurements on Lanthanum Strontium Ferrite Thin Films via the Curvature Relaxation Method. Solid State Ionics, 2013. 249–250(0): p. 123-128.
221. Yang, Q. and J.D. Nicholas, Porous Thick Film Lanthanum Strontium Ferrite Stress and Oxygen Surface Exchange Bilayer Curvature Relaxation Measurements. Journal of the
Electrochemical Society, 2014. Accepted.
222. Chen, Z.W., X. Wang, V. Bhakhri, F. Giuliani, and A. Atkinson, Nanoindentation of Porous Bulk and Thin Films of La0.6Sr0.4Co0.2Fe0.8O3-delta. Acta Materialia, 2013.
61(15): p. 5720-5734.
223. Lipinska-Chwalek, M., F. Schulze-Kuppers, and J. Malzbender, Stability Aspects of
Porous Ba0.5Sr0.5Co0.8Fe0.2O3-delta. Ceramics International, 2014. 40(5): p. 7395-7399.
224. Selcuk, A. and A. Atkinson, Elastic Properties of Ceramic Oxides Used in Solid Oxide
Fuel Cells (SOFC). Journal of the European Ceramic Society, 1997. 17(12): p. 1523-1532.
225. Fan, X., E.D. Case, Q. Yang, and J.D. Nicholas, Room Temperature Elastic Properties of Gadolinia-doped Ceria as a Function of Porosity. Ceramics International, 2013. 39(6): p. 6877-6886.

162
226. Kimura, Y., T. Kushi, S.- i. Hashimoto, K. Amezawa, and T. Kawada, Influences of Temperature and Oxygen Partial Pressure on Mechanical Properties of
La0.6Sr0.4Co1−yFeyO3−δ. Journal of the American Ceramic Society, 2012. 95(8): p. 2608-2613.
227. Bhatia, S. and B.W. Sheldon, Compositional Stresses in Polycrystalline Titania Films. Journal of the American Ceramic Society, 2008. 91(12): p. 3986-3993.
228. Yasuda, I. and T. Hikita, Precise Determination of the Chemical Diffusion Coefficient of
Calcium‐Doped Lanthanum Chromites by Means of Electrical Conductivity Relaxation.
Journal of the Electrochemical Society, 1994. 141(5): p. 1268-1273.