Embed Size (px)
Citation preview
Fracture Mechanics of Concrete and Concrete Structures -Recent Advances in Fracture Mechanics of Concrete - B. H. Oh, et al.(eds)
ⓒ 2010 Korea Concrete Institute, Seoul, ISBN 978-89-5708-180-8
Surface energy and fracture energy
F. H. Wittmann
Aedificat Institute Freiburg, Germany, and Qingdao Technological University, Qingdao, China
Z. Sun
Qingdao Technological University, Qingdao, China; now Binzhou Finance Bureau, Binzhou, China
T. Zhao
Qingdao Technological University, Qingdao, China
ABSTRACT: Properties of cement-based materials are governed by their nano-structure in general and by the interaction between the surfaces of the nano-particles with their hygral surrounding in particular. In this con-tribution local damage and nano-crack formation in the three-dimensional network of nano-particles is con-sidered to be at the origin of crack formation. Macroscopic fracture energy can be considered to be the sum of a huge number of small energies consumed by nano-crack formation. Considering the physical process of nano-crack formation it is possible to predict the influence of variable environments on fracture energy. This hypothesis is verified by experimental investigations. The influence of aqueous NaCl solutions on strength, fracture energy and swelling has been determined. It is shown that values of fracture energy as determined in the laboratory are not conservative if applied for prediction of crack formation of reinforced concrete struc-tures situated in marine environment. This fact is of major importance for durability and service life of rein-forced concrete structures in marine environment.
1 INTRODUCTION
Fracture energy of different types of concrete has been measured by many authors by different tech-niques, and for many years by now (see for example Carpinteri et al. 2007). In the literature there are var-ious standard test methods described such as direct tension test, three point and four point bending test, and wedge splitting test, which all may serve to de-termine fracture energy experimentally. In the ficti-tious crack model by Hillerborg (Hillerborg et al. 1976, Hillerborg 1985) fracture energy of concrete is introduced in a phenomenological way. The overall energy consumed by crack formation in sufficiently large specimens is considered to be a material prop-erty. Crack formation induced by shrinkage for in-stance can be predicted with this approach in a real-istic way (Alvaredo 1994). In this global approach, however, physical processes involved in crack for-mation are neglected. For this reason the influence of changes of the environment on fracture energy cannot be taken into consideration directly and quan-titatively. If a global approach is used, it is not clear and not of primary interest to know precisely what happens in the fracture process zone when a crack is propagating.
Conventional concrete is a composite material with mineral aggregates embedded in a cement-
based matrix. Most characteristic properties such as shrinkage or swelling and compressive or tensile strength are governed by the nano-structure built up by hydration products of cement. When a load is ap-plied to the three-dimensional framework of nano-particles, a complex state of stress with local stress concentrations is built up. At sites where the stresses are above the local load bearing capacity, damage will occur by nano-crack formation. This process progressive damage leading to macroscopic cracks can be modeled numerically.
In this contribution the macroscopically observed fracture energy shall be linked with the elementary processes in the nano-structure. It will be shown that in this way it is possible to describe the influence of chemical composition of the pore solution on strength, fracture energy, and shrinkage or swelling at least phenomenologically.
2 FUNDAMENTALS
In a homogeneous ideal brittle material the Griffith criterion can be applied to describe crack formation. If we consider a nano-crack in the xerogel of the hardened cement paste with the length of 2c the crit-ical stress σ is given by the following equation:
2E
c
γσ
π=
(1)
In Equation (1) E stands for the elastic modulus
of the material around the crack and γ is the surface energy and at the same time the fracture energy on the nano-scale. Formation of one nano-crack can be considered to be the elementary step of accumula-tion of damage and finally crack formation. To cre-ate a macroscopic crack a huge number of nano-cracks have to be formed first.
If an external load is applied, early nano-cracks are formed at a macroscopic stress as low as one third of the load bearing capacity. With increasing load more and more cracks are formed and the length of existing cracks increases (see for example Zaitsev & Wittmann 1981). This process induces damage to the material, which can be observed by a gradual decrease of the stiffness or by increased cap-illary absorption (see for example Wittmann et al. 2006). Once the maximum stress is reached the den-sity of nano-cracks is high enough and micro-cracks are formed by coalescence of nano-cracks. The den-sity of nano and micro-cracks is particularly large in the so-called fracture process zone where the macro-scopic crack will be formed finally.
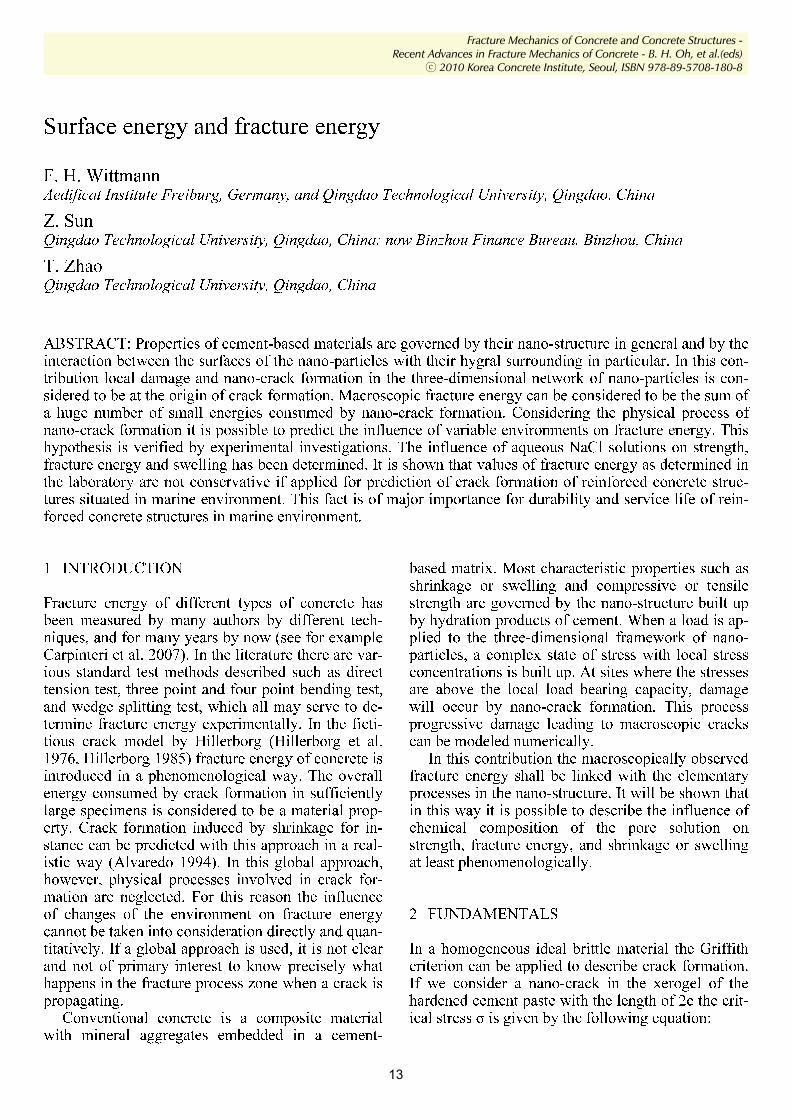
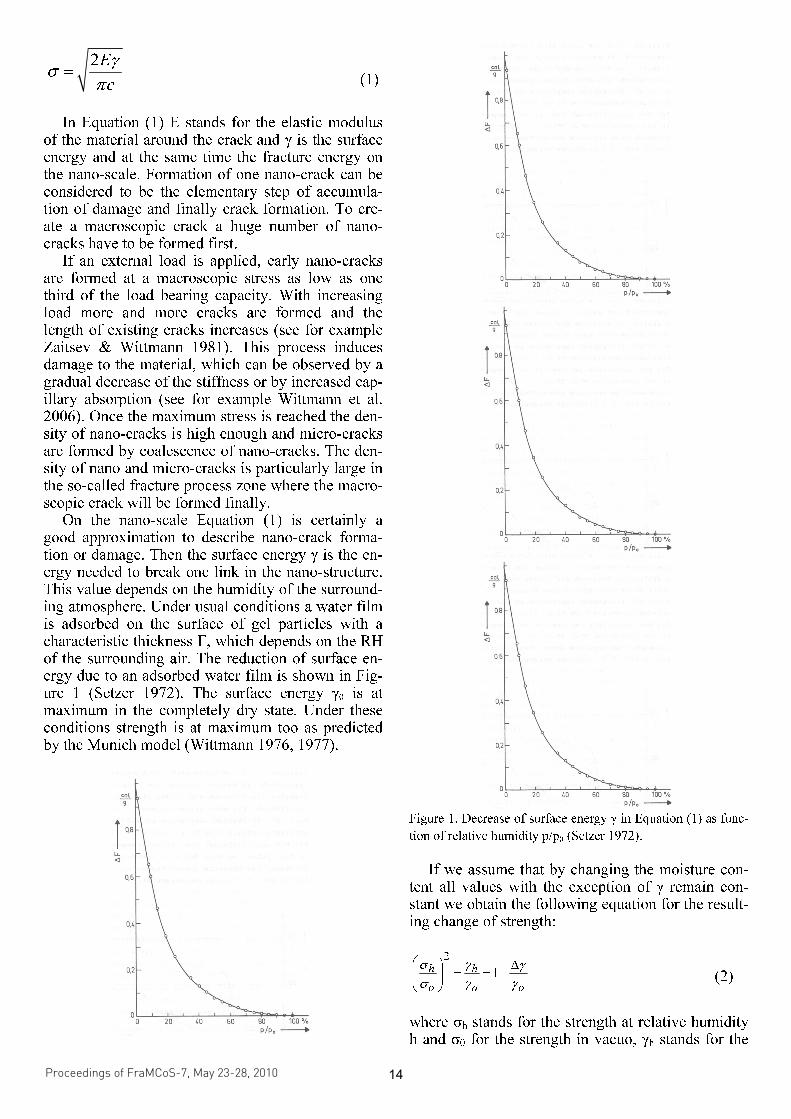
On the nano-scale Equation (1) is certainly a good approximation to describe nano-crack forma-tion or damage. Then the surface energy γ is the en-ergy needed to break one link in the nano-structure. This value depends on the humidity of the surround-ing atmosphere. Under usual conditions a water film is adsorbed on the surface of gel particles with a characteristic thickness Γ, which depends on the RH of the surrounding air. The reduction of surface en-ergy due to an adsorbed water film is shown in Fig-ure 1 (Setzer 1972). The surface energy γ0 is at maximum in the completely dry state. Under these conditions strength is at maximum too as predicted by the Munich model (Wittmann 1976, 1977).
Figure 1. Decrease of surface energy γ in Equation (1) as func-
tion of relative humidity p/p0 (Setzer 1972).
If we assume that by changing the moisture con-
tent all values with the exception of γ remain con-stant we obtain the following equation for the result-ing change of strength:
2
1h h
o o o
σ γ γ
σ γ γ
⎛ ⎞ ∆= = −⎜ ⎟
⎝ ⎠ (2)
where σh stands for the strength at relative humidity h and σ0 for the strength in vacuo, γh stands for the
Proceedings of FraMCoS-7, May 23-28, 2010
hThD ∇−= ),(J (1)
The proportionality coefficient D(h,T) is called moisture permeability and it is a nonlinear function of the relative humidity h and temperature T (Bažant & Najjar 1972). The moisture mass balance requires that the variation in time of the water mass per unit volume of concrete (water content w) be equal to the divergence of the moisture flux J
J•∇=∂
∂−
t
w (2)
The water content w can be expressed as the sum
of the evaporable water we (capillary water, water vapor, and adsorbed water) and the non-evaporable (chemically bound) water wn (Mills 1966, Pantazopoulo & Mills 1995). It is reasonable to assume that the evaporable water is a function of relative humidity, h, degree of hydration, αc, and degree of silica fume reaction, αs, i.e. we=we(h,αc,αs) = age-dependent sorption/desorption isotherm (Norling Mjonell 1997). Under this assumption and by substituting Equation 1 into Equation 2 one obtains
nscw
s
ew
c
ew
hh
Dt
h
h
ew
&&& ++∂
∂
∂
∂
=∇•∇+∂
∂
∂
∂
− αα
αα
)(
(3)
where ∂we/∂h is the slope of the sorption/desorption isotherm (also called moisture capacity). The governing equation (Equation 3) must be completed by appropriate boundary and initial conditions.
The relation between the amount of evaporable water and relative humidity is called ‘‘adsorption isotherm” if measured with increasing relativity humidity and ‘‘desorption isotherm” in the opposite case. Neglecting their difference (Xi et al. 1994), in the following, ‘‘sorption isotherm” will be used with reference to both sorption and desorption conditions. By the way, if the hysteresis of the moisture isotherm would be taken into account, two different relation, evaporable water vs relative humidity, must be used according to the sign of the variation of the relativity humidity. The shape of the sorption isotherm for HPC is influenced by many parameters, especially those that influence extent and rate of the chemical reactions and, in turn, determine pore structure and pore size distribution (water-to-cement ratio, cement chemical composition, SF content, curing time and method, temperature, mix additives, etc.). In the literature various formulations can be found to describe the sorption isotherm of normal concrete (Xi et al. 1994). However, in the present paper the semi-empirical expression proposed by Norling Mjornell (1997) is adopted because it
explicitly accounts for the evolution of hydration reaction and SF content. This sorption isotherm reads
( ) ( )( )
( ) ( )⎥⎥
⎦
⎤
⎢⎢
⎣
⎡
⎥⎥⎥
⎦
⎤
⎢⎢⎢
⎣
⎡
−
−∞
+
−∞
−=
1110
,1
110
11,
1,,
hcc
ge
scK
hcc
ge
scG
sch
ew
αα
αα
αα
αααα
(4)
where the first term (gel isotherm) represents the physically bound (adsorbed) water and the second term (capillary isotherm) represents the capillary water. This expression is valid only for low content of SF. The coefficient G1 represents the amount of water per unit volume held in the gel pores at 100% relative humidity, and it can be expressed (Norling Mjornell 1997) as
( ) ss
s
vgkc
c
c
vgk
scG αααα +=,1
(5)
where k
cvg and k
svg are material parameters. From the
maximum amount of water per unit volume that can fill all pores (both capillary pores and gel pores), one can calculate K1 as one obtains
( )1
110
110
11
22.0188.00
,1
−⎟⎠
⎞⎜⎝
⎛−∞
⎥⎥⎥
⎦
⎤
⎢⎢⎢
⎣
⎡⎟⎠
⎞⎜⎝
⎛−∞
−−+−
=
hcc
ge
hcc
geGs
ssc
w
scK
αα
αα
αα
αα
(6)
The material parameters k
cvg and k
svg and g1 can
be calibrated by fitting experimental data relevant to free (evaporable) water content in concrete at various ages (Di Luzio & Cusatis 2009b).
2.2 Temperature evolution
Note that, at early age, since the chemical reactions associated with cement hydration and SF reaction are exothermic, the temperature field is not uniform for non-adiabatic systems even if the environmental temperature is constant. Heat conduction can be described in concrete, at least for temperature not exceeding 100°C (Bažant & Kaplan 1996), by Fourier’s law, which reads
T∇−= λq (7)
where q is the heat flux, T is the absolute temperature, and λ is the heat conductivity; in this
surface energy at relative humidity h and γ0 the surface energy in vacuo, ∆γ is the change of surface energy.
The Munich model also predicts a length chance if the moisture content changes (Wittmann 1976, 1977). The length change ∆l of a specimen with length l0 can be described by means of the Bangham equation (Bangham & Fakhoury and Bangham & Razouk):
( )o
o h
l
lλ γ γ
∆= − (3)
where λ is a material constant, which takes the stiff-ness of the material into consideration. By combin-ing Equation (1) and Equation (3) we obtain:
2 1( ) 1h
o o o
l
l
σ
σ λγ
∆= − (4)
That means that the square of the related strength
is linearly related to swelling. These relations are applicable to nano-porous materials in the range of RH < 60 %. In this range strength as well as swell-ing or shrinkage are controlled essentially by the change of surface energy. At higher relative humid-ity disjoining pressure dominates and should be taken into consideration separately (Wittmann 1976).
So far we have considered formation of one sin-gle nano-crack in hardened cement paste. When the density of nano-cracks becomes high enough micro-cracks are formed and finally macro-cracks. The en-ergy necessary to form a macro-crack is obviously the sum of all nano-cracks which are necessary to be formed before failure. The Griffith criterion is not applicable in its simple from given by Equation (1) to cement based composite materials. But still sur-face energy γ is at the origin of all the elementary processes leading to crack formation. The sum of all small quantities of surface energy needed to form the huge number of nano-cracks necessary to create a real crack finally is the macroscopic fracture energy, which we determine with experimental methods.
Based on these considerations we can state that adsoption of water in the nano-structure reduces sur-face energy of gel particles and in an indirect way fracture energy as measured on the macro-scale. In marine environment salt water can penetrate into the pore space of concrete. As seawater and salt water in general have a higher surface energy as compared to water, we may expect that salt water and seawater reduce strength even more than pure water. In gen-eral strength and hygral length chance depend on the chemical composition of the pore solution.
3 EXPERIMENTAL
Preliminary results have been published recently
(Wittmann et al. 2007). In this contribution new re-sults shall be presented to broaden the experimental basis, which serves as verification of the above de-scribed relations.
Tests have been carried out on concrete and mor-tar specimens. For concrete broken natural gravel with a maximum diameter of 20 mm and local river sand with a maximum diameter of 5 mm were used. In order to obtain good workability 1% of a plasti-cizer related to the mass of cement was added. Ordi-nary Portland cement type 32.5 was used through-out. The composition of concrete is given in Table 1.
Table 1. Composition of concrete in kg/m3.
Cement Gravel Sand Water W/C
320 1267 653 160 0.5
Table 2. Composition of mortar in kg/m3.
Cement Sand Water W/C
450 1350 225 0.5
Two types of concrete specimens have been pre-
pared: (a) slabs with the dimensions of 400 x 400 x 36 mm for wedge splitting tests (WST) and (b) beams with the dimensions of 100 x 100 x 510 mm for three point bending tests (3PB). For tests to de-termine compressive strength cubes with an edge length of 200 mm have been cast.
In addition mortar with a maximum aggregate size of 5 mm has been prepared using the same type of cement. The composition of the mortar is indi-cated in Table 2. From the mortar the following two types of specimens have been produced: (a) slabs with the dimensions 400 x 400 x 36 mm for wedge splitting tests and standard prisms with the dimen-sions 40 x 40 x 160 mm for three-point bending tests. On the two ends obtained by three-point bend-ing compressive strength of mortar has been deter-mined.
All specimens were allowed to harden for 28 days in a humid chamber at T = 20 ± 2 °C and RH > 95 %. At the age of 28 days compressive strength and fracture energy have been determined. Part of the specimens was then dried in a ventilated oven at 105 °C for 14 days. At that time constant weight had been achieved. After cooling down to room tempera-ture fracture energy has been determined again. Oth-er samples were allowed to absorb water vapour af-ter drying. They were placed in the laboratory atmosphere, which can be characterized by 20 °C and 75 % RH for at least two months. Other pre-dried samples were placed in liquid water or in sea-water for 14 days. Then fracture energy has been de-termined by wedge splitting test and by three-point bending.
Similar tests have been run on mortar specimen. But on the standard prisms made of mortar hygral swelling was measured in addition.
Proceedings of FraMCoS-7, May 23-28, 2010
hThD ∇−= ),(J (1)
The proportionality coefficient D(h,T) is called moisture permeability and it is a nonlinear function of the relative humidity h and temperature T (Bažant & Najjar 1972). The moisture mass balance requires that the variation in time of the water mass per unit volume of concrete (water content w) be equal to the divergence of the moisture flux J
J•∇=∂
∂−
t
w (2)
The water content w can be expressed as the sum
of the evaporable water we (capillary water, water vapor, and adsorbed water) and the non-evaporable (chemically bound) water wn (Mills 1966, Pantazopoulo & Mills 1995). It is reasonable to assume that the evaporable water is a function of relative humidity, h, degree of hydration, αc, and degree of silica fume reaction, αs, i.e. we=we(h,αc,αs) = age-dependent sorption/desorption isotherm (Norling Mjonell 1997). Under this assumption and by substituting Equation 1 into Equation 2 one obtains
nscw
s
ew
c
ew
hh
Dt
h
h
ew
&&& ++∂
∂
∂
∂
=∇•∇+∂
∂
∂
∂
− αα
αα
)(
(3)
where ∂we/∂h is the slope of the sorption/desorption isotherm (also called moisture capacity). The governing equation (Equation 3) must be completed by appropriate boundary and initial conditions.
The relation between the amount of evaporable water and relative humidity is called ‘‘adsorption isotherm” if measured with increasing relativity humidity and ‘‘desorption isotherm” in the opposite case. Neglecting their difference (Xi et al. 1994), in the following, ‘‘sorption isotherm” will be used with reference to both sorption and desorption conditions. By the way, if the hysteresis of the moisture isotherm would be taken into account, two different relation, evaporable water vs relative humidity, must be used according to the sign of the variation of the relativity humidity. The shape of the sorption isotherm for HPC is influenced by many parameters, especially those that influence extent and rate of the chemical reactions and, in turn, determine pore structure and pore size distribution (water-to-cement ratio, cement chemical composition, SF content, curing time and method, temperature, mix additives, etc.). In the literature various formulations can be found to describe the sorption isotherm of normal concrete (Xi et al. 1994). However, in the present paper the semi-empirical expression proposed by Norling Mjornell (1997) is adopted because it
explicitly accounts for the evolution of hydration reaction and SF content. This sorption isotherm reads
( ) ( )( )
( ) ( )⎥⎥
⎦
⎤
⎢⎢
⎣
⎡
⎥⎥⎥
⎦
⎤
⎢⎢⎢
⎣
⎡
−
−∞
+
−∞
−=
1110
,1
110
11,
1,,
hcc
ge
scK
hcc
ge
scG
sch
ew
αα
αα
αα
αααα
(4)
where the first term (gel isotherm) represents the physically bound (adsorbed) water and the second term (capillary isotherm) represents the capillary water. This expression is valid only for low content of SF. The coefficient G1 represents the amount of water per unit volume held in the gel pores at 100% relative humidity, and it can be expressed (Norling Mjornell 1997) as
( ) ss
s
vgkc
c
c
vgk
scG αααα +=,1
(5)
where k
cvg and k
svg are material parameters. From the
maximum amount of water per unit volume that can fill all pores (both capillary pores and gel pores), one can calculate K1 as one obtains
( )1
110
110
11
22.0188.00
,1
−⎟⎠
⎞⎜⎝
⎛−∞
⎥⎥⎥
⎦
⎤
⎢⎢⎢
⎣
⎡⎟⎠
⎞⎜⎝
⎛−∞
−−+−
=
hcc
ge
hcc
geGs
ssc
w
scK
αα
αα
αα
αα
(6)
The material parameters k
cvg and k
svg and g1 can
be calibrated by fitting experimental data relevant to free (evaporable) water content in concrete at various ages (Di Luzio & Cusatis 2009b).
2.2 Temperature evolution
Note that, at early age, since the chemical reactions associated with cement hydration and SF reaction are exothermic, the temperature field is not uniform for non-adiabatic systems even if the environmental temperature is constant. Heat conduction can be described in concrete, at least for temperature not exceeding 100°C (Bažant & Kaplan 1996), by Fourier’s law, which reads
T∇−= λq (7)
where q is the heat flux, T is the absolute temperature, and λ is the heat conductivity; in this
4 RESULTS AND DISCUSSION
4.1 Strength and fracture energy of untreated concrete and after different hygral conditioning
Compressive strength as obtained after different cur-ing conditions is shown in Figure 2. The concrete used for these test series had a compressive strength of 42.5 N/mm
2 at an age of 28 days. After drying the
compressive strength had increased to 65.4 N/mm2.
This corresponds to an increase of 54 %. Part of this increase can be explained by further hydration at elevated temperature but the major part is due to in-creased surface energy of the nano-particles in hard-ened cement paste after removal of the adsorbed wa-ter layers. At 75 % RH humidity approximately two molecular layers of water are re-adsorbed. As a con-sequence compressive strength decreases again to a value of 54 N/mm
2. Finally the strength decreases
even more if the specimens are water saturated. In fact they nearly reach the original strength.
0.00
10.00
20.00
30.00
40.00
50.00
60.00
70.00
compressive strength (MPa)
Value 42.52 65.39 53.98 43.29 39.61
28 days Dry RH 75% Water Sat Seawater Sat
Figure 2. Compressive strength of differently conditioned con-crete cubes.
But most interesting, the compressive strength
decreases even more if the specimens are saturated with seawater. Water has a surface tension of 72.6 mN/m (Vargaftik et al. 1983) and surface tension of seawater has been measured to be 74.5 mN/m (see Table 3). That means the surface energy of the ce-ment gel is even more reduced after saturation with seawater.
Table 3. Surface tension of water, aqueous solutions with 3 % and 5 % NaCl and seawater.
Liquid Surface tension mN/m
Water 72.6
3 % NaCl 73.3
5 % NaCl 73.9
Seawater 74.5
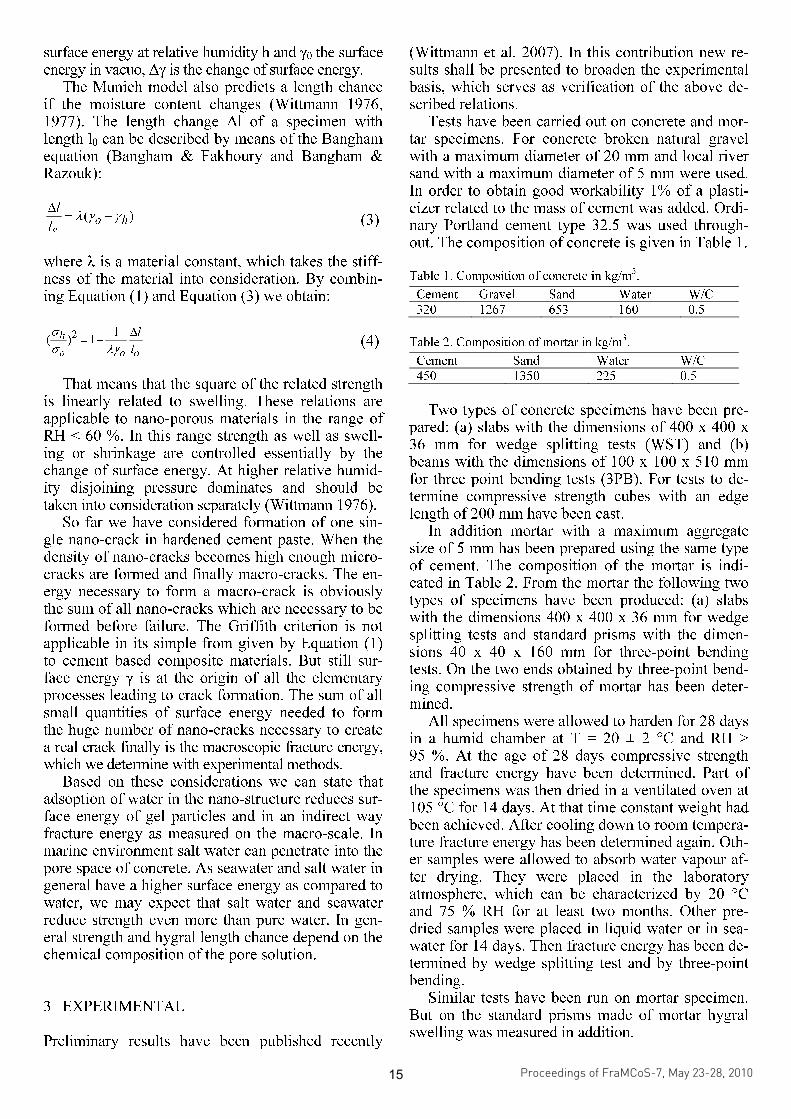
In Figure 3 the force-CMOD diagrams as ob-
tained by wedge splitting tests on concrete precondi-tioned in the same way as described above in context with the compression tests are shown. The curves
shown in Figure 3 are average values of at least three individual measurements. It should be men-tioned here that the same tests have also been carried out with smaller slabs (200 x 200 x 40 mm). As re-sults are essentially the same and because of space limits these results shall not be presented here but in a forthcoming paper. From the original data, as shown in Figure 3, fracture energy and strain soften-ing have been determined by inverse analysis (Bret-tschneider et al. 2007).
Figure 3. Force-CMOD diagrams as obtained by the wedge splitting test (WST) from concrete pre-conditioned in the same way as specimens prepared for compression tests (see Fig. 2).
The fracture energy as obtained by inverse analy-
sis of the force-CMOD diagrams shown in Figure 3 are compiled in Table 4. It can be seen that fracture energy of concrete increases considerably by drying. The increase of fracture energy by drying is slightly more than 20 %. But due to adsorption of water on the internal surface fracture energy decreases again after storage in air with RH = 75 %. The fracture en-ergy is further reduced by water saturation. As one could have expected saturation with seawater re-duces fracture energy even more than saturation with water as the surface tension of seawater is higher see Table 3).
Table 4. Fracture energy Gf in J/m2 as determined by wedge splitting test (WST) and by three-point bending (3PB) on dif-ferently pre-conditioned concrete samples.
Moist. Cond.
28 days dried 75 % RH
Water Sat.
Sea- water
WST 128 154 145 118 106 3PB 110 154 131 98 93
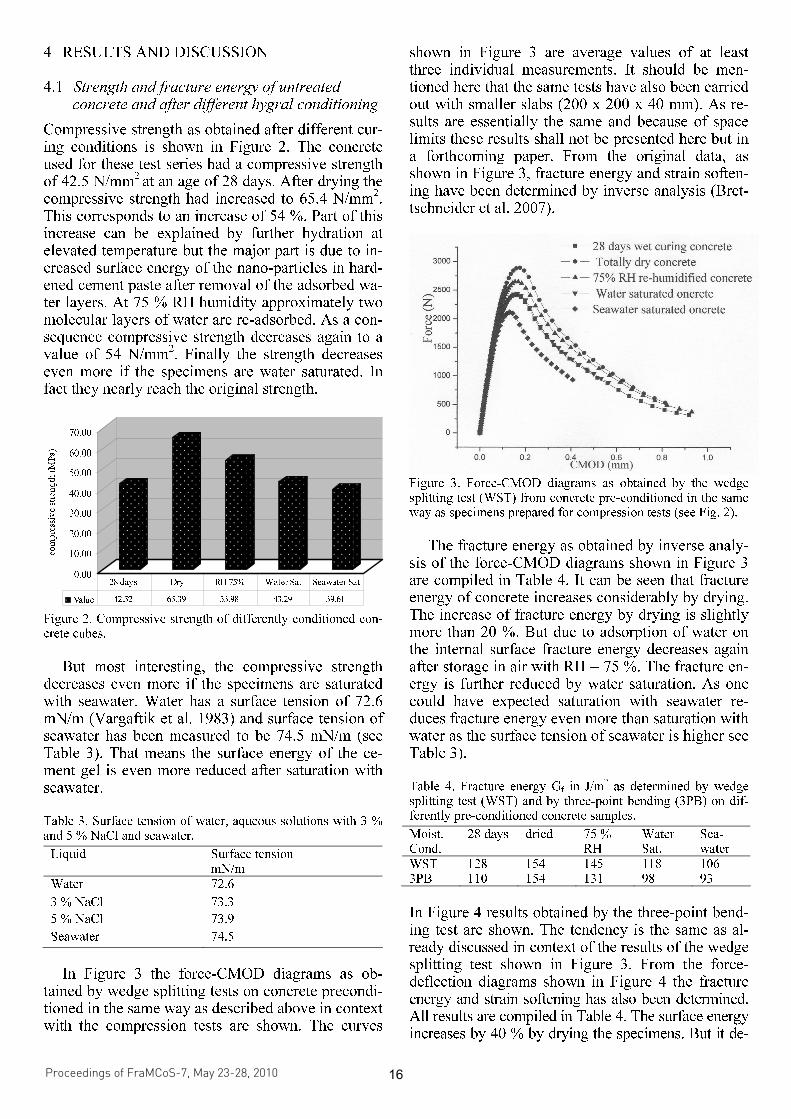
In Figure 4 results obtained by the three-point bend-ing test are shown. The tendency is the same as al-ready discussed in context of the results of the wedge splitting test shown in Figure 3. From the force-deflection diagrams shown in Figure 4 the fracture energy and strain softening has also been determined. All results are compiled in Table 4. The surface energy increases by 40 % by drying the specimens. But it de-
Proceedings of FraMCoS-7, May 23-28, 2010
hThD ∇−= ),(J (1)
The proportionality coefficient D(h,T) is called moisture permeability and it is a nonlinear function of the relative humidity h and temperature T (Bažant & Najjar 1972). The moisture mass balance requires that the variation in time of the water mass per unit volume of concrete (water content w) be equal to the divergence of the moisture flux J
J•∇=∂
∂−
t
w (2)
The water content w can be expressed as the sum
of the evaporable water we (capillary water, water vapor, and adsorbed water) and the non-evaporable (chemically bound) water wn (Mills 1966, Pantazopoulo & Mills 1995). It is reasonable to assume that the evaporable water is a function of relative humidity, h, degree of hydration, αc, and degree of silica fume reaction, αs, i.e. we=we(h,αc,αs) = age-dependent sorption/desorption isotherm (Norling Mjonell 1997). Under this assumption and by substituting Equation 1 into Equation 2 one obtains
nscw
s
ew
c
ew
hh
Dt
h
h
ew
&&& ++∂
∂
∂
∂
=∇•∇+∂
∂
∂
∂
− αα
αα
)(
(3)
where ∂we/∂h is the slope of the sorption/desorption isotherm (also called moisture capacity). The governing equation (Equation 3) must be completed by appropriate boundary and initial conditions.
The relation between the amount of evaporable water and relative humidity is called ‘‘adsorption isotherm” if measured with increasing relativity humidity and ‘‘desorption isotherm” in the opposite case. Neglecting their difference (Xi et al. 1994), in the following, ‘‘sorption isotherm” will be used with reference to both sorption and desorption conditions. By the way, if the hysteresis of the moisture isotherm would be taken into account, two different relation, evaporable water vs relative humidity, must be used according to the sign of the variation of the relativity humidity. The shape of the sorption isotherm for HPC is influenced by many parameters, especially those that influence extent and rate of the chemical reactions and, in turn, determine pore structure and pore size distribution (water-to-cement ratio, cement chemical composition, SF content, curing time and method, temperature, mix additives, etc.). In the literature various formulations can be found to describe the sorption isotherm of normal concrete (Xi et al. 1994). However, in the present paper the semi-empirical expression proposed by Norling Mjornell (1997) is adopted because it
explicitly accounts for the evolution of hydration reaction and SF content. This sorption isotherm reads
( ) ( )( )
( ) ( )⎥⎥
⎦
⎤
⎢⎢
⎣
⎡
⎥⎥⎥
⎦
⎤
⎢⎢⎢
⎣
⎡
−
−∞
+
−∞
−=
1110
,1
110
11,
1,,
hcc
ge
scK
hcc
ge
scG
sch
ew
αα
αα
αα
αααα
(4)
where the first term (gel isotherm) represents the physically bound (adsorbed) water and the second term (capillary isotherm) represents the capillary water. This expression is valid only for low content of SF. The coefficient G1 represents the amount of water per unit volume held in the gel pores at 100% relative humidity, and it can be expressed (Norling Mjornell 1997) as
( ) ss
s
vgkc
c
c
vgk
scG αααα +=,1
(5)
where k
cvg and k
svg are material parameters. From the
maximum amount of water per unit volume that can fill all pores (both capillary pores and gel pores), one can calculate K1 as one obtains
( )1
110
110
11
22.0188.00
,1
−⎟⎠
⎞⎜⎝
⎛−∞
⎥⎥⎥
⎦
⎤
⎢⎢⎢
⎣
⎡⎟⎠
⎞⎜⎝
⎛−∞
−−+−
=
hcc
ge
hcc
geGs
ssc
w
scK
αα
αα
αα
αα
(6)
The material parameters k
cvg and k
svg and g1 can
be calibrated by fitting experimental data relevant to free (evaporable) water content in concrete at various ages (Di Luzio & Cusatis 2009b).
2.2 Temperature evolution
Note that, at early age, since the chemical reactions associated with cement hydration and SF reaction are exothermic, the temperature field is not uniform for non-adiabatic systems even if the environmental temperature is constant. Heat conduction can be described in concrete, at least for temperature not exceeding 100°C (Bažant & Kaplan 1996), by Fourier’s law, which reads
T∇−= λq (7)
where q is the heat flux, T is the absolute temperature, and λ is the heat conductivity; in this
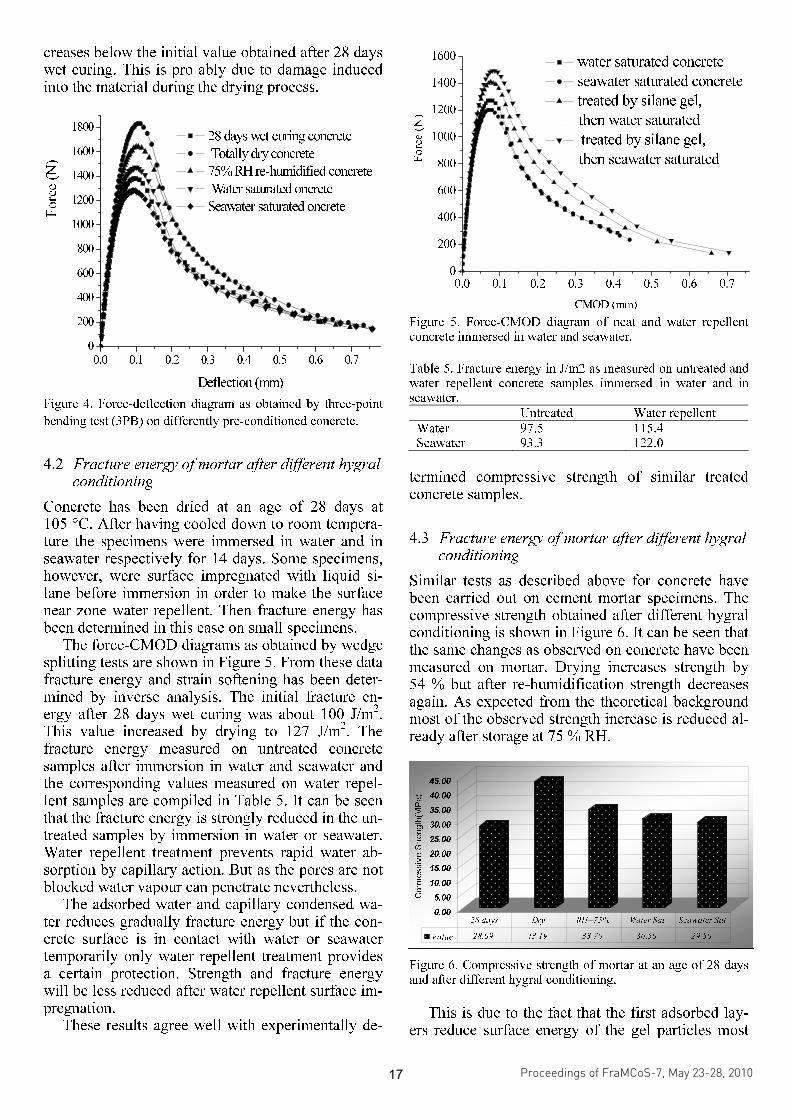
creases below the initial value obtained after 28 days wet curing. This is pro ably due to damage induced into the material during the drying process.
0.0 0.1 0.2 0.3 0.4 0.5 0.6 0.7
0
200
400
600
800
1000
1200
1400
1600
1800 28 days wet curing concrete
Totally dry concrete
75% RH re-humidified concrete
Water saturated oncrete
Seawater saturated oncreteForce (N)
Deflection (mm)
Figure 4. Force-deflection diagram as obtained by three-point
bending test (3PB) on differently pre-conditioned concrete.
4.2 Fracture energy of mortar after different hygral conditioning
Concrete has been dried at an age of 28 days at 105 °C. After having cooled down to room tempera-ture the specimens were immersed in water and in seawater respectively for 14 days. Some specimens, however, were surface impregnated with liquid si-lane before immersion in order to make the surface near zone water repellent. Then fracture energy has been determined in this case on small specimens.
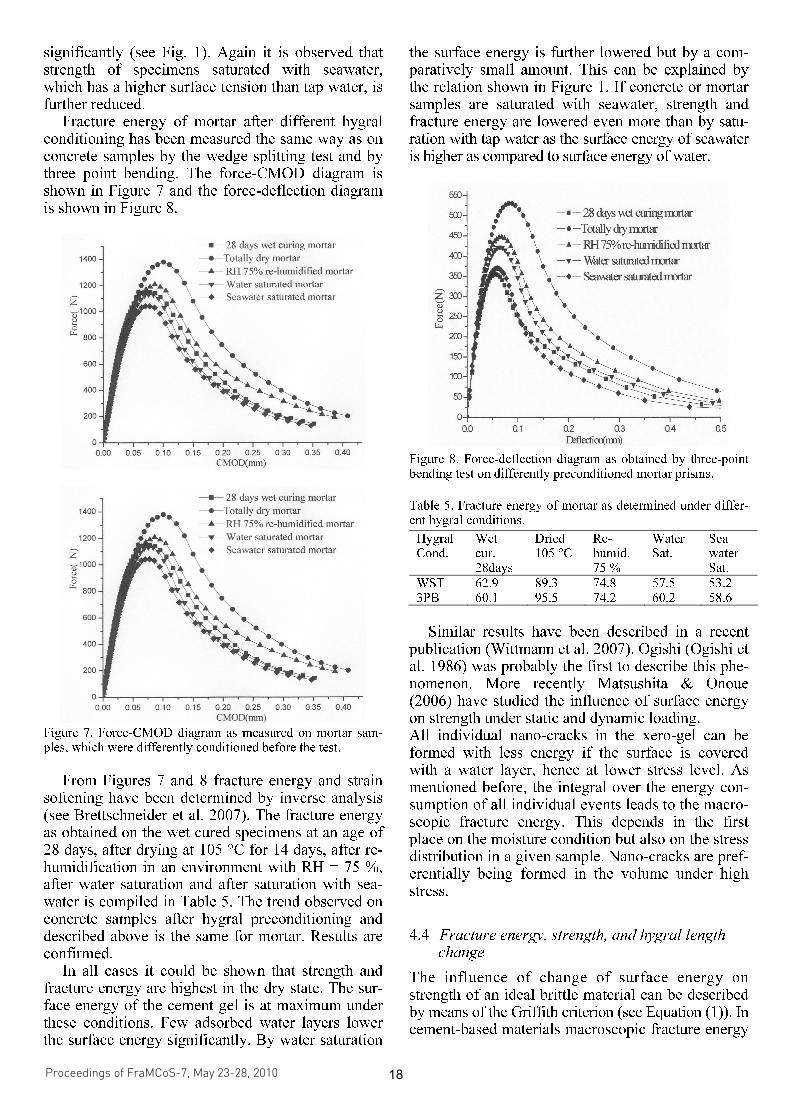
The force-CMOD diagrams as obtained by wedge splitting tests are shown in Figure 5. From these data fracture energy and strain softening has been deter-mined by inverse analysis. The initial fracture en-ergy after 28 days wet curing was about 100 J/m
2.
This value increased by drying to 127 J/m2. The
fracture energy measured on untreated concrete samples after immersion in water and seawater and the corresponding values measured on water repel-lent samples are compiled in Table 5. It can be seen that the fracture energy is strongly reduced in the un-treated samples by immersion in water or seawater. Water repellent treatment prevents rapid water ab-sorption by capillary action. But as the pores are not blocked water vapour can penetrate nevertheless.
The adsorbed water and capillary condensed wa-ter reduces gradually fracture energy but if the con-crete surface is in contact with water or seawater temporarily only water repellent treatment provides a certain protection. Strength and fracture energy will be less reduced after water repellent surface im-pregnation.
These results agree well with experimentally de-
0.0 0.1 0.2 0.3 0.4 0.5 0.6 0.7
0
200
400
600
800
1000
1200
1400
1600 water saturated concrete
seawater saturated concrete
treated by silane gel,
then water saturated
treated by silane gel,
then seawater saturatedForce (N)
CMOD (mm) Figure 5. Force-CMOD diagram of neat and water repellent concrete immersed in water and seawater.
Table 5. Fracture energy in J/m2 as measured on untreated and water repellent concrete samples immersed in water and in seawater.
Untreated Water repellent
Water 97.5 115.4 Seawater 93.3 122.0
termined compressive strength of similar treated concrete samples.
4.3 Fracture energy of mortar after different hygral conditioning
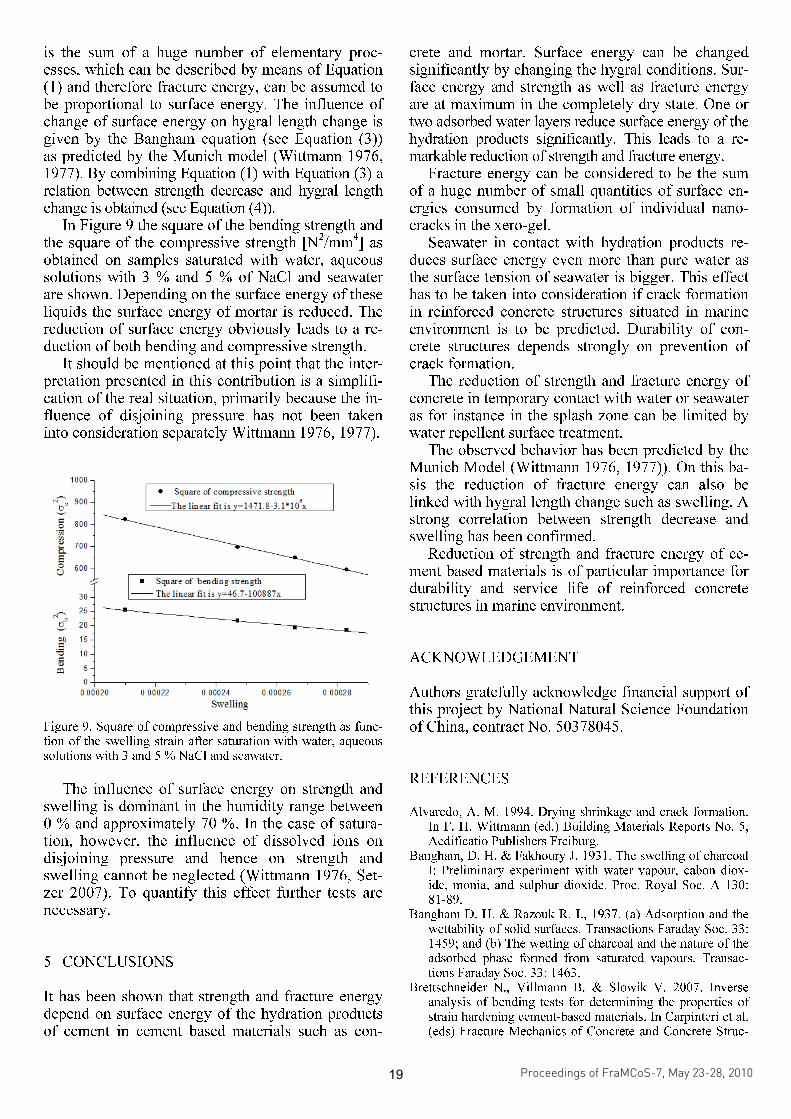
Similar tests as described above for concrete have been carried out on cement mortar specimens. The compressive strength obtained after different hygral conditioning is shown in Figure 6. It can be seen that the same changes as observed on concrete have been measured on mortar. Drying increases strength by 54 % but after re-humidification strength decreases again. As expected from the theoretical background most of the observed strength increase is reduced al-ready after storage at 75 % RH.
0.00
5.00
10.00
15.00
20.00
25.00
30.00
35.00
40.00
45.00
Comressive Strength(MPa)
Value 28.09 43.19 33.70 30.50 29.50
28 days Dry RH=75% Water Sat Seawater Sat
Figure 6. Compressive strength of mortar at an age of 28 days and after different hygral conditioning.
This is due to the fact that the first adsorbed lay-
ers reduce surface energy of the gel particles most
Proceedings of FraMCoS-7, May 23-28, 2010
hThD ∇−= ),(J (1)
The proportionality coefficient D(h,T) is called moisture permeability and it is a nonlinear function of the relative humidity h and temperature T (Bažant & Najjar 1972). The moisture mass balance requires that the variation in time of the water mass per unit volume of concrete (water content w) be equal to the divergence of the moisture flux J
J•∇=∂
∂−
t
w (2)
The water content w can be expressed as the sum
of the evaporable water we (capillary water, water vapor, and adsorbed water) and the non-evaporable (chemically bound) water wn (Mills 1966, Pantazopoulo & Mills 1995). It is reasonable to assume that the evaporable water is a function of relative humidity, h, degree of hydration, αc, and degree of silica fume reaction, αs, i.e. we=we(h,αc,αs) = age-dependent sorption/desorption isotherm (Norling Mjonell 1997). Under this assumption and by substituting Equation 1 into Equation 2 one obtains
nscw
s
ew
c
ew
hh
Dt
h
h
ew
&&& ++∂
∂
∂
∂
=∇•∇+∂
∂
∂
∂
− αα
αα
)(
(3)
where ∂we/∂h is the slope of the sorption/desorption isotherm (also called moisture capacity). The governing equation (Equation 3) must be completed by appropriate boundary and initial conditions.
The relation between the amount of evaporable water and relative humidity is called ‘‘adsorption isotherm” if measured with increasing relativity humidity and ‘‘desorption isotherm” in the opposite case. Neglecting their difference (Xi et al. 1994), in the following, ‘‘sorption isotherm” will be used with reference to both sorption and desorption conditions. By the way, if the hysteresis of the moisture isotherm would be taken into account, two different relation, evaporable water vs relative humidity, must be used according to the sign of the variation of the relativity humidity. The shape of the sorption isotherm for HPC is influenced by many parameters, especially those that influence extent and rate of the chemical reactions and, in turn, determine pore structure and pore size distribution (water-to-cement ratio, cement chemical composition, SF content, curing time and method, temperature, mix additives, etc.). In the literature various formulations can be found to describe the sorption isotherm of normal concrete (Xi et al. 1994). However, in the present paper the semi-empirical expression proposed by Norling Mjornell (1997) is adopted because it
explicitly accounts for the evolution of hydration reaction and SF content. This sorption isotherm reads
( ) ( )( )
( ) ( )⎥⎥
⎦
⎤
⎢⎢
⎣
⎡
⎥⎥⎥
⎦
⎤
⎢⎢⎢
⎣
⎡
−
−∞
+
−∞
−=
1110
,1
110
11,
1,,
hcc
ge
scK
hcc
ge
scG
sch
ew
αα
αα
αα
αααα
(4)
where the first term (gel isotherm) represents the physically bound (adsorbed) water and the second term (capillary isotherm) represents the capillary water. This expression is valid only for low content of SF. The coefficient G1 represents the amount of water per unit volume held in the gel pores at 100% relative humidity, and it can be expressed (Norling Mjornell 1997) as
( ) ss
s
vgkc
c
c
vgk
scG αααα +=,1
(5)
where k
cvg and k
svg are material parameters. From the
maximum amount of water per unit volume that can fill all pores (both capillary pores and gel pores), one can calculate K1 as one obtains
( )1
110
110
11
22.0188.00
,1
−⎟⎠
⎞⎜⎝
⎛−∞
⎥⎥⎥
⎦
⎤
⎢⎢⎢
⎣
⎡⎟⎠
⎞⎜⎝
⎛−∞
−−+−
=
hcc
ge
hcc
geGs
ssc
w
scK
αα
αα
αα
αα
(6)
The material parameters k
cvg and k
svg and g1 can
be calibrated by fitting experimental data relevant to free (evaporable) water content in concrete at various ages (Di Luzio & Cusatis 2009b).
2.2 Temperature evolution
Note that, at early age, since the chemical reactions associated with cement hydration and SF reaction are exothermic, the temperature field is not uniform for non-adiabatic systems even if the environmental temperature is constant. Heat conduction can be described in concrete, at least for temperature not exceeding 100°C (Bažant & Kaplan 1996), by Fourier’s law, which reads
T∇−= λq (7)
where q is the heat flux, T is the absolute temperature, and λ is the heat conductivity; in this
significantly (see Fig. 1). Again it is observed that strength of specimens saturated with seawater, which has a higher surface tension than tap water, is further reduced.
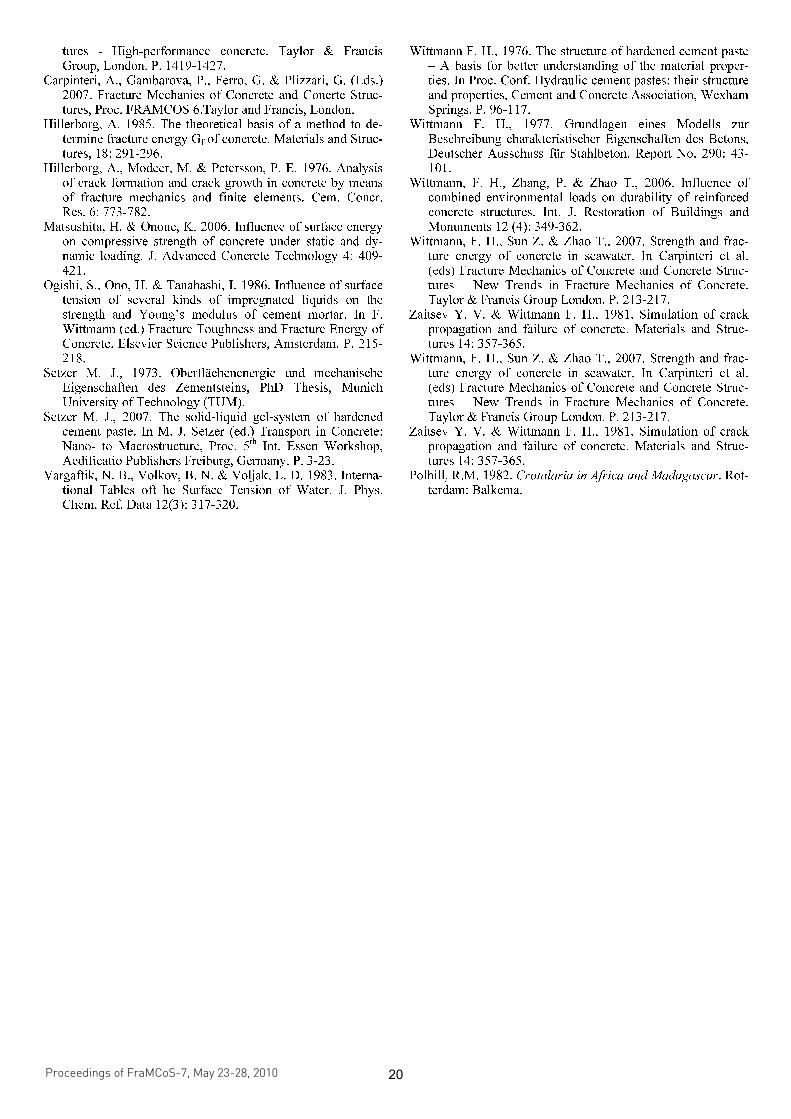
Fracture energy of mortar after different hygral conditioning has been measured the same way as on concrete samples by the wedge splitting test and by three point bending. The force-CMOD diagram is shown in Figure 7 and the force-deflection diagram is shown in Figure 8.
Figure 7. Force-CMOD diagram as measured on mortar sam-ples, which were differently conditioned before the test.
From Figures 7 and 8 fracture energy and strain
softening have been determined by inverse analysis (see Brettschneider et al. 2007). The fracture energy as obtained on the wet cured specimens at an age of 28 days, after drying at 105 °C for 14 days, after re-humidification in an environment with RH = 75 %, after water saturation and after saturation with sea-water is compiled in Table 5. The trend observed on concrete samples after hygral preconditioning and described above is the same for mortar. Results are confirmed.
In all cases it could be shown that strength and fracture energy are highest in the dry state. The sur-face energy of the cement gel is at maximum under these conditions. Few adsorbed water layers lower the surface energy significantly. By water saturation
the surface energy is further lowered but by a com-paratively small amount. This can be explained by the relation shown in Figure 1. If concrete or mortar samples are saturated with seawater, strength and fracture energy are lowered even more than by satu-ration with tap water as the surface energy of seawater is higher as compared to surface energy of water.
Figure 8. Force-deflection diagram as obtained by three-point bending test on differently preconditioned mortar prisms.
Table 5. Fracture energy of mortar as determined under differ-ent hygral conditions.
Hygral Cond.
Wet cur. 28days
Dried 105 °C
Re-humid. 75 %
Water Sat.
Sea water Sat.
WST 62.9 89.3 74.8 57.5 53.2 3PB 60.1 95.5 74.2 60.2 58.6
Similar results have been described in a recent
publication (Wittmann et al. 2007). Ogishi (Ogishi et al. 1986) was probably the first to describe this phe-nomenon. More recently Matsushita & Onoue (2006) have studied the influence of surface energy on strength under static and dynamic loading. All individual nano-cracks in the xero-gel can be formed with less energy if the surface is covered with a water layer, hence at lower stress level. As mentioned before, the integral over the energy con-sumption of all individual events leads to the macro-scopic fracture energy. This depends in the first place on the moisture condition but also on the stress distribution in a given sample. Nano-cracks are pref-erentially being formed in the volume under high stress.
4.4 Fracture energy, strength, and hygral length change
The influence of change of surface energy on strength of an ideal brittle material can be described by means of the Griffith criterion (see Equation (1)). In cement-based materials macroscopic fracture energy
Proceedings of FraMCoS-7, May 23-28, 2010
hThD ∇−= ),(J (1)
The proportionality coefficient D(h,T) is called moisture permeability and it is a nonlinear function of the relative humidity h and temperature T (Bažant & Najjar 1972). The moisture mass balance requires that the variation in time of the water mass per unit volume of concrete (water content w) be equal to the divergence of the moisture flux J
J•∇=∂
∂−
t
w (2)
The water content w can be expressed as the sum
of the evaporable water we (capillary water, water vapor, and adsorbed water) and the non-evaporable (chemically bound) water wn (Mills 1966, Pantazopoulo & Mills 1995). It is reasonable to assume that the evaporable water is a function of relative humidity, h, degree of hydration, αc, and degree of silica fume reaction, αs, i.e. we=we(h,αc,αs) = age-dependent sorption/desorption isotherm (Norling Mjonell 1997). Under this assumption and by substituting Equation 1 into Equation 2 one obtains
nscw
s
ew
c
ew
hh
Dt
h
h
ew
&&& ++∂
∂
∂
∂
=∇•∇+∂
∂
∂
∂
− αα
αα
)(
(3)
where ∂we/∂h is the slope of the sorption/desorption isotherm (also called moisture capacity). The governing equation (Equation 3) must be completed by appropriate boundary and initial conditions.
The relation between the amount of evaporable water and relative humidity is called ‘‘adsorption isotherm” if measured with increasing relativity humidity and ‘‘desorption isotherm” in the opposite case. Neglecting their difference (Xi et al. 1994), in the following, ‘‘sorption isotherm” will be used with reference to both sorption and desorption conditions. By the way, if the hysteresis of the moisture isotherm would be taken into account, two different relation, evaporable water vs relative humidity, must be used according to the sign of the variation of the relativity humidity. The shape of the sorption isotherm for HPC is influenced by many parameters, especially those that influence extent and rate of the chemical reactions and, in turn, determine pore structure and pore size distribution (water-to-cement ratio, cement chemical composition, SF content, curing time and method, temperature, mix additives, etc.). In the literature various formulations can be found to describe the sorption isotherm of normal concrete (Xi et al. 1994). However, in the present paper the semi-empirical expression proposed by Norling Mjornell (1997) is adopted because it
explicitly accounts for the evolution of hydration reaction and SF content. This sorption isotherm reads
( ) ( )( )
( ) ( )⎥⎥
⎦
⎤
⎢⎢
⎣
⎡
⎥⎥⎥
⎦
⎤
⎢⎢⎢
⎣
⎡
−
−∞
+
−∞
−=
1110
,1
110
11,
1,,
hcc
ge
scK
hcc
ge
scG
sch
ew
αα
αα
αα
αααα
(4)
where the first term (gel isotherm) represents the physically bound (adsorbed) water and the second term (capillary isotherm) represents the capillary water. This expression is valid only for low content of SF. The coefficient G1 represents the amount of water per unit volume held in the gel pores at 100% relative humidity, and it can be expressed (Norling Mjornell 1997) as
( ) ss
s
vgkc
c
c
vgk
scG αααα +=,1
(5)
where k
cvg and k
svg are material parameters. From the
maximum amount of water per unit volume that can fill all pores (both capillary pores and gel pores), one can calculate K1 as one obtains
( )1
110
110
11
22.0188.00
,1
−⎟⎠
⎞⎜⎝
⎛−∞
⎥⎥⎥
⎦
⎤
⎢⎢⎢
⎣
⎡⎟⎠
⎞⎜⎝
⎛−∞
−−+−
=
hcc
ge
hcc
geGs
ssc
w
scK
αα
αα
αα
αα
(6)
The material parameters k
cvg and k
svg and g1 can
be calibrated by fitting experimental data relevant to free (evaporable) water content in concrete at various ages (Di Luzio & Cusatis 2009b).
2.2 Temperature evolution
Note that, at early age, since the chemical reactions associated with cement hydration and SF reaction are exothermic, the temperature field is not uniform for non-adiabatic systems even if the environmental temperature is constant. Heat conduction can be described in concrete, at least for temperature not exceeding 100°C (Bažant & Kaplan 1996), by Fourier’s law, which reads
T∇−= λq (7)
where q is the heat flux, T is the absolute temperature, and λ is the heat conductivity; in this
is the sum of a huge number of elementary proc-esses, which can be described by means of Equation (1) and therefore fracture energy, can be assumed to be proportional to surface energy. The influence of change of surface energy on hygral length change is given by the Bangham equation (see Equation (3)) as predicted by the Munich model (Wittmann 1976, 1977). By combining Equation (1) with Equation (3) a relation between strength decrease and hygral length change is obtained (see Equation (4)).
In Figure 9 the square of the bending strength and the square of the compressive strength [N
2/mm
4] as
obtained on samples saturated with water, aqueous solutions with 3 % and 5 % of NaCl and seawater are shown. Depending on the surface energy of these liquids the surface energy of mortar is reduced. The reduction of surface energy obviously leads to a re-duction of both bending and compressive strength.
It should be mentioned at this point that the inter-pretation presented in this contribution is a simplifi-cation of the real situation, primarily because the in-fluence of disjoining pressure has not been taken into consideration separately Wittmann 1976, 1977).
Figure 9. Square of compressive and bending strength as func-tion of the swelling strain after saturation with water, aqueous solutions with 3 and 5 % NaCl and seawater.
The influence of surface energy on strength and
swelling is dominant in the humidity range between 0 % and approximately 70 %. In the case of satura-tion, however, the influence of dissolved ions on disjoining pressure and hence on strength and swelling cannot be neglected (Wittmann 1976, Set-zer 2007). To quantify this effect further tests are necessary.
5 CONCLUSIONS
It has been shown that strength and fracture energy depend on surface energy of the hydration products of cement in cement based materials such as con-
crete and mortar. Surface energy can be changed significantly by changing the hygral conditions. Sur-face energy and strength as well as fracture energy are at maximum in the completely dry state. One or two adsorbed water layers reduce surface energy of the hydration products significantly. This leads to a re-markable reduction of strength and fracture energy.
Fracture energy can be considered to be the sum of a huge number of small quantities of surface en-ergies consumed by formation of individual nano-cracks in the xero-gel.
Seawater in contact with hydration products re-duces surface energy even more than pure water as the surface tension of seawater is bigger. This effect has to be taken into consideration if crack formation in reinforced concrete structures situated in marine environment is to be predicted. Durability of con-crete structures depends strongly on prevention of crack formation.
The reduction of strength and fracture energy of concrete in temporary contact with water or seawater as for instance in the splash zone can be limited by water repellent surface treatment.
The observed behavior has been predicted by the Munich Model (Wittmann 1976, 1977)). On this ba-sis the reduction of fracture energy can also be linked with hygral length change such as swelling. A strong correlation between strength decrease and swelling has been confirmed.
Reduction of strength and fracture energy of ce-ment based materials is of particular importance for durability and service life of reinforced concrete structures in marine environment.
ACKNOWLEDGEMENT
Authors gratefully acknowledge financial support of this project by National Natural Science Foundation of China, contract No. 50378045.
REFERENCES
Alvaredo, A. M. 1994. Drying shrinkage and crack formation. In F. H. Wittmann (ed.) Building Materials Reports No. 5, Aedificatio Publishers Freiburg.
Bangham, D. H. & Fakhoury J. 1931. The swelling of charcoal I: Preliminary experiment with water vapour, cabon diox-ide, monia, and sulphur dioxide. Proc. Royal Soc. A 130: 81-89.
Bangham D. H. & Razouk R. I., 1937. (a) Adsorption and the wettability of solid surfaces. Transactions Faraday Soc. 33: 1459; and (b) The wetting of charcoal and the nature of the adsorbed phase formed from saturated vapours. Transac-tions Faraday Soc. 33: 1463.
Brettschneider N., Villmann B. & Slowik V. 2007. Inverse analysis of bending tests for determining the properties of strain hardening cement-based materials. In Carpinteri et al. (eds) Fracture Mechanics of Concrete and Concrete Struc-
Proceedings of FraMCoS-7, May 23-28, 2010
hThD ∇−= ),(J (1)
The proportionality coefficient D(h,T) is called moisture permeability and it is a nonlinear function of the relative humidity h and temperature T (Bažant & Najjar 1972). The moisture mass balance requires that the variation in time of the water mass per unit volume of concrete (water content w) be equal to the divergence of the moisture flux J
J•∇=∂
∂−
t
w (2)
The water content w can be expressed as the sum
of the evaporable water we (capillary water, water vapor, and adsorbed water) and the non-evaporable (chemically bound) water wn (Mills 1966, Pantazopoulo & Mills 1995). It is reasonable to assume that the evaporable water is a function of relative humidity, h, degree of hydration, αc, and degree of silica fume reaction, αs, i.e. we=we(h,αc,αs) = age-dependent sorption/desorption isotherm (Norling Mjonell 1997). Under this assumption and by substituting Equation 1 into Equation 2 one obtains
nscw
s
ew
c
ew
hh
Dt
h
h
ew
&&& ++∂
∂
∂
∂
=∇•∇+∂
∂
∂
∂
− αα
αα
)(
(3)
where ∂we/∂h is the slope of the sorption/desorption isotherm (also called moisture capacity). The governing equation (Equation 3) must be completed by appropriate boundary and initial conditions.
The relation between the amount of evaporable water and relative humidity is called ‘‘adsorption isotherm” if measured with increasing relativity humidity and ‘‘desorption isotherm” in the opposite case. Neglecting their difference (Xi et al. 1994), in the following, ‘‘sorption isotherm” will be used with reference to both sorption and desorption conditions. By the way, if the hysteresis of the moisture isotherm would be taken into account, two different relation, evaporable water vs relative humidity, must be used according to the sign of the variation of the relativity humidity. The shape of the sorption isotherm for HPC is influenced by many parameters, especially those that influence extent and rate of the chemical reactions and, in turn, determine pore structure and pore size distribution (water-to-cement ratio, cement chemical composition, SF content, curing time and method, temperature, mix additives, etc.). In the literature various formulations can be found to describe the sorption isotherm of normal concrete (Xi et al. 1994). However, in the present paper the semi-empirical expression proposed by Norling Mjornell (1997) is adopted because it
explicitly accounts for the evolution of hydration reaction and SF content. This sorption isotherm reads
( ) ( )( )
( ) ( )⎥⎥
⎦
⎤
⎢⎢
⎣
⎡
⎥⎥⎥
⎦
⎤
⎢⎢⎢
⎣
⎡
−
−∞
+
−∞
−=
1110
,1
110
11,
1,,
hcc
ge
scK
hcc
ge
scG
sch
ew
αα
αα
αα
αααα
(4)
where the first term (gel isotherm) represents the physically bound (adsorbed) water and the second term (capillary isotherm) represents the capillary water. This expression is valid only for low content of SF. The coefficient G1 represents the amount of water per unit volume held in the gel pores at 100% relative humidity, and it can be expressed (Norling Mjornell 1997) as
( ) ss
s
vgkc
c
c
vgk
scG αααα +=,1
(5)
where k
cvg and k
svg are material parameters. From the
maximum amount of water per unit volume that can fill all pores (both capillary pores and gel pores), one can calculate K1 as one obtains
( )1
110
110
11
22.0188.00
,1
−⎟⎠
⎞⎜⎝
⎛−∞
⎥⎥⎥
⎦
⎤
⎢⎢⎢
⎣
⎡⎟⎠
⎞⎜⎝
⎛−∞
−−+−
=
hcc
ge
hcc
geGs
ssc
w
scK
αα
αα
αα
αα
(6)
The material parameters k
cvg and k
svg and g1 can
be calibrated by fitting experimental data relevant to free (evaporable) water content in concrete at various ages (Di Luzio & Cusatis 2009b).
2.2 Temperature evolution
Note that, at early age, since the chemical reactions associated with cement hydration and SF reaction are exothermic, the temperature field is not uniform for non-adiabatic systems even if the environmental temperature is constant. Heat conduction can be described in concrete, at least for temperature not exceeding 100°C (Bažant & Kaplan 1996), by Fourier’s law, which reads
T∇−= λq (7)
where q is the heat flux, T is the absolute temperature, and λ is the heat conductivity; in this
tures - High-performance concrete. Taylor & Francis Group, London. P. 1419-1427.
Carpinteri, A., Gambarova, P., Ferro, G. & Plizzari, G. (Eds.) 2007. Fracture Mechanics of Concrete and Concrte Struc-tures, Proc. FRAMCOS 6.Taylor and Francis, London.
Hillerborg, A. 1985. The theoretical basis of a method to de-termine fracture energy Gf of concrete. Materials and Struc-tures, 18: 291-296.
Hillerborg, A., Modeer, M. & Petersson, P. E. 1976. Analysis of crack formation and crack growth in concrete by means of fracture mechanics and finite elements. Cem. Concr. Res. 6: 773-782.
Matsushita, H. & Onoue, K. 2006. Influence of surface energy on compressive strength of concrete under static and dy-namic loading. J. Advanced Concrete Technology 4: 409-421.
Ogishi, S., Ono, H. & Tanahashi, I. 1986. Influence of surface tension of several kinds of impregnated liquids on the strength and Young’s modulus of cement mortar. In F. Wittmann (ed.) Fracture Toughness and Fracture Energy of Concrete. Elsevier Science Publishers, Amsterdam. P. 215-218.
Setzer M. J., 1973. Oberflächenenergie und mechanische Eigenschaften des Zementsteins, PhD Thesis, Munich University of Technology (TUM).
Setzer M. J., 2007. The solid-liquid gel-system of hardened cement paste. In M. J. Setzer (ed.) Transport in Concrete: Nano- to Macrostructure, Proc. 5th Int. Essen Workshop, Aedificatio Publishers Freiburg, Germany. P. 3-23.
Vargaftik, N. B., Volkov, B. N. & Voljak, L. D. 1983. Interna-tional Tables oft he Surface Tension of Water. J. Phys. Chem. Ref. Data 12(3): 317-320.
Wittmann F. H., 1976. The structure of hardened cement paste – A basis for better understanding of the material proper-ties. In Proc. Conf. Hydraulic cement pastes: their structure and properties, Cement and Concrete Association, Wexham Springs. P. 96-117.
Wittmann F. H., 1977. Grundlagen eines Modells zur Beschreibung charakteristischer Eigenschaften des Betons, Deutscher Ausschuss für Stahlbeton, Report No. 290: 43-101.
Wittmann, F. H., Zhang, P. & Zhao T., 2006. Influence of combined environmental loads on durability of reinforced concrete structures. Int. J. Restoration of Buildings and Monuments 12 (4): 349-362.
Wittmann, F. H., Sun Z. & Zhao T., 2007. Strength and frac-ture energy of concrete in seawater. In Carpinteri et al. (eds) Fracture Mechanics of Concrete and Concrete Struc-tures – New Trends in Fracture Mechanics of Concrete. Taylor & Francis Group London. P. 213-217.
Zaitsev Y. V. & Wittmann F. H., 1981. Simulation of crack propagation and failure of concrete. Materials and Struc-tures 14: 357-365.
Polhill, R.M. 1982. Crotalaria in Africa and Madagascar. Rot-terdam: Balkema.
Proceedings of FraMCoS-7, May 23-28, 2010
hThD ∇−= ),(J (1)
The proportionality coefficient D(h,T) is called moisture permeability and it is a nonlinear function of the relative humidity h and temperature T (Bažant & Najjar 1972). The moisture mass balance requires that the variation in time of the water mass per unit volume of concrete (water content w) be equal to the divergence of the moisture flux J
J•∇=∂
∂−
t
w (2)
The water content w can be expressed as the sum
of the evaporable water we (capillary water, water vapor, and adsorbed water) and the non-evaporable (chemically bound) water wn (Mills 1966, Pantazopoulo & Mills 1995). It is reasonable to assume that the evaporable water is a function of relative humidity, h, degree of hydration, αc, and degree of silica fume reaction, αs, i.e. we=we(h,αc,αs) = age-dependent sorption/desorption isotherm (Norling Mjonell 1997). Under this assumption and by substituting Equation 1 into Equation 2 one obtains
nscw
s
ew
c
ew
hh
Dt
h
h
ew
&&& ++∂
∂
∂
∂
=∇•∇+∂
∂
∂
∂
− αα
αα
)(
(3)
where ∂we/∂h is the slope of the sorption/desorption isotherm (also called moisture capacity). The governing equation (Equation 3) must be completed by appropriate boundary and initial conditions.
The relation between the amount of evaporable water and relative humidity is called ‘‘adsorption isotherm” if measured with increasing relativity humidity and ‘‘desorption isotherm” in the opposite case. Neglecting their difference (Xi et al. 1994), in the following, ‘‘sorption isotherm” will be used with reference to both sorption and desorption conditions. By the way, if the hysteresis of the moisture isotherm would be taken into account, two different relation, evaporable water vs relative humidity, must be used according to the sign of the variation of the relativity humidity. The shape of the sorption isotherm for HPC is influenced by many parameters, especially those that influence extent and rate of the chemical reactions and, in turn, determine pore structure and pore size distribution (water-to-cement ratio, cement chemical composition, SF content, curing time and method, temperature, mix additives, etc.). In the literature various formulations can be found to describe the sorption isotherm of normal concrete (Xi et al. 1994). However, in the present paper the semi-empirical expression proposed by Norling Mjornell (1997) is adopted because it
explicitly accounts for the evolution of hydration reaction and SF content. This sorption isotherm reads
( ) ( )( )
( ) ( )⎥⎥
⎦
⎤
⎢⎢
⎣
⎡
⎥⎥⎥
⎦
⎤
⎢⎢⎢
⎣
⎡
−
−∞
+
−∞
−=
1110
,1
110
11,
1,,
hcc
ge
scK
hcc
ge
scG
sch
ew
αα
αα
αα
αααα
(4)
where the first term (gel isotherm) represents the physically bound (adsorbed) water and the second term (capillary isotherm) represents the capillary water. This expression is valid only for low content of SF. The coefficient G1 represents the amount of water per unit volume held in the gel pores at 100% relative humidity, and it can be expressed (Norling Mjornell 1997) as
( ) ss
s
vgkc
c
c
vgk
scG αααα +=,1
(5)
where k
cvg and k
svg are material parameters. From the
maximum amount of water per unit volume that can fill all pores (both capillary pores and gel pores), one can calculate K1 as one obtains
( )1
110
110
11
22.0188.00
,1
−⎟⎠
⎞⎜⎝
⎛−∞
⎥⎥⎥
⎦
⎤
⎢⎢⎢
⎣
⎡⎟⎠
⎞⎜⎝
⎛−∞
−−+−
=
hcc
ge
hcc
geGs
ssc
w
scK
αα
αα
αα
αα
(6)
The material parameters k
cvg and k
svg and g1 can
be calibrated by fitting experimental data relevant to free (evaporable) water content in concrete at various ages (Di Luzio & Cusatis 2009b).
2.2 Temperature evolution
Note that, at early age, since the chemical reactions associated with cement hydration and SF reaction are exothermic, the temperature field is not uniform for non-adiabatic systems even if the environmental temperature is constant. Heat conduction can be described in concrete, at least for temperature not exceeding 100°C (Bažant & Kaplan 1996), by Fourier’s law, which reads
T∇−= λq (7)
where q is the heat flux, T is the absolute temperature, and λ is the heat conductivity; in this