Embed Size (px)
Citation preview
Queensland Government Statistician’s Office
http://www.qgso.qld.gov.au http://creativecommons.org/licenses/by/4.0
© The State of Queensland (Queensland Treasury) 2017
Surat Basin non–resident population projections, 2017 to 2023
Introduction
With the use of fly-in/fly-out and drive-in/drive-out (FIFO/DIDO) work practices now common, many resource regions have a large population of non-resident workers who live in the area only while on-shift. This non-resident population is not included in the Australian Bureau of Statistics’ (ABS) official resident population estimates for these areas.
To bridge this information gap, Surat Basin non–resident population projections, 2017 to 2023 provides projected numbers of non–resident workers on-shift for local government areas (LGAs) in the Surat Basin region (Figure 1). The report presents three projection series for the region, based on information provided by industry regarding existing operations and future projects. Data tables to supplement the report are available on the Queensland Government Statistician’s Office (QGSO) website (www.qgso.qld.gov.au).
Key points
Key points of this report include:
The non-resident population of the Surat Basin in June 2016 was 3,820 persons, down from 5,420 persons in June 2015. The region’s non-resident population has declined substantially from a peak of 14,490 persons in June 2014, as the large FIFO/DIDO construction workforces of three major coal seam gas (CSG) projects have been replaced by smaller operational workforces.
Three projection series represent potential non–resident population outcomes for the Surat Basin out to 2023, based on different assumptions about future project and operations workforces. All three series project the non-resident population to remain between 3,140 and 4,110 persons, as the focus of activity for the CSG industry shifts from construction to production and to ensuring continuity of CSG supply.
The Series A projection, which represents all existing operations plus projects that have passed final investment decision (FID), indicates that the Surat Basin’s non-resident population will decrease to 3,140 persons by 2019, then remain stable to 2023.
The Series B projection, which factors in the additional impacts of projects that have received all approvals but are yet to reach FID, anticipates the non-resident population of the Surat Basin to fall to 3,290 persons in 2019 before growing to 4,110 persons by 2023.
The LGA of Western Downs (R) will continue to account for the majority of resource industry activity in the Surat Basin for the next seven years. According to the Series A projection, the non-resident population of Western Downs (R) will decline from 2,460 persons in 2016 to 2,030 persons from 2019 onward.
The Series B and C projections for Western Downs (R) both indicate that the area’s non-resident population will remain below 2016 levels, reaching 2,310 persons by 2023.
The non-resident population of Maranoa (R) is projected to decrease from 1,280 persons in 2016 to 1,020 persons from 2019 onward, according to the Series A projection. The Series B projection, which factors in construction workforces of proposed gas field and pipeline developments, would see the non-resident population of Maranoa (R) grow to 1,690 persons in 2023.
The non-resident population of Toowoomba (R) is projected to remain stable at around 90 persons from 2016 to 2023 (Series A), with construction workforces potentially influencing a temporary peak of 240 persons in 2018 (Series B).
None of the projection series for the Surat Basin include consideration of proposed projects where FID has been delayed indefinitely, or where it is not possible to give consideration to indicative workforce data or sequencing.
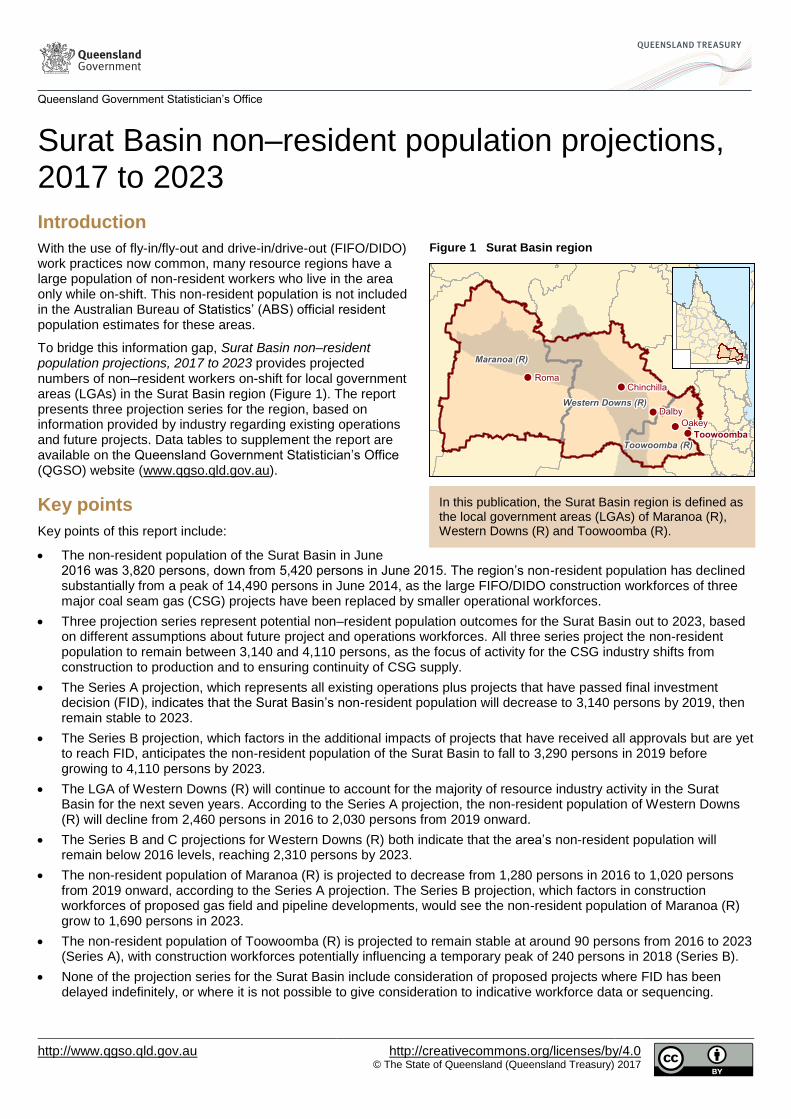
Figure 1 Surat Basin region
In this publication, the Surat Basin region is defined as the local government areas (LGAs) of Maranoa (R), Western Downs (R) and Toowoomba (R).
Queensland Government Statistician’s Office
Surat Basin non–resident population projections, 2017 to 2023 2
Surat Basin—future influences
The Surat Basin in southern Queensland has evolved into a major energy province, based on production of CSG, coal mining, and electricity generation from coal and gas-fired power stations. In addition to these traditional energy industries, several alternative electricity generation proposals are now in the development pipeline, including solar and wind farms. The size of the Surat Basin’s non-resident population out to 2023 will be influenced by the construction and production workforces of all existing resource operations and future projects (Table 5, page 8).
The three major CSG projects located in the Surat Basin reached advanced production status during the year to December 2016, with 17.5 million tonnes (Mt) of liquefied natural gas (LNG) product exported from their Gladstone processing plants during that period (Gladstone Ports Corporation, 2017). With construction of the first stage gas field and pipeline infrastructure now substantially completed, the future focus of all three projects in the Surat Basin will be on ensuring continuity of gas supply through expanded drilling and completions programs, and on improving infrastructure required for wholesale domestic and export gas trading via the Wallumbilla Gas Hub.
Construction of Queensland Curtis LNG’s (QCLNG) Charlie gas expansion project near Wandoan will continue into 2017, with the project being around one-third completed by September 2016 (QGC, 2016b). The project involves construction of several hundred gas wells, gas field infrastructure and pipelines that connect to Woleebee Creek Hub (QGC, 2016a).
The Gladstone LNG (GLNG) project began LNG production from its second train in Gladstone in May 2016 (Santos, 2016). The proposed Santos GLNG Gas Field Development Project in the Surat Basin received final government approvals in March 2016 (Coordinator-General, 2016b), with subsequent variations to conditions imposed in December 2016 (DoEE, 2016). The project has yet to proceed to FID.
The Australia Pacific LNG (APLNG) project commenced LNG production from its second Gladstone train in October 2016 (APLNG, 2016).
APA Group’s Reedy Creek Wallumbilla Pipeline project, which will connect the APLNG trunk pipeline at Reedy Creek to the Wallumbilla Gas Hub, is scheduled to commence construction in 2017 (APA, 2016).
Senex Energy’s Western Surat Gas project, which will produce gas for sale to the GLNG project, is targeting first gas production by the end of 2017 (Senex Energy Limited, 2016a). Although the project has yet to complete necessary approvals and reach FID, construction of pilot wells and surface infrastructure in the Glenora block north of Roma was underway in September 2016 (Senex Energy Limited, 2016b).
The future direction of some coal mining operations in the Surat Basin is not yet clear. The planned sale of Peabody Coal’s Wilkie Creek Mine, which is currently in care and maintenance, has been delayed subject to successful financing by the proposed purchaser (Peabody Energy, 2016), while final approvals for the New Acland Stage Three expansion project (New Hope Group) remain on hold pending the results of legal proceedings (Land Court of Queensland, 2017).
Two large–scale solar energy projects (the Darling Downs Solar Farm (Origin Energy) and the Oakey Solar Farm (Canadian Solar (Australia))) attracted funding from the Australian Renewable Energy Agency (ARENA) in 2016 (Qld Government, 2016), and are likely to commence construction in 2017 (ARENA, 2016). The Coopers Gap Wind Farm (AGL Energy Limited), to be located north of Dalby, has published a draft EIS which is currently being assessed (Coordinator-General, 2016a).
Projection methodology
QGSO’s 2017 to 2023 non–resident population projection methodology comprises four different series, which represent a range of possible outcomes arising from the future development of resource projects and operations in the Surat Basin. Each series estimates the cumulative non-resident population that would be present in each LGA at 30 June of each year to 2023, should the listed operations and projects proceed according to advised timeframes and workforce numbers.
Users of these projections should note that there is a degree of uncertainty about the likelihood of these projects proceeding as assumed and, as such, the projections should be regarded as being indicative scenarios rather than probabilistic predictions. QGSO does not advocate any of the projection series as being the most likely or favoured outcome. See caveats on page 9 of this report for further details.
The four projection series are based on the workforces of operations and projects at the time of preparation. Projects are categorised and included in each scenario according to their standing in the environmental impact statement (EIS) process
1.
Series A projection is based on the number of non–resident workers on-shift who were engaged in existing resource operations and associated infrastructure activities in the area at June 2016. The projection takes into account future
1 The projections also include some projects where an EIS is not or may not be mandatory.
Queensland Government Statistician’s Office
Surat Basin non–resident population projections, 2017 to 2023 3
changes to those operational workforces as advised by resource company sources, as well as the estimated non–resident construction and operational workforces of Category A projects (i.e. those that had reached FID) at the time of preparation.
Series B projection includes the Series A projection plus projected growth in the non-resident population arising from Category B projects (those that have an EIS approved but have yet to reach FID).
Series C projection includes the Series A and B projections, plus the projected growth in the non-resident population arising from Category C projects (those that have lodged an EIS, but have yet to proceed through to final approval).
Series D projection includes Series A, B and C projections, plus the projected growth in the non-resident population from Category D projects (those that have yet to publish an EIS, including projects that have lodged an initial advice statement (IAS) as well as projects that have yet to begin the approvals process). There is no Series D projection for the Surat Basin in this edition as there are no projects in Category D.
Where FID for an approved project has been delayed indefinitely, or where it is not possible to give consideration to indicative workforce data or sequencing, the project is designated as Category E and is not included in any of the four projection series. Other projects that are dependent on Category E projects in order to commence are also designated as Category E, and excluded from consideration.
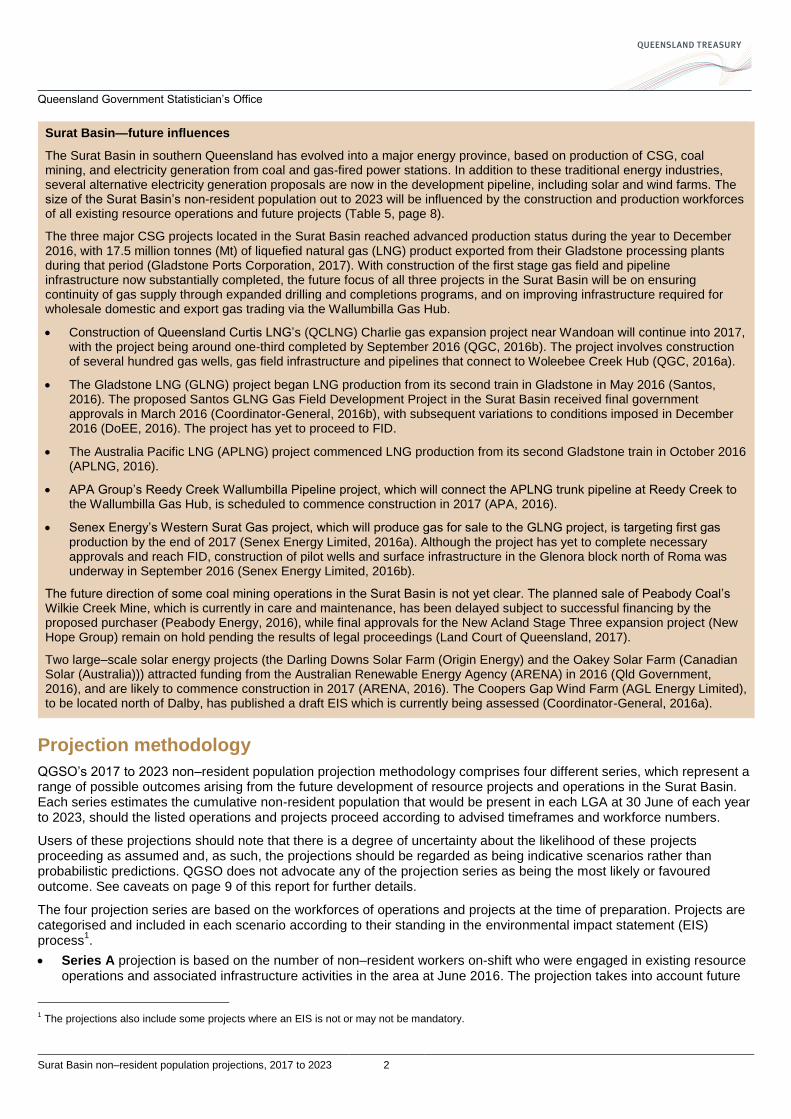
A full list of existing operations and projects included in each category is available in Table 5 (page 8), and a map of selected projects in the Surat Basin is shown in Figure 2.
Figure 2 Selected projects(a)
, Surat Basin
(a) Does not include gas field development and expansion projects, or existing gas operations. Project status is current as at December 2016. See Table 5 (page 8) for a full list of existing operations and projects by project category. Pipelines, rail corridors, and other project locations shown in map are indicative only.
Source: QGSO, 2016
Queensland Government Statistician’s Office
Surat Basin non–resident population projections, 2017 to 2023 4
Projected non-resident population, Surat Basin
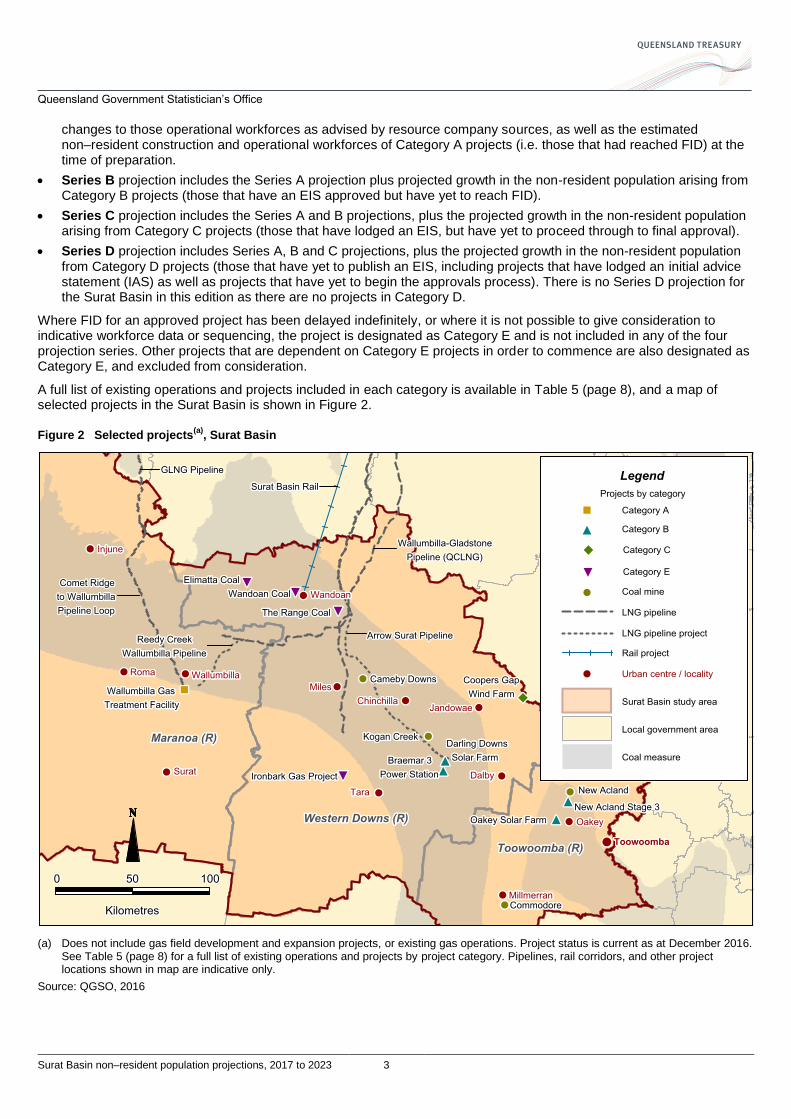
The non-resident population of the Surat Basin was 3,820 persons in June 2016, around 1,610 persons fewer than for the preceding year (Figure 3). The large CSG construction workforces that temporarily boosted the region’s non-resident population to 14,490 persons in June 2014 have largely made way for smaller production workforces as these projects reach operational status. Several new resource projects are proposed for the Surat Basin out to 2023 (Table 5, page 8), but these are unlikely to influence major changes in the number of non-resident workers on-shift in the region.
Three projection series are presented for the Surat Basin out to 2023. Under the Series A projection, the non-resident population of the Surat Basin will decrease to 3,140 persons by 2019, then remain at this level to 2023 (Table 1). This series includes the non-resident workforces of existing coal mining, CSG and power station operations, along with gas gathering, drilling and completions workforces for the three major gas field expansion projects (Table 5).
Series B projects the Surat Basin’s non-resident population to increase slightly to 3,920 persons in 2017, before falling to 3,290 persons in 2019 and 2020, then increasing to 4,110 persons by 2023. This series reflects the impacts of workforces for the Reedy Creek Wallumbilla Pipeline, the New Acland Coal Mine Stage 3 Project, the Santos GLNG Gas Field Development, Braemar 3 Power Station, Western Surat Gas project, and two solar projects.
Series C, which takes into account the construction workforces of the Coopers Gap Wind Farm project and the Nathan Dam and Pipeline project, would see the region’s non-resident population increase to 3,950 persons in 2017 and decline gradually to 3,290 persons in 2020, before reaching 4,110 persons by 2023.
There are no series D projections for the Surat Basin. None of the projection series for the region include consideration of the Arrow Surat Pipeline, Surat Gas Project, Ironbark Gas Project, Surat Basin Rail or proposed coal mining projects, which are classified as Category E (refer Table 5, page 8).
Figure 3 Past and projected non-resident population, Surat Basin
Source: QGSO estimates, 2010 to 2016; QGSO projections, 2017 to 2023
Table 1 Projected non-resident population, Surat Basin
Projection series
Number of non–resident workers on-shift at 30 June
Estimated Projected
2016 2017 2018 2019 2020 2021 2022 2023
Series A 3,820 3,540 3,190 3,140 3,140 3,140 3,140 3,140
Series B 3,820 3,920 3,580 3,290 3,290 3,500 3,900 4,110
Series C 3,820 3,950 3,810 3,390 3,290 3,500 3,900 4,110
Figures in all tables have been rounded to the nearest 10; see Notes at end of report for details.
Source: QGSO estimates, 2016; QGSO projections, 2017 to 2023
0
2,000
4,000
6,000
8,000
10,000
12,000
14,000
16,000
2010 2011 2012 2013 2014 2015 2016 2017 2018 2019 2020 2021 2022 2023
Pers
ons
Non-resident workers on-shift Series A Series B Series C
Estimated Projected
Queensland Government Statistician’s Office
Surat Basin non–resident population projections, 2017 to 2023 5
Maranoa (R)
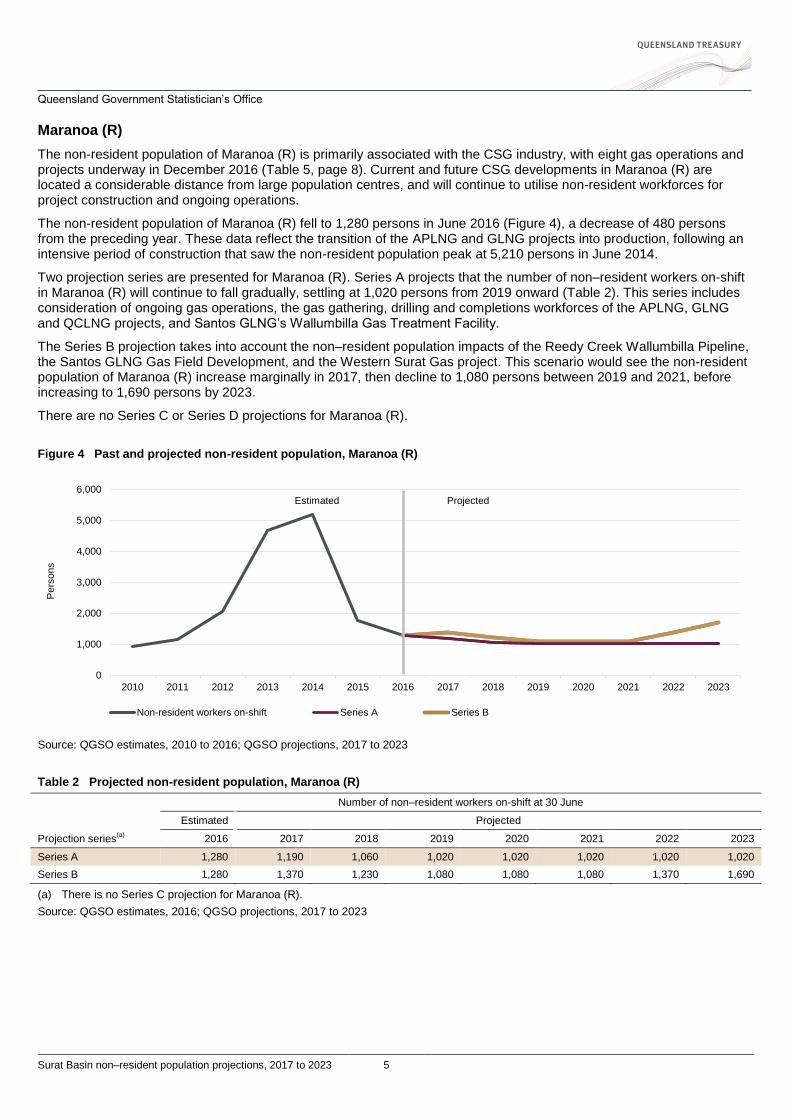
The non-resident population of Maranoa (R) is primarily associated with the CSG industry, with eight gas operations and projects underway in December 2016 (Table 5, page 8). Current and future CSG developments in Maranoa (R) are located a considerable distance from large population centres, and will continue to utilise non-resident workforces for project construction and ongoing operations.
The non-resident population of Maranoa (R) fell to 1,280 persons in June 2016 (Figure 4), a decrease of 480 persons from the preceding year. These data reflect the transition of the APLNG and GLNG projects into production, following an intensive period of construction that saw the non-resident population peak at 5,210 persons in June 2014.
Two projection series are presented for Maranoa (R). Series A projects that the number of non–resident workers on-shift in Maranoa (R) will continue to fall gradually, settling at 1,020 persons from 2019 onward (Table 2). This series includes consideration of ongoing gas operations, the gas gathering, drilling and completions workforces of the APLNG, GLNG and QCLNG projects, and Santos GLNG’s Wallumbilla Gas Treatment Facility.
The Series B projection takes into account the non–resident population impacts of the Reedy Creek Wallumbilla Pipeline, the Santos GLNG Gas Field Development, and the Western Surat Gas project. This scenario would see the non-resident population of Maranoa (R) increase marginally in 2017, then decline to 1,080 persons between 2019 and 2021, before increasing to 1,690 persons by 2023.
There are no Series C or Series D projections for Maranoa (R).
Figure 4 Past and projected non-resident population, Maranoa (R)
Source: QGSO estimates, 2010 to 2016; QGSO projections, 2017 to 2023
Table 2 Projected non-resident population, Maranoa (R)
Projection series(a)
Number of non–resident workers on-shift at 30 June
Estimated Projected
2016 2017 2018 2019 2020 2021 2022 2023
Series A 1,280 1,190 1,060 1,020 1,020 1,020 1,020 1,020
Series B 1,280 1,370 1,230 1,080 1,080 1,080 1,370 1,690
(a) There is no Series C projection for Maranoa (R).
Source: QGSO estimates, 2016; QGSO projections, 2017 to 2023
0
1,000
2,000
3,000
4,000
5,000
6,000
2010 2011 2012 2013 2014 2015 2016 2017 2018 2019 2020 2021 2022 2023
Pers
ons
Non-resident workers on-shift Series A Series B
Estimated Projected
Queensland Government Statistician’s Office
Surat Basin non–resident population projections, 2017 to 2023 6
Western Downs (R)
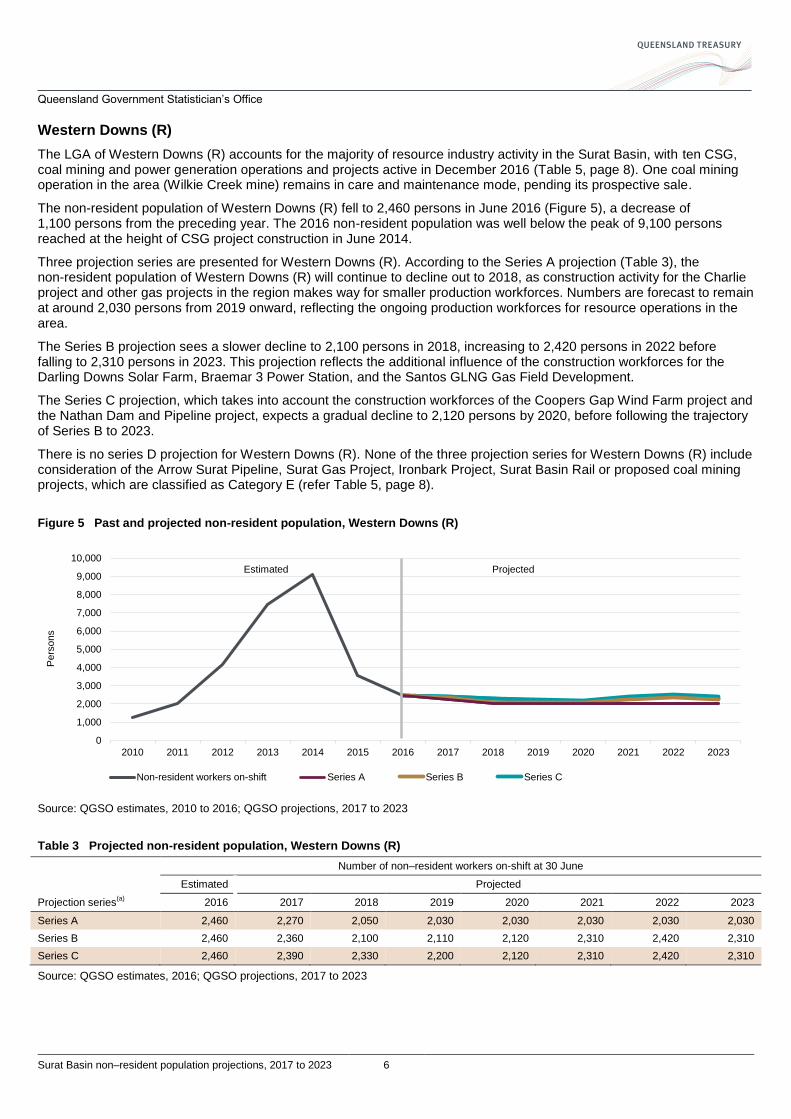
The LGA of Western Downs (R) accounts for the majority of resource industry activity in the Surat Basin, with ten CSG, coal mining and power generation operations and projects active in December 2016 (Table 5, page 8). One coal mining operation in the area (Wilkie Creek mine) remains in care and maintenance mode, pending its prospective sale.
The non-resident population of Western Downs (R) fell to 2,460 persons in June 2016 (Figure 5), a decrease of 1,100 persons from the preceding year. The 2016 non-resident population was well below the peak of 9,100 persons reached at the height of CSG project construction in June 2014.
Three projection series are presented for Western Downs (R). According to the Series A projection (Table 3), the non-resident population of Western Downs (R) will continue to decline out to 2018, as construction activity for the Charlie project and other gas projects in the region makes way for smaller production workforces. Numbers are forecast to remain at around 2,030 persons from 2019 onward, reflecting the ongoing production workforces for resource operations in the area.
The Series B projection sees a slower decline to 2,100 persons in 2018, increasing to 2,420 persons in 2022 before falling to 2,310 persons in 2023. This projection reflects the additional influence of the construction workforces for the Darling Downs Solar Farm, Braemar 3 Power Station, and the Santos GLNG Gas Field Development.
The Series C projection, which takes into account the construction workforces of the Coopers Gap Wind Farm project and the Nathan Dam and Pipeline project, expects a gradual decline to 2,120 persons by 2020, before following the trajectory of Series B to 2023.
There is no series D projection for Western Downs (R). None of the three projection series for Western Downs (R) include consideration of the Arrow Surat Pipeline, Surat Gas Project, Ironbark Project, Surat Basin Rail or proposed coal mining projects, which are classified as Category E (refer Table 5, page 8).
Figure 5 Past and projected non-resident population, Western Downs (R)
Source: QGSO estimates, 2010 to 2016; QGSO projections, 2017 to 2023
Table 3 Projected non-resident population, Western Downs (R)
Projection series(a)
Number of non–resident workers on-shift at 30 June
Estimated Projected
2016 2017 2018 2019 2020 2021 2022 2023
Series A 2,460 2,270 2,050 2,030 2,030 2,030 2,030 2,030
Series B 2,460 2,360 2,100 2,110 2,120 2,310 2,420 2,310
Series C 2,460 2,390 2,330 2,200 2,120 2,310 2,420 2,310
Source: QGSO estimates, 2016; QGSO projections, 2017 to 2023
0
1,000
2,000
3,000
4,000
5,000
6,000
7,000
8,000
9,000
10,000
2010 2011 2012 2013 2014 2015 2016 2017 2018 2019 2020 2021 2022 2023
Pers
ons
Non-resident workers on-shift Series A Series B Series C
Estimated Projected
Queensland Government Statistician’s Office
Surat Basin non–resident population projections, 2017 to 2023 7
Toowoomba (R)
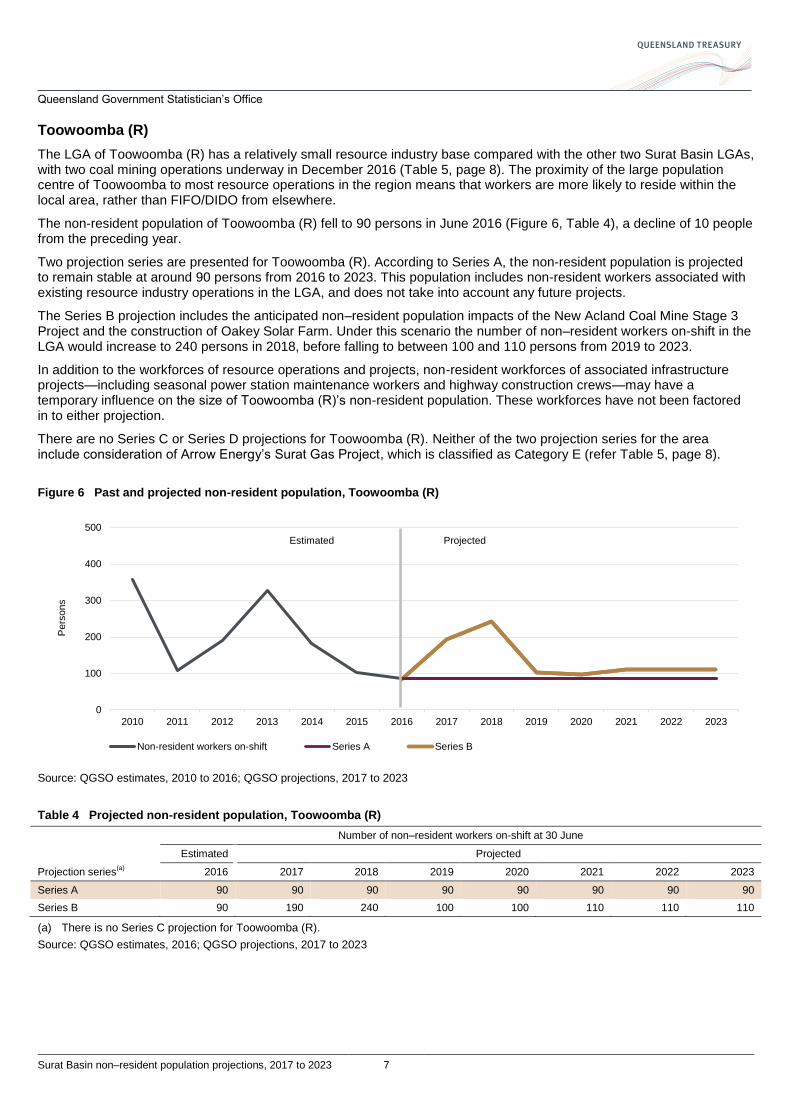
The LGA of Toowoomba (R) has a relatively small resource industry base compared with the other two Surat Basin LGAs, with two coal mining operations underway in December 2016 (Table 5, page 8). The proximity of the large population centre of Toowoomba to most resource operations in the region means that workers are more likely to reside within the local area, rather than FIFO/DIDO from elsewhere.
The non-resident population of Toowoomba (R) fell to 90 persons in June 2016 (Figure 6, Table 4), a decline of 10 people from the preceding year.
Two projection series are presented for Toowoomba (R). According to Series A, the non-resident population is projected to remain stable at around 90 persons from 2016 to 2023. This population includes non-resident workers associated with existing resource industry operations in the LGA, and does not take into account any future projects.
The Series B projection includes the anticipated non–resident population impacts of the New Acland Coal Mine Stage 3 Project and the construction of Oakey Solar Farm. Under this scenario the number of non–resident workers on-shift in the LGA would increase to 240 persons in 2018, before falling to between 100 and 110 persons from 2019 to 2023.
In addition to the workforces of resource operations and projects, non-resident workforces of associated infrastructure projects—including seasonal power station maintenance workers and highway construction crews—may have a temporary influence on the size of Toowoomba (R)’s non-resident population. These workforces have not been factored in to either projection.
There are no Series C or Series D projections for Toowoomba (R). Neither of the two projection series for the area include consideration of Arrow Energy’s Surat Gas Project, which is classified as Category E (refer Table 5, page 8).
Figure 6 Past and projected non-resident population, Toowoomba (R)
Source: QGSO estimates, 2010 to 2016; QGSO projections, 2017 to 2023
Table 4 Projected non-resident population, Toowoomba (R)
Projection series(a)
Number of non–resident workers on-shift at 30 June
Estimated Projected
2016 2017 2018 2019 2020 2021 2022 2023
Series A 90 90 90 90 90 90 90 90
Series B 90 190 240 100 100 110 110 110
(a) There is no Series C projection for Toowoomba (R).
Source: QGSO estimates, 2016; QGSO projections, 2017 to 2023
0
100
200
300
400
500
2010 2011 2012 2013 2014 2015 2016 2017 2018 2019 2020 2021 2022 2023
Pe
rsons
Non-resident workers on-shift Series A Series B
Estimated Projected
Queensland Government Statistician’s Office
Surat Basin non–resident population projections, 2017 to 2023 8
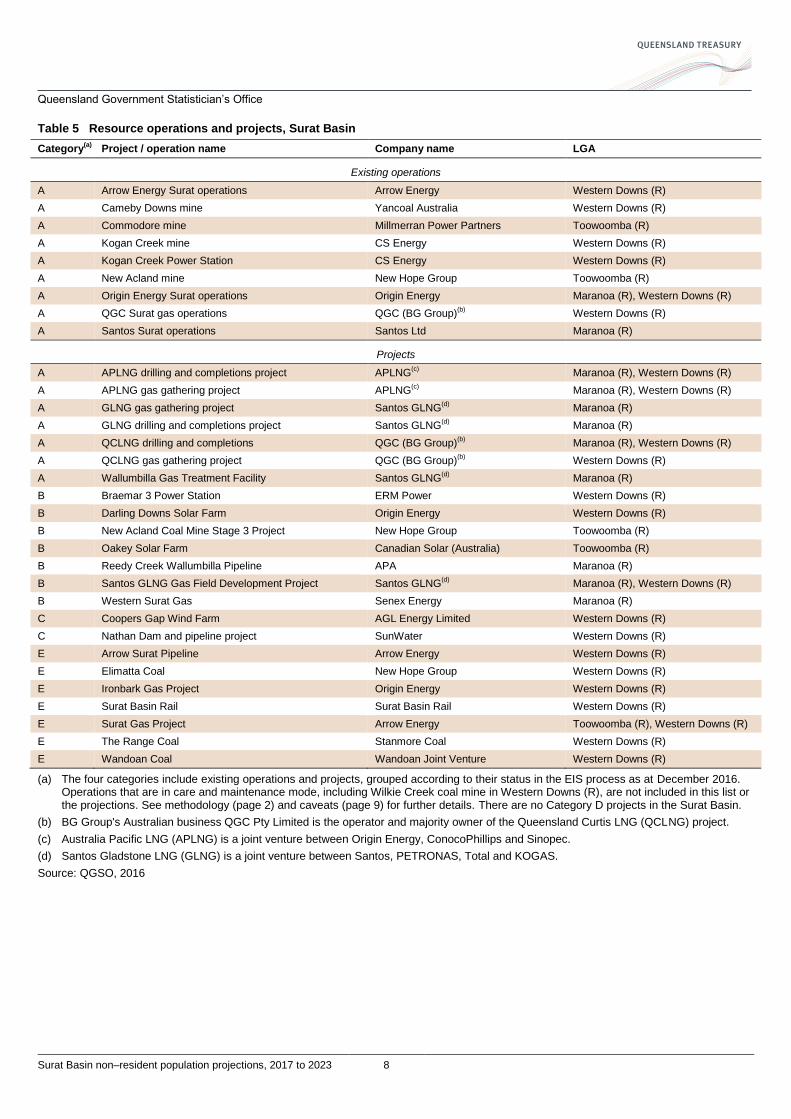
Table 5 Resource operations and projects, Surat Basin
Category(a)
Project / operation name Company name LGA
Existing operations
A Arrow Energy Surat operations Arrow Energy Western Downs (R)
A Cameby Downs mine Yancoal Australia Western Downs (R)
A Commodore mine Millmerran Power Partners Toowoomba (R)
A Kogan Creek mine CS Energy Western Downs (R)
A Kogan Creek Power Station CS Energy Western Downs (R)
A New Acland mine New Hope Group Toowoomba (R)
A Origin Energy Surat operations Origin Energy Maranoa (R), Western Downs (R)
A QGC Surat gas operations QGC (BG Group)(b)
Western Downs (R)
A Santos Surat operations Santos Ltd Maranoa (R)
Projects
A APLNG drilling and completions project APLNG(c)
Maranoa (R), Western Downs (R)
A APLNG gas gathering project APLNG(c)
Maranoa (R), Western Downs (R)
A GLNG gas gathering project Santos GLNG(d)
Maranoa (R)
A GLNG drilling and completions project Santos GLNG(d)
Maranoa (R)
A QCLNG drilling and completions QGC (BG Group)(b)
Maranoa (R), Western Downs (R)
A QCLNG gas gathering project QGC (BG Group)(b)
Western Downs (R)
A Wallumbilla Gas Treatment Facility Santos GLNG(d)
Maranoa (R)
B Braemar 3 Power Station ERM Power Western Downs (R)
B Darling Downs Solar Farm Origin Energy Western Downs (R)
B New Acland Coal Mine Stage 3 Project New Hope Group Toowoomba (R)
B Oakey Solar Farm Canadian Solar (Australia) Toowoomba (R)
B Reedy Creek Wallumbilla Pipeline APA Maranoa (R)
B Santos GLNG Gas Field Development Project Santos GLNG(d)
Maranoa (R), Western Downs (R)
B Western Surat Gas Senex Energy Maranoa (R)
C Coopers Gap Wind Farm AGL Energy Limited Western Downs (R)
C Nathan Dam and pipeline project SunWater Western Downs (R)
E Arrow Surat Pipeline Arrow Energy Western Downs (R)
E Elimatta Coal New Hope Group Western Downs (R)
E Ironbark Gas Project Origin Energy Western Downs (R)
E Surat Basin Rail Surat Basin Rail Western Downs (R)
E Surat Gas Project Arrow Energy Toowoomba (R), Western Downs (R)
E The Range Coal Stanmore Coal Western Downs (R)
E Wandoan Coal Wandoan Joint Venture Western Downs (R)
(a) The four categories include existing operations and projects, grouped according to their status in the EIS process as at December 2016. Operations that are in care and maintenance mode, including Wilkie Creek coal mine in Western Downs (R), are not included in this list or the projections. See methodology (page 2) and caveats (page 9) for further details. There are no Category D projects in the Surat Basin.
(b) BG Group's Australian business QGC Pty Limited is the operator and majority owner of the Queensland Curtis LNG (QCLNG) project.
(c) Australia Pacific LNG (APLNG) is a joint venture between Origin Energy, ConocoPhillips and Sinopec.
(d) Santos Gladstone LNG (GLNG) is a joint venture between Santos, PETRONAS, Total and KOGAS.
Source: QGSO, 2016
Queensland Government Statistician’s Office
Surat Basin non–resident population projections, 2017 to 2023 9
Caveats
QGSO’s non–resident population projections provide an estimate of the number of non–resident workers on-shift by LGA. They are based on the on-shift non–resident worker population estimates established in previous years and take into account future workforce growth arising from resource industry and infrastructure projects planned for the region, as reported directly by resource companies.
Projections are based on the best available data and advice at the time of preparation. Non-resident populations are projected for the period to 2023 only, as it is considered that the reliability of information regarding future projects diminishes considerably beyond that point. Projected numbers of non–resident workers on-shift presented in this report represent an estimate for 30 June of the indicated year. Temporary peaks and falls in project workforces may occur in between these mid-year estimates for successive years.
The four projection series represent a range of possible outcomes based on the status of projects in the EIS process at the time of production in December 2016 (see the projection methodology, page 2, for further details). These outcomes are subject to change over time as projects proceed through the approvals process. Projections reflect the cumulative impacts of multiple projects at a given point in time, and changes to any individual project will affect the projected cumulative outcome.
Category E comprises projects that have completed the approvals process but where FID has been delayed indefinitely; projects where it is not possible to give consideration to indicative workforce data or sequencing; and other projects that are dependent on the commencement of projects in this category. These projects could not be allocated to a projection series at the time of preparation. Changes in the status of these projects could substantially alter any or all of the possible outcomes represented by the four projection series.
The projections reflect certain assumptions about the likelihood of projects advancing according to advised commencement dates, sequencing of project stages and timing of workforce peaks. Changes to any of these factors can make a significant difference to the cumulative non-resident workforce at a given point in time, particularly during construction phases. Short-term influences such as extreme weather events, industrial action, and supply chain delays can all result in changes to project scheduling and to these projections.
QGSO does not advocate any one series as being the most likely or favoured outcome and users should consider the assumptions affecting each potential scenario. Given the volatile nature of the resource sector and the inherent uncertainty about the likelihood of projects proceeding as indicated, these projections should be considered as being indicative of the range of potential outcomes rather than literal accounts of future growth.
Notes
(R) – Regional Council
Non-resident workers are people who fly-in/fly-out or drive-in/drive-out (FIFO/DIDO) to work and live in the area temporarily while rostered on, and who have their usual place of residence elsewhere. Non-resident workers include FIFO/DIDO mining and gas industry employees and contractors, construction workers and associated sub-contractors. Figures in this report refer to the number of non–resident workers on-shift, or present in the area at a given point in time, and should not be confused with total non–resident workforce numbers.
Data in this report are derived from surveys conducted by QGSO in 2016 and other sources. The Survey of Accommodation Providers counted the number of non–resident workers on-shift during the last week of June 2016. See the Surat Basin population report, 2016 http://www.qgso.qld.gov.au/products/publications/surat-basin-pop-report/index.php for further details. The Resource Operations Employment Survey and the Resource Projects Employment Survey gathered workforce information from companies with existing operations or future projects in the Surat Basin at June 2016. A full list of existing operations and projects is available in Table 5 of this report.
The total number of non–resident workers on-shift for the Surat Basin represents the aggregate non-resident populations of all LGAs in the region. This total may include a small number of non-resident workers in each LGA who live elsewhere within the Surat Basin.
Figures in tables have been rounded to the nearest 10. As a result of rounding, discrepancies may occur between sums of the component items and totals. Percentages and other calculations are made prior to rounding of figures and discrepancies might therefore exist between these calculations and those that could be derived from the rounded figures.
Data tables to supplement this report are available on-line at http://www.qgso.qld.gov.au/products/tables/index.php.
Queensland Government Statistician’s Office
Surat Basin non–resident population projections, 2017 to 2023 10
References
APA (2016) APA expands its East Coast Grid with Reedy Creek Wallumbilla Pipeline, 6 September 2016
https://www.apa.com.au/news/asx-releases/2016/rcwp-announcement/
APLNG (2016) Australia Pacific LNG second train starts production, 10 October 2016 http://www.aplng.com.au/content/dam/aplng/media-release/2016/10102016%20Media%20Release%20APLNG%20Train%202%20FINAL.pdf
Australian Renewable Energy Agency (ARENA) (2016) Historic day for Australian solar as 12 new plants get support, 8 September 2016 https://arena.gov.au/wp-content/uploads/2016/09/ARENA-MEDIA-FACT-SHEET-Historic-day-for-Australian-solar-as-12-new-plants-get-support.pdf
Coordinator-General (2016a) Coopers Gap Wind Farm http://www.coordinatorgeneral.qld.gov.au/assessments-and-approvals/coopers-
gap-wind-farm.html
Coordinator-General (2016b) Santos GLNG Gas Field Development Project http://www.coordinatorgeneral.qld.gov.au/assessments-and-approvals/santos-glng-gas-field-development-project.html
Department of Environment and Energy (DoEE) (2016) Variation to conditions attached to approval – Santos GLNG Gas Field Development Project http://epbcnotices.environment.gov.au/_entity/annotation/2924d767-a6c8-e611-bdfe-005056ba00a8/a71d58ad-
4cba-48b6-8dab-f3091fc31cd5?t=1484031244556
Gladstone Ports Corporation (2017) Trade Statistics http://www.gpcl.com.au/Pages/Trade-Statistics.aspx
Land Court of Queensland (2017) New Acland Coal Pty Ltd v Ashman & Ors (No. 3) [2017] QLC 1 http://www.sclqld.org.au/caselaw/QLC/2017/001
Peabody Energy (2016) Peabody Energy Announces Agreement To Sell Interest In Prairie State Energy Campus; Updates Asset Sales Initiatives, 21 January 2016 http://www.peabodyenergy.com/investor-news-release-details.aspx?nr=908
QGC (2016a) Operations Bulletin, June 2016 http://www.bg-group.com/assets/files/cms/45606_QGC_Operations_Bulletin_June_2016_F.pdf
QGC (2016b) Operations Bulletin, September 2016 http://www.bg-group.com/assets/files/cms/45966_QGC_Operations_Bulletin_September_2016_F_WEB.pdf
Queensland Government (2016) Super solar boost to jobs and investment for Queensland, 8 September 2016 http://statements.qld.gov.au/Statement/2016/9/8/super-solar-boost-to-jobs-and-investment-for-queensland
Santos GLNG (2016) First LNG from GLNG train 2, 26 May 2016 http://www.santosglng.com/media-centre/media-releases/first-lng-from-glng-train-2.aspx
Senex Energy Limited (2016a) Half year report for the period ended 31 December 2015, February 2016 http://www.senexenergy.com.au/wp-content/uploads/2016/02/FY-16-half-year-announcement-and-report.pdf
Senex Energy Limited (2016b) Quarterly Report, September 2016 http://www.senexenergy.com.au/wp-content/uploads/2016/10/2016-10-17-September-Quarterly-Report-FINAL.pdf