Embed Size (px)
Citation preview
Ethnic Population Projections for the UK and Local Areas, 2011-2061:
New Results for the Fourth Demographic Transition
ESRC, Ref ES/L013878/1
Evaluation, Revision and Extension of Ethnic Population
Projections – NewETHPOP
Jan 2015 - May 2016
HEIF, University of Leeds
Helping governments and businesses understand the ethnic
transition and use information on future ethnic populations
May - Oct 2015
School of Geography FACULTY OF ENVIRONMENT
Philip Rees1, Pia Wohland2, Stephen Clark1, Nik Lomax1, Paul Norman1
1University of Leeds, 2Hull-York Medical School
Presentation at the British Society for Population Studies, Annual Conference, Leeds, 7-9 September 2015, Session, Demographic projections: ethnicity & projections
Web: http://www.ethpop.org
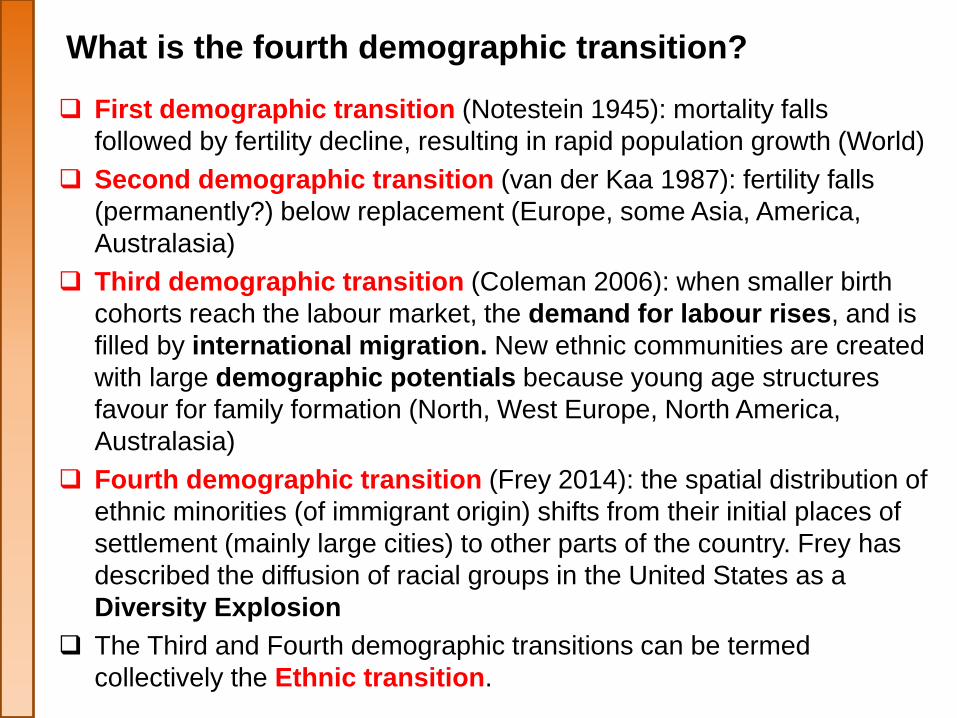
What is the fourth demographic transition?
First demographic transition (Notestein 1945): mortality falls
followed by fertility decline, resulting in rapid population growth (World)
Second demographic transition (van der Kaa 1987): fertility falls
(permanently?) below replacement (Europe, some Asia, America,
Australasia)
Third demographic transition (Coleman 2006): when smaller birth
cohorts reach the labour market, the demand for labour rises, and is
filled by international migration. New ethnic communities are created
with large demographic potentials because young age structures
favour for family formation (North, West Europe, North America,
Australasia)
Fourth demographic transition (Frey 2014): the spatial distribution of
ethnic minorities (of immigrant origin) shifts from their initial places of
settlement (mainly large cities) to other parts of the country. Frey has
described the diffusion of racial groups in the United States as a
Diversity Explosion
The Third and Fourth demographic transitions can be termed
collectively the Ethnic transition.
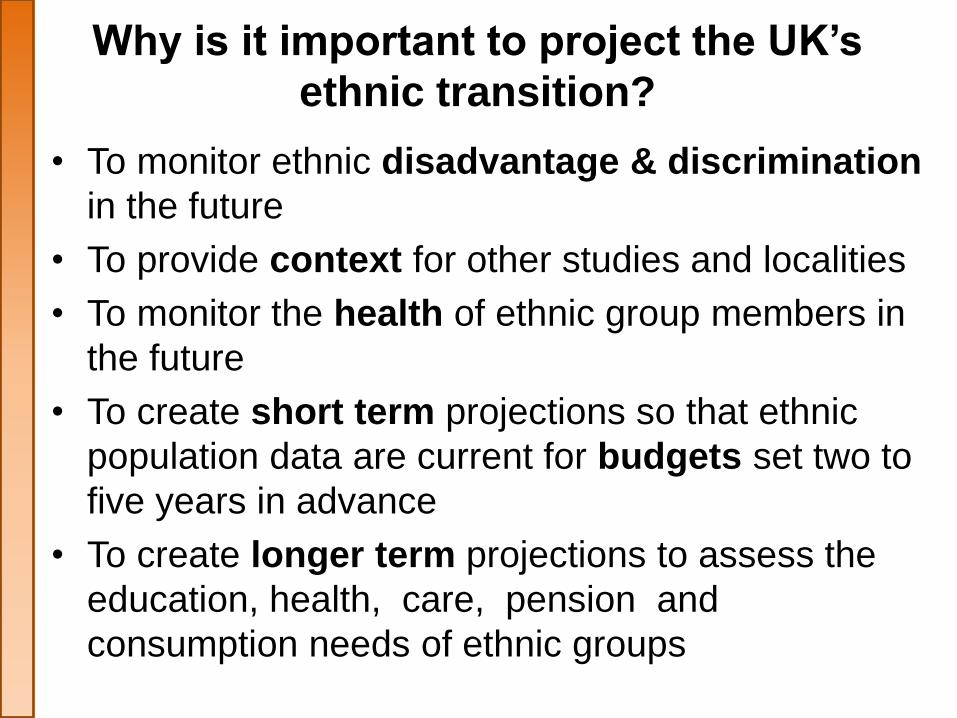
Why is it important to project the UK’s
ethnic transition?
• To monitor ethnic disadvantage & discrimination
in the future
• To provide context for other studies and localities
• To monitor the health of ethnic group members in
the future
• To create short term projections so that ethnic
population data are current for budgets set two to
five years in advance
• To create longer term projections to assess the
education, health, care, pension and
consumption needs of ethnic groups
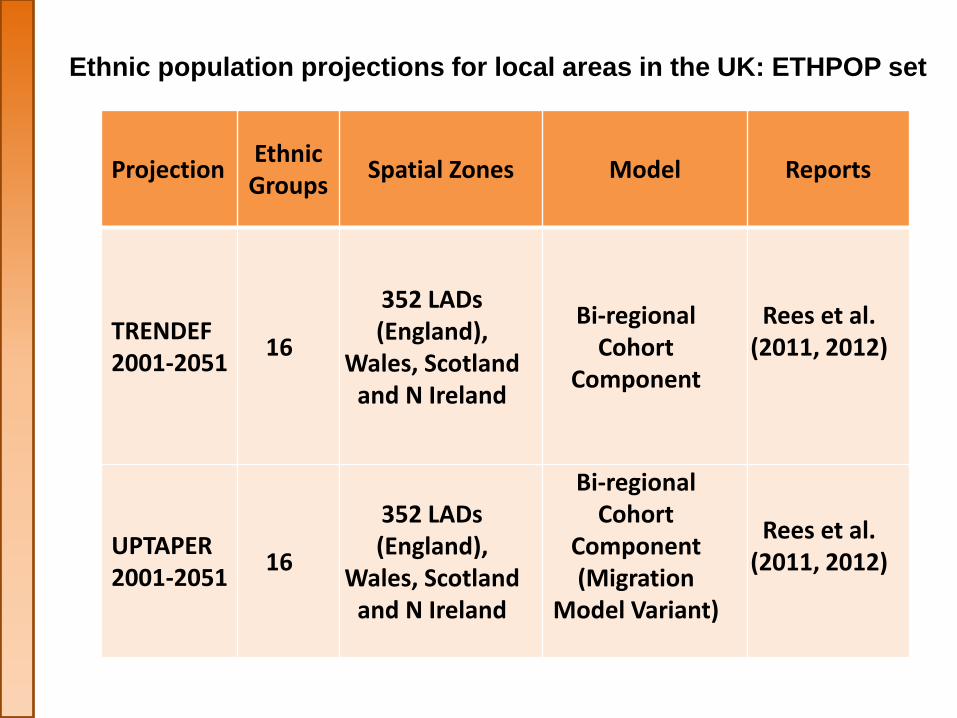
Projection Ethnic Groups
Spatial Zones Model Reports
TRENDEF 2001-2051
16
352 LADs (England),
Wales, Scotland and N Ireland
Bi-regional Cohort
Component
Rees et al. (2011, 2012)
UPTAPER 2001-2051
16
352 LADs (England),
Wales, Scotland and N Ireland
Bi-regional Cohort
Component (Migration
Model Variant)
Rees et al. (2011, 2012)
Ethnic population projections for local areas in the UK: ETHPOP set
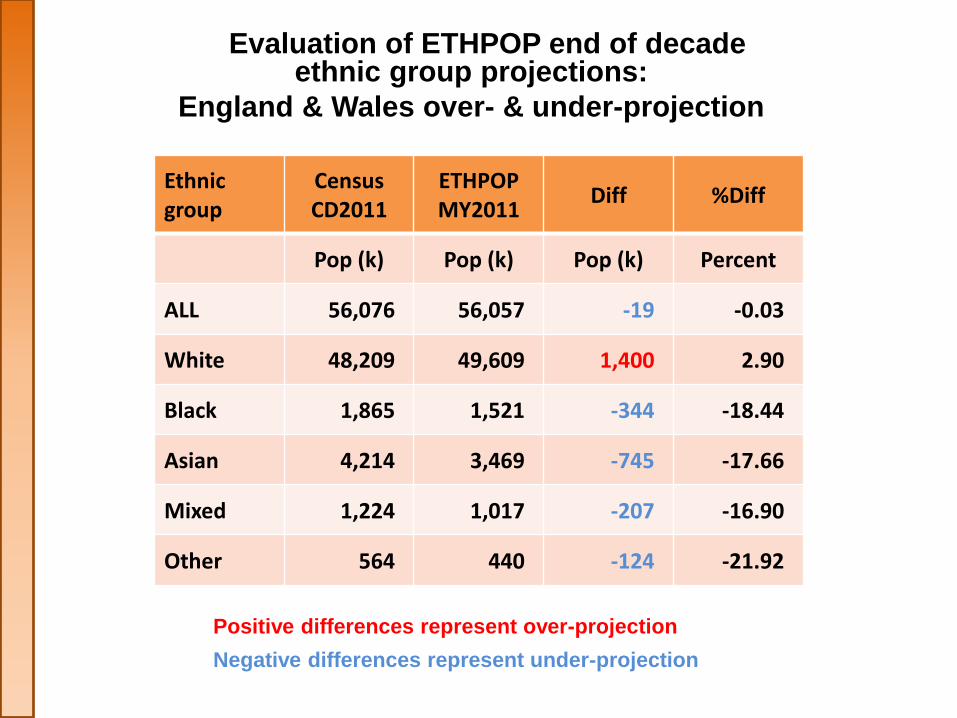
Ethnic group
Census CD2011
ETHPOP MY2011
Diff %Diff
Pop (k) Pop (k) Pop (k) Percent
ALL 56,076 56,057 -19 -0.03
White 48,209 49,609 1,400 2.90
Black 1,865 1,521 -344 -18.44
Asian 4,214 3,469 -745 -17.66
Mixed 1,224 1,017 -207 -16.90
Other 564 440 -124 -21.92
Positive differences represent over-projection
Negative differences represent under-projection
Evaluation of ETHPOP end of decade ethnic group projections:
England & Wales over- & under-projection
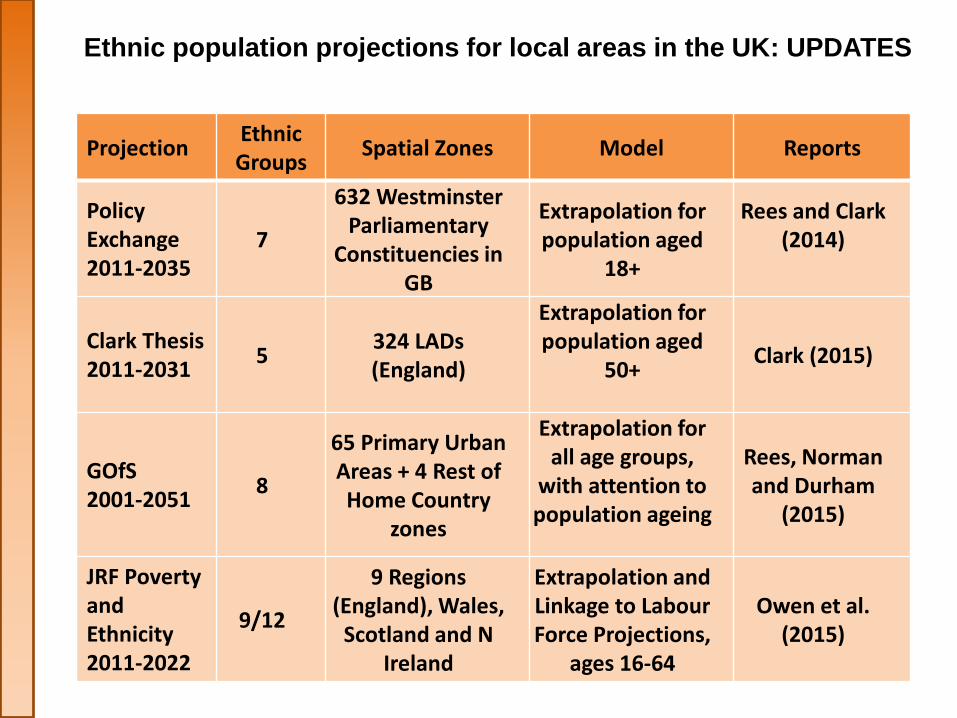
Projection Ethnic Groups
Spatial Zones Model Reports
Policy Exchange 2011-2035
7
632 Westminster Parliamentary
Constituencies in GB
Extrapolation for population aged
18+
Rees and Clark (2014)
Clark Thesis 2011-2031
5 324 LADs (England)
Extrapolation for population aged
50+
Clark (2015)
GOfS 2001-2051
8
65 Primary Urban Areas + 4 Rest of Home Country
zones
Extrapolation for all age groups,
with attention to population ageing
Rees, Norman and Durham
(2015)
JRF Poverty and Ethnicity 2011-2022
9/12
9 Regions (England), Wales,
Scotland and N Ireland
Extrapolation and Linkage to Labour Force Projections,
ages 16-64
Owen et al. (2015)
Ethnic population projections for local areas in the UK: UPDATES
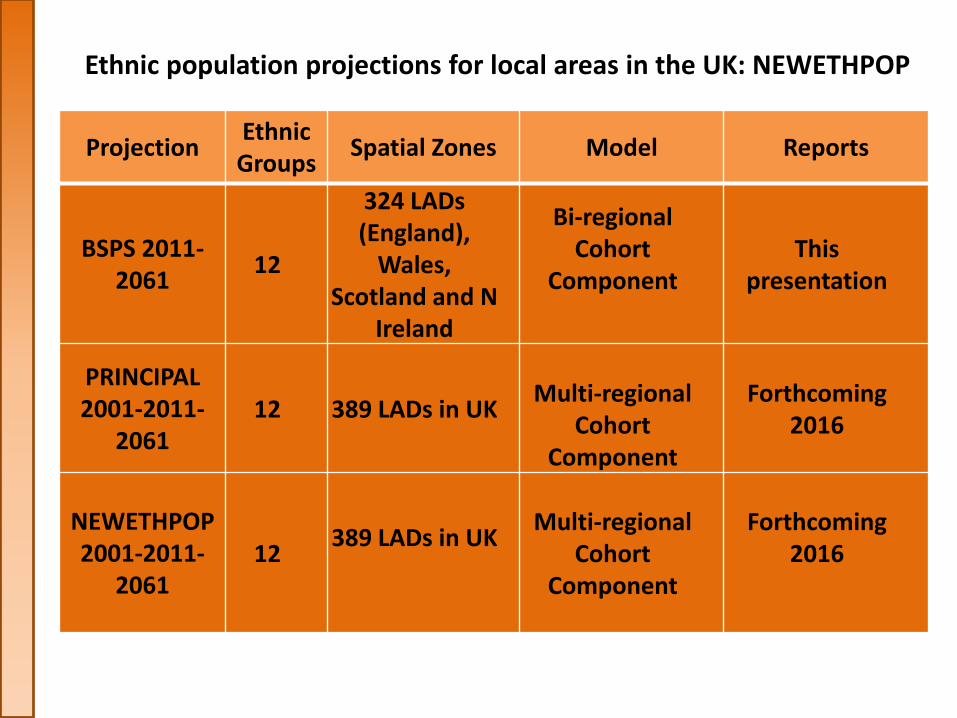
Projection Ethnic Groups
Spatial Zones Model Reports
BSPS 2011-2061
12
324 LADs (England),
Wales, Scotland and N
Ireland
Bi-regional Cohort
Component
This presentation
PRINCIPAL 2001-2011-
2061 12 389 LADs in UK
Multi-regional
Cohort Component
Forthcoming 2016
NEWETHPOP 2001-2011-
2061 12
389 LADs in UK
Multi-regional
Cohort Component
Forthcoming 2016
Ethnic population projections for local areas in the UK: NEWETHPOP
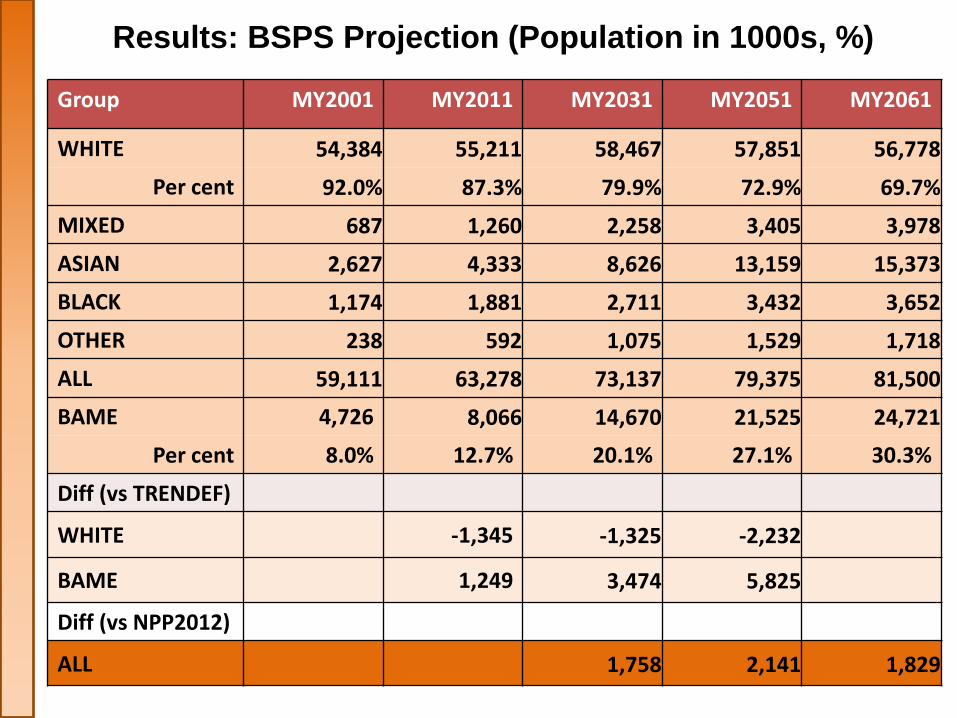
Results: BSPS Projection (Population in 1000s, %)
Group MY2001 MY2011 MY2031 MY2051 MY2061
WHITE 54,384 55,211 58,467 57,851 56,778
Per cent 92.0% 87.3% 79.9% 72.9% 69.7%
MIXED 687 1,260 2,258 3,405 3,978
ASIAN 2,627 4,333 8,626 13,159 15,373
BLACK 1,174 1,881 2,711 3,432 3,652
OTHER 238 592 1,075 1,529 1,718
ALL 59,111 63,278 73,137 79,375 81,500
BAME 4,726 8,066 14,670 21,525 24,721
Per cent 8.0% 12.7% 20.1% 27.1% 30.3%
Diff (vs TRENDEF)
WHITE -1,345 -1,325 -2,232
BAME 1,249 3,474 5,825
Diff (vs NPP2012)
ALL 1,758 2,141 1,829
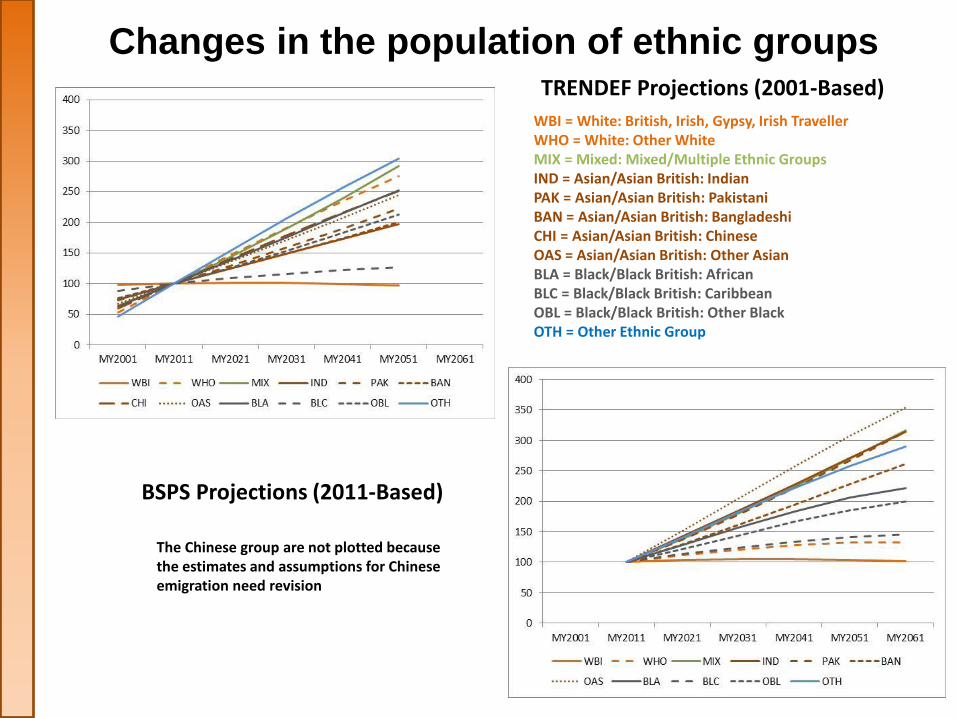
Changes in the population of ethnic groups TRENDEF Projections (2001-Based)
BSPS Projections (2011-Based)
WBI = White: British, Irish, Gypsy, Irish Traveller WHO = White: Other White MIX = Mixed: Mixed/Multiple Ethnic Groups IND = Asian/Asian British: Indian PAK = Asian/Asian British: Pakistani BAN = Asian/Asian British: Bangladeshi CHI = Asian/Asian British: Chinese OAS = Asian/Asian British: Other Asian BLA = Black/Black British: African BLC = Black/Black British: Caribbean OBL = Black/Black British: Other Black OTH = Other Ethnic Group
The Chinese group are not plotted because the estimates and assumptions for Chinese emigration need revision
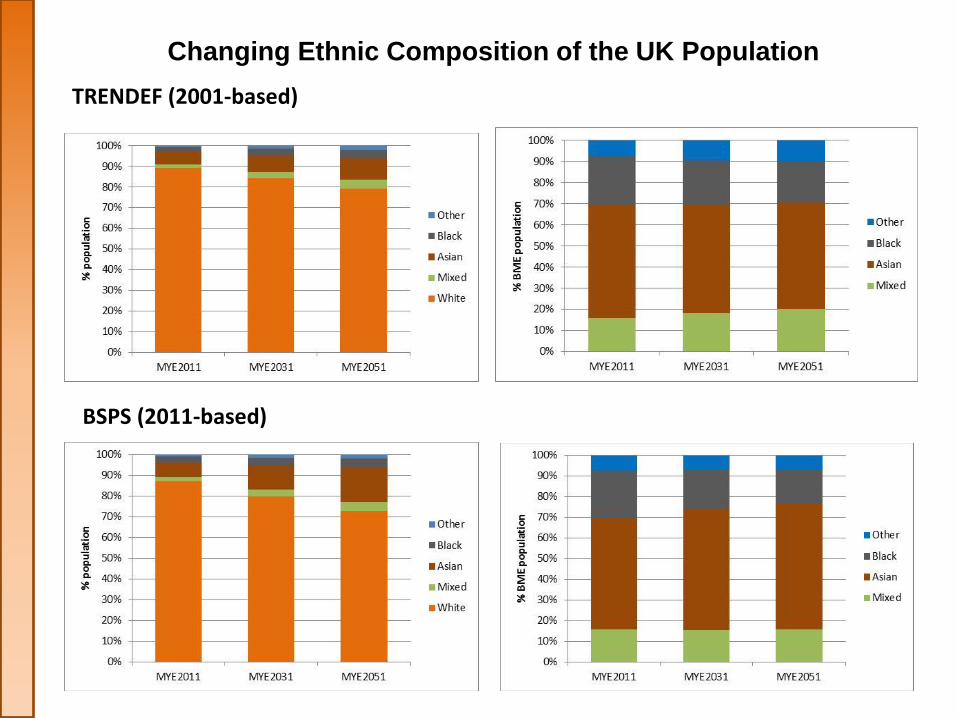
Changing Ethnic Composition of the UK Population
BSPS (2011-based)
TRENDEF (2001-based)
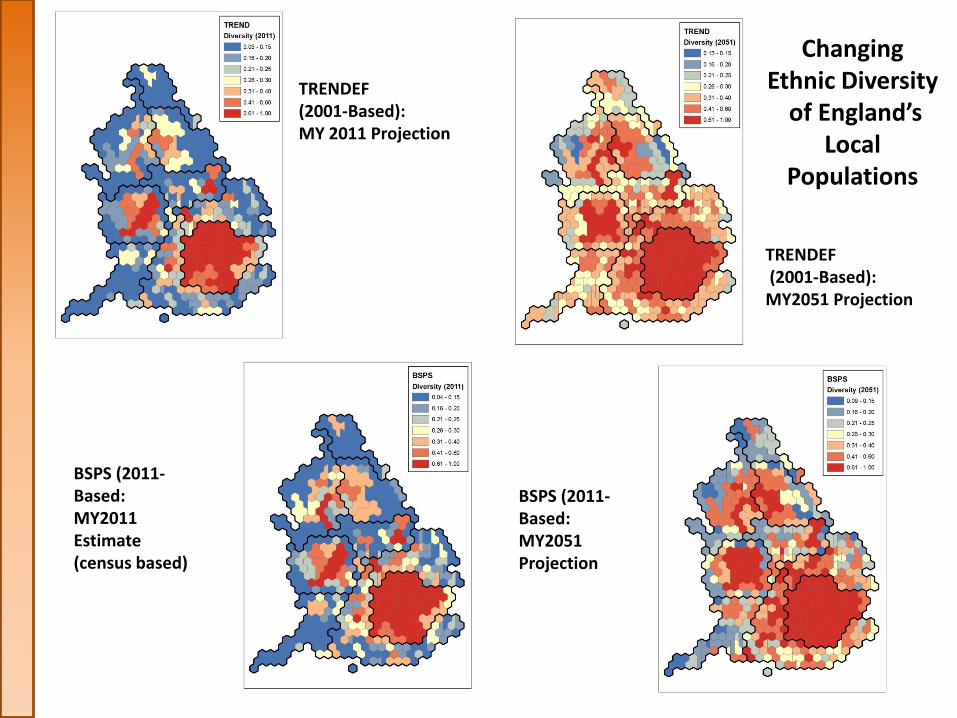
Changing Ethnic Diversity
of England’s Local
Populations
TRENDEF (2001-Based): MY 2011 Projection
TRENDEF (2001-Based): MY2051 Projection
BSPS (2011-Based: MY2011 Estimate (census based)
BSPS (2011-Based: MY2051 Projection
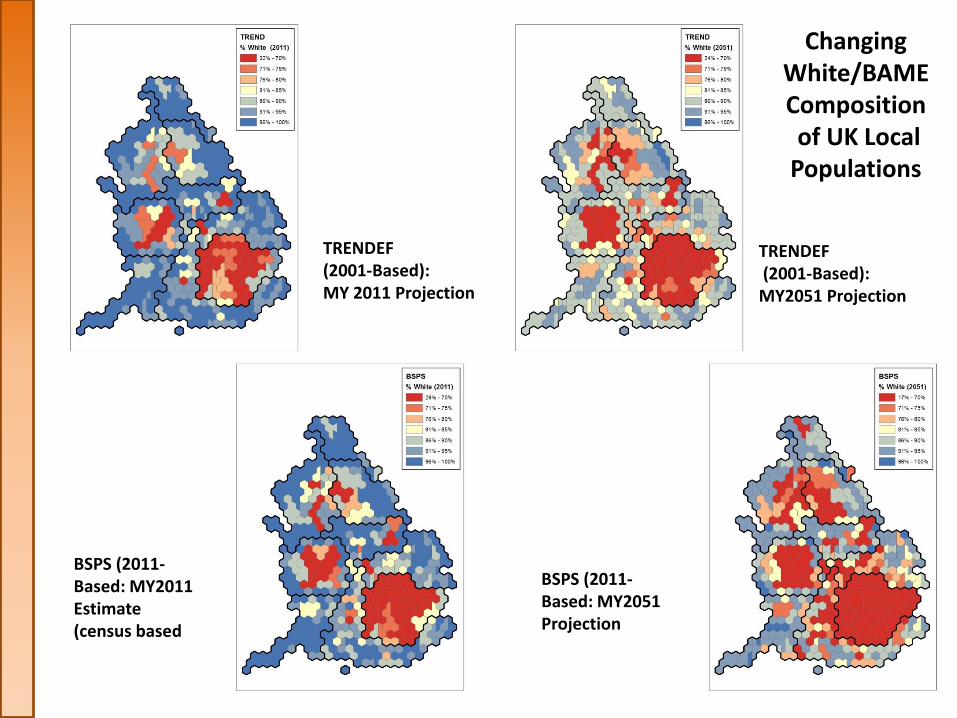
Changing White/BAME Composition of UK Local Populations
TRENDEF (2001-Based): MY 2011 Projection
BSPS (2011-Based: MY2011 Estimate (census based
TRENDEF (2001-Based): MY2051 Projection
BSPS (2011-Based: MY2051 Projection
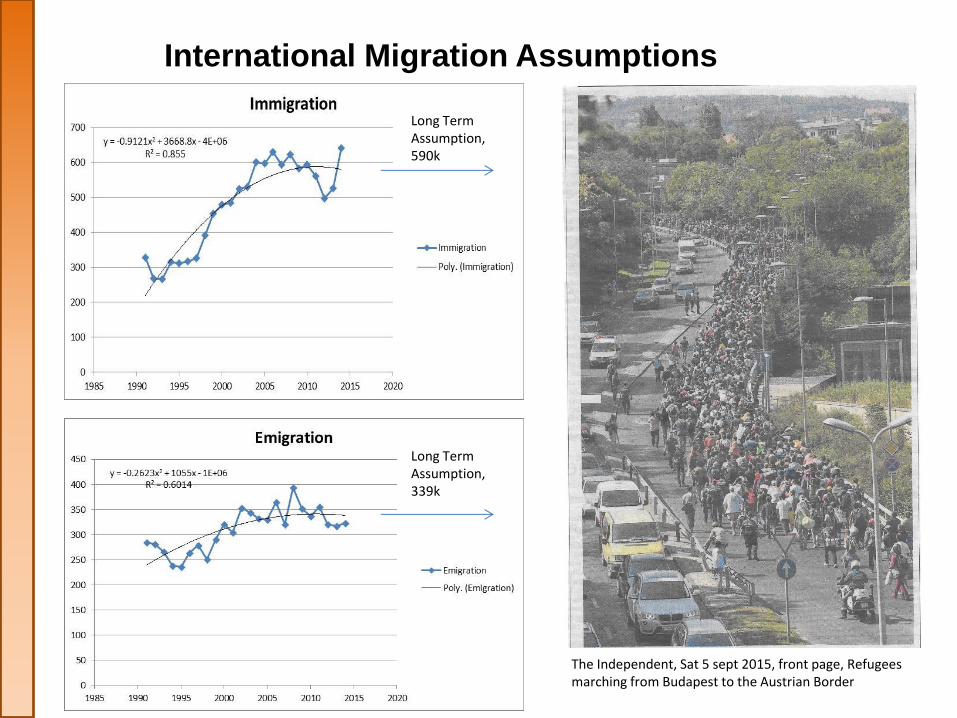
International Migration Assumptions
The Independent, Sat 5 sept 2015, front page, Refugees marching from Budapest to the Austrian Border
Long Term Assumption, 590k
Long Term Assumption, 339k
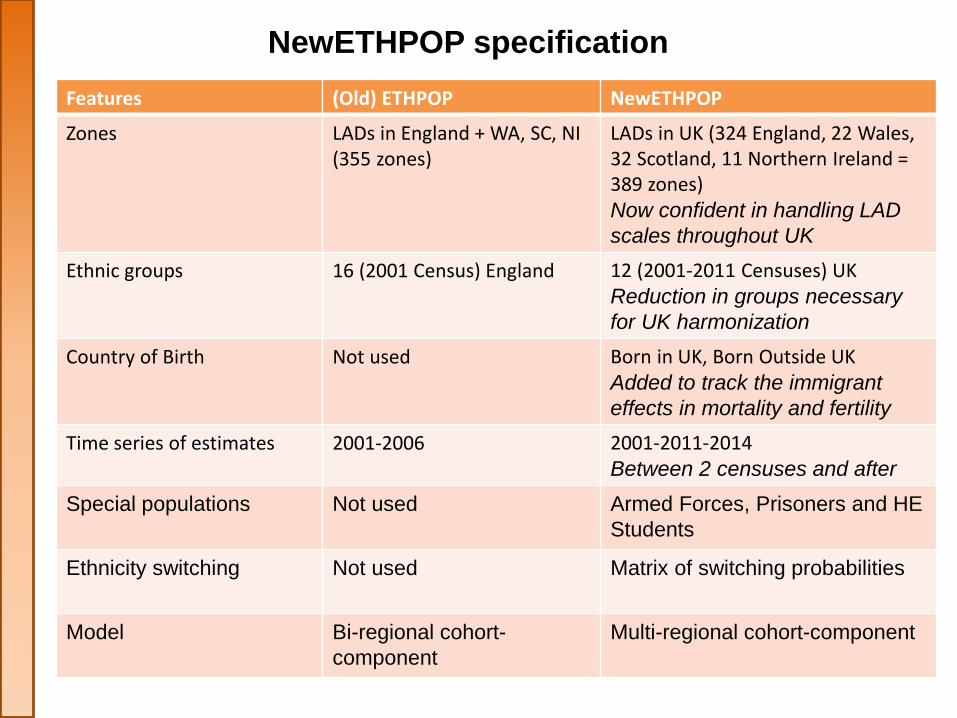
NewETHPOP specification
Features (Old) ETHPOP NewETHPOP
Zones LADs in England + WA, SC, NI (355 zones)
LADs in UK (324 England, 22 Wales, 32 Scotland, 11 Northern Ireland = 389 zones) Now confident in handling LAD
scales throughout UK
Ethnic groups 16 (2001 Census) England 12 (2001-2011 Censuses) UK Reduction in groups necessary
for UK harmonization
Country of Birth Not used Born in UK, Born Outside UK Added to track the immigrant
effects in mortality and fertility
Time series of estimates 2001-2006 2001-2011-2014 Between 2 censuses and after
Special populations Not used Armed Forces, Prisoners and HE
Students
Ethnicity switching
Not used Matrix of switching probabilities
Model Bi-regional cohort-
component
Multi-regional cohort-component
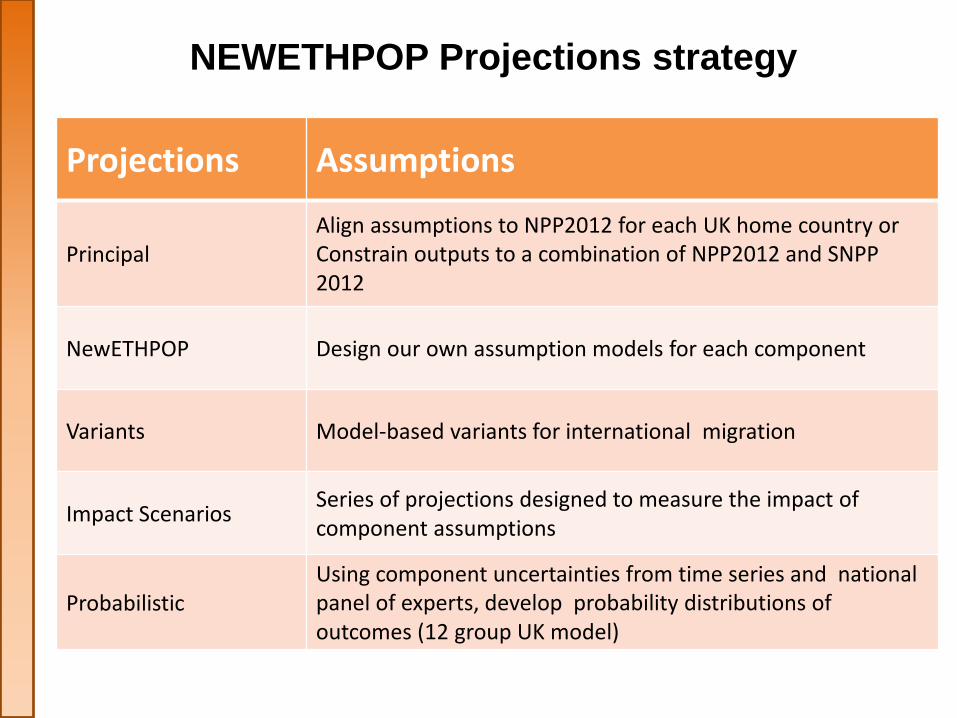
Projections Assumptions
Principal Align assumptions to NPP2012 for each UK home country or Constrain outputs to a combination of NPP2012 and SNPP 2012
NewETHPOP Design our own assumption models for each component
Variants Model-based variants for international migration
Impact Scenarios Series of projections designed to measure the impact of component assumptions
Probabilistic
Using component uncertainties from time series and national panel of experts, develop probability distributions of outcomes (12 group UK model)
NEWETHPOP Projections strategy
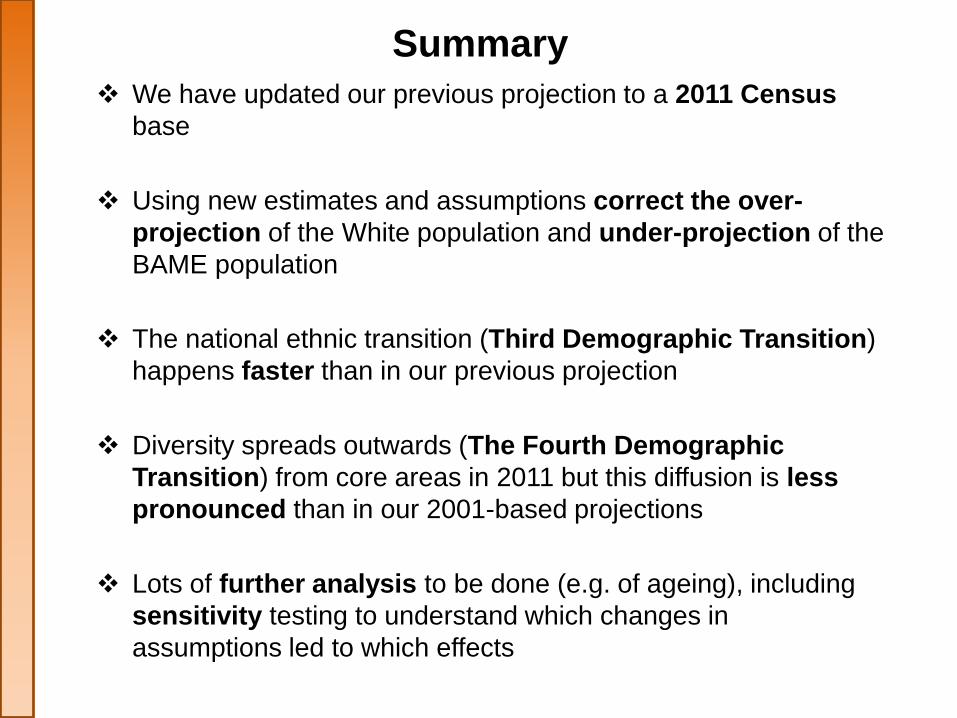
Summary
We have updated our previous projection to a 2011 Census
base
Using new estimates and assumptions correct the over-
projection of the White population and under-projection of the
BAME population
The national ethnic transition (Third Demographic Transition)
happens faster than in our previous projection
Diversity spreads outwards (The Fourth Demographic
Transition) from core areas in 2011 but this diffusion is less
pronounced than in our 2001-based projections
Lots of further analysis to be done (e.g. of ageing), including
sensitivity testing to understand which changes in
assumptions led to which effects
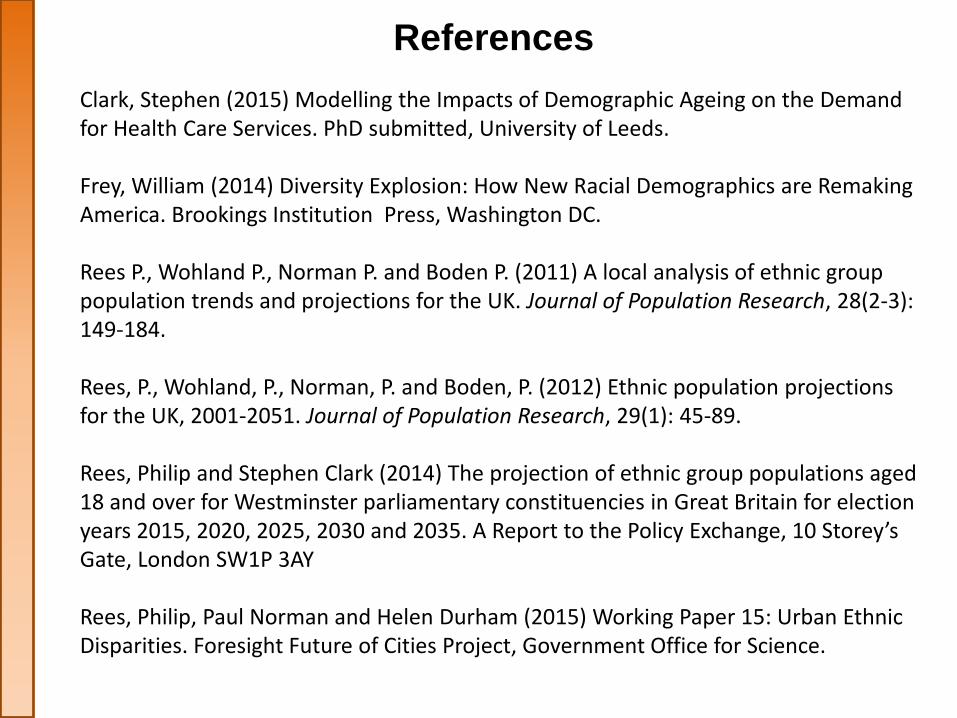
References
Clark, Stephen (2015) Modelling the Impacts of Demographic Ageing on the Demand for Health Care Services. PhD submitted, University of Leeds. Frey, William (2014) Diversity Explosion: How New Racial Demographics are Remaking America. Brookings Institution Press, Washington DC. Rees P., Wohland P., Norman P. and Boden P. (2011) A local analysis of ethnic group population trends and projections for the UK. Journal of Population Research, 28(2-3): 149-184. Rees, P., Wohland, P., Norman, P. and Boden, P. (2012) Ethnic population projections for the UK, 2001-2051. Journal of Population Research, 29(1): 45-89. Rees, Philip and Stephen Clark (2014) The projection of ethnic group populations aged 18 and over for Westminster parliamentary constituencies in Great Britain for election years 2015, 2020, 2025, 2030 and 2035. A Report to the Policy Exchange, 10 Storey’s Gate, London SW1P 3AY Rees, Philip, Paul Norman and Helen Durham (2015) Working Paper 15: Urban Ethnic Disparities. Foresight Future of Cities Project, Government Office for Science.