Embed Size (px)
Citation preview
Sun, Meijun and Zhang, Dong and Wang, Zheng and Ren, Jinchang and
Chai, Bolong and Sun, Jizhou (2015) What's wrong with the murals at the
Mogao Grottoes : a near-infrared hyperspectral imaging method.
Scientific Reports, 5. ISSN 2045-2322 ,
http://dx.doi.org/10.1038/srep14371
This version is available at https://strathprints.strath.ac.uk/55672/
Strathprints is designed to allow users to access the research output of the University of
Strathclyde. Unless otherwise explicitly stated on the manuscript, Copyright © and Moral Rights
for the papers on this site are retained by the individual authors and/or other copyright owners.
Please check the manuscript for details of any other licences that may have been applied. You
may not engage in further distribution of the material for any profitmaking activities or any
commercial gain. You may freely distribute both the url (https://strathprints.strath.ac.uk/) and the
content of this paper for research or private study, educational, or not-for-profit purposes without
prior permission or charge.
Any correspondence concerning this service should be sent to the Strathprints administrator:
The Strathprints institutional repository (https://strathprints.strath.ac.uk) is a digital archive of University of Strathclyde research
outputs. It has been developed to disseminate open access research outputs, expose data about those outputs, and enable the
management and persistent access to Strathclyde's intellectual output.
1SCIENTIFIC REPORTS | 5:14371 | DOI: 10.1038/srep14371
www.nature.com/scientificreports
What�s Wrong with the Murals
at the Mogao Grottoes: A Near-
Infrared Hyperspectral Imaging
MethodMeijun Sun1, Dong Zhang1, Zheng Wang2, Jinchang Ren3, Bolong Chai4 & Jizhou Sun1
Although a signiボcant amount of work has been performed to preserve the ancient murals in the Mogao Grottoes by Dunhuang Cultural Research┸ non┽contact methods need to be developed to eプectively evaluate the degree of ━aking of the murals┻ In this study┸ we propose to evaluate the ━aking by automatically analyzing hyperspectral images that were scanned at the site┻ Murals with various degrees of ━aking were scanned in the ぐけさth cave using a near┽infrared ゅNIRょ hyperspectral camera with a spectral range of approximately じくく to ぐざくく nm┻ The regions of interest ゅROIsょ of the murals were manually labeled and grouped into four levels┺ normal┸ slight┸ moderate┸ and severe┻ The average spectral data from each ROI and its group label were used to train our classiボcation model┻ To predict the degree of ━aking┸ we adopted four algorithms┺ deep belief networks ゅDBNsょ┸ partial least squares regression ゅPLSRょ┸ principal component analysis with a support vector machine ゅPCA + SVMょ and principal component analysis with an artiボcial neural network ゅPCA + ANNょ┻ The experimental results show the eプectiveness of our method┻ In particular┸ better results are obtained using DBNs when the training data contain a signiボcant amount of striping noise┻
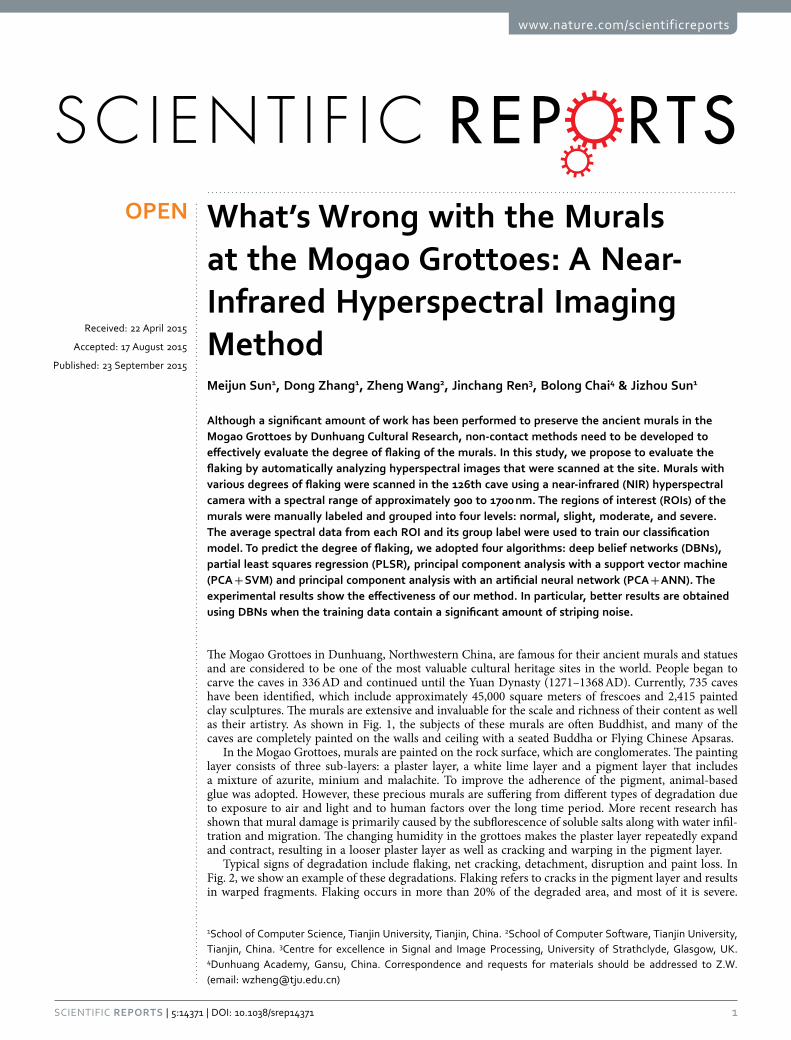
he Mogao Grottoes in Dunhuang, Northwestern China, are famous for their ancient murals and statues and are considered to be one of the most valuable cultural heritage sites in the world. People began to carve the caves in 336 AD and continued until the Yuan Dynasty (1271–1368 AD). Currently, 735 caves have been identiied, which include approximately 45,000 square meters of frescoes and 2,415 painted clay sculptures. he murals are extensive and invaluable for the scale and richness of their content as well as their artistry. As shown in Fig. 1, the subjects of these murals are oten Buddhist, and many of the caves are completely painted on the walls and ceiling with a seated Buddha or Flying Chinese Apsaras.
In the Mogao Grottoes, murals are painted on the rock surface, which are conglomerates. he painting layer consists of three sub-layers: a plaster layer, a white lime layer and a pigment layer that includes a mixture of azurite, minium and malachite. To improve the adherence of the pigment, animal-based glue was adopted. However, these precious murals are sufering from diferent types of degradation due to exposure to air and light and to human factors over the long time period. More recent research has shown that mural damage is primarily caused by the sublorescence of soluble salts along with water inil-tration and migration. he changing humidity in the grottoes makes the plaster layer repeatedly expand and contract, resulting in a looser plaster layer as well as cracking and warping in the pigment layer.
Typical signs of degradation include laking, net cracking, detachment, disruption and paint loss. In Fig. 2, we show an example of these degradations. Flaking refers to cracks in the pigment layer and results in warped fragments. Flaking occurs in more than 20% of the degraded area, and most of it is severe.
1School of Computer Science, Tianjin University, Tianjin, China. 2School of Computer Software, Tianjin University,
Tianjin, China. 3Centre for excellence in Signal and Image Processing, University of Strathclyde, Glasgow, UK. 4Dunhuang Academy, Gansu, China. Correspondence and requests for materials should be addressed to Z.W.
(email: [email protected])
Received: 22 April 2015
Accepted: 17 August 2015
Published: 23 September 2015
OPEN
www.nature.com/scientificreports/
2SCIENTIFIC REPORTS | 5:14371 | DOI: 10.1038/srep14371
Flaking is also regarded as an early stage of peeling, exfoliation, and delamination. As described else-where1–5, laking murals are salvaged by reattaching the lakes using a polyvinyl acetate emulsion (PVA). his method was irst put into practice in the 1950s to 1960s in the 94th and the 108th caves. A hybrid acrylic and silicone acrylic emulsion has been applied to laking murals in the 23rd and the 217th caves during the past decade. A gelatin solution has been used in the 85th and the 98th caves. However, there is still a need for a more efective method of monitoring and assessing the level of laking than human vision to evaluate these protection and reinforcement techniques. his will also help researchers deter-mine if the protection is still working or is causing renewed damages. In this study, we analyze the laking
Figure 1. Examples of murals at the Mogao Grottoes (We are grateful to Bolong Chai for taking these
photographs).
Figure 2. Some examples of diseases on the murals (We are grateful to Bolong Chai for taking these
photographs).
www.nature.com/scientificreports/
3SCIENTIFIC REPORTS | 5:14371 | DOI: 10.1038/srep14371
on murals in the Mogao Grottoes using NIR hyperspectral images of the murals and machine learning algorithms. his non-destructive technique shows great potential for assessing the state of the murals.
Hyperspectral imaging was irst used to monitor cultural heritage in the mid-1990s, where the initial experiments were performed on the Parma Cathedral, Italy6. Later experiments exploited the imaging luorescence LIDAR technique for the acquisition of hyperspectral luorescence images of several monuments7–9. Some studies have focused on the detection and characterization of diferent lithotypes6,10 and protective treatments11–13. In addition, a few applications of imaging spectrometry in cultural heritage frameworks have been introduced in the literature. In particular, Buck et al.14 presented the results of the sub-pixel capability of detecting obsidian and pottery artifacts scattered on the bare soil surface of a site in the western USA. Palombi et al. elucidated the past interventions to conserve the Colosseum in Rome using hyperspectral luorescence LIDAR imaging15. Hallstrom et al. used hyperspectral technology to document the restoration of soiled and biodeteriorated facades of the Colosseum in Rome16. hese multispectral and hyperspectral imaging techniques are ideally suited for the examination of historical murals because they are non-contact and generally non-destructive.
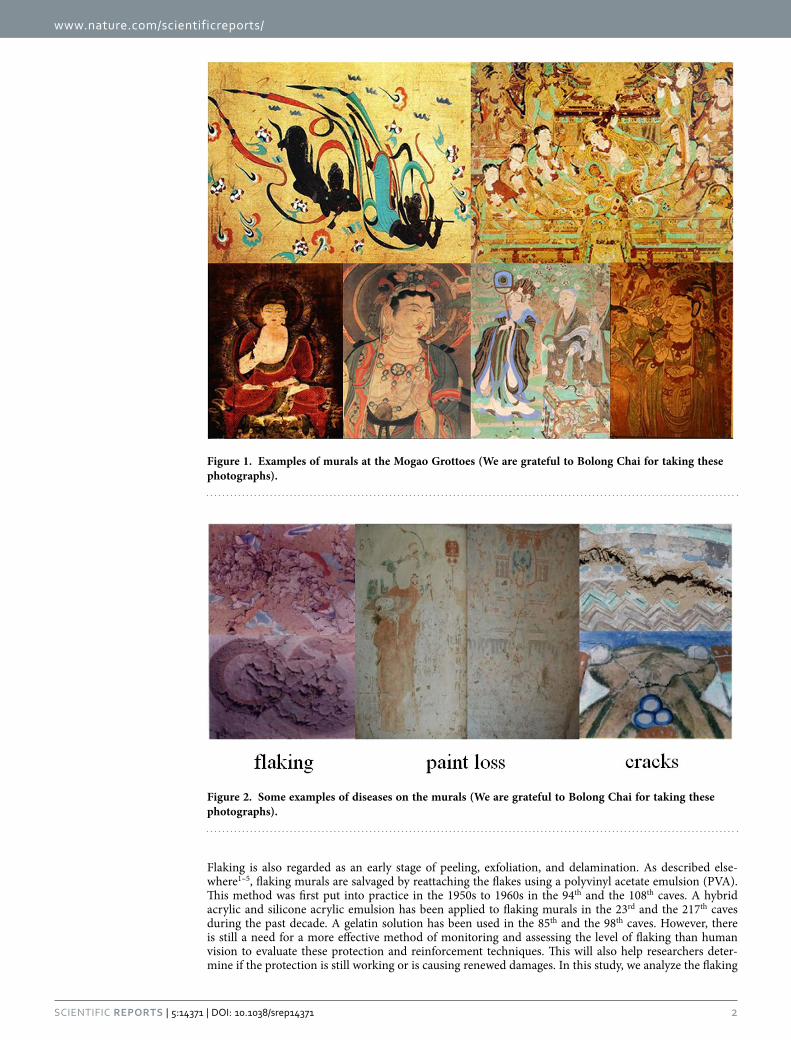
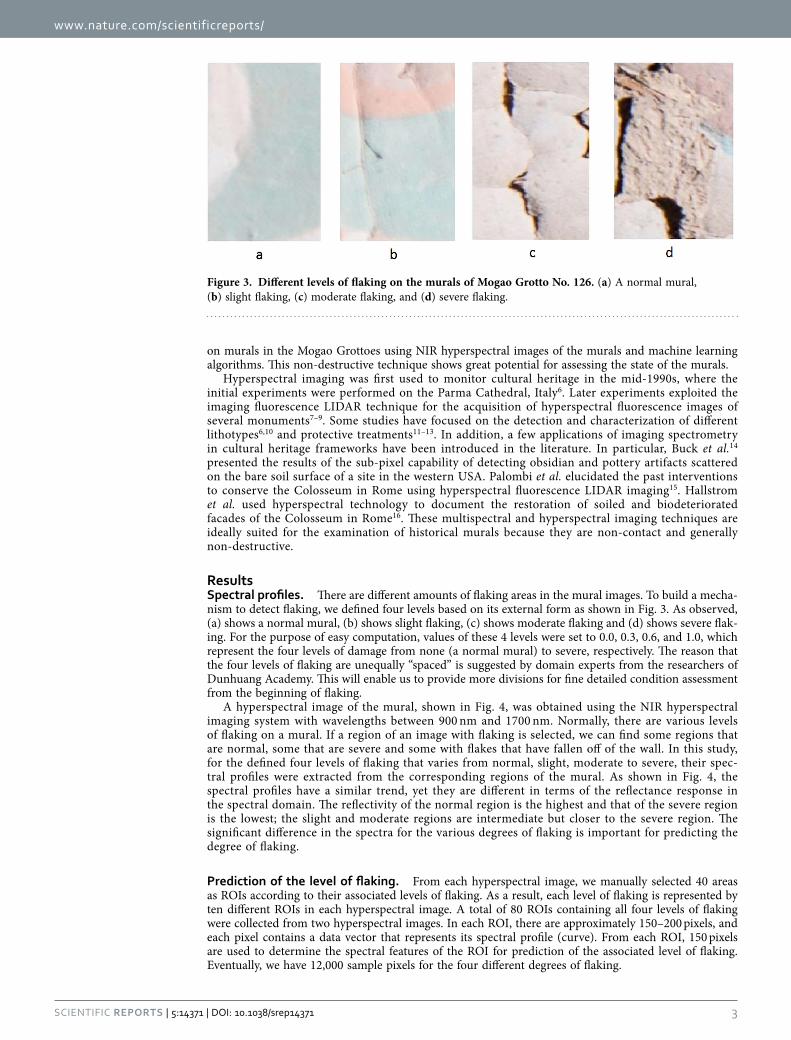
ResultsSpectral proボles┻ here are diferent amounts of laking areas in the mural images. To build a mecha-nism to detect laking, we deined four levels based on its external form as shown in Fig. 3. As observed, (a) shows a normal mural, (b) shows slight laking, (c) shows moderate laking and (d) shows severe lak-ing. For the purpose of easy computation, values of these 4 levels were set to 0.0, 0.3, 0.6, and 1.0, which represent the four levels of damage from none (a normal mural) to severe, respectively. he reason that the four levels of laking are unequally “spaced” is suggested by domain experts from the researchers of Dunhuang Academy. his will enable us to provide more divisions for ine detailed condition assessment from the beginning of laking.
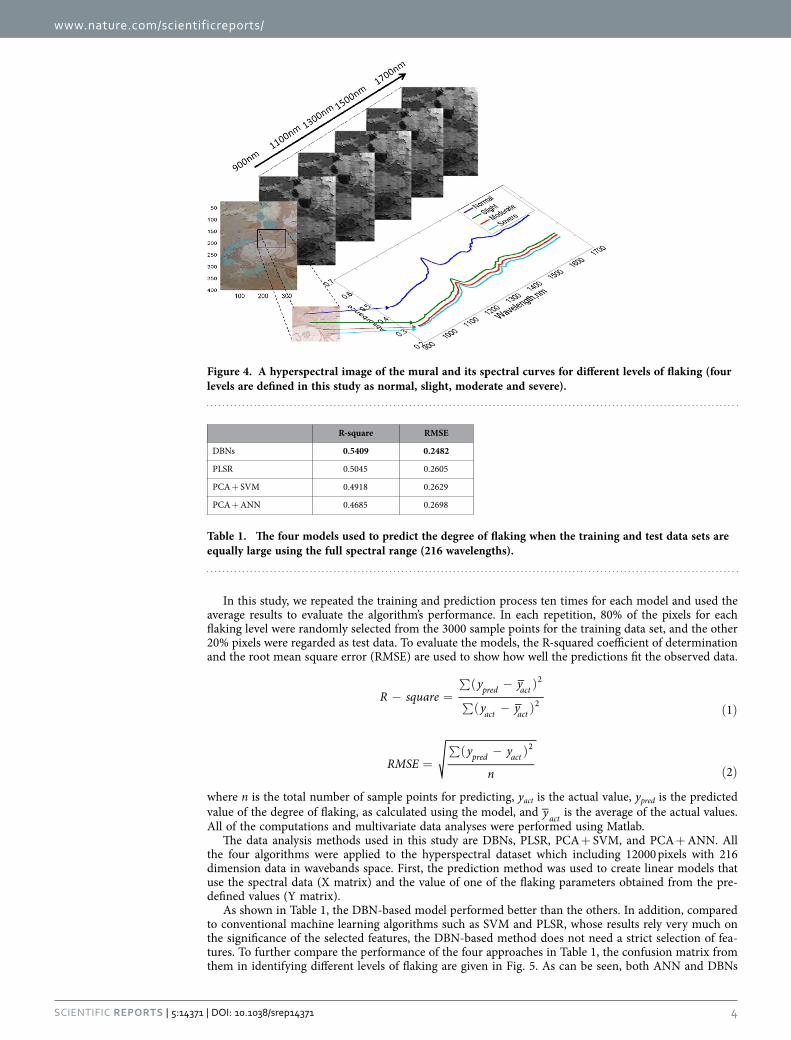
A hyperspectral image of the mural, shown in Fig. 4, was obtained using the NIR hyperspectral imaging system with wavelengths between 900 nm and 1700 nm. Normally, there are various levels of laking on a mural. If a region of an image with laking is selected, we can ind some regions that are normal, some that are severe and some with lakes that have fallen of of the wall. In this study, for the deined four levels of laking that varies from normal, slight, moderate to severe, their spec-tral proiles were extracted from the corresponding regions of the mural. As shown in Fig. 4, the spectral proiles have a similar trend, yet they are diferent in terms of the relectance response in the spectral domain. he relectivity of the normal region is the highest and that of the severe region is the lowest; the slight and moderate regions are intermediate but closer to the severe region. he signiicant diference in the spectra for the various degrees of laking is important for predicting the degree of laking.
Prediction of the level of ━aking┻ From each hyperspectral image, we manually selected 40 areas as ROIs according to their associated levels of laking. As a result, each level of laking is represented by ten diferent ROIs in each hyperspectral image. A total of 80 ROIs containing all four levels of laking were collected from two hyperspectral images. In each ROI, there are approximately 150–200 pixels, and each pixel contains a data vector that represents its spectral proile (curve). From each ROI, 150 pixels are used to determine the spectral features of the ROI for prediction of the associated level of laking. Eventually, we have 12,000 sample pixels for the four diferent degrees of laking.
Figure 3. Diferent levels of laking on the murals of Mogao Grotto No. 126. (a) A normal mural,
(b) slight laking, (c) moderate laking, and (d) severe laking.
www.nature.com/scientificreports/
4SCIENTIFIC REPORTS | 5:14371 | DOI: 10.1038/srep14371
In this study, we repeated the training and prediction process ten times for each model and used the average results to evaluate the algorithm’s performance. In each repetition, 80% of the pixels for each laking level were randomly selected from the 3000 sample points for the training data set, and the other 20% pixels were regarded as test data. To evaluate the models, the R-squared coeicient of determination and the root mean square error (RMSE) are used to show how well the predictions it the observed data.
− =∑( − )
∑( − ) ( )R square
y y
y y 1
pred act
act act
2
2
=∑( − )
( )RMSE
y y
n 2
pred act
2
where n is the total number of sample points for predicting, yact is the actual value, ypred is the predicted value of the degree of laking, as calculated using the model, and y
act is the average of the actual values.
All of the computations and multivariate data analyses were performed using Matlab.he data analysis methods used in this study are DBNs, PLSR, PCA + SVM, and PCA + ANN. All
the four algorithms were applied to the hyperspectral dataset which including 12000 pixels with 216 dimension data in wavebands space. First, the prediction method was used to create linear models that use the spectral data (X matrix) and the value of one of the laking parameters obtained from the pre-deined values (Y matrix).
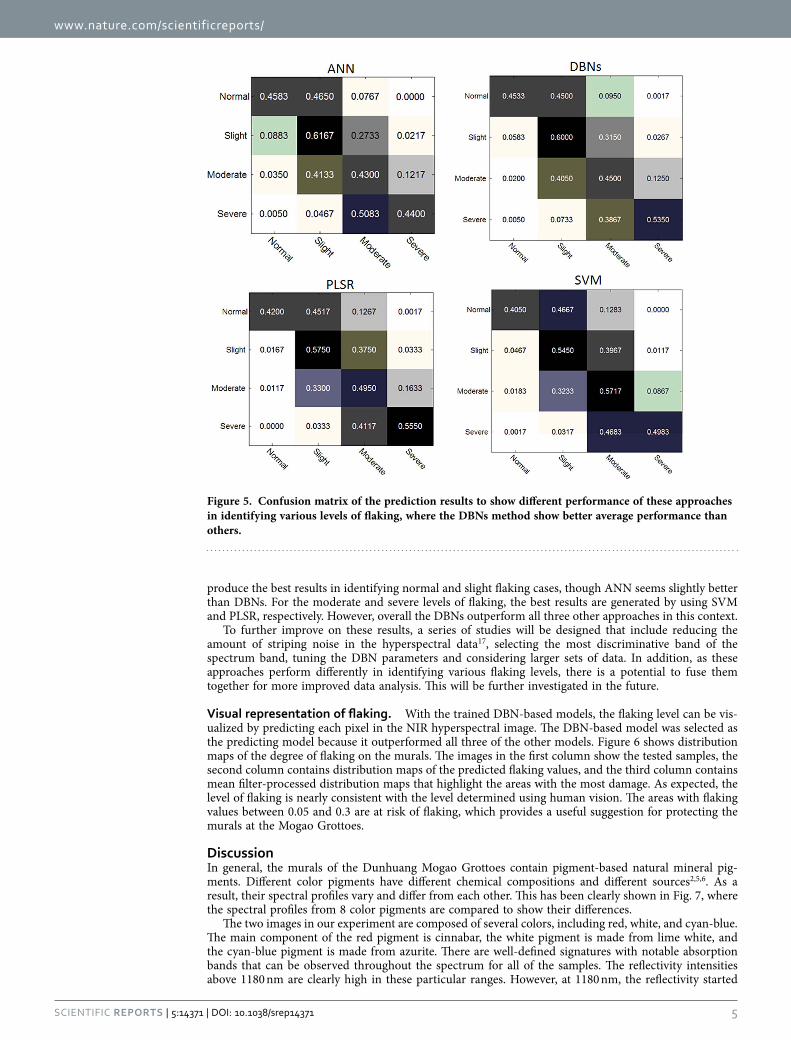
As shown in Table 1, the DBN-based model performed better than the others. In addition, compared to conventional machine learning algorithms such as SVM and PLSR, whose results rely very much on the signiicance of the selected features, the DBN-based method does not need a strict selection of fea-tures. To further compare the performance of the four approaches in Table 1, the confusion matrix from them in identifying diferent levels of laking are given in Fig. 5. As can be seen, both ANN and DBNs
Figure 4. A hyperspectral image of the mural and its spectral curves for diferent levels of laking (four
levels are deined in this study as normal, slight, moderate and severe).
R-square RMSE
DBNs 0.5409 0.2482
PLSR 0.5045 0.2605
PCA + SVM 0.4918 0.2629
PCA + ANN 0.4685 0.2698
Table 1. he four models used to predict the degree of laking when the training and test data sets are
equally large using the full spectral range (216 wavelengths).
www.nature.com/scientificreports/
5SCIENTIFIC REPORTS | 5:14371 | DOI: 10.1038/srep14371
produce the best results in identifying normal and slight laking cases, though ANN seems slightly better than DBNs. For the moderate and severe levels of laking, the best results are generated by using SVM and PLSR, respectively. However, overall the DBNs outperform all three other approaches in this context.
To further improve on these results, a series of studies will be designed that include reducing the amount of striping noise in the hyperspectral data17, selecting the most discriminative band of the spectrum band, tuning the DBN parameters and considering larger sets of data. In addition, as these approaches perform diferently in identifying various laking levels, there is a potential to fuse them together for more improved data analysis. his will be further investigated in the future.
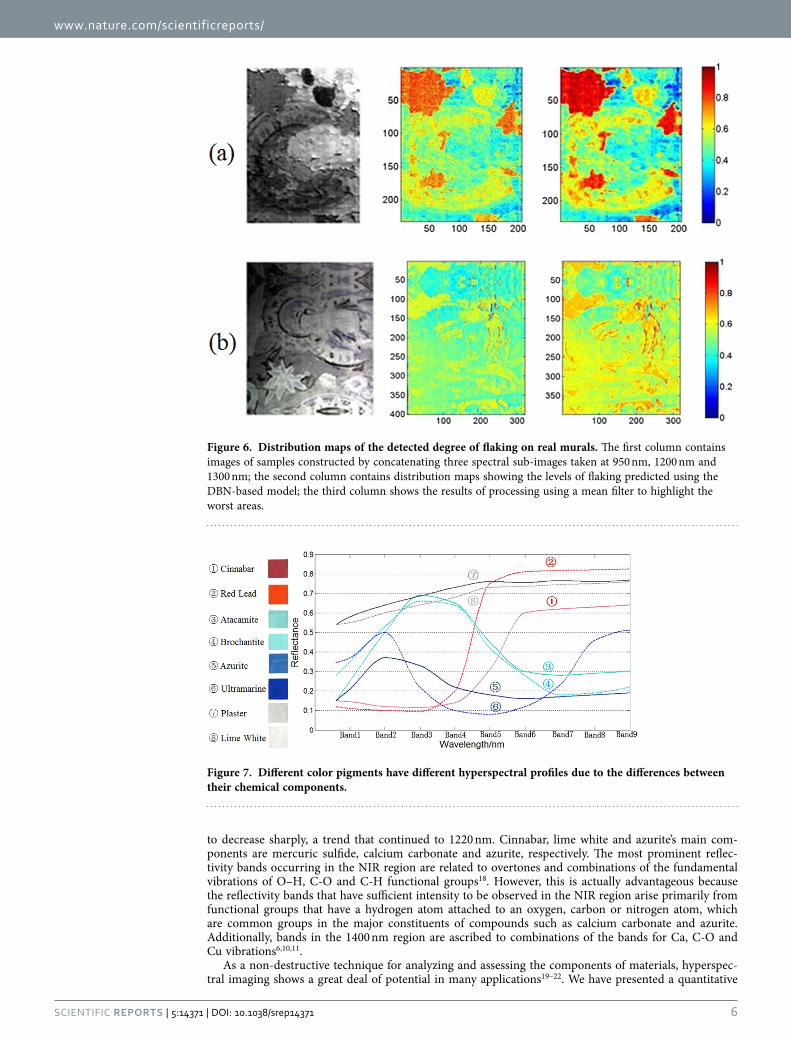
Visual representation of ━aking┻ With the trained DBN-based models, the laking level can be vis-ualized by predicting each pixel in the NIR hyperspectral image. he DBN-based model was selected as the predicting model because it outperformed all three of the other models. Figure 6 shows distribution maps of the degree of laking on the murals. he images in the irst column show the tested samples, the second column contains distribution maps of the predicted laking values, and the third column contains mean ilter-processed distribution maps that highlight the areas with the most damage. As expected, the level of laking is nearly consistent with the level determined using human vision. he areas with laking values between 0.05 and 0.3 are at risk of laking, which provides a useful suggestion for protecting the murals at the Mogao Grottoes.
DiscussionIn general, the murals of the Dunhuang Mogao Grottoes contain pigment-based natural mineral pig-ments. Diferent color pigments have diferent chemical compositions and diferent sources2,5,6. As a result, their spectral proiles vary and difer from each other. his has been clearly shown in Fig. 7, where the spectral proiles from 8 color pigments are compared to show their diferences.
he two images in our experiment are composed of several colors, including red, white, and cyan-blue. he main component of the red pigment is cinnabar, the white pigment is made from lime white, and the cyan-blue pigment is made from azurite. here are well-deined signatures with notable absorption bands that can be observed throughout the spectrum for all of the samples. he relectivity intensities above 1180 nm are clearly high in these particular ranges. However, at 1180 nm, the relectivity started
Figure 5. Confusion matrix of the prediction results to show diferent performance of these approaches
in identifying various levels of laking, where the DBNs method show better average performance than
others.
www.nature.com/scientificreports/
6SCIENTIFIC REPORTS | 5:14371 | DOI: 10.1038/srep14371
to decrease sharply, a trend that continued to 1220 nm. Cinnabar, lime white and azurite’s main com-ponents are mercuric sulide, calcium carbonate and azurite, respectively. he most prominent relec-tivity bands occurring in the NIR region are related to overtones and combinations of the fundamental vibrations of O–H, C-O and C-H functional groups18. However, this is actually advantageous because the relectivity bands that have suicient intensity to be observed in the NIR region arise primarily from functional groups that have a hydrogen atom attached to an oxygen, carbon or nitrogen atom, which are common groups in the major constituents of compounds such as calcium carbonate and azurite. Additionally, bands in the 1400 nm region are ascribed to combinations of the bands for Ca, C-O and Cu vibrations6,10,11.
As a non-destructive technique for analyzing and assessing the components of materials, hyperspec-tral imaging shows a great deal of potential in many applications19–22. We have presented a quantitative
Figure 6. Distribution maps of the detected degree of laking on real murals. he irst column contains
images of samples constructed by concatenating three spectral sub-images taken at 950 nm, 1200 nm and
1300 nm; the second column contains distribution maps showing the levels of laking predicted using the
DBN-based model; the third column shows the results of processing using a mean ilter to highlight the
worst areas.
Figure 7. Diferent color pigments have diferent hyperspectral proiles due to the diferences between
their chemical components.
www.nature.com/scientificreports/
7SCIENTIFIC REPORTS | 5:14371 | DOI: 10.1038/srep14371
approach to evaluating and visualizing the level of laking damage to murals at the Mogao Grottoes in Dunhuang. Our promising results indicate that a combination of the NIR hyperspectral technique and a deep belief network is valuable. In addition to assessing the overall degree of damage caused by laking on murals, hyperspectral imaging has the additional merit of allowing the distribution of the damage to be visualized.
In conclusion, the proposed hyperspectral method has been proven to capture the physical changes that will allow us to rank damage levels and predict mural damage prior to its occurrence. Further direc-tions of this study include real-time monitoring, evaluating protection methods and early warnings of mural damage, which are considerably valuable for the protection of cultural heritage.
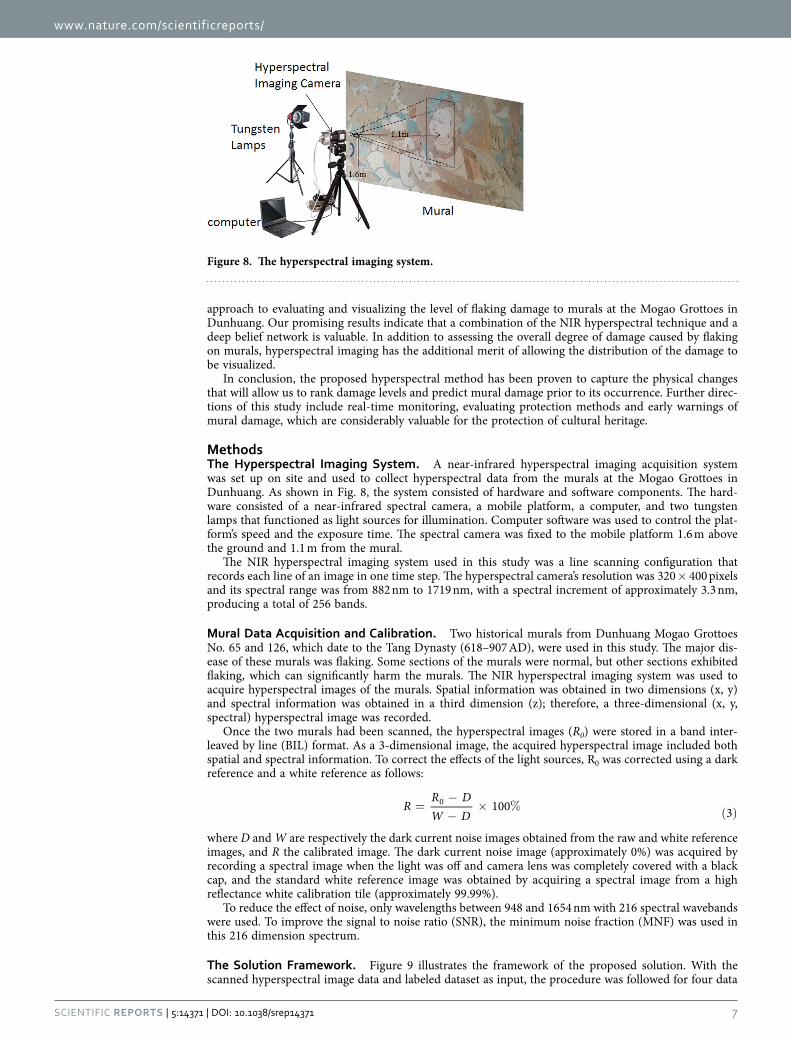
MethodsThe Hyperspectral Imaging System┻ A near-infrared hyperspectral imaging acquisition system was set up on site and used to collect hyperspectral data from the murals at the Mogao Grottoes in Dunhuang. As shown in Fig. 8, the system consisted of hardware and sotware components. he hard-ware consisted of a near-infrared spectral camera, a mobile platform, a computer, and two tungsten lamps that functioned as light sources for illumination. Computer sotware was used to control the plat-form’s speed and the exposure time. he spectral camera was ixed to the mobile platform 1.6 m above the ground and 1.1 m from the mural.
he NIR hyperspectral imaging system used in this study was a line scanning coniguration that records each line of an image in one time step. he hyperspectral camera’s resolution was 320 × 400 pixels and its spectral range was from 882 nm to 1719 nm, with a spectral increment of approximately 3.3 nm, producing a total of 256 bands.
Mural Data Acquisition and Calibration┻ Two historical murals from Dunhuang Mogao Grottoes No. 65 and 126, which date to the Tang Dynasty (618–907 AD), were used in this study. he major dis-ease of these murals was laking. Some sections of the murals were normal, but other sections exhibited laking, which can signiicantly harm the murals. he NIR hyperspectral imaging system was used to acquire hyperspectral images of the murals. Spatial information was obtained in two dimensions (x, y) and spectral information was obtained in a third dimension (z); therefore, a three-dimensional (x, y, spectral) hyperspectral image was recorded.
Once the two murals had been scanned, the hyperspectral images (R0) were stored in a band inter-leaved by line (BIL) format. As a 3-dimensional image, the acquired hyperspectral image included both spatial and spectral information. To correct the efects of the light sources, R0 was corrected using a dark reference and a white reference as follows:
=−
−× %
( )R
R D
W D100
30
where D and W are respectively the dark current noise images obtained from the raw and white reference images, and R the calibrated image. he dark current noise image (approximately 0%) was acquired by recording a spectral image when the light was of and camera lens was completely covered with a black cap, and the standard white reference image was obtained by acquiring a spectral image from a high relectance white calibration tile (approximately 99.99%).
To reduce the efect of noise, only wavelengths between 948 and 1654 nm with 216 spectral wavebands were used. To improve the signal to noise ratio (SNR), the minimum noise fraction (MNF) was used in this 216 dimension spectrum.
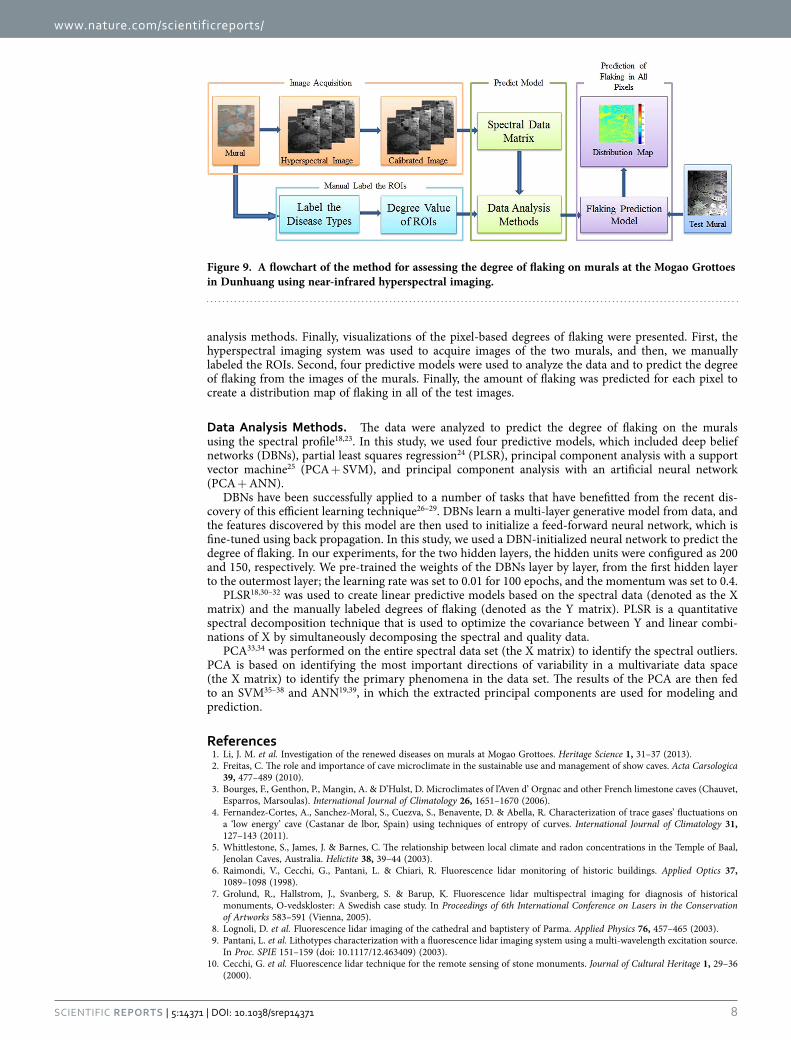
The Solution Framework┻ Figure 9 illustrates the framework of the proposed solution. With the scanned hyperspectral image data and labeled dataset as input, the procedure was followed for four data
Figure 8. he hyperspectral imaging system.
www.nature.com/scientificreports/
8SCIENTIFIC REPORTS | 5:14371 | DOI: 10.1038/srep14371
analysis methods. Finally, visualizations of the pixel-based degrees of laking were presented. First, the hyperspectral imaging system was used to acquire images of the two murals, and then, we manually labeled the ROIs. Second, four predictive models were used to analyze the data and to predict the degree of laking from the images of the murals. Finally, the amount of laking was predicted for each pixel to create a distribution map of laking in all of the test images.
Data Analysis Methods┻ he data were analyzed to predict the degree of laking on the murals using the spectral proile18,23. In this study, we used four predictive models, which included deep belief networks (DBNs), partial least squares regression24 (PLSR), principal component analysis with a support vector machine25 (PCA + SVM), and principal component analysis with an artiicial neural network (PCA + ANN).
DBNs have been successfully applied to a number of tasks that have beneitted from the recent dis-covery of this eicient learning technique26–29. DBNs learn a multi-layer generative model from data, and the features discovered by this model are then used to initialize a feed-forward neural network, which is ine-tuned using back propagation. In this study, we used a DBN-initialized neural network to predict the degree of laking. In our experiments, for the two hidden layers, the hidden units were conigured as 200 and 150, respectively. We pre-trained the weights of the DBNs layer by layer, from the irst hidden layer to the outermost layer; the learning rate was set to 0.01 for 100 epochs, and the momentum was set to 0.4.
PLSR18,30–32 was used to create linear predictive models based on the spectral data (denoted as the X matrix) and the manually labeled degrees of laking (denoted as the Y matrix). PLSR is a quantitative spectral decomposition technique that is used to optimize the covariance between Y and linear combi-nations of X by simultaneously decomposing the spectral and quality data.
PCA33,34 was performed on the entire spectral data set (the X matrix) to identify the spectral outliers. PCA is based on identifying the most important directions of variability in a multivariate data space (the X matrix) to identify the primary phenomena in the data set. he results of the PCA are then fed to an SVM35–38 and ANN19,39, in which the extracted principal components are used for modeling and prediction.
References1. Li, J. M. et al. Investigation of the renewed diseases on murals at Mogao Grottoes. Heritage Science 1, 31–37 (2013).2. Freitas, C. he role and importance of cave microclimate in the sustainable use and management of show caves. Acta Carsologica
39, 477–489 (2010).3. Bourges, F., Genthon, P., Mangin, A. & D’Hulst, D. Microclimates of l’Aven d’ Orgnac and other French limestone caves (Chauvet,
Esparros, Marsoulas). International Journal of Climatology 26, 1651–1670 (2006).4. Fernandez-Cortes, A., Sanchez-Moral, S., Cuezva, S., Benavente, D. & Abella, R. Characterization of trace gases’ luctuations on
a ‘low energy’ cave (Castanar de lbor, Spain) using techniques of entropy of curves. International Journal of Climatology 31, 127–143 (2011).
5. Whittlestone, S., James, J. & Barnes, C. he relationship between local climate and radon concentrations in the Temple of Baal, Jenolan Caves, Australia. Helictite 38, 39–44 (2003).
6. Raimondi, V., Cecchi, G., Pantani, L. & Chiari, R. Fluorescence lidar monitoring of historic buildings. Applied Optics 37, 1089–1098 (1998).
7. Grolund, R., Hallstrom, J., Svanberg, S. & Barup, K. Fluorescence lidar multispectral imaging for diagnosis of historical monuments, O-vedskloster: A Swedish case study. In Proceedings of 6th International Conference on Lasers in the Conservation of Artworks 583–591 (Vienna, 2005).
8. Lognoli, D. et al. Fluorescence lidar imaging of the cathedral and baptistery of Parma. Applied Physics 76, 457–465 (2003).9. Pantani, L. et al. Lithotypes characterization with a luorescence lidar imaging system using a multi-wavelength excitation source.
In Proc. SPIE 151–159 (doi: 10.1117/12.463409) (2003).10. Cecchi, G. et al. Fluorescence lidar technique for the remote sensing of stone monuments. Journal of Cultural Heritage 1, 29–36
(2000).
Figure 9. A lowchart of the method for assessing the degree of laking on murals at the Mogao Grottoes
in Dunhuang using near-infrared hyperspectral imaging.
www.nature.com/scientificreports/
9SCIENTIFIC REPORTS | 5:14371 | DOI: 10.1038/srep14371
11. Ballerini, G., Bracci, S., Pantani, L. & Tiano, P. Lidar remote sensing of stone cultural heritage: detection of protective treatments. Optical Engineering 40, 1579–1583 (2001).
12. Lognoli, D. et al. Detection and characterization of biodeteriogens on stone cultural heritage by luorescence lidar. Applied Optics 41, 1780–1787 (2002).
13. Chen, X. Y., Xiang, S. M. & Liu, C. L. Aircrat detection by deep belief nets. In Proceedings of the 2013 2nd IAPR Asian Conference on Pattern Recognition 54–58 (Naha, 2013).
14. Buck, P. E., Sabol, D. E., Alan, R. & Gillespie, A. R. Sub-pixel artifact detection using remote sensing. Journal of Archaeological Science 30, 973–989 (2003).
15. Palombi, L. et al. Hyperspectral luorescence lidar imaging at the Colosseum, Rome: Elucidating past conservation interventions. Optics Express 16, 6794–6808 (2008).
16. Weibring, P. et al. Fluorescence lidar imaging of historical monuments. Applied Optics 40, 6111–6120 (2001).17. Ren, J., Zabalza, Z., Marshall, S. & Zheng, J. Efective feature extraction and data reduction with hyperspectral imaging in remote
sensing. IEEE Signal Processing Magazine 31, 149–154 (2014).18. Gamal, E., Sun, D. W. & Paul, A. Near-infrared hyperspectral imaging for predicting color, pH and tenderness of fresh beef.
Journal of Food Engineering 110, 127–140 (2012).19. Ratle, F., Camps-Valls, G. & Weston, J. Semisupervised neural networks for eicient hyperspectral image classiication. IEEE
Transactions on Geoscience and Remote Sensing 48, 2271–2282 (2010).20. Hallstrom, J. et al. Documentation of soiled and biodeteriorated facades: A case study on the Coliseum, Rome, using hyperspectral
imaging luorescence lidars. Journal of Cultural Heritage 10, 106–115 (2009).21. Vasei, F. et al. Polarization-sensitive hyperspectral imaging in vivo: a multimode dermoscope for skin analysis. Scientiic Reports
4, 22–23 (2014).22. Geng, X. R., Sun, K., Ji, L. Y. & Zhao, Y. C. A high-order statistical tensor based algorithm for anomaly detection in hyperspectral
imagery. Scientiic Reports 4, 6869–6869 (2014).23. Qin, J. W., Chao, K. L., Kim, M. S., Lu, R. F. & Burks, T. F. Hyperspectral and multispectral imaging for evaluating food safety
and quality. Journal of Food Engineering 118, 157–171 (2013).24. Qiao, T. et al. Quantitative prediction of beef quality using visible spectroscopy with large data samples under industry conditions.
Journal of Applied Spectroscopy 82, 137–144 (2015).25. Zabalza, J. et al. Novel two dimensional singular spectrum analysis for efective feature extraction and data classiication in
hyperspectral imaging. IEEE Trans. Geoscience and Remote Sensing 53, 4418–4433 (2015).26. Cavali, R., Colosi, F., Palombo, A., Pignatti, S. & Poscolieri, M. Remote hyperspectral imagery as a support to archaeological
prospection. Journal of Cultural Heritage 8, 272–283 (2007).27. Ratle, F., Camps-Valls, G. & Weston, J. Semisupervised neural networks for eicient hyperspectral image classiication. IEEE
Transactions on Geoscience and Remote Sensing 48, 2271–2282 (2010).28. Chen, Y., Lin, Z., Zhao, X., Wang, G. & Gu, Y. Deep learning-based classiication of hyperspectral data. IEEE Journal of Selected
Topics in Applied Earth Observations and Remote Sensing 7, 2094–2107 (2014).29. Han, J., Zhang, D., Cheng, G., Guo, L. & Ren, J. Object detection in optical remote sensing images based on weakly supervised
learning and high-level feature learning. IEEE Trans. Geoscience and Remote Sensing 53, 3325–3337 (2015).30. Osborne, S., Jordan, R. & Kunnemeyer, R. Methods of wavelength selection for partial least squares. Analyst 122, 1531–1537
(1997).31. Naganathan, G. K. et al. Partial least squares analysis of near-infrared hyperspectral images for beef tenderness prediction.
Sensing and Instrumentation for Food Quality and Safety 2, 178–188 (2008).32. Uzair, M., Mahmood, A. & Mian, A. Hyperspectral face recognition with spatiospectral information fusion and PLS regression.
IEEE Transactions on Image Processing 24, 1127–1137 (2015).33. Imani, M. & Ghassemian, H. Principal component discriminant analysis for feature extraction and classiication of hyperspectral
images. In Processing of 2014 Iranian Conference on Intelligent System 1–5 (Bam, 2014).34. Garini, Y., Young, I. T. & McNamara, G. Spectral imaging, principles and applications. Cytometry Part A 69A, 735–747 (2006).35. Baassou, B., He, M. Y. & Mei, S. H. An accurate SVM-based classiication approach for hyperspectral image classiication. In
Processing of the 2013 21st International Conference on Geoinformatics 1–7 (Kaifeng, 2013).36. Pal, M. & Foody, G. M. Feature selection for classiication of hyperspectral data by SVM. IEEE Transactions on Geoscience and
Remote Sensing 48, 2297–2307 (2010).37. Kuo, B. C., Ho, H. H., Li, C. H., Hung, C. C. & Taur, J. S. A kernel-based feature selection method for SVM with RBF kernel for
hyperspectral image classiication. IEEE Journal of Selected Topic in Applied Observations and Remote Sensing 7, 317–326 (2014).38. Shao, Z., Zhang, L., Zhou, X. & Ding, L. A novel hierarchical semisupervised SVM for classiication of hyperspectral images.
IEEE Geoscience and Remote Sensing Letters 11, 1609–1613 (2014).39. Licciardi, G. A. & Del Frate, F. Pixel unmixing in hyperspectral data by means of neural networks. IEEE Transactions on
Geoscience and Remote Sensing 49, 4163–4172 (2011).
Acknowledgementshe authors wish to acknowledge support from the National Natural Science Foundation, China under grant numbers 61003201, 61202165, 61572351, and 61272266 and a joint project funded by the Royal Society of Edinburgh and NSFC (grant number 61211130125).
Author ContributionsM.S. and D.Z. designed and performed the experiments and analyzed the data. Z.W. conceived the idea. M.S. and Z.W. wrote the main text of the manuscript. J.R. attended experimental design, data analysis and paper preparation. B.C. provided the hyperspectral imaging data for the murals at the Mogao Grottoes. J.S. gave his help in language. All of the authors reviewed the manuscript.
Additional InformationCompeting inancial interests: he authors declare no competing inancial interests.
How to cite this article: Sun, M. et al. What’s Wrong with the Murals at the Mogao Grottoes: A Near-Infrared Hyperspectral Imaging Method. Sci. Rep. 5, 14371; doi: 10.1038/srep14371 (2015).

www.nature.com/scientificreports/
1 0SCIENTIFIC REPORTS | 5:14371 | DOI: 10.1038/srep14371
his work is licensed under a Creative Commons Attribution 4.0 International License. he images or other third party material in this article are included in the article’s Creative Com-
mons license, unless indicated otherwise in the credit line; if the material is not included under the Creative Commons license, users will need to obtain permission from the license holder to reproduce the material. To view a copy of this license, visit http://creativecommons.org/licenses/by/4.0/