Embed Size (px)
Citation preview
Ekonomski horizonti, Maj - Avgust 2016, Volumen 18, Sveska 2, 107 - 119 © Ekonomski fakultet Univerziteta u KragujevcuUDC: 33 ISSN: 1450-863 X www. ekfak.kg.ac.rs
Original scientific paperUDC: 504.5(510)”1991/2012”
doi: 10.5937/ekonhor1602107B
INTRODUCTION
Pollutant discharge, the main evaluation index of the government policy, has been the core of the environmental problems for a long time. China’s economy has achieved an „abnormal” ultra-high speed growth rate since the policy of Reform and Opening, which led to an excessive pollutant discharge into the environment and the limits of the ecological environment system have constantly been
challenged. As a result, the ecological environmental cost of economic growth continues to accumulate. It is revealed in the latest „China Environment Bullet 2012”, released by the Ministry of Environmental Protection, that more than 30% of the rivers and 50% of the groundwater throughout the country are below the standard and that 59.1% of 325 prefecture-level cities do not meet the new air quality standards. The non-compliance rate of the 113 key environmental protection cities reaches up to 76.1%. The overall environmental situation is far from promising. The fog and haze that have swept the largest part of China since 2012 have attracted the public’s attention to the pollutant discharge problem, which has also become a
THE DYNAMIC CHANGE OF POLLUTANT DISCHARGE IN CHINA: 1991-2012 - BASED ON THE ANALYSIS OF THE
MULTIPLE ATTRIBUTE COMPREHENSIVE EVALUATION THEORY
Liu Bolong and Li Danni*School of Economics and Finance of Xi’an Jiaotong University, Xi’an, Shaanxi, China
This paper chooses pollutant discharge as the study object and utilizes a modified scatter degree comprehensive evaluation method to establish the pollutant discharge comprehensive evaluation index. Then, using the convergence test model and from the perspective of intensity and gross, this paper respectively studies the convergence of the pollutant discharge at the nationwide level and in the three major regions. The result shows that the pollutant discharge level of the middle region is the highest, whereas in the western one, it is the lowest; that of the eastern region is higher than the national average. The σ convergence, based on the Theil index, shows that only the middle region shows a feeble σ convergence tendency, whereas the other two ones show a different tendency. Besides, considering the differences of the per capita GDP, the industrial structure, the structure of energy consumption and pollution regulation, the β convergence shows that the two variables of all the regions are conditional β convergence, not absolute β convergence.Keywords: pollutant discharge, dynamic comprehensive evaluation, convergence, GMM fixed effect model
JEL Classification: R11, O13, C32
* Correspondence to: Li Danni, School of Economics and Finance of Xi‘an Jiaotong University, West Road 74 of Yanta, Xi’an, Shaanxi, China; e-mail: [email protected]

108 Ekonomski horizonti (2016) 18(2), 107 - 119
hot theoretical discussion.
Currently, there are two main branches with respect to the pollutant discharge study: the one focuses on the overall pollutant discharge measurement and the other pays attention to the pollutant discharge reduction mechanism. The present research deepens our understanding of China’s pollution discharge problems. However, the measurement related to overall pollutant discharge either based on a simple single index (sulfur dioxide) or multiple single indicators (exhaust gas and solid waste etc.). Actually, various pollutants interrelated and superimposed in space-time, generating combined pollutants during the process of producing, transportation and transformation, which results in a synergistic negative impact on the environment system (Zhengda Li, Xiaoling Yuan & Wanping Yang, 2014). Single or several single pollutant indexes only reflect the partial pollution status; so, using this to evaluate overall pollutant discharge will inevitably fall within the „take-a-part-for-the-whole” dilemma.
Therefore, it is necessary to standardize the research pattern of pollutant discharge from the overall perspective in theory. Putting industrial production and living emission into a unified framework and choosing scientific evaluation methods to comprehensively assess the overall pollutant discharge status of all the provinces in China, then accurately grasp its dynamic evolution rule and explore its convergence effect1. The study on these problems is the basis for dealing with the current severe environmental situation and is also the focus of this paper, which has theoretical and practical significance for bringing the targeted emission and carbon reduction policy.
According to the current study and the actual situation in China, it is hypothesized in this paper that the pollutant discharge level of the middle region is the highest and that of the western one is the lowest, as well as that the pollutant discharge level of the eastern region is higher than the national average.
LITERATURE REVIEW
The core of a comprehensive evaluation of pollutant discharge reflects in the intention to select the
evaluation index and method. Considering the evaluation index, R. Färe, S. Grosskopf and Jr. C. A. Pasurka (2010) use a toxic emission inventory (TRI), which contains a variety of pollutants, to evaluate the performance of the power station (Neng Shen, 2010). Yang Wanping and Yuan Xiaoling (2008) utilize industrial wastewater discharge, industrial exhaust gas emission, industrial soot emission, industrial dust emission, industrial sulfur dioxide emission and industrial solid waste discharge to establish the integrated pollutant discharge index. Based on the same principle, Neng Shen (2010) builds an evaluation system which contains different pollutant discharge indicators and integrates them into one single index (Färe, Grosskopf & Pasurka, 2010). Yafei Wang (2011) selects wastewater, solid waste and exhaust gas produced by the economic system to measure pollutant discharge. The main evaluation methods include the index analysis (Liu, Heilig, Chen & Heino, 2007; Styles, O’Brien & Jones, 2009). The principal component analysis (Chenhui Liu, Xinhong Lv, & Haiyan Fan, 2011), the factor analysis (Ritter, Regalado & Muñoz-Carpena, 2009), the hierarchy analysis (Wang, D., Zhong, X. H., Liu, S. Z., Liu, J. G., Wang, Z. Y. & Li, M. H, 2008), the fuzzy evaluation (Li, Zhang, Wu, Sun, Chen, Pan, Zhao & Cheng, 2008) and the grey evaluation (Tian, Ju, Shao & Fang, 2011). Currently, the selected pollutant discharge indexes do not consider the impact that living discharge have made to the overall pollution status, for which reason the same are not comprehensive. As to the evaluation methods, though unique and superior, all of them are unable to reflect the information difference each index made in time and space when applied to panel data.
THE DYNAMIC COMPREHENSIVE EVALUATION OF PROVINCIAL POLLUTANT DISCHARGE IN CHINA
The establishment of the pollutant discharge index and the source of data
The establishment of the pollutant discharge index
Because the sample interval of each indicator (Table 1) is inconsistent, no effective index can be calculated.
Liu Bolong and Li Danni, The dynamic change of pollutant discharge in China: 1991-2012 109
In this paper, Shiyi Chen’s (2012) approach is used for reference: By establishing 3 sub-indices for different sample intervals and averaging a repeat interval, each province’s pollutant discharge index series from 1991-2012 will be gained. The deviation caused by the single model can be effectively reduced in this way (Table 2).
The data source of the pollutant discharge indicators
The data related to industrial emission, sulfur dioxide emission, soot and dust emission, wastewater discharge, industrial solid waste, living garbage and fertilizer consumption are all taken from the China Statistical Yearbook and the Statistical Yearbook of each province, municipality and autonomous region, in which the total amount of sulfur dioxide emission and wastewater discharge2 are the sum of industrial and living sulfur dioxide emissions, wastewater discharge. According to the latest statistical caliber, the
total amount of soot and dust emission is the sum of industrial and living soot emissions; the data on the pesticides use are taken from the China Rural Statistical Yearbook. At present, there is no official statistical data on carbon dioxide emission. The China Energy Statistical Yearbook provides relatively complete data on all kinds of energy and electricity consumption for each province. In this paper, final energy consumption is divided into these 9 types: coal, coke, crude oil, gasoline, kerosene, diesel, fuel oil, natural gas and electricity, and carbon dioxide emission is calculated according to each one of these 9 types’ coal conversion factor and carbon emission factor. For the specific factors, please refer to the IPCC Guidelines for National Greenhouse Gas Emissions Inventory, edition 20063. In particular, in order to improve relevance, the Y. Xiaoling and L. Zhengda (2013) method is applied in order to decompose Sichuan and Chongqing’s indicators before 1997.
The dynamic comprehensive evaluation model
The specific evaluation steps are as follows.
First, standardize the indicator. Since Undimensionalization will affect the results of the modified scatter degree comprehensive evaluation method, the Yajun Guo, Fengmei Ma and Qingxing Dong (2011) linear proportion method is applied herein so as to standardize the data. Suppose {xij(tk)} stands for the j indicator at the k time of the sample i (i = 1,2,...,n; k = 1,2,...,N); this being so, it can be said that:
. (1)
Table 1 Pollutant discharge evaluation indicators
Target Criteria Indicator Unit Sample Interval
Pollutant Discharge Index (E)
Air Pollution
Carbon Dioxide (CO2) 0.1 billion tons 1995-2012
Sulfur Dioxide (SO2)
10 thousand tons 1991-2012
Soot and Dust (SE)
10 thousand tons 1991-2012
Industrial Emission (IE) 0.1 billion m3 1991-2012
Water Pollution
Wastewater (WE) 0.1 billion tons 1991-2012
Soil Pollution
Living Garbage (TG)
10 thousand tons 1991-2012
Chemical Fertilizer (CF)
10 thousand tons 1991-2012
Industrial Solid Waste (ISWG)
10 thousand tons 1991-2012
Pesticides (UP) tons 1991-2012
Source: Authors, according to the related Statistical Yearbook, shown in the Data Source of Pollutant Discharge indicators
Table 2 The pollutant discharge index model
Gross index
Sub-Indices
Sample Interval Indicators
Pollutant Discharge Index
1 1991-2012 SO2 SE IE WE ISWG UP
2 1995-2012 SO2 SE IE WE ISWG UP CO2
3 1996-2012 SO2 SE IE WE ISWG UP CO2 TG
Source: Authors
110 Ekonomski horizonti (2016) 18(2), 107 - 119
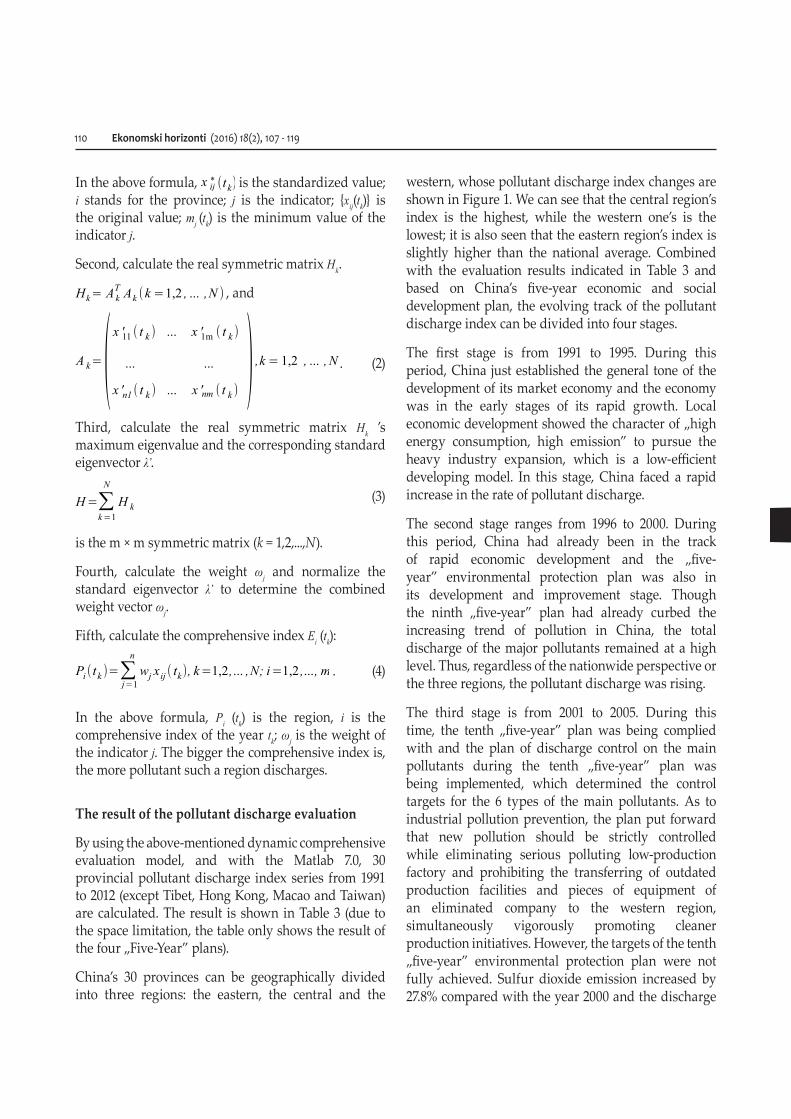
In the above formula, is the standardized value; i stands for the province; j is the indicator; {xij(tk)} is the original value; mj (tk) is the minimum value of the indicator j.
Second, calculate the real symmetric matrix Hk.
, and
. (2)
Third, calculate the real symmetric matrix Hk ’s maximum eigenvalue and the corresponding standard eigenvector λ’.
(3)
is the m × m symmetric matrix (k = 1,2,...,N).
Fourth, calculate the weight ωj and normalize the standard eigenvector λ’ to determine the combined weight vector ωj.
Fifth, calculate the comprehensive index Ei (tk):
. (4)
In the above formula, Pi (tk) is the region, i is the comprehensive index of the year tk; ωj is the weight of the indicator j. The bigger the comprehensive index is, the more pollutant such a region discharges.
The result of the pollutant discharge evaluation
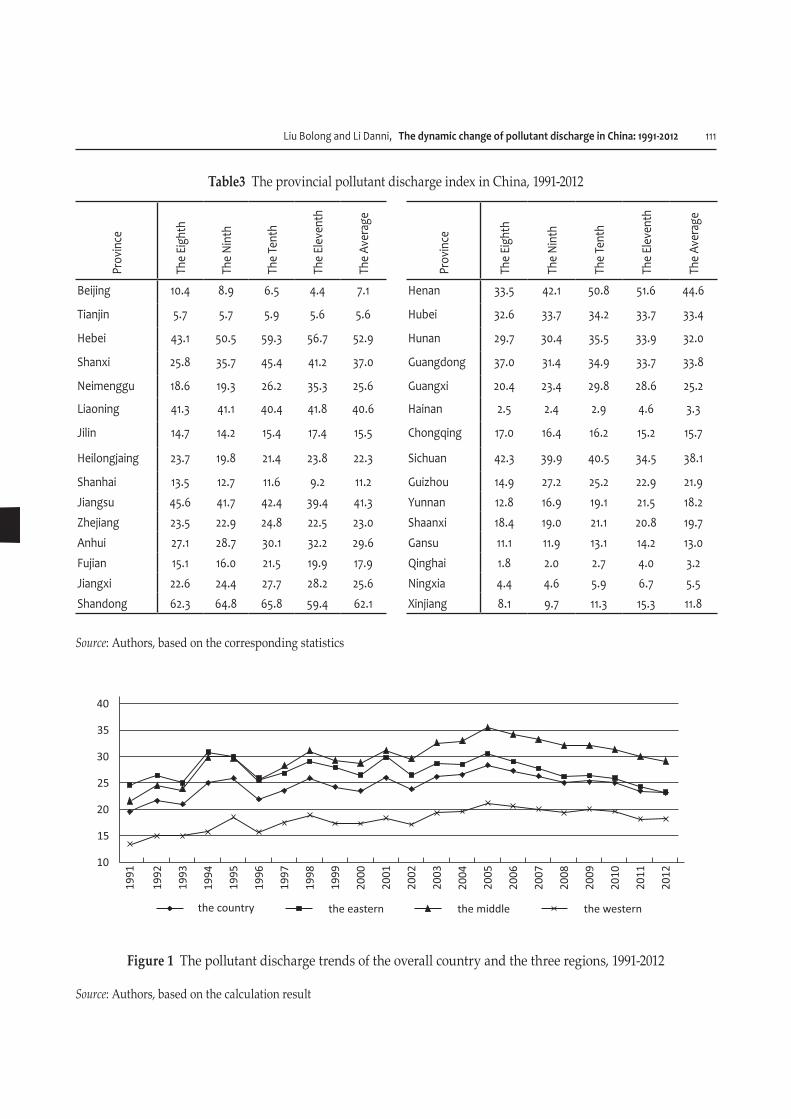
By using the above-mentioned dynamic comprehensive evaluation model, and with the Matlab 7.0, 30 provincial pollutant discharge index series from 1991 to 2012 (except Tibet, Hong Kong, Macao and Taiwan) are calculated. The result is shown in Table 3 (due to the space limitation, the table only shows the result of the four „Five-Year” plans).
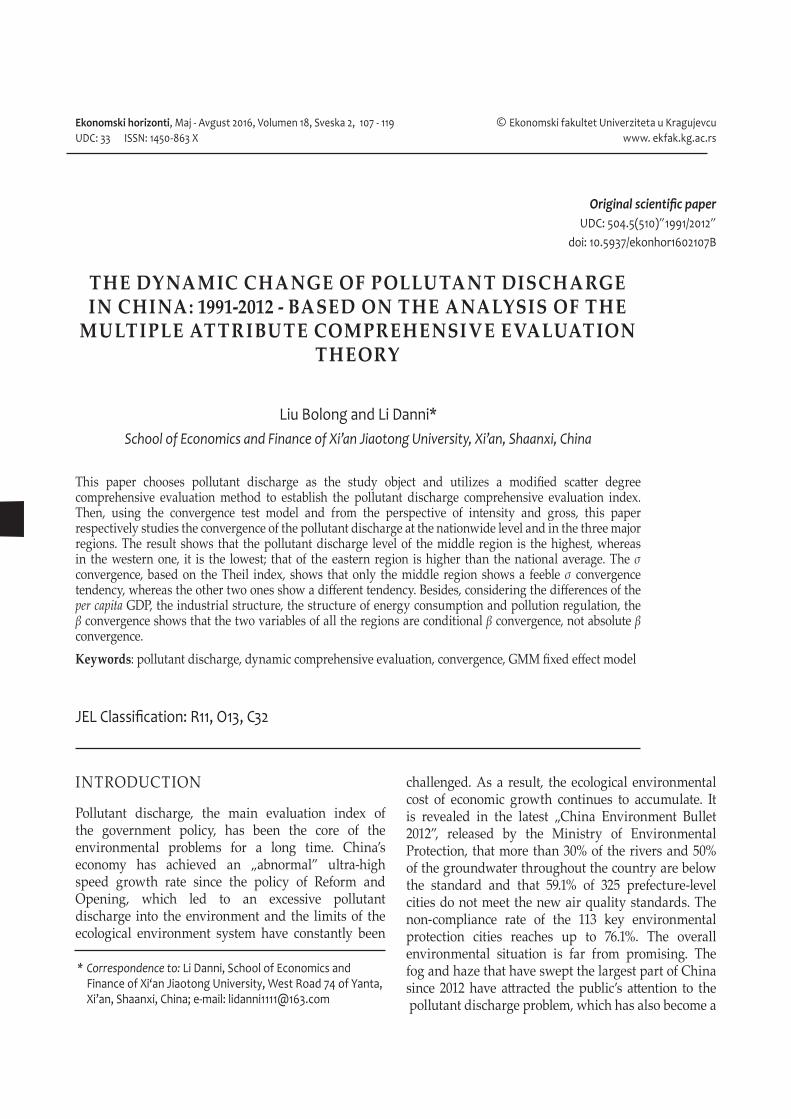
China’s 30 provinces can be geographically divided into three regions: the eastern, the central and the
western, whose pollutant discharge index changes are shown in Figure 1. We can see that the central region’s index is the highest, while the western one’s is the lowest; it is also seen that the eastern region’s index is slightly higher than the national average. Combined with the evaluation results indicated in Table 3 and based on China’s five-year economic and social development plan, the evolving track of the pollutant discharge index can be divided into four stages.
The first stage is from 1991 to 1995. During this period, China just established the general tone of the development of its market economy and the economy was in the early stages of its rapid growth. Local economic development showed the character of „high energy consumption, high emission” to pursue the heavy industry expansion, which is a low-efficient developing model. In this stage, China faced a rapid increase in the rate of pollutant discharge.
The second stage ranges from 1996 to 2000. During this period, China had already been in the track of rapid economic development and the „five-year” environmental protection plan was also in its development and improvement stage. Though the ninth „five-year” plan had already curbed the increasing trend of pollution in China, the total discharge of the major pollutants remained at a high level. Thus, regardless of the nationwide perspective or the three regions, the pollutant discharge was rising.
The third stage is from 2001 to 2005. During this time, the tenth „five-year” plan was being complied with and the plan of discharge control on the main pollutants during the tenth „five-year” plan was being implemented, which determined the control targets for the 6 types of the main pollutants. As to industrial pollution prevention, the plan put forward that new pollution should be strictly controlled while eliminating serious polluting low-production factory and prohibiting the transferring of outdated production facilities and pieces of equipment of an eliminated company to the western region, simultaneously vigorously promoting cleaner production initiatives. However, the targets of the tenth „five-year” environmental protection plan were not fully achieved. Sulfur dioxide emission increased by 27.8% compared with the year 2000 and the discharge
Liu Bolong and Li Danni, The dynamic change of pollutant discharge in China: 1991-2012 111
Table3 The provincial pollutant discharge index in China, 1991-2012
Prov
ince
The
Eigh
th
The
Nint
h
The
Tent
h
The
Elev
enth
The
Aver
age
Prov
ince
The
Eigh
th
The
Nint
h
The
Tent
h
The
Elev
enth
The
Aver
age
Beijing 10.4 8.9 6.5 4.4 7.1 Henan 33.5 42.1 50.8 51.6 44.6
Tianjin 5.7 5.7 5.9 5.6 5.6 Hubei 32.6 33.7 34.2 33.7 33.4
Hebei 43.1 50.5 59.3 56.7 52.9 Hunan 29.7 30.4 35.5 33.9 32.0
Shanxi 25.8 35.7 45.4 41.2 37.0 Guangdong 37.0 31.4 34.9 33.7 33.8
Neimenggu 18.6 19.3 26.2 35.3 25.6 Guangxi 20.4 23.4 29.8 28.6 25.2
Liaoning 41.3 41.1 40.4 41.8 40.6 Hainan 2.5 2.4 2.9 4.6 3.3
Jilin 14.7 14.2 15.4 17.4 15.5 Chongqing 17.0 16.4 16.2 15.2 15.7
Heilongjaing 23.7 19.8 21.4 23.8 22.3 Sichuan 42.3 39.9 40.5 34.5 38.1
Shanhai 13.5 12.7 11.6 9.2 11.2 Guizhou 14.9 27.2 25.2 22.9 21.9 Jiangsu 45.6 41.7 42.4 39.4 41.3 Yunnan 12.8 16.9 19.1 21.5 18.2 Zhejiang 23.5 22.9 24.8 22.5 23.0 Shaanxi 18.4 19.0 21.1 20.8 19.7 Anhui 27.1 28.7 30.1 32.2 29.6 Gansu 11.1 11.9 13.1 14.2 13.0 Fujian 15.1 16.0 21.5 19.9 17.9 Qinghai 1.8 2.0 2.7 4.0 3.2 Jiangxi 22.6 24.4 27.7 28.2 25.6 Ningxia 4.4 4.6 5.9 6.7 5.5 Shandong 62.3 64.8 65.8 59.4 62.1 Xinjiang 8.1 9.7 11.3 15.3 11.8
Source: Authors, based on the corresponding statistics
Figure 1 The pollutant discharge trends of the overall country and the three regions, 1991-2012
Source: Authors, based on the calculation result
112 Ekonomski horizonti (2016) 18(2), 107 - 119
of the major pollutants exceeded the environmental capacity by far, which indicated that there was still serious pollution in place. This also explained why the emission during this period was still rising.
The fourth stage is from 2005 to 2012. During this time, China had already made a breakthrough on some deep-seated environmental problems, which showed that China’s environmental policy had entered the innovation stage. The eleventh „five-year” plan proposed the idea that the economic and social development should be coordinated with environmental protection, focusing on pollution reduction. Since 2005, the pollutant discharge indexes observed nationwide and those of the three regions have all fell from their highest values, which remained such up to 2001, but they started to decline more slowly after the year 2011.
CONVERGENCE ANALYSIS
Earlier in the paper, pollutant discharge of each province was evaluated from the perspective of the total discharge, called the pollutant discharge index (hereinafter referred to as the gross index). Considering China’s current development status, the pollutant discharge of each province was also evaluated from the perspective of the economic development cost, called the pollutant discharge intensity index (hereinafter referred to as the intensity index). That is the gross index generated by the per-unit of the GDP, using the 1990’s price to deflate. In order to test whether there is a convergence effect of the two indices’ developing track, the convergence empirical model of the economic growth theory was used in order to analyze the convergence of pollutant discharge. Generally, there are 3 kinds of the convergence test: the σ convergence, the absolute β convergence and the conditional β convergence tests (Sala-I-Martin, 1996).
σ convergence
In this paper, the Theil index (Theil, 1972) is used as the measure of σ convergence, because the Theil index not only reflects the overall differences, but it also indicates the differences between groups and within
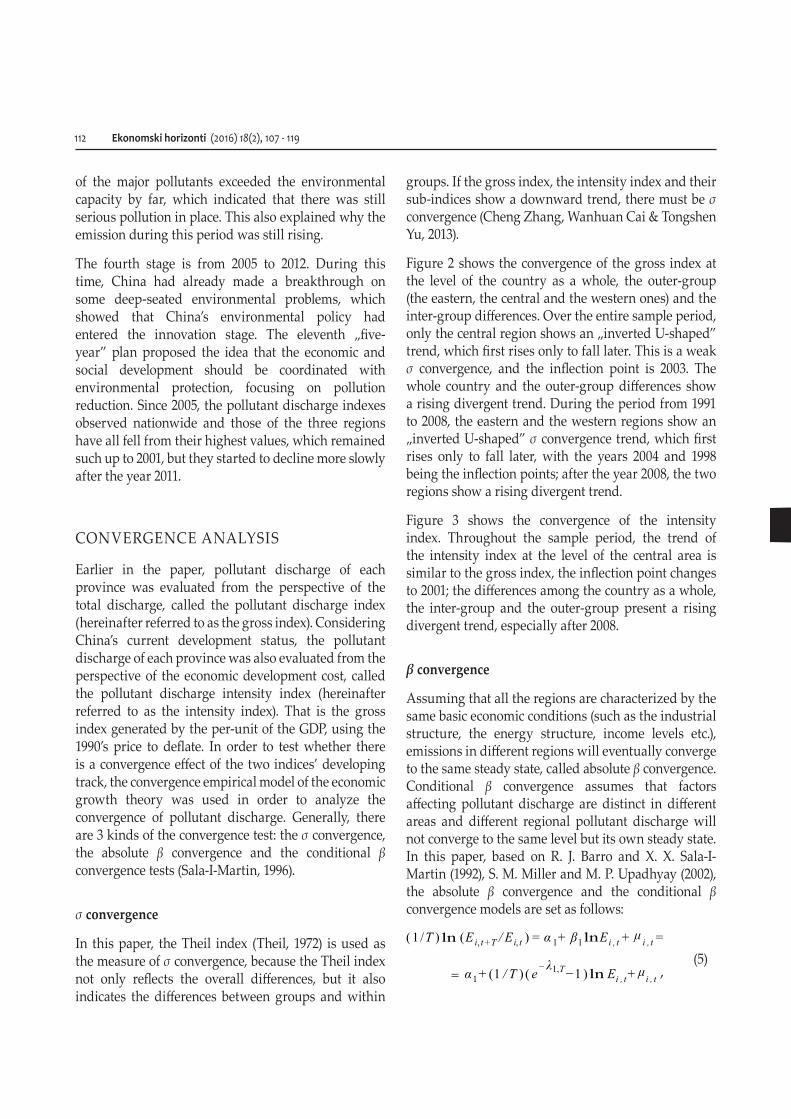
groups. If the gross index, the intensity index and their sub-indices show a downward trend, there must be σ convergence (Cheng Zhang, Wanhuan Cai & Tongshen Yu, 2013).
Figure 2 shows the convergence of the gross index at the level of the country as a whole, the outer-group (the eastern, the central and the western ones) and the inter-group differences. Over the entire sample period, only the central region shows an „inverted U-shaped” trend, which first rises only to fall later. This is a weak σ convergence, and the inflection point is 2003. The whole country and the outer-group differences show a rising divergent trend. During the period from 1991 to 2008, the eastern and the western regions show an „inverted U-shaped” σ convergence trend, which first rises only to fall later, with the years 2004 and 1998 being the inflection points; after the year 2008, the two regions show a rising divergent trend.
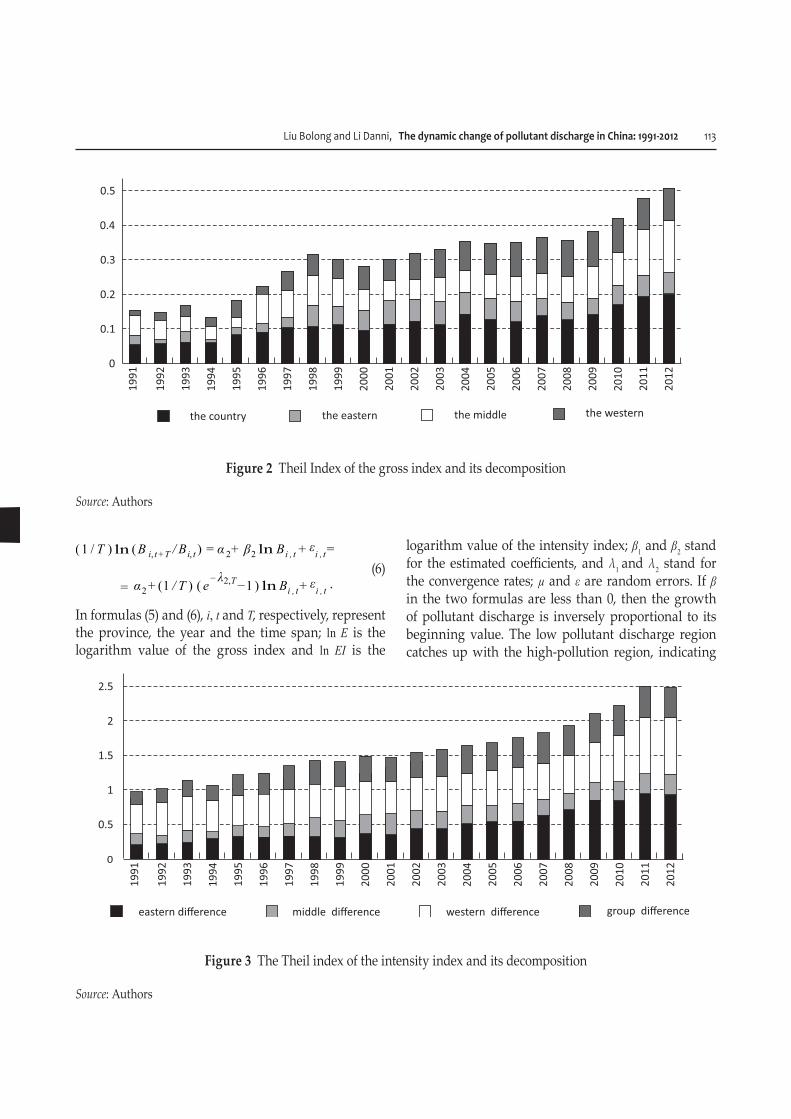
Figure 3 shows the convergence of the intensity index. Throughout the sample period, the trend of the intensity index at the level of the central area is similar to the gross index, the inflection point changes to 2001; the differences among the country as a whole, the inter-group and the outer-group present a rising divergent trend, especially after 2008.
β convergence
Assuming that all the regions are characterized by the same basic economic conditions (such as the industrial structure, the energy structure, income levels etc.), emissions in different regions will eventually converge to the same steady state, called absolute β convergence. Conditional β convergence assumes that factors affecting pollutant discharge are distinct in different areas and different regional pollutant discharge will not converge to the same level but its own steady state. In this paper, based on R. J. Barro and X. X. Sala-I-Martin (1992), S. M. Miller and M. P. Upadhyay (2002), the absolute β convergence and the conditional β convergence models are set as follows:
(5)
Liu Bolong and Li Danni, The dynamic change of pollutant discharge in China: 1991-2012 113
(6)
In formulas (5) and (6), i, t and T, respectively, represent the province, the year and the time span; ln E is the logarithm value of the gross index and ln EI is the
logarithm value of the intensity index; β1 and β2 stand for the estimated coefficients, and λ1 and λ2 stand for the convergence rates; µ and ε are random errors. If β in the two formulas are less than 0, then the growth of pollutant discharge is inversely proportional to its beginning value. The low pollutant discharge region catches up with the high-pollution region, indicating
Figure 2 Theil Index of the gross index and its decomposition
Source: Authors
Figure 3 The Theil index of the intensity index and its decomposition
Source: Authors
114 Ekonomski horizonti (2016) 18(2), 107 - 119
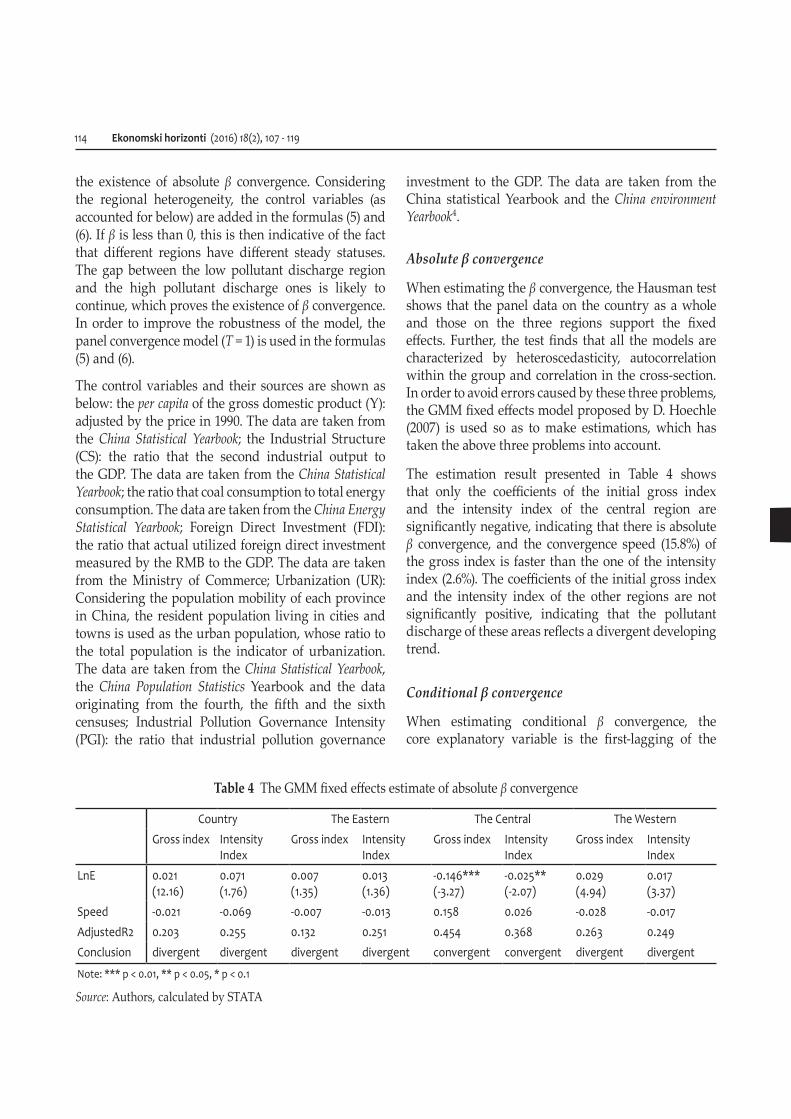
the existence of absolute β convergence. Considering the regional heterogeneity, the control variables (as accounted for below) are added in the formulas (5) and (6). If β is less than 0, this is then indicative of the fact that different regions have different steady statuses. The gap between the low pollutant discharge region and the high pollutant discharge ones is likely to continue, which proves the existence of β convergence. In order to improve the robustness of the model, the panel convergence model (T = 1) is used in the formulas (5) and (6).
The control variables and their sources are shown as below: the per capita of the gross domestic product (Y): adjusted by the price in 1990. The data are taken from the China Statistical Yearbook; the Industrial Structure (CS): the ratio that the second industrial output to the GDP. The data are taken from the China Statistical Yearbook; the ratio that coal consumption to total energy consumption. The data are taken from the China Energy Statistical Yearbook; Foreign Direct Investment (FDI): the ratio that actual utilized foreign direct investment measured by the RMB to the GDP. The data are taken from the Ministry of Commerce; Urbanization (UR): Considering the population mobility of each province in China, the resident population living in cities and towns is used as the urban population, whose ratio to the total population is the indicator of urbanization. The data are taken from the China Statistical Yearbook, the China Population Statistics Yearbook and the data originating from the fourth, the fifth and the sixth censuses; Industrial Pollution Governance Intensity (PGI): the ratio that industrial pollution governance
investment to the GDP. The data are taken from the China statistical Yearbook and the China environment Yearbook4.
Absolute β convergence
When estimating the β convergence, the Hausman test shows that the panel data on the country as a whole and those on the three regions support the fixed effects. Further, the test finds that all the models are characterized by heteroscedasticity, autocorrelation within the group and correlation in the cross-section. In order to avoid errors caused by these three problems, the GMM fixed effects model proposed by D. Hoechle (2007) is used so as to make estimations, which has taken the above three problems into account.
The estimation result presented in Table 4 shows that only the coefficients of the initial gross index and the intensity index of the central region are significantly negative, indicating that there is absolute β convergence, and the convergence speed (15.8%) of the gross index is faster than the one of the intensity index (2.6%). The coefficients of the initial gross index and the intensity index of the other regions are not significantly positive, indicating that the pollutant discharge of these areas reflects a divergent developing trend.
Conditional β convergence
When estimating conditional β convergence, the core explanatory variable is the first-lagging of the
Table 4 The GMM fixed effects estimate of absolute β convergence
Country The Eastern The Central The WesternGross index Intensity
IndexGross index Intensity
IndexGross index Intensity
IndexGross index Intensity
IndexLnE 0.021
(12.16)0.071 (1.76)
0.007 (1.35)
0.013 (1.36)
-0.146*** (-3.27)
-0.025** (-2.07)
0.029 (4.94)
0.017 (3.37)
Speed -0.021 -0.069 -0.007 -0.013 0.158 0.026 -0.028 -0.017AdjustedR2 0.203 0.255 0.132 0.251 0.454 0.368 0.263 0.249Conclusion divergent divergent divergent divergent convergent convergent divergent divergent
Note: *** p < 0.01, ** p < 0.05, * p < 0.1
Source: Authors, calculated by STATA
Liu Bolong and Li Danni, The dynamic change of pollutant discharge in China: 1991-2012 115
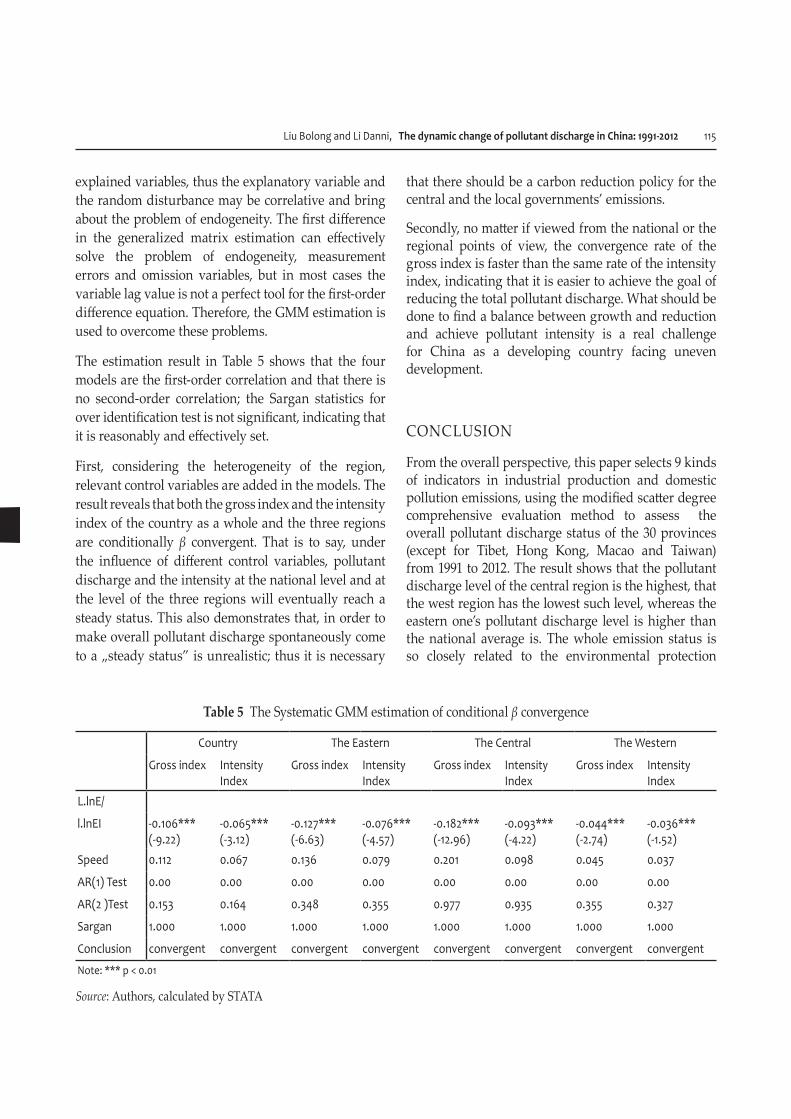
explained variables, thus the explanatory variable and the random disturbance may be correlative and bring about the problem of endogeneity. The first difference in the generalized matrix estimation can effectively solve the problem of endogeneity, measurement errors and omission variables, but in most cases the variable lag value is not a perfect tool for the first-order difference equation. Therefore, the GMM estimation is used to overcome these problems.
The estimation result in Table 5 shows that the four models are the first-order correlation and that there is no second-order correlation; the Sargan statistics for over identification test is not significant, indicating that it is reasonably and effectively set.
First, considering the heterogeneity of the region, relevant control variables are added in the models. The result reveals that both the gross index and the intensity index of the country as a whole and the three regions are conditionally β convergent. That is to say, under the influence of different control variables, pollutant discharge and the intensity at the national level and at the level of the three regions will eventually reach a steady status. This also demonstrates that, in order to make overall pollutant discharge spontaneously come to a „steady status” is unrealistic; thus it is necessary
that there should be a carbon reduction policy for the central and the local governments’ emissions.
Secondly, no matter if viewed from the national or the regional points of view, the convergence rate of the gross index is faster than the same rate of the intensity index, indicating that it is easier to achieve the goal of reducing the total pollutant discharge. What should be done to find a balance between growth and reduction and achieve pollutant intensity is a real challenge for China as a developing country facing uneven development.
CONCLUSION
From the overall perspective, this paper selects 9 kinds of indicators in industrial production and domestic pollution emissions, using the modified scatter degree comprehensive evaluation method to assess the overall pollutant discharge status of the 30 provinces (except for Tibet, Hong Kong, Macao and Taiwan) from 1991 to 2012. The result shows that the pollutant discharge level of the central region is the highest, that the west region has the lowest such level, whereas the eastern one’s pollutant discharge level is higher than the national average is. The whole emission status is so closely related to the environmental protection
Table 5 The Systematic GMM estimation of conditional β convergence
Country The Eastern The Central The Western
Gross index Intensity Index
Gross index Intensity Index
Gross index Intensity Index
Gross index Intensity Index
L.lnE/
l.lnEI -0.106*** (-9.22)
-0.065*** (-3.12)
-0.127*** (-6.63)
-0.076*** (-4.57)
-0.182*** (-12.96)
-0.093*** (-4.22)
-0.044*** (-2.74)
-0.036*** (-1.52)
Speed 0.112 0.067 0.136 0.079 0.201 0.098 0.045 0.037
AR(1) Test 0.00 0.00 0.00 0.00 0.00 0.00 0.00 0.00
AR(2 )Test 0.153 0.164 0.348 0.355 0.977 0.935 0.355 0.327
Sargan 1.000 1.000 1.000 1.000 1.000 1.000 1.000 1.000
Conclusion convergent convergent convergent convergent convergent convergent convergent convergent
Note: *** p < 0.01
Source: Authors, calculated by STATA
116 Ekonomski horizonti (2016) 18(2), 107 - 119
policy. The paper applies the convergence analysis often used in economic growth theory to establish the framework of pollutant discharge evaluation, and makes a convergence effect analysis of China’s overall pollutant discharge status from 1991 to 2012, from the perspective of the total amount and intensity.
The σ convergence based on the Theil index shows throughout the sample period that only the middle region’s gross index reflects a feeble σ convergence tendency. From 1991 to 2008, the eastern and the western regions present an σ convergence trend, only to turn to a rising divergent trend after 2008. The other regions show a divergent trend. When the intensity index is concerned, only the middle region shows a feeble σ convergence tendency throughout the sample period, whereas the others are characterized by a divergent trend.
The results of absolute β convergence show that, no matter whether the gross index or the intensity index are concerned, the middle region is the only one to significantly show absolute β convergence, whereas no absolute β convergence is perceived in the other regions. Taking into consideration the differences among the per-capita GDP, the industrial structure, the energy consumption structure and pollution regulation, the conditional β convergence result shows that the two indices of all the regions are conditional β convergence and the faster convergence rate of the gross index than it is the case with the intensity index.
In view of this, the main contribution of this paper includes: first, from the overall perspective that fully considers the comprehensiveness and complexity of pollutant discharge, this paper selects 9 kinds of evaluation indicators according to the impact industrial and living pollution has made on air, water and soil, uses the modified scatter degree comprehensive evaluation method (Guo Yajun, 2007) for the purpose of measuring the overall pollutant discharge status of the 30 provinces and cities in China (except for Tibet, Hong Kong, Macao and Taiwan) in the period from 1991 to 2012, and then builds the comprehensive evaluation index of pollutant discharge (the pollutant discharge index. in short), which can stand for the pollutant discharge condition to the hit and make up for the deficiencies regarding the fact that the single index cannot reveal the overall condition. Second,
this paper applies convergence analysis, which is often used in economic growth theory to establish the framework of pollutant discharge evaluation, and makes a convergence effect analysis of China’s overall pollutant discharge status from 1991 to 2012, from the perspective of amount and intensity. The limitation of this paper, however, is that it focuses on a provincial analysis, lacking a smaller-scale evaluation, such as a city and a county, which makes the research less targeted. The evaluation scope should be narrowed and the indicator should be extended in a further study.
According to the above findings, our understanding of two things has deepened.
First, because pollutant discharge is comprehensive and complex, an overall concept should be established and all factors should be taken into consideration when reducing emission. According to the contents of this paper, the pollutant discharge index is a multi-dimensional evaluation system based on air, water and soil. Currently, some local governments lack a concept of „overall governance”, which results in the re-emergence of pollutant discharge. Therefore, to improve the overall pollution status, the government should set the carbon and pollution reduction job as a holistic system and thoroughly engage in doing work on the comprehensive management of the air, water and soil pollution sources.
Secondly, for the reason of the fact that the intensity index is more difficult to reduce than the gross index is, the government should set a quality and efficient economic growth as a goal, taking as well various measurements in order to reduce discharge and carbon. In order to achieve transfer from extensive to intensive economic growth, the government should increase investment in pollution reduction and improve capital efficiency to make the investment match the effectiveness of the work on such reduction. They should also actively adjust the industrial structure, accelerate the development of the low-emission and low-carbon industry and increase the proportion of added value from the service industry and the strategic emerging industry. The government should adjust and optimize the energy consumption structure, and strictly control the total amount of coal consumption, reduce the proportion of coal
Liu Bolong and Li Danni, The dynamic change of pollutant discharge in China: 1991-2012 117
consumption while simultaneously increasing the use of clean energy. They should reasonably direct FDI flows, set the main pollutant discharge as the pre-condition for the introduction of foreign capital so as to improve the quality of foreign investment. They should establish the emission trading system combined with the special enforcement of the environmental protection departments so as to force enterprises to increase investment in pollution control.
ENDNOTES
1 The „convergence effect” in this paper refers to the convergence analysis. In the current literature, the empirical analysis of the convergence of environmental issues has been carried out, but few scholars have, however, conducted a systematic overall convergence analysis of China’s pollutant discharge problems.
2 Due to the space limitations, the detailed calculation process and the results are not shown in this paper. Should you be interested in learning them, please contact the author.
3 Living wastewater in the total wastewater discharge refers to the water discharged due to the living use.
4 The China Statistical Yearbook only provides data on industrial pollution governance investment from 1996 to 2012, and the China Environment Yearbook provides data on the pollution governance investment made by enterprises and institutions in the period from 1991 to 1995. The data on industrial pollution governance investment in this paper is the sum of these two parts.
REFERENCES
Barro, R. J., & Sala-I-Martin, X. X. (1992). Convergence. The Journal of Political Economic, 100(2), 223-251. http://dx.doi.org/10.1086/261816
Chen Shiyi. (2012). Assessment on transition process of Chinese regional low-carbon economy. Economic Research, 2.
Cheng Zhang, Wanhuan Cai, & Tongshen Yu. (2013). Regional economic growth and carbon productivity - Based on convergence and decoupling index analysis. China Industrial Economy, 100(2), 18-30.
Chenhui Liu, Xinhong Lv, & Haiyan Fan. (2011). Discussion on principal component analysis for environmental quality
evaluation. Environmental Science and Management, 3, 183-186.
Färe, R., Grosskopf, S., & Pasurka, Jr. C. A. (2010). Toxic releases: An environmental performance index for coal-fired power plants. Energy Economics, 32(1), 158-165. doi:10.1016/j.eneco.2009.07.005
Guo Yajun. (2007). Comprehensive Evaluation Theory, Methods and Applications. Beijing, China: Science Press.
Guo Yajun, Fengmei Ma, & Qingxing Dong. (2011). Undimensionalization influence on modified scatter degree comprehensive evaluation method. Journal of Management Science, 5, 19-28.
Hoechle, D. (2007). Robust standard errors for panel regressions with cross-sectional dependence. The Stata Journal, 7(3), 281-312.
Li, W. X., Zhang, X. X., Wu, B, Sun, S. L., Chen, Y. S., Pan, W. Y., Zhao, D. Y., & Cheng, S. P. A. (2008). Comparative analysis of environmental quality assessment methods for heavy metal-contaminated soils. Pedosphere, 18(3), 344-352.
Liu, X., Heilig, G. K., Chen, J., & Heino, M. (2007). Interactions between economic growth and environmental quality in Shenzhen, China’s first special economic zone. Ecological Economics, 62, 559-570. doi:10.1016/j.ecolecon.2006.07.020
Miller, S. M., & Upadhyay, M. P. (2002). Total factor productivity and the convergence hypothesis. Journal of Macroeconomics, 24(2), 267-286. doi:10.1016/S0164-0704(02)00022-8
Neng Shen. (2010). Regional spatial analysis on energy inputs, emissions and energy efficiency. Trade Economics, 1, 107-113.
Ritter, A. Regalado, C. M., & Muñoz-Carpena, R. (2009). Temporal common trends of topsoil water dynamics in a humid subtropical forest watershed. Vadose Zone Hydrology, 8(2), 437-449. doi: 10.2136/vzj2008.0054
Sala-i-Martin, X. X. (1996). The classical approach to convergence analysis. Economic Journal, 106(437), 1019-1036. doi: 10.2307/2235375
Styles, D., O’Brien, K., & Jones, M. B. (2009). A quantitative integrated assessment of pollution prevention achieved by integrated pollution prevention control licensing. Environment International, 35(8), 1177-1187. doi: 10.1016/j.envint.2009.07.013
Theil, H. (1972). Statistical decomposition analysis: With application in the social and administrative sciences. Studies in Mathematical and Managerial Economics, Volume 14.
Tian, X. G., Ju, M. T., Shao, C. F., & Fang, Z. L. (2011). Developing a new grey dynamic modeling system for evaluation of
118 Ekonomski horizonti (2016) 18(2), 107 - 119
biology and pollution indicators of the marine environment in coastal areas. Ocean & Coastal Management, 54(10), 750-759. doi: 10.1016/j.ocecoaman.2011.08.003
Wang, X. D., Zhong, X. H., Liu, S. Z., Liu, J. G., Wang, Z. Y., & Li, M. H. (2008). Regional assessment of environmental vulnerability in the Tibetan Plateau: Development and application of a new method. Journal of Arid Environments, 72(10), 1929-1939. doi: 10.1016/j.jaridenv.2008.06.005
Xiaoling Yuan, & Zhengda Li. (2013). Chinese ecological environment dynamic changes, regional differences and the impact mechanism. Economy Science, 6, 59-76.
Yafei Wang. (2011). Impact of urbanization make on resource consumption and pollutant discharge. Urban Studies, 3, 53-57.
Yang Wanping, & Yuan Xiaoling. (2008). The analysis on the
influence foreign trade and FDI made to pollutant discharge. World Economy, 2, 62-68.
Zhengda Li, Xiaoling Yuan, & Wanping Yang. (2014). Environmental quality assessment: situation, confusion and prospects. Resource Science, 1, 175-181.
The China Energy Statistical Yearbook
The China Environment Yearbook
The China Population Statistics Yearbook
The China Rural Statistical Yearbook
The China Statistical Yearbook
The Guidelines for National Greenhouse Gas Emissions Inventory. (2006).
Liu Bolong is an employee at the School of Economics and Finance of Xi’an Jiaotong University, Xi’an, Shaanxi, China.
Li Danni is an employee at the School of Economics and Finance of Xi’an Jiaotong University, Xi’an, Shaanxi, China.
Received on 2nd June 2016, after revision,
accepted for publication on 22nd August 2016.
Published online on 26th August 2016.
Liu Bolong and Li Danni, The dynamic change of pollutant discharge in China: 1991-2012 119
DINAMIČKE PROMENE U EMISIJI ZAGAĐIVAČA U KINI U PERIODU 1991-2012, NA OSNOVU ANALIZE TEORIJE
SVEOBUHVATNE PROCENE VIŠESTRUKIH ATRIBUTA
Liu Bolong and Li DanniSchool of Economics and Finance of Xi’an Jiaotong University, Xi’an, Shaanxi, China
Predmet istraživanja u ovom radu je emisija zagađivača. Za utvrđivanje indeksa sveobuhvatne procene emisije zagađivača upotrebljen je modifikovani metod sveobuhvatne procene stepena rasturanja. Zatim, kroz korišćenje modela testa konvergencije, i to sa stanovišta ukupnog iznosa i intenziteta, istražena je konvergencija emisije zagađivača na nacionalnom nivou i u tri glavna regiona, respektivno. Rezultat pokazuje da je nivo emisije zagađivača u središnjem regionu najviši, u zapadnom regionu najniži, a da je u istočnom regionu viši od nacionalnog proseka. Zasnovana na H. Theil-ovom indeksu, σ konvergencija pokazuje da se samo u središnjem regionu manifestuje tendencija slabe σ konvergencije, a da druga dva regiona pokazuju drugačiju tendenciju. Uz to, s obzirom na razlike u BDP per capita, industrijskoj strukturi, strukturi potrošnje energije i regulaciji zagađivanja, β konvergencija pokazuje da su dve varijable svih regiona uslovna - a ne apsolutna - β konvergencija.Ključne reči: emisija zagađivača, dinamička sveobuhvatna procena, konvergencija, model utvrđenog učinka generalizovane metode momenata (GMM)
JEL Classification: R11, O13, C32