Embed Size (px)
Citation preview
Created: May | 2018 Revised: November | 2020
Sumter County
Community Health Assessment 2018

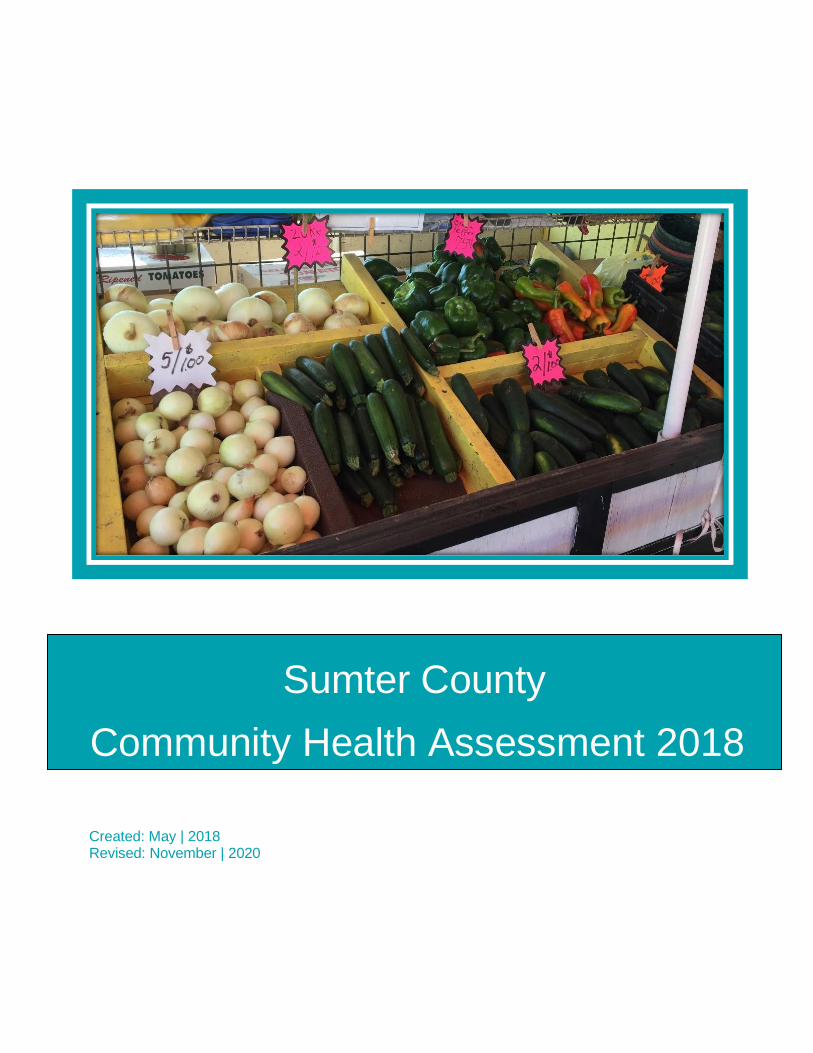
Revision Log
Name of Person(s)
Making Revisions
Date of Revisions
Description of revisions (Including sections revised and goal or
objectives changed)
Reason for Revision
Daniel Chacreton
10/20/2020 CHA Addendum added Health disparities and infectious disease components required expansion
Daniel Chacreton
11/23/2020 CHA Addendum modified. See CHA Addendum Summary for details.
Revision made based on state feedback and plan review process.
ii
Table of Contents Table of Contents ........................................................................................................................ ii Executive Summary .................................................................................................................... 1 Introduction ................................................................................................................................. 3 CHA Report Purpose: .................................................................................................................. 3 MAPP Community Health Assessment Process ........................................................................ 5
Phase 1: Organizing and Engaging Partners ........................................................................ 6 Phase 2: Create a Vision ......................................................................................................... 7 Phase 3: Data Collection and Assessments .......................................................................... 7
a. Community Health Status Assessment (CHSA) ........................................................ 7 b. Community Themes and Strengths Assessment (CTSA) and Community Health Assessment and Group Evaluation (CHANGE) ................................................................. 8 c. Local Public Health System Assessment (LPHSA) ................................................. 11 d. Forces of Change (FoC) ............................................................................................ 11
Phase 4 and Phase 5: Identification of Strategic Issues and Formulation of Goals and Strategies ............................................................................................................................... 11 Phase 6: Action cycle ........................................................................................................... 12
Community Health Status Assessment ................................................................................... 13 Demographics ........................................................................................................................ 14
Population .......................................................................................................................... 14 Summary ............................................................................................................................. 16
Social Determinates of Health ............................................................................................... 17 Socioeconomic ..................................................................................................................... 17 Educational Attainment ......................................................................................................... 22 County Health Rankings ....................................................................................................... 23 United Way ALICE Report .................................................................................................... 23 Summary ............................................................................................................................. 24 Healthcare Access ................................................................................................................ 27 Health Risk Behaviors .......................................................................................................... 31 Health Protective Behaviors ................................................................................................. 33 Summary ............................................................................................................................. 33
Health Outcomes ................................................................................................................... 34 Life Expectancy .................................................................................................................... 34 Mortality ............................................................................................................................... 35 Health Care Utilization .......................................................................................................... 37 Infectious Disease ................................................................................................................ 41 Maternal, Child Health and Adolescent Health ....................................................................... 42 Violence ............................................................................................................................... 47 Summary ............................................................................................................................. 49
Key Data Findings ................................................................................................................... 50 Community Themes and Strengths Assessment .................................................................... 51
CHANGE surveys .................................................................................................................. 51 Sumter Through Your Lens .................................................................................................. 52
Forces of Change Assessment ................................................................................................ 55 Introduction ........................................................................................................................... 55 Method ................................................................................................................................... 55
Summary.............................................................................................................................. 55
Table of Contents
Local Public Health System Assessment ................................................................................ 56 Method ................................................................................................................................... 56
Observations ........................................................................................................................ 56 Conclusion ................................................................................................................................. 57
Discussion ............................................................................................................................. 57 Identification of Strategic Priorities ..................................................................................... 57
1. Maternal and Child Health ............................................................................................ 57 2. Chronic Diseases ....................................................................................................... 58 3. Community Engagement .............................................................................................. 59
Summary and Conclusion ..................................................................................................... 60 Maternal and Child Health .................................................................................................... 60 Chronic Diseases ................................................................................................................. 61 Community Engagement ...................................................................................................... 62 Next Steps ........................................................................................................................... 62
Acknowledgments .................................................................................................................... 63 References ................................................................................................................................ 64 Appendices ............................................................................................................................... 65
Appendix A: Full List of Sumter County MAPP Steering Committee Organizations ........ 66 Appendix B: Visioning Results ............................................................................................ 67 Appendix C: Bus Stop Survey .............................................................................................. 69 Appendix D: Golf Cart Survey .............................................................................................. 71 Appendix E: Windshield Survey ........................................................................................... 73 Appendix F: Walkability Survey ........................................................................................... 75 Appendix G: Focus Group Report........................................................................................ 78 Appendix H: 2018 Steering Committee Survey Assessment Tool ..................................... 84 Appendix I: 2018 Steering Committee Survey Results ....................................................... 91 Appendix J: Local Public Health System Assessment Results ....................................... 101 Appendix K: Forces of Change Assessment .................................................................... 102 Appendix L: 2018 Steering Committee Meeting Sign-in Sheet ........................................ 107 Appendix M: 2018 Steering Committee Meeting Minutes ................................................. 111 Appendix N: 2018 Best Practice Recommendations ........................................................ 113
Key Resources ...................................................................................................................... 116 Sumter County Community Health Assessment Addendum ............................................... cxix
Population Specific Health Challenges ............................................................................. cxx Aging ................................................................................................................................. cxx Health Disparities ............................................................................................................... cxx
Strategic Priority Area: Chronic Disease & Infectious Disease ....................................... cxxi Social Determinants of Health: Income .............................................................................. cxxi Social Determinants of Health: Education .......................................................................... cxxi Health Disparities: Life Expectancy ................................................................................... cxxii Health Disparities: Teen Pregnancy .................................................................................. cxxii Health Disparities: Health Outcomes ............................................................................... cxxiii Unintentional Injury: Car Seat Misuse .............................................................................. cxxiv Unintentional Injury: Falls ................................................................................................. cxxiv Infectious Disease: Hepatitis A ......................................................................................... cxxv
Sub-appendix .................................................................................................................... cxxvi Sub-appendix A: Life Expectancy by Census Tract ......................................................... cxxvii Sub-appendix B: Median Income by Census Tract ........................................................ cxxviii Sub-appendix C: Education Level .................................................................................... cxxix

iv
Sub-appendix D: Health Disparities .................................................................................. cxxx Sub-appendix E: Community Assets and Resources ....................................................... cxxxi
Table of Contents
Definitions
Community Health Assessment (CHA): One of the four MAPP core assessments. A systematic
evaluation and review of various indicators that play a role in community health.
Community Health Improvement Plan (CHIP): 2018-2023 Sumter County CHIP
Community Themes and Strengths Assessment (CTSA): One of the four MAPP core
assessments. Aimed at identifying and evaluating key focus areas, perceived quality of life, and
available assets that could contribute to community health.
Florida Department of Health in Sumter County (DOH-Sumter)
Forces of Change Assessment (FoC): One of the four MAPP core assessments. “Focuses on
identifying forces such as legislation, technology, and other impending changes that affect the context
in which the community and its public health system operate” (NACCHO, 2018).
Ten Essential Services (ES): Public health activities that all communities should undertake, as
described by the Centers for Disease Control and Prevention.
Sumter County MAPP Steering Committee (SCMSC)
Mobilizing for Action through Planning and Partnership (MAPP)
Medical Reserve Corps (MRC)
National Association of County and City Health Officials (NACCHO)
DOH-Sumter Program Management Council (PMC): The Florida Department of Health in Sumter
County’s internal planning and leadership group.
Local Public Health Systems Assessment (LPHSA): One of the four MAPP core assessments.
Focuses on evaluating the organizations and entities, that contribute to the public health system, on
their ability to provide the 10 Essential Public Health Services.

Executive Summary
1
Executive Summary Process and Timeline:
In 2017 and 2018 the Florida Department of Health in Sumter County (DOH-Sumter) led the
process to produce a Sumter County Community Health Assessment (CHA). The CHA
included the involvement of several diverse organizations and individuals representing
public and private organizations, community groups, healthcare providers, patients, and
others. As a result of that collaboration, there emerged a collective vision for Sumter
County:
The Sumter County CHA process began in March of 2017 when DOH-Sumter and Sumter
County Medical Reserve Corp (MRC) came together to plan the first stages of the primary
data collection phase. This data collection phase included public safety assessments,
pedestrian safety assessments, a chronic disease community resource assessment, a
community-based photography project, and multiple community focus groups. Throughout
the process many community partners contributed to the success of the data collection
efforts. (see Appendix A for a full list of community partners).
Findings:
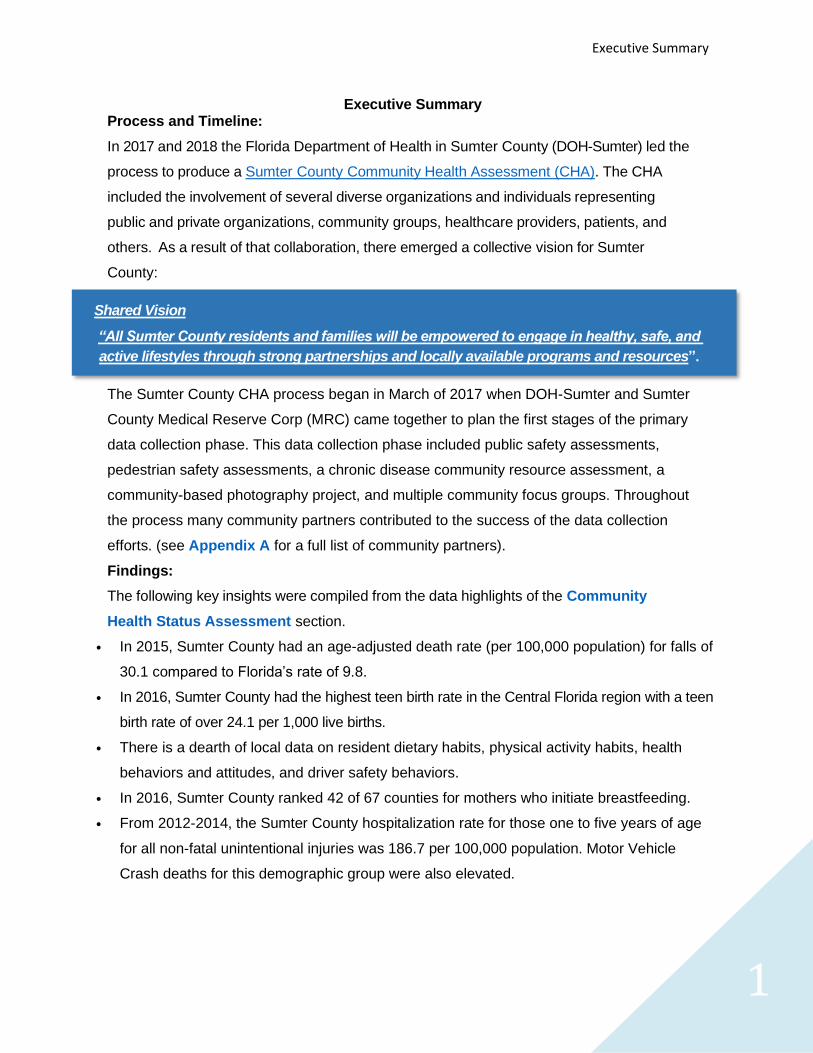
The following key insights were compiled from the data highlights of the Community
Health Status Assessment section.
• In 2015, Sumter County had an age-adjusted death rate (per 100,000 population) for falls of
30.1 compared to Florida’s rate of 9.8.
• In 2016, Sumter County had the highest teen birth rate in the Central Florida region with a teen
birth rate of over 24.1 per 1,000 live births.
• There is a dearth of local data on resident dietary habits, physical activity habits, health
behaviors and attitudes, and driver safety behaviors.
• In 2016, Sumter County ranked 42 of 67 counties for mothers who initiate breastfeeding.
• From 2012-2014, the Sumter County hospitalization rate for those one to five years of age
for all non-fatal unintentional injuries was 186.7 per 100,000 population. Motor Vehicle
Crash deaths for this demographic group were also elevated.
Shared Vision
“All Sumter County residents and families will be empowered to engage in healthy, safe, and
active lifestyles through strong partnerships and locally available programs and resources”.
2
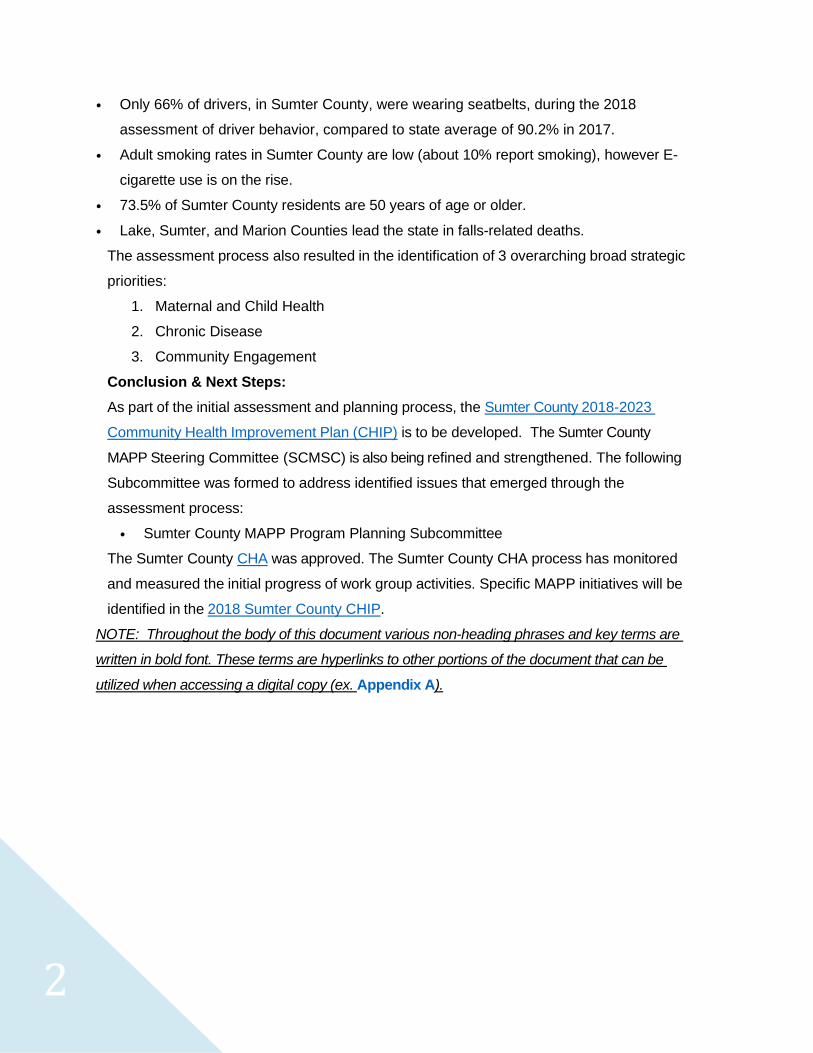
• Only 66% of drivers, in Sumter County, were wearing seatbelts, during the 2018
assessment of driver behavior, compared to state average of 90.2% in 2017.
• Adult smoking rates in Sumter County are low (about 10% report smoking), however E-
cigarette use is on the rise.
• 73.5% of Sumter County residents are 50 years of age or older.
• Lake, Sumter, and Marion Counties lead the state in falls-related deaths.
The assessment process also resulted in the identification of 3 overarching broad strategic
priorities:
1. Maternal and Child Health
2. Chronic Disease
3. Community Engagement
Conclusion & Next Steps:
As part of the initial assessment and planning process, the Sumter County 2018-2023
Community Health Improvement Plan (CHIP) is to be developed. The Sumter County
MAPP Steering Committee (SCMSC) is also being refined and strengthened. The following
Subcommittee was formed to address identified issues that emerged through the
assessment process:
• Sumter County MAPP Program Planning Subcommittee
The Sumter County CHA was approved. The Sumter County CHA process has monitored
and measured the initial progress of work group activities. Specific MAPP initiatives will be
identified in the 2018 Sumter County CHIP.
NOTE: Throughout the body of this document various non-heading phrases and key terms are
written in bold font. These terms are hyperlinks to other portions of the document that can be
utilized when accessing a digital copy (ex. Appendix A).
Introduction
3
Introduction
CHA Report Purpose: Community Health Assessment (CHA) “is the ongoing process of regular and systematic
collection, assembly, analysis, and distribution of information on the health needs of the
community. This information includes statistics
on health status, community health
needs/gaps/problems, and assets. The sharing
of findings with key stakeholders enables and
mobilizes community members to work
collaboratively towards building a healthier
community (McDavid & Hawthorn, 2013).”
This report was written in an effort to compile
various indicators including demographic,
socioeconomic, and health behaviors that do or could potentially impact health outcomes in
Sumter County. By implementing policies and programs targeting these health factors, we
can improve the health of the community. This, however, requires broad community
collaboration not only of healthcare providers and public health officials, but many others in
the community.
This assessment is the product of an ongoing comprehensive strategic approach to
community health improvement. The Mobilizing for Action through Planning and
Partnerships (MAPP) model has been the tool utilized throughout this process. This
strategic planning tool is a community-wide strategy for improving community health
developed by the National Association of County and City Health Officials (NACCHO) and
the Centers for Disease Control and Prevention (CDC).
Did you know: That, in a recent assessment of
driver behavior, only 66% of drivers in Sumter County were
wearing seat-belts. (Florida rate: 90.7%)
(For more information see the section on Community Themes and Strengths Assessment: Windshield Survey)
4
This report aims to:
• Accurately represent Sumter County’s key health issues.
• Identify strategic health planning issues.
• Identify potential approaches to addressing the key health planning issues.
• Provide insight and input to the next phase of the MAPP assessment/improvement
process (i.e., development of the Sumter County 2018-2023 Community Health
Improvement Plan [CHIP]).
• Provide the community with a rich data resource, not only for the next phase of CHIP
creation, but also for ongoing program development and implementation as well as
evaluation of community health improvements.
How to use this report:
The 2018 Sumter County CHA is designed to function as a community health needs
assessment. The intent is that this report serves as a resource to assist health policy planners,
community organizers, the not for profit community, and local elected officials in the effort to
ensure that Sumter County is a healthy place to live, play, learn, and grow.
MAPP Community Health Assessment Process
5
MAPP Community Health Assessment Process
To guide the Sumter County Community Health Assessment (CHA), the Mobilizing for Action
through Planning and Partnership (MAPP) model was adopted as the community-wide strategic
health planning framework. MAPP is a nationally recognized planning tool to help communities
prioritize health issues, and to identify resources to address them with the help of public health
leadership.
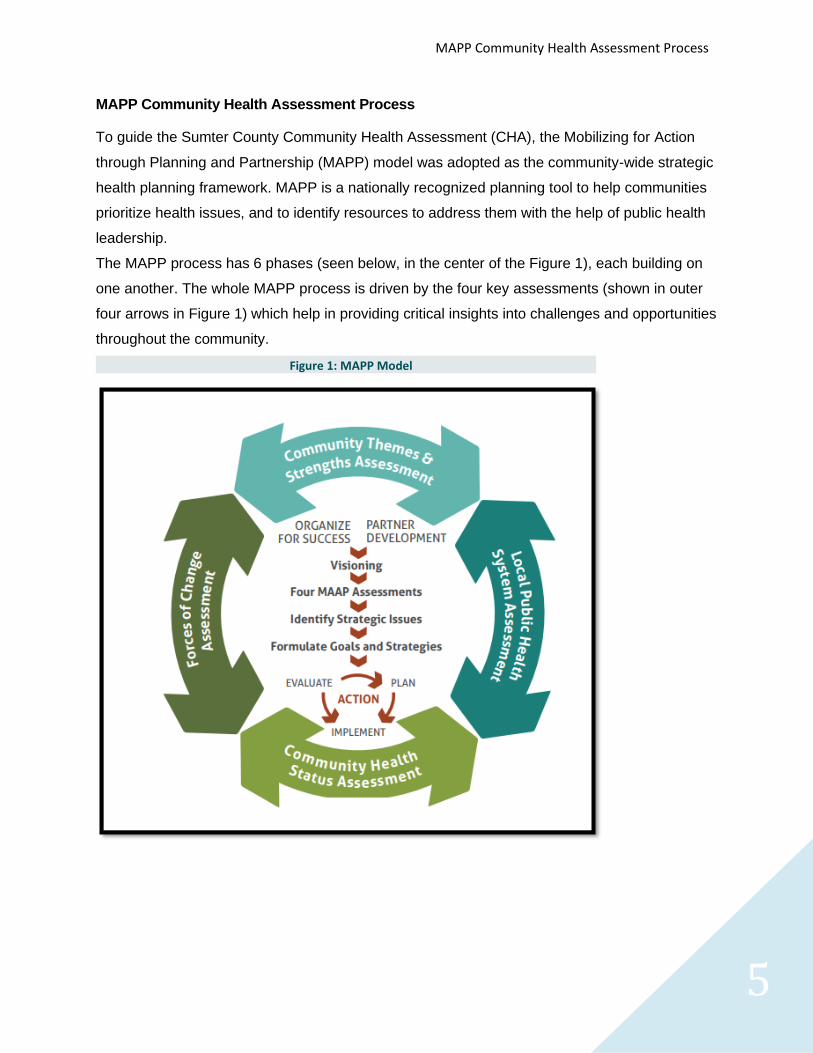
The MAPP process has 6 phases (seen below, in the center of the Figure 1), each building on
one another. The whole MAPP process is driven by the four key assessments (shown in outer
four arrows in Figure 1) which help in providing critical insights into challenges and opportunities
throughout the community.
Figure 1: MAPP Model
6
Phase 1: Organizing and Engaging Partners
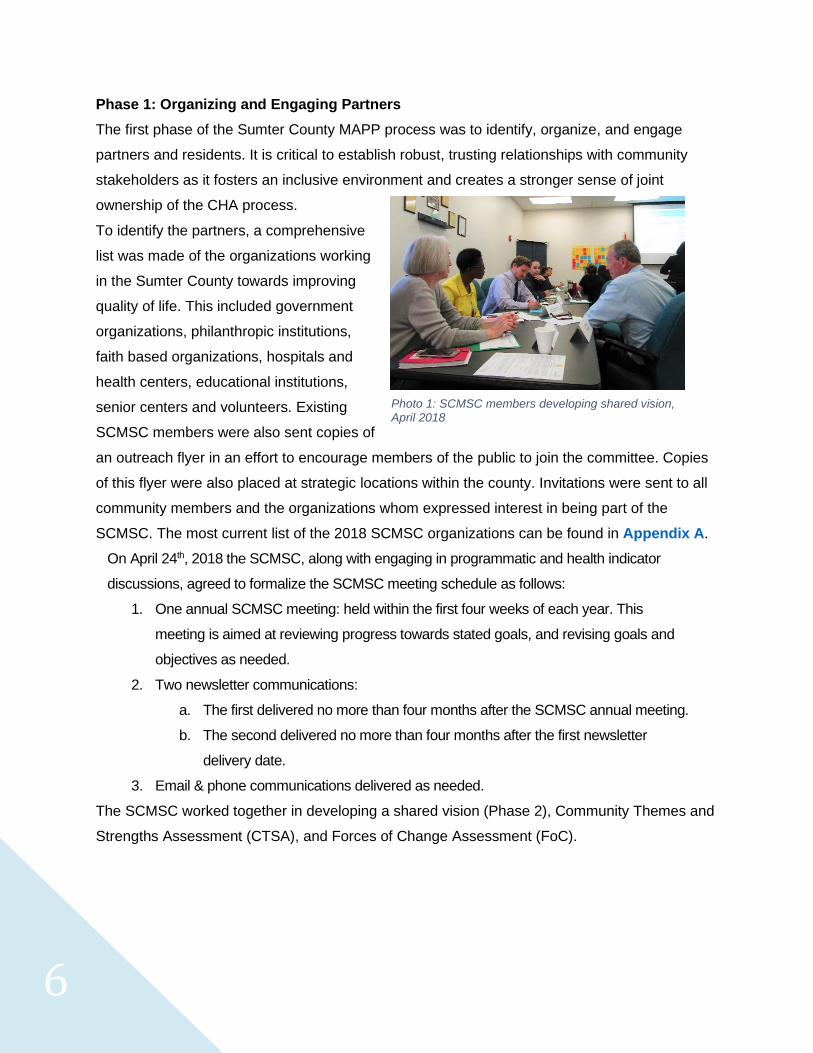
The first phase of the Sumter County MAPP process was to identify, organize, and engage
partners and residents. It is critical to establish robust, trusting relationships with community
stakeholders as it fosters an inclusive environment and creates a stronger sense of joint
ownership of the CHA process.
To identify the partners, a comprehensive
list was made of the organizations working
in the Sumter County towards improving
quality of life. This included government
organizations, philanthropic institutions,
faith based organizations, hospitals and
health centers, educational institutions,
senior centers and volunteers. Existing
SCMSC members were also sent copies of
an outreach flyer in an effort to encourage members of the public to join the committee. Copies
of this flyer were also placed at strategic locations within the county. Invitations were sent to all
community members and the organizations whom expressed interest in being part of the
SCMSC. The most current list of the 2018 SCMSC organizations can be found in Appendix A.
On April 24th, 2018 the SCMSC, along with engaging in programmatic and health indicator
discussions, agreed to formalize the SCMSC meeting schedule as follows:
1. One annual SCMSC meeting: held within the first four weeks of each year. This
meeting is aimed at reviewing progress towards stated goals, and revising goals and
objectives as needed.
2. Two newsletter communications:
a. The first delivered no more than four months after the SCMSC annual meeting.
b. The second delivered no more than four months after the first newsletter
delivery date.
3. Email & phone communications delivered as needed.
The SCMSC worked together in developing a shared vision (Phase 2), Community Themes and
Strengths Assessment (CTSA), and Forces of Change Assessment (FoC).
Photo 1: SCMSC members developing shared vision, April 2018
MAPP Community Health Assessment Process
7
Phase 2: Create a Vision
The second phase was to create a shared community vision and common values through a
collaborative and creative process. Shared vision and values provide focus, purpose and
direction to the CHA, and help in guiding future
efforts. A vision helps set the stage for planning,
and provides a common framework throughout
subsequent phases.
The SCMSC worked together to develop shared
vision and values (Appendix B). The committee
members were asked the questions ‘What does
a heathy community mean to you?’ in an effort
to draw out ideas for a vision statement. They
were also asked ‘What needs to be in place for
us to work effectively to achieve our vision?’ to
generate discussion around organizational values. The information collected from the members
was crafted into a Wordle to assist in the creation of the shared vision statement (Appendix B).
The final vision statement can be found in the box to the right.
Phase 3: Data Collection and Assessments
The third and very critical phase of the Sumter County MAPP process was data collection and
assessments. At the heart of the MAPP process are the following core MAPP assessments:
(a) Community Health Status Assessment (CHSA),
(b) Community Themes and Strengths Assessment (CTSA),
(c) Forces of Change Assessment (FoC), and
(d) Local Public Health Systems Assessment (LPHSA).
Each assessment provides information for determining local health priorities and for improving
the health of the community. These assessments are discussed in detail below:
a. Community Health Status Assessment (CHSA)
CHSA was done using multiple sources such as Florida Charts, Robert Wood Johnson County
Health Rankings, Behavioral Risk Factor Surveillance System (BRFSS), Centers for Disease
Control and Prevention, Florida Youth Substance Abuse Survey (FYSAS), Florida
Shared Vision
“All Sumter County residents
and families will be
empowered to engage in
healthy, safe, and active
lifestyles through strong
partnerships and locally
available programs and
resources”.
8
Environmental Health Tracker, Census reports, Fatality Analysis Reporting System (FARS), and
tobacco store surveys. More information on the sources used in this report can be found in the
References section.
The secondary data was collected on mortality and morbidity indicators, health factors and
health behaviors that describe the overall health status of Sumter County. For indicators without
locally accepted benchmarks, the rate or count seen in Florida overall is held the bench mark or
baseline for comparison.
b. Community Themes and Strengths Assessment (CTSA) and Community Health
Assessment and Group Evaluation (CHANGE)
While the previous section, the Community Health
Status Assessment, is largely based on in-depth
quantitative analysis of existing community and
health system administrative data sets, this section
provides a qualitative perspective on health issues
and the health system from the community at-large.
It also fulfills a key MAPP requirement by providing
community members the opportunity to provide
feedback on the health of Sumter County and its
residents. For this assessment, primary data
collection was conducted through multiple techniques which are listed below:
CHANGE Surveys: DOH-Sumter staff conducted surveys using the CDC CHANGE
(Community Health Assessment and Group Evaluation) survey tool. These surveys collected
data on current policies and practices related to health and chronic disease prevention. Survey
questions assessed policies and practices in areas of nutrition, physical activity, tobacco,
chronic disease management, and leadership. Sixteen organizations throughout Sumter County
were interviewed representing various sectors including health care, work sites, schools,
community organizations, and the community at large. For the results of this assessment see
Community Themes and Strengths Assessment.
Bus Stop Surveys: School bus stops are places where children (with or without supervision)
wait for the school bus to arrive to be transported to the school. DOH-Sumter conducted school
bus stop surveys to understand how safe these bus stops are in terms of nearest crosswalk
quality, sidewalk quality, general walkability, and overall safety. The Sumter County School
Did you know: That the rate of children,
between the ages of 5 and 11, who experience child abuse in
Sumter County is 1.5 times higher than the rate seen in
Florida as a whole? (For more information see the section on
Violence)
MAPP Community Health Assessment Process
9
Board provided DOH-Sumter with a list of all past and present school bus stops (n=3,977). 115
bus stops were randomly selected to survey. This created a meaningful and representative
sample of bus stops (Minimum sample size=94, Confidence Level=95%, Confidence
Interval=10). Working in teams of 1-3 people, the CHA team conducted 95 bus stop surveys
throughout Sumter County to assess their expected routes on various safety measures. The
survey tool used was adapted from the AARP
Sidewalks and Streets Survey (Appendix C).
For the results of this assessment see Bus
Stop Surveys.
Golf Cart Surveys: The objective of golf cart
surveys was to understand the safety of
shared-use, multimodal paths within Sumter
County. Working in teams of two, MRC
volunteers assessed 20 multimodal paths in
The Villages. These areas were zones of high golf cart traffic. Multimodal paths are designed for
use by golf carts, pedestrians, cyclists, etc. The Villages community was divided into 4 zones,
with 5 surveys completed in each zone. The teams of two consisted of one golf cart driver and
one scribe tasked with completing the survey tool. Surveyors used a tool adapted from the
AARP Sidewalks and Streets Survey (Appendix D). Multimodal paths were assessed for
various safety features and driver behavior was observed. For the results of this assessment
see Golf Cart Surveys.
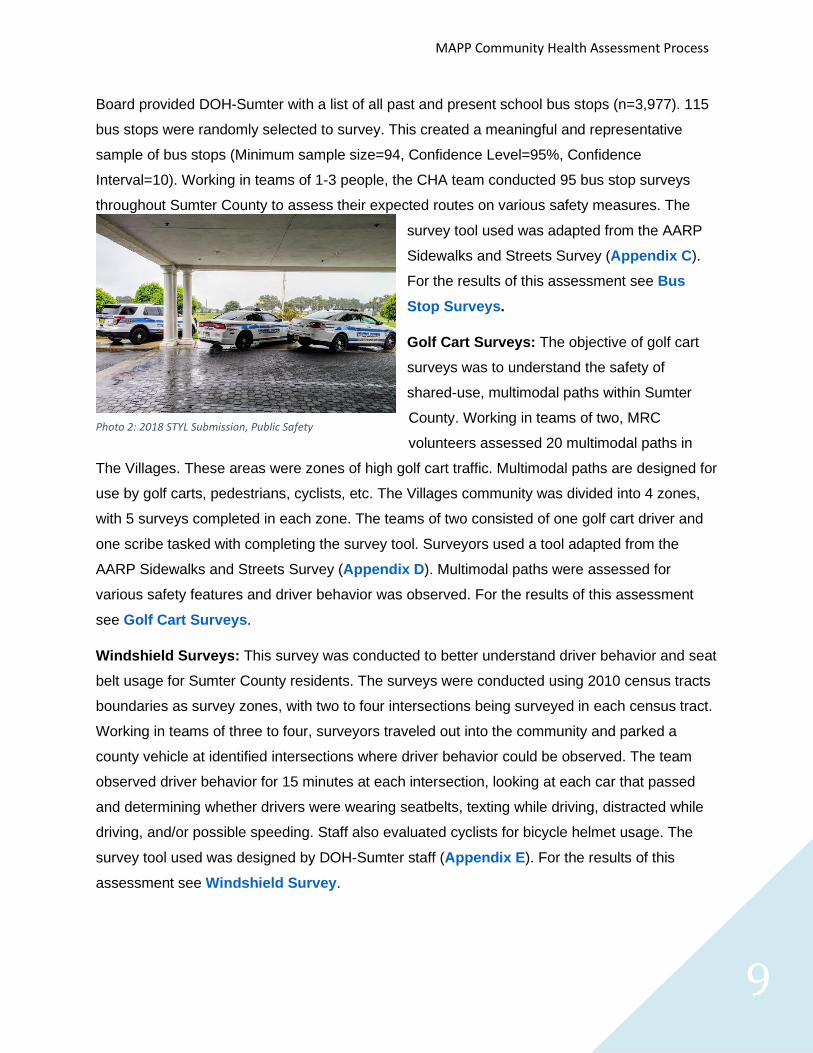
Windshield Surveys: This survey was conducted to better understand driver behavior and seat
belt usage for Sumter County residents. The surveys were conducted using 2010 census tracts
boundaries as survey zones, with two to four intersections being surveyed in each census tract.
Working in teams of three to four, surveyors traveled out into the community and parked a
county vehicle at identified intersections where driver behavior could be observed. The team
observed driver behavior for 15 minutes at each intersection, looking at each car that passed
and determining whether drivers were wearing seatbelts, texting while driving, distracted while
driving, and/or possible speeding. Staff also evaluated cyclists for bicycle helmet usage. The
survey tool used was designed by DOH-Sumter staff (Appendix E). For the results of this
assessment see Windshield Survey.
Photo 2: 2018 STYL Submission, Public Safety
10
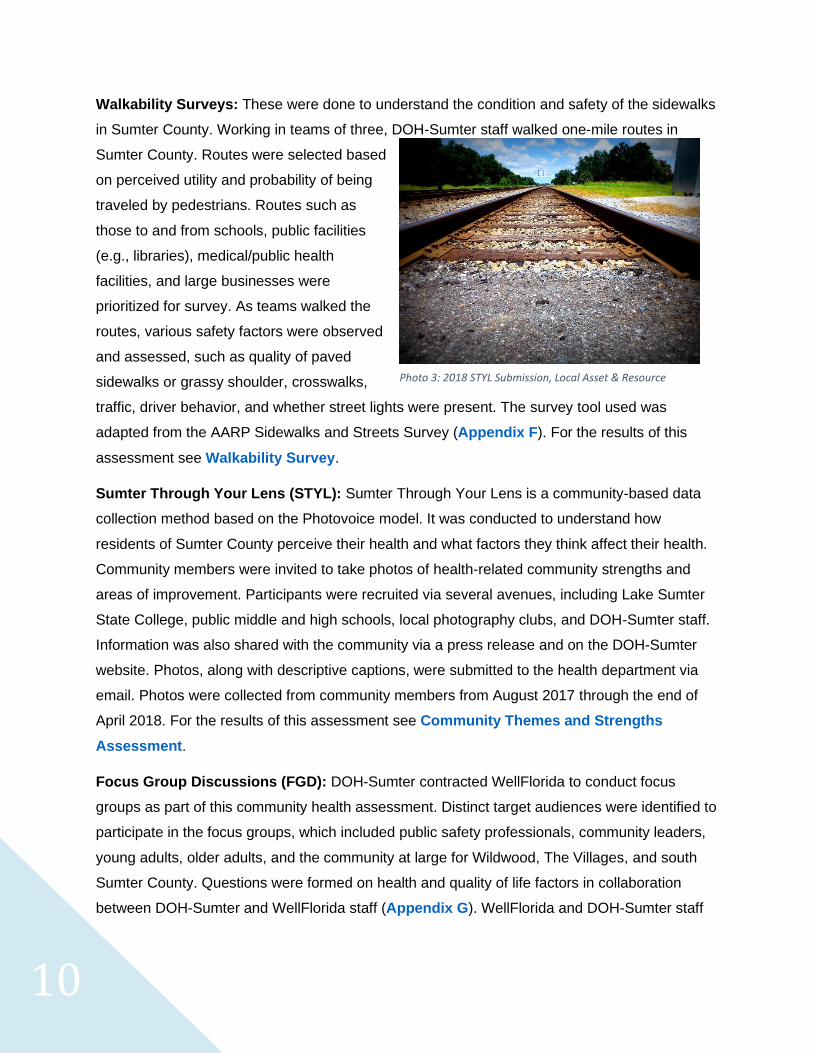
Walkability Surveys: These were done to understand the condition and safety of the sidewalks
in Sumter County. Working in teams of three, DOH-Sumter staff walked one-mile routes in
Sumter County. Routes were selected based
on perceived utility and probability of being
traveled by pedestrians. Routes such as
those to and from schools, public facilities
(e.g., libraries), medical/public health
facilities, and large businesses were
prioritized for survey. As teams walked the
routes, various safety factors were observed
and assessed, such as quality of paved
sidewalks or grassy shoulder, crosswalks,
traffic, driver behavior, and whether street lights were present. The survey tool used was
adapted from the AARP Sidewalks and Streets Survey (Appendix F). For the results of this
assessment see Walkability Survey.
Sumter Through Your Lens (STYL): Sumter Through Your Lens is a community-based data
collection method based on the Photovoice model. It was conducted to understand how
residents of Sumter County perceive their health and what factors they think affect their health.
Community members were invited to take photos of health-related community strengths and
areas of improvement. Participants were recruited via several avenues, including Lake Sumter
State College, public middle and high schools, local photography clubs, and DOH-Sumter staff.
Information was also shared with the community via a press release and on the DOH-Sumter
website. Photos, along with descriptive captions, were submitted to the health department via
email. Photos were collected from community members from August 2017 through the end of
April 2018. For the results of this assessment see Community Themes and Strengths
Assessment.
Focus Group Discussions (FGD): DOH-Sumter contracted WellFlorida to conduct focus
groups as part of this community health assessment. Distinct target audiences were identified to
participate in the focus groups, which included public safety professionals, community leaders,
young adults, older adults, and the community at large for Wildwood, The Villages, and south
Sumter County. Questions were formed on health and quality of life factors in collaboration
between DOH-Sumter and WellFlorida staff (Appendix G). WellFlorida and DOH-Sumter staff
Photo 3: 2018 STYL Submission, Local Asset & Resource
MAPP Community Health Assessment Process
11
collaborated in recruitment of participants. Participants were offered a $20 stipend for their time
and participation in the focus groups.
Six focus groups were conducted. Each focus group was 90 minutes long and had anywhere
from two to fourteen participants. Seven focus groups were scheduled, but one of the focus
groups failed to recruit any participants. In total, 49 participants shared their views and opinions
in focus groups. For the results of this assessment see Focus Group Discussion.
c. Local Public Health System Assessment (LPHSA)
The Sumter County Performance Management Council (PMC) along with several identified
members of the community were assembled to participate in the Local Public Health Systems
Assessment. This poll-style group activity called on participants to identify the components,
activities, competencies and capacities of Sumter County’s local public health system. The
assessment also measured how well the Essential Services (identified by The National Public
Health Performance Standards program and partners) are being provided by the Sumter County
public health system (Appendix J). For the results of this assessment see Local Public Health
System Assessment.
d. Forces of Change (FoC)
Sumter County Steering Committee members identified and assembled a diverse gathering
of community leaders to participate in a strategic Forces of Change meeting. During this
meeting, members participated in a group brainstorming activity aimed at identifying events,
trends, and factors in the Sumter County community that have been, or will, be influencing the
health and quality of life of the community. The groups later came together to discuss the
identified forces and identify the opportunities and threats associated with each. A sub-
committee was created and met to further discuss the previously identified forces, as well as
to identify already existing programs, gaps, and barriers associated with each factor. A poll
was conducted to rate forces on impact and feasibility. For the results of this assessment see
Forces of Change Assessment.
Phase 4 and Phase 5: Identification of Strategic Issues and Formulation of Goals and
Strategies
Once primary data was collected from multiple techniques, it was entered in Microsoft Excel and
Epi Info and analyzed to obtain results. This phase is described in detail in the results and
discussion section which is divided into broad sections and themes. It utilizes the information
12
collected from different assessments to identify key themes and issues relevant to Sumter
County.
Phase 6: Action cycle
This is described in the section Next Steps. This section details some general suggestions, or
promising practices, about how to move forward with the identified needs. Appendix N provides
some specific examples of approaches to address these needs and discusses some community
organization principles that will need to be addressed to ensure that true community health
improvement is realized. Digital copies of the CHA and CHIP reports are made available on the
DOH-Sumter website and are also distributed to all SCMSC members. Hardcopies of this report
are available to the public, upon request, at any DOH-Sumter clinic site.
Community Health Status Assessment
13
Community Health Status Assessment The section of Sumter County CHA Report provides a
summary of the data reviewed during the 2017-2018
Sumter County CHA. A wide range of data sources were
reviewed and complied to generate the data found below. A
full list of data sources can be found in the References
section of this report.
Through this data review a number of key findings and
health disparities were identified. These are detailed in the
Conclusion section of this report. For indicators without
locally accepted benchmarks, the rate or count seen in
Florida overall is held the bench mark or baseline for comparison.
The Community Health Status Assessment data report is broken down into several components:
• Demographics o Population
• Social Determinates of Health o Socioeconomics o Educational Attainment o County Health Rankings o United Way ALICE Report o Public Safety o Focus Group Findings
• Health Behaviors
o Healthcare Access • Health Outcomes o Life Expectancy o Mortality o Health Care Utilization o Maternal and Child Health o Violence
• Key Findings
Did you know: That the rate of teen pregnancy
in Sumter County is nearly double that is seen in Florida?
(For more information see the section on Teen Pregnancy)
14
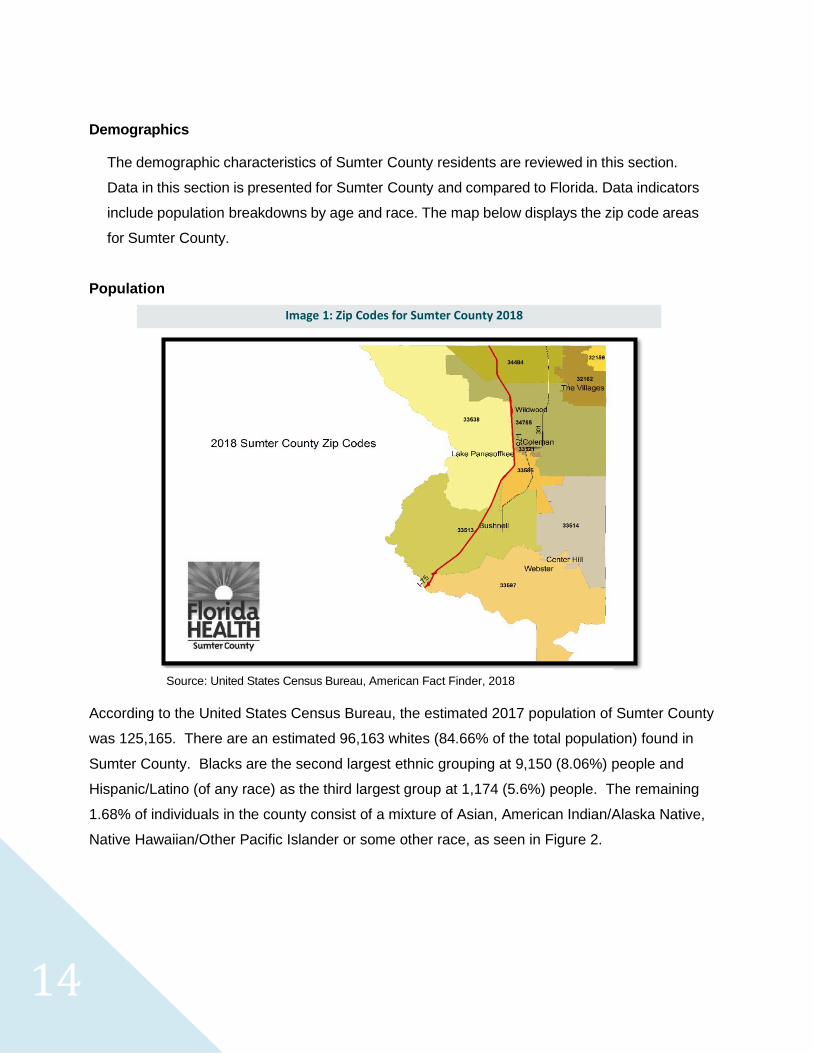
Demographics
The demographic characteristics of Sumter County residents are reviewed in this section.
Data in this section is presented for Sumter County and compared to Florida. Data indicators
include population breakdowns by age and race. The map below displays the zip code areas
for Sumter County.
Population
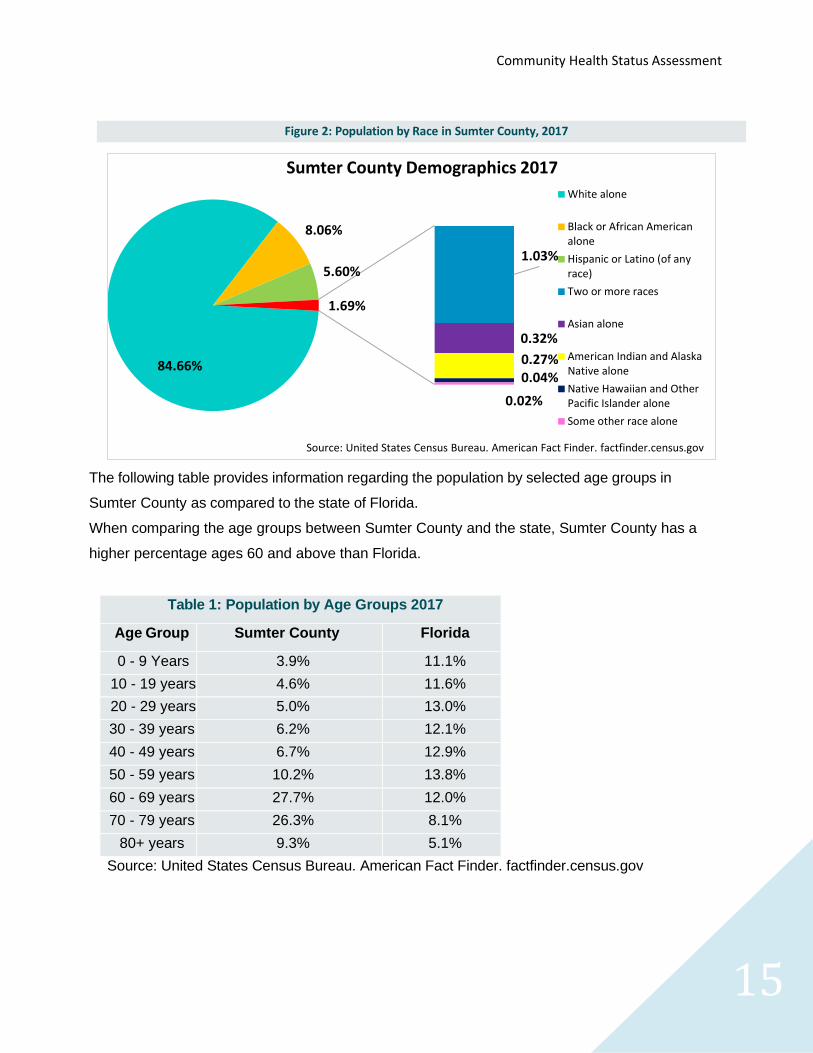
According to the United States Census Bureau, the estimated 2017 population of Sumter County
was 125,165. There are an estimated 96,163 whites (84.66% of the total population) found in
Sumter County. Blacks are the second largest ethnic grouping at 9,150 (8.06%) people and
Hispanic/Latino (of any race) as the third largest group at 1,174 (5.6%) people. The remaining
1.68% of individuals in the county consist of a mixture of Asian, American Indian/Alaska Native,
Native Hawaiian/Other Pacific Islander or some other race, as seen in Figure 2.
Image 1: Zip Codes for Sumter County 2018
Source: United States Census Bureau, American Fact Finder, 2018
Community Health Status Assessment
15
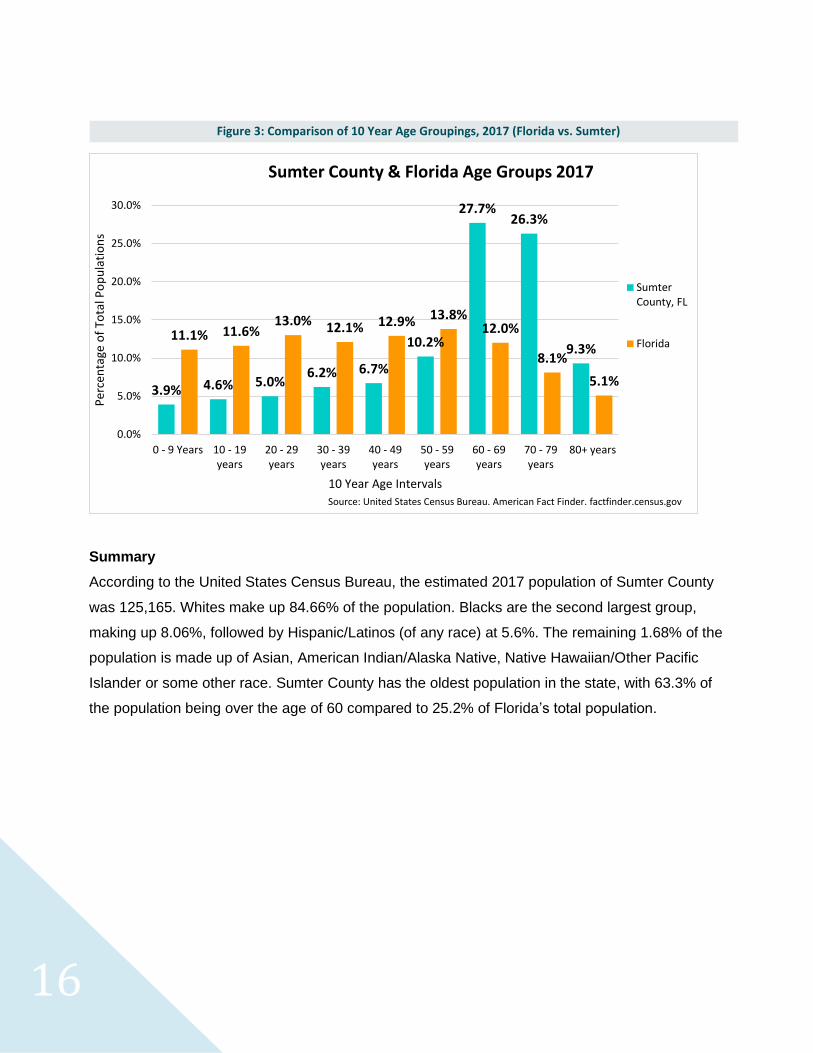
The following table provides information regarding the population by selected age groups in
Sumter County as compared to the state of Florida.
When comparing the age groups between Sumter County and the state, Sumter County has a
higher percentage ages 60 and above than Florida.
Table 1: Population by Age Groups 2017
Age Group Sumter County
Population
Florida
Population 0 - 9 Years 3.9% 11.1%
10 - 19 years 4.6% 11.6%
20 - 29 years 5.0% 13.0%
30 - 39 years 6.2% 12.1%
40 - 49 years 6.7% 12.9%
50 - 59 years 10.2% 13.8%
60 - 69 years 27.7% 12.0%
70 - 79 years 26.3% 8.1%
80+ years 9.3% 5.1%
Source: United States Census Bureau. American Fact Finder. factfinder.census.gov
84.66%
8.06%
5.60%1.03%
0.32%
0.27%0.04%
0.02%
1.69%
Sumter County Demographics 2017
White alone
Black or African Americanalone
Hispanic or Latino (of anyrace)
Two or more races
Asian alone
American Indian and AlaskaNative alone
Native Hawaiian and OtherPacific Islander alone
Some other race alone
Source: United States Census Bureau. American Fact Finder. factfinder.census.gov
Figure 2: Population by Race in Sumter County, 2017
16
Summary
According to the United States Census Bureau, the estimated 2017 population of Sumter County
was 125,165. Whites make up 84.66% of the population. Blacks are the second largest group,
making up 8.06%, followed by Hispanic/Latinos (of any race) at 5.6%. The remaining 1.68% of the
population is made up of Asian, American Indian/Alaska Native, Native Hawaiian/Other Pacific
Islander or some other race. Sumter County has the oldest population in the state, with 63.3% of
the population being over the age of 60 compared to 25.2% of Florida’s total population.
3.9% 4.6% 5.0%6.2% 6.7%
10.2%
27.7%26.3%
9.3%11.1% 11.6%
13.0% 12.1% 12.9% 13.8%12.0%
8.1%
5.1%
0.0%
5.0%
10.0%
15.0%
20.0%
25.0%
30.0%
0 - 9 Years 10 - 19years
20 - 29years
30 - 39years
40 - 49years
50 - 59years
60 - 69years
70 - 79years
80+ years
Per
cen
tage
of
Tota
l Po
pu
lati
on
s
10 Year Age Intervals
Sumter County & Florida Age Groups 2017
SumterCounty, FL
Florida
Source: United States Census Bureau. American Fact Finder. factfinder.census.gov
Figure 3: Comparison of 10 Year Age Groupings, 2017 (Florida vs. Sumter)
Community Health Status Assessment
17
Social Determinates of Health
According to the World Health Organization the social determinants of health (SDH) are considered
to be the “conditions in which people are born, grow, live, work and age.” SDH varies and effect
community and individual health in a multitude of ways.
Socioeconomic
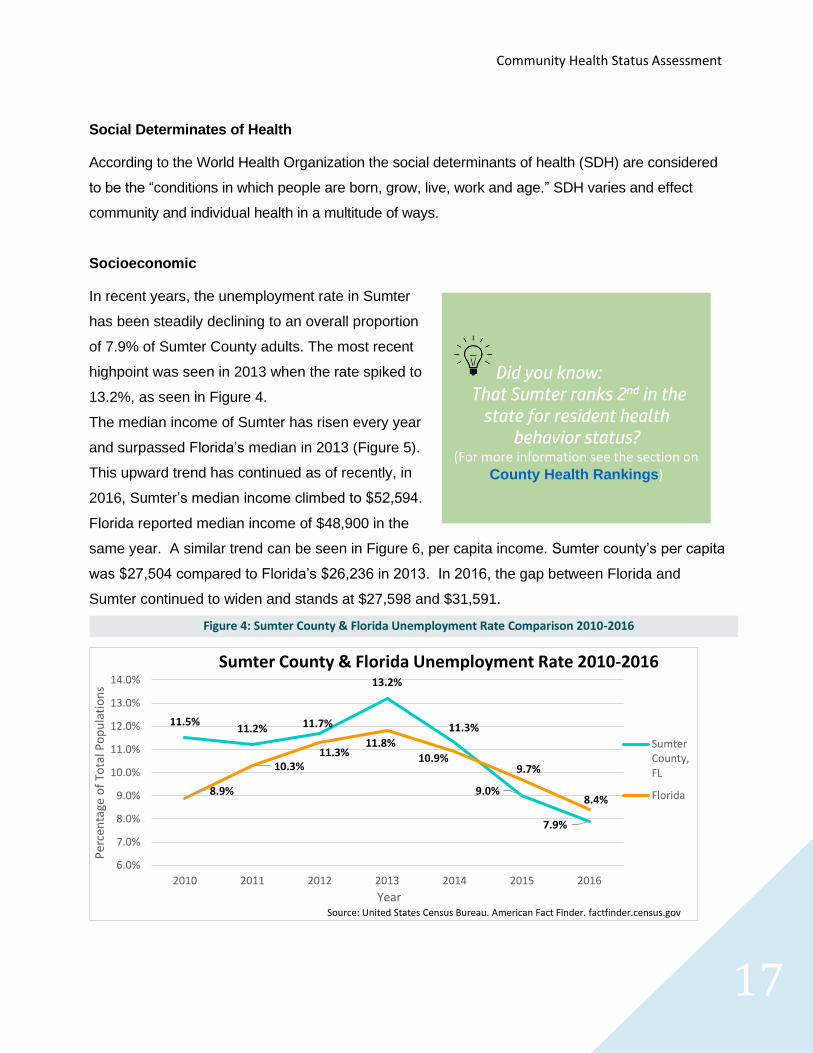
In recent years, the unemployment rate in Sumter
has been steadily declining to an overall proportion
of 7.9% of Sumter County adults. The most recent
highpoint was seen in 2013 when the rate spiked to
13.2%, as seen in Figure 4.
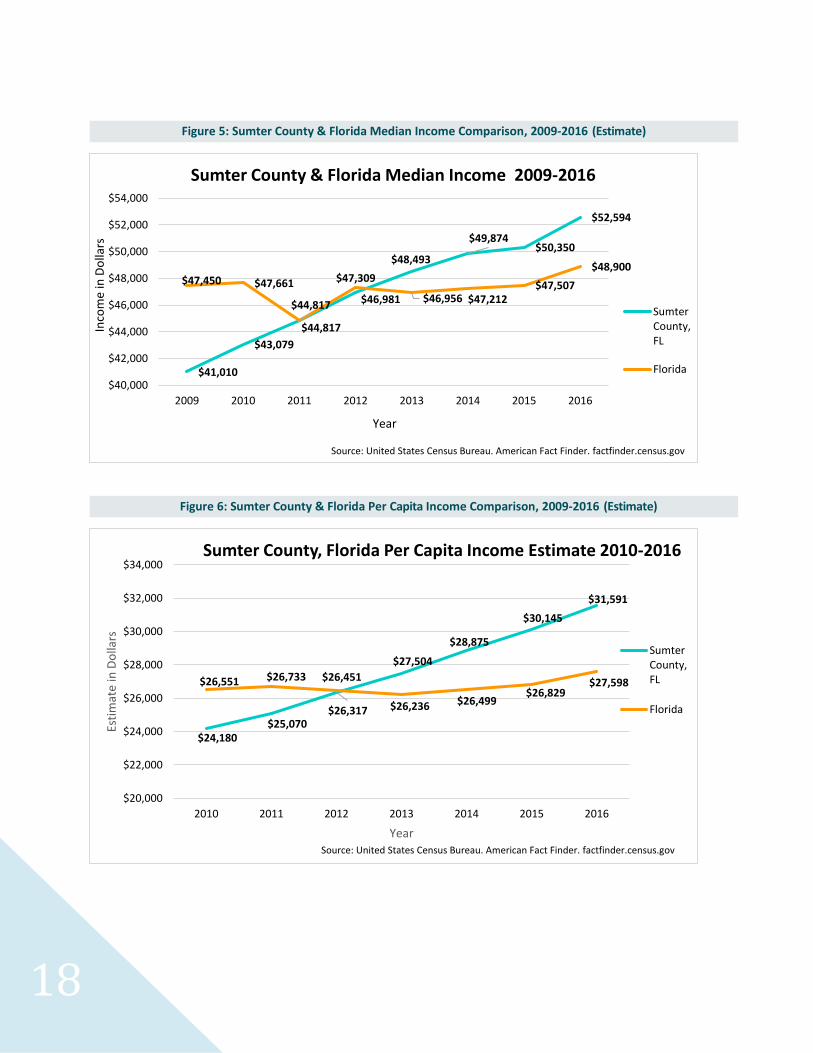
The median income of Sumter has risen every year
and surpassed Florida’s median in 2013 (Figure 5).
This upward trend has continued as of recently, in
2016, Sumter’s median income climbed to $52,594.
Florida reported median income of $48,900 in the
same year. A similar trend can be seen in Figure 6, per capita income. Sumter county’s per capita
was $27,504 compared to Florida’s $26,236 in 2013. In 2016, the gap between Florida and
Sumter continued to widen and stands at $27,598 and $31,591.
11.5%11.2% 11.7%
13.2%
11.3%
9.0%
7.9%
8.9%
10.3%11.3%
11.8%
10.9%9.7%
8.4%
6.0%
7.0%
8.0%
9.0%
10.0%
11.0%
12.0%
13.0%
14.0%
2010 2011 2012 2013 2014 2015 2016
Per
cen
tage
of
Tota
l Po
pu
lati
on
s
Year
Sumter County & Florida Unemployment Rate 2010-2016
SumterCounty,FL
Florida
Source: United States Census Bureau. American Fact Finder. factfinder.census.gov
Figure 4: Sumter County & Florida Unemployment Rate Comparison 2010-2016
Did you know: That Sumter ranks 2nd in the
state for resident health behavior status?
(For more information see the section on County Health Rankings)
18
$41,010
$43,079
$44,817
$46,981
$48,493
$49,874$50,350
$52,594
$47,450 $47,661
$44,817
$47,309
$46,956 $47,212$47,507
$48,900
$40,000
$42,000
$44,000
$46,000
$48,000
$50,000
$52,000
$54,000
2009 2010 2011 2012 2013 2014 2015 2016
Inco
me
in D
olla
rs
Year
Sumter County & Florida Median Income 2009-2016
SumterCounty,FL
Florida
Source: United States Census Bureau. American Fact Finder. factfinder.census.gov
$24,180$25,070
$26,317
$27,504
$28,875
$30,145
$31,591
$26,551 $26,733 $26,451
$26,236 $26,499$26,829
$27,598
$20,000
$22,000
$24,000
$26,000
$28,000
$30,000
$32,000
$34,000
2010 2011 2012 2013 2014 2015 2016
Esti
mat
e in
Do
llars
Year
Sumter County, Florida Per Capita Income Estimate 2010-2016
SumterCounty,FL
Florida
Source: United States Census Bureau. American Fact Finder. factfinder.census.gov
Figure 5: Sumter County & Florida Median Income Comparison, 2009-2016 (Estimate)
Figure 6: Sumter County & Florida Per Capita Income Comparison, 2009-2016 (Estimate)
Community Health Status Assessment
19
Table 2: Sumter County’s Top Ten Employers
Employer Number of Employees
Coleman Federal Prison 1,204
CFHA - The Villages Regional Medical Center 1,128
Sumter District Schools 815
Publix 800
T&D Family of Companies 660
Winn-Dixie 573
Sumter Correctional Institute 500
The Village Community 400
Walmart Stores 390
Sumter Electric Cooperative 340
Source: Sumter County Office of Economic Development, 2018
Table 3: Select Environmental Health Indicators
Environmental Health Indicators Year Sumter County
Florida
Percent of the population living within a 1/2 mile of a fast food restaurant
2016 8.45% 33.86%
Percent of the population living within a ten-minute walk (1/2 mile) of a park
2016 6.89% 43.22%
Percent of the population living within a ten-minute walk (1/2 mile) of an off-street trail system
2016 4.47% 18.23%
Percent of children screened for lead poisoning 2012 17.05% 16.32%
Percent of housing units that are vacant 2013 21.47% 19.73%
Percent of housing units that lack complete plumbing facilities
2013 0.31% 0.25%
Age-adjusted rate of Dog Bite hospitalizations per 100,000 2016 6.82 6
Source: Florida Environmental Public Health Tracking, Floridatracking.com
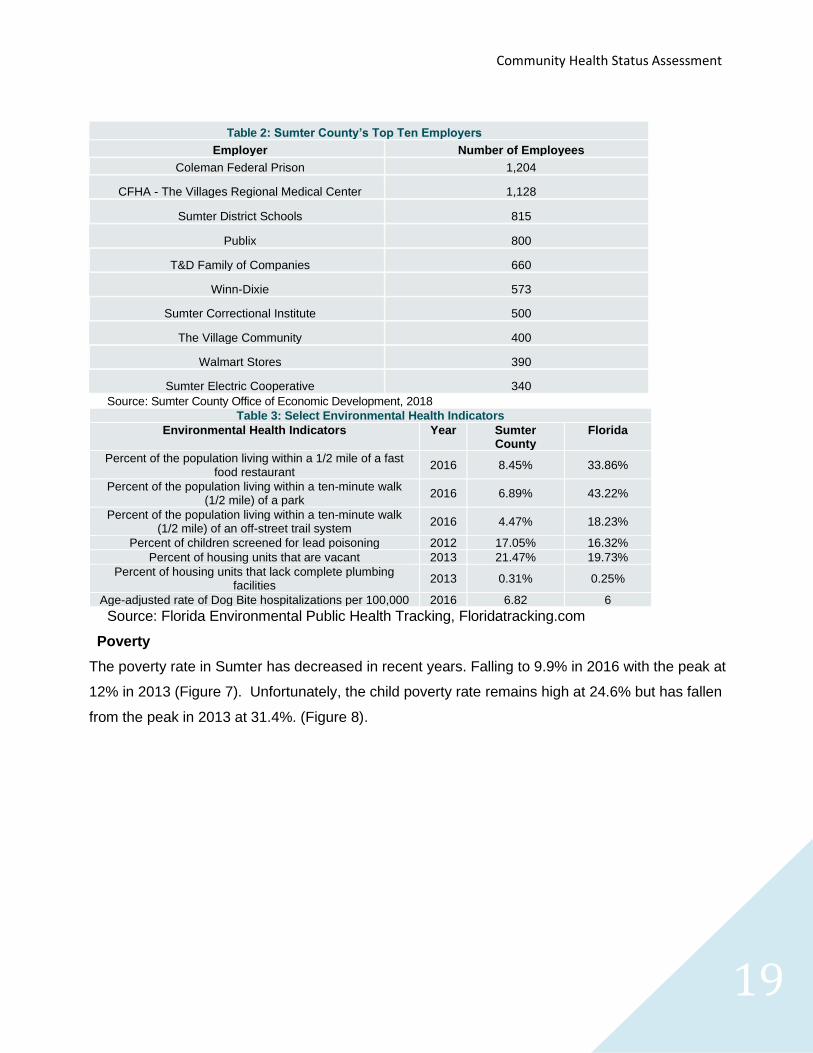
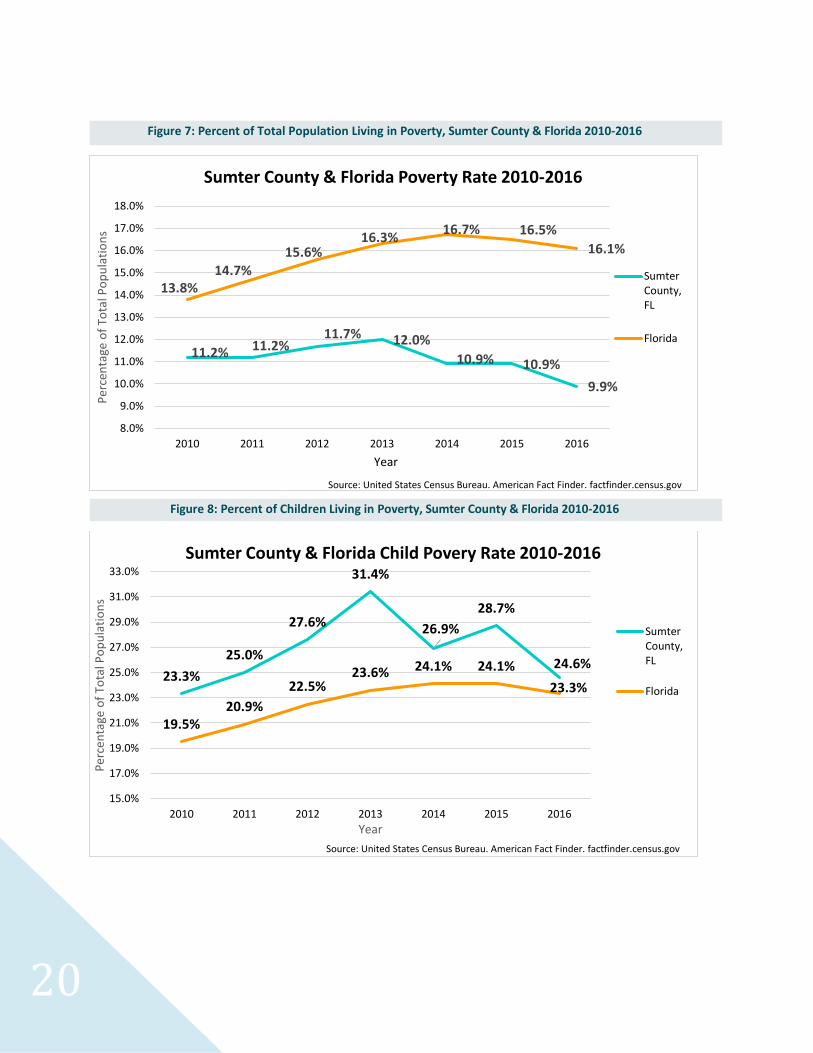
Poverty
The poverty rate in Sumter has decreased in recent years. Falling to 9.9% in 2016 with the peak at
12% in 2013 (Figure 7). Unfortunately, the child poverty rate remains high at 24.6% but has fallen
from the peak in 2013 at 31.4%. (Figure 8).
20
11.2% 11.2%11.7% 12.0%
10.9% 10.9%
9.9%
13.8%14.7%
15.6%16.3%
16.7% 16.5%
16.1%
8.0%
9.0%
10.0%
11.0%
12.0%
13.0%
14.0%
15.0%
16.0%
17.0%
18.0%
2010 2011 2012 2013 2014 2015 2016
Per
cen
tage
of
Tota
l Po
pu
lati
on
s
Year
Sumter County & Florida Poverty Rate 2010-2016
SumterCounty,FL
Florida
Source: United States Census Bureau. American Fact Finder. factfinder.census.gov
23.3%
25.0%
27.6%
31.4%
26.9%
28.7%
24.6%
19.5%20.9%
22.5%23.6% 24.1% 24.1%
23.3%
15.0%
17.0%
19.0%
21.0%
23.0%
25.0%
27.0%
29.0%
31.0%
33.0%
2010 2011 2012 2013 2014 2015 2016
Per
cen
tage
of
Tota
l Po
pu
lati
on
s
Year
Sumter County & Florida Child Povery Rate 2010-2016
SumterCounty,FL
Florida
Source: United States Census Bureau. American Fact Finder. factfinder.census.gov
Figure 7: Percent of Total Population Living in Poverty, Sumter County & Florida 2010-2016
Figure 8: Percent of Children Living in Poverty, Sumter County & Florida 2010-2016
Community Health Status Assessment
21
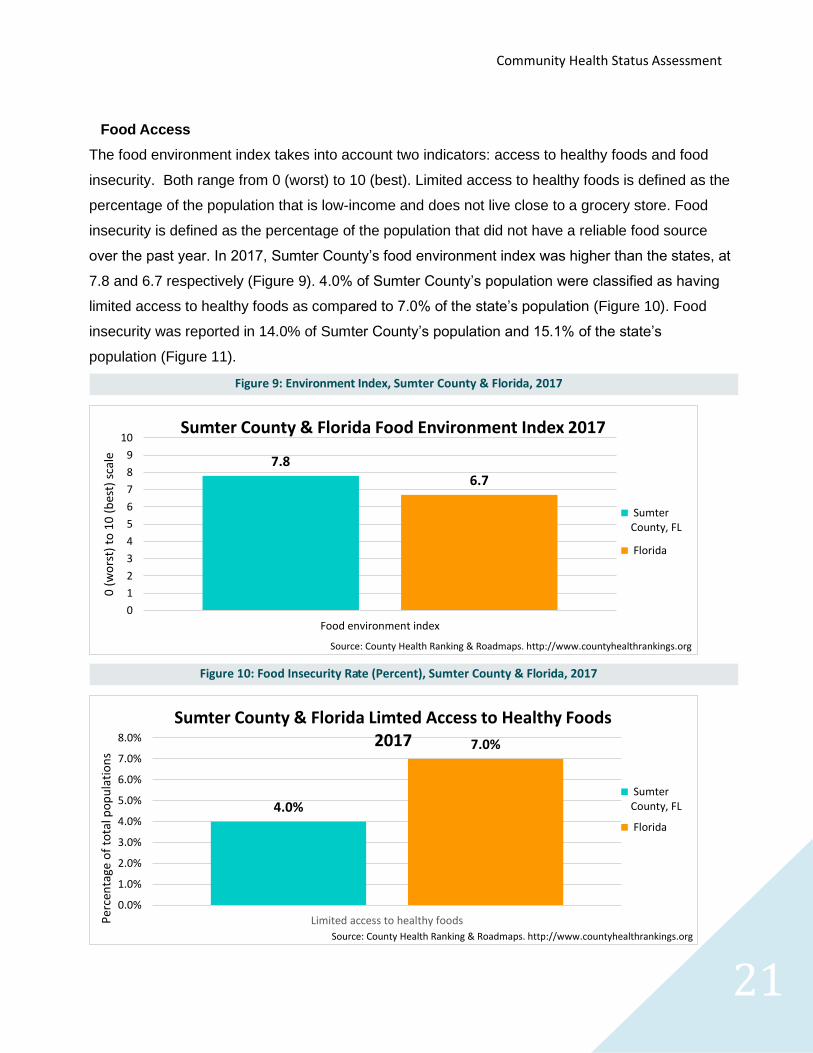
Food Access
The food environment index takes into account two indicators: access to healthy foods and food
insecurity. Both range from 0 (worst) to 10 (best). Limited access to healthy foods is defined as the
percentage of the population that is low-income and does not live close to a grocery store. Food
insecurity is defined as the percentage of the population that did not have a reliable food source
over the past year. In 2017, Sumter County’s food environment index was higher than the states, at
7.8 and 6.7 respectively (Figure 9). 4.0% of Sumter County’s population were classified as having
limited access to healthy foods as compared to 7.0% of the state’s population (Figure 10). Food
insecurity was reported in 14.0% of Sumter County’s population and 15.1% of the state’s
population (Figure 11).
7.8
6.7
0
1
2
3
4
5
6
7
8
9
10
Food environment index
0 (
wo
rst)
to
10
(b
est)
sca
le
Source: County Health Ranking & Roadmaps. http://www.countyhealthrankings.org
Sumter County & Florida Food Environment Index 2017
SumterCounty, FL
Florida
4.0%
7.0%
0.0%
1.0%
2.0%
3.0%
4.0%
5.0%
6.0%
7.0%
8.0%
Limited access to healthy foodsPer
cen
tage
of
tota
l po
pu
lati
on
s
Source: County Health Ranking & Roadmaps. http://www.countyhealthrankings.org
Sumter County & Florida Limted Access to Healthy Foods 2017
SumterCounty, FL
Florida
Figure 9: Environment Index, Sumter County & Florida, 2017
Figure 10: Food Insecurity Rate (Percent), Sumter County & Florida, 2017
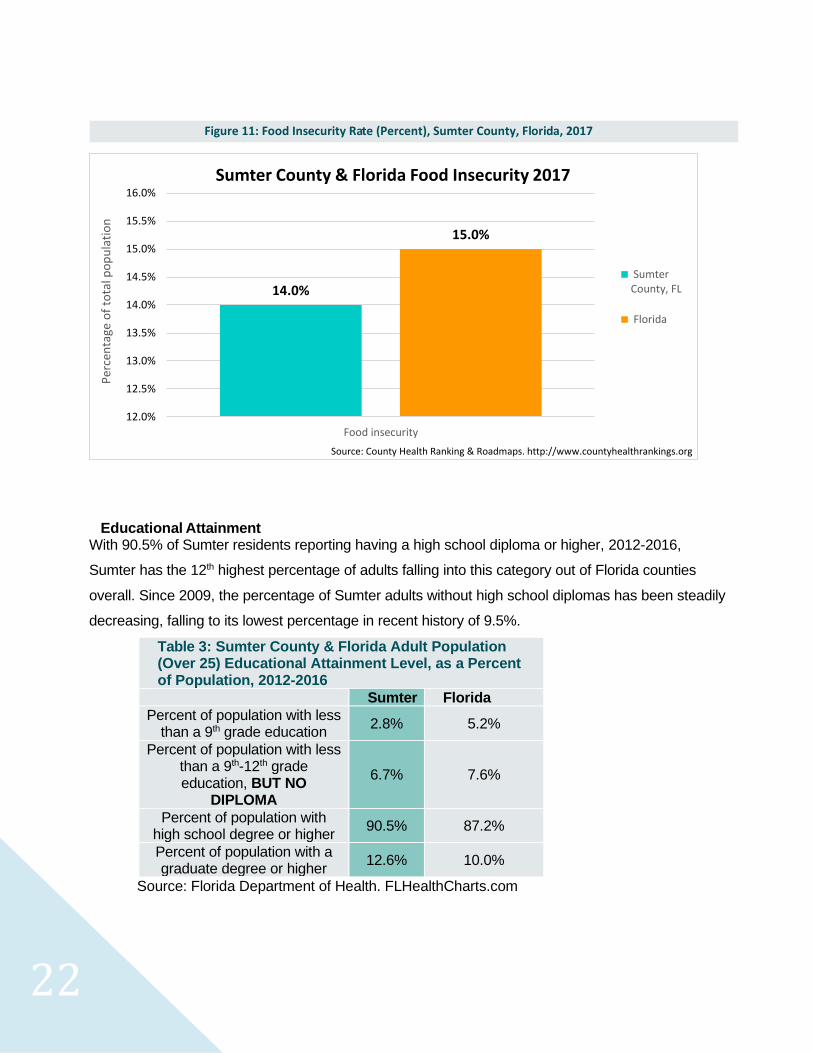
22
Educational Attainment With 90.5% of Sumter residents reporting having a high school diploma or higher, 2012-2016,
Sumter has the 12th highest percentage of adults falling into this category out of Florida counties
overall. Since 2009, the percentage of Sumter adults without high school diplomas has been steadily
decreasing, falling to its lowest percentage in recent history of 9.5%.
Table 3: Sumter County & Florida Adult Population (Over 25) Educational Attainment Level, as a Percent of Population, 2012-2016
Sumter Florida
Percent of population with less than a 9th grade education
2.8% 5.2%
Percent of population with less than a 9th-12th grade education, BUT NO
DIPLOMA
6.7% 7.6%
Percent of population with high school degree or higher
90.5% 87.2%
Percent of population with a graduate degree or higher
12.6% 10.0%
Source: Florida Department of Health. FLHealthCharts.com
14.0%
15.0%
12.0%
12.5%
13.0%
13.5%
14.0%
14.5%
15.0%
15.5%
16.0%
Food insecurity
Per
cen
tage
of
tota
l po
pu
lati
on
Source: County Health Ranking & Roadmaps. http://www.countyhealthrankings.org
Sumter County & Florida Food Insecurity 2017
SumterCounty, FL
Florida
Figure 11: Food Insecurity Rate (Percent), Sumter County, Florida, 2017
Community Health Status Assessment
23
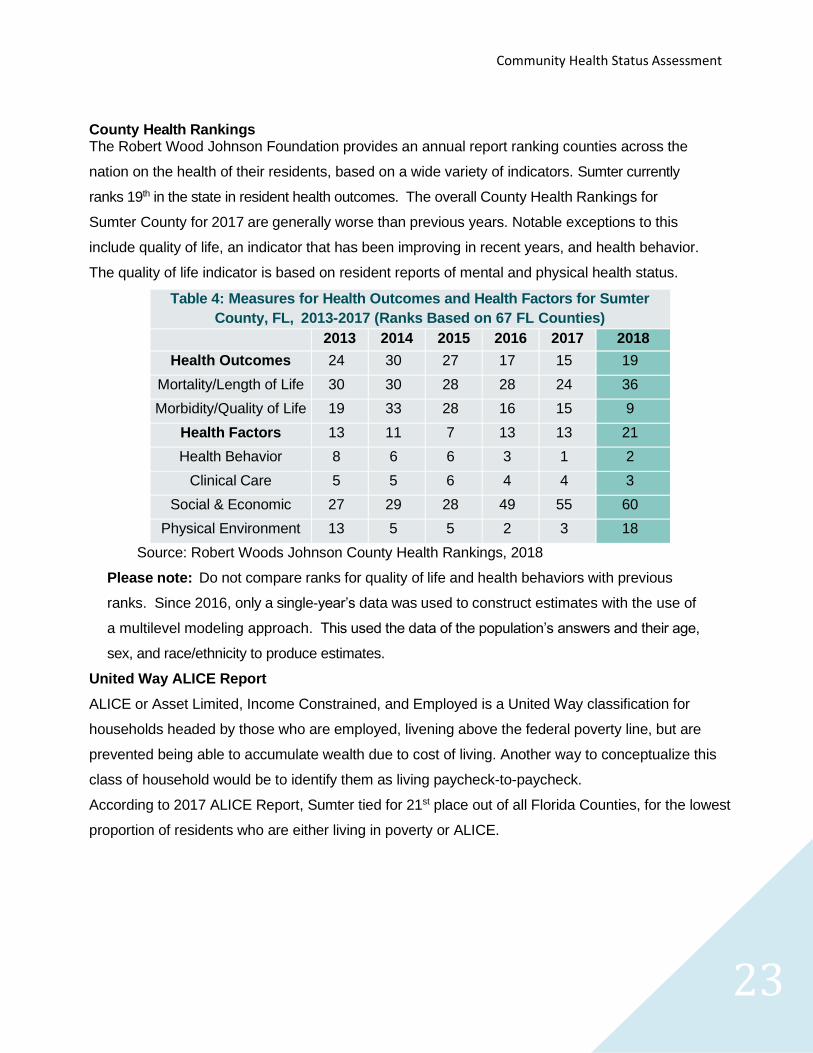
County Health Rankings The Robert Wood Johnson Foundation provides an annual report ranking counties across the
nation on the health of their residents, based on a wide variety of indicators. Sumter currently
ranks 19th in the state in resident health outcomes. The overall County Health Rankings for
Sumter County for 2017 are generally worse than previous years. Notable exceptions to this
include quality of life, an indicator that has been improving in recent years, and health behavior.
The quality of life indicator is based on resident reports of mental and physical health status.
Table 4: Measures for Health Outcomes and Health Factors for Sumter
County, FL, 2013-2017 (Ranks Based on 67 FL Counties)
2013 2014 2015 2016 2017 2018
Health Outcomes 24 30 27 17 15 19
Mortality/Length of Life 30 30 28 28 24 36
Morbidity/Quality of Life 19 33 28 16 15 9
Health Factors 13 11 7 13 13 21
Health Behavior 8 6 6 3 1 2
Clinical Care 5 5 6 4 4 3
Social & Economic
Factors
27 29 28 49 55 60
Physical Environment 13 5 5 2 3 18
Source: Robert Woods Johnson County Health Rankings, 2018
Please note: Do not compare ranks for quality of life and health behaviors with previous
ranks. Since 2016, only a single-year’s data was used to construct estimates with the use of
a multilevel modeling approach. This used the data of the population’s answers and their age,
sex, and race/ethnicity to produce estimates.
United Way ALICE Report
ALICE or Asset Limited, Income Constrained, and Employed is a United Way classification for
households headed by those who are employed, livening above the federal poverty line, but are
prevented being able to accumulate wealth due to cost of living. Another way to conceptualize this
class of household would be to identify them as living paycheck-to-paycheck.
According to 2017 ALICE Report, Sumter tied for 21st place out of all Florida Counties, for the lowest
proportion of residents who are either living in poverty or ALICE.
24
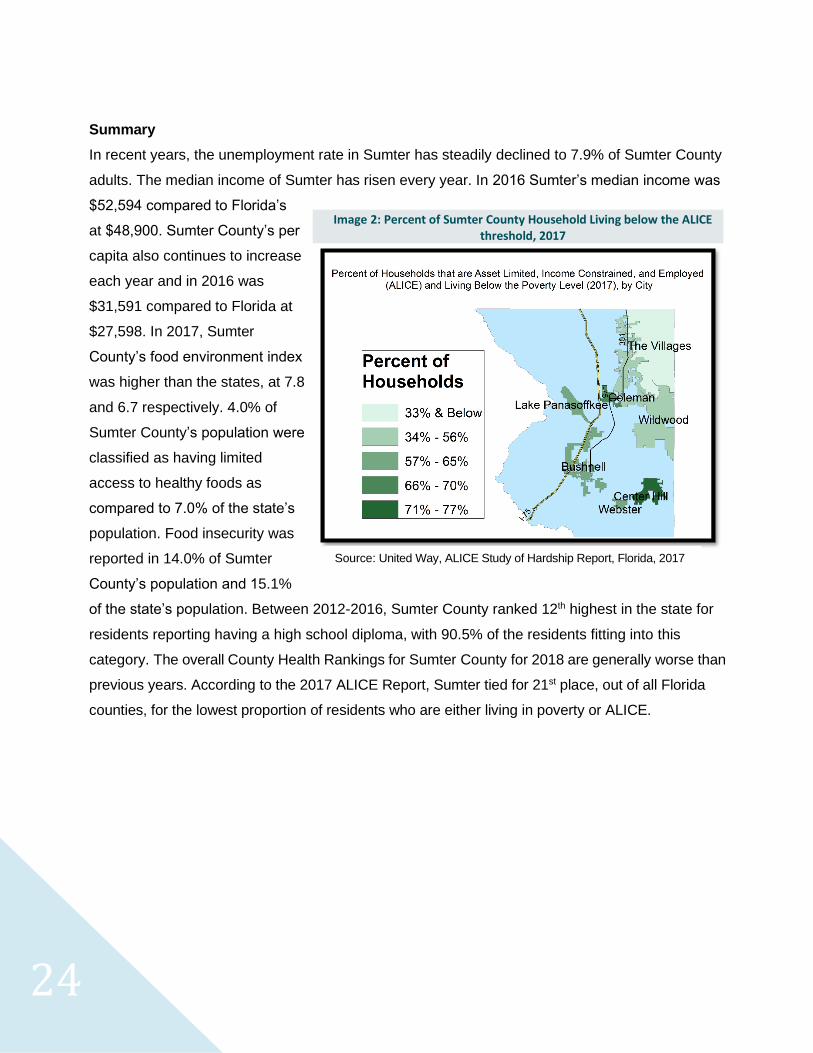
Summary
In recent years, the unemployment rate in Sumter has steadily declined to 7.9% of Sumter County
adults. The median income of Sumter has risen every year. In 2016 Sumter’s median income was
$52,594 compared to Florida’s
at $48,900. Sumter County’s per
capita also continues to increase
each year and in 2016 was
$31,591 compared to Florida at
$27,598. In 2017, Sumter
County’s food environment index
was higher than the states, at 7.8
and 6.7 respectively. 4.0% of
Sumter County’s population were
classified as having limited
access to healthy foods as
compared to 7.0% of the state’s
population. Food insecurity was
reported in 14.0% of Sumter
County’s population and 15.1%
of the state’s population. Between 2012-2016, Sumter County ranked 12th highest in the state for
residents reporting having a high school diploma, with 90.5% of the residents fitting into this
category. The overall County Health Rankings for Sumter County for 2018 are generally worse than
previous years. According to the 2017 ALICE Report, Sumter tied for 21st place, out of all Florida
counties, for the lowest proportion of residents who are either living in poverty or ALICE.
Image 2: Percent of Sumter County Household Living below the ALICE threshold, 2017
Source: United Way, ALICE Study of Hardship Report, Florida, 2017
Community Health Status Assessment
25
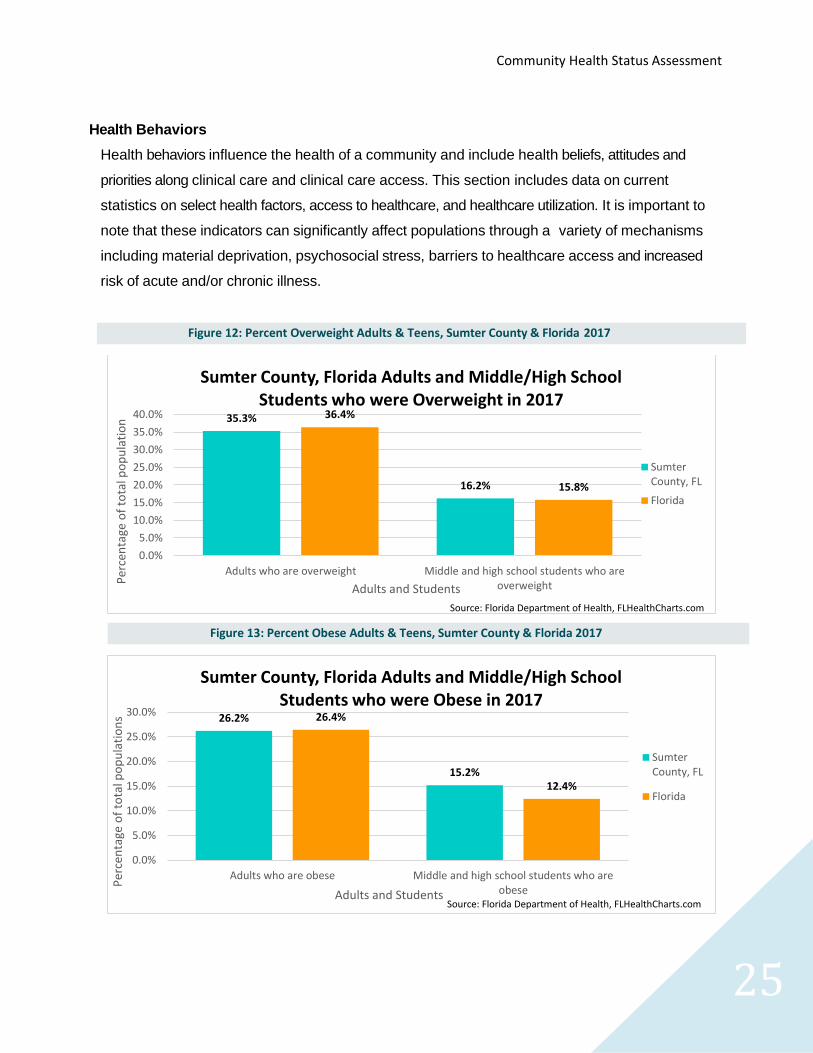
Health Behaviors
Health behaviors influence the health of a community and include health beliefs, attitudes and
priorities along clinical care and clinical care access. This section includes data on current
statistics on select health factors, access to healthcare, and healthcare utilization. It is important to
note that these indicators can significantly affect populations through a variety of mechanisms
including material deprivation, psychosocial stress, barriers to healthcare access and increased
risk of acute and/or chronic illness.
35.3%
16.2%
36.4%
15.8%
0.0%
5.0%
10.0%
15.0%
20.0%
25.0%
30.0%
35.0%
40.0%
Adults who are overweight Middle and high school students who areoverweightP
erce
nta
ge o
f to
tal p
op
ula
tio
n
Adults and Students
Sumter County, Florida Adults and Middle/High School Students who were Overweight in 2017
SumterCounty, FL
Florida
Source: Florida Department of Health, FLHealthCharts.com
26.2%
15.2%
26.4%
12.4%
0.0%
5.0%
10.0%
15.0%
20.0%
25.0%
30.0%
Adults who are obese Middle and high school students who areobese
Per
cen
tage
of
tota
l po
pu
lati
on
s
Adults and Students
Sumter County, Florida Adults and Middle/High School Students who were Obese in 2017
SumterCounty, FL
Florida
Source: Florida Department of Health, FLHealthCharts.com
Figure 12: Percent Overweight Adults & Teens, Sumter County & Florida 2017
Figure 13: Percent Obese Adults & Teens, Sumter County & Florida 2017
26
61.4%
31.3%
62.8%
28.2%
0.0%
10.0%
20.0%
30.0%
40.0%
50.0%
60.0%
70.0%
Adults who are overweight or obese Middle and high school students who areoverweight or obeseP
erce
nta
ge o
f to
tal p
op
ula
tio
ns
Adults and Students
Sumter County, Florida Overweight & Obese in Adults and Middle/High School Students 2017
SumterCounty,FL
Florida
Source: Florida Department of Health, FLHealthCharts.com
44.5%46.3%
33.4% 34.6%
0.0%
5.0%
10.0%
15.0%
20.0%
25.0%
30.0%
35.0%
40.0%
45.0%
50.0%
High Blood Cholesterol Hypertension
Per
cen
tage
of
tota
l po
pu
lati
on
Risk Factor
Sumter County, Florida Adults Who Have Ever Been Told They Had a Risk Factor 2013
SumterCounty, FL
Florida
Source: Florida Department of Health. FLHealthCharts.com
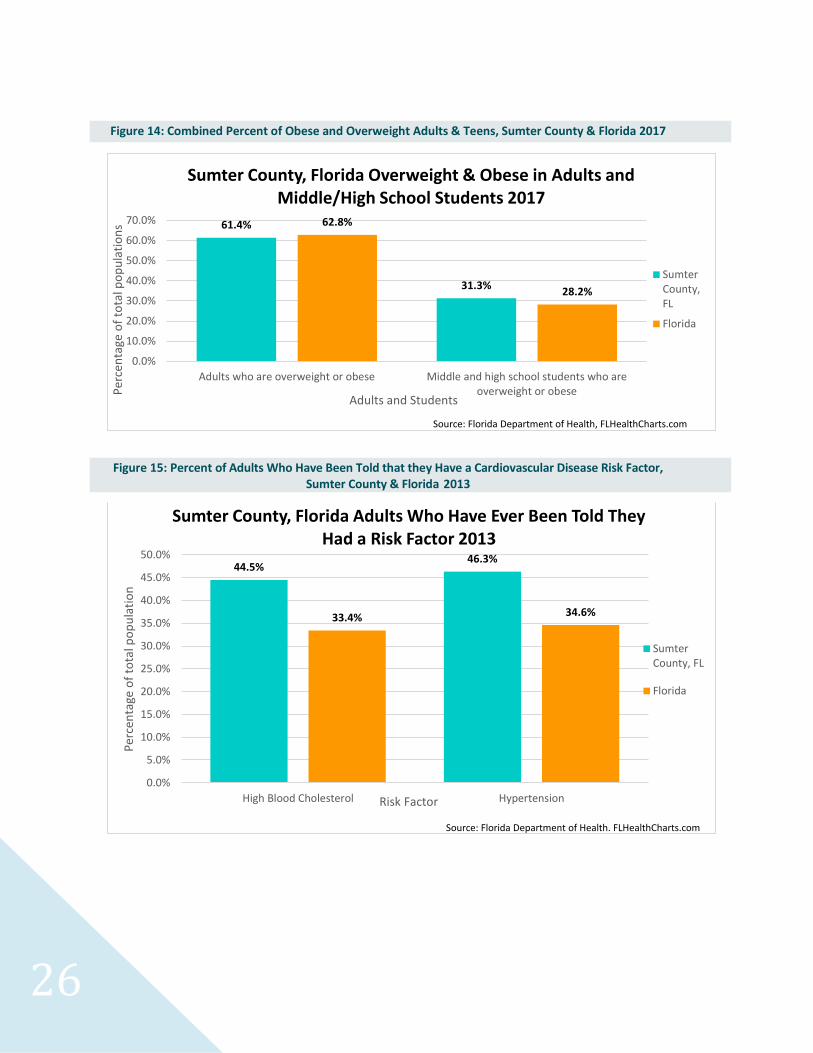
Figure 14: Combined Percent of Obese and Overweight Adults & Teens, Sumter County & Florida 2017
Figure 15: Percent of Adults Who Have Been Told that they Have a Cardiovascular Disease Risk Factor, Sumter County & Florida 2013
Community Health Status Assessment
27
Healthcare Access
According to Healthy People 2020 access to healthcare is "the timely use of personal health
services to achieve the best health outcomes."
Access can be broken into 3 phases:
1. Gaining entry into the health care system (usually through insurance coverage)
2. Accessing a location where needed health care services are provided (geographic
availability)
3. Finding a health care provider whom the patient trusts and can communicate with
(personal relationship)
Key findings from data sets associated with healthcare access are compiled below.
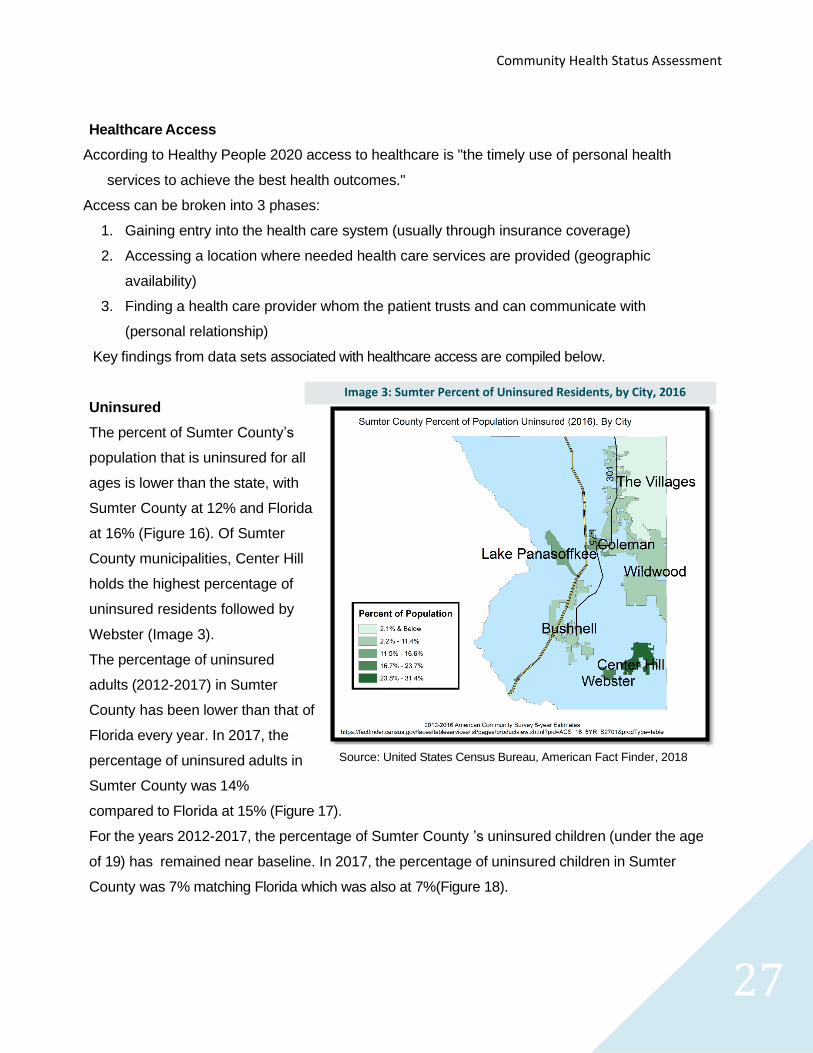
Uninsured
The percent of Sumter County’s
population that is uninsured for all
ages is lower than the state, with
Sumter County at 12% and Florida
at 16% (Figure 16). Of Sumter
County municipalities, Center Hill
holds the highest percentage of
uninsured residents followed by
Webster (Image 3).
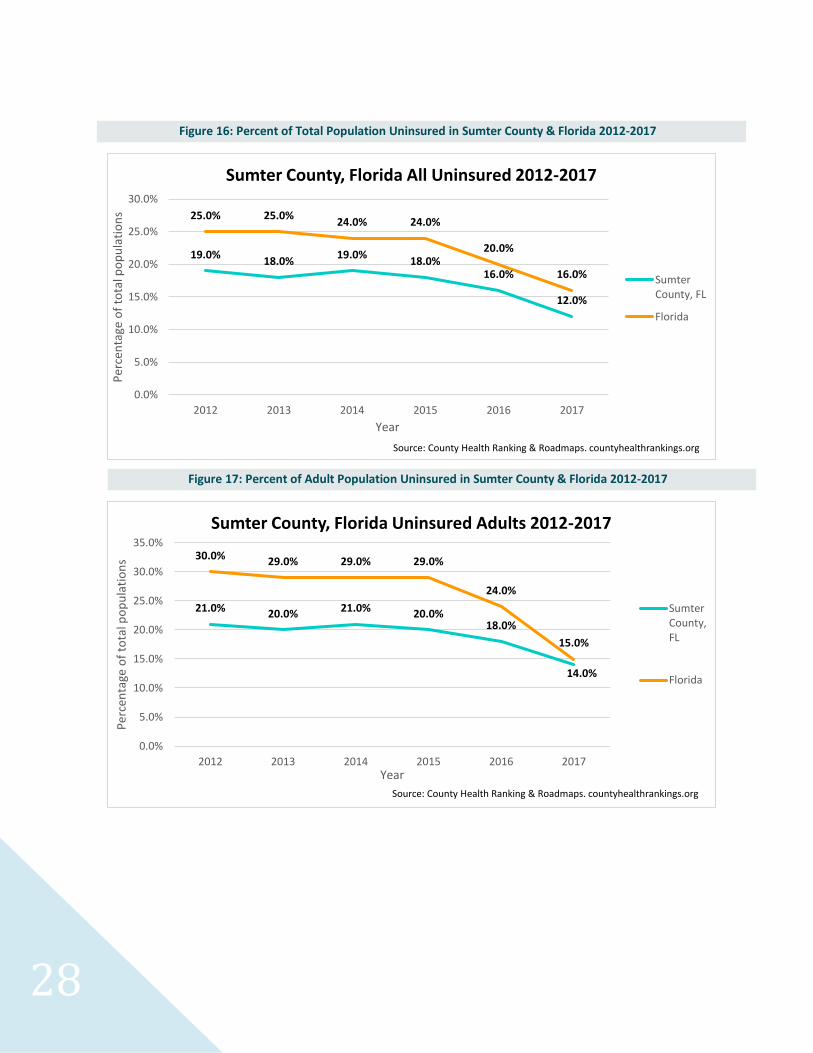
The percentage of uninsured
adults (2012-2017) in Sumter
County has been lower than that of
Florida every year. In 2017, the
percentage of uninsured adults in
Sumter County was 14%
compared to Florida at 15% (Figure 17).
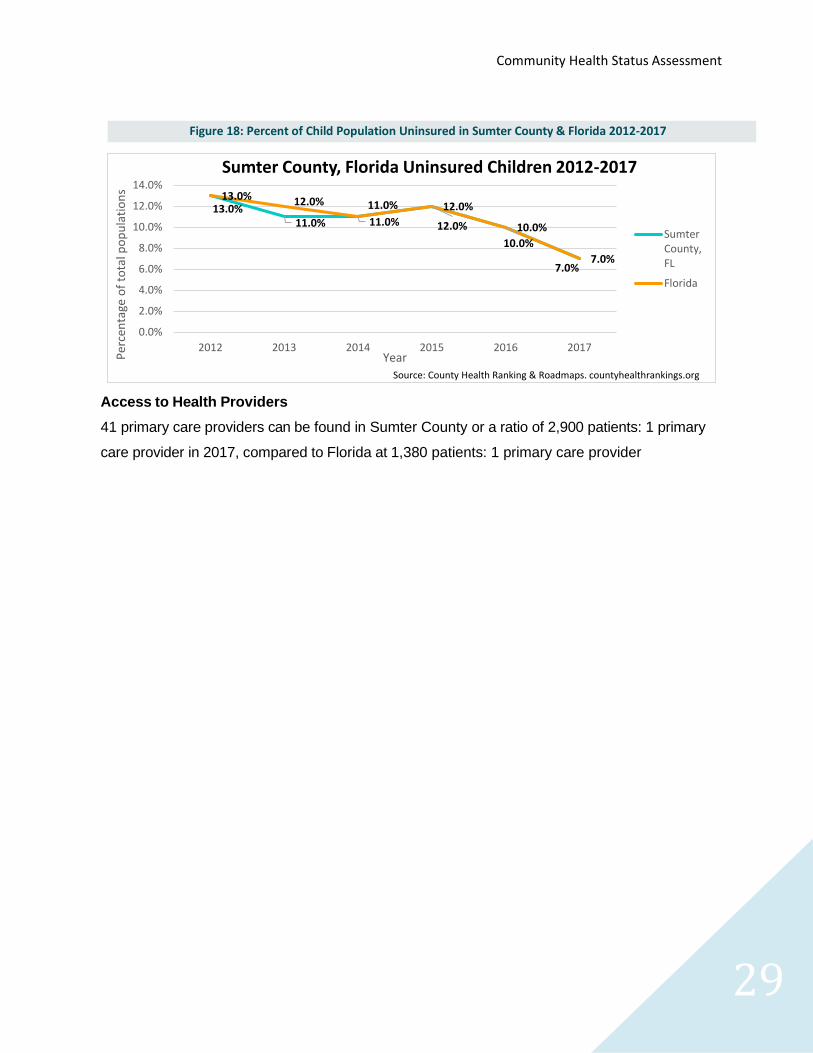
For the years 2012-2017, the percentage of Sumter County ’s uninsured children (under the age
of 19) has remained near baseline. In 2017, the percentage of uninsured children in Sumter
County was 7% matching Florida which was also at 7%(Figure 18).
Image 3: Sumter Percent of Uninsured Residents, by City, 2016
Source: United States Census Bureau, American Fact Finder, 2018
28
19.0%18.0%
19.0%18.0%
16.0%
12.0%
25.0% 25.0%24.0% 24.0%
20.0%
16.0%
0.0%
5.0%
10.0%
15.0%
20.0%
25.0%
30.0%
2012 2013 2014 2015 2016 2017
Per
cen
tage
of
tota
l po
pu
lati
on
s
Year
Sumter County, Florida All Uninsured 2012-2017
SumterCounty, FL
Florida
Source: County Health Ranking & Roadmaps. countyhealthrankings.org
21.0% 20.0% 21.0% 20.0%18.0%
14.0%
30.0% 29.0% 29.0% 29.0%
24.0%
15.0%
0.0%
5.0%
10.0%
15.0%
20.0%
25.0%
30.0%
35.0%
2012 2013 2014 2015 2016 2017
Per
cen
tage
of
tota
l po
pu
lati
on
s
Year
Sumter County, Florida Uninsured Adults 2012-2017
SumterCounty,FL
Florida
Source: County Health Ranking & Roadmaps. countyhealthrankings.org
Figure 16: Percent of Total Population Uninsured in Sumter County & Florida 2012-2017
Figure 17: Percent of Adult Population Uninsured in Sumter County & Florida 2012-2017
Community Health Status Assessment
29
Access to Health Providers
41 primary care providers can be found in Sumter County or a ratio of 2,900 patients: 1 primary
care provider in 2017, compared to Florida at 1,380 patients: 1 primary care provider
13.0%
11.0% 11.0%
12.0%
10.0%
7.0%
13.0%12.0% 11.0%
12.0%
10.0%
7.0%
0.0%
2.0%
4.0%
6.0%
8.0%
10.0%
12.0%
14.0%
2012 2013 2014 2015 2016 2017
Per
cen
tage
of
tota
l po
pu
lati
on
s
Year
Sumter County, Florida Uninsured Children 2012-2017
SumterCounty,FL
Florida
Source: County Health Ranking & Roadmaps. countyhealthrankings.org
Figure 18: Percent of Child Population Uninsured in Sumter County & Florida 2012-2017
30
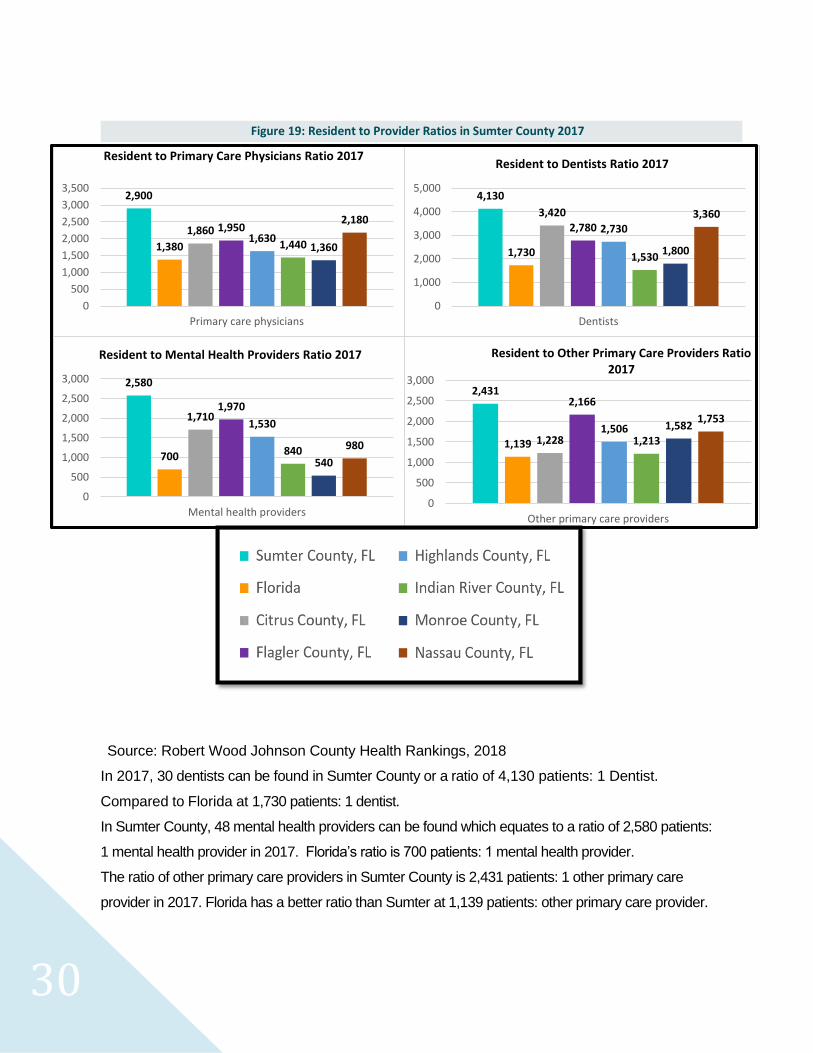
Source: Robert Wood Johnson County Health Rankings, 2018
In 2017, 30 dentists can be found in Sumter County or a ratio of 4,130 patients: 1 Dentist.
Compared to Florida at 1,730 patients: 1 dentist.
In Sumter County, 48 mental health providers can be found which equates to a ratio of 2,580 patients:
1 mental health provider in 2017. Florida’s ratio is 700 patients: 1 mental health provider.
The ratio of other primary care providers in Sumter County is 2,431 patients: 1 other primary care
provider in 2017. Florida has a better ratio than Sumter at 1,139 patients: other primary care provider.
Figure 19: Resident to Provider Ratios in Sumter County 2017
2,900
1,380
1,860 1,9501,630
1,440 1,360
2,180
0
500
1,000
1,500
2,000
2,500
3,000
3,500
Primary care physicians
Resident to Primary Care Physicians Ratio 2017
4,130
1,730
3,420
2,780 2,730
1,5301,800
3,360
0
1,000
2,000
3,000
4,000
5,000
Dentists
Resident to Dentists Ratio 2017
2,580
700
1,7101,970
1,530
840540
980
0
500
1,000
1,500
2,000
2,500
3,000
Mental health providers
Resident to Mental Health Providers Ratio 2017
2,431
1,139 1,228
2,166
1,5061,213
1,5821,753
0
500
1,000
1,500
2,000
2,500
3,000
Other primary care providers
Resident to Other Primary Care Providers Ratio 2017
Community Health Status Assessment
31
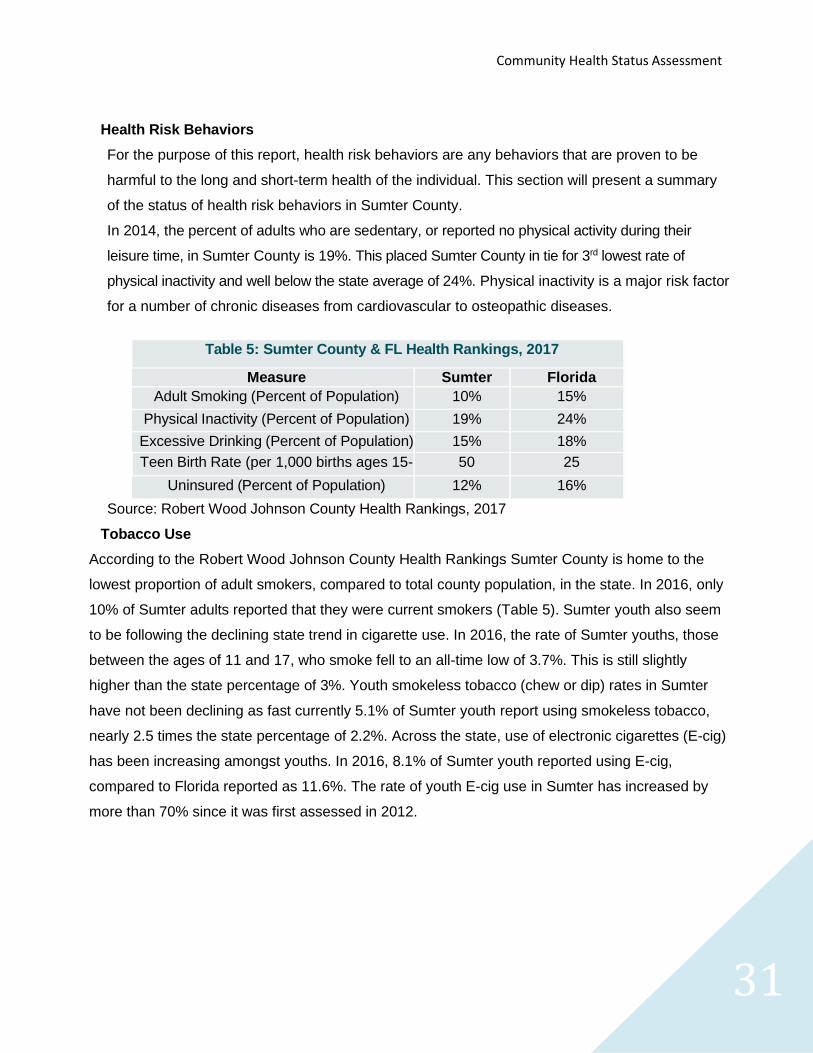
Health Risk Behaviors
For the purpose of this report, health risk behaviors are any behaviors that are proven to be
harmful to the long and short-term health of the individual. This section will present a summary
of the status of health risk behaviors in Sumter County.
In 2014, the percent of adults who are sedentary, or reported no physical activity during their
leisure time, in Sumter County is 19%. This placed Sumter County in tie for 3rd lowest rate of
physical inactivity and well below the state average of 24%. Physical inactivity is a major risk factor
for a number of chronic diseases from cardiovascular to osteopathic diseases.
Table 5: Sumter County & FL Health Rankings, 2017
Measure Sumter Florida
Adult Smoking (Percent of Population) 10% 15%
Physical Inactivity (Percent of Population) 19% 24%
Excessive Drinking (Percent of Population) 15% 18%
Teen Birth Rate (per 1,000 births ages 15-
19)
50 25
Uninsured (Percent of Population) 12% 16%
Source: Robert Wood Johnson County Health Rankings, 2017
Tobacco Use
According to the Robert Wood Johnson County Health Rankings Sumter County is home to the
lowest proportion of adult smokers, compared to total county population, in the state. In 2016, only
10% of Sumter adults reported that they were current smokers (Table 5). Sumter youth also seem
to be following the declining state trend in cigarette use. In 2016, the rate of Sumter youths, those
between the ages of 11 and 17, who smoke fell to an all-time low of 3.7%. This is still slightly
higher than the state percentage of 3%. Youth smokeless tobacco (chew or dip) rates in Sumter
have not been declining as fast currently 5.1% of Sumter youth report using smokeless tobacco,
nearly 2.5 times the state percentage of 2.2%. Across the state, use of electronic cigarettes (E-cig)
has been increasing amongst youths. In 2016, 8.1% of Sumter youth reported using E-cig,
compared to Florida reported as 11.6%. The rate of youth E-cig use in Sumter has increased by
more than 70% since it was first assessed in 2012.
32
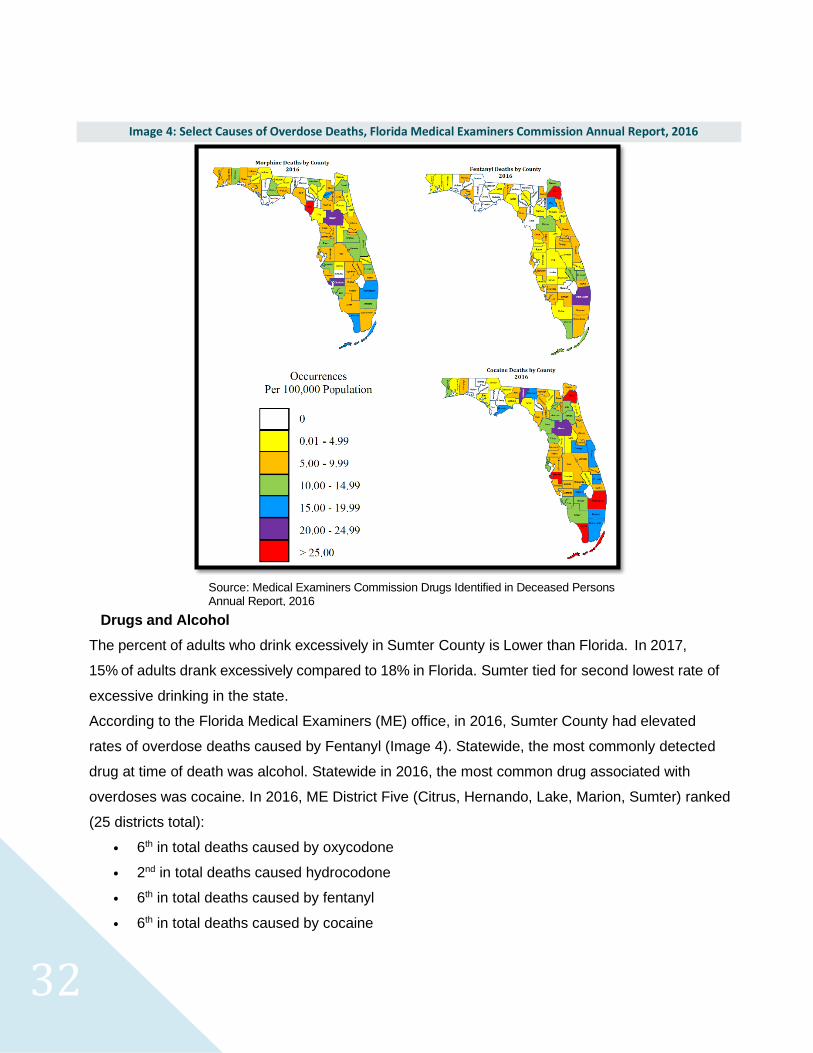
Drugs and Alcohol
The percent of adults who drink excessively in Sumter County is Lower than Florida. In 2017,
15% of adults drank excessively compared to 18% in Florida. Sumter tied for second lowest rate of
excessive drinking in the state.
According to the Florida Medical Examiners (ME) office, in 2016, Sumter County had elevated
rates of overdose deaths caused by Fentanyl (Image 4). Statewide, the most commonly detected
drug at time of death was alcohol. Statewide in 2016, the most common drug associated with
overdoses was cocaine. In 2016, ME District Five (Citrus, Hernando, Lake, Marion, Sumter) ranked
(25 districts total):
• 6th in total deaths caused by oxycodone
• 2nd in total deaths caused hydrocodone
• 6th in total deaths caused by fentanyl
• 6th in total deaths caused by cocaine
Image 4: Select Causes of Overdose Deaths, Florida Medical Examiners Commission Annual Report, 2016
Source: Medical Examiners Commission Drugs Identified in Deceased Persons Annual Report, 2016
Community Health Status Assessment
33
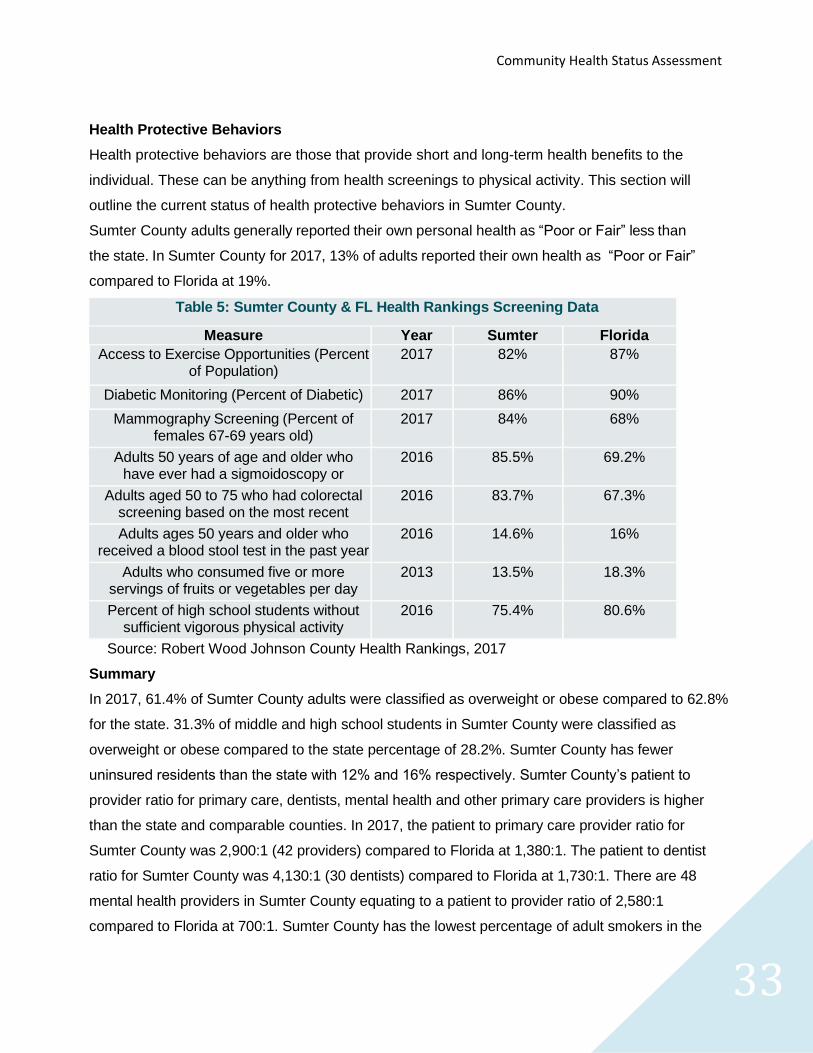
Health Protective Behaviors
Health protective behaviors are those that provide short and long-term health benefits to the
individual. These can be anything from health screenings to physical activity. This section will
outline the current status of health protective behaviors in Sumter County.
Sumter County adults generally reported their own personal health as “Poor or Fair” less than
the state. In Sumter County for 2017, 13% of adults reported their own health as “Poor or Fair”
compared to Florida at 19%.
Table 5: Sumter County & FL Health Rankings Screening Data
Measure Year Sumter Florida
Access to Exercise Opportunities (Percent of Population)
2017 82% 87%
Diabetic Monitoring (Percent of Diabetic) 2017 86% 90%
Mammography Screening (Percent of females 67-69 years old)
2017 84% 68%
Adults 50 years of age and older who have ever had a sigmoidoscopy or
colonoscopy
2016 85.5% 69.2%
Adults aged 50 to 75 who had colorectal screening based on the most recent
clinical guidelines
2016 83.7% 67.3%
Adults ages 50 years and older who received a blood stool test in the past year
2016 14.6% 16%
Adults who consumed five or more servings of fruits or vegetables per day
2013 13.5% 18.3%
Percent of high school students without sufficient vigorous physical activity
2016 75.4% 80.6%
Source: Robert Wood Johnson County Health Rankings, 2017
Summary
In 2017, 61.4% of Sumter County adults were classified as overweight or obese compared to 62.8%
for the state. 31.3% of middle and high school students in Sumter County were classified as
overweight or obese compared to the state percentage of 28.2%. Sumter County has fewer
uninsured residents than the state with 12% and 16% respectively. Sumter County’s patient to
provider ratio for primary care, dentists, mental health and other primary care providers is higher
than the state and comparable counties. In 2017, the patient to primary care provider ratio for
Sumter County was 2,900:1 (42 providers) compared to Florida at 1,380:1. The patient to dentist
ratio for Sumter County was 4,130:1 (30 dentists) compared to Florida at 1,730:1. There are 48
mental health providers in Sumter County equating to a patient to provider ratio of 2,580:1
compared to Florida at 700:1. Sumter County has the lowest percentage of adult smokers in the
34
state at 10%. Youth tobacco use rates are higher than that of the state with 3.7% of 11-17 year old
smoking, and 5.1% of Sumter youth using smokeless tobacco products.
Recent local data on many health protective factors such as local dietary habits, adult physical
activity levels, and youth physical activity levels were incomplete or nonexistent. This creates
limitations in the ability to generate a complete picture of Sumter health behaviors.
Health Outcomes
One of the best strategies for measuring health and well-being is by examining a community’s
rates of disease and death. In Sumter County —as well as in Florida and the rest of the
United States—premature disease and death are primarily attributable to chronic health
issues. Chronic health issues typically develop throughout the course of life and often require
careful management for prolonged periods of time. This section focuses on the health
outcomes (morbidity and mortality) of Sumter County residents. Sumter County data will be
compared to state of Florida data when possible.
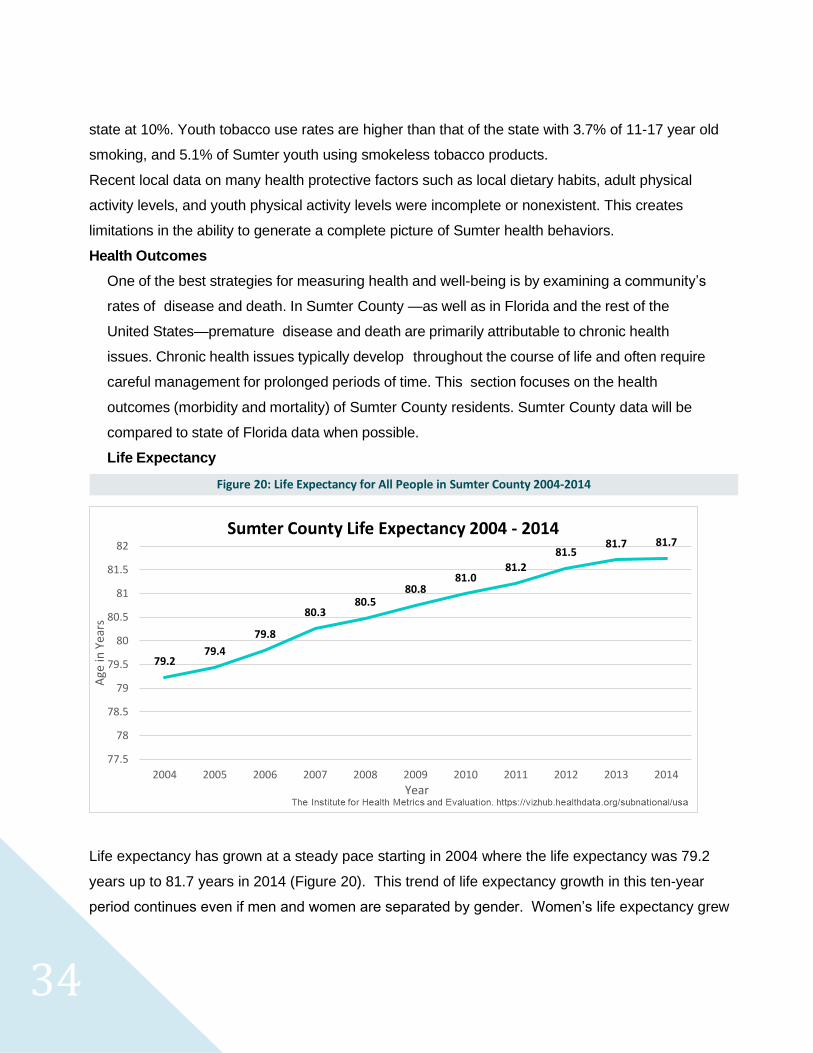
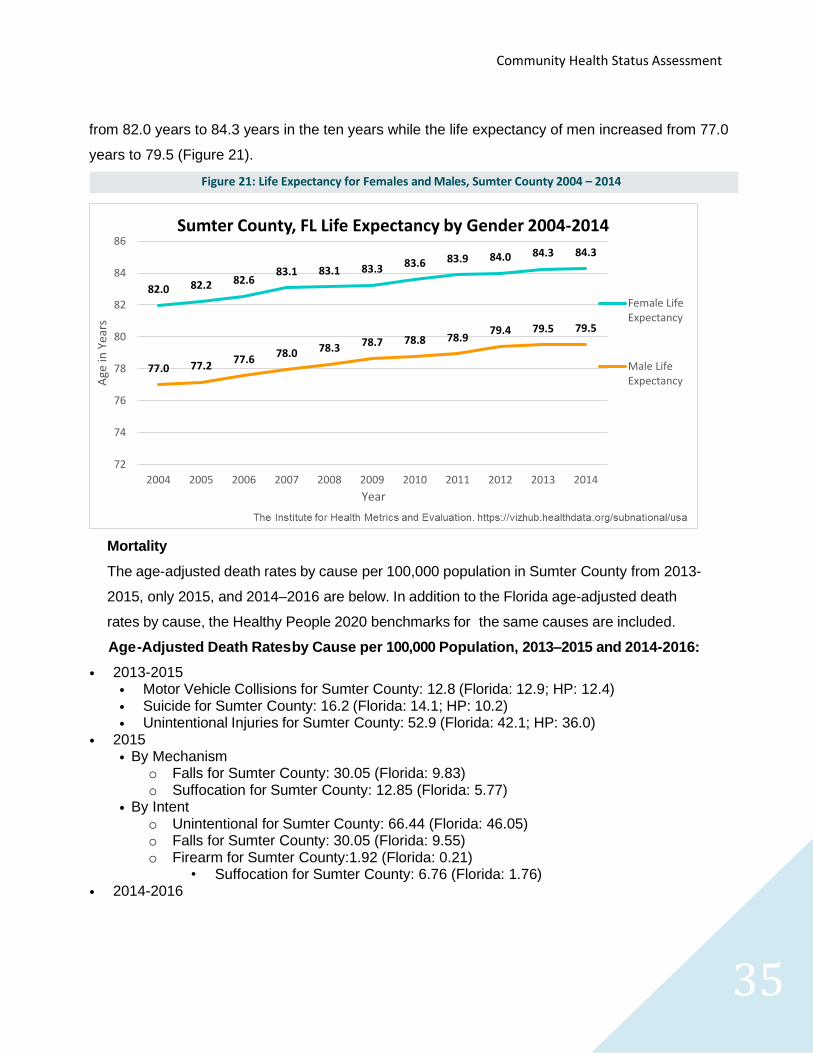
Life Expectancy
Life expectancy has grown at a steady pace starting in 2004 where the life expectancy was 79.2
years up to 81.7 years in 2014 (Figure 20). This trend of life expectancy growth in this ten-year
period continues even if men and women are separated by gender. Women’s life expectancy grew
79.279.4
79.8
80.380.5
80.881.0
81.2
81.581.7 81.7
77.5
78
78.5
79
79.5
80
80.5
81
81.5
82
2004 2005 2006 2007 2008 2009 2010 2011 2012 2013 2014
Age
in Y
ears
Year
Sumter County Life Expectancy 2004 - 2014
Figure 20: Life Expectancy for All People in Sumter County 2004-2014
Community Health Status Assessment
35
from 82.0 years to 84.3 years in the ten years while the life expectancy of men increased from 77.0
years to 79.5 (Figure 21).
Mortality
The age-adjusted death rates by cause per 100,000 population in Sumter County from 2013-
2015, only 2015, and 2014–2016 are below. In addition to the Florida age-adjusted death
rates by cause, the Healthy People 2020 benchmarks for the same causes are included.
Age -Adjusted Death Rates by Cause per 100,000 Population, 2013–2015 and 2014-2016:
• 2013-2015 • Motor Vehicle Collisions for Sumter County: 12.8 (Florida: 12.9; HP: 12.4) • Suicide for Sumter County: 16.2 (Florida: 14.1; HP: 10.2) • Unintentional Injuries for Sumter County: 52.9 (Florida: 42.1; HP: 36.0)
• 2015 • By Mechanism
o Falls for Sumter County: 30.05 (Florida: 9.83) o Suffocation for Sumter County: 12.85 (Florida: 5.77)
• By Intent o Unintentional for Sumter County: 66.44 (Florida: 46.05) o Falls for Sumter County: 30.05 (Florida: 9.55) o Firearm for Sumter County:1.92 (Florida: 0.21)
• Suffocation for Sumter County: 6.76 (Florida: 1.76) • 2014-2016
82.0 82.2 82.683.1 83.1 83.3 83.6 83.9 84.0 84.3 84.3
77.0 77.277.6
78.0 78.3 78.7 78.8 78.979.4 79.5 79.5
72
74
76
78
80
82
84
86
2004 2005 2006 2007 2008 2009 2010 2011 2012 2013 2014
Age
in Y
ears
Year
Sumter County, FL Life Expectancy by Gender 2004-2014
Female LifeExpectancy
Male LifeExpectancy
Figure 21: Life Expectancy for Females and Males, Sumter County 2004 – 2014
36
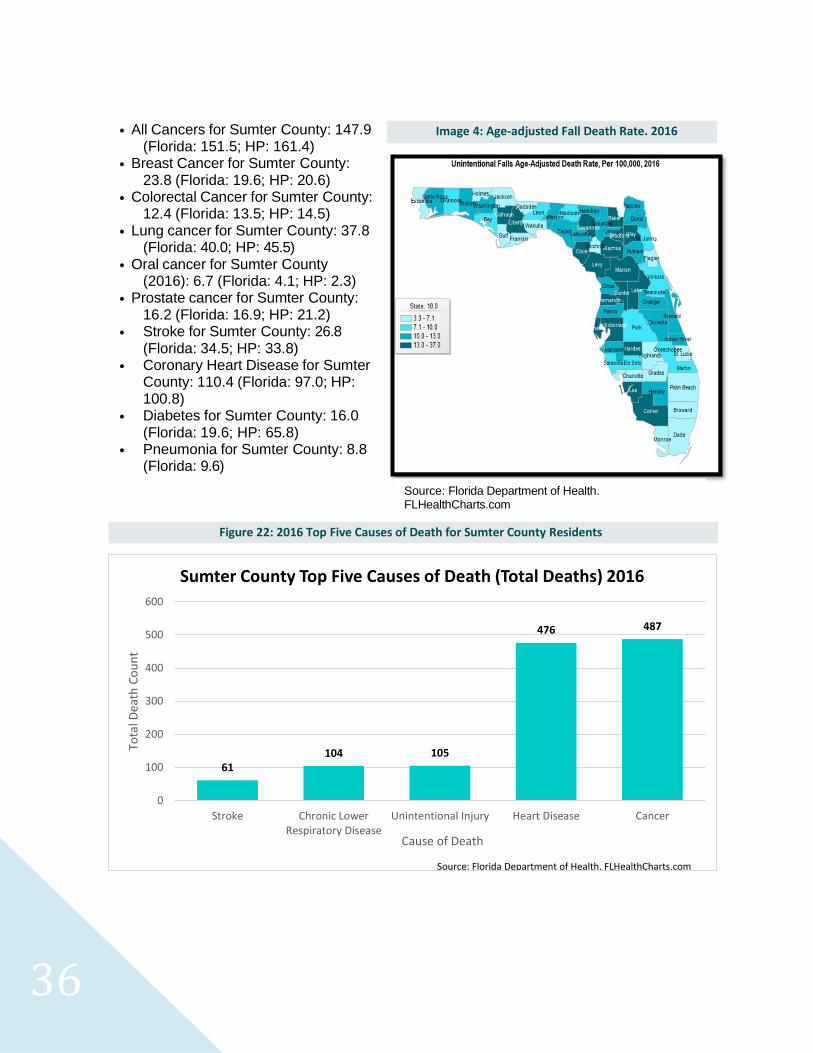
• All Cancers for Sumter County: 147.9 (Florida: 151.5; HP: 161.4)
• Breast Cancer for Sumter County: 23.8 (Florida: 19.6; HP: 20.6)
• Colorectal Cancer for Sumter County: 12.4 (Florida: 13.5; HP: 14.5)
• Lung cancer for Sumter County: 37.8 (Florida: 40.0; HP: 45.5)
• Oral cancer for Sumter County (2016): 6.7 (Florida: 4.1; HP: 2.3)
• Prostate cancer for Sumter County: 16.2 (Florida: 16.9; HP: 21.2)
• Stroke for Sumter County: 26.8 (Florida: 34.5; HP: 33.8)
• Coronary Heart Disease for Sumter County: 110.4 (Florida: 97.0; HP: 100.8)
• Diabetes for Sumter County: 16.0 (Florida: 19.6; HP: 65.8)
• Pneumonia for Sumter County: 8.8 (Florida: 9.6)
61104 105
476 487
0
100
200
300
400
500
600
Stroke Chronic LowerRespiratory Disease
Unintentional Injury Heart Disease Cancer
Tota
l Dea
th C
ou
nt
Cause of Death
Sumter County Top Five Causes of Death (Total Deaths) 2016
Source: Florida Department of Health. FLHealthCharts.com
Figure 22: 2016 Top Five Causes of Death for Sumter County Residents
Image 4: Age-adjusted Fall Death Rate. 2016
Source: Florida Department of Health. FLHealthCharts.com
Community Health Status Assessment
37
Health Care Utilization The age-adjusted non-fatal emergency room visit rates by cause per 100,000 population in
Sumter County from 2014 are below. The Florida age-adjusted ER rates by cause per 100,000
population are also included.
Age -Adjusted Non-Fatal ER Rates by Cause per 100,000 Population, 2014:
• By Mechanism • Bite/Sting for Sumter County: 576.2 (Florida: 471.9) • Poisoning for Sumter County: 246.5 (Florida: 166.1) • Transport, Other for Sumter County: 131.6 (Florida: 65.0) • Natural, Environmental for Sumter County: 90.9 (Florida: 46.7)
• By Intent • Unintentional (All Mechanisms) for Sumter County: 7,832.6 (Florida: 8,760.4) • Bite/Sting for Sumter County: 576.2 (Florida: 471.9) • Poisoning for Sumter County: 135.5 (Florida: 103.8) • Transport, Other for Sumter County: 131.6 (Florida: 65.0) • Natural, Environmental for Sumter County: 90.9 (Florida: 46.5) • Self-Inflicted (All Mechanisms) for Sumter County: 106.7 (Florida: 65.2) • Poisoning for Sumter County: 79.3 (Florida: 37.7)
Most notably from the Sumter County data on ER
rates, Sumter County is much worse off than the state
when it comes to age-adjusted ER rates for bite/sting,
poisoning, transport, and natural, environmental
causes. The data for age-adjusted ER rates by cause
per 100,000 population in Sumter County from 2014.
Hospitalizations
The age-adjusted hospitalization rates by cause per
100,000 population in Sumter County from 2014 are
below.
Age -Adjusted Hospitalization Rates by Cause per 100,000 Population, 2014:
• By Mechanism • Firearm for Sumter County: 12.5 (Florida: 9.0) • Transport, Other for Sumter County: 11.2 (Florida: 9.4) • Unspecified for Sumter County: 30.3 (Florida: 19.8)
• By Intent • Unintentional (All Mechanisms) for Sumter County: 439.7 (Florida: 464.6) • Firearm for Sumter County: 6.6 (Florida: 2.9) • Fire, Flame for Sumter County: 7.8 (Florida: 3.0) • Fall for Sumter County: 229.4 (Florida: 256.9) • Transport, Other for Sumter County: 11.2 (Florida: 9.4) • Unspecified for Sumter County: 21.2 (Florida: 15.6)
Did you know: That Sumter County has the
lowest rate of adult smoking in the State of Florida?
(For more information see the section on Health Risk Behaviors)
38
• Assault (All Mechanisms) for Sumter County: 41.6 (Florida: 25.0) • Cut, Pierce for Sumter County: 6.7 (Florida: 4.3) • Struck by, Against for Sumter County: 12.5 (Florida: 9.2) • Unspecified for Sumter County: 8.9 (Florida: 25.0)
• Cardiovascular Disease Hospitalization • Coronary Heart Disease for Sumter County: 942.2 (Florida: 939.3) • Heart Attack for Sumter County: 189.0 (Florida: 166.4)
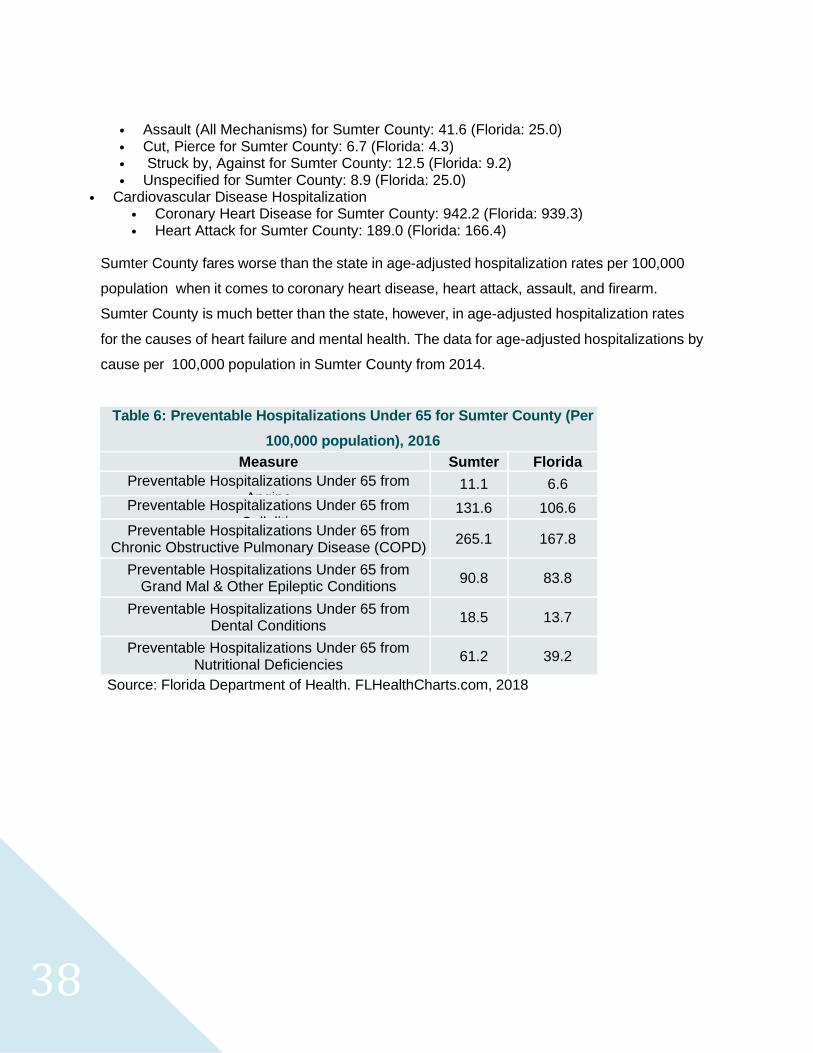
Sumter County fares worse than the state in age-adjusted hospitalization rates per 100,000
population when it comes to coronary heart disease, heart attack, assault, and firearm.
Sumter County is much better than the state, however, in age-adjusted hospitalization rates
for the causes of heart failure and mental health. The data for age-adjusted hospitalizations by
cause per 100,000 population in Sumter County from 2014.
Table 6: Preventable Hospitalizations Under 65 for Sumter County (Per
100,000 population), 2016
Measure Sumter Florida
Preventable Hospitalizations Under 65 from Angina
11.1 6.6
Preventable Hospitalizations Under 65 from Cellulitis
131.6 106.6
Preventable Hospitalizations Under 65 from Chronic Obstructive Pulmonary Disease (COPD)
265.1 167.8
Preventable Hospitalizations Under 65 from Grand Mal & Other Epileptic Conditions
90.8 83.8
Preventable Hospitalizations Under 65 from Dental Conditions
18.5 13.7
Preventable Hospitalizations Under 65 from Nutritional Deficiencies
61.2 39.2
Source: Florida Department of Health. FLHealthCharts.com, 2018
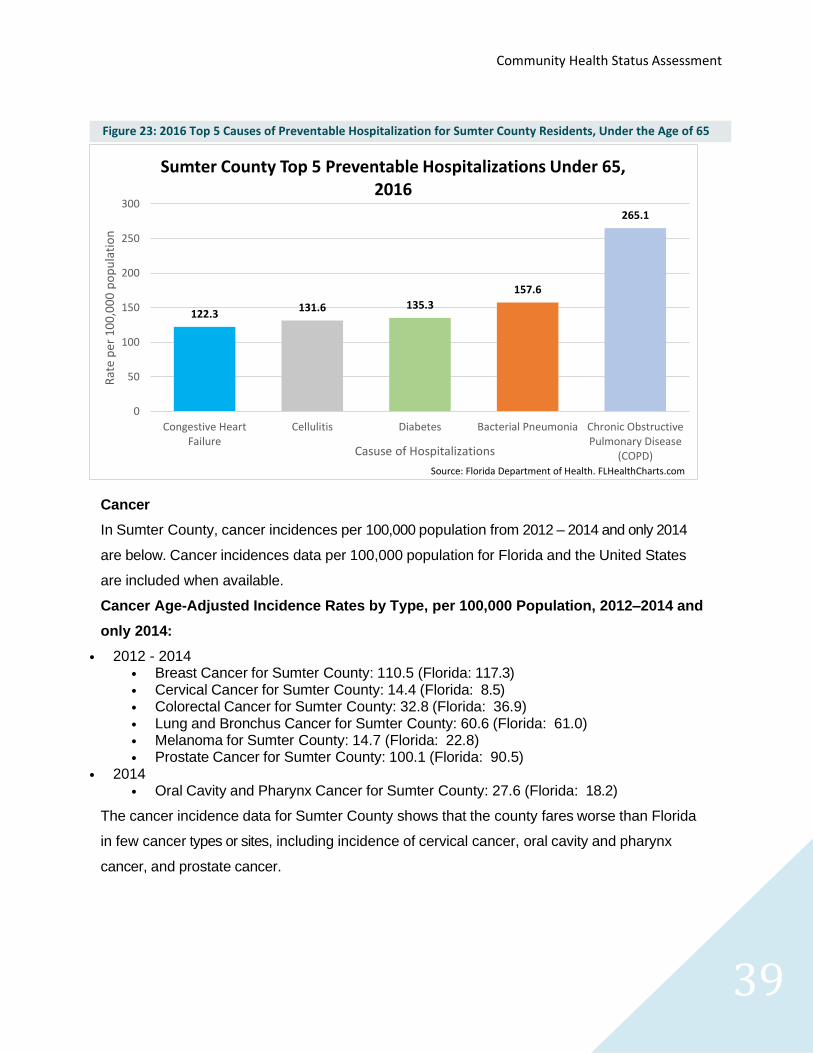
Community Health Status Assessment
39
Cancer
In Sumter County, cancer incidences per 100,000 population from 2012 – 2014 and only 2014
are below. Cancer incidences data per 100,000 population for Florida and the United States
are included when available.
Cancer Age-Adjusted Incidence Rates by Type, per 100,000 Population, 2012–2014 and
only 2014:
• 2012 - 2014 • Breast Cancer for Sumter County: 110.5 (Florida: 117.3) • Cervical Cancer for Sumter County: 14.4 (Florida: 8.5) • Colorectal Cancer for Sumter County: 32.8 (Florida: 36.9) • Lung and Bronchus Cancer for Sumter County: 60.6 (Florida: 61.0) • Melanoma for Sumter County: 14.7 (Florida: 22.8) • Prostate Cancer for Sumter County: 100.1 (Florida: 90.5)
• 2014 • Oral Cavity and Pharynx Cancer for Sumter County: 27.6 (Florida: 18.2)
The cancer incidence data for Sumter County shows that the county fares worse than Florida
in few cancer types or sites, including incidence of cervical cancer, oral cavity and pharynx
cancer, and prostate cancer.
122.3131.6 135.3
157.6
265.1
0
50
100
150
200
250
300
Congestive HeartFailure
Cellulitis Diabetes Bacterial Pneumonia Chronic ObstructivePulmonary Disease
(COPD)
Rat
e p
er 1
00
,00
0 p
op
ula
tio
n
Casuse of Hospitalizations
Sumter County Top 5 Preventable Hospitalizations Under 65, 2016
Source: Florida Department of Health. FLHealthCharts.com
Figure 23: 2016 Top 5 Causes of Preventable Hospitalization for Sumter County Residents, Under the Age of 65
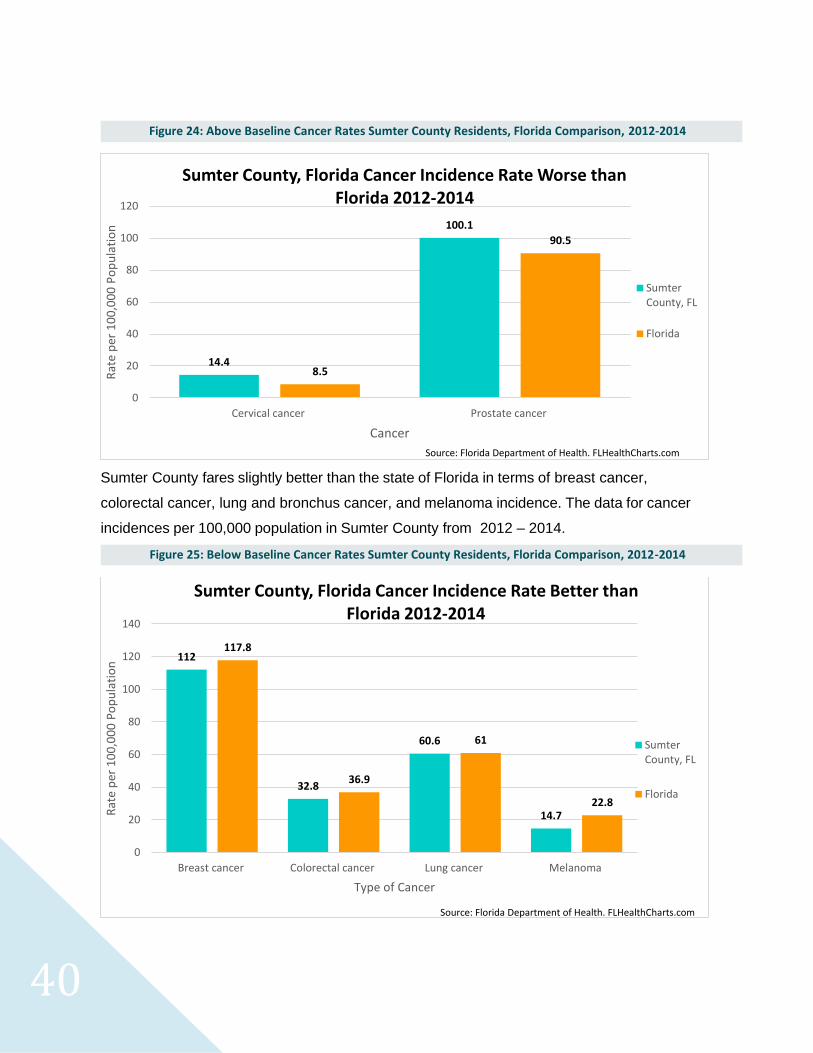
40
Sumter County fares slightly better than the state of Florida in terms of breast cancer,
colorectal cancer, lung and bronchus cancer, and melanoma incidence. The data for cancer
incidences per 100,000 population in Sumter County from 2012 – 2014.
14.4
100.1
8.5
90.5
0
20
40
60
80
100
120
Cervical cancer Prostate cancer
Rat
e p
er 1
00
,00
0 P
op
ula
tio
n
Cancer
Sumter County, Florida Cancer Incidence Rate Worse than Florida 2012-2014
SumterCounty, FL
Florida
Source: Florida Department of Health. FLHealthCharts.com
112
32.8
60.6
14.7
117.8
36.9
61
22.8
0
20
40
60
80
100
120
140
Breast cancer Colorectal cancer Lung cancer Melanoma
Rat
e p
er 1
00
,00
0 P
op
ula
tio
n
Type of Cancer
Sumter County, Florida Cancer Incidence Rate Better than Florida 2012-2014
SumterCounty, FL
Florida
Source: Florida Department of Health. FLHealthCharts.com
Figure 24: Above Baseline Cancer Rates Sumter County Residents, Florida Comparison, 2012-2014
Figure 25: Below Baseline Cancer Rates Sumter County Residents, Florida Comparison, 2012-2014
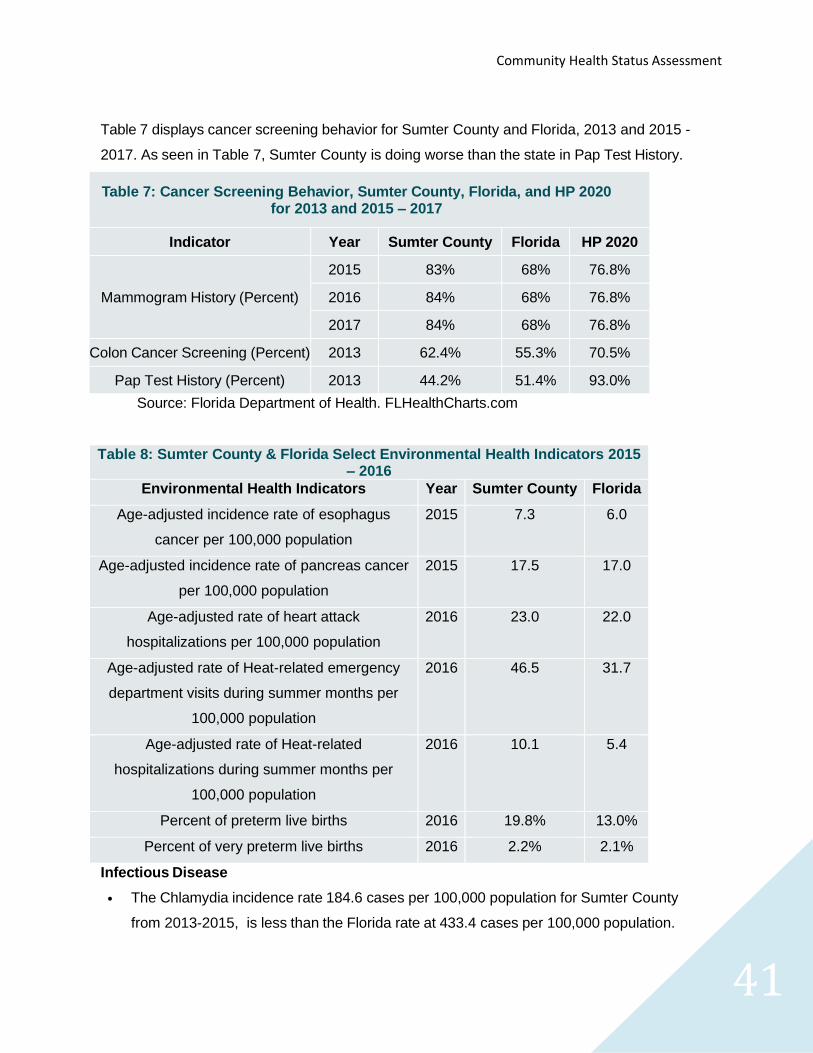
Community Health Status Assessment
41
Table 7 displays cancer screening behavior for Sumter County and Florida, 2013 and 2015 -
2017. As seen in Table 7, Sumter County is doing worse than the state in Pap Test History.
Table 7: Cancer Screening Behavior, Sumter County, Florida, and HP 2020 for 2013 and 2015 – 2017
Indicator Year Sumter County Florida HP 2020
Mammogram History (Percent)
2015 83% 68% 76.8%
2016 84% 68% 76.8%
2017 84% 68% 76.8%
Colon Cancer Screening (Percent) 2013 62.4% 55.3% 70.5%
Pap Test History (Percent) 2013 44.2% 51.4% 93.0%
Source: Florida Department of Health. FLHealthCharts.com
Table 8: Sumter County & Florida Select Environmental Health Indicators 2015 – 2016
Environmental Health Indicators Year Sumter County Florida
Age-adjusted incidence rate of esophagus
cancer per 100,000 population
2015 7.3 6.0
Age-adjusted incidence rate of pancreas cancer
per 100,000 population
2015 17.5 17.0
Age-adjusted rate of heart attack
hospitalizations per 100,000 population
2016 23.0 22.0
Age-adjusted rate of Heat-related emergency
department visits during summer months per
100,000 population
2016 46.5 31.7
Age-adjusted rate of Heat-related
hospitalizations during summer months per
100,000 population
2016 10.1 5.4
Percent of preterm live births 2016 19.8% 13.0%
Percent of very preterm live births 2016 2.2% 2.1%
Infectious Disease
• The Chlamydia incidence rate 184.6 cases per 100,000 population for Sumter County
from 2013-2015, is less than the Florida rate at 433.4 cases per 100,000 population.
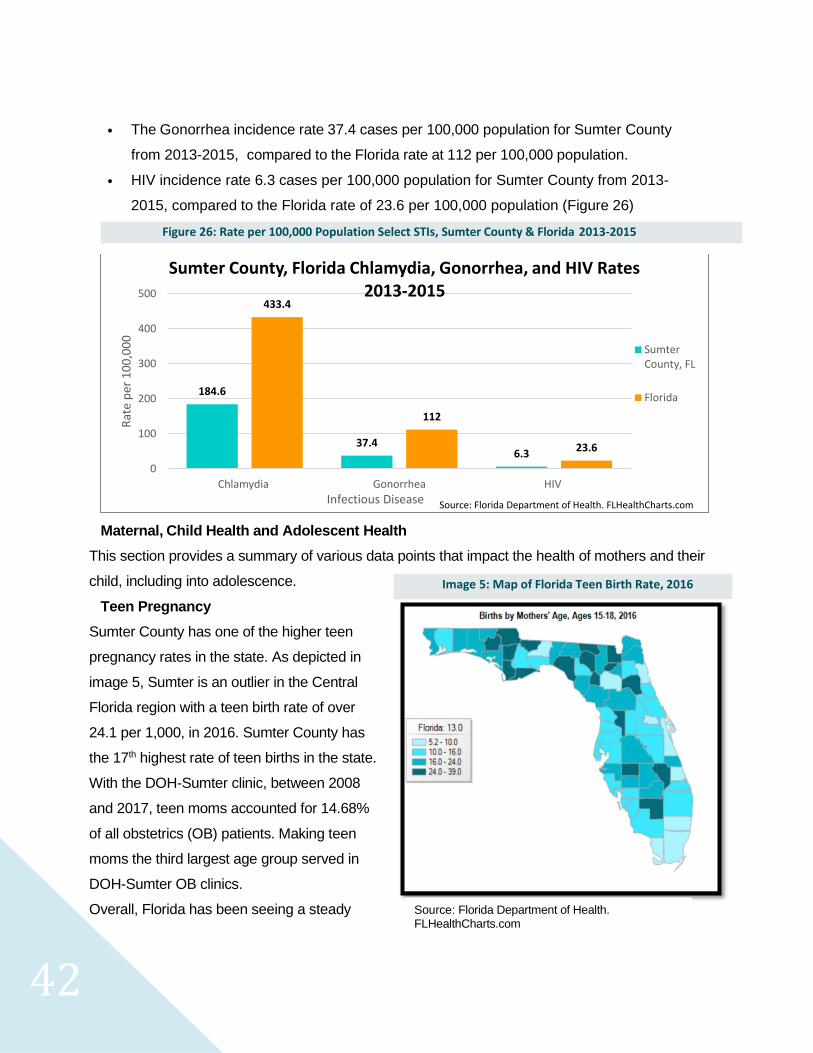
42
• The Gonorrhea incidence rate 37.4 cases per 100,000 population for Sumter County
from 2013-2015, compared to the Florida rate at 112 per 100,000 population.
• HIV incidence rate 6.3 cases per 100,000 population for Sumter County from 2013-
2015, compared to the Florida rate of 23.6 per 100,000 population (Figure 26)
Maternal, Child Health and Adolescent Health
This section provides a summary of various data points that impact the health of mothers and their
child, including into adolescence.
Teen Pregnancy
Sumter County has one of the higher teen
pregnancy rates in the state. As depicted in
image 5, Sumter is an outlier in the Central
Florida region with a teen birth rate of over
24.1 per 1,000, in 2016. Sumter County has
the 17th highest rate of teen births in the state.
With the DOH-Sumter clinic, between 2008
and 2017, teen moms accounted for 14.68%
of all obstetrics (OB) patients. Making teen
moms the third largest age group served in
DOH-Sumter OB clinics.
Overall, Florida has been seeing a steady
184.6
37.46.3
433.4
112
23.6
0
100
200
300
400
500
Chlamydia Gonorrhea HIV
Rat
e p
er 1
00
,00
0
Infectious Disease
Sumter County, Florida Chlamydia, Gonorrhea, and HIV Rates 2013-2015
SumterCounty, FL
Florida
Source: Florida Department of Health. FLHealthCharts.com
Figure 26: Rate per 100,000 Population Select STIs, Sumter County & Florida 2013-2015
Image 5: Map of Florida Teen Birth Rate, 2016
Source: Florida Department of Health. FLHealthCharts.com
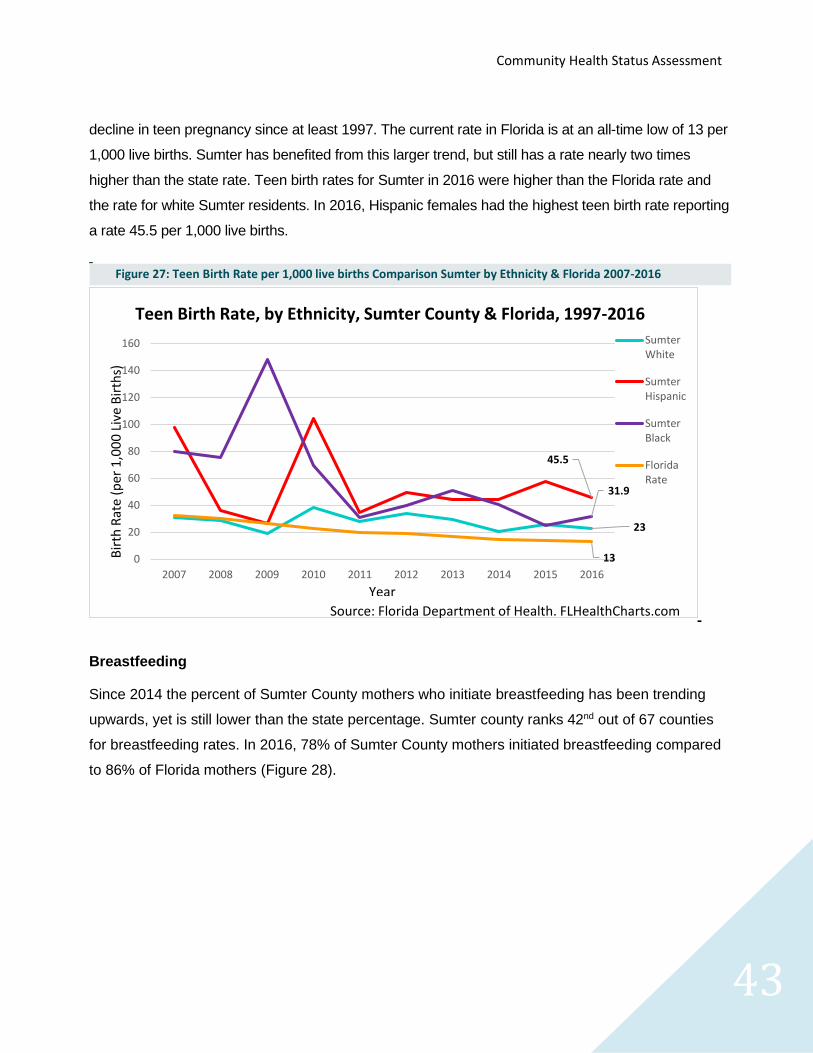
Community Health Status Assessment
43
decline in teen pregnancy since at least 1997. The current rate in Florida is at an all-time low of 13 per
1,000 live births. Sumter has benefited from this larger trend, but still has a rate nearly two times
higher than the state rate. Teen birth rates for Sumter in 2016 were higher than the Florida rate and
the rate for white Sumter residents. In 2016, Hispanic females had the highest teen birth rate reporting
a rate 45.5 per 1,000 live births.
Breastfeeding
Since 2014 the percent of Sumter County mothers who initiate breastfeeding has been trending
upwards, yet is still lower than the state percentage. Sumter county ranks 42nd out of 67 counties
for breastfeeding rates. In 2016, 78% of Sumter County mothers initiated breastfeeding compared
to 86% of Florida mothers (Figure 28).
23
45.5
31.9
130
20
40
60
80
100
120
140
160
2007 2008 2009 2010 2011 2012 2013 2014 2015 2016
SumterWhite
SumterHispanic
SumterBlack
FloridaRate
Teen Birth Rate, by Ethnicity, Sumter County & Florida, 1997-2016
Bir
th R
ate
(p
er 1
,00
0 L
ive
Bir
ths)
Year
Source: Florida Department of Health. FLHealthCharts.com
Figure 27: Teen Birth Rate per 1,000 live births Comparison Sumter by Ethnicity & Florida 2007-2016
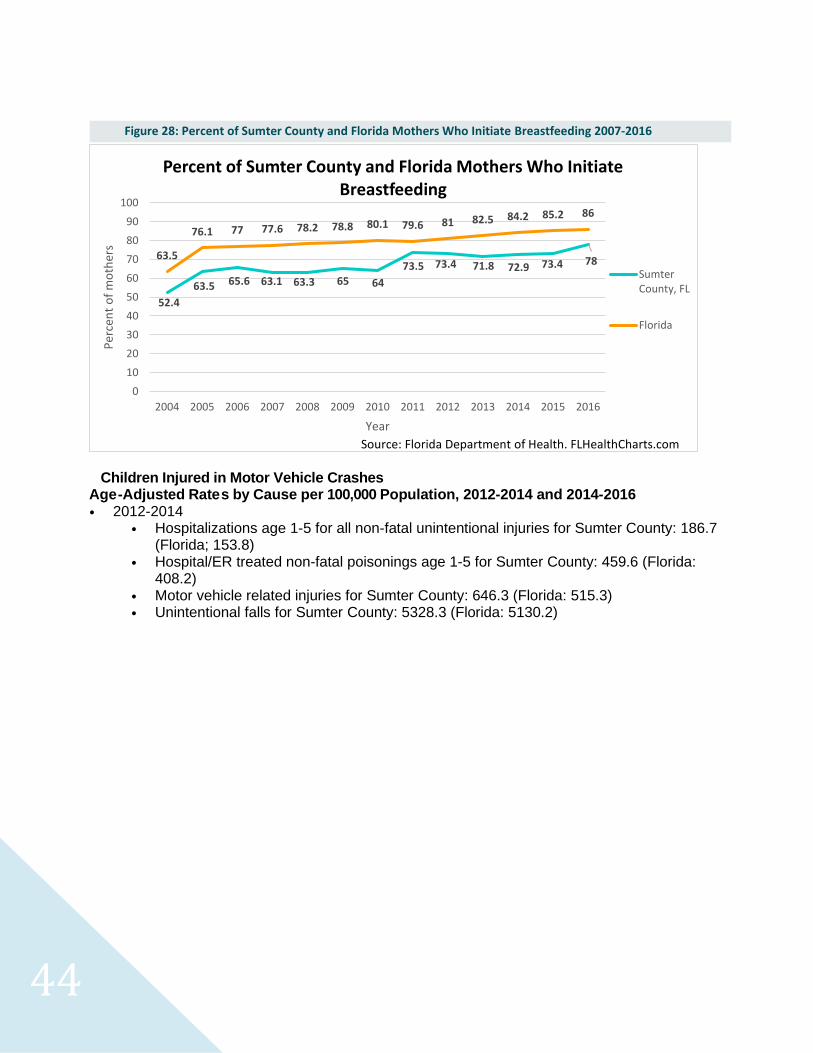
44
Children Injured in Motor Vehicle Crashes Age -Adjusted Rate s by Cause per 100,000 Population, 2012-2014 and 2014-2016 • 2012-2014
• Hospitalizations age 1-5 for all non-fatal unintentional injuries for Sumter County: 186.7 (Florida; 153.8)
• Hospital/ER treated non-fatal poisonings age 1-5 for Sumter County: 459.6 (Florida: 408.2)
• Motor vehicle related injuries for Sumter County: 646.3 (Florida: 515.3) • Unintentional falls for Sumter County: 5328.3 (Florida: 5130.2)
52.4
63.5 65.6 63.1 63.3 65 64
73.5 73.4 71.8 72.9 73.4 7863.5
76.1 77 77.6 78.2 78.8 80.1 79.6 81 82.5 84.2 85.2 86
0
10
20
30
40
50
60
70
80
90
100
2004 2005 2006 2007 2008 2009 2010 2011 2012 2013 2014 2015 2016
Per
cen
t o
f m
oth
ers
Year
Percent of Sumter County and Florida Mothers Who Initiate Breastfeeding
SumterCounty, FL
Florida
Source: Florida Department of Health. FLHealthCharts.com
Figure 28: Percent of Sumter County and Florida Mothers Who Initiate Breastfeeding 2007-2016
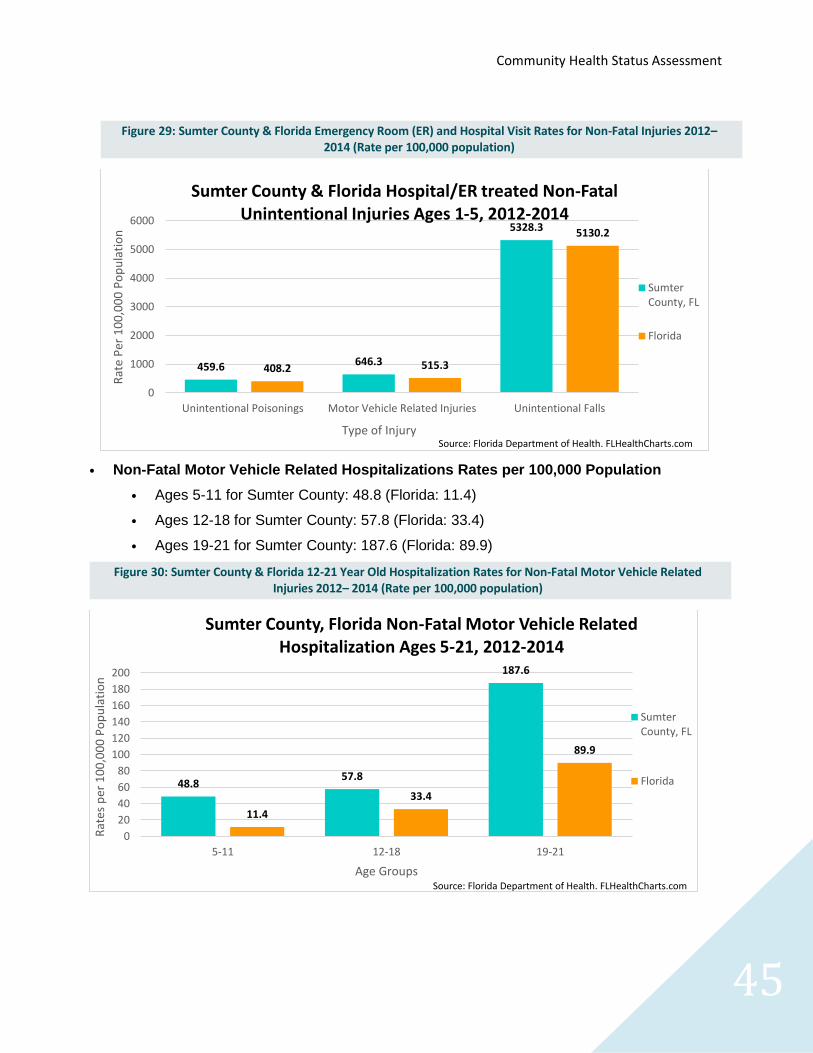
Community Health Status Assessment
45
• Non-Fatal Motor Vehicle Related Hospitalizations Rates per 100,000 Population
• Ages 5-11 for Sumter County: 48.8 (Florida: 11.4)
• Ages 12-18 for Sumter County: 57.8 (Florida: 33.4)
• Ages 19-21 for Sumter County: 187.6 (Florida: 89.9)
459.6 646.3
5328.3
408.2 515.3
5130.2
0
1000
2000
3000
4000
5000
6000
Unintentional Poisonings Motor Vehicle Related Injuries Unintentional Falls
Rat
e P
er 1
00
,00
0 P
op
ula
tio
n
Type of Injury
Sumter County & Florida Hospital/ER treated Non-Fatal Unintentional Injuries Ages 1-5, 2012-2014
SumterCounty, FL
Florida
Source: Florida Department of Health. FLHealthCharts.com
48.857.8
187.6
11.4
33.4
89.9
0
20
40
60
80
100
120
140
160
180
200
5-11 12-18 19-21
Rat
es p
er 1
00
,00
0 P
op
ula
tio
n
Age Groups
Sumter County, Florida Non-Fatal Motor Vehicle Related Hospitalization Ages 5-21, 2012-2014
SumterCounty, FL
Florida
Source: Florida Department of Health. FLHealthCharts.com
Figure 29: Sumter County & Florida Emergency Room (ER) and Hospital Visit Rates for Non-Fatal Injuries 2012– 2014 (Rate per 100,000 population)
Figure 30: Sumter County & Florida 12-21 Year Old Hospitalization Rates for Non-Fatal Motor Vehicle Related Injuries 2012– 2014 (Rate per 100,000 population)
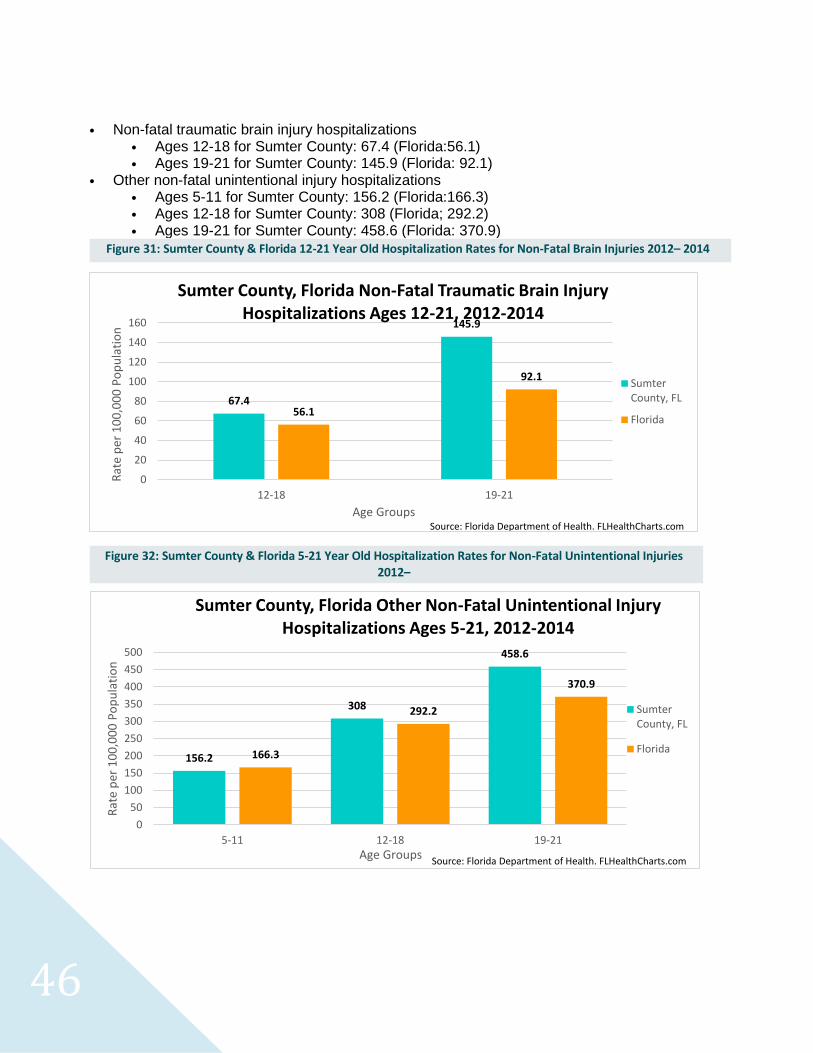
46
• Non-fatal traumatic brain injury hospitalizations • Ages 12-18 for Sumter County: 67.4 (Florida:56.1) • Ages 19-21 for Sumter County: 145.9 (Florida: 92.1)
• Other non-fatal unintentional injury hospitalizations • Ages 5-11 for Sumter County: 156.2 (Florida:166.3) • Ages 12-18 for Sumter County: 308 (Florida; 292.2) • Ages 19-21 for Sumter County: 458.6 (Florida: 370.9)
67.4
145.9
56.1
92.1
0
20
40
60
80
100
120
140
160
12-18 19-21
Rat
e p
er 1
00
,00
0 P
op
ula
tio
n
Age Groups
Sumter County, Florida Non-Fatal Traumatic Brain Injury Hospitalizations Ages 12-21, 2012-2014
SumterCounty, FL
Florida
Source: Florida Department of Health. FLHealthCharts.com
Figure 31: Sumter County & Florida 12-21 Year Old Hospitalization Rates for Non-Fatal Brain Injuries 2012– 2014
Figure 32: Sumter County & Florida 5-21 Year Old Hospitalization Rates for Non-Fatal Unintentional Injuries 2012–
156.2
308
458.6
166.3
292.2
370.9
0
50
100
150
200
250
300
350
400
450
500
5-11 12-18 19-21
Rat
e p
er 1
00
,00
0 P
op
ula
tio
n
Age Groups
Sumter County, Florida Other Non-Fatal Unintentional Injury Hospitalizations Ages 5-21, 2012-2014
SumterCounty, FL
Florida
Source: Florida Department of Health. FLHealthCharts.com
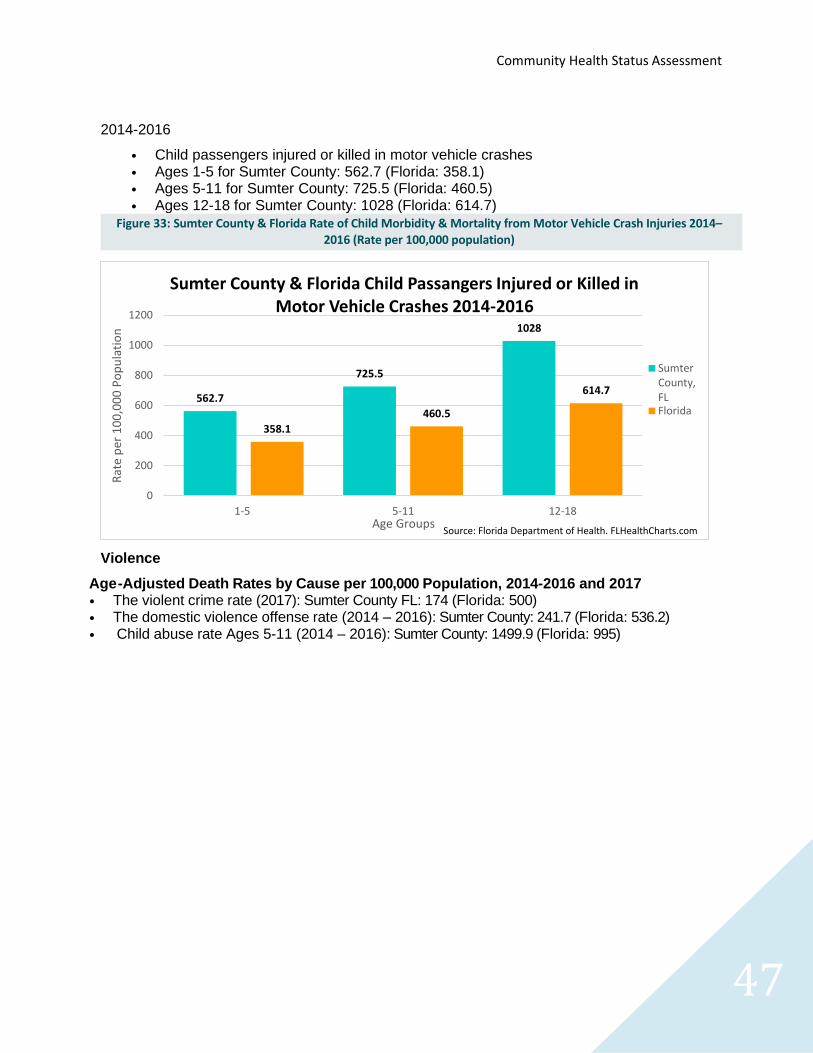
Community Health Status Assessment
47
2014-2016
• Child passengers injured or killed in motor vehicle crashes • Ages 1-5 for Sumter County: 562.7 (Florida: 358.1) • Ages 5-11 for Sumter County: 725.5 (Florida: 460.5) • Ages 12-18 for Sumter County: 1028 (Florida: 614.7)
Violence
Age -Adjusted Death Rates by Cause per 100,000 Population, 2014-2016 and 2017 • The violent crime rate (2017): Sumter County FL: 174 (Florida: 500) • The domestic violence offense rate (2014 – 2016): Sumter County: 241.7 (Florida: 536.2) • Child abuse rate Ages 5-11 (2014 – 2016): Sumter County: 1499.9 (Florida: 995)
562.7
725.5
1028
358.1
460.5
614.7
0
200
400
600
800
1000
1200
1-5 5-11 12-18
Rat
e p
er 1
00
,00
0 P
op
ula
tio
n
Age Groups
Sumter County & Florida Child Passangers Injured or Killed in Motor Vehicle Crashes 2014-2016
SumterCounty,FLFlorida
Source: Florida Department of Health. FLHealthCharts.com
Figure 33: Sumter County & Florida Rate of Child Morbidity & Mortality from Motor Vehicle Crash Injuries 2014– 2016 (Rate per 100,000 population)
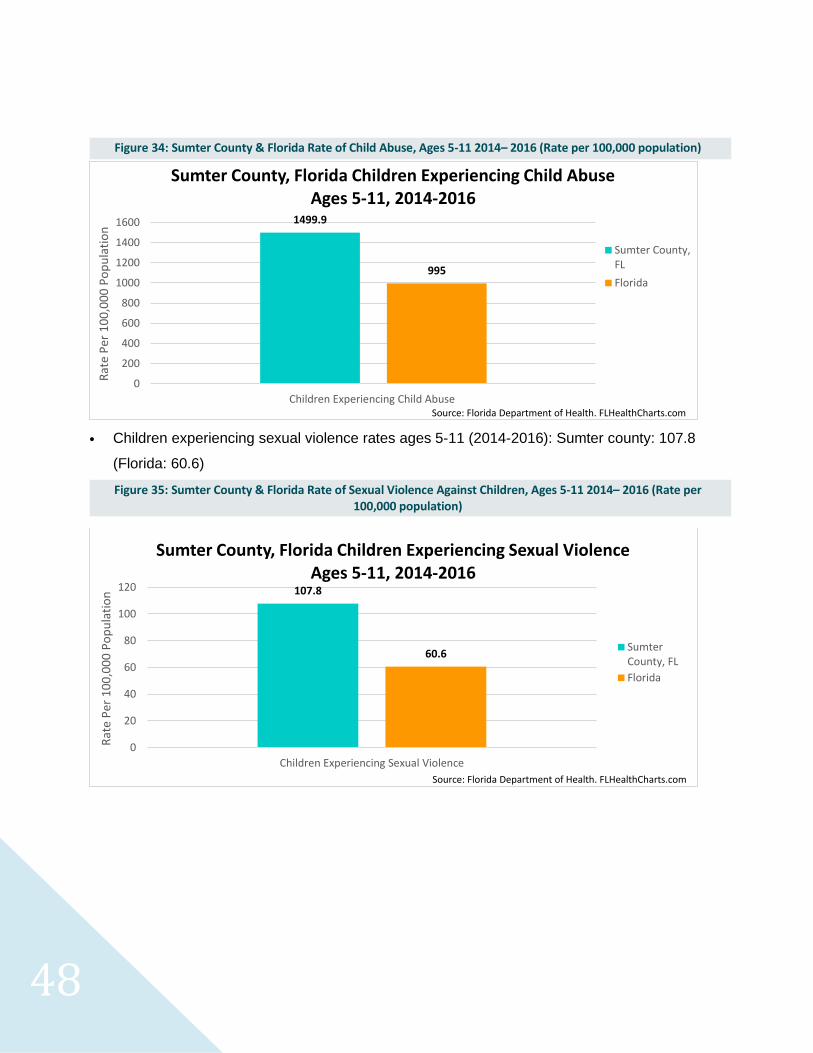
48
• Children experiencing sexual violence rates ages 5-11 (2014-2016): Sumter county: 107.8
(Florida: 60.6)
1499.9
995
0
200
400
600
800
1000
1200
1400
1600
Children Experiencing Child Abuse
Rat
e P
er 1
00
,00
0 P
op
ula
tio
n
Sumter County, Florida Children Experiencing Child Abuse Ages 5-11, 2014-2016
Sumter County,FL
Florida
Source: Florida Department of Health. FLHealthCharts.com
107.8
60.6
0
20
40
60
80
100
120
Children Experiencing Sexual Violence
Rat
e P
er 1
00
,00
0 P
op
ula
tio
n
Sumter County, Florida Children Experiencing Sexual Violence Ages 5-11, 2014-2016
SumterCounty, FL
Florida
Source: Florida Department of Health. FLHealthCharts.com
Figure 34: Sumter County & Florida Rate of Child Abuse, Ages 5-11 2014– 2016 (Rate per 100,000 population)
Figure 35: Sumter County & Florida Rate of Sexual Violence Against Children, Ages 5-11 2014– 2016 (Rate per 100,000 population)
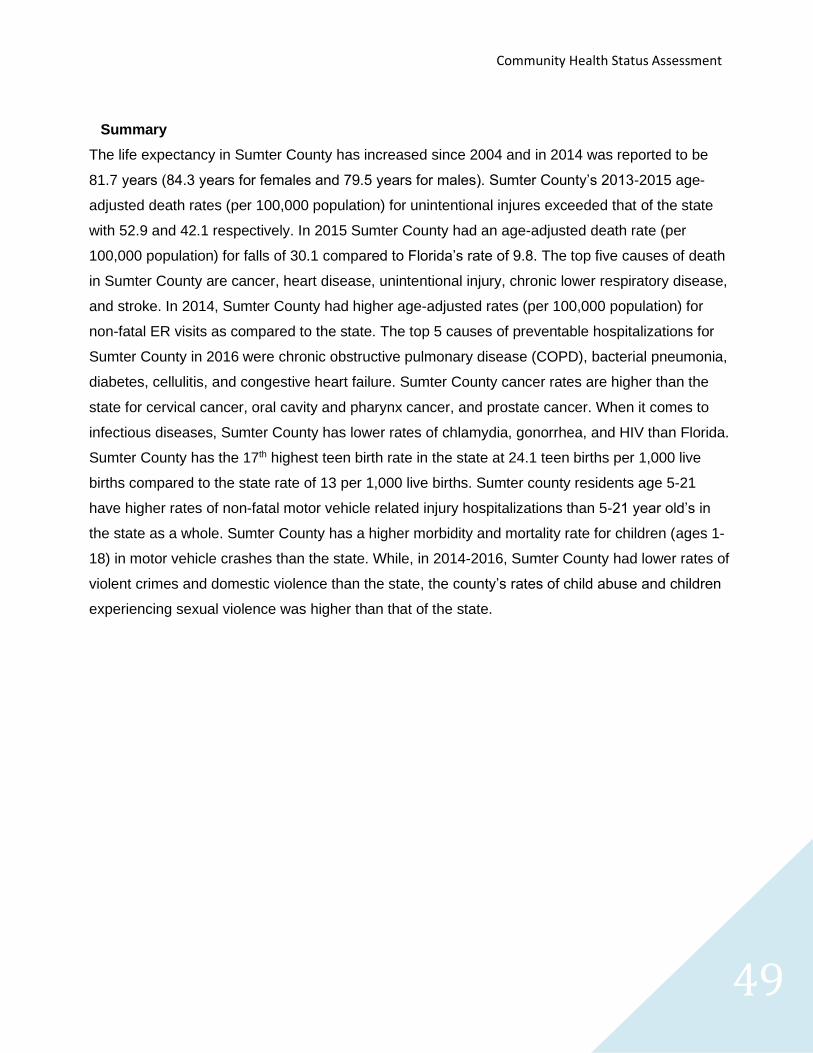
Community Health Status Assessment
49
Summary
The life expectancy in Sumter County has increased since 2004 and in 2014 was reported to be
81.7 years (84.3 years for females and 79.5 years for males). Sumter County’s 2013-2015 age-
adjusted death rates (per 100,000 population) for unintentional injures exceeded that of the state
with 52.9 and 42.1 respectively. In 2015 Sumter County had an age-adjusted death rate (per
100,000 population) for falls of 30.1 compared to Florida’s rate of 9.8. The top five causes of death
in Sumter County are cancer, heart disease, unintentional injury, chronic lower respiratory disease,
and stroke. In 2014, Sumter County had higher age-adjusted rates (per 100,000 population) for
non-fatal ER visits as compared to the state. The top 5 causes of preventable hospitalizations for
Sumter County in 2016 were chronic obstructive pulmonary disease (COPD), bacterial pneumonia,
diabetes, cellulitis, and congestive heart failure. Sumter County cancer rates are higher than the
state for cervical cancer, oral cavity and pharynx cancer, and prostate cancer. When it comes to
infectious diseases, Sumter County has lower rates of chlamydia, gonorrhea, and HIV than Florida.
Sumter County has the 17th highest teen birth rate in the state at 24.1 teen births per 1,000 live
births compared to the state rate of 13 per 1,000 live births. Sumter county residents age 5-21
have higher rates of non-fatal motor vehicle related injury hospitalizations than 5-21 year old’s in
the state as a whole. Sumter County has a higher morbidity and mortality rate for children (ages 1-
18) in motor vehicle crashes than the state. While, in 2014-2016, Sumter County had lower rates of
violent crimes and domestic violence than the state, the county’s rates of child abuse and children
experiencing sexual violence was higher than that of the state.
50
Key Data Findings
Below are key insights from the Community Health Status Assessment section.
• In 2015 Sumter County had an age-adjusted death rate (per 100,000 population) for falls of
30.1 compared to Florida’s rate of 9.8.
• In 2016, Sumter had the highest teen birth rate in the Central Florida region with a teen birth rate
of over 24.1 per 1,000 live births.
• There is a dearth of local data on resident dietary and physical activity habits.
• In 2016, Sumter ranked 42 of 67 counties for mothers who initiate breastfeeding.
• Only 66% of drivers, in Sumter County, were wearing seatbelts, during the 2018 assessment of driver behavior, compared to state average of 90.2% in 2017.
• From 2012-2014 the Sumter hospitalization rate for those age one to five years for all non-fatal
unintentional injuries was 186.7 per 100,000 population. Motor vehicle crash deaths for this
demographic group are also elevated.
• Adult smoking rates in Sumter are low, however E-cig use is on the rise.
• 73.5% of Sumter County residents are 50 years of age or older.
• Lake, Sumter, and Marion Counties lead the state in Falls related deaths.
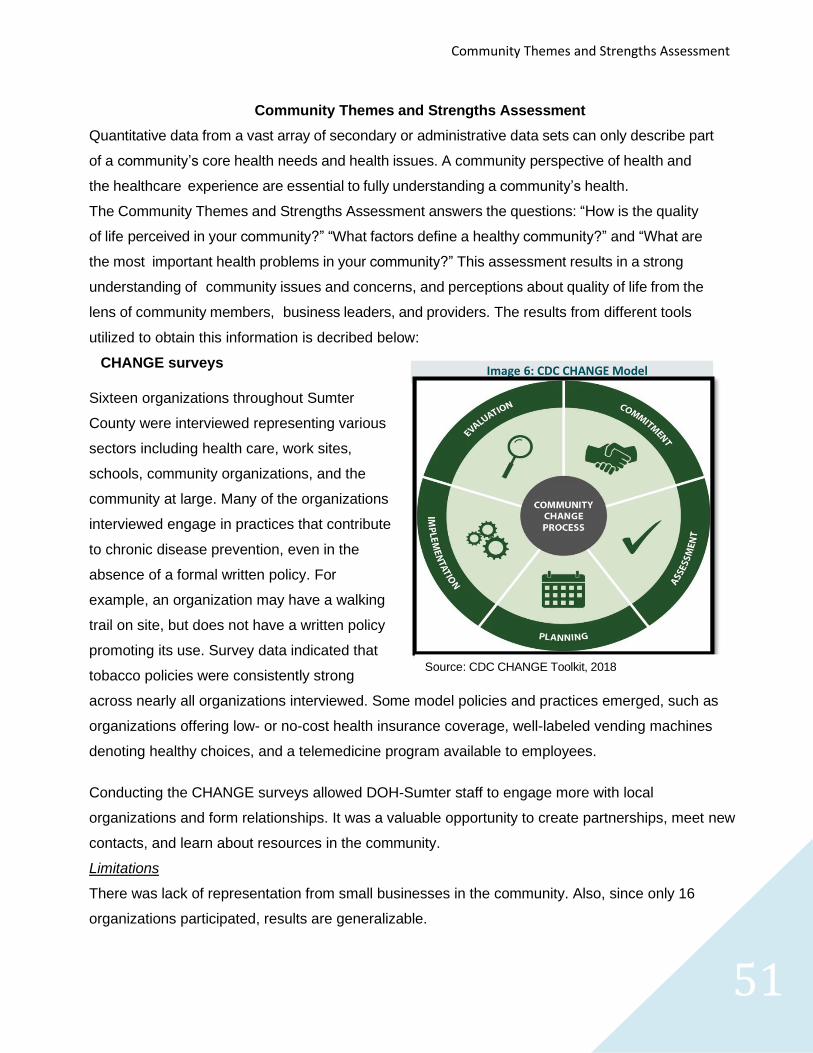
Community Themes and Strengths Assessment
51
Community Themes and Strengths Assessment
Quantitative data from a vast array of secondary or administrative data sets can only describe part
of a community’s core health needs and health issues. A community perspective of health and
the healthcare experience are essential to fully understanding a community’s health.
The Community Themes and Strengths Assessment answers the questions: “How is the quality
of life perceived in your community?” “What factors define a healthy community?” and “What are
the most important health problems in your community?” This assessment results in a strong
understanding of community issues and concerns, and perceptions about quality of life from the
lens of community members, business leaders, and providers. The results from different tools
utilized to obtain this information is decribed below:
CHANGE surveys
Sixteen organizations throughout Sumter
County were interviewed representing various
sectors including health care, work sites,
schools, community organizations, and the
community at large. Many of the organizations
interviewed engage in practices that contribute
to chronic disease prevention, even in the
absence of a formal written policy. For
example, an organization may have a walking
trail on site, but does not have a written policy
promoting its use. Survey data indicated that
tobacco policies were consistently strong
across nearly all organizations interviewed. Some model policies and practices emerged, such as
organizations offering low- or no-cost health insurance coverage, well-labeled vending machines
denoting healthy choices, and a telemedicine program available to employees.
Conducting the CHANGE surveys allowed DOH-Sumter staff to engage more with local
organizations and form relationships. It was a valuable opportunity to create partnerships, meet new
contacts, and learn about resources in the community.
Limitations
There was lack of representation from small businesses in the community. Also, since only 16
organizations participated, results are generalizable.
Image 6: CDC CHANGE Model
Source: CDC CHANGE Toolkit, 2018
52
Sumter Through Your Lens
A total of 248 photos from 49 unique individuals were received. Several themes emerged from the
photos, highlighting community strengths and potential areas of improvement. Themes of
community strengths that emerged included the natural beauty of Sumter County, recreation
opportunities, public safety, and access to healthy foods. Themes identifying areas of improvement
included litter in the community, abandoned property, and local facilities in need of updates and
repairs (e.g., community parks).
All the photos received will be compiled into an electronic presentation for all participants and
community members to view. The presentation will be shared via the DOH-Sumter website.
Limitations
Sample size was limited and it does not represent broader voice of the community. There was also
selection bias as not all the community members were reached by marketing and recruitment
efforts.
Bus Stop Surveys
Results of the bus stop surveys are generalizable. 95 bus stops were assessed and given a score from
0 to 100. The overall average score for bus stops was 63.80
(Range=37.5-81). The most commonly reported issues
included a lack of street lights at bus stops, lack of ramps for
wheelchairs/strollers, and lack of buffers between the bus
stop and the road. Highlights include that very few stray dogs
were seen, high pedestrian visibility, and concrete sidewalks
in good repair (when present).
Limitations
Because the list of bus stops provided by the school board
included both past and present stops, it was sometimes difficult to determine which bus stops were
active and currently being used by students. Also, DOH-Sumter staff could not always determine with
certainty which routes students would be taking to and from the bus stops to properly assess the safety
of the route.
Golf Cart Surveys
Twenty multimodal paths were assessed and given a score from 0 to 100. The overall average score
for paths was 84.9. Commonly reported strengths of the paths include that street crossings were mostly
reported as safe, the multimodal path was fairly continuous throughout the area, and that the flow of
road traffic rarely interfered with the multimodal path traffic. Opportunities for improvement that were
observed include some dark areas on the paths, lack of buffer between the multimodal path and the
Did you know: That Sumter County has the 3rd
lowest rate of adult physical inactivity in the State of Florida? (For more information see the section on
Health Risk Behaviors)
Community Themes and Strengths Assessment
53
road, sharp curves along the paths, and many drivers rolling through stop signs.
Limitations
Because of the sampling method, results are not generalizable to all of the multimodal paths throughout
The Villages community. Further surveys are needed to gain a clearer picture of safety along these
pathways.
Windshield Surveys
DOH-Sumter staff surveyed 5,037 vehicles. The overall rate of seatbelt usage was 66%. This is well
below the percentage seen in Florida and the U.S. which reported seatbelt usage rates of 90.7% and
89.7%, respectively in 2017 (U.S. Department of Transportation, 2018). The rate of drivers not wearing
seatbelts was 14%. With about 20% of vehicles surveyed, it was not clear whether the driver was
wearing a seatbelt or not, so these were listed as unknown. Large variability in seatbelt usage by
census tract was observed, with a range of 45%-81%.
Limitations
Results of the windshield surveys are not generalizable due to sampling method. Intersections and
roads to observe were not chosen at random and there is an unknown denominator for Sumter County
drivers. As mentioned, there was some difficulty in observing seatbelt usage for every vehicle that
passed due to limited visibility. Visibility was at times affected by sunlight glaring off vehicle
windshields, cars driving by too fast, or dark tinted windows. Even with multiple staff observing the
same vehicles, not all driver behavior could be measured with confidence.
Walkability Surveys
Eighteen routes were assessed and given a score of 0 to 100. The overall average score for walkability
surveys was 67.5 (Range=43.1-87). The most commonly reported issues included litter and debris along
roadways, inconsistent paved sidewalks, lack of crosswalks or faded crosswalks, and lack of street
lights. Staff observed that when paved sidewalks were present, they were in good repair. In many
instances, staff also noted that due to the rural nature of Sumter County crosswalks and street lights
may not always be warranted. On many routes, very little vehicle traffic was observed.
Limitations
Results of the walkability surveys are not generalizable to the community at large due to sampling
method. It is also recognized that many of the survey responses are subjective, and based on the
perceptions of the surveyor. Staff communicated about having common criteria for survey measures,
but individual bias could still have some influence on responses.
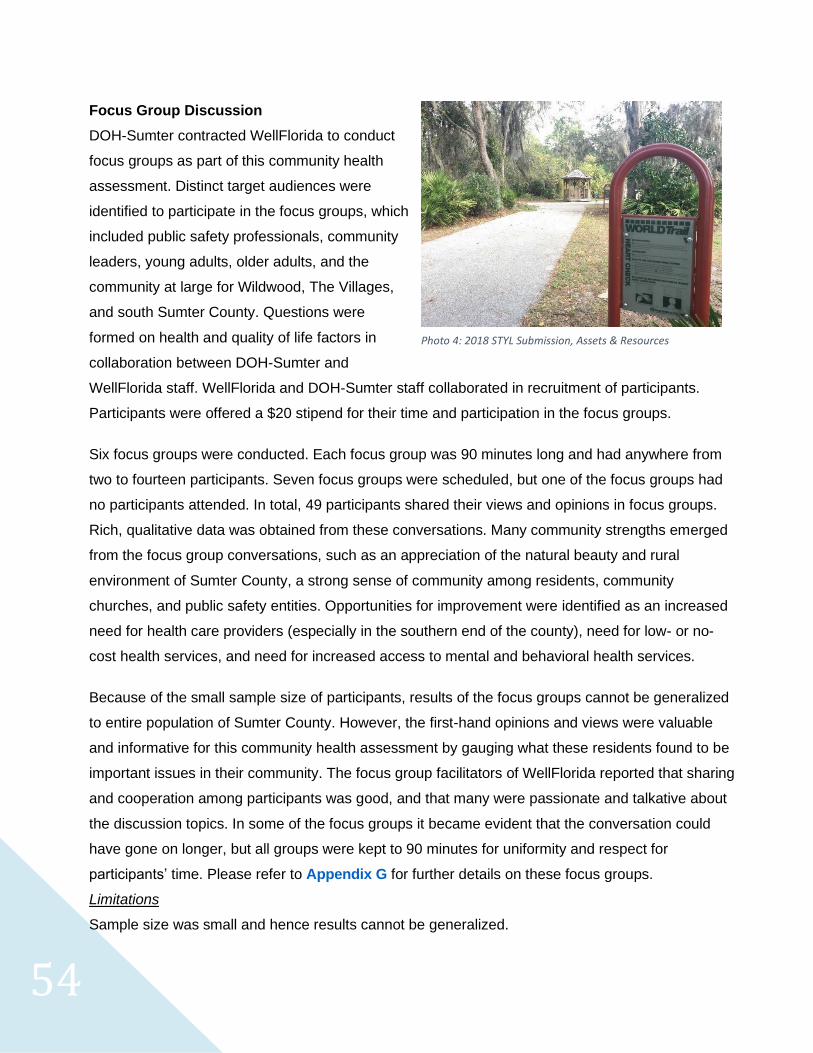
54
Focus Group Discussion
DOH-Sumter contracted WellFlorida to conduct
focus groups as part of this community health
assessment. Distinct target audiences were
identified to participate in the focus groups, which
included public safety professionals, community
leaders, young adults, older adults, and the
community at large for Wildwood, The Villages,
and south Sumter County. Questions were
formed on health and quality of life factors in
collaboration between DOH-Sumter and
WellFlorida staff. WellFlorida and DOH-Sumter staff collaborated in recruitment of participants.
Participants were offered a $20 stipend for their time and participation in the focus groups.
Six focus groups were conducted. Each focus group was 90 minutes long and had anywhere from
two to fourteen participants. Seven focus groups were scheduled, but one of the focus groups had
no participants attended. In total, 49 participants shared their views and opinions in focus groups.
Rich, qualitative data was obtained from these conversations. Many community strengths emerged
from the focus group conversations, such as an appreciation of the natural beauty and rural
environment of Sumter County, a strong sense of community among residents, community
churches, and public safety entities. Opportunities for improvement were identified as an increased
need for health care providers (especially in the southern end of the county), need for low- or no-
cost health services, and need for increased access to mental and behavioral health services.
Because of the small sample size of participants, results of the focus groups cannot be generalized
to entire population of Sumter County. However, the first-hand opinions and views were valuable
and informative for this community health assessment by gauging what these residents found to be
important issues in their community. The focus group facilitators of WellFlorida reported that sharing
and cooperation among participants was good, and that many were passionate and talkative about
the discussion topics. In some of the focus groups it became evident that the conversation could
have gone on longer, but all groups were kept to 90 minutes for uniformity and respect for
participants’ time. Please refer to Appendix G for further details on these focus groups.
Limitations
Sample size was small and hence results cannot be generalized.
Photo 4: 2018 STYL Submission, Assets & Resources
Forces of Change Assessment
55
Forces of Change Assessment
Introduction
The Forces of Change Assessment (FoC) is used to
help identify forces that can affect the community and
local public health system either now or in the future.
Forces in the form of trends, factors, or events are
identified along with the opportunities or threats they
pose. The FoC aims to answer the following questions:
What is occurring or might occur that affects the health
of the community or the local public health system?
What specific threats or opportunities are generated by
these occurrences?
Method
See MAPP Process, Phase 3, Subheading D FoC.
Summary
The identified forces and associated opportunities and threats were compiled into a chart that can
be found in appendix K. Forces identified by steering committee members were grouped into
fourteen main forces: natural disasters, driver safety, car seat safety, school safety, flu epidemics,
opioid crisis, injury related hospital visits (especially falls) related, breastfeeding rates, access to
telemedicine/virtual health care, lack of dental services, access to healthy foods, access to public
transportation, lack of mental health services and lack of garbage/recycling disposal facilities.
Threats and/or opportunities were identified for all but six of the forces discussed. During the
subcommittee meeting members further elaborated on the previously identified forces. Providing
information on programs that currently exist to address the forces of concern as well as to identify
gaps and barriers related to these programs. In total, subcommittee members discussed four main
forces: falls, breastfeeding rates, mental health and the opioid crisis, and public transportation
(including car seat safety). A common gap/barrier identified during the discussion was a lack of
resources and/or a lack of awareness of available resources. A poll was conducted to rate forces on
impact and feasibility. Results from the poll were analyzed and an impact score, feasibility score and
total score was assigned to each force allowing for the forces to be ranked (Appendix K: image K1,
image K2, image K3). Falls, opioid crisis, and breastfeeding rates ranked highest in impact scores.
Falls, car seat safety and natural disasters ranked highest in feasibility scores. When the impact
score and feasibility scores were both taken into account, falls ranked highest followed by car seat
safety and breastfeeding rates.
Did you know: Did you know that Sumter, with
a median age of 66.6, is the oldest county in the US?
(For more information see the section on Demographics)
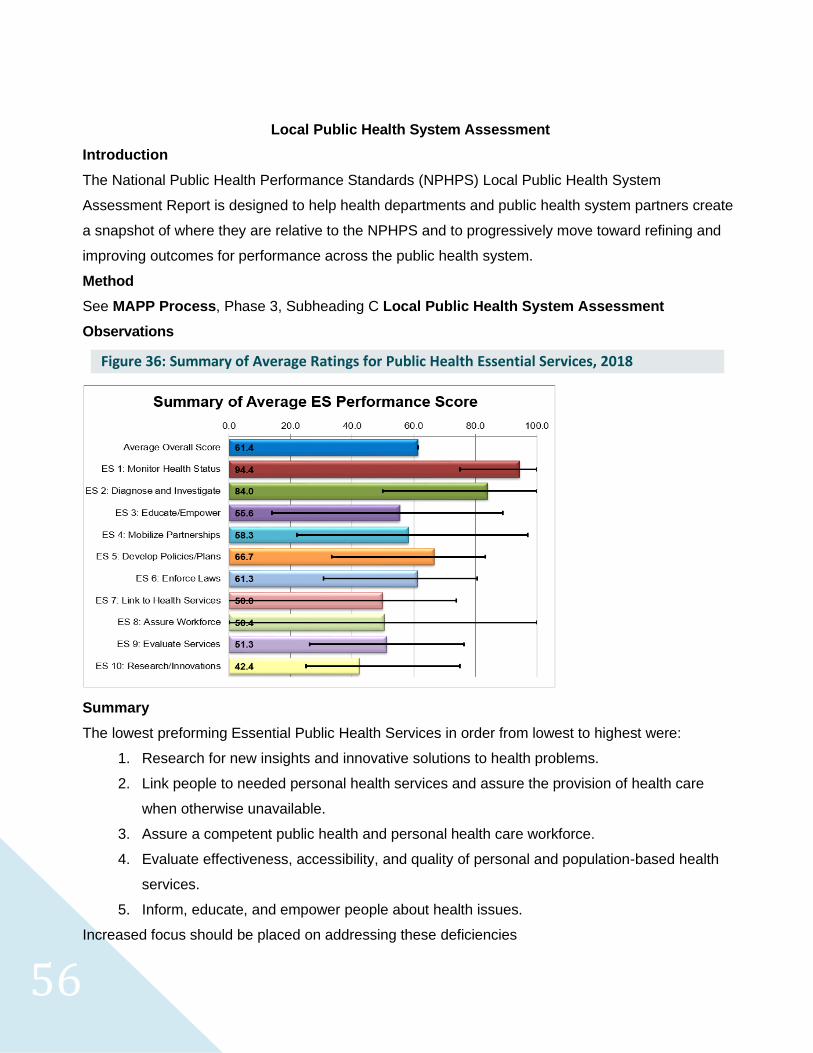
56
Local Public Health System Assessment
Introduction
The National Public Health Performance Standards (NPHPS) Local Public Health System
Assessment Report is designed to help health departments and public health system partners create
a snapshot of where they are relative to the NPHPS and to progressively move toward refining and
improving outcomes for performance across the public health system.
Method
See MAPP Process, Phase 3, Subheading C Local Public Health System Assessment
Observations
Summary
The lowest preforming Essential Public Health Services in order from lowest to highest were:
1. Research for new insights and innovative solutions to health problems.
2. Link people to needed personal health services and assure the provision of health care
when otherwise unavailable.
3. Assure a competent public health and personal health care workforce.
4. Evaluate effectiveness, accessibility, and quality of personal and population-based health
services.
5. Inform, educate, and empower people about health issues.
Increased focus should be placed on addressing these deficiencies
Figure 36: Summary of Average Ratings for Public Health Essential Services, 2018
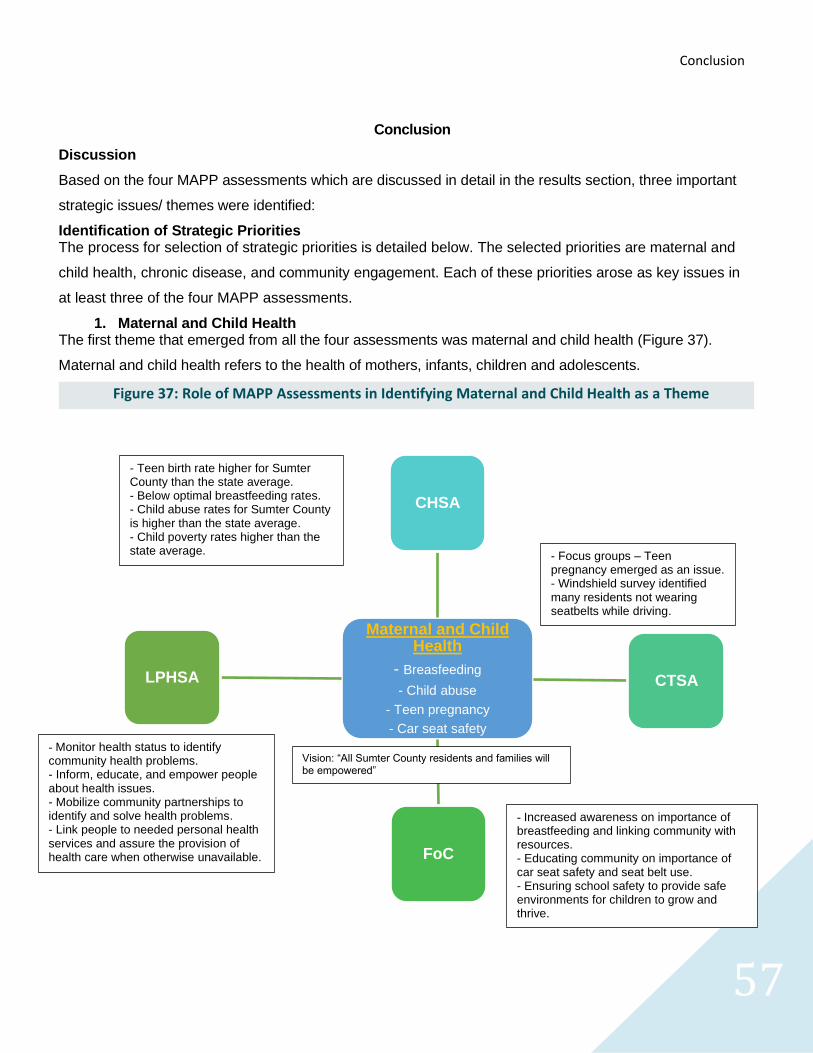
Conclusion
57
Conclusion
Discussion
Based on the four MAPP assessments which are discussed in detail in the results section, three important
strategic issues/ themes were identified:
Identification of Strategic Priorities The process for selection of strategic priorities is detailed below. The selected priorities are maternal and
child health, chronic disease, and community engagement. Each of these priorities arose as key issues in
at least three of the four MAPP assessments.
1. Maternal and Child Health The first theme that emerged from all the four assessments was maternal and child health (Figure 37).
Maternal and child health refers to the health of mothers, infants, children and adolescents.
Figure 37: Role of MAPP Assessments in Identifying Maternal and Child Health as a Theme
Maternal and Child Health
- Breasfeeding
- Child abuse
- Teen pregnancy
- Car seat safety
CHSA
CTSA
FoC
LPHSA
- Monitor health status to identify community health problems. - Inform, educate, and empower people about health issues. - Mobilize community partnerships to identify and solve health problems. - Link people to needed personal health services and assure the provision of health care when otherwise unavailable.
- Increased awareness on importance of breastfeeding and linking community with resources. - Educating community on importance of car seat safety and seat belt use. - Ensuring school safety to provide safe environments for children to grow and thrive.
- Focus groups – Teen pregnancy emerged as an issue. - Windshield survey identified many residents not wearing seatbelts while driving.
- Teen birth rate higher for Sumter County than the state average. - Below optimal breastfeeding rates. - Child abuse rates for Sumter County is higher than the state average. - Child poverty rates higher than the state average.
Vision: “All Sumter County residents and families will be empowered”
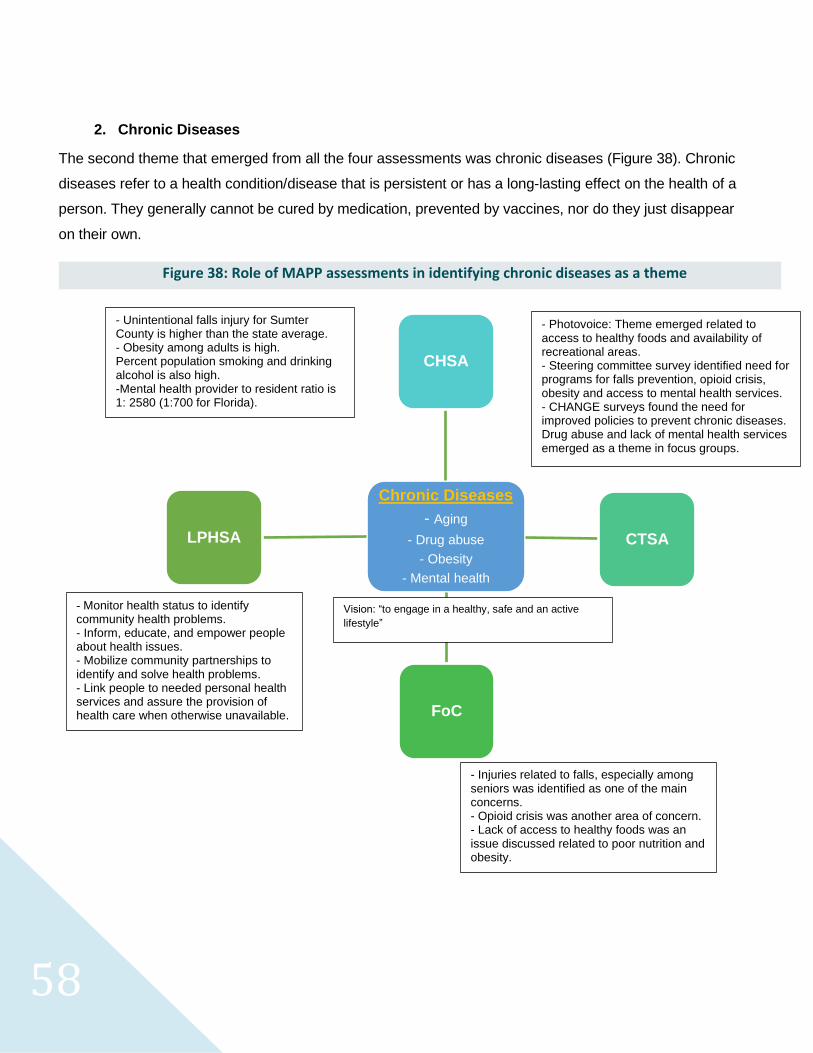
58
2. Chronic Diseases
The second theme that emerged from all the four assessments was chronic diseases (Figure 38). Chronic
diseases refer to a health condition/disease that is persistent or has a long-lasting effect on the health of a
person. They generally cannot be cured by medication, prevented by vaccines, nor do they just disappear
on their own.
Figure 38: Role of MAPP assessments in identifying chronic diseases as a theme
Chronic Diseases
- Aging
- Drug abuse
- Obesity
- Mental health
CHSA
CTSA
FoC
LPHSA
- Monitor health status to identify community health problems. - Inform, educate, and empower people about health issues. - Mobilize community partnerships to identify and solve health problems. - Link people to needed personal health services and assure the provision of health care when otherwise unavailable.
- Injuries related to falls, especially among seniors was identified as one of the main concerns. - Opioid crisis was another area of concern. - Lack of access to healthy foods was an issue discussed related to poor nutrition and obesity.
- Photovoice: Theme emerged related to access to healthy foods and availability of recreational areas. - Steering committee survey identified need for programs for falls prevention, opioid crisis, obesity and access to mental health services. - CHANGE surveys found the need for improved policies to prevent chronic diseases. Drug abuse and lack of mental health services emerged as a theme in focus groups.
- Unintentional falls injury for Sumter County is higher than the state average. - Obesity among adults is high. Percent population smoking and drinking alcohol is also high. -Mental health provider to resident ratio is 1: 2580 (1:700 for Florida).
Vision: “to engage in a healthy, safe and an active
lifestyle”
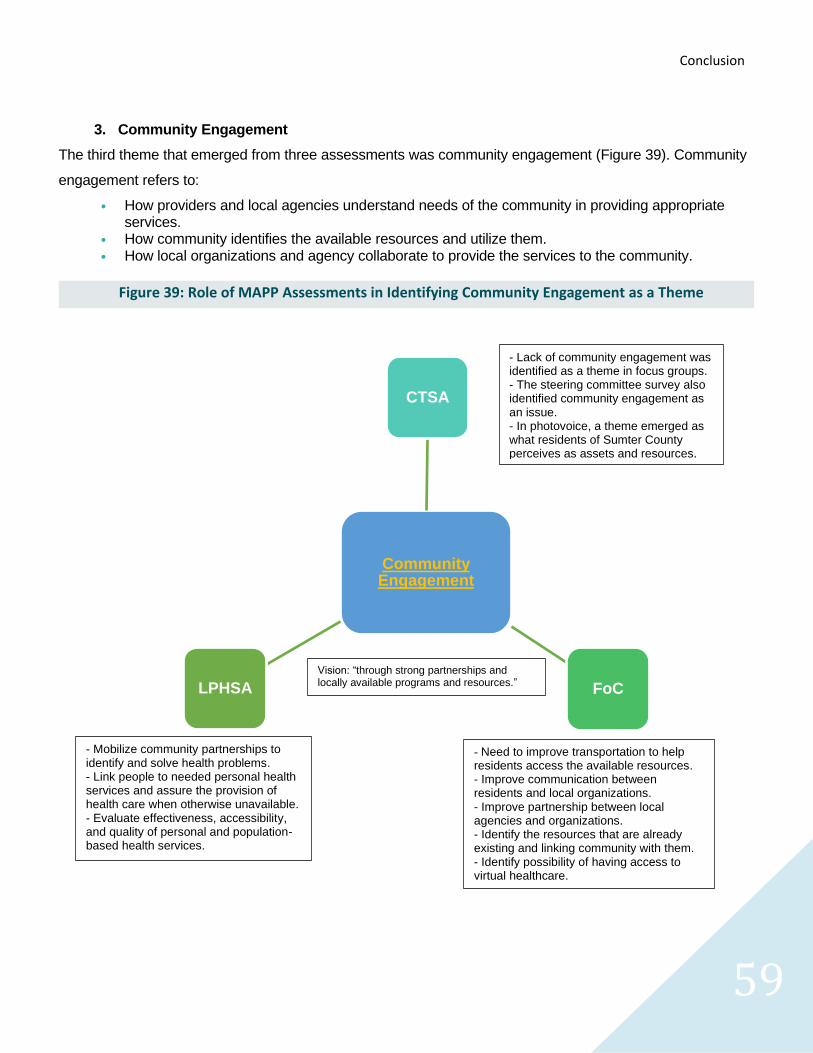
Conclusion
59
3. Community Engagement
The third theme that emerged from three assessments was community engagement (Figure 39). Community
engagement refers to:
• How providers and local agencies understand needs of the community in providing appropriate services.
• How community identifies the available resources and utilize them. • How local organizations and agency collaborate to provide the services to the community.
Figure 39: Role of MAPP Assessments in Identifying Community Engagement as a Theme
Community Engagement
CTSA
FoCLPHSA
- Mobilize community partnerships to identify and solve health problems. - Link people to needed personal health services and assure the provision of health care when otherwise unavailable. - Evaluate effectiveness, accessibility, and quality of personal and population-based health services.
- Need to improve transportation to help residents access the available resources. - Improve communication between residents and local organizations. - Improve partnership between local agencies and organizations. - Identify the resources that are already existing and linking community with them. - Identify possibility of having access to virtual healthcare.
- Lack of community engagement was identified as a theme in focus groups. - The steering committee survey also identified community engagement as an issue. - In photovoice, a theme emerged as what residents of Sumter County perceives as assets and resources.
Vision: “through strong partnerships and locally available programs and resources.”
60
Summary and Conclusion
After reviewing the four assessments and identifying key theme areas, the CHA team settled on prioritizing
the following topics under each theme.
Maternal and Child Health
1. Breastfeeding
Current data: Percent of mothers who initiate breastfeeding (2016): 78% for Sumter County (86% for
Florida). Sumter county ranks 42nd out of 67 counties for breastfeeding rates.
Current programs in Sumter County: Sumter Making Our Mothers Stronger (MOMS) with DOH-Sumter for
pregnant and lactating mothers. Healthy Start in Sumter County for children 0-3 years, WIC.
Gaps: There is lack of awareness among residents about the current programs and services provided in
Sumter County. There is also lack of awareness on the importance of breastfeeding.
2. Child abuse
Current data: Child abuse rate per 100,000 population ages 5-11 years (2014 – 2016): 1499.9 for Sumter
County (995 for Florida).
Current programs in Sumter County: Department of Children and Families provides support and services to
families affected by child abuse.
Gaps: There are no further existing programs or awareness campaigns in Sumter County to work on the
issues of child abuse/neglect.
3. Teen pregnancy
Current data: Teen birth rate for Sumter County: 24.1 per 1,000 live births in 2016. Sumter County has the
17th highest rate of teen births in the state.
Current programs in Sumter County: There are no existing programs in Sumter County specifically for
prevention for teen pregnancy.
Gaps: There is a lack of existing programs specific for teen mothers.
4. Car seat safety
Current data: Non-fatal motor vehicle related hospitalizations, ages 5-11 years: 48.8 for Sumter County
(Florida: 11.4).
Conclusion
61
Child passengers ages 1-5 years injured or killed in motor vehicle crashes: 562.7 for Sumter County
(Florida: 358.1); 5-11 years: 725.5 Sumter County (Florida: 460.5).
Current programs in Sumter County: Early Learning Coalition, Healthy Start, and Sumter County Sheriff’s
Office have car seat safety check programs.
Gaps: There is a lack of awareness among residents about existing programs available in Sumter County
and a high rate of car seat misuse, per report of Early Learning Coalition partners.
Chronic Diseases
1. Aging
Current data: Age-adjusted death rates per 100,000 population for falls (unintentional): 30.05 for Sumter
(Florida: 9.55).
Age-adjusted hospitalization rates per 100,000 population for falls (unintentional): 229.44 for Sumter
(Florida: 256.88).
The median age for Sumter county residents is 66.6 years old.
Current programs in Sumter County: Elder Options offers a falls prevention program called Matter of
Balance. Sumter County Sheriff’s Office has the Vial of Life program.
Gaps: There is lack of local resources on falls prevention. There is an opportunity to improve communication
between residents and organizations about existing programs. More than 50% of Sumter County residents
are older adults and there is a clear need for offering home assessments to address risks for falls.
2. Drug abuse
Current data: For 2017, 15% of adults drank excessively in Sumter County compared to 18% in Florida.
Also, 10% of adults in Sumter County smoke, compared to 15% in Florida for 2017.
Current programs in Sumter County: Sumter CAP, Tobacco Free Florida through DOH-Sumter, Langley
Health Services withdrawal treatment program, Celebrate Recovery through local churches, and programs
with LifeStream Behavioral.
Gaps: There are no programs on prevention of drugs and opioid use. There is a need to develop programs
for drugs and opioid use for Sumter residents, especially for the youth.
62
3. Obesity
Current data: 26.2% of adults in Sumter County are obese (26.4% in Florida). 19% of adults in Sumter
County are physically inactive and 18% do not have access to exercise opportunities.
Current programs in Sumter County: There are no community-wide programs addressing obesity in Sumter
County.
Gaps: There is a need to develop programs to reduce obesity and improve access to healthy foods.
4. Access to mental health services
Current data: Ratio of mental health providers to patients in Sumter County is 1: 2,580 patients (2017).
Florida’s ratio is 1 provider to 700 patients.
Current programs: Residents can receive mental health services at LifeStream Behavioral, but there are no further
programs for mental health.
Gaps: There is a need to develop programs to improve access to mental health services.
Community Engagement
Current data: None.
Current programs: While there are opportunities in The Villages neighborhoods for community engagement
(social events, information-sharing events, etc.), other neighborhoods of Sumter County do not have access
to the same programs and resources.
Gaps: There are low rates of participation in existing programs by community members county-wide.
Next Steps
The CHA team will meet consistently with steering committee members and other partners to strengthen
existing programs and develop additional programs where needed. Marketing strategies will also be
developed to increase community engagement for all residents of Sumter County. Please refer to the best
practices section to learn about evidence-based programs based on the identified themes (Appendix N).
Acknowledgments
63
Acknowledgments
This report would not have been possible without the generous support and partnership of the
following individuals and organizations:
• Chris Leibner (Lake- Sumter State College)
• City of Bushnell
• City of Center Hill
• City of Webster
• City of Wildwood
• Daniel Richwine (First Assembly of God of Sumterville)
• James Kim (University of South Florida)
• Jessica Cole (Kids Central Inc.)
• Lake Sumter State College
• Langley Health Services
• Love N’ Hugs
• New Covenant United Methodist Church
• Oxford Assembly of God
• Sumter County Board of County Commissioners
• Sumter County Medical Reserve Corp (MRC)
• Sumter County Youth Center
• The Villages Regional Hospital
• WellFlorida: Health Council of North Central Florida
64
References
Florida Department of Health, FLHealthCharts. (2018). FLHealthCharts: Community Health Assessment Resource Tool Set. Retrieved from http://www.flhealthcharts.com/charts/QASpecial.aspx
Florida Youth Tobacco Survey (FYTS). (n.d.). Retrieved from http://www.floridahealth.gov/statistics-and-data/survey-data/florida-youth-survey/florida-youth-tobacco-survey/index.html
Floridatracking.com. (2018). Florida Department of Health - Public Health Tracking System. [online] Available at: https://www.floridatracking.com/healthtracking/ [Accessed 1 Apr. 2018].
Haddad, Y. K., Bergen, G., & Florence, C. S. (2018). Estimating the Economic Burden Related to Older Adult Falls by State. Journal of Public Health Management and Practice, 1. doi:10.1097/phh.0000000000000816
McDavid, J. C., & Hawthorn, L. R. (2013). Program evaluation and performance measurement: An introduction to practice. Thousand Oaks, CA: SAGE.
NACCHO. (n.d). Phase 3: Collecting and Analyzing Data. Retrieved from https://www.naccho.org/programs/public-health-infrastructure/performance-improvement/community-health-assessment/mapp/phase-3-the-four-assessments
NCCDPHP: Community Health. (2018, March 23). Retrieved from www.cdc.gov/nccdphp/dch/programs/healthycommunitiesprogram/tools/change.htm
Nelson, S. J., Wolf, B. C., Sheppard, R. G., Jones, K. T., Heidt, W., & Whitmore, C. (2017). Drugs identified in deceased persons (United States of America, Florida Department of Law Enforcement, Medical Examiners Commission). FL.
United Way of Florida. (2017). ALICE Report- 2017 Update for Florida. Retrieved from http://www.uwof.org/sites/uwof.org/files/17UW%20ALICE%20Report_FL%20Update_2.14.17_Lowres_0.pdf
U.S. Census Bureau. (2018). American FactFinder - Search. [online] Factfinder.census.gov. Available at: https://factfinder.census.gov/faces/nav/jsf/pages/searchresults.xhtml?refresh=t [Accessed 1 May 2018].
U.S. Department of Transportation, National Highway Traffic Safety Administration. (n.d.). Traffic safety facts: Seat belt use in 2017—overall results (DOT HS 812 465). Washington, D.C.: NHTSA, National Center for Statistics and Analysis. Available at: https://crashstats.nhtsa.dot.gov/Api/Public/ViewPublication/812546 [Accessed 1 May 2018].
Appendices
65
Appendices
A. Full List of Sumter County MAPP Steering Committee Organizations
B. Visioning Results
C. Bus Stop Survey Assessment Tool
D. Golf Cart Survey Assessment Tool
E. Windshield Survey Assessment Tool
F. Walkability Survey Assessment Tool
G. 2018 Focus Group Report
H. 2018 Steering Committee Survey Assessment Tool
I. 2018 Steering Committee Survey Results
J. Local Public Health Assessment Results
K. Forces of Change Assessment
L. 2018 Steering Committee Meeting Sign-in Sheet
M. 2018 Steering Committee Meeting Minutes
N. 2018 Best Practices Recommendations
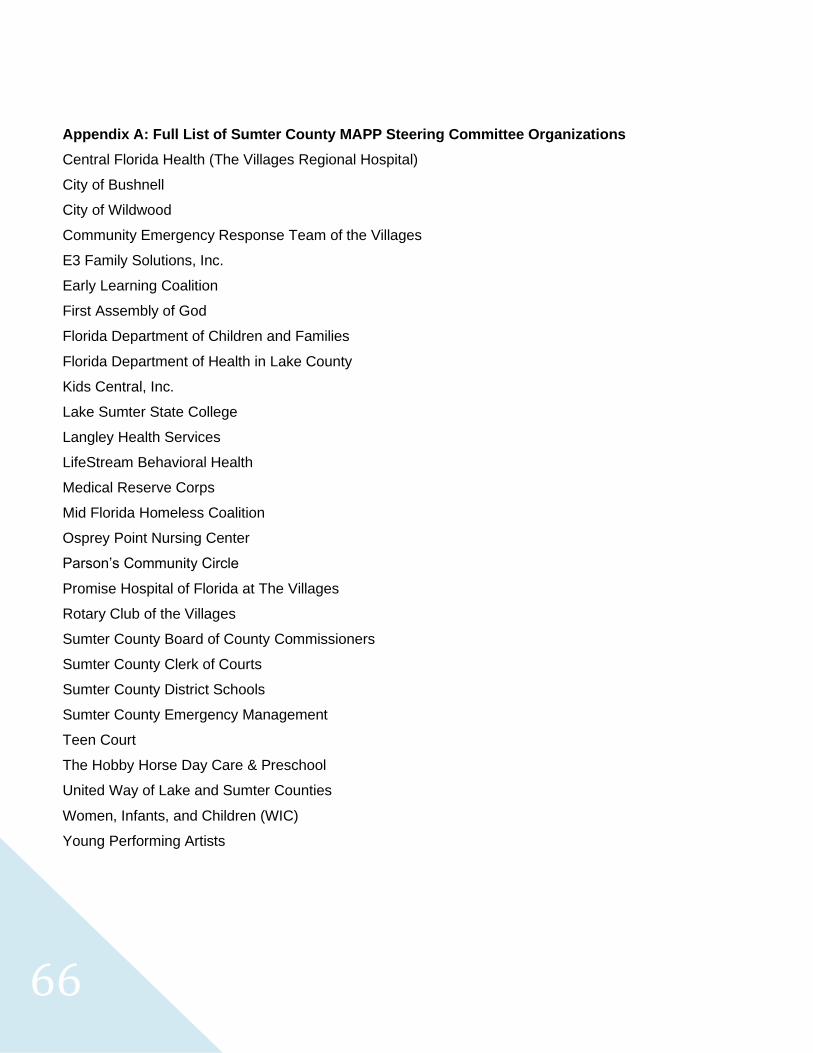
66
Appendix A: Full List of Sumter County MAPP Steering Committee Organizations
Central Florida Health (The Villages Regional Hospital)
City of Bushnell
City of Wildwood
Community Emergency Response Team of the Villages
E3 Family Solutions, Inc.
Early Learning Coalition
First Assembly of God
Florida Department of Children and Families
Florida Department of Health in Lake County
Kids Central, Inc.
Lake Sumter State College
Langley Health Services
LifeStream Behavioral Health
Medical Reserve Corps
Mid Florida Homeless Coalition
Osprey Point Nursing Center
Parson’s Community Circle
Promise Hospital of Florida at The Villages
Rotary Club of the Villages
Sumter County Board of County Commissioners
Sumter County Clerk of Courts
Sumter County District Schools
Sumter County Emergency Management
Teen Court
The Hobby Horse Day Care & Preschool
United Way of Lake and Sumter Counties
Women, Infants, and Children (WIC)
Young Performing Artists
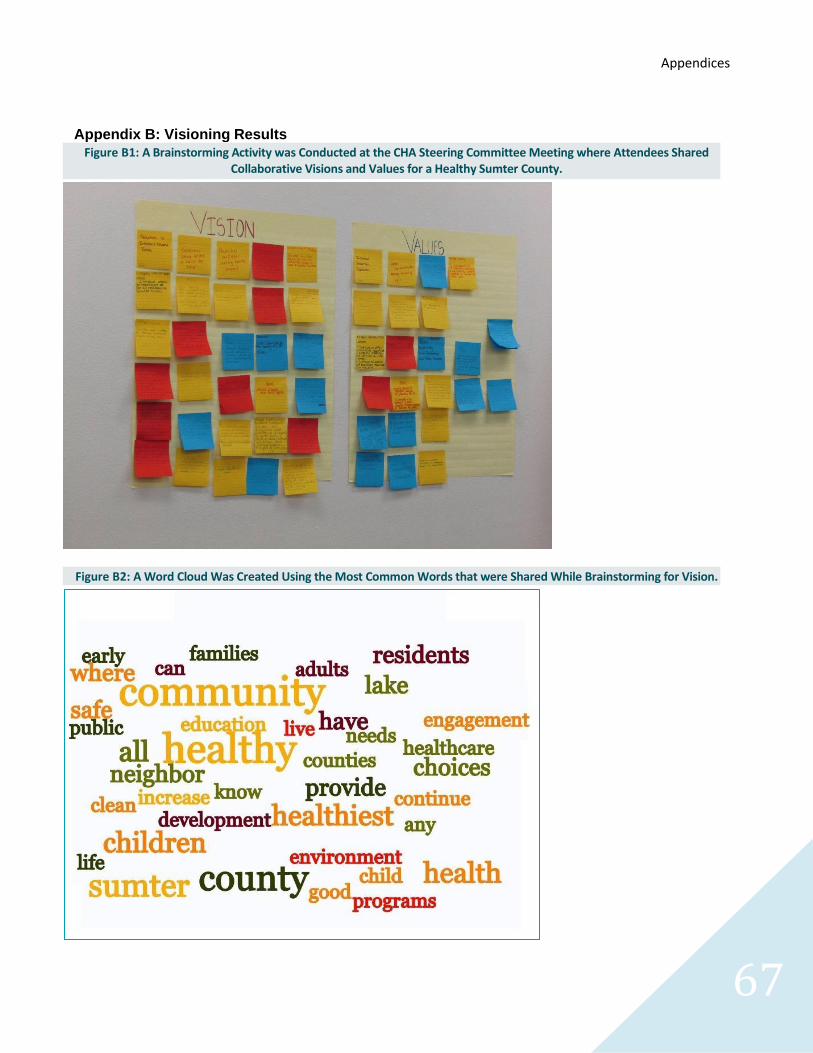
Appendices
67
Appendix B: Visioning Results
Figure B1: A Brainstorming Activity was Conducted at the CHA Steering Committee Meeting where Attendees Shared Collaborative Visions and Values for a Healthy Sumter County.
Figure B2: A Word Cloud Was Created Using the Most Common Words that were Shared While Brainstorming for Vision.
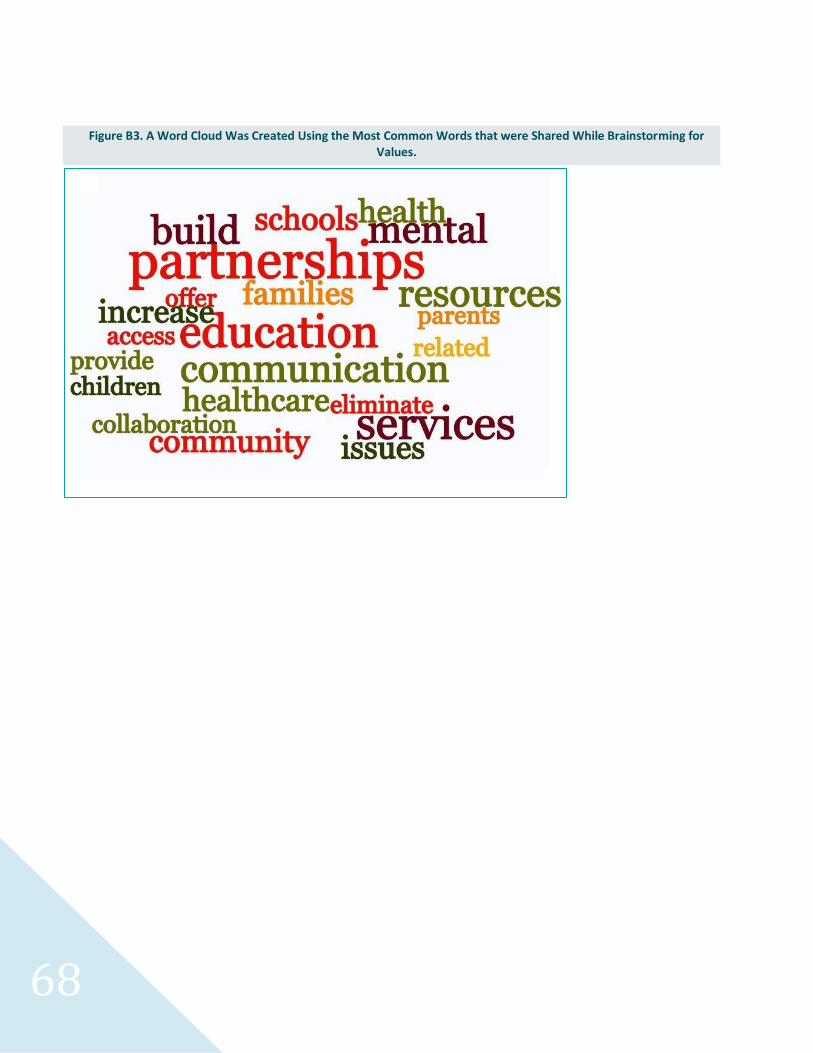
68
Figure B3. A Word Cloud Was Created Using the Most Common Words that were Shared While Brainstorming for Values.
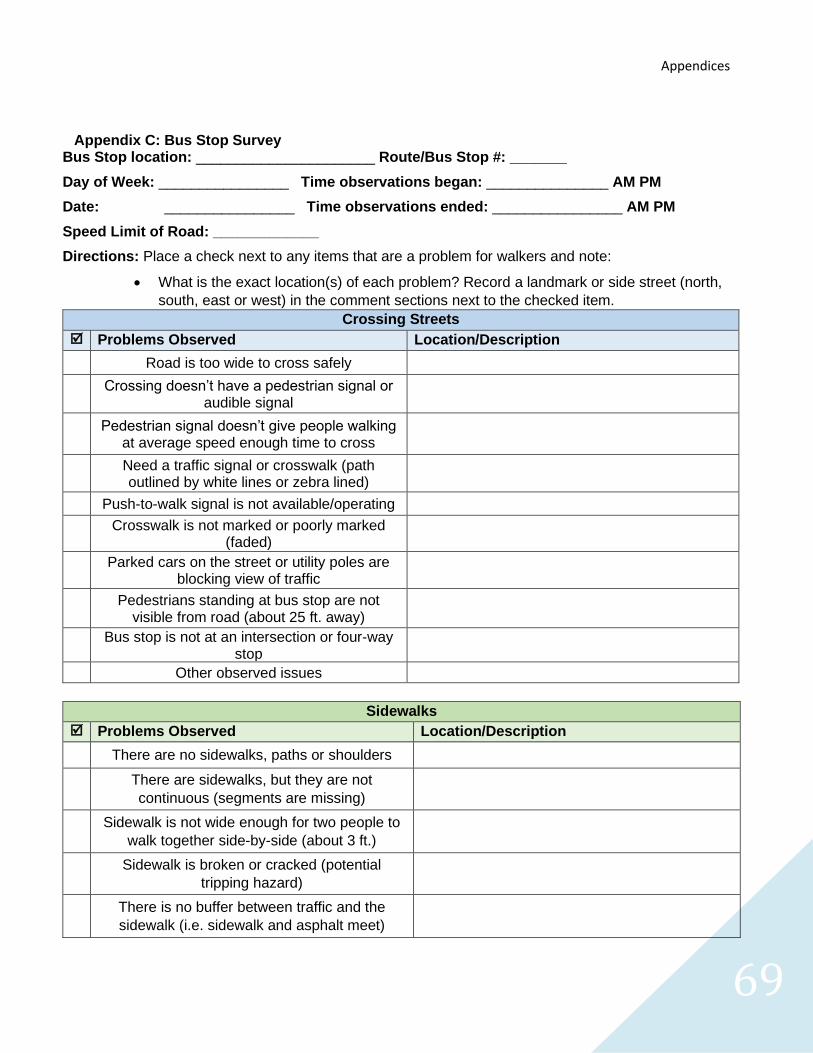
Appendices
69
Appendix C: Bus Stop Survey Bus Stop location: ______________________ Route/Bus Stop #: _______
Day of Week: ________________ Time observations began: _______________ AM PM
Date: ________________ Time observations ended: ________________ AM PM
Speed Limit of Road: _____________
Directions: Place a check next to any items that are a problem for walkers and note:
• What is the exact location(s) of each problem? Record a landmark or side street (north,
south, east or west) in the comment sections next to the checked item.
Crossing Streets
Problems Observed Location/Description
Road is too wide to cross safely
Crossing doesn’t have a pedestrian signal or audible signal
Pedestrian signal doesn’t give people walking at average speed enough time to cross
Need a traffic signal or crosswalk (path outlined by white lines or zebra lined)
Push-to-walk signal is not available/operating
Crosswalk is not marked or poorly marked (faded)
Parked cars on the street or utility poles are blocking view of traffic
Pedestrians standing at bus stop are not visible from road (about 25 ft. away)
Bus stop is not at an intersection or four-way stop
Other observed issues
Sidewalks
Problems Observed Location/Description
There are no sidewalks, paths or shoulders
There are sidewalks, but they are not
continuous (segments are missing)
Sidewalk is not wide enough for two people to
walk together side-by-side (about 3 ft.)
Sidewalk is broken or cracked (potential
tripping hazard)
There is no buffer between traffic and the
sidewalk (i.e. sidewalk and asphalt meet)
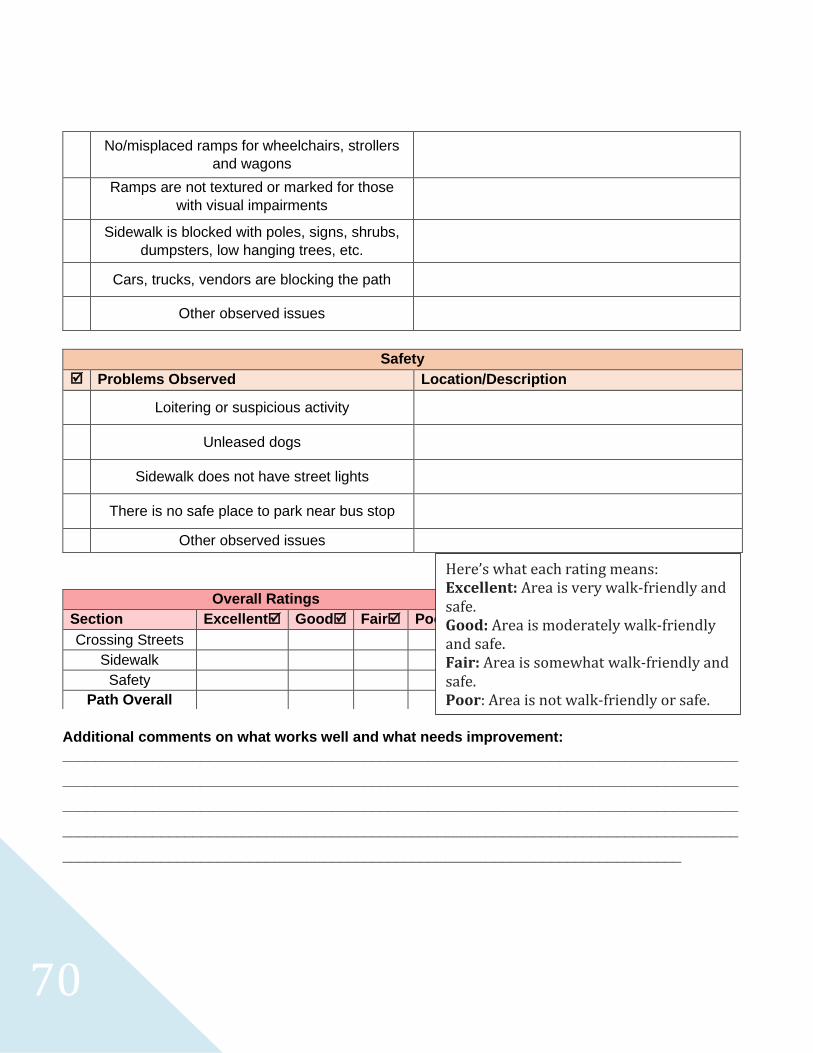
70
No/misplaced ramps for wheelchairs, strollers
and wagons
Ramps are not textured or marked for those
with visual impairments
Sidewalk is blocked with poles, signs, shrubs,
dumpsters, low hanging trees, etc.
Cars, trucks, vendors are blocking the path
Other observed issues
Safety
Problems Observed Location/Description
Loitering or suspicious activity
Unleased dogs
Sidewalk does not have street lights
There is no safe place to park near bus stop
Other observed issues
Additional comments on what works well and what needs improvement:
___________________________________________________________________________________
___________________________________________________________________________________
___________________________________________________________________________________
___________________________________________________________________________________
____________________________________________________________________________
Overall Ratings
Section Excellent Good Fair Poor
Crossing Streets
Sidewalk
Safety
Path Overall
Here’s what each rating means: Excellent: Area is very walk-friendly and safe. Good: Area is moderately walk-friendly and safe. Fair: Area is somewhat walk-friendly and safe. Poor: Area is not walk-friendly or safe.
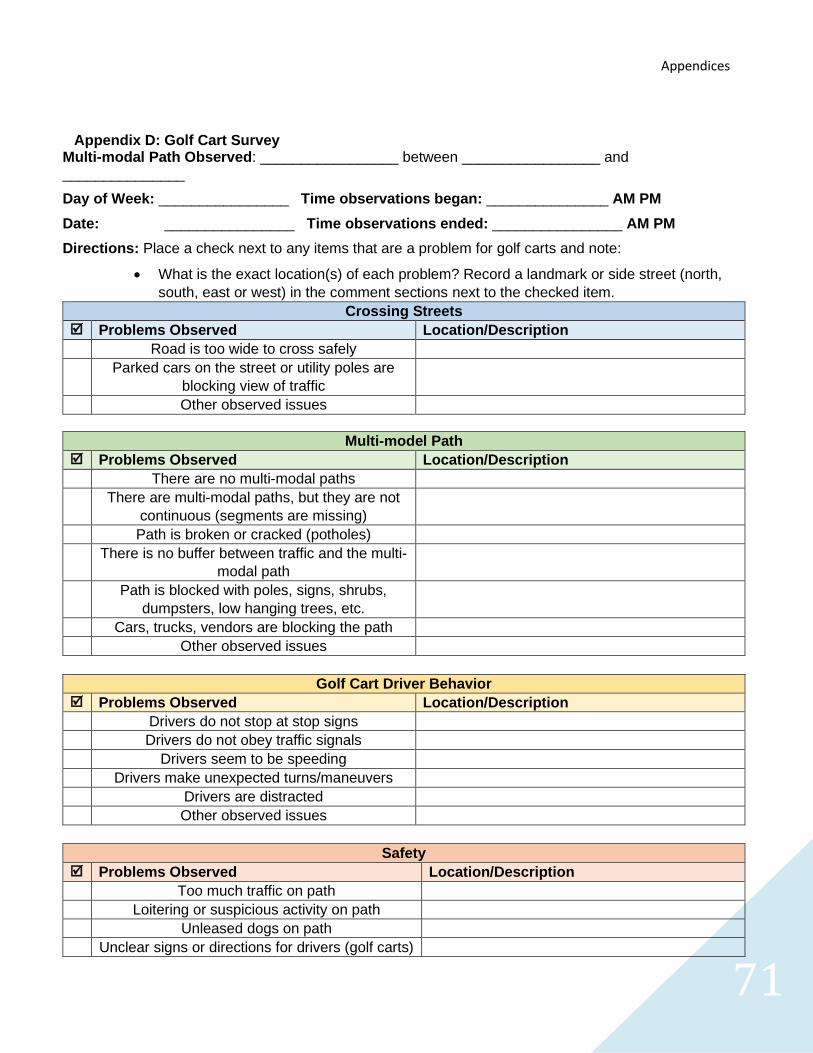
Appendices
71
Appendix D: Golf Cart Survey Multi-modal Path Observed: _________________ between _________________ and _______________
Day of Week: ________________ Time observations began: _______________ AM PM
Date: ________________ Time observations ended: ________________ AM PM
Directions: Place a check next to any items that are a problem for golf carts and note:
• What is the exact location(s) of each problem? Record a landmark or side street (north,
south, east or west) in the comment sections next to the checked item.
Crossing Streets
Problems Observed Location/Description
Road is too wide to cross safely
Parked cars on the street or utility poles are
blocking view of traffic
Other observed issues
Multi-model Path
Problems Observed Location/Description
There are no multi-modal paths
There are multi-modal paths, but they are not
continuous (segments are missing)
Path is broken or cracked (potholes)
There is no buffer between traffic and the multi-
modal path
Path is blocked with poles, signs, shrubs,
dumpsters, low hanging trees, etc.
Cars, trucks, vendors are blocking the path
Other observed issues
Golf Cart Driver Behavior
Problems Observed Location/Description
Drivers do not stop at stop signs
Drivers do not obey traffic signals
Drivers seem to be speeding
Drivers make unexpected turns/maneuvers
Drivers are distracted
Other observed issues
Safety
Problems Observed Location/Description
Too much traffic on path
Loitering or suspicious activity on path
Unleased dogs on path
Unclear signs or directions for drivers (golf carts)
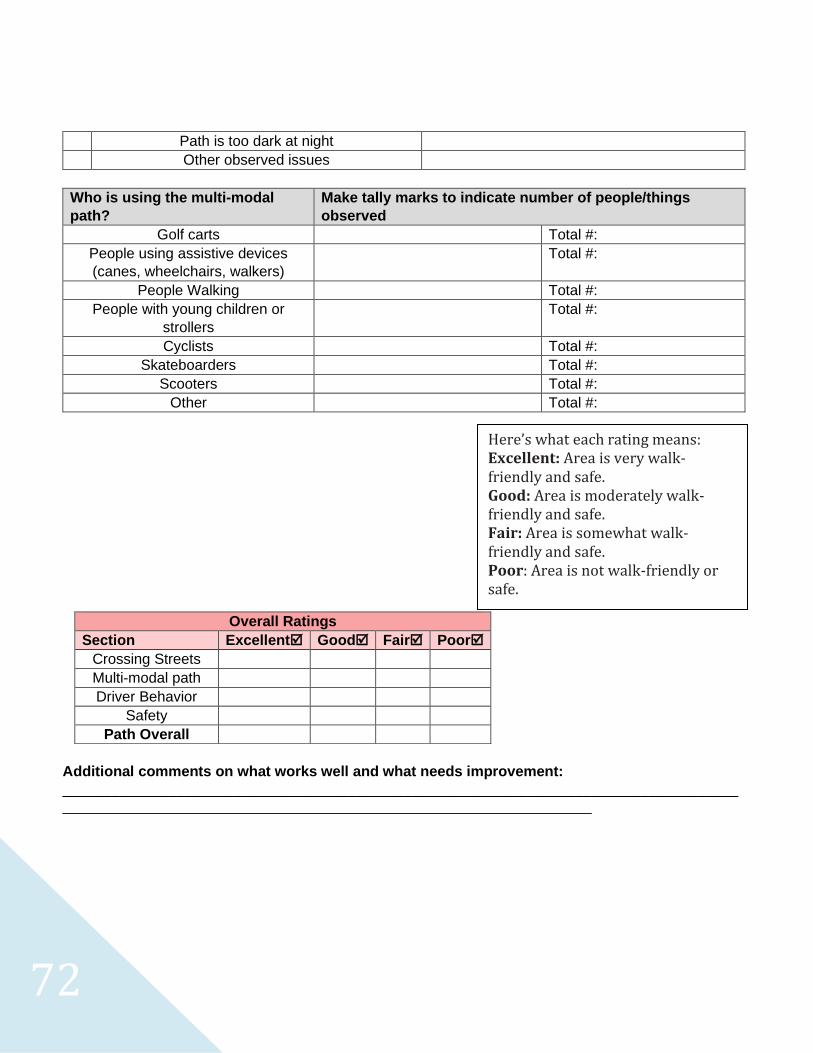
72
Path is too dark at night
Other observed issues
Who is using the multi-modal
path?
Make tally marks to indicate number of people/things
observed
Golf carts Total #:
People using assistive devices
(canes, wheelchairs, walkers)
Total #:
People Walking Total #:
People with young children or
strollers
Total #:
Cyclists Total #:
Skateboarders Total #:
Scooters Total #:
Other Total #:
Additional comments on what works well and what needs improvement:
____________________________________________________________________________________________________________________________________________________
Overall Ratings
Section Excellent Good Fair Poor
Crossing Streets
Multi-modal path
Driver Behavior
Safety
Path Overall
Here’s what each rating means: Excellent: Area is very walk-friendly and safe. Good: Area is moderately walk-friendly and safe. Fair: Area is somewhat walk-friendly and safe. Poor: Area is not walk-friendly or safe.
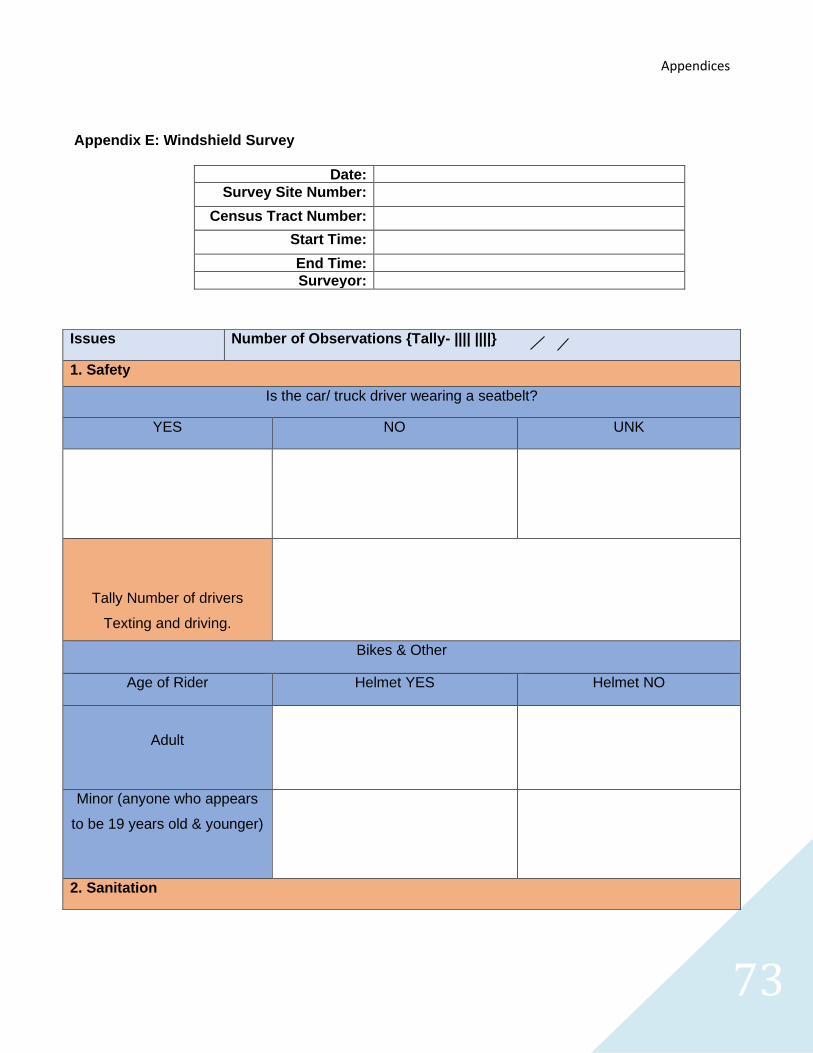
Appendices
73
Appendix E: Windshield Survey
Date:
Survey Site Number:
Census Tract Number:
Start Time:
End Time:
Surveyor:
Issues Number of Observations {Tally- |||| ||||}
1. Safety
Is the car/ truck driver wearing a seatbelt?
YES NO UNK
Tally Number of drivers
Texting and driving.
Bikes & Other
Age of Rider Helmet YES Helmet NO
Adult
Minor (anyone who appears
to be 19 years old & younger)
2. Sanitation
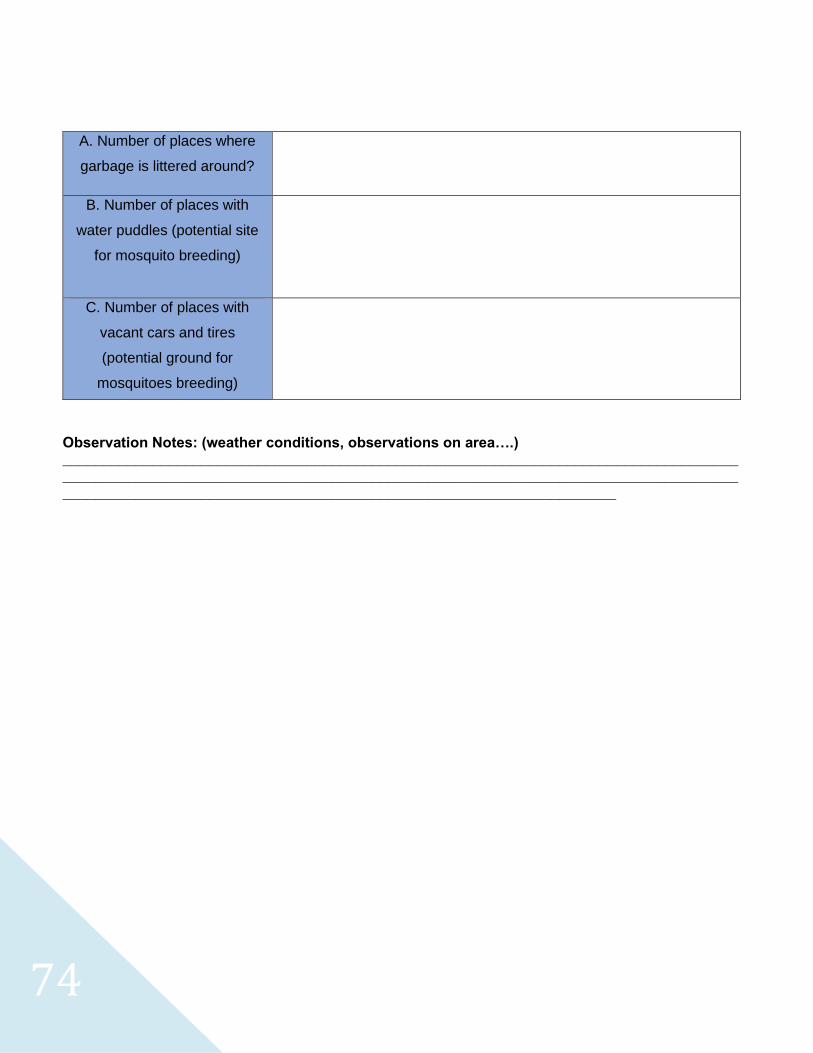
74
Observation Notes: (weather conditions, observations on area….) __________________________________________________________________________________________________________________________________________________________________________________________________________________________________________
A. Number of places where
garbage is littered around?
B. Number of places with
water puddles (potential site
for mosquito breeding)
C. Number of places with
vacant cars and tires
(potential ground for
mosquitoes breeding)
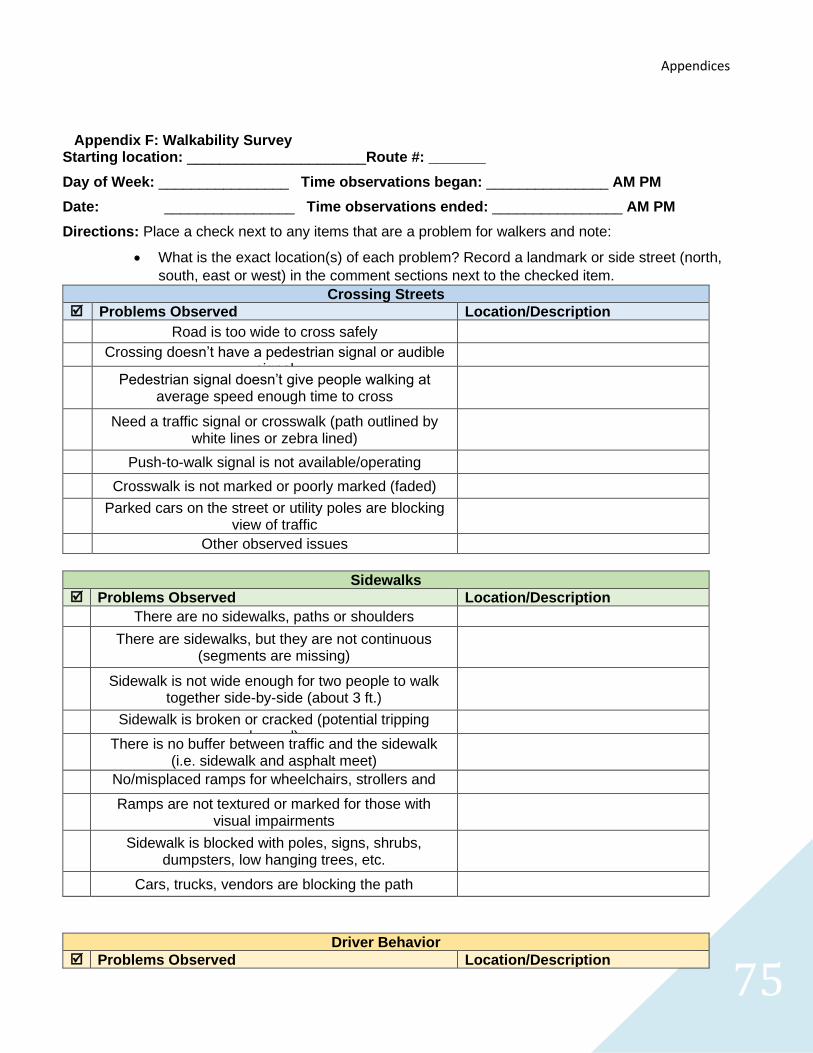
Appendices
75
Appendix F: Walkability Survey Starting location: ______________________Route #: _______
Day of Week: ________________ Time observations began: _______________ AM PM
Date: ________________ Time observations ended: ________________ AM PM
Directions: Place a check next to any items that are a problem for walkers and note:
• What is the exact location(s) of each problem? Record a landmark or side street (north,
south, east or west) in the comment sections next to the checked item.
Crossing Streets Problems Observed Location/Description
Road is too wide to cross safely
Crossing doesn’t have a pedestrian signal or audible signal
Pedestrian signal doesn’t give people walking at average speed enough time to cross
Need a traffic signal or crosswalk (path outlined by white lines or zebra lined)
Push-to-walk signal is not available/operating
Crosswalk is not marked or poorly marked (faded)
Parked cars on the street or utility poles are blocking view of traffic
Other observed issues
Sidewalks Problems Observed Location/Description
There are no sidewalks, paths or shoulders
There are sidewalks, but they are not continuous (segments are missing)
Sidewalk is not wide enough for two people to walk together side-by-side (about 3 ft.)
Sidewalk is broken or cracked (potential tripping hazard)
There is no buffer between traffic and the sidewalk (i.e. sidewalk and asphalt meet)
No/misplaced ramps for wheelchairs, strollers and wagons
Ramps are not textured or marked for those with visual impairments
Sidewalk is blocked with poles, signs, shrubs, dumpsters, low hanging trees, etc.
Cars, trucks, vendors are blocking the path
Driver Behavior Problems Observed Location/Description
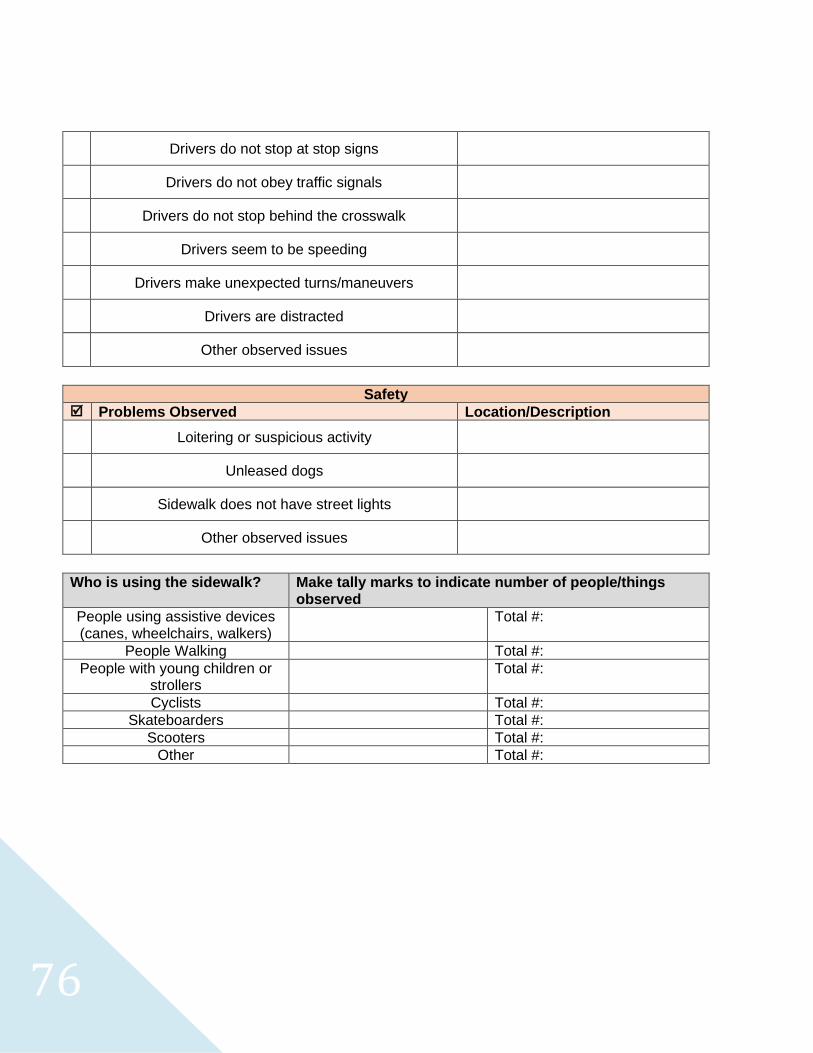
76
Drivers do not stop at stop signs
Drivers do not obey traffic signals
Drivers do not stop behind the crosswalk
Drivers seem to be speeding
Drivers make unexpected turns/maneuvers
Drivers are distracted
Other observed issues
Safety Problems Observed Location/Description
Loitering or suspicious activity
Unleased dogs
Sidewalk does not have street lights
Other observed issues
Who is using the sidewalk? Make tally marks to indicate number of people/things observed
People using assistive devices (canes, wheelchairs, walkers)
Total #:
People Walking Total #:
People with young children or strollers
Total #:
Cyclists Total #:
Skateboarders Total #:
Scooters Total #:
Other Total #:
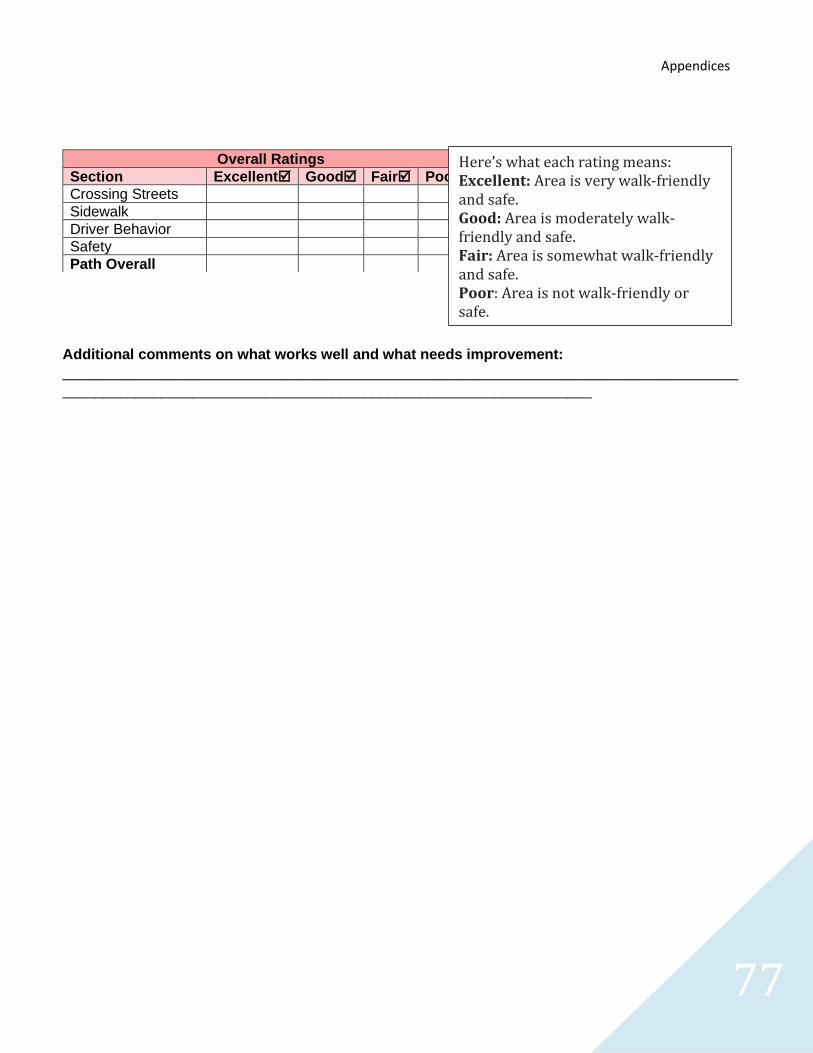
Appendices
77
Additional comments on what works well and what needs improvement:
___________________________________________________________________________________
_________________________________________________________________
Overall Ratings
Section Excellent Good Fair Poor
Crossing Streets
Sidewalk
Driver Behavior
Safety
Path Overall
Here’s what each rating means: Excellent: Area is very walk-friendly and safe. Good: Area is moderately walk-friendly and safe. Fair: Area is somewhat walk-friendly and safe. Poor: Area is not walk-friendly or safe.
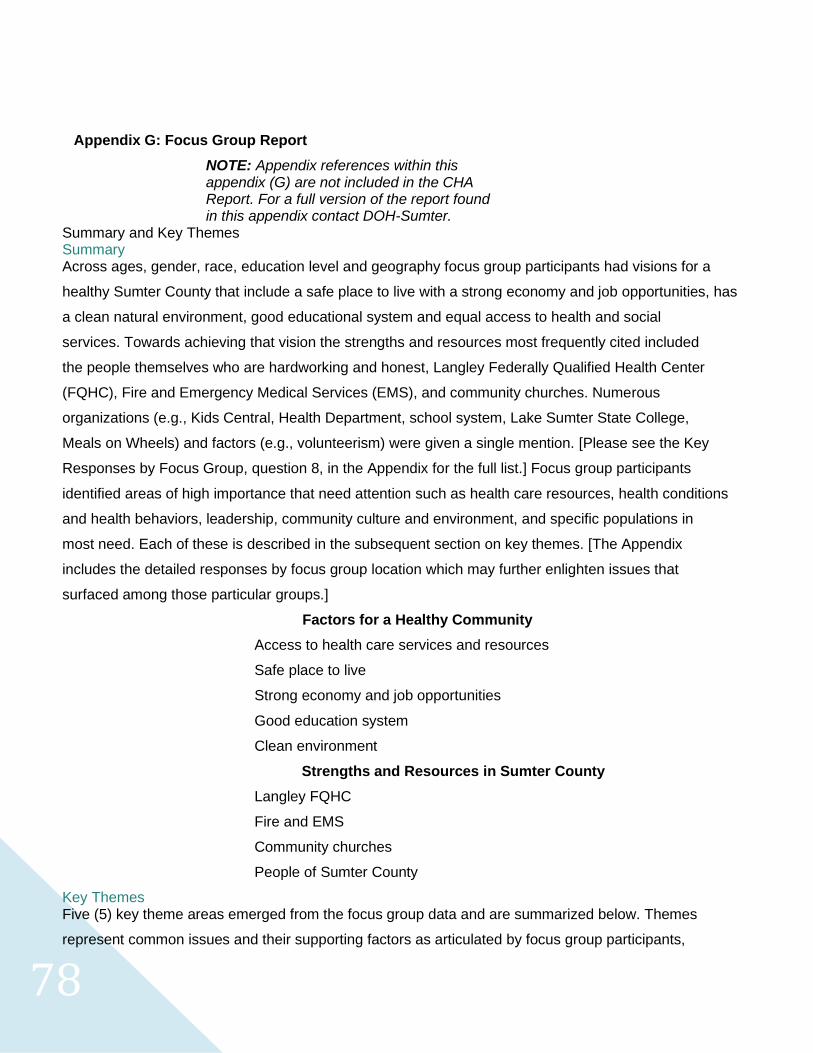
78
Appendix G: Focus Group Report
NOTE: Appendix references within this appendix (G) are not included in the CHA Report. For a full version of the report found in this appendix contact DOH-Sumter.
Summary and Key Themes Summary Across ages, gender, race, education level and geography focus group participants had visions for a
healthy Sumter County that include a safe place to live with a strong economy and job opportunities, has
a clean natural environment, good educational system and equal access to health and social
services. Towards achieving that vision the strengths and resources most frequently cited included
the people themselves who are hardworking and honest, Langley Federally Qualified Health Center
(FQHC), Fire and Emergency Medical Services (EMS), and community churches. Numerous
organizations (e.g., Kids Central, Health Department, school system, Lake Sumter State College,
Meals on Wheels) and factors (e.g., volunteerism) were given a single mention. [Please see the Key
Responses by Focus Group, question 8, in the Appendix for the full list.] Focus group participants
identified areas of high importance that need attention such as health care resources, health conditions
and health behaviors, leadership, community culture and environment, and specific populations in
most need. Each of these is described in the subsequent section on key themes. [The Appendix
includes the detailed responses by focus group location which may further enlighten issues that
surfaced among those particular groups.]
Factors for a Healthy Community
Access to health care services and resources
Safe place to live
Strong economy and job opportunities
Good education system
Clean environment
Strengths and Resources in Sumter County
Langley FQHC
Fire and EMS
Community churches
People of Sumter County
Key Themes Five (5) key theme areas emerged from the focus group data and are summarized below. Themes
represent common issues and their supporting factors as articulated by focus group participants,
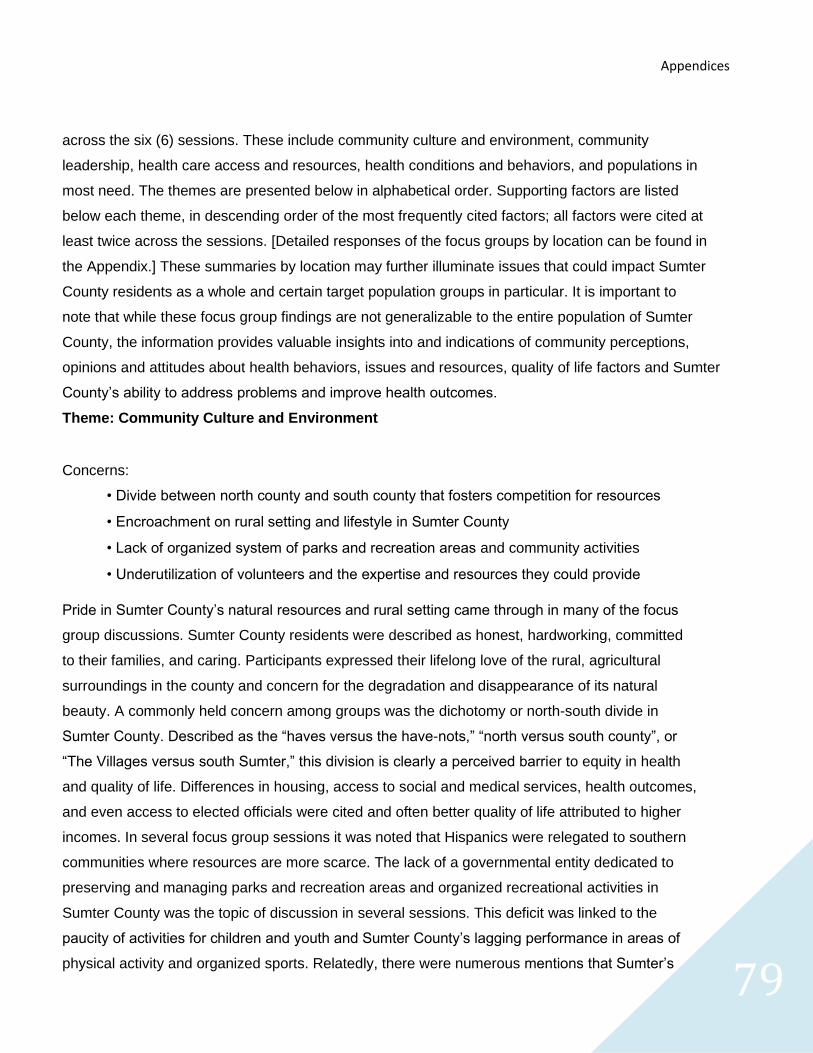
Appendices
79
across the six (6) sessions. These include community culture and environment, community
leadership, health care access and resources, health conditions and behaviors, and populations in
most need. The themes are presented below in alphabetical order. Supporting factors are listed
below each theme, in descending order of the most frequently cited factors; all factors were cited at
least twice across the sessions. [Detailed responses of the focus groups by location can be found in
the Appendix.] These summaries by location may further illuminate issues that could impact Sumter
County residents as a whole and certain target population groups in particular. It is important to
note that while these focus group findings are not generalizable to the entire population of Sumter
County, the information provides valuable insights into and indications of community perceptions,
opinions and attitudes about health behaviors, issues and resources, quality of life factors and Sumter
County’s ability to address problems and improve health outcomes.
Pride in Sumter County’s natural resources and rural setting came through in many of the focus
group discussions. Sumter County residents were described as honest, hardworking, committed
to their families, and caring. Participants expressed their lifelong love of the rural, agricultural
surroundings in the county and concern for the degradation and disappearance of its natural
beauty. A commonly held concern among groups was the dichotomy or north-south divide in
Sumter County. Described as the “haves versus the have-nots,” “north versus south county”, or
“The Villages versus south Sumter,” this division is clearly a perceived barrier to equity in health
and quality of life. Differences in housing, access to social and medical services, health outcomes,
and even access to elected officials were cited and often better quality of life attributed to higher
incomes. In several focus group sessions it was noted that Hispanics were relegated to southern
communities where resources are more scarce. The lack of a governmental entity dedicated to
preserving and managing parks and recreation areas and organized recreational activities in
Sumter County was the topic of discussion in several sessions. This deficit was linked to the
paucity of activities for children and youth and Sumter County’s lagging performance in areas of
physical activity and organized sports. Relatedly, there were numerous mentions that Sumter’s
Theme: Community Culture and Environment
Concerns:
• Divide between north county and south county that fosters competition for resources
• Encroachment on rural setting and lifestyle in Sumter County
• Lack of organized system of parks and recreation areas and community activities
• Underutilization of volunteers and the expertise and resources they could provide
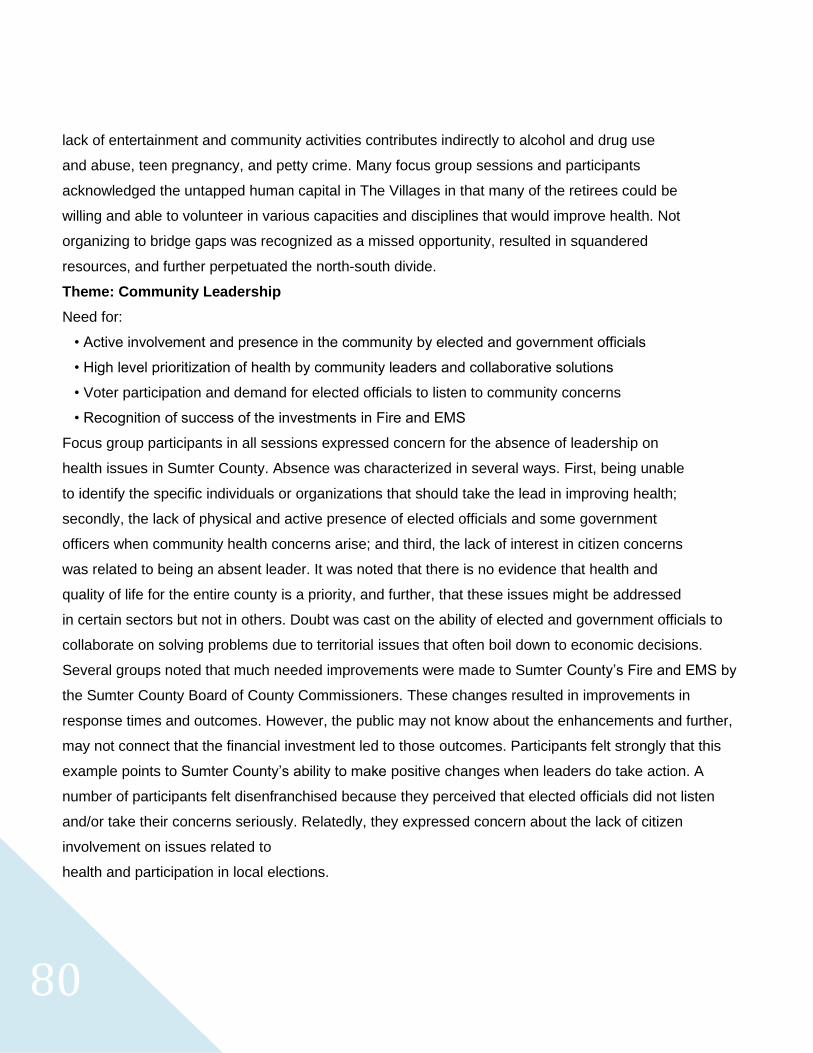
80
lack of entertainment and community activities contributes indirectly to alcohol and drug use
and abuse, teen pregnancy, and petty crime. Many focus group sessions and participants
acknowledged the untapped human capital in The Villages in that many of the retirees could be
willing and able to volunteer in various capacities and disciplines that would improve health. Not
organizing to bridge gaps was recognized as a missed opportunity, resulted in squandered
resources, and further perpetuated the north-south divide.
Theme: Community Leadership
Need for:
• Active involvement and presence in the community by elected and government officials
• High level prioritization of health by community leaders and collaborative solutions
• Voter participation and demand for elected officials to listen to community concerns
• Recognition of success of the investments in Fire and EMS
Focus group participants in all sessions expressed concern for the absence of leadership on
health issues in Sumter County. Absence was characterized in several ways. First, being unable
to identify the specific individuals or organizations that should take the lead in improving health;
secondly, the lack of physical and active presence of elected officials and some government
officers when community health concerns arise; and third, the lack of interest in citizen concerns
was related to being an absent leader. It was noted that there is no evidence that health and
quality of life for the entire county is a priority, and further, that these issues might be addressed
in certain sectors but not in others. Doubt was cast on the ability of elected and government officials to
collaborate on solving problems due to territorial issues that often boil down to economic decisions.
Several groups noted that much needed improvements were made to Sumter County’s Fire and EMS by
the Sumter County Board of County Commissioners. These changes resulted in improvements in
response times and outcomes. However, the public may not know about the enhancements and further,
may not connect that the financial investment led to those outcomes. Participants felt strongly that this
example points to Sumter County’s ability to make positive changes when leaders do take action. A
number of participants felt disenfranchised because they perceived that elected officials did not listen
and/or take their concerns seriously. Relatedly, they expressed concern about the lack of citizen
involvement on issues related to
health and participation in local elections.
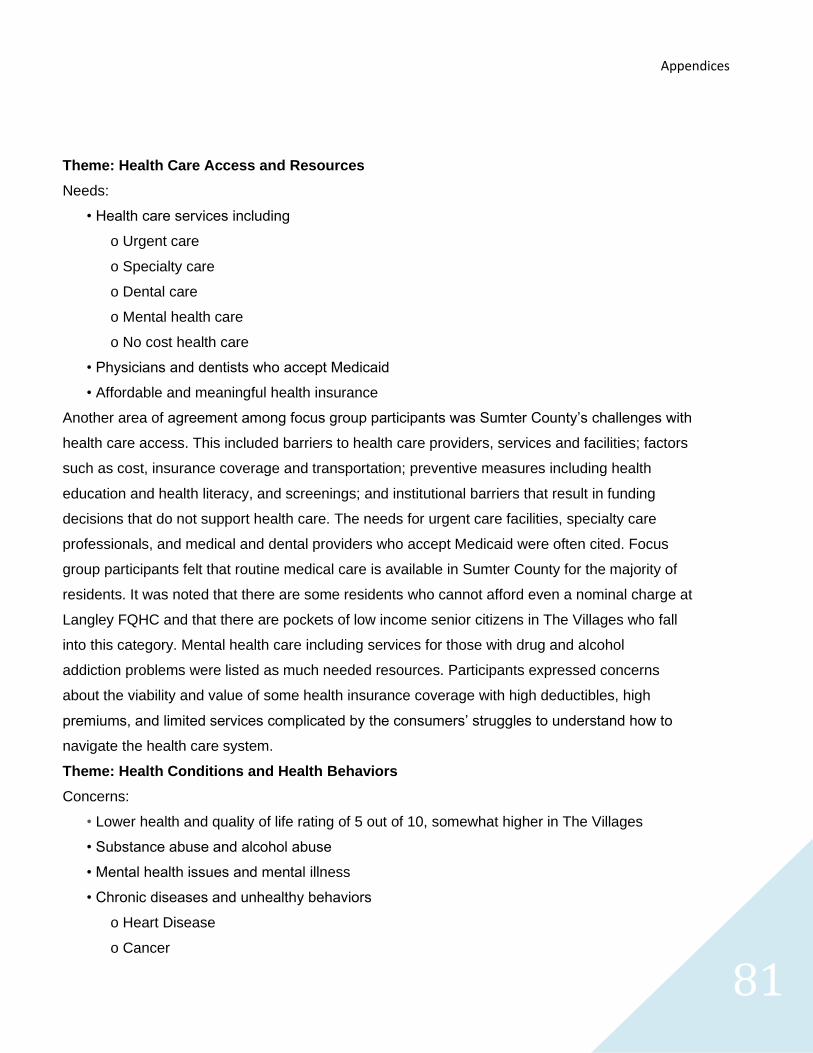
Appendices
81
Theme: Health Care Access and Resources
Needs:
• Health care services including
o Urgent care
o Specialty care
o Dental care
o Mental health care
o No cost health care
• Physicians and dentists who accept Medicaid
• Affordable and meaningful health insurance
Another area of agreement among focus group participants was Sumter County’s challenges with
health care access. This included barriers to health care providers, services and facilities; factors
such as cost, insurance coverage and transportation; preventive measures including health
education and health literacy, and screenings; and institutional barriers that result in funding
decisions that do not support health care. The needs for urgent care facilities, specialty care
professionals, and medical and dental providers who accept Medicaid were often cited. Focus
group participants felt that routine medical care is available in Sumter County for the majority of
residents. It was noted that there are some residents who cannot afford even a nominal charge at
Langley FQHC and that there are pockets of low income senior citizens in The Villages who fall
into this category. Mental health care including services for those with drug and alcohol
addiction problems were listed as much needed resources. Participants expressed concerns
about the viability and value of some health insurance coverage with high deductibles, high
premiums, and limited services complicated by the consumers’ struggles to understand how to
navigate the health care system.
Theme: Health Conditions and Health Behaviors
Concerns:
• Lower health and quality of life rating of 5 out of 10, somewhat higher in The Villages
• Substance abuse and alcohol abuse
• Mental health issues and mental illness
• Chronic diseases and unhealthy behaviors
o Heart Disease
o Cancer
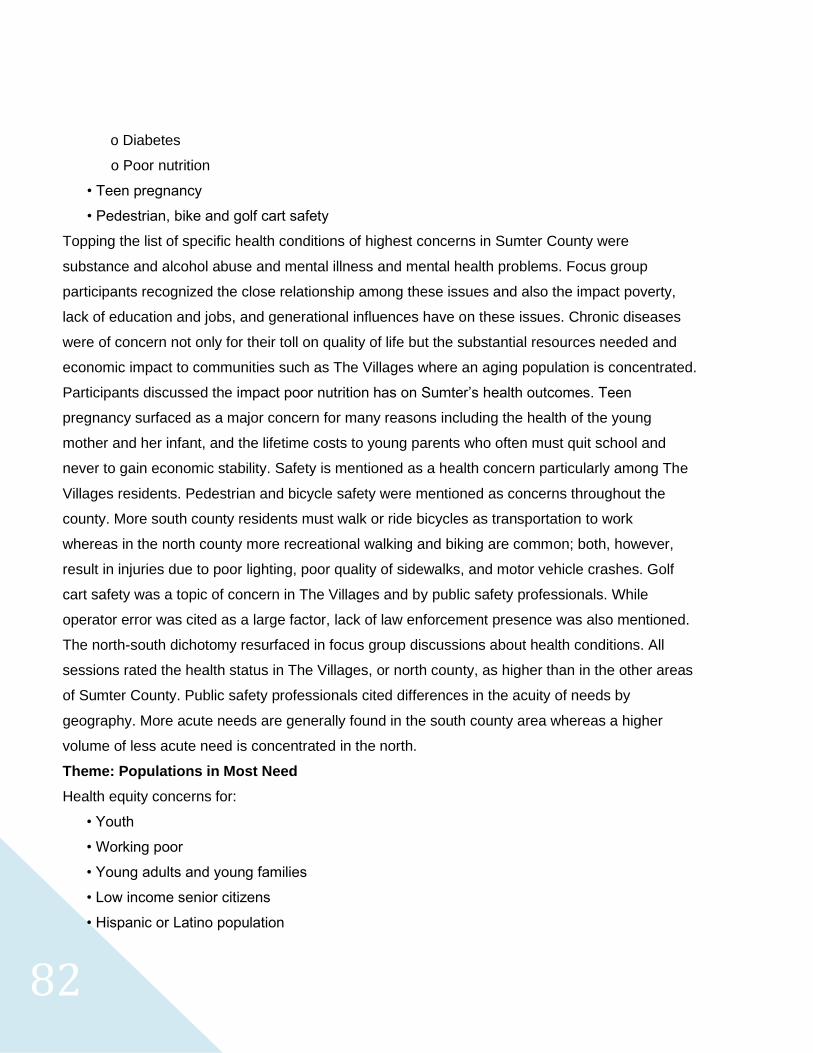
82
o Diabetes
o Poor nutrition
• Teen pregnancy
• Pedestrian, bike and golf cart safety
Topping the list of specific health conditions of highest concerns in Sumter County were
substance and alcohol abuse and mental illness and mental health problems. Focus group
participants recognized the close relationship among these issues and also the impact poverty,
lack of education and jobs, and generational influences have on these issues. Chronic diseases
were of concern not only for their toll on quality of life but the substantial resources needed and
economic impact to communities such as The Villages where an aging population is concentrated.
Participants discussed the impact poor nutrition has on Sumter’s health outcomes. Teen
pregnancy surfaced as a major concern for many reasons including the health of the young
mother and her infant, and the lifetime costs to young parents who often must quit school and
never to gain economic stability. Safety is mentioned as a health concern particularly among The
Villages residents. Pedestrian and bicycle safety were mentioned as concerns throughout the
county. More south county residents must walk or ride bicycles as transportation to work
whereas in the north county more recreational walking and biking are common; both, however,
result in injuries due to poor lighting, poor quality of sidewalks, and motor vehicle crashes. Golf
cart safety was a topic of concern in The Villages and by public safety professionals. While
operator error was cited as a large factor, lack of law enforcement presence was also mentioned.
The north-south dichotomy resurfaced in focus group discussions about health conditions. All
sessions rated the health status in The Villages, or north county, as higher than in the other areas
of Sumter County. Public safety professionals cited differences in the acuity of needs by
geography. More acute needs are generally found in the south county area whereas a higher
volume of less acute need is concentrated in the north.
Theme: Populations in Most Need
Health equity concerns for:
• Youth
• Working poor
• Young adults and young families
• Low income senior citizens
• Hispanic or Latino population
Appendices
83
Focus group participants uniformly expressed concern for Sumter County youth and working poor
as populations that experience disproportionate challenges and barriers to good health and quality
of life. Among the factors cited as obstacles for youth are poverty, lack of youth services in Sumter
County, stressful family and school environments, and poor economic and job opportunities. The
working poor and young adults and families face similar challenges along with lack of affordable
housing and health care. Low income senior citizens, in particular those who are isolated, were
listed as a forgotten and overlooked group. Hispanics or Latinos in Sumter County were described
in some sessions as a silent and therefore ignored group.
Next Steps
The preceding focus group results lend important primary data to the larger community health
assessment process. The Florida Department of Health in Sumter County will develop a
comprehensive assessment report and use the findings to identify health priorities, craft and
implement a community health improvement plan, health department marketing strategy, and
health equity action plan. Towards achieving sustainable, positive changes in health policy,
practices, behaviors, and outcomes the use of promising, model and evidence-based practices is
recommended. Noted below are six (6) recognized compendiums of public health practices and
programs that could be consulted when selecting targeted interventions for the above mentioned
plans.
https://www.thecommunityguide.org/ U.S. Department of Health and Human Services, Community
Preventive Services Task Force
https://www.healthypeople.gov/2020/tools-resources/Evidence-Based-Resources U.S.
Department of Health and Human Services, Office of Disease Prevention and Health Promotion
https://knowledge.samhsa.gov/ta-centers/national-registry-evidence-based-programs-andpractices U.S.
Department of Health and Human Services, Substance Abuse and Mental Health
Services Administration
https://www.naccho.org/resources/model-practices National Association of County and Health
Officials
http://ctb.ku.edu/en/databases-best-practices The Community Tool Box, University of Kansas
https://www.phqix.org/ Public Health Quality Improvement Exchange, Robert Wood Johnson
Foundation
84
Appendix H: 2018 Steering Committee Survey Assessment Tool
FDOH-Sumter Steering Committee Survey 2018
2018 FDOH-Sumter Steering Committee Data Feedback Survey This survey will take about 10 minutes to complete. By completing this survey, you are helping to set the agenda for the next FDOH-Sumter Health Improvement Steering Committee meeting, currently scheduled to occur in early 2018. Your feedback will also be used to guide our secondary data analysis, which is currently underway. Thank you for taking the time to complete this survey. Your opinions are greatly valued. 1. Name (Last, First, M)
2. Organization:
3. Employment Category 4. Phone:
5. Email:
6. Please categorize the following public health issues by your perceived severity, relevance to you and/or your agency, magnitude of impact on the county:
Impact on Community: Not a problem, somewhat of a problem, Severe problem, I Don’t know
Relevance to your agency: Very relevant, Somewhat relevant, No opinion/ I don’t know, Not very relevant, Not relevant at all.
Drowning Rates
Drowning Rates Impact on Community
Drowning Rates Relevance to your agency
Malnutrition Rates
Malnutrition Rates Impact on Community
Malnutrition Rates Relevance to your agency
Falls Injury Rates
Falls Injury Rates Impact on Community
Falls Injury Rates Relevance to your agency
Appendices
85
Rates of Tobacco Use
Rates of Tobacco Use Impact on Community
Rates of Tobacco Use Relevance to your agency
Breastfeeding Rates
Breastfeeding Rates Impact on Community
Breastfeeding Rates Relevance to your agency
Property Crime Rates
Property Crime Rates Impact on Community
Property Crime Rates Relevance to your agency
Violent Crime Rates
Violent Crime Rates Impact on Community
Violent Crime Rates Relevance to your agency
High School Drop-out Rates
High School Drop-out Rates Impact on Community
High School Drop-out Rates Relevance to your agency
Community Engagement Rates (How involved Sumter County residents are in their own governance, policy planning, and health promotion)
Community Engagement Rates (How involved Sumter County residents are in their own governance, policy planning, and health promotion) Impact on Community
Community Engagement Rates (How involved Sumter County residents are in their own governance, policy planning, and health promotion) Relevance to your agency
Infant Mortality Rates
Infant Mortality Rates Impact on Community
Infant Mortality Rates Relevance to your agency
Dental Disease Rates
Dental Disease Rates Impact on Community
Dental Disease Rates Relevance to your agency
Poverty Rates
Poverty Rates Impact on Community
Poverty Rates Relevance to your agency
Heart Disease Rates
Heart Disease Rates Impact on Community
Heart Disease Rates Relevance to your agency
Diabetes Rates
Diabetes Rates Impact on Community
Diabetes Rates Relevance to your agency
Cancer Rates
Cancer Rates Impact on Community
Cancer Rates Relevance to your agency
Child Abuse Rates
Child Abuse Rates Impact on Community
Child Abuse Rates Relevance to your agency
Teen Pregnancy Rates
Teen Pregnancy Rates Impact on Community
Teen Pregnancy Rates Relevance to your agency:
Motor vehicle crash injury and death rates
86
Motor vehicle crash injury and death rates Impact on Community
Motor vehicle crash injury and death rates Relevance to your agency
Drunk Driving Rates
Drunk Driving Rates Impact on Community
Drunk Driving Rates Relevance to your agency
Physical Inactivity Rates
Physical Inactivity Rates Impact on Community
Physical Inactivity Rates Relevance to your agency
Drug & Alcohol Addiction Rates
Drug & Alcohol Addiction Rates Impact on Community
Drug & Alcohol Addiction Rates Relevance to your agency
Infectious Disease Rates
Infectious Disease Rates Impact on Community
Infectious Disease Rates Relevance to your agency
Suicide Rates
Suicide Rates Impact on Community
Suicide Rates Relevance to your agency
7. Please categorize the following environmental health issues by your perceived severity, relevance to you and/or your agency, magnitude of impact on the county:
Impact on community: Not a problem, somewhat of a problem, Severe problem, I Don’t know
Relevance to your agency: Very relevant, Somewhat relevant, No opinion/ I don’t know, Not very relevant, Not relevant at all.
Litter
Litter Impact on community
Litter Relevance to your agency
Vacant Buildings/ Abandoned Automobiles
Vacant Buildings/ Abandoned Automobiles Impact on community
Vacant Buildings/ Abandoned Automobiles Relevance to your agency
Stray Animals (dogs, cats…)
Stray Animals (dogs, cats…) Impact on community
Stray Animals (dogs, cats…) Relevance to your agency
Environmental Toxin Exposure (Lead, arsenic, mercury…)
Environmental Toxin Exposure (Lead, arsenic, mercury…) Impact on community
Environmental Toxin Exposure (Lead, arsenic, mercury…) Relevance to your agency
Access to Health Education Resources
Access to Health Education Resources Impact on community
Access to Health Education Resources Relevance to your agency
Access to Dental Care
Access to Dental Care Impact on community
Access to Dental Care Relevance to your agency
Access to Walk/ Bike/ Alternative transportation trails and paths
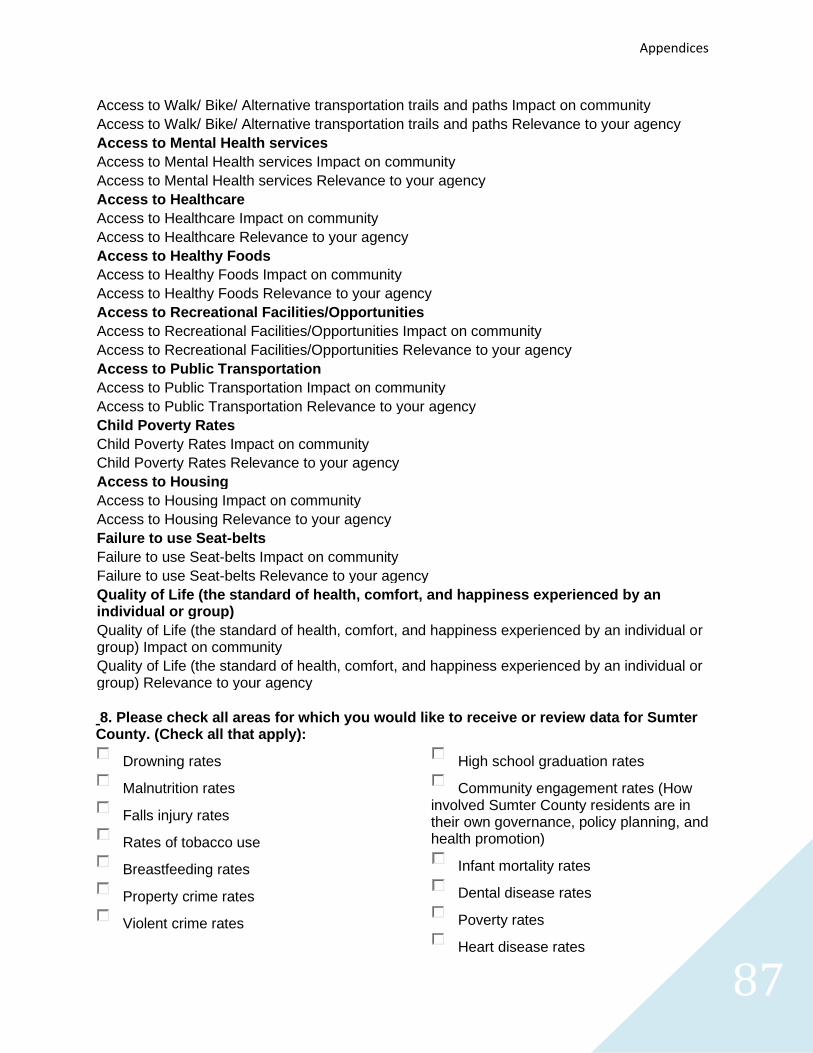
Appendices
87
Access to Walk/ Bike/ Alternative transportation trails and paths Impact on community
Access to Walk/ Bike/ Alternative transportation trails and paths Relevance to your agency
Access to Mental Health services
Access to Mental Health services Impact on community
Access to Mental Health services Relevance to your agency
Access to Healthcare
Access to Healthcare Impact on community
Access to Healthcare Relevance to your agency
Access to Healthy Foods
Access to Healthy Foods Impact on community
Access to Healthy Foods Relevance to your agency
Access to Recreational Facilities/Opportunities
Access to Recreational Facilities/Opportunities Impact on community
Access to Recreational Facilities/Opportunities Relevance to your agency
Access to Public Transportation
Access to Public Transportation Impact on community
Access to Public Transportation Relevance to your agency
Child Poverty Rates
Child Poverty Rates Impact on community
Child Poverty Rates Relevance to your agency
Access to Housing
Access to Housing Impact on community
Access to Housing Relevance to your agency
Failure to use Seat-belts
Failure to use Seat-belts Impact on community
Failure to use Seat-belts Relevance to your agency
Quality of Life (the standard of health, comfort, and happiness experienced by an individual or group)
Quality of Life (the standard of health, comfort, and happiness experienced by an individual or group) Impact on community
Quality of Life (the standard of health, comfort, and happiness experienced by an individual or group) Relevance to your agency
8. Please check all areas for which you would like to receive or review data for Sumter County. (Check all that apply):
Drowning rates
Malnutrition rates
Falls injury rates
Rates of tobacco use
Breastfeeding rates
Property crime rates
Violent crime rates
High school graduation rates
Community engagement rates (How involved Sumter County residents are in their own governance, policy planning, and health promotion)
Infant mortality rates
Dental disease rates
Poverty rates
Heart disease rates
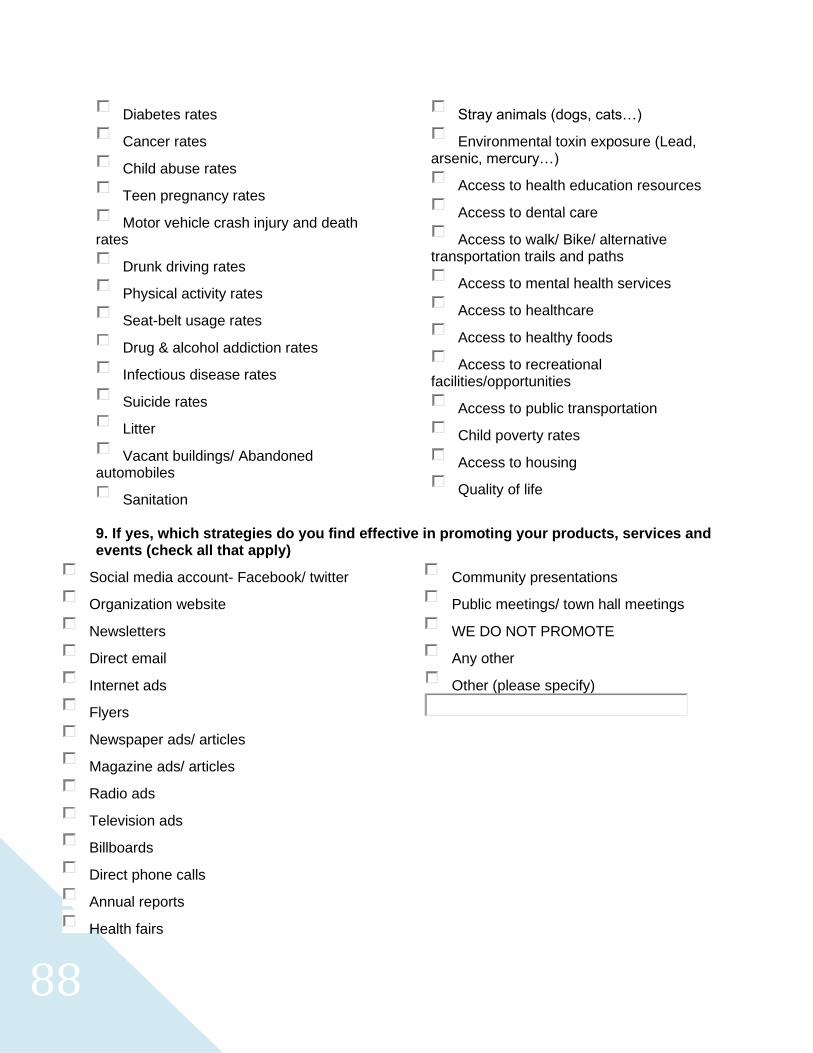
88
Diabetes rates
Cancer rates
Child abuse rates
Teen pregnancy rates
Motor vehicle crash injury and death rates
Drunk driving rates
Physical activity rates
Seat-belt usage rates
Drug & alcohol addiction rates
Infectious disease rates
Suicide rates
Litter
Vacant buildings/ Abandoned automobiles
Sanitation
Stray animals (dogs, cats…)
Environmental toxin exposure (Lead, arsenic, mercury…)
Access to health education resources
Access to dental care
Access to walk/ Bike/ alternative transportation trails and paths
Access to mental health services
Access to healthcare
Access to healthy foods
Access to recreational facilities/opportunities
Access to public transportation
Child poverty rates
Access to housing
Quality of life
9. If yes, which strategies do you find effective in promoting your products, services and events (check all that apply)
Social media account- Facebook/ twitter
Organization website
Newsletters
Direct email
Internet ads
Flyers
Newspaper ads/ articles
Magazine ads/ articles
Radio ads
Television ads
Billboards
Direct phone calls
Annual reports
Health fairs
Community presentations
Public meetings/ town hall meetings
WE DO NOT PROMOTE
Any other
Other (please specify)
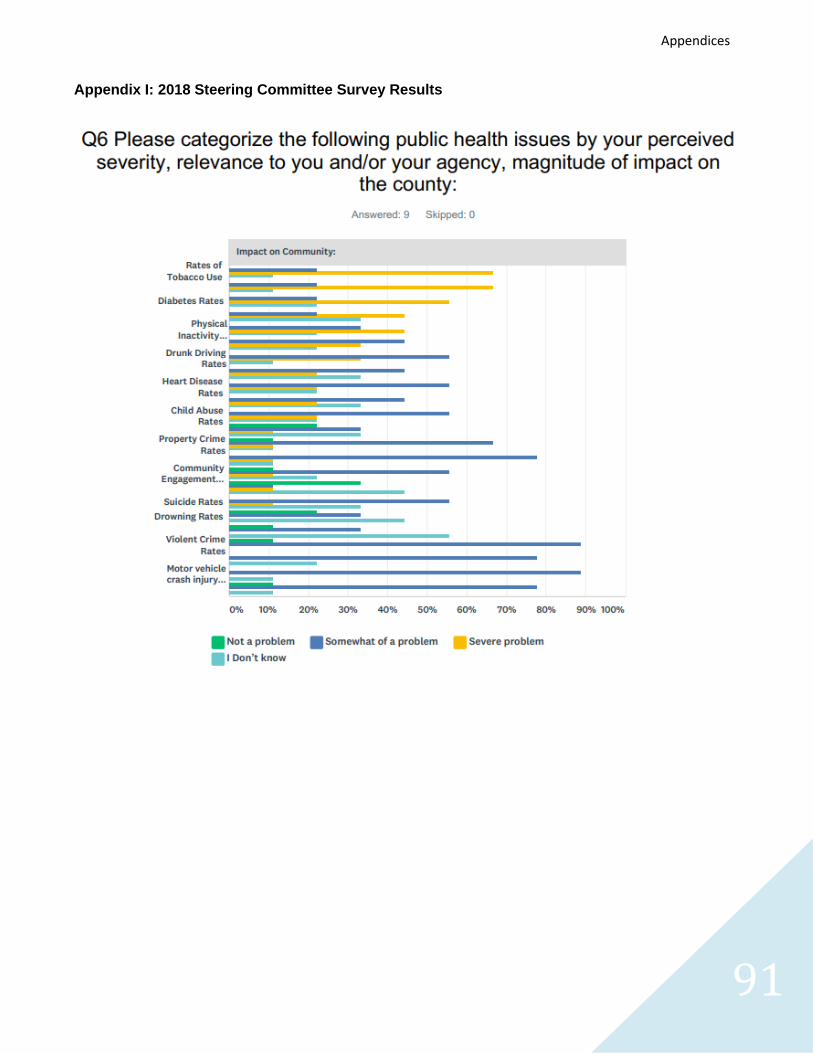
91
Appendices
Appendix I: 2018 Steering Committee Survey Results
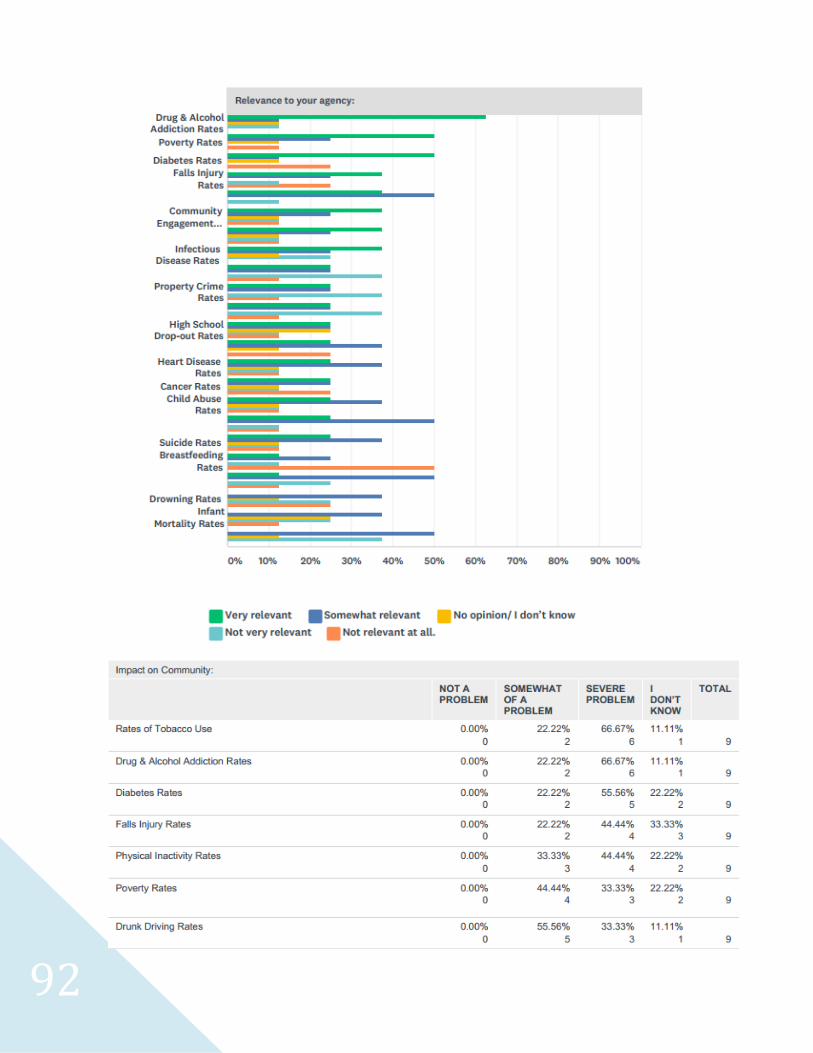
92
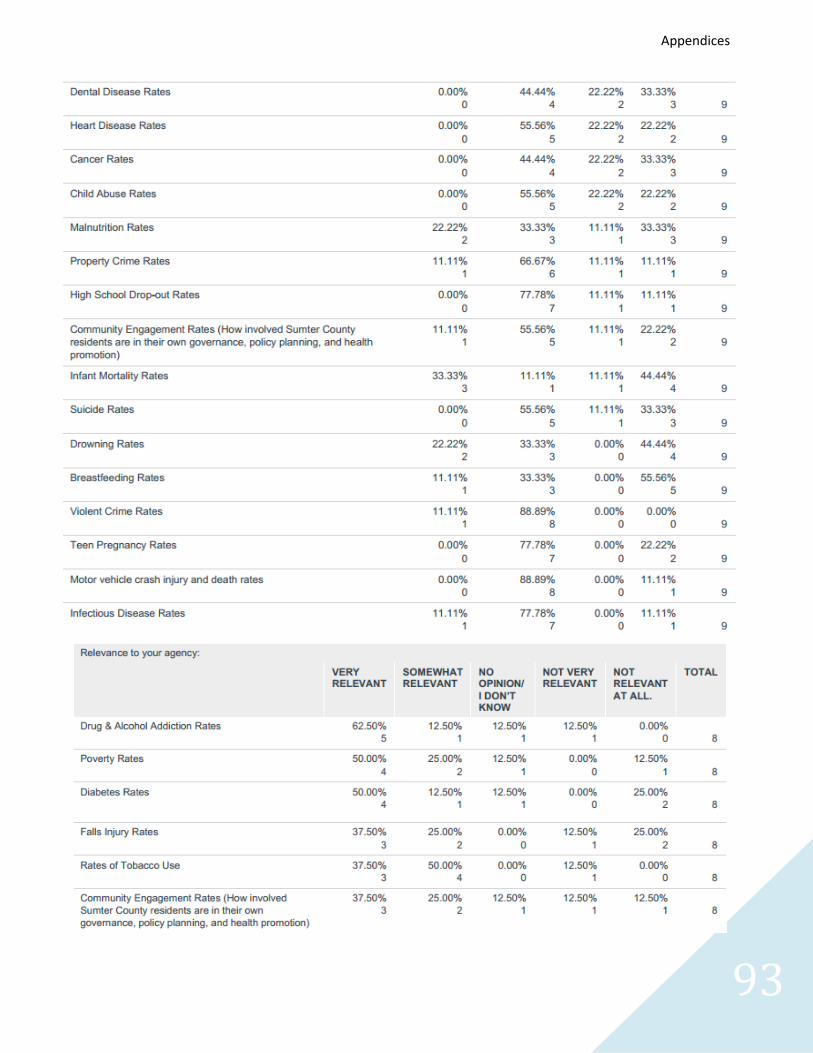
93
Appendices
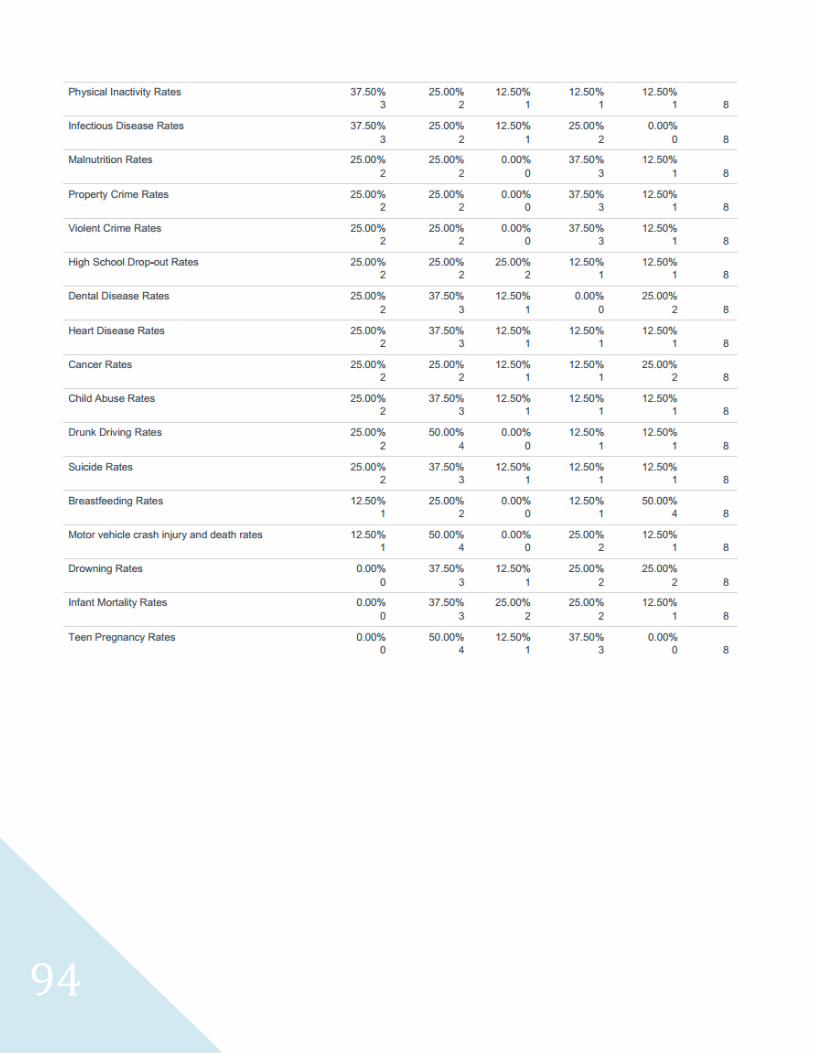
94
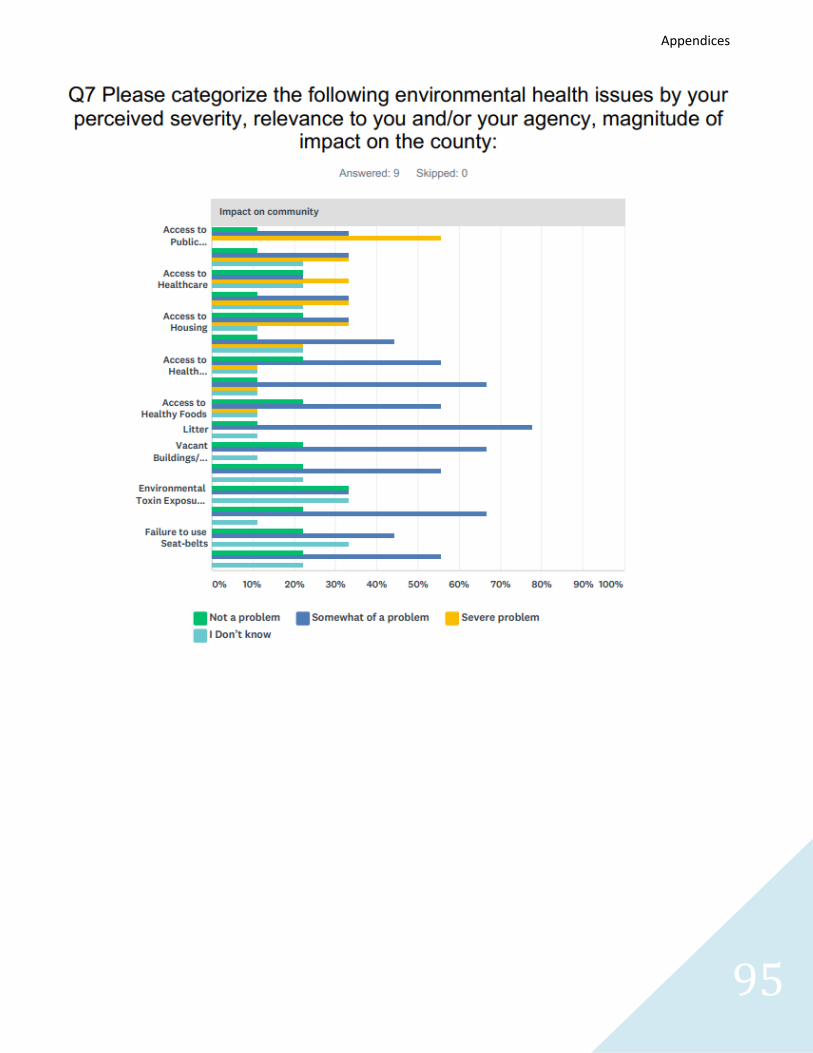
95
Appendices
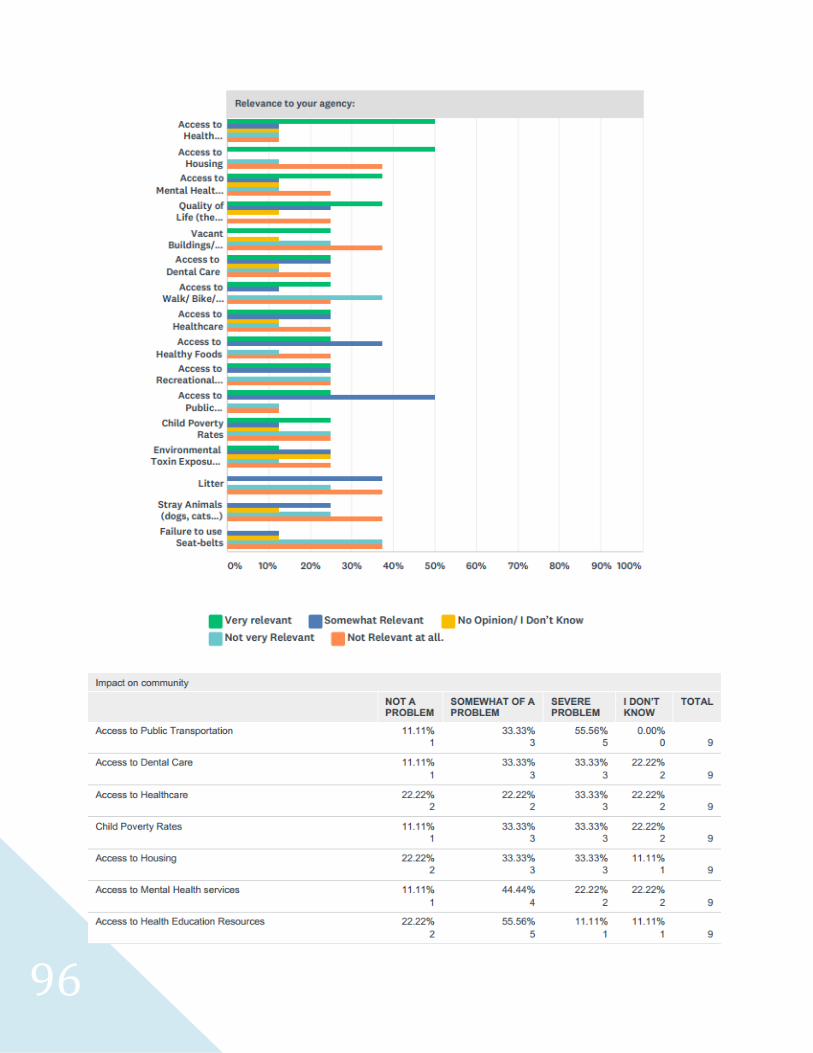
96
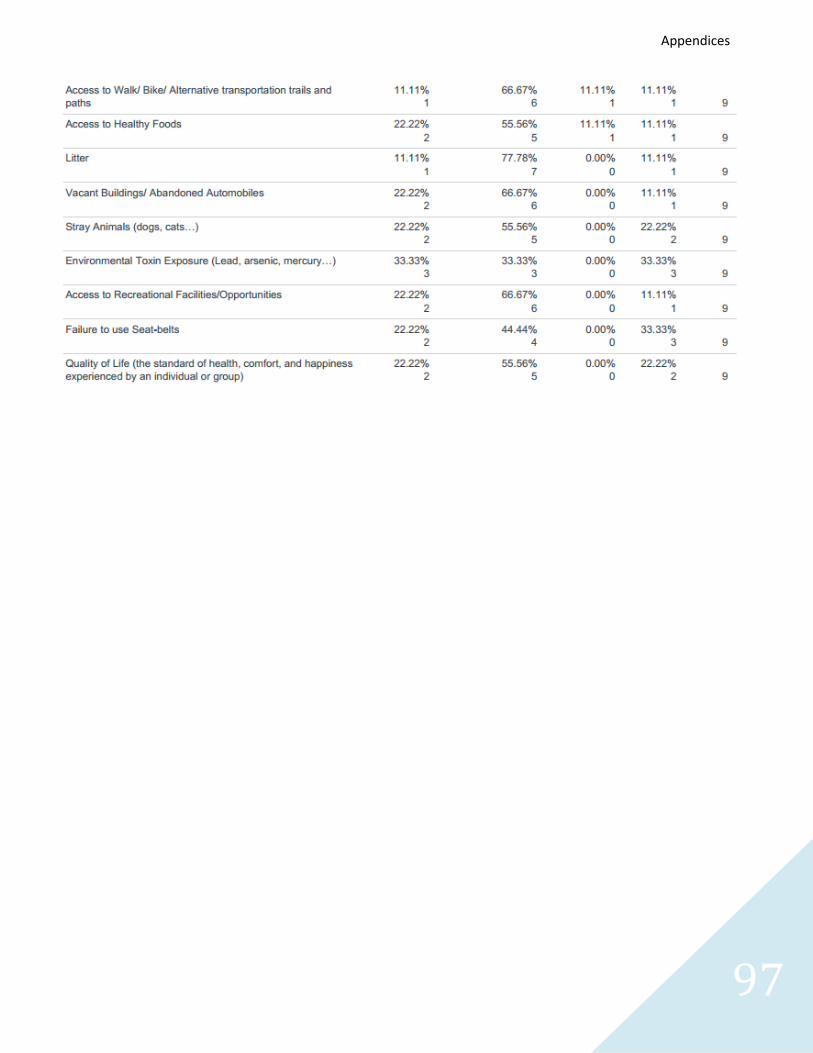
97
Appendices
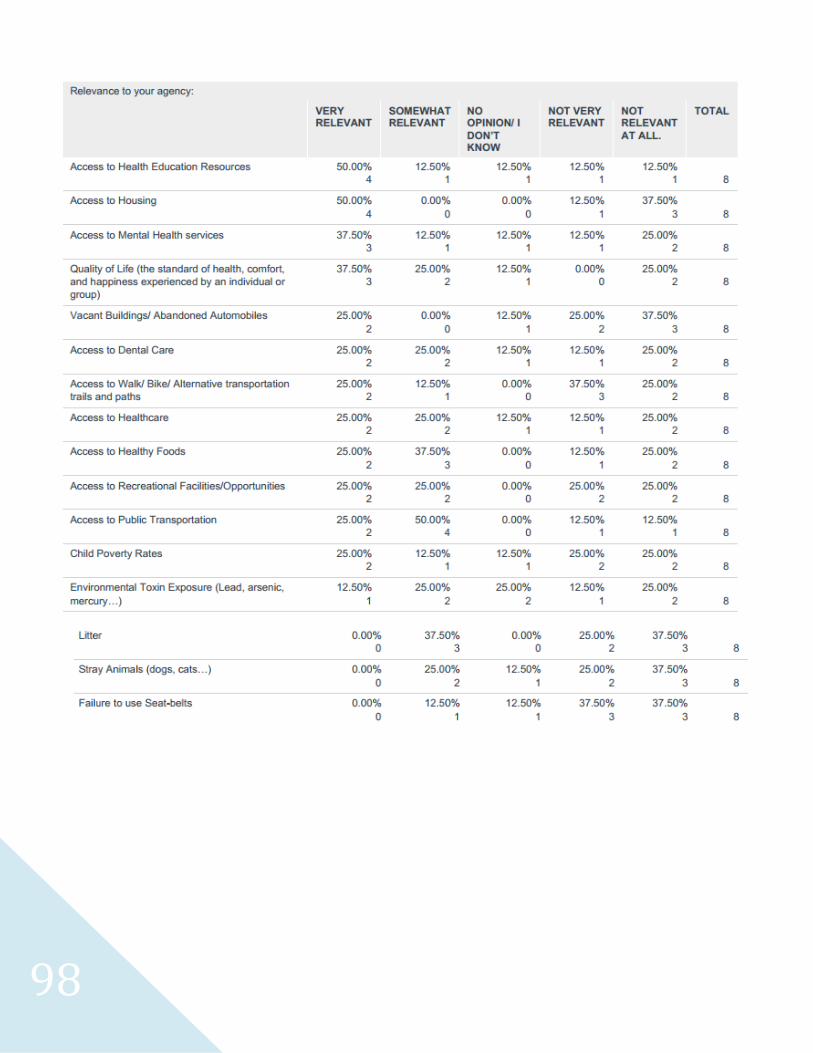
98
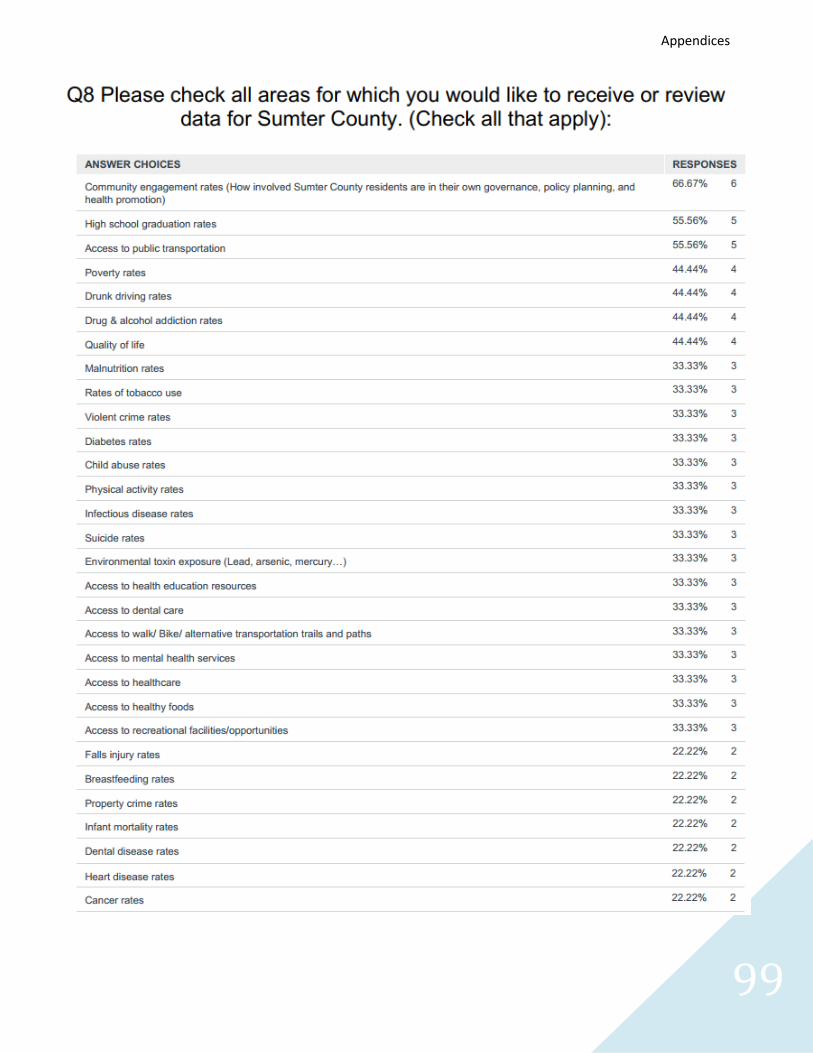
99
Appendices
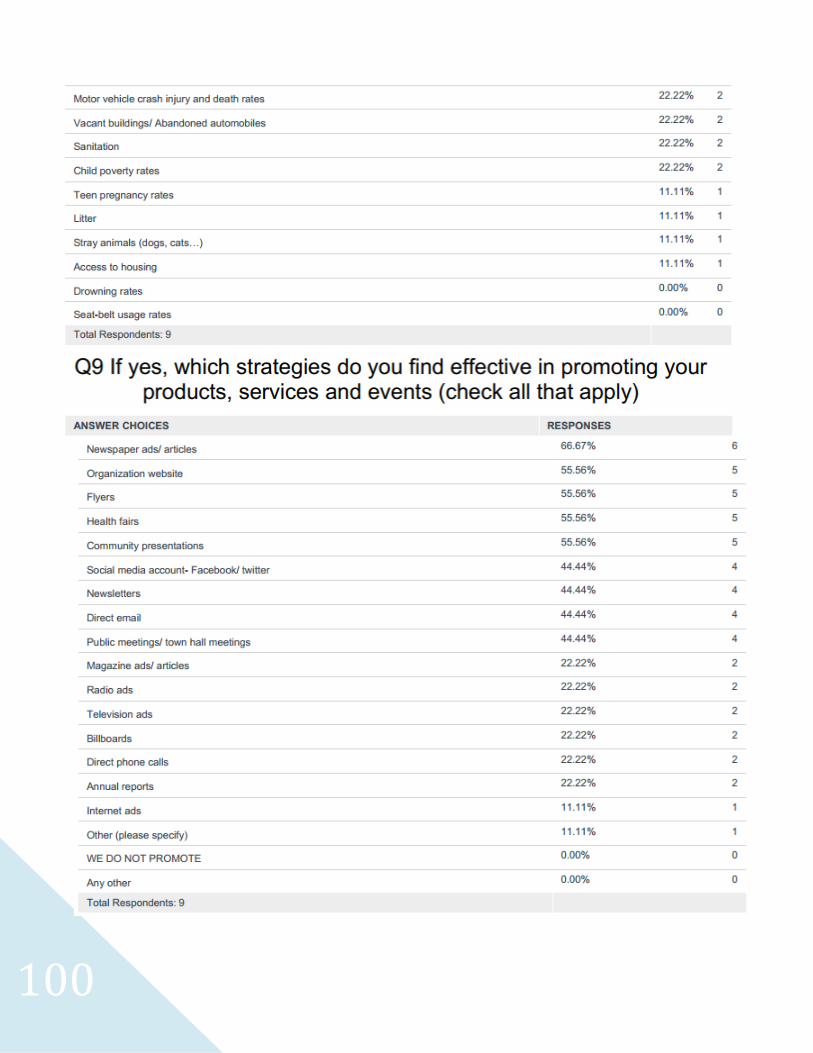
100
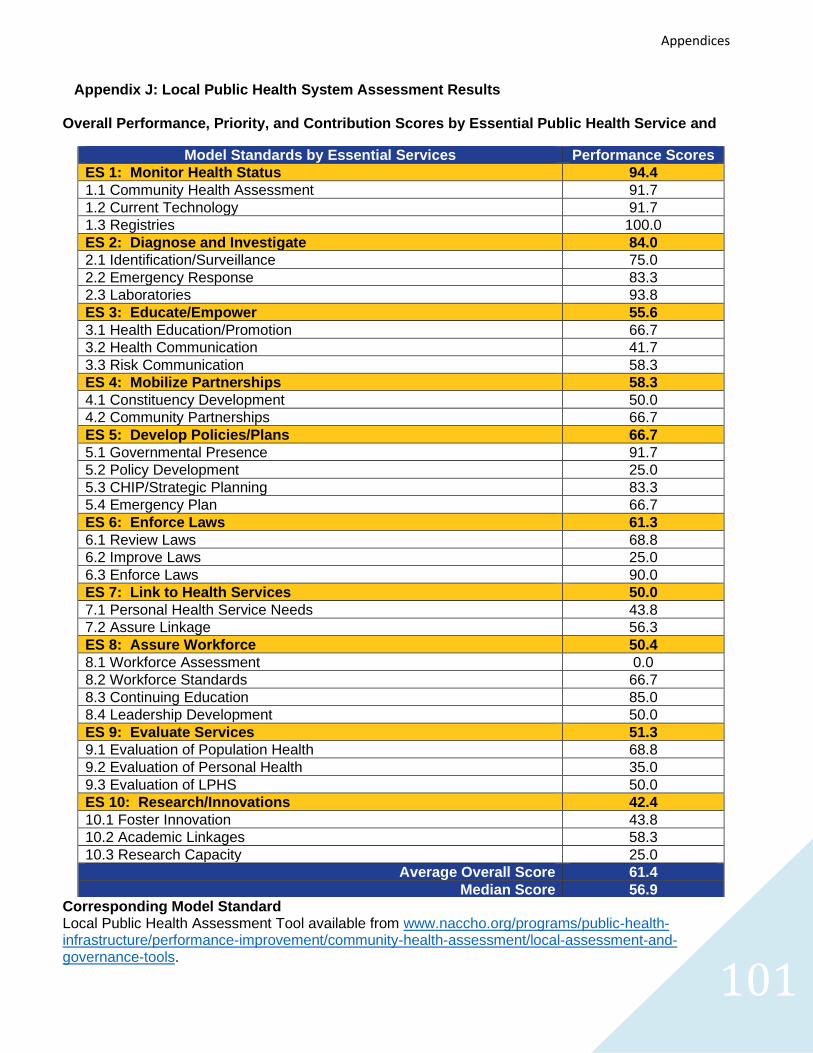
101
Appendices
Appendix J: Local Public Health System Assessment Results Overall Performance, Priority, and Contribution Scores by Essential Public Health Service and
Corresponding Model Standard Local Public Health Assessment Tool available from www.naccho.org/programs/public-health-infrastructure/performance-improvement/community-health-assessment/local-assessment-and-governance-tools.
Model Standards by Essential Services Performance Scores
ES 1: Monitor Health Status 94.4
1.1 Community Health Assessment 91.7
1.2 Current Technology 91.7
1.3 Registries 100.0
ES 2: Diagnose and Investigate 84.0
2.1 Identification/Surveillance 75.0
2.2 Emergency Response 83.3
2.3 Laboratories 93.8
ES 3: Educate/Empower 55.6
3.1 Health Education/Promotion 66.7
3.2 Health Communication 41.7
3.3 Risk Communication 58.3
ES 4: Mobilize Partnerships 58.3
4.1 Constituency Development 50.0
4.2 Community Partnerships 66.7
ES 5: Develop Policies/Plans 66.7
5.1 Governmental Presence 91.7
5.2 Policy Development 25.0
5.3 CHIP/Strategic Planning 83.3
5.4 Emergency Plan 66.7
ES 6: Enforce Laws 61.3
6.1 Review Laws 68.8
6.2 Improve Laws 25.0
6.3 Enforce Laws 90.0
ES 7: Link to Health Services 50.0
7.1 Personal Health Service Needs 43.8
7.2 Assure Linkage 56.3
ES 8: Assure Workforce 50.4
8.1 Workforce Assessment 0.0
8.2 Workforce Standards 66.7
8.3 Continuing Education 85.0
8.4 Leadership Development 50.0
ES 9: Evaluate Services 51.3
9.1 Evaluation of Population Health 68.8
9.2 Evaluation of Personal Health 35.0
9.3 Evaluation of LPHS 50.0
ES 10: Research/Innovations 42.4
10.1 Foster Innovation 43.8
10.2 Academic Linkages 58.3
10.3 Research Capacity 25.0
Average Overall Score 61.4
Median Score 56.9
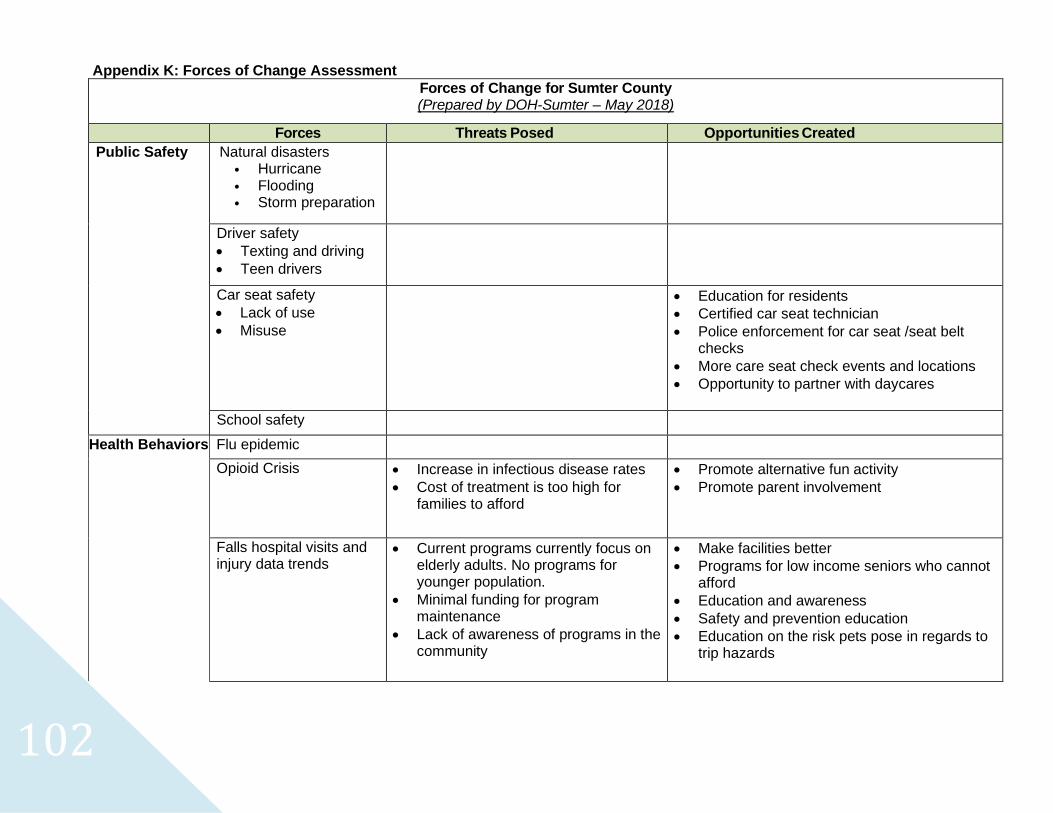
102
Appendix K: Forces of Change Assessment
Forces of Change for Sumter County (Prepared by DOH-Sumter – May 2018)
Forces Threats Posed Opportunities Created
Public Safety Natural disasters • Hurricane • Flooding • Storm preparation
Driver safety
• Texting and driving
• Teen drivers
Car seat safety
• Lack of use
• Misuse
• Education for residents
• Certified car seat technician
• Police enforcement for car seat /seat belt checks
• More care seat check events and locations
• Opportunity to partner with daycares
School safety
Health Behaviors
Flu epidemic
Opioid Crisis
• Increase in infectious disease rates
• Cost of treatment is too high for families to afford
• Promote alternative fun activity
• Promote parent involvement
Falls hospital visits and injury data trends
• Current programs currently focus on elderly adults. No programs for younger population.
• Minimal funding for program maintenance
• Lack of awareness of programs in the community
• Make facilities better
• Programs for low income seniors who cannot afford
• Education and awareness
• Safety and prevention education
• Education on the risk pets pose in regards to trip hazards
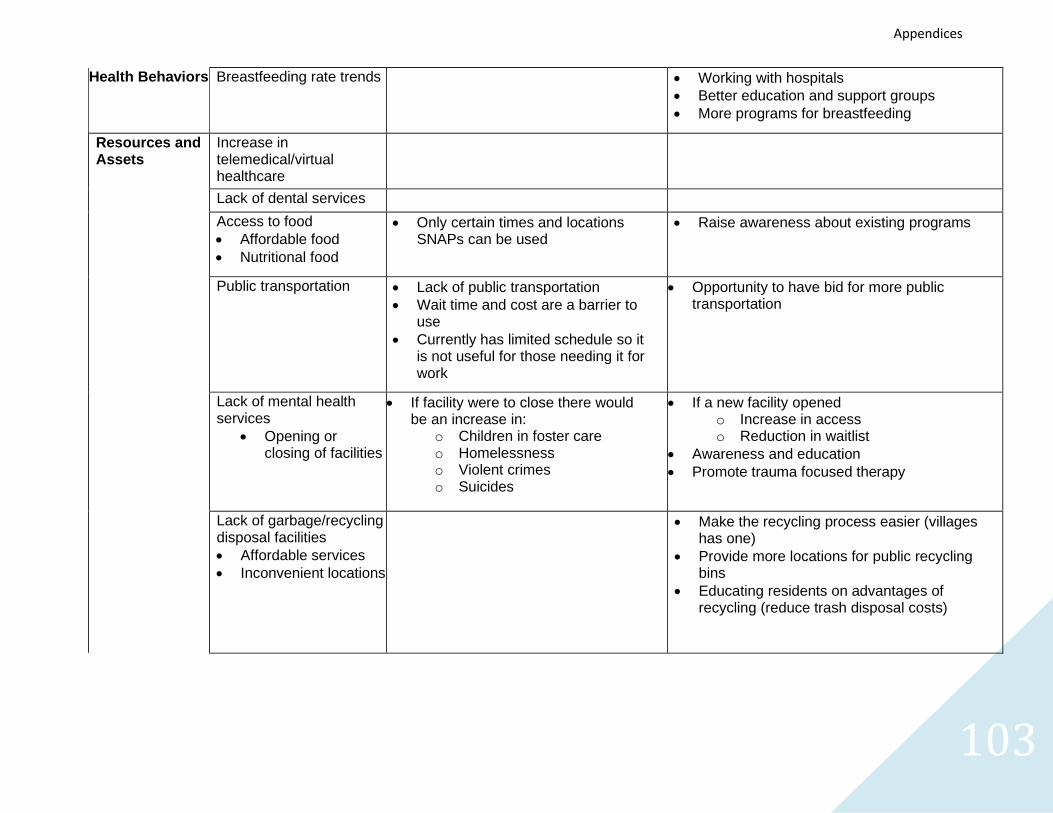
103
Appendices
Health Behaviors Breastfeeding rate trends • Working with hospitals
• Better education and support groups
• More programs for breastfeeding
Resources and Assets
Increase in telemedical/virtual healthcare
Lack of dental services
Access to food
• Affordable food
• Nutritional food
• Only certain times and locations SNAPs can be used
• Raise awareness about existing programs
Public transportation
• Lack of public transportation
• Wait time and cost are a barrier to use
• Currently has limited schedule so it is not useful for those needing it for work
• Opportunity to have bid for more public transportation
Lack of mental health services
• Opening or closing of facilities
• If facility were to close there would be an increase in:
o Children in foster care o Homelessness o Violent crimes o Suicides
• If a new facility opened o Increase in access o Reduction in waitlist
• Awareness and education
• Promote trauma focused therapy
Lack of garbage/recycling disposal facilities
• Affordable services
• Inconvenient locations
• Make the recycling process easier (villages has one)
• Provide more locations for public recycling bins
• Educating residents on advantages of recycling (reduce trash disposal costs)

104
32
38
39
39
40
42
46
48
50
0 10 20 30 40 50 60
Garbage…
Mental health…
Public…
Natural disasters
Access to…
Car seat safety
Breastfeeding…
Opioid crisis
Falls
Impact Score
Total Score
Image K1: Impact Scores
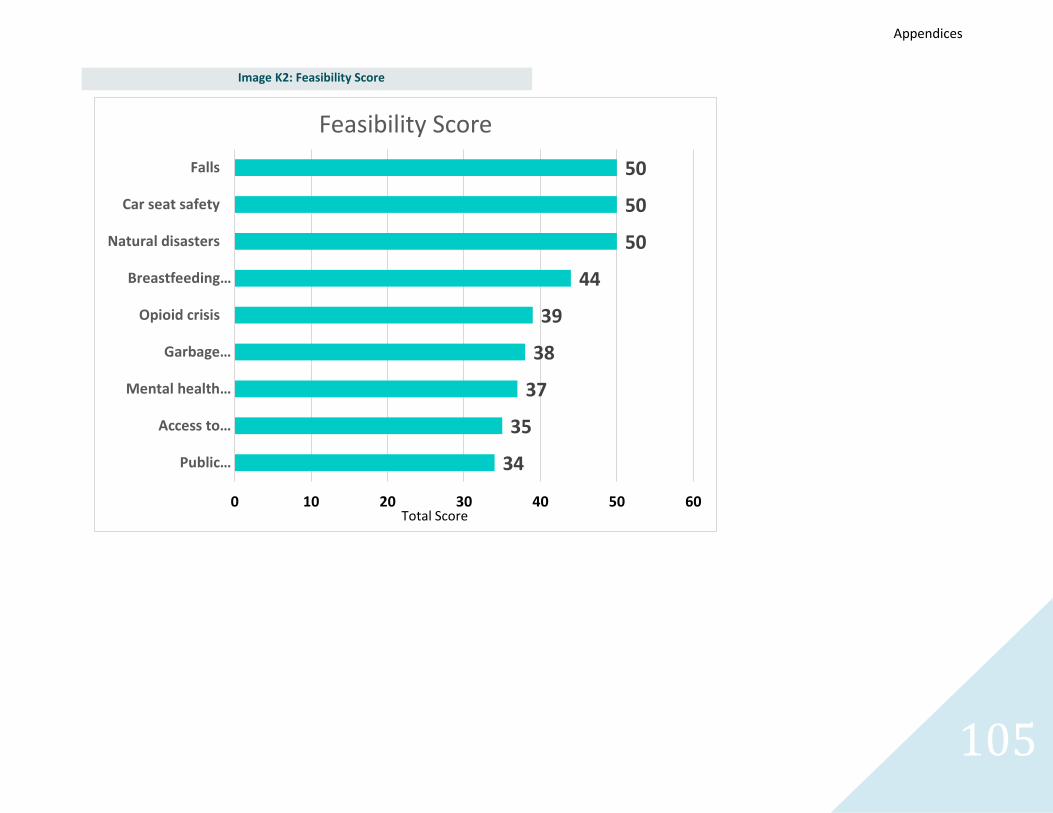
105
Appendices
Image K2: Feasibility Score
34
35
37
38
39
44
50
50
50
0 10 20 30 40 50 60
Public…
Access to…
Mental health…
Garbage…
Opioid crisis
Breastfeeding…
Natural disasters
Car seat safety
Falls
Feasibility Score
Total Score
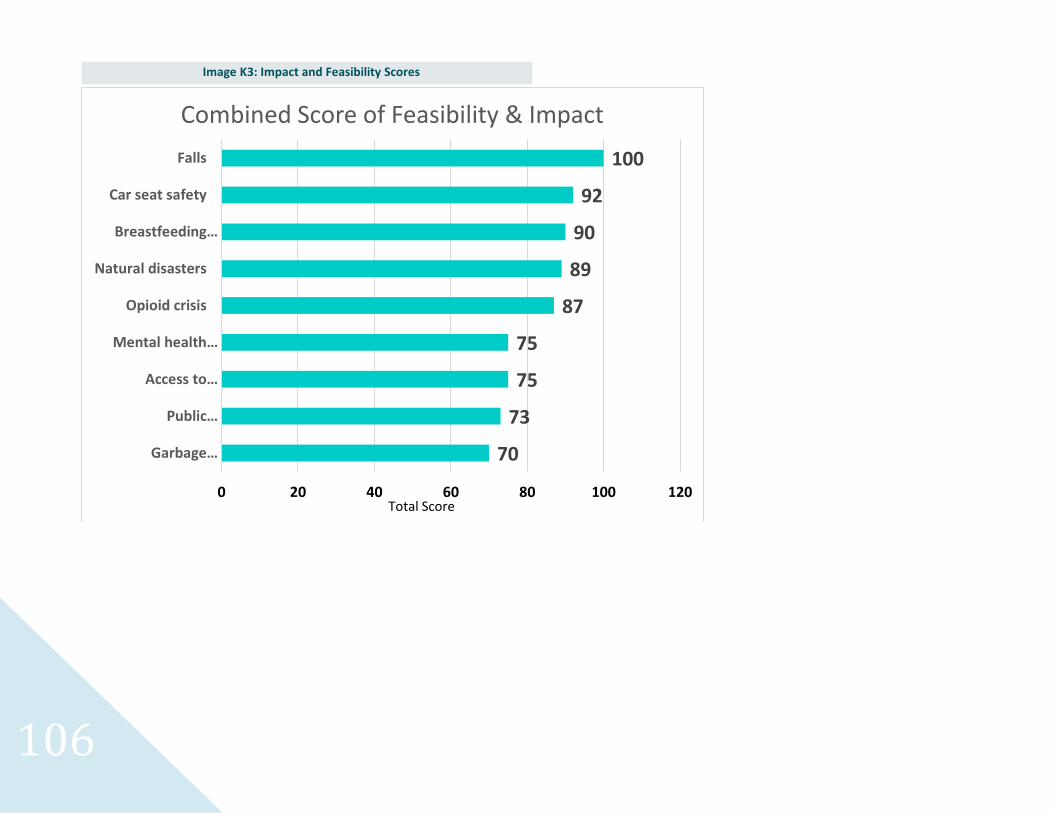
106
70
73
75
75
87
89
90
92
100
0 20 40 60 80 100 120
Garbage…
Public…
Access to…
Mental health…
Opioid crisis
Natural disasters
Breastfeeding…
Car seat safety
Falls
Combined Score of Feasibility & Impact
Total Score
Image K3: Impact and Feasibility Scores
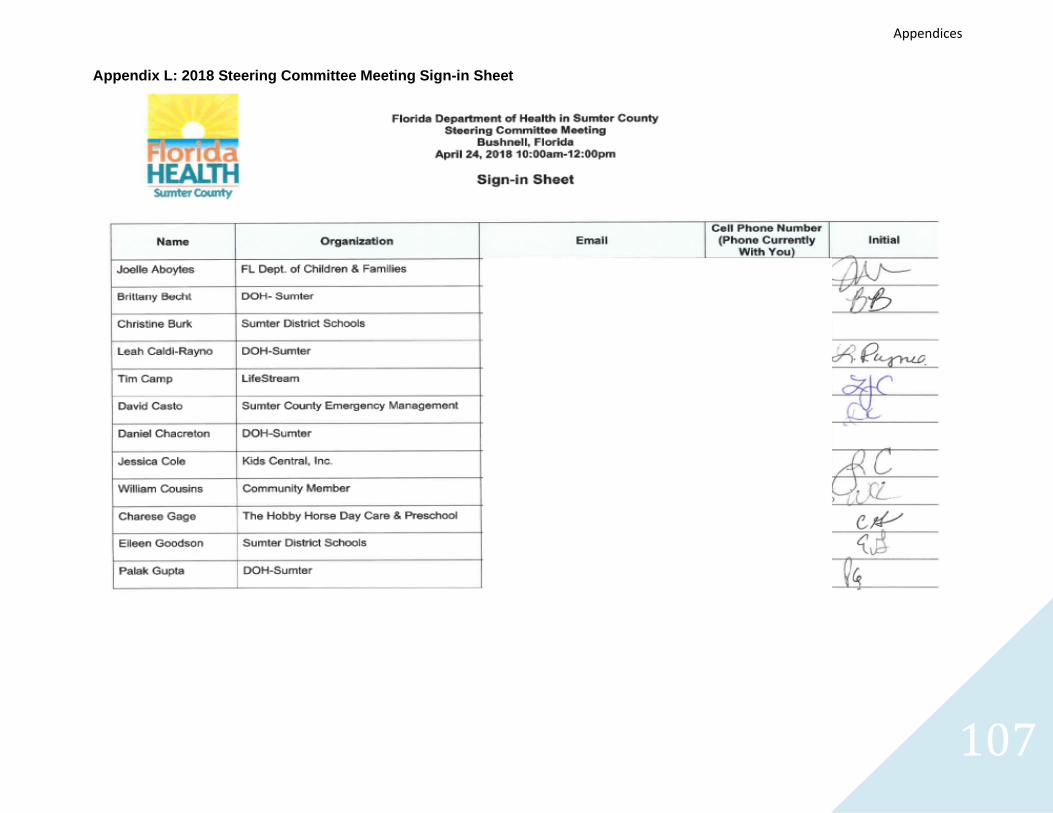
107
Appendices
Appendix L: 2018 Steering Committee Meeting Sign-in Sheet
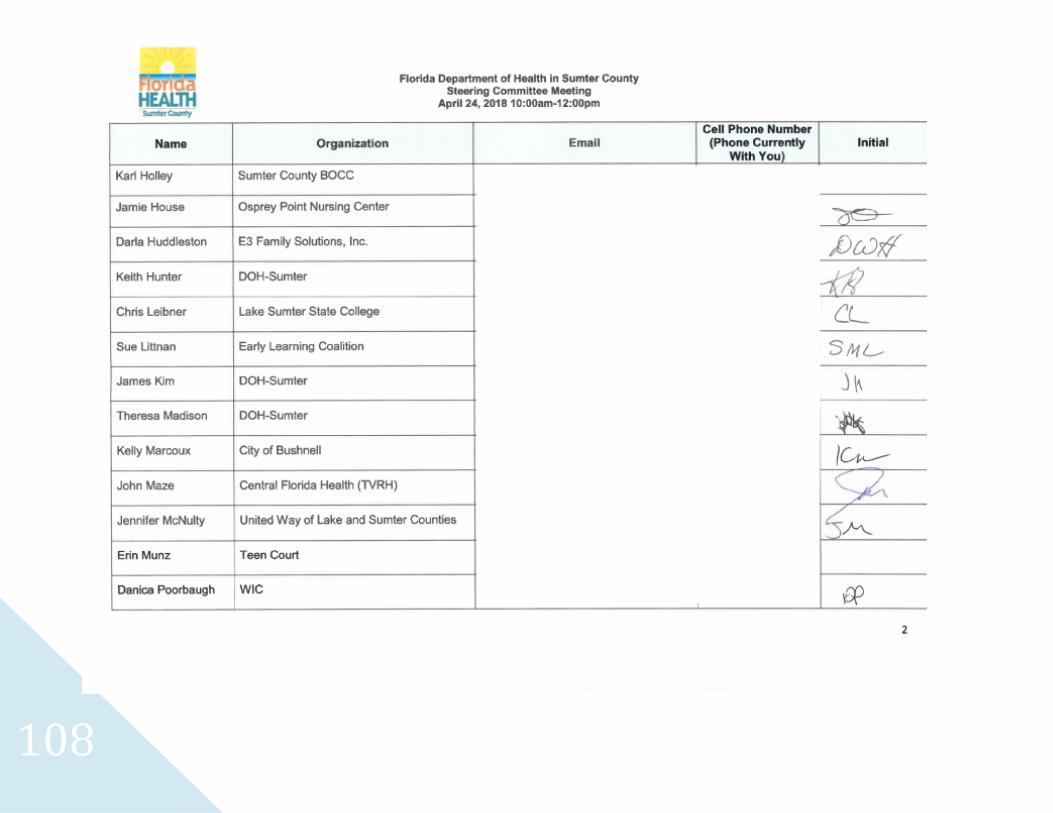
108
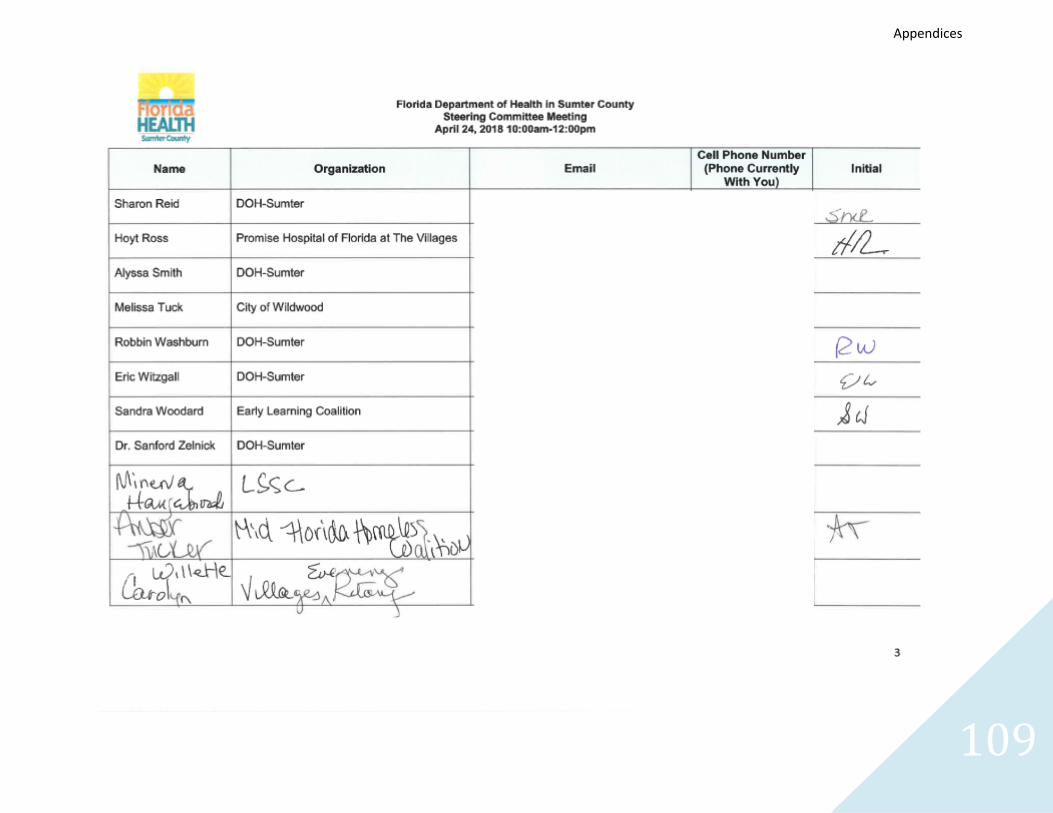
109
Appendices
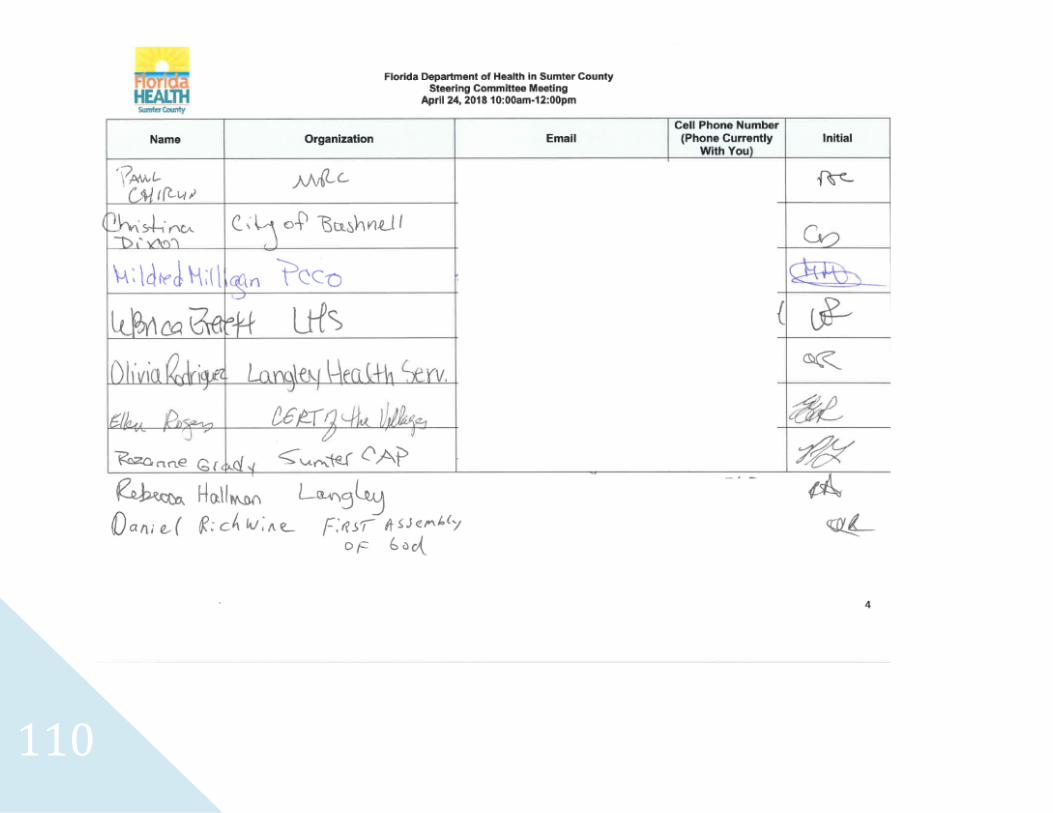
110
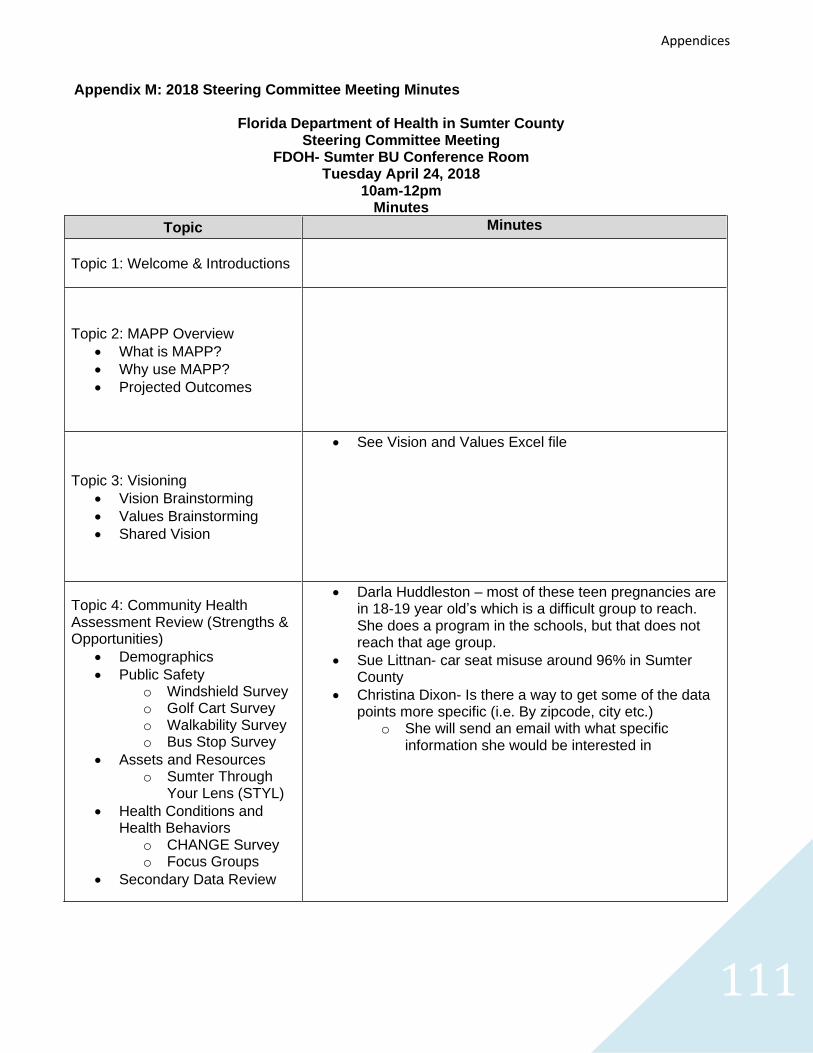
111
Appendices
Appendix M: 2018 Steering Committee Meeting Minutes
Florida Department of Health in Sumter County Steering Committee Meeting
FDOH- Sumter BU Conference Room Tuesday April 24, 2018
10am-12pm Minutes
Topic Minutes
Topic 1: Welcome & Introductions
Topic 2: MAPP Overview
• What is MAPP?
• Why use MAPP?
• Projected Outcomes
Topic 3: Visioning
• Vision Brainstorming
• Values Brainstorming
• Shared Vision
• See Vision and Values Excel file
Topic 4: Community Health Assessment Review (Strengths & Opportunities)
• Demographics
• Public Safety o Windshield Survey o Golf Cart Survey o Walkability Survey o Bus Stop Survey
• Assets and Resources o Sumter Through
Your Lens (STYL)
• Health Conditions and Health Behaviors
o CHANGE Survey o Focus Groups
• Secondary Data Review
• Darla Huddleston – most of these teen pregnancies are in 18-19 year old’s which is a difficult group to reach. She does a program in the schools, but that does not reach that age group.
• Sue Littnan- car seat misuse around 96% in Sumter County
• Christina Dixon- Is there a way to get some of the data points more specific (i.e. By zipcode, city etc.)
o She will send an email with what specific information she would be interested in
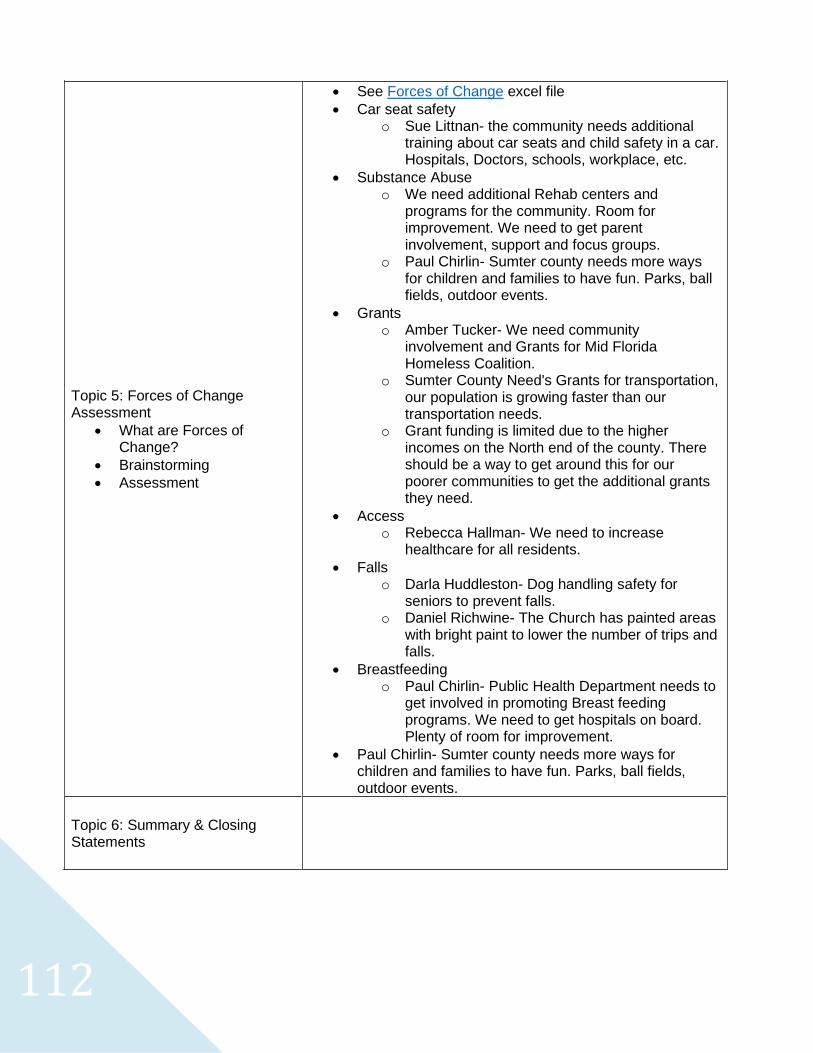
112
Topic 5: Forces of Change Assessment
• What are Forces of Change?
• Brainstorming
• Assessment
• See Forces of Change excel file
• Car seat safety o Sue Littnan- the community needs additional
training about car seats and child safety in a car. Hospitals, Doctors, schools, workplace, etc.
• Substance Abuse o We need additional Rehab centers and
programs for the community. Room for improvement. We need to get parent involvement, support and focus groups.
o Paul Chirlin- Sumter county needs more ways for children and families to have fun. Parks, ball fields, outdoor events.
• Grants o Amber Tucker- We need community
involvement and Grants for Mid Florida Homeless Coalition.
o Sumter County Need's Grants for transportation, our population is growing faster than our transportation needs.
o Grant funding is limited due to the higher incomes on the North end of the county. There should be a way to get around this for our poorer communities to get the additional grants they need.
• Access o Rebecca Hallman- We need to increase
healthcare for all residents.
• Falls o Darla Huddleston- Dog handling safety for
seniors to prevent falls. o Daniel Richwine- The Church has painted areas
with bright paint to lower the number of trips and falls.
• Breastfeeding o Paul Chirlin- Public Health Department needs to
get involved in promoting Breast feeding programs. We need to get hospitals on board. Plenty of room for improvement.
• Paul Chirlin- Sumter county needs more ways for children and families to have fun. Parks, ball fields, outdoor events.
Topic 6: Summary & Closing Statements
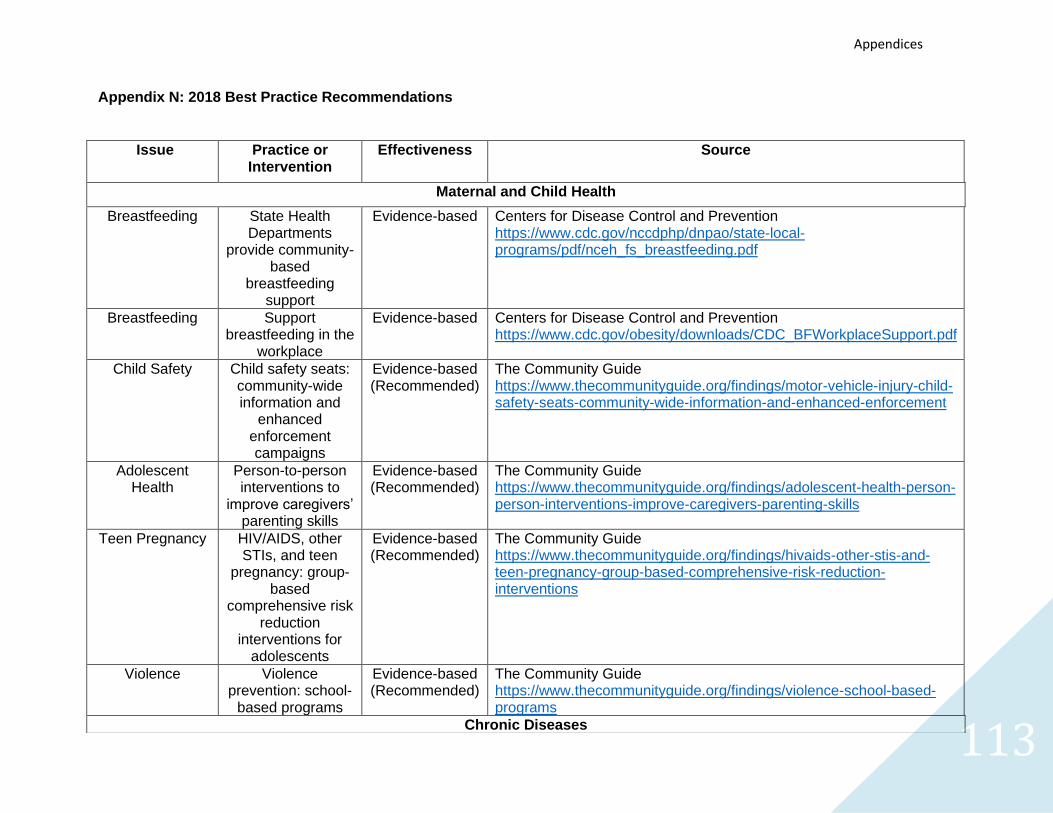
113
Appendices
Appendix N: 2018 Best Practice Recommendations
Issue Practice or Intervention
Effectiveness Source
Maternal and Child Health
Breastfeeding State Health Departments
provide community-based
breastfeeding support
Evidence-based Centers for Disease Control and Prevention https://www.cdc.gov/nccdphp/dnpao/state-local-programs/pdf/nceh_fs_breastfeeding.pdf
Breastfeeding Support breastfeeding in the
workplace
Evidence-based Centers for Disease Control and Prevention https://www.cdc.gov/obesity/downloads/CDC_BFWorkplaceSupport.pdf
Child Safety Child safety seats: community-wide information and
enhanced enforcement campaigns
Evidence-based (Recommended)
The Community Guide https://www.thecommunityguide.org/findings/motor-vehicle-injury-child-safety-seats-community-wide-information-and-enhanced-enforcement
Adolescent Health
Person-to-person interventions to
improve caregivers’ parenting skills
Evidence-based (Recommended)
The Community Guide https://www.thecommunityguide.org/findings/adolescent-health-person-person-interventions-improve-caregivers-parenting-skills
Teen Pregnancy HIV/AIDS, other STIs, and teen
pregnancy: group-based
comprehensive risk reduction
interventions for adolescents
Evidence-based (Recommended)
The Community Guide https://www.thecommunityguide.org/findings/hivaids-other-stis-and-teen-pregnancy-group-based-comprehensive-risk-reduction-interventions
Violence Violence prevention: school-
based programs
Evidence-based (Recommended)
The Community Guide https://www.thecommunityguide.org/findings/violence-school-based-programs
Chronic Diseases
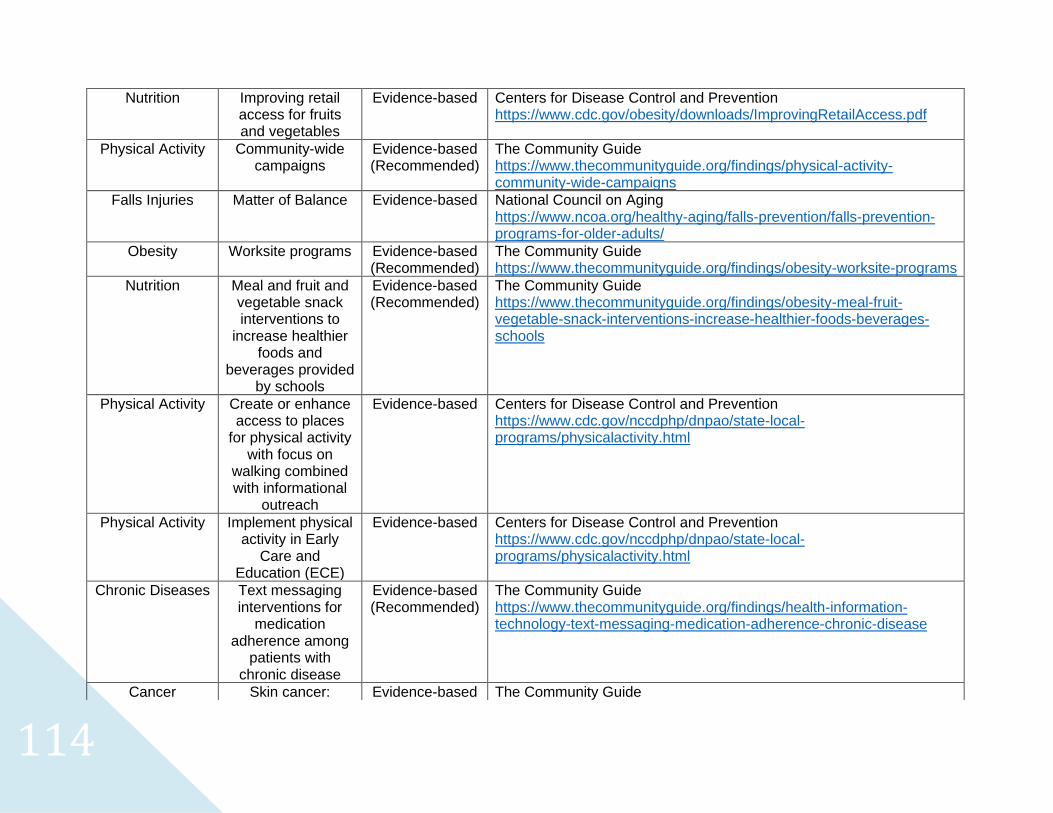
114
Nutrition Improving retail access for fruits and vegetables
Evidence-based Centers for Disease Control and Prevention https://www.cdc.gov/obesity/downloads/ImprovingRetailAccess.pdf
Physical Activity Community-wide campaigns
Evidence-based (Recommended)
The Community Guide https://www.thecommunityguide.org/findings/physical-activity-community-wide-campaigns
Falls Injuries Matter of Balance Evidence-based National Council on Aging https://www.ncoa.org/healthy-aging/falls-prevention/falls-prevention-programs-for-older-adults/
Obesity Worksite programs Evidence-based (Recommended)
The Community Guide https://www.thecommunityguide.org/findings/obesity-worksite-programs
Nutrition Meal and fruit and vegetable snack interventions to
increase healthier foods and
beverages provided by schools
Evidence-based (Recommended)
The Community Guide https://www.thecommunityguide.org/findings/obesity-meal-fruit-vegetable-snack-interventions-increase-healthier-foods-beverages-schools
Physical Activity Create or enhance access to places
for physical activity with focus on
walking combined with informational
outreach
Evidence-based Centers for Disease Control and Prevention https://www.cdc.gov/nccdphp/dnpao/state-local-programs/physicalactivity.html
Physical Activity Implement physical activity in Early
Care and Education (ECE)
Evidence-based Centers for Disease Control and Prevention https://www.cdc.gov/nccdphp/dnpao/state-local-programs/physicalactivity.html
Chronic Diseases Text messaging interventions for
medication adherence among
patients with chronic disease
Evidence-based (Recommended)
The Community Guide https://www.thecommunityguide.org/findings/health-information-technology-text-messaging-medication-adherence-chronic-disease
Cancer Skin cancer: Evidence-based The Community Guide
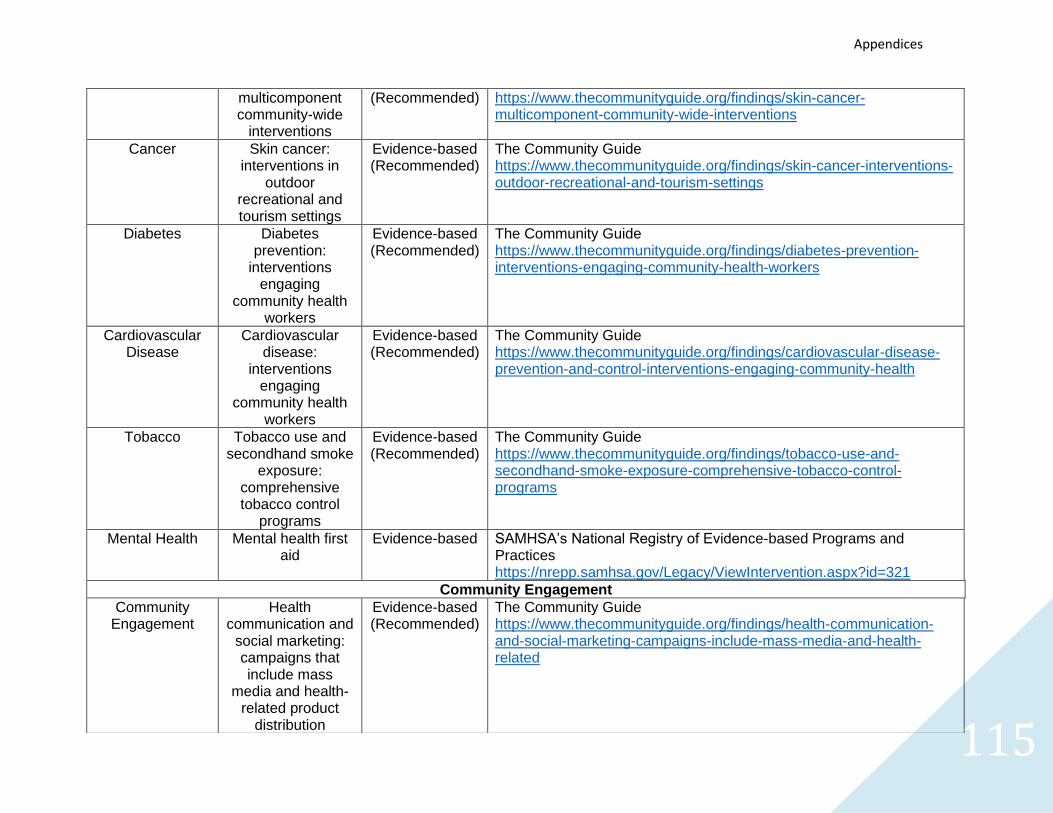
115
Appendices
multicomponent community-wide
interventions
(Recommended) https://www.thecommunityguide.org/findings/skin-cancer-multicomponent-community-wide-interventions
Cancer Skin cancer: interventions in
outdoor recreational and tourism settings
Evidence-based (Recommended)
The Community Guide https://www.thecommunityguide.org/findings/skin-cancer-interventions-outdoor-recreational-and-tourism-settings
Diabetes Diabetes prevention:
interventions engaging
community health workers
Evidence-based (Recommended)
The Community Guide https://www.thecommunityguide.org/findings/diabetes-prevention-interventions-engaging-community-health-workers
Cardiovascular Disease
Cardiovascular disease:
interventions engaging
community health workers
Evidence-based (Recommended)
The Community Guide https://www.thecommunityguide.org/findings/cardiovascular-disease-prevention-and-control-interventions-engaging-community-health
Tobacco Tobacco use and secondhand smoke
exposure: comprehensive tobacco control
programs
Evidence-based (Recommended)
The Community Guide https://www.thecommunityguide.org/findings/tobacco-use-and-secondhand-smoke-exposure-comprehensive-tobacco-control-programs
Mental Health Mental health first aid
Evidence-based SAMHSA’s National Registry of Evidence-based Programs and Practices https://nrepp.samhsa.gov/Legacy/ViewIntervention.aspx?id=321
Community Engagement
Community Engagement
Health communication and
social marketing: campaigns that include mass
media and health-related product
distribution
Evidence-based (Recommended)
The Community Guide https://www.thecommunityguide.org/findings/health-communication-and-social-marketing-campaigns-include-mass-media-and-health-related
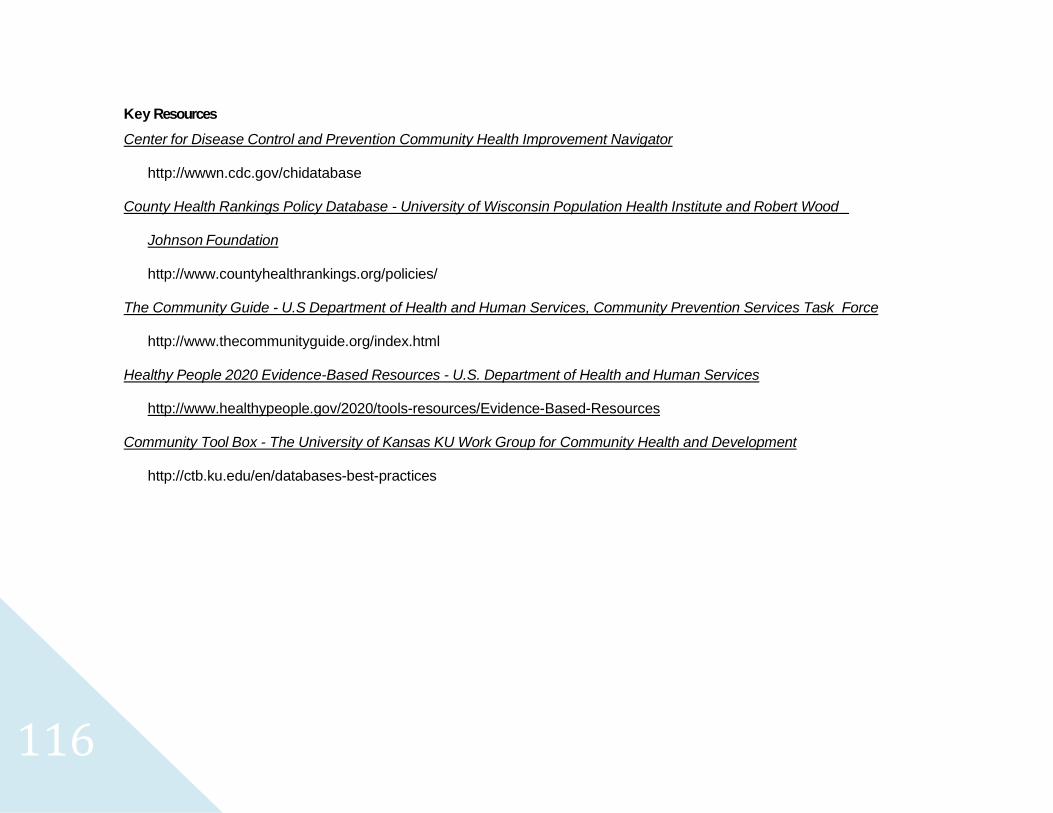
116
Key Resources
Center for Disease Control and Prevention Community Health Improvement Navigator
http://wwwn.cdc.gov/chidatabase
County Health Rankings Policy Database - University of Wisconsin Population Health Institute and Robert Wood
Johnson Foundation
http://www.countyhealthrankings.org/policies/
The Community Guide - U.S Department of Health and Human Services, Community Prevention Services Task Force
http://www.thecommunityguide.org/index.html
Healthy People 2020 Evidence-Based Resources - U.S. Department of Health and Human Services
http://www.healthypeople.gov/2020/tools-resources/Evidence-Based-Resources
Community Tool Box - The University of Kansas KU Work Group for Community Health and Development
http://ctb.ku.edu/en/databases-best-practices

[This page was left intentionally blank]
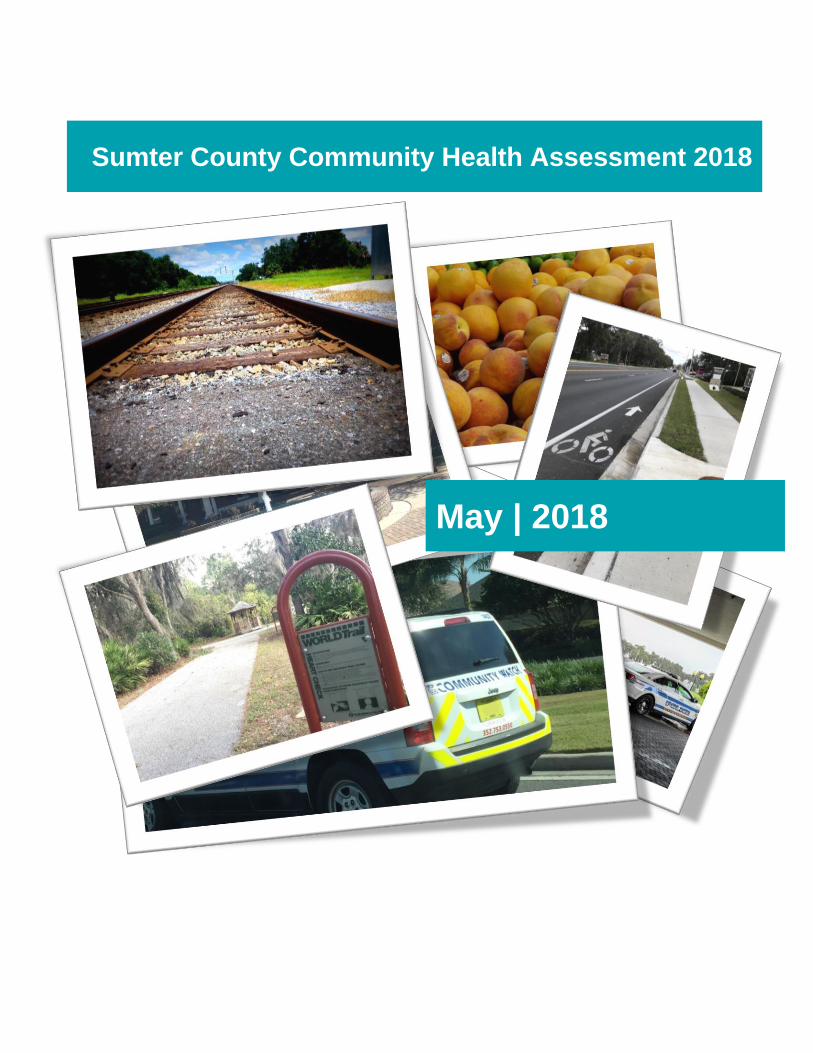
May | 2018
Sumter County Community Health Assessment 2018
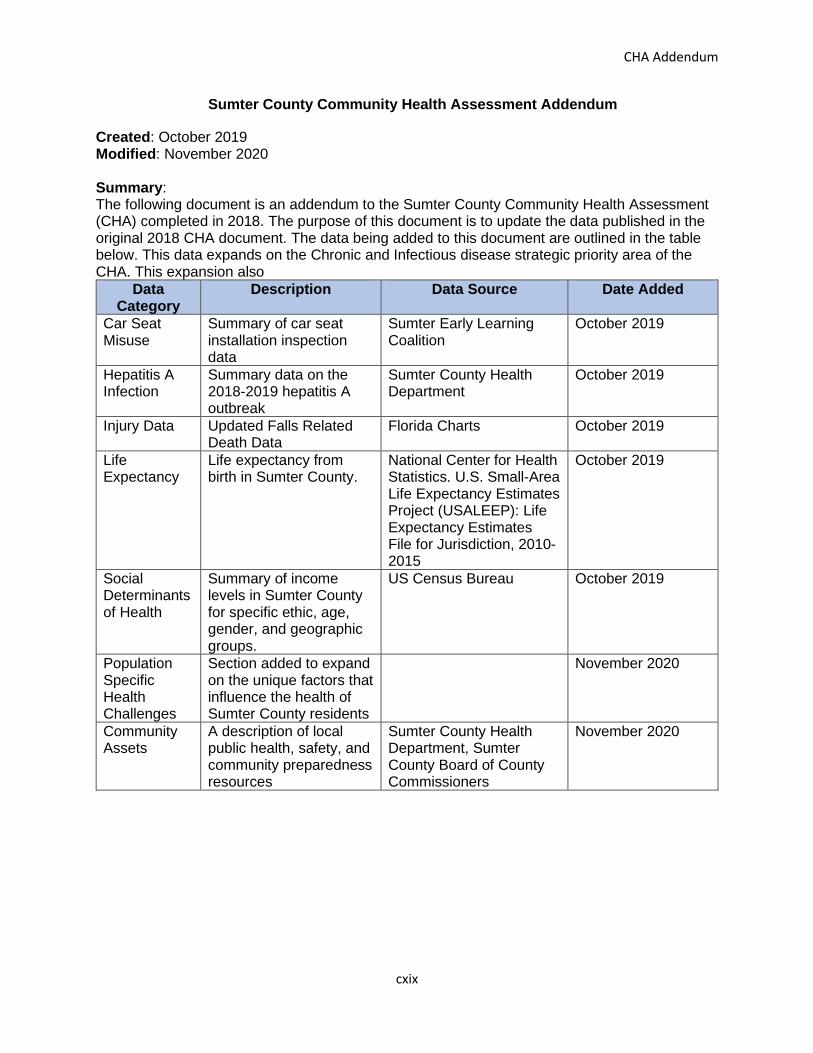
CHA Addendum
cxix
Sumter County Community Health Assessment Addendum
Created: October 2019 Modified: November 2020 Summary: The following document is an addendum to the Sumter County Community Health Assessment (CHA) completed in 2018. The purpose of this document is to update the data published in the original 2018 CHA document. The data being added to this document are outlined in the table below. This data expands on the Chronic and Infectious disease strategic priority area of the CHA. This expansion also
Data Category
Description Data Source Date Added
Car Seat Misuse
Summary of car seat installation inspection data
Sumter Early Learning Coalition
October 2019
Hepatitis A Infection
Summary data on the 2018-2019 hepatitis A outbreak
Sumter County Health Department
October 2019
Injury Data Updated Falls Related Death Data
Florida Charts October 2019
Life Expectancy
Life expectancy from birth in Sumter County.
National Center for Health Statistics. U.S. Small-Area Life Expectancy Estimates Project (USALEEP): Life Expectancy Estimates File for Jurisdiction, 2010-2015
October 2019
Social Determinants of Health
Summary of income levels in Sumter County for specific ethic, age, gender, and geographic groups.
US Census Bureau October 2019
Population Specific Health Challenges
Section added to expand on the unique factors that influence the health of Sumter County residents
November 2020
Community Assets
A description of local public health, safety, and community preparedness resources
Sumter County Health Department, Sumter County Board of County Commissioners
November 2020
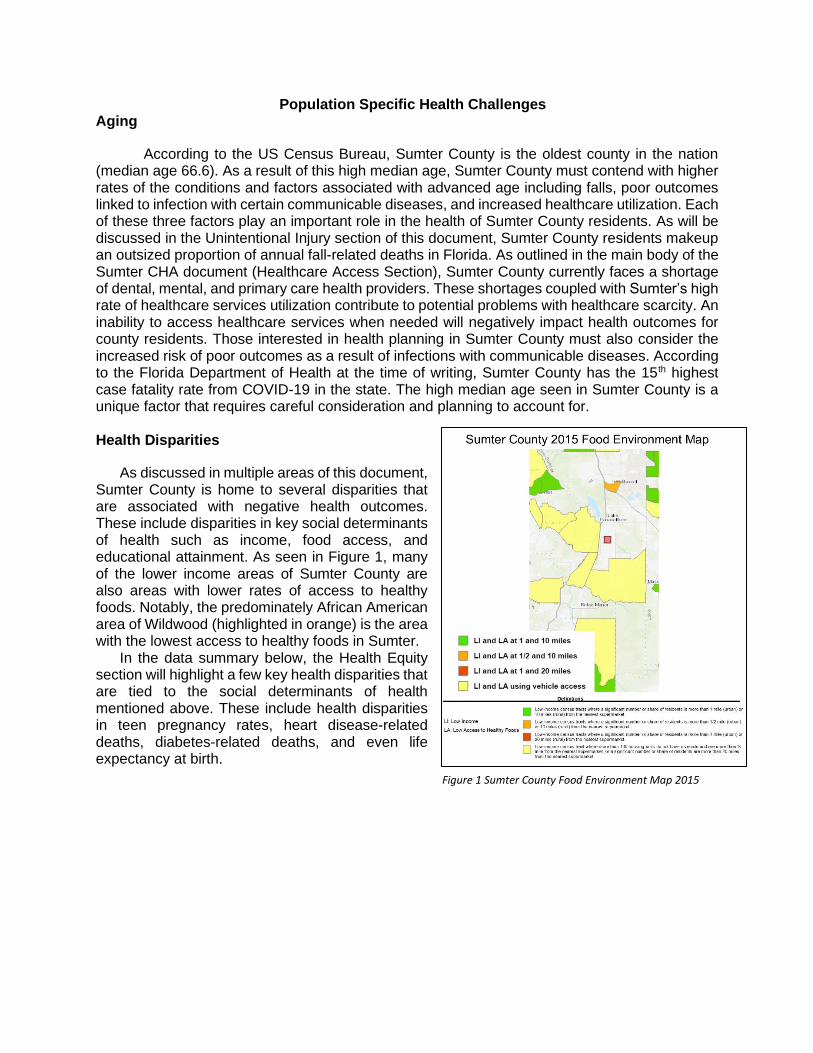
Population Specific Health Challenges Aging
According to the US Census Bureau, Sumter County is the oldest county in the nation (median age 66.6). As a result of this high median age, Sumter County must contend with higher rates of the conditions and factors associated with advanced age including falls, poor outcomes linked to infection with certain communicable diseases, and increased healthcare utilization. Each of these three factors play an important role in the health of Sumter County residents. As will be discussed in the Unintentional Injury section of this document, Sumter County residents makeup an outsized proportion of annual fall-related deaths in Florida. As outlined in the main body of the Sumter CHA document (Healthcare Access Section), Sumter County currently faces a shortage of dental, mental, and primary care health providers. These shortages coupled with Sumter’s high rate of healthcare services utilization contribute to potential problems with healthcare scarcity. An inability to access healthcare services when needed will negatively impact health outcomes for county residents. Those interested in health planning in Sumter County must also consider the increased risk of poor outcomes as a result of infections with communicable diseases. According to the Florida Department of Health at the time of writing, Sumter County has the 15th highest case fatality rate from COVID-19 in the state. The high median age seen in Sumter County is a unique factor that requires careful consideration and planning to account for. Health Disparities
As discussed in multiple areas of this document, Sumter County is home to several disparities that are associated with negative health outcomes. These include disparities in key social determinants of health such as income, food access, and educational attainment. As seen in Figure 1, many of the lower income areas of Sumter County are also areas with lower rates of access to healthy foods. Notably, the predominately African American area of Wildwood (highlighted in orange) is the area with the lowest access to healthy foods in Sumter.
In the data summary below, the Health Equity section will highlight a few key health disparities that are tied to the social determinants of health mentioned above. These include health disparities in teen pregnancy rates, heart disease-related deaths, diabetes-related deaths, and even life expectancy at birth. Figure 1 Sumter County Food Environment Map 2015
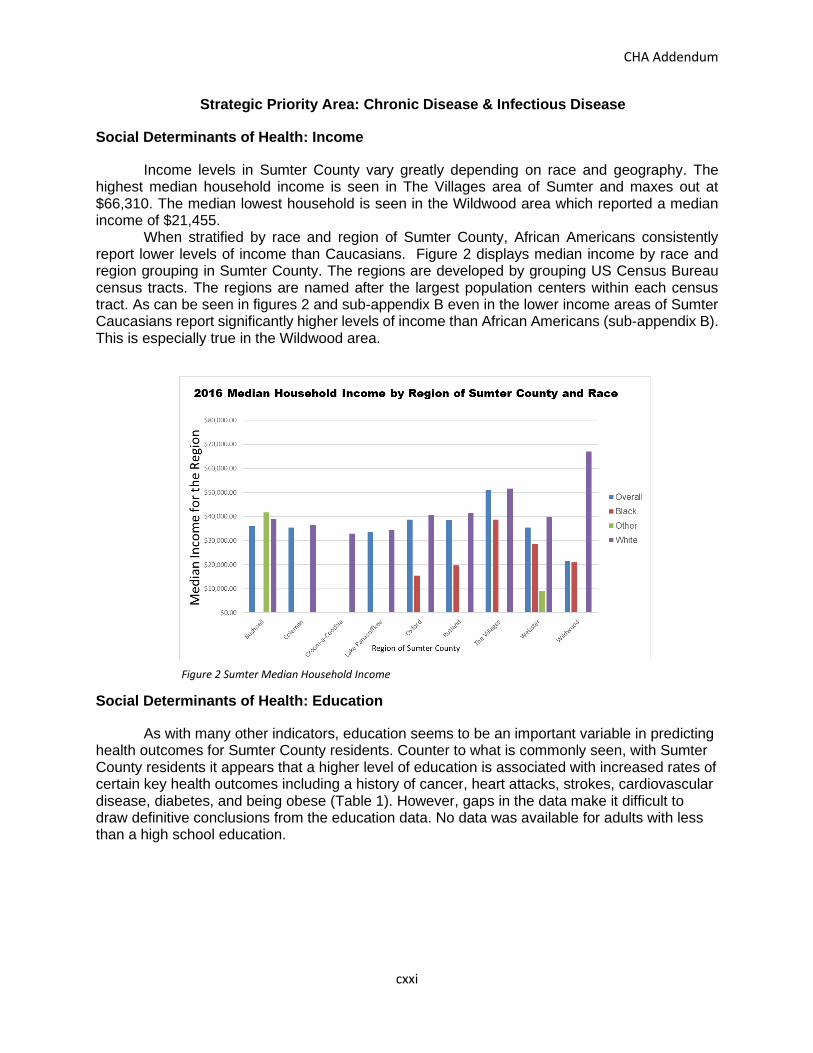
CHA Addendum
cxxi
Strategic Priority Area: Chronic Disease & Infectious Disease
Social Determinants of Health: Income
Income levels in Sumter County vary greatly depending on race and geography. The highest median household income is seen in The Villages area of Sumter and maxes out at $66,310. The median lowest household is seen in the Wildwood area which reported a median income of $21,455.
When stratified by race and region of Sumter County, African Americans consistently report lower levels of income than Caucasians. Figure 2 displays median income by race and region grouping in Sumter County. The regions are developed by grouping US Census Bureau census tracts. The regions are named after the largest population centers within each census tract. As can be seen in figures 2 and sub-appendix B even in the lower income areas of Sumter Caucasians report significantly higher levels of income than African Americans (sub-appendix B). This is especially true in the Wildwood area.
Social Determinants of Health: Education
As with many other indicators, education seems to be an important variable in predicting health outcomes for Sumter County residents. Counter to what is commonly seen, with Sumter County residents it appears that a higher level of education is associated with increased rates of certain key health outcomes including a history of cancer, heart attacks, strokes, cardiovascular disease, diabetes, and being obese (Table 1). However, gaps in the data make it difficult to draw definitive conclusions from the education data. No data was available for adults with less than a high school education.
Figure 2 Sumter Median Household Income
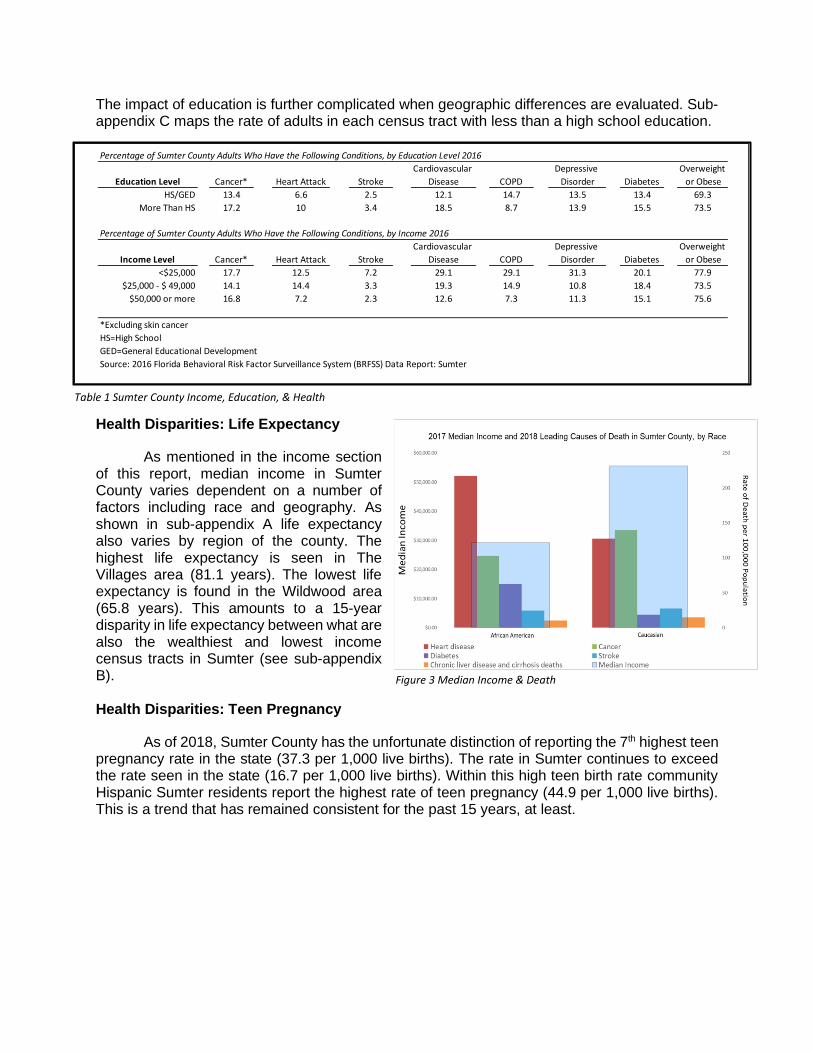
The impact of education is further complicated when geographic differences are evaluated. Sub-appendix C maps the rate of adults in each census tract with less than a high school education.
Health Disparities: Life Expectancy
As mentioned in the income section of this report, median income in Sumter County varies dependent on a number of factors including race and geography. As shown in sub-appendix A life expectancy also varies by region of the county. The highest life expectancy is seen in The Villages area (81.1 years). The lowest life expectancy is found in the Wildwood area (65.8 years). This amounts to a 15-year disparity in life expectancy between what are also the wealthiest and lowest income census tracts in Sumter (see sub-appendix B).
Health Disparities: Teen Pregnancy
As of 2018, Sumter County has the unfortunate distinction of reporting the 7th highest teen pregnancy rate in the state (37.3 per 1,000 live births). The rate in Sumter continues to exceed the rate seen in the state (16.7 per 1,000 live births). Within this high teen birth rate community Hispanic Sumter residents report the highest rate of teen pregnancy (44.9 per 1,000 live births). This is a trend that has remained consistent for the past 15 years, at least.
Education Level Cancer* Heart Attack Stroke
Cardiovascular
Disease COPD
Depressive
Disorder Diabetes
Overweight
or Obese
HS/GED 13.4 6.6 2.5 12.1 14.7 13.5 13.4 69.3
More Than HS 17.2 10 3.4 18.5 8.7 13.9 15.5 73.5
Income Level Cancer* Heart Attack Stroke
Cardiovascular
Disease COPD
Depressive
Disorder Diabetes
Overweight
or Obese
<$25,000 17.7 12.5 7.2 29.1 29.1 31.3 20.1 77.9
$25,000 - $ 49,000 14.1 14.4 3.3 19.3 14.9 10.8 18.4 73.5
$50,000 or more 16.8 7.2 2.3 12.6 7.3 11.3 15.1 75.6
GED=General Educational Development
Source: 2016 Florida Behavioral Risk Factor Surveillance System (BRFSS) Data Report: Sumter
Percentage of Sumter County Adults Who Have the Following Conditions, by Income 2016
Percentage of Sumter County Adults Who Have the Following Conditions, by Education Level 2016
*Excluding skin cancer
HS=High School
Table 1 Sumter County Income, Education, & Health
Figure 3 Median Income & Death
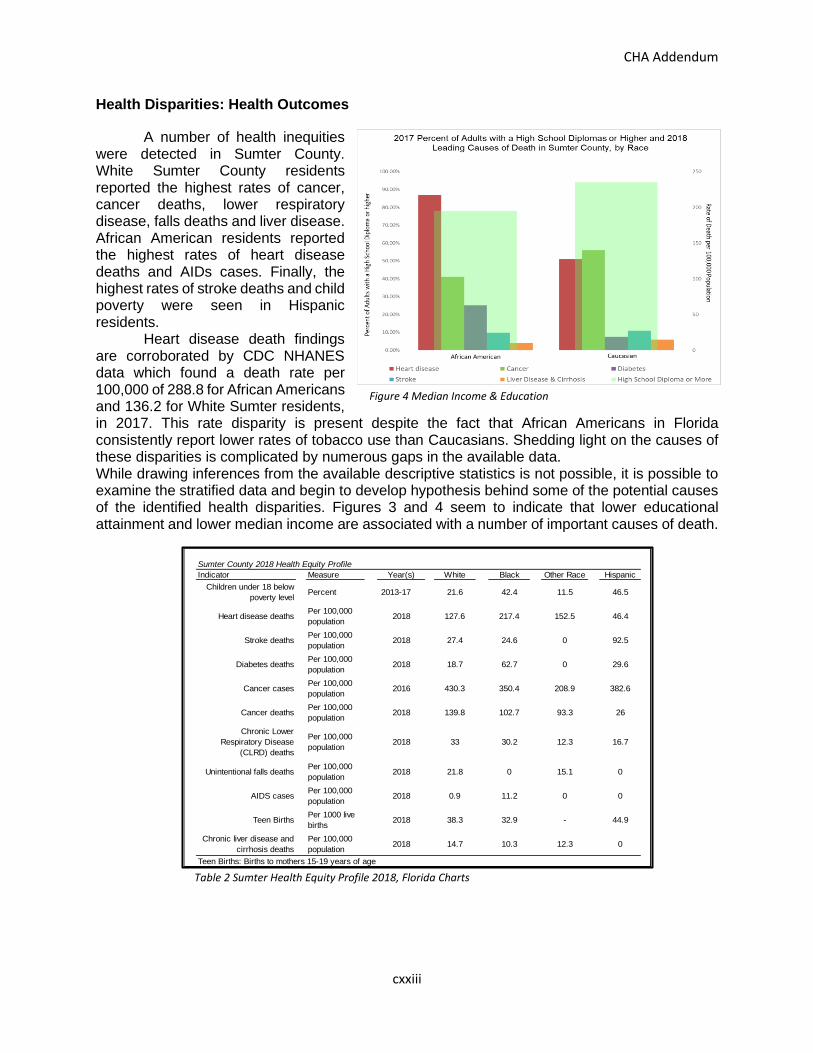
CHA Addendum
cxxiii
Health Disparities: Health Outcomes
A number of health inequities were detected in Sumter County. White Sumter County residents reported the highest rates of cancer, cancer deaths, lower respiratory disease, falls deaths and liver disease. African American residents reported the highest rates of heart disease deaths and AIDs cases. Finally, the highest rates of stroke deaths and child poverty were seen in Hispanic residents.
Heart disease death findings are corroborated by CDC NHANES data which found a death rate per 100,000 of 288.8 for African Americans and 136.2 for White Sumter residents, in 2017. This rate disparity is present despite the fact that African Americans in Florida consistently report lower rates of tobacco use than Caucasians. Shedding light on the causes of these disparities is complicated by numerous gaps in the available data. While drawing inferences from the available descriptive statistics is not possible, it is possible to examine the stratified data and begin to develop hypothesis behind some of the potential causes of the identified health disparities. Figures 3 and 4 seem to indicate that lower educational attainment and lower median income are associated with a number of important causes of death.
Table 2 Sumter Health Equity Profile 2018, Florida Charts
Indicator Measure Year(s) White Black Other Race Hispanic
Children under 18 below
poverty levelPercent 2013-17 21.6 42.4 11.5 46.5
Heart disease deathsPer 100,000
population2018 127.6 217.4 152.5 46.4
Stroke deathsPer 100,000
population2018 27.4 24.6 0 92.5
Diabetes deathsPer 100,000
population2018 18.7 62.7 0 29.6
Cancer casesPer 100,000
population2016 430.3 350.4 208.9 382.6
Cancer deathsPer 100,000
population2018 139.8 102.7 93.3 26
Chronic Lower
Respiratory Disease
(CLRD) deaths
Per 100,000
population2018 33 30.2 12.3 16.7
Unintentional falls deathsPer 100,000
population2018 21.8 0 15.1 0
AIDS casesPer 100,000
population2018 0.9 11.2 0 0
Teen BirthsPer 1000 live
births2018 38.3 32.9 - 44.9
Chronic liver disease and
cirrhosis deaths
Per 100,000
population2018 14.7 10.3 12.3 0
Teen Births: Births to mothers 15-19 years of age
Sumter County 2018 Health Equity Profile
Figure 4 Median Income & Education
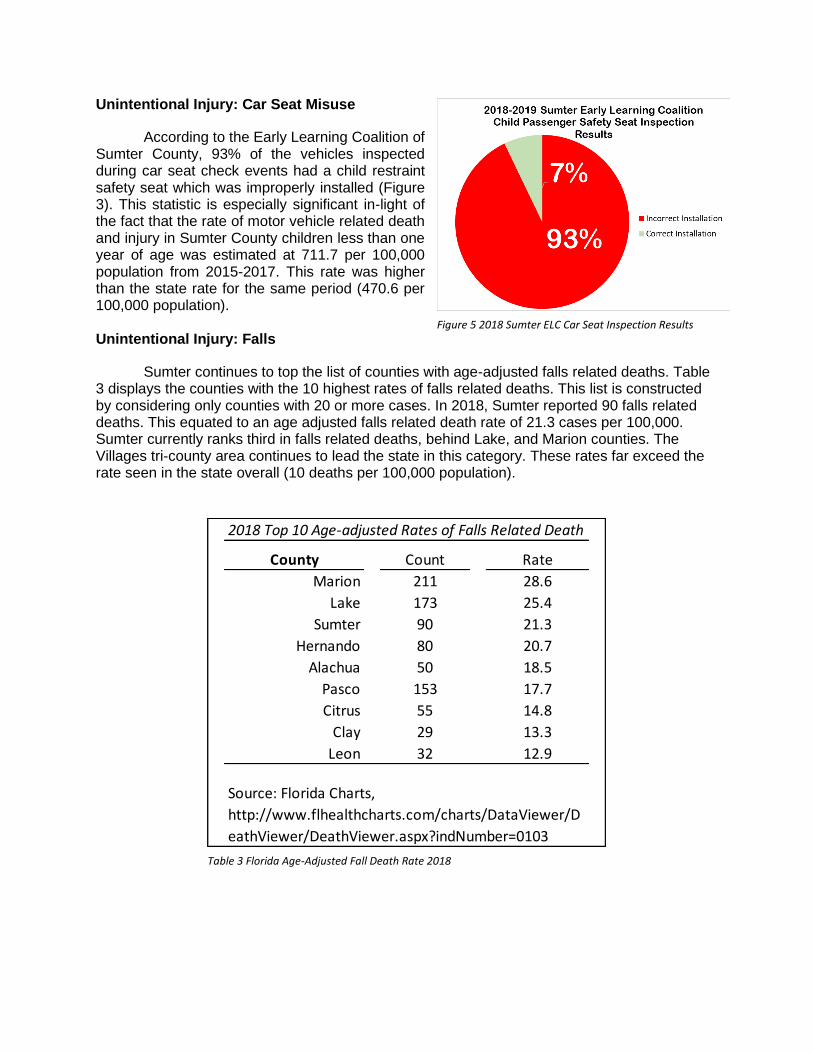
Unintentional Injury: Car Seat Misuse
According to the Early Learning Coalition of Sumter County, 93% of the vehicles inspected during car seat check events had a child restraint safety seat which was improperly installed (Figure 3). This statistic is especially significant in-light of the fact that the rate of motor vehicle related death and injury in Sumter County children less than one year of age was estimated at 711.7 per 100,000 population from 2015-2017. This rate was higher than the state rate for the same period (470.6 per 100,000 population).
Unintentional Injury: Falls
Sumter continues to top the list of counties with age-adjusted falls related deaths. Table 3 displays the counties with the 10 highest rates of falls related deaths. This list is constructed by considering only counties with 20 or more cases. In 2018, Sumter reported 90 falls related deaths. This equated to an age adjusted falls related death rate of 21.3 cases per 100,000. Sumter currently ranks third in falls related deaths, behind Lake, and Marion counties. The Villages tri-county area continues to lead the state in this category. These rates far exceed the rate seen in the state overall (10 deaths per 100,000 population).
Figure 5 2018 Sumter ELC Car Seat Inspection Results
County Count Rate
Marion 211 28.6
Lake 173 25.4
Sumter 90 21.3
Hernando 80 20.7
Alachua 50 18.5
Pasco 153 17.7
Citrus 55 14.8
Clay 29 13.3
Leon 32 12.9
2018 Top 10 Age-adjusted Rates of Falls Related Death
Source: Florida Charts,
http://www.flhealthcharts.com/charts/DataViewer/D
eathViewer/DeathViewer.aspx?indNumber=0103
Table 3 Florida Age-Adjusted Fall Death Rate 2018
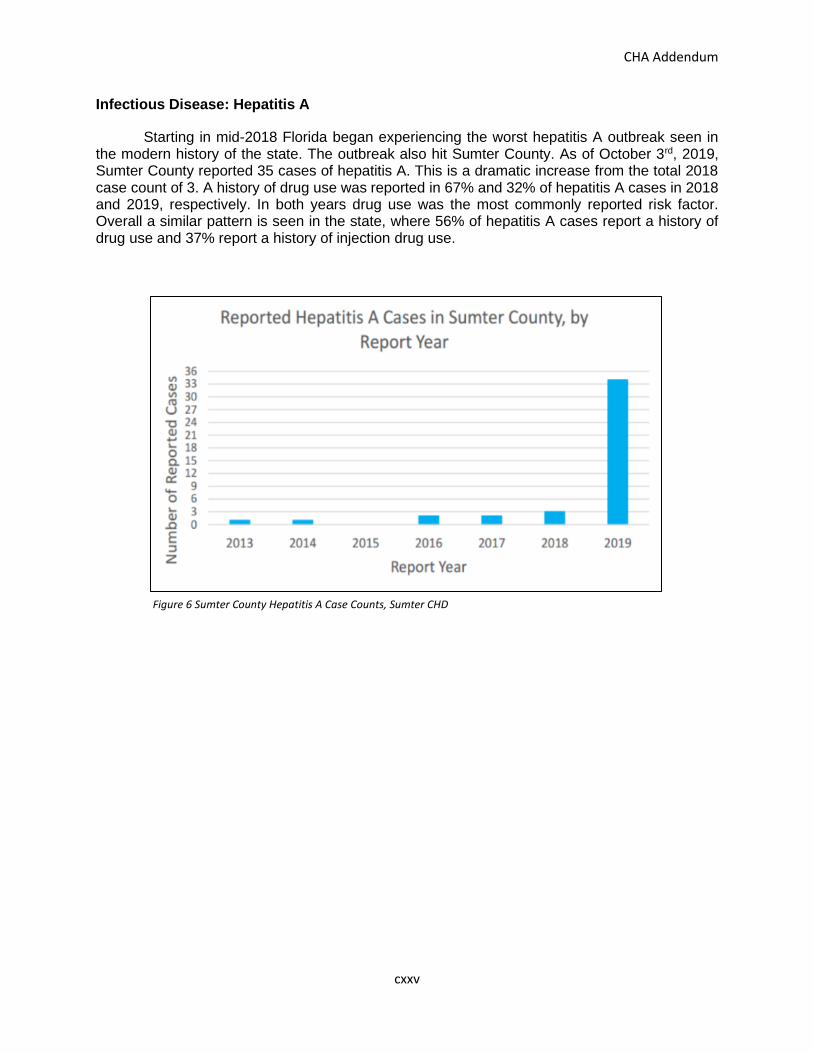
CHA Addendum
cxxv
Infectious Disease: Hepatitis A
Starting in mid-2018 Florida began experiencing the worst hepatitis A outbreak seen in the modern history of the state. The outbreak also hit Sumter County. As of October 3rd, 2019, Sumter County reported 35 cases of hepatitis A. This is a dramatic increase from the total 2018 case count of 3. A history of drug use was reported in 67% and 32% of hepatitis A cases in 2018 and 2019, respectively. In both years drug use was the most commonly reported risk factor. Overall a similar pattern is seen in the state, where 56% of hepatitis A cases report a history of drug use and 37% report a history of injection drug use.
Figure 6 Sumter County Hepatitis A Case Counts, Sumter CHD
Sub-appendix
• Sub-appendix A: Life Expectancy by Census Tract
• Sub-appendix B: Median Income by Census Tract
• Sub-appendix C: Education Level
• Sub-appendix D: Health Disparities
• Sub-appendix E: Community Assets and Resources
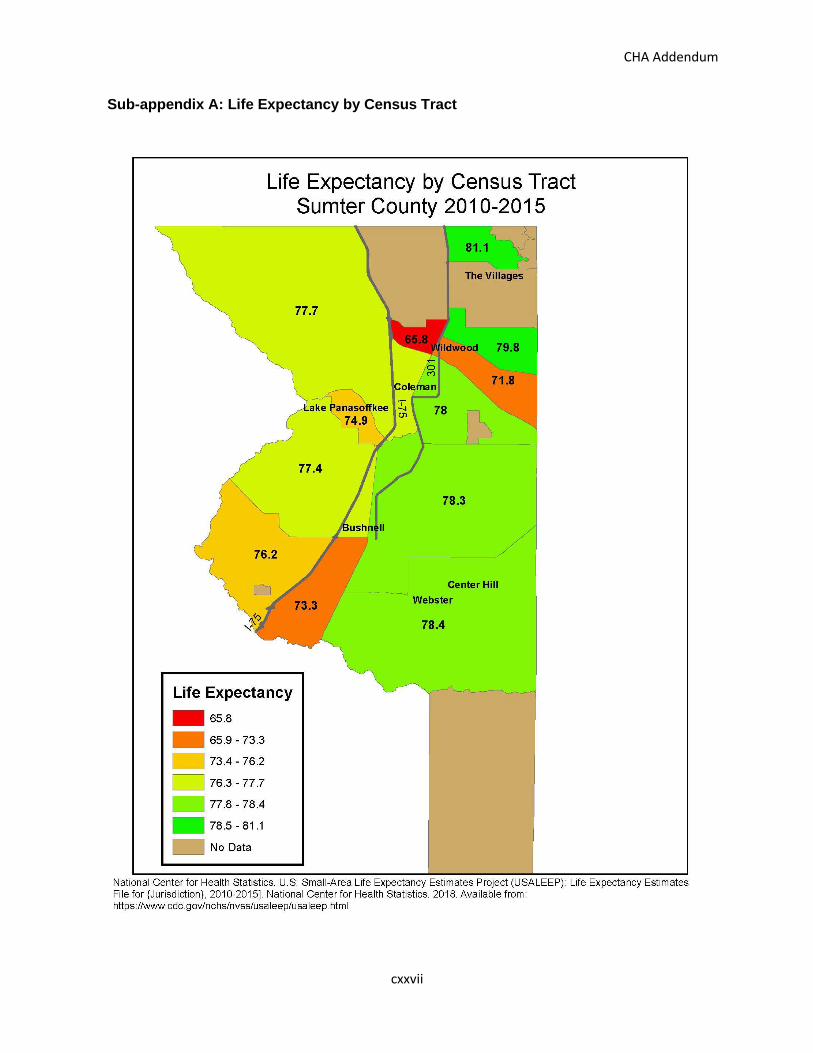
CHA Addendum
cxxvii
Sub-appendix A: Life Expectancy by Census Tract
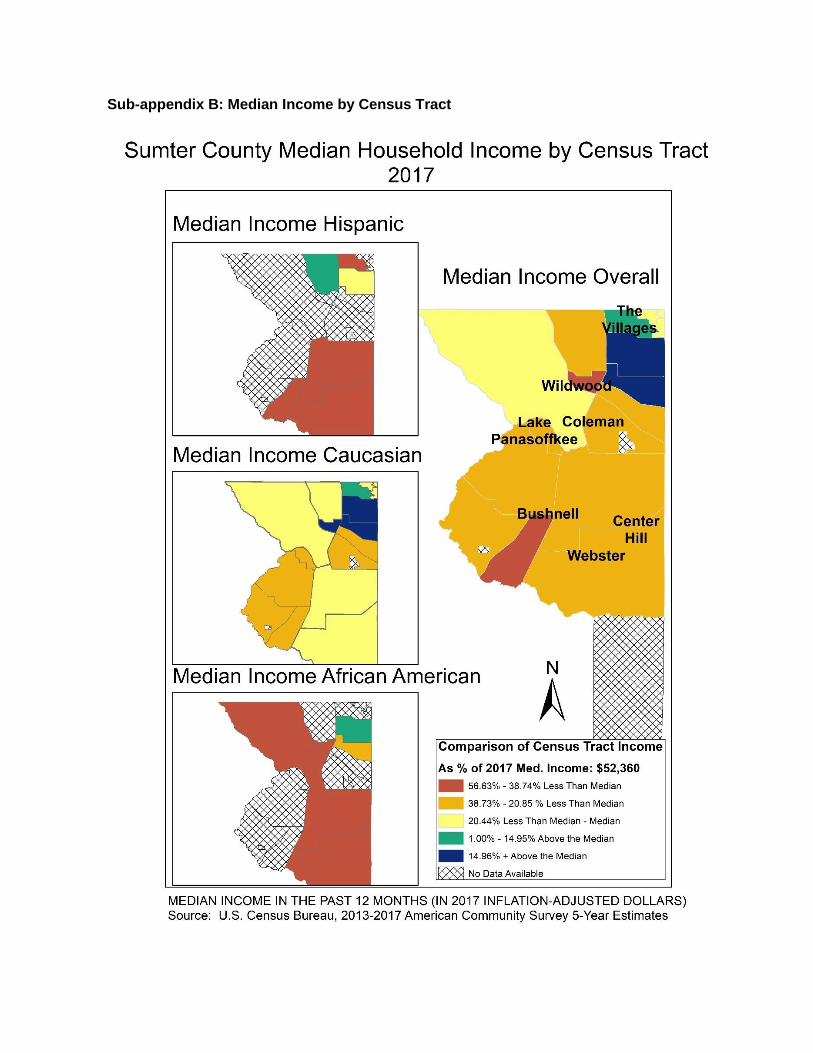
Sub-appendix B: Median Income by Census Tract
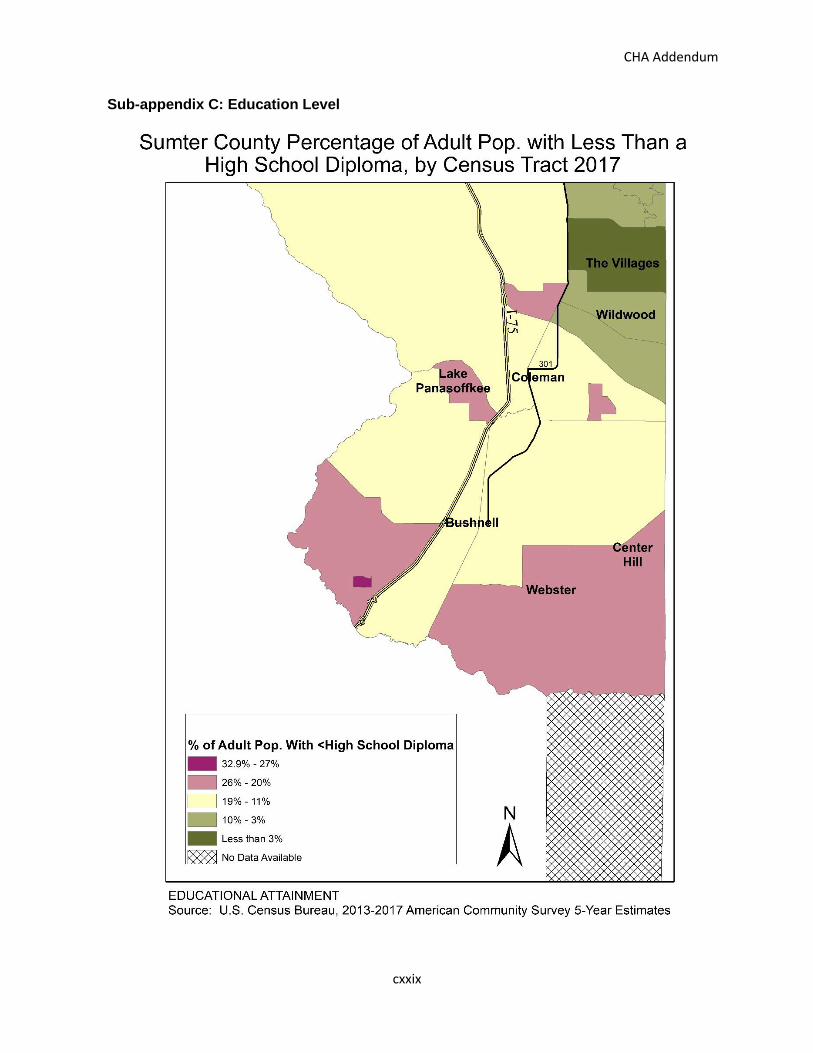
CHA Addendum
cxxix
Sub-appendix C: Education Level
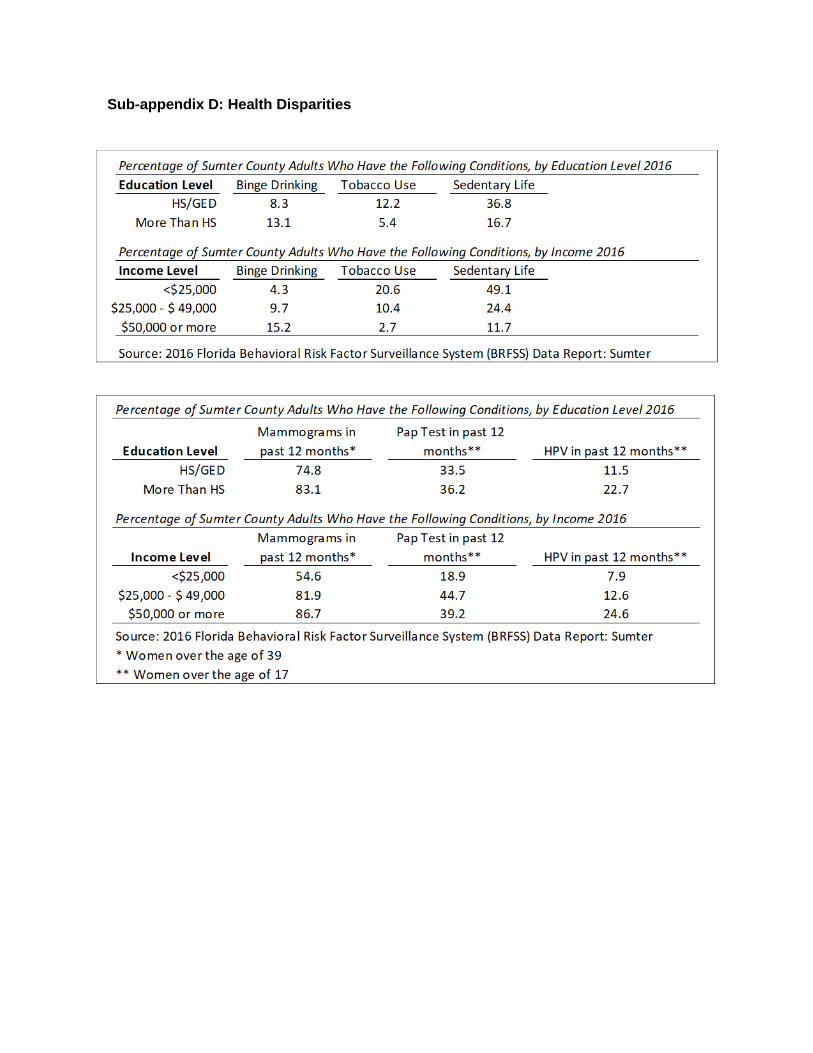
Sub-appendix D: Health Disparities
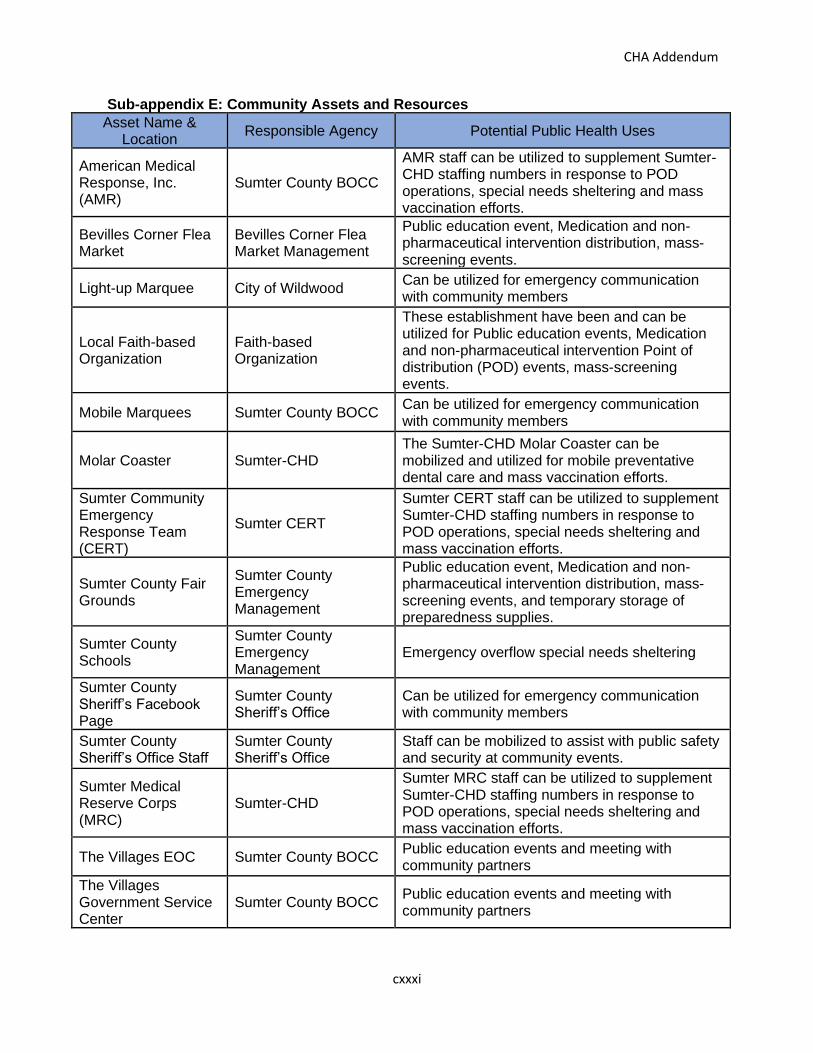
CHA Addendum
cxxxi
Sub-appendix E: Community Assets and Resources
Asset Name & Location
Responsible Agency Potential Public Health Uses
American Medical Response, Inc. (AMR)
Sumter County BOCC
AMR staff can be utilized to supplement Sumter-CHD staffing numbers in response to POD operations, special needs sheltering and mass vaccination efforts.
Bevilles Corner Flea Market
Bevilles Corner Flea Market Management
Public education event, Medication and non-pharmaceutical intervention distribution, mass-screening events.
Light-up Marquee City of Wildwood Can be utilized for emergency communication with community members
Local Faith-based Organization
Faith-based Organization
These establishment have been and can be utilized for Public education events, Medication and non-pharmaceutical intervention Point of distribution (POD) events, mass-screening events.
Mobile Marquees Sumter County BOCC Can be utilized for emergency communication with community members
Molar Coaster Sumter-CHD The Sumter-CHD Molar Coaster can be mobilized and utilized for mobile preventative dental care and mass vaccination efforts.
Sumter Community Emergency Response Team (CERT)
Sumter CERT
Sumter CERT staff can be utilized to supplement Sumter-CHD staffing numbers in response to POD operations, special needs sheltering and mass vaccination efforts.
Sumter County Fair Grounds
Sumter County Emergency Management
Public education event, Medication and non-pharmaceutical intervention distribution, mass-screening events, and temporary storage of preparedness supplies.
Sumter County Schools
Sumter County Emergency Management
Emergency overflow special needs sheltering
Sumter County Sheriff’s Facebook Page
Sumter County Sheriff’s Office
Can be utilized for emergency communication with community members
Sumter County Sheriff’s Office Staff
Sumter County Sheriff’s Office
Staff can be mobilized to assist with public safety and security at community events.
Sumter Medical Reserve Corps (MRC)
Sumter-CHD
Sumter MRC staff can be utilized to supplement Sumter-CHD staffing numbers in response to POD operations, special needs sheltering and mass vaccination efforts.
The Villages EOC Sumter County BOCC Public education events and meeting with community partners
The Villages Government Service Center
Sumter County BOCC Public education events and meeting with community partners
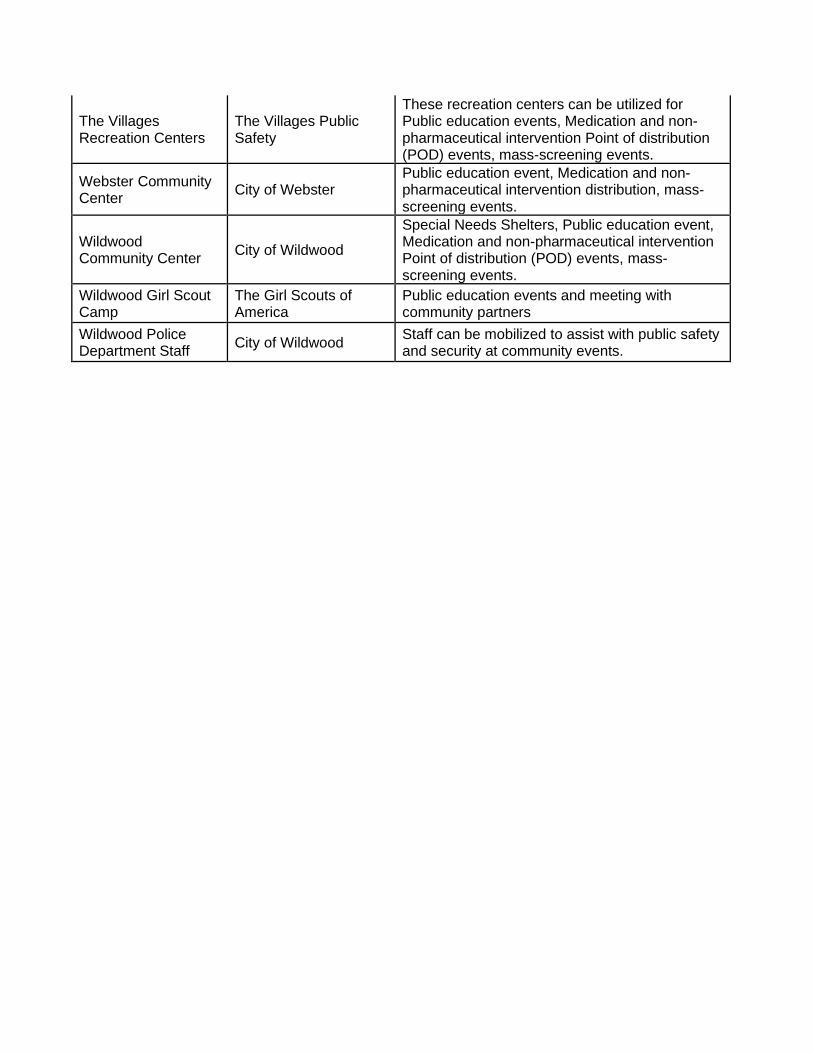
The Villages Recreation Centers
The Villages Public Safety
These recreation centers can be utilized for Public education events, Medication and non-pharmaceutical intervention Point of distribution (POD) events, mass-screening events.
Webster Community Center
City of Webster Public education event, Medication and non-pharmaceutical intervention distribution, mass-screening events.
Wildwood Community Center
City of Wildwood
Special Needs Shelters, Public education event, Medication and non-pharmaceutical intervention Point of distribution (POD) events, mass-screening events.
Wildwood Girl Scout Camp
The Girl Scouts of America
Public education events and meeting with community partners
Wildwood Police Department Staff
City of Wildwood Staff can be mobilized to assist with public safety and security at community events.