Embed Size (px)
Citation preview
FHWA/NHTSA National Crash Analysis Center Page 1 of 32 Prepared by: Dr. Kennerly H. Digges
Summary Report of Rollover Crashes
Kennerly H. Digges June 2002
INTRODUCTION Rollover continues to be a serious highway threat. Each year in the US, about 220,000 light vehicles are involved in rollovers. The number of occupants in these vehicles is about 350,000. Of these rollover exposed occupants, 224,000 are injured or killed. About 200,000 suffer minor to moderate injuries, 14,100 survive serious to critical injuries, and 9,000 are killed. The injured occupants suffer about 789,000 injuries, about 3.5 injuries per occupant. The comprehensive cost of the injuries and fatalities in rollovers is about $40 billion per year. As a class, rollover crashes constitute about 2.2% of the crashes, but 33% of the injury costs. This paper attempts to identify opportunities and priorities for reducing casualties in rollover crashes. DATA SOURCES AND SUMMARIES An analysis of FARS, and NASS accident data, and Polk exposure data provides insight into opportunities for reducing injuries from rollover crashes. The FARS data is from the Fatal Accident Reporting System, an annual census of all fatalities from highway crashes since 1975. The NASS data is from the National Accident Sampling System. Between 1977 and 1986 NASS was a sample of police reported crashes in the US. After 1987, NASS only collected cases in which one vehicle was damaged sufficiently that it was towed-away. This data set is known as the NASS/CDS, CDS being Crashworthiness Data System. The pre 1987 NASS is of continuing interest because it provides better estimates of exposure to low severity crashes. The post 1987 NASS provides better information on the more severe crashes and resulting injuries. The light vehicle crash exposure and incidence of rollover impacts, as an average annual percentage are shown in Table 1. The Table shows that rollover impacts constitute approximately 2.2% of all light vehicle crashes. For passenger cars, the rollover percentage is only 1.74%. For pick-ups the rollover percentage is 4.0% and for multipurpose vehicles (SUV’s) the percentage is 6.3%. However, because of the large population of passenger cars, the majority of rollovers in the vehicle fleet of the 1990’s involved passenger cars. The growth in sales volume of pickups and MPV’s in recent years is reducing the dominance of passenger car rollovers in the fleet.
FHWA/NHTSA National Crash Analysis Center Page 2 of 32 Prepared by: Dr. Kennerly H. Digges
Table 1- Crash Involved Vehicles and Vehicles in Rollovers Average Numbers per Year NASS /GES 1988-90
All Non-towed Towaway Rollovers % Rollover Cars
8,200,000 5,866,000 2,334,000 142371
1.7%
Pickups
1,300,000 923,000 377,000 51,964
4.0%
Vans
415,000 313,000 102,000 9,899
2.4%
MPV's
255,000 169,000 86,000 16,178
6.3%
All Light Vehicles
10,170,000 7,271,000 2,899,000 220,412 2.2%
Table 2- Crash Involved Occupants and Occupants in Rollovers Average Numbers per Year - NASS/GES 1988-1990
Cars Pickups Vans MPV's All No R/O
11,708,510 1,670,145 631,039 340,119 14,349,813
R/O No Ej
214,758 75,047 18,457 24,924 333,186
R/O w Ej.
8,066 3,743 693 1,830
14,332
R/O All
222,824 78,790 19,150 26,754 347,518
R/O %
1.9% 4.5% 2.9% 7.3%
2.4%
Ej in R/O 3.6% 4.8% 3.6% 6.8% 4.1% Table 2 shows crash exposure and rollover data for occupants of different light vehicle classes. Ejection has been found to be a particularly harmful event, and the rollovers with ejection are listed separately. The fractions of occupants in rollovers are small in the fleet, and the fractions of rollovers with ejections are also small. However, as will be shown later, a large fraction of fatalities and harm are associated with rollover, and with ejections. As in the vehicle exposure data, the pick-ups and MPV’s have the highest fractions of rollovers and of ejections in rollovers. AIS injury coding is a method of partitioning injuries in six categories, according to threat to life. The coding scale is maintained by the Association for the Advancement of Automotive Medicine. The scale does not adequately address the long term impairment associated with an injury. Some of the low AIS neck, brain, and spine injuries may have much worse long term consequences than higher AIS level chest and abdominal injuries. The maximum injury suffered is abbreviated MAIS. The maximum AIS severity injury
FHWA/NHTSA National Crash Analysis Center Page 3 of 32 Prepared by: Dr. Kennerly H. Digges
suffered by occupants involved in rollovers is shown in Table 3. The data in Table 3 shows the distributions for uninjured, injured survivors by MAIS level, and the fatally injured. . Table 3 - Crash Involved Occupant Injuries in Rollovers Average Numbers per Year - NASS/GES 1988-1990
Cars Pickups Vans MPV's All
Uninjured 72,821 32,806 7,668 17,679 130,974
MAIS1
96,392 36,167 9,746 15,970 158,275
MAIS2
25,375 9,715 2,192 4,792 42,074
MAIS3
5,291 3,402 804 1,137 10,634
MAIS4
949 373 145 118 1,585
MAIS5
1,407 412 27 39 1,885
Fatal
5,819 2,780 434 770 9,803
All
208,054 85,655 21,016 40,505 355,230
In order to better understand the distribution of rollover injuries, the concept of Harm [Malliaris 82] is useful. The HARM scale applies a weighing factor to each injured survivor according to the severity of the injuries. The weighing factors are based on the cost and injury outcome schedules appearing in the work of Miller conducted for the Department of Transportation [Miller 91]. The total HARM in the NASS file can be calculated by summing all the injured people, each weighted in proportion to the severity of injury in monetary consequences, irrespective of fatal outcome. Each occupant in the NASS file also has a population weighting factor which is used to project the data to national averages. This weighting factor is also included in calculating the total HARM. The total HARM can then be subdivided according to crash mode, injured body region, injury cause, etc. The resulting fractions of the total HARM projected from the NASS file should be representative of the fraction of HARM which is occurring in crashes on the US roads. These HARM fractions provide a basis for estimating the magnitude of the opportunities for interventions. Two types on injury costs have been estimated by Miller [Miller 1991]. The monetary harm includes the average direct costs which can be attributed to the population injured in crashes. The comprehensive harm includes pain, suffering and other indirect costs. The cost of property damage is excluded from both formulations of harm. The monetary and comprehensive harm costs for the maximum AIS (MAIS) of survivors and for those fatally injured are shown in Table 4 [NHTSA 2001]. The table also shows the number of annual incidents for each level of injury.
FHWA/NHTSA National Crash Analysis Center Page 4 of 32 Prepared by: Dr. Kennerly H. Digges
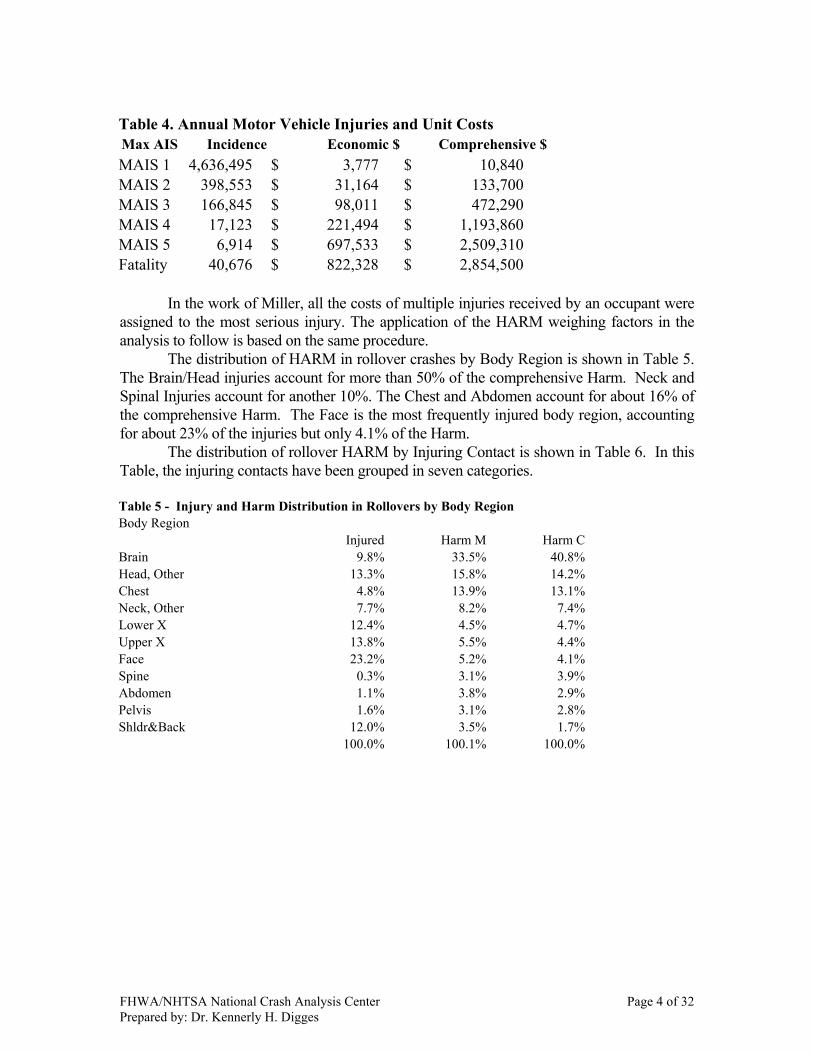
Table 4. Annual Motor Vehicle Injuries and Unit Costs Max AIS Incidence Economic $ Comprehensive $MAIS 1 4,636,495 $ 3,777 $ 10,840 MAIS 2 398,553 $ 31,164 $ 133,700 MAIS 3 166,845 $ 98,011 $ 472,290 MAIS 4 17,123 $ 221,494 $ 1,193,860 MAIS 5 6,914 $ 697,533 $ 2,509,310 Fatality 40,676 $ 822,328 $ 2,854,500 In the work of Miller, all the costs of multiple injuries received by an occupant were assigned to the most serious injury. The application of the HARM weighing factors in the analysis to follow is based on the same procedure. The distribution of HARM in rollover crashes by Body Region is shown in Table 5. The Brain/Head injuries account for more than 50% of the comprehensive Harm. Neck and Spinal Injuries account for another 10%. The Chest and Abdomen account for about 16% of the comprehensive Harm. The Face is the most frequently injured body region, accounting for about 23% of the injuries but only 4.1% of the Harm.
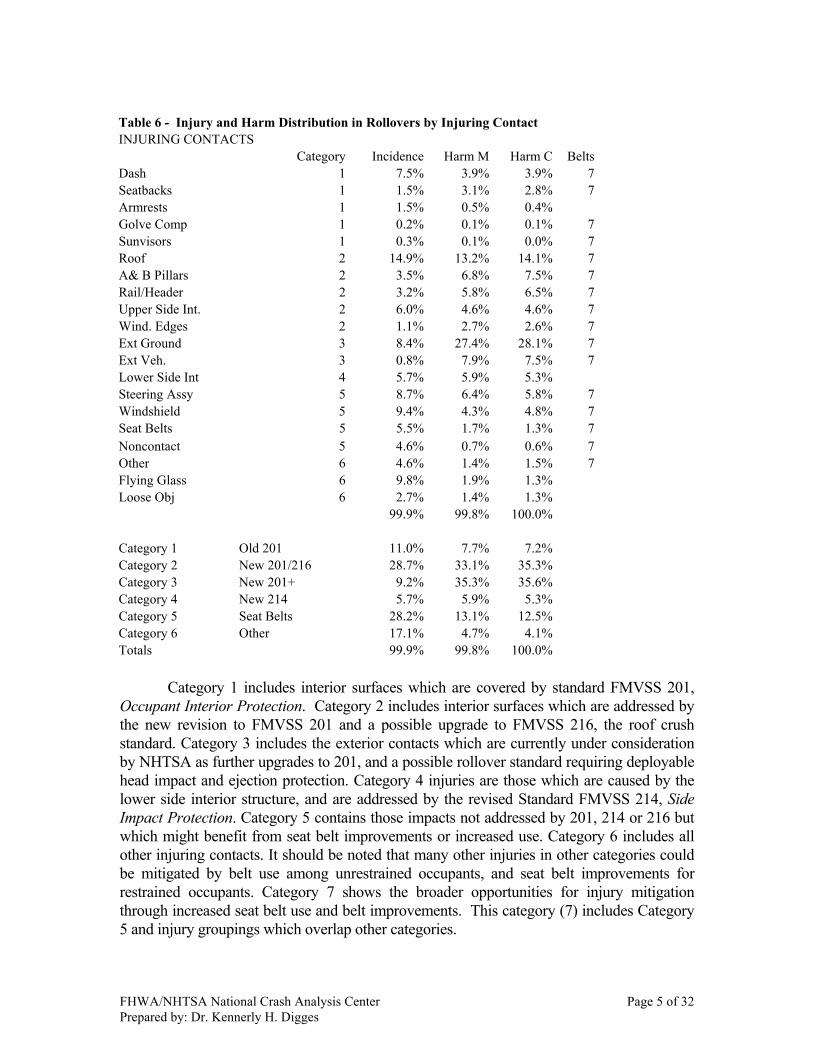
The distribution of rollover HARM by Injuring Contact is shown in Table 6. In this Table, the injuring contacts have been grouped in seven categories.
Table 5 - Injury and Harm Distribution in Rollovers by Body Region Body Region Injured Harm M Harm C Brain 9.8% 33.5% 40.8% Head, Other 13.3% 15.8% 14.2% Chest 4.8% 13.9% 13.1% Neck, Other 7.7% 8.2% 7.4% Lower X 12.4% 4.5% 4.7% Upper X 13.8% 5.5% 4.4% Face 23.2% 5.2% 4.1% Spine 0.3% 3.1% 3.9% Abdomen 1.1% 3.8% 2.9% Pelvis 1.6% 3.1% 2.8% Shldr&Back 12.0% 3.5% 1.7% 100.0% 100.1% 100.0%
FHWA/NHTSA National Crash Analysis Center Page 5 of 32 Prepared by: Dr. Kennerly H. Digges
Table 6 - Injury and Harm Distribution in Rollovers by Injuring Contact INJURING CONTACTS Category Incidence Harm M Harm C Belts Dash 1 7.5% 3.9% 3.9% 7 Seatbacks 1 1.5% 3.1% 2.8% 7 Armrests 1 1.5% 0.5% 0.4% Golve Comp 1 0.2% 0.1% 0.1% 7 Sunvisors 1 0.3% 0.1% 0.0% 7 Roof 2 14.9% 13.2% 14.1% 7 A& B Pillars 2 3.5% 6.8% 7.5% 7 Rail/Header 2 3.2% 5.8% 6.5% 7 Upper Side Int. 2 6.0% 4.6% 4.6% 7 Wind. Edges 2 1.1% 2.7% 2.6% 7 Ext Ground 3 8.4% 27.4% 28.1% 7 Ext Veh. 3 0.8% 7.9% 7.5% 7 Lower Side Int 4 5.7% 5.9% 5.3% Steering Assy 5 8.7% 6.4% 5.8% 7 Windshield 5 9.4% 4.3% 4.8% 7 Seat Belts 5 5.5% 1.7% 1.3% 7 Noncontact 5 4.6% 0.7% 0.6% 7 Other 6 4.6% 1.4% 1.5% 7 Flying Glass 6 9.8% 1.9% 1.3% Loose Obj 6 2.7% 1.4% 1.3% 99.9% 99.8% 100.0% Category 1 Old 201 11.0% 7.7% 7.2% Category 2 New 201/216 28.7% 33.1% 35.3% Category 3 New 201+ 9.2% 35.3% 35.6% Category 4 New 214 5.7% 5.9% 5.3% Category 5 Seat Belts 28.2% 13.1% 12.5% Category 6 Other 17.1% 4.7% 4.1% Totals 99.9% 99.8% 100.0%
Category 1 includes interior surfaces which are covered by standard FMVSS 201,
Occupant Interior Protection. Category 2 includes interior surfaces which are addressed by the new revision to FMVSS 201 and a possible upgrade to FMVSS 216, the roof crush standard. Category 3 includes the exterior contacts which are currently under consideration by NHTSA as further upgrades to 201, and a possible rollover standard requiring deployable head impact and ejection protection. Category 4 injuries are those which are caused by the lower side interior structure, and are addressed by the revised Standard FMVSS 214, Side Impact Protection. Category 5 contains those impacts not addressed by 201, 214 or 216 but which might benefit from seat belt improvements or increased use. Category 6 includes all other injuring contacts. It should be noted that many other injuries in other categories could be mitigated by belt use among unrestrained occupants, and seat belt improvements for restrained occupants. Category 7 shows the broader opportunities for injury mitigation through increased seat belt use and belt improvements. This category (7) includes Category 5 and injury groupings which overlap other categories.
FHWA/NHTSA National Crash Analysis Center Page 6 of 32 Prepared by: Dr. Kennerly H. Digges
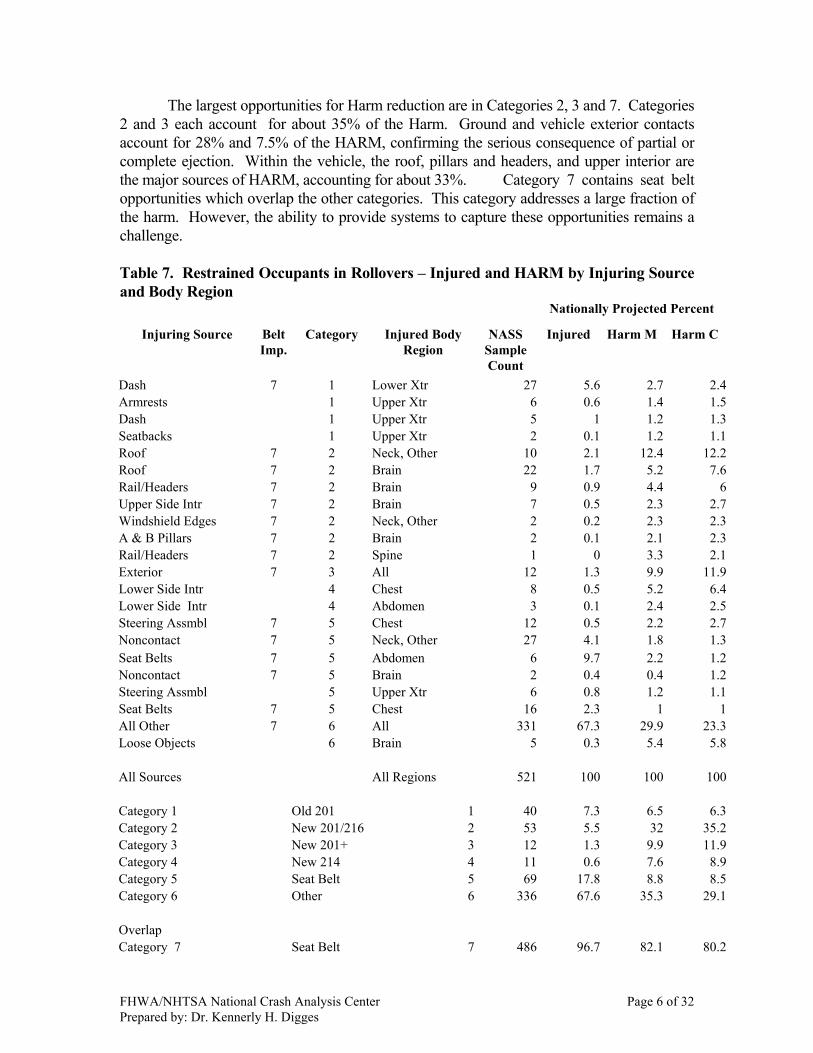
The largest opportunities for Harm reduction are in Categories 2, 3 and 7. Categories 2 and 3 each account for about 35% of the Harm. Ground and vehicle exterior contacts account for 28% and 7.5% of the HARM, confirming the serious consequence of partial or complete ejection. Within the vehicle, the roof, pillars and headers, and upper interior are the major sources of HARM, accounting for about 33%. Category 7 contains seat belt opportunities which overlap the other categories. This category addresses a large fraction of the harm. However, the ability to provide systems to capture these opportunities remains a challenge. Table 7. Restrained Occupants in Rollovers – Injured and HARM by Injuring Source and Body Region Nationally Projected Percent
Injuring Source Belt Imp.
Category Injured Body Region
NASS Sample Count
Injured Harm M Harm C
Dash 7 1 Lower Xtr 27 5.6 2.7 2.4Armrests 1 Upper Xtr 6 0.6 1.4 1.5Dash 1 Upper Xtr 5 1 1.2 1.3Seatbacks 1 Upper Xtr 2 0.1 1.2 1.1Roof 7 2 Neck, Other 10 2.1 12.4 12.2Roof 7 2 Brain 22 1.7 5.2 7.6Rail/Headers 7 2 Brain 9 0.9 4.4 6Upper Side Intr 7 2 Brain 7 0.5 2.3 2.7Windshield Edges 7 2 Neck, Other 2 0.2 2.3 2.3A & B Pillars 7 2 Brain 2 0.1 2.1 2.3Rail/Headers 7 2 Spine 1 0 3.3 2.1Exterior 7 3 All 12 1.3 9.9 11.9Lower Side Intr 4 Chest 8 0.5 5.2 6.4Lower Side Intr 4 Abdomen 3 0.1 2.4 2.5Steering Assmbl 7 5 Chest 12 0.5 2.2 2.7Noncontact 7 5 Neck, Other 27 4.1 1.8 1.3Seat Belts 7 5 Abdomen 6 9.7 2.2 1.2Noncontact 7 5 Brain 2 0.4 0.4 1.2Steering Assmbl 5 Upper Xtr 6 0.8 1.2 1.1Seat Belts 7 5 Chest 16 2.3 1 1All Other 7 6 All 331 67.3 29.9 23.3Loose Objects 6 Brain 5 0.3 5.4 5.8 All Sources All Regions 521 100 100 100 Category 1 Old 201 1 40 7.3 6.5 6.3Category 2 New 201/216 2 53 5.5 32 35.2Category 3 New 201+ 3 12 1.3 9.9 11.9Category 4 New 214 4 11 0.6 7.6 8.9Category 5 Seat Belt 5 69 17.8 8.8 8.5Category 6 Other 6 336 67.6 35.3 29.1 Overlap Category 7 Seat Belt 7 486 96.7 82.1 80.2
FHWA/NHTSA National Crash Analysis Center Page 7 of 32 Prepared by: Dr. Kennerly H. Digges
Table 8. Unrestrained Occupants in Rollovers – Injured and HARM by Injuring Source and Body Region Nationally Projected Percent in
Each Column Injuring Source Injured Body
Region Belt Imp.
Category NASS Sample Count
Injured Harm M Harm C
Seatbacks Pelvis 7 1 2 0.4 3.5 3.4Dash Lower Xtr 7 1 34 6.6 1.1 1Roof Brain 7 2 42 3.9 9 10.8A & B Pillars Brain 7 2 7 1 7.3 7.5Rail/Headers Brain 7 2 16 1 3.4 3.8Windshield Edges Brain 7 2 6 0.4 3.2 3.3Rail/Headers Head, Other 7 2 5 0.2 1.8 1.8A & B Pillars Head, Other 7 2 6 0.6 1.2 1.1Roof Spine 7 2 3 0.3 1.6 1Exterior All 7 3 117 6.2 34.7 34.2Lower Side Intr Chest 4 16 1.3 3.6 3.9Windshield Brain 7 5 28 2.9 3.5 4.8Steering Assmbl Chest 7 5 21 1.1 2.3 2.5All Other All 7 6 516 66.5 21.3 19.3Flying Glass Upper Xtr 6 19 7.6 2.5 1.4 All Sources All Regions 838 100 100 100 Category 1 Old 201 1 36 7 4.6 4.4Category 2 New 201/216 2 85 7.4 27.5 29.3Category 3 New 201+ 3 117 6.2 34.7 34.2Category 4 New 214 4 16 1.3 3.6 3.9Category 5 Seat Belt 5 49 4 5.8 7.3Category 6 Other 6 535 74.1 23.8 20.7 Overlap Category 7 Seat Belt 7 803 91.1 93.9 94.5
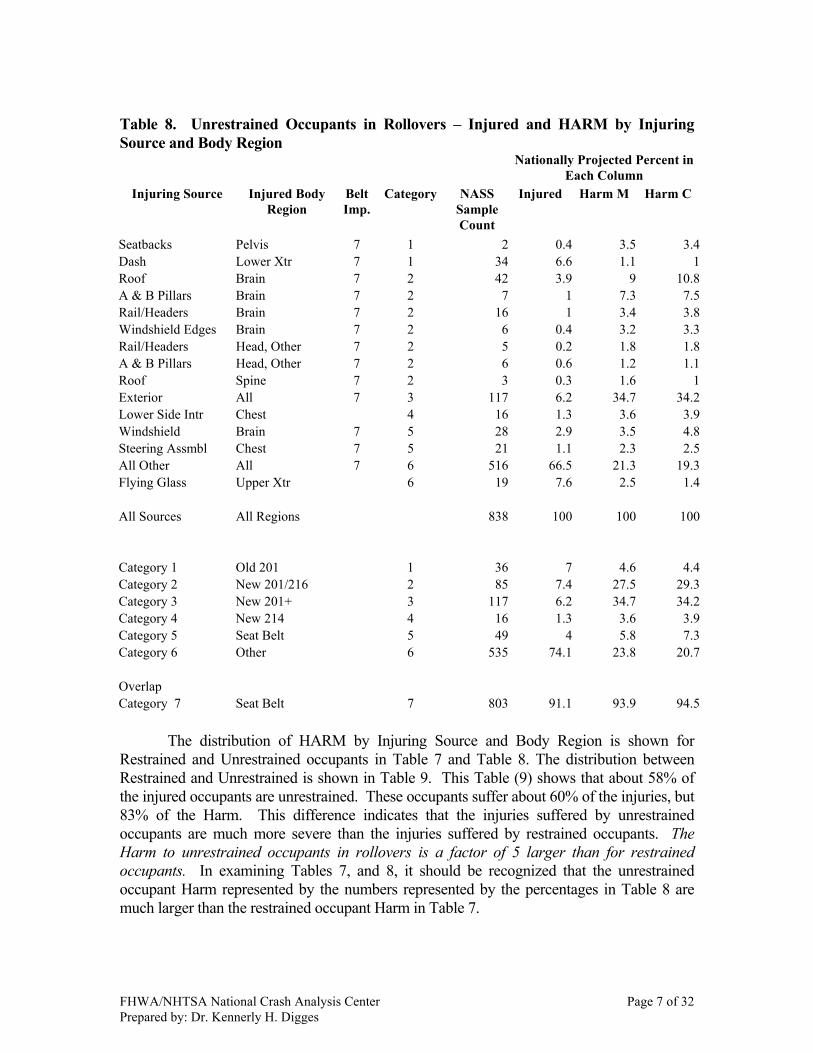
The distribution of HARM by Injuring Source and Body Region is shown for Restrained and Unrestrained occupants in Table 7 and Table 8. The distribution between Restrained and Unrestrained is shown in Table 9. This Table (9) shows that about 58% of the injured occupants are unrestrained. These occupants suffer about 60% of the injuries, but 83% of the Harm. This difference indicates that the injuries suffered by unrestrained occupants are much more severe than the injuries suffered by restrained occupants. The Harm to unrestrained occupants in rollovers is a factor of 5 larger than for restrained occupants. In examining Tables 7, and 8, it should be recognized that the unrestrained occupant Harm represented by the numbers represented by the percentages in Table 8 are much larger than the restrained occupant Harm in Table 7.

FHWA/NHTSA National Crash Analysis Center Page 8 of 32 Prepared by: Dr. Kennerly H. Digges
Table 9 - Injuries and Harm Distributions in Light Vehicles NASS 1988-90 Restraint Use Unrestrained Restrained
Distribution Injuries 60.1% 39.9%
Percent Injured 57.9% 42.1%
Harm M
83.9% 16.1%
For both Restrained and Unrestrained occupants in rollovers, large portions of the HARM are associated with head/brain and spinal injuries are from contacts with the roof and upper interior structure. The comprehensive Harm figures are 35% for restrained and 29% for unrestrained. These contacts are being partially addressed by the new FMVSS 201 standard. However, the largest source of Comprehensive Harm for restrained occupants is neck/spine injuries caused by impacts with upper surfaces of the vehicle (16.6%) and head/brain injuries from upper surface contact (18.6%). Many of these injuries may be associated with loading that will not be mitigated by padding alone. Intrusion and rate of intrusion of the roof may also contribute to these injuries. Unrestrained occupants suffer about 29.3% of the harm from head/neck/spine injuries caused by contact with the upper vehicle surfaces. The Harm from exterior contacts for restrained occupants is 11.9%. This is much lower than the 34.2% for unrestrained occupants. The difference underscores the harmful nature of ejection that occurs much more frequently to unrestrained occupants. Based on Tables 7 and 8 both restrained and unrestrained occupants should benefit from reducing the head impact severity with upper interior structures (35.2% and 29.3%, respectively). However, for restrained occupants, head-to-upper structure injuries (18.6%) and neck/spine-to-roof injuries (16.6%) may require additional countermeasures, not currently addressed by the new FMVSS 201. NHTSA is considering an upgrade of FMVSS 216 (Roof Strength) to address these injuries (34.6%). Protection from exterior contacts through ejection prevention would be most beneficial to the unrestrained (34.2%), but offers a smaller potential benefit to the restrained (11.9%). The Catagory 4 injuries from contact with the lower side interior account for small percentages - 8.9% for restrained and 3.9% for unrestrained. Miscellaneous interior contacts account for about 20% of the Harm. Improvements in safety belts might address some of these as well as many of those in Category 2 (35.2%) and Category 3 (11.9%). About 20% to 30% of the Harm is associated with a wide variety of contacts and body regions. For the unrestrained population, the use of seat belts provides a very large opportunity for reducing harm. As indicated in Category 7, seat belts offer opportunities for addressing over 90% of the Harm. For the restrained population, improvements in safety belts for the rollover crash mode offers significant opportunities as well. Additional studies would be required to refine the extent to which the opportunities shown could be addressed with safety improvements of the belt system. For restrained occupants, a considerable opportunity exists for technology to reduce upper extremity injuries, possibly from flailing (6.3%).
FHWA/NHTSA National Crash Analysis Center Page 9 of 32 Prepared by: Dr. Kennerly H. Digges
CRASH SEVERITY Rollover crashes involve the most complex vehicle and occupant motion among the four major crash modes: front, side, rear, and rollover. The forces involved prior to and during a rollover crash are complicated and dynamic. These crash forces are applied to the vehicle structure in a variety of locations, and at a variety of magnitudes and directions. Crash energy is removed more slowly in a rollover crash - and the crash motion occurs over a much longer period of time. Typically, the crash forces are applied over several seconds in a rollover vs. 0.1 seconds in a planar crash. A major difference between rollovers and planar crashes is that rollovers generally occur at higher speeds. In examining the speed distributions of planar vs. rollover crashes, one finds that the mean speed for rollovers is shifted by more than 20 mph toward higher travel speeds. The mean speeds for these distributions are: 50 mph for rollover involved cars, and 28 mph for cars in all other crashes. For rollovers in which a fatality is involved, the mean speed is 63.4 mph, compared with 45.3 mph for all other fatal crashes Rollover involvement of car occupants is about 1.75 per 100 crash exposed. However, the Harm to rollover exposed occupants is about 21% of the harm to all crash exposed. Rollovers account for about 30% of the light vehicle occupant fatalities. The complexity of rollover events make the characterization of these accidents much more difficult than for planar crashes. For planar crashes, delta-V has been widely accepted as a measure of the crash severity. Techniques and computer analysis are available for estimating planar crash severity, based on energy dissipation from the observed vehicle damage or post crash trajectory. There is no similar accepted estimate for rollovers accident severity. Past studies of rollover crashes suggest that the initial speed, number of quarter turns, extent of damage, and characteristics of the tripping mechanism are significant accident parameters which influence the severity of the occupant/vehicle interactions and the resulting outcome. The characteristics of the vehicle - by type, wheelbase, and stability factor, have been reported to influence rollover frequency. According to NHTSA’s analysis, two vehicle parameters have significant correlation with rate of rollovers in single vehicle crashes. These are: (1) rollover stability factor and (2) critical sliding velocity [Hinch, November 1991]. The rollover stability factor is one half the vehicle’s track width divided by the vehicle’s center of gravity height. The rollover stability factor formed the basis for NHTSA’s regulation for a rollover rating system. The rollover stability factor is now required on the window sticker of new vehicles to provide consumer information on the relative risks of rollovers. This simple geometric static stability metric which does not consider the dynamics of the steering and suspension systems. Further, it does not consider the benefits of stability countermeasures, such as Automatic Stability Control. The critical sliding velocity is a measure of the minimum lateral velocity required to initiate rollover, when the vehicle is in a tripping orientation. It is determined by equating the vehicle kinetic energy prior to a tripped impact to the potential energy required to raise the vehicle cg above a critical pivot point. The pivot point is assumed to be located at the contact between the tires and the tripping object. The critical sliding velocity is related to the vehicle’s roll mass moment of inertia, vertical cg. height, track width, and coefficient of restitution. (See equation 1)
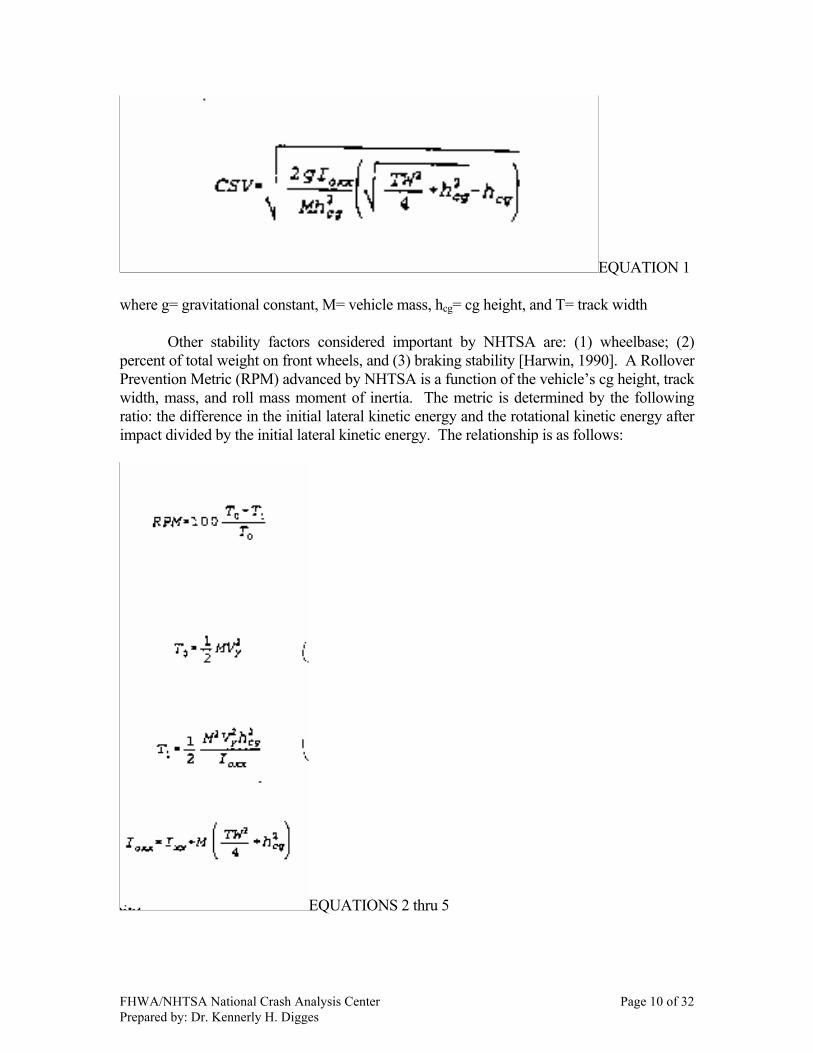
FHWA/NHTSA National Crash Analysis Center Page 10 of 32 Prepared by: Dr. Kennerly H. Digges
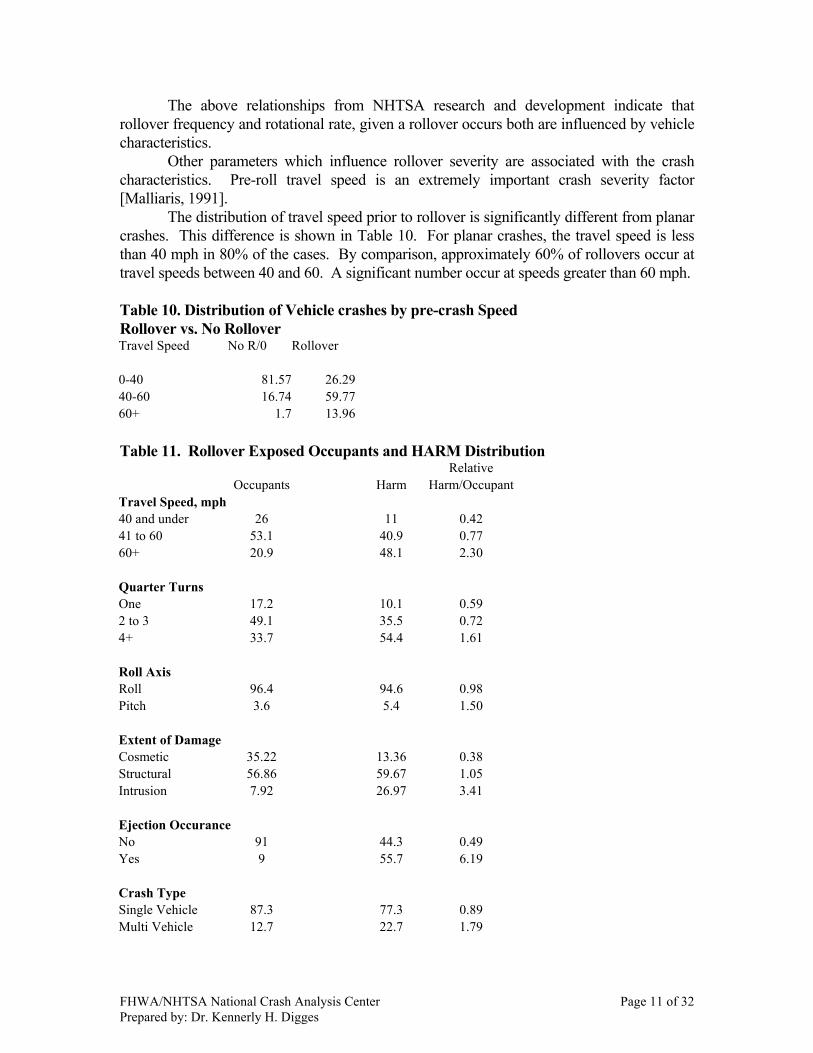
EQUATION 1 where g= gravitational constant, M= vehicle mass, hcg= cg height, and T= track width Other stability factors considered important by NHTSA are: (1) wheelbase; (2) percent of total weight on front wheels, and (3) braking stability [Harwin, 1990]. A Rollover Prevention Metric (RPM) advanced by NHTSA is a function of the vehicle’s cg height, track width, mass, and roll mass moment of inertia. The metric is determined by the following ratio: the difference in the initial lateral kinetic energy and the rotational kinetic energy after impact divided by the initial lateral kinetic energy. The relationship is as follows:
EQUATIONS 2 thru 5
FHWA/NHTSA National Crash Analysis Center Page 11 of 32 Prepared by: Dr. Kennerly H. Digges
The above relationships from NHTSA research and development indicate that rollover frequency and rotational rate, given a rollover occurs both are influenced by vehicle characteristics. Other parameters which influence rollover severity are associated with the crash characteristics. Pre-roll travel speed is an extremely important crash severity factor [Malliaris, 1991]. The distribution of travel speed prior to rollover is significantly different from planar crashes. This difference is shown in Table 10. For planar crashes, the travel speed is less than 40 mph in 80% of the cases. By comparison, approximately 60% of rollovers occur at travel speeds between 40 and 60. A significant number occur at speeds greater than 60 mph. Table 10. Distribution of Vehicle crashes by pre-crash Speed Rollover vs. No Rollover Travel Speed No R/0 Rollover 0-40 81.57 26.2940-60 16.74 59.7760+ 1.7 13.96 Table 11. Rollover Exposed Occupants and HARM Distribution Relative Occupants Harm Harm/OccupantTravel Speed, mph 40 and under 26 11 0.42 41 to 60 53.1 40.9 0.77 60+ 20.9 48.1 2.30 Quarter Turns One 17.2 10.1 0.59 2 to 3 49.1 35.5 0.72 4+ 33.7 54.4 1.61 Roll Axis Roll 96.4 94.6 0.98 Pitch 3.6 5.4 1.50 Extent of Damage Cosmetic 35.22 13.36 0.38 Structural 56.86 59.67 1.05 Intrusion 7.92 26.97 3.41 Ejection Occurance No 91 44.3 0.49 Yes 9 55.7 6.19 Crash Type Single Vehicle 87.3 77.3 0.89 Multi Vehicle 12.7 22.7 1.79
FHWA/NHTSA National Crash Analysis Center Page 12 of 32 Prepared by: Dr. Kennerly H. Digges
Although Tables 10 and 11 show that the average energy of rollover crashes is much higher than non-rollovers it should be noted that the maximum deceleration on the vehicle are generally much lower in rollover crashes. High speed rollovers generally involve multiple impacts between the vehicle and ground that occur over a considerable distance. Consequently, vehicle impact decelerations are generally low for each individual impact and occupant protection in many of these severe events is practical. Vehicle integrity to control intrusion and to prevent or block ejection paths are required safety technologies. Examination of the independent crash variables that influence rollover crash severity can be aided by three parameters which provide a quantitative perspective. These are: 1) the occupant exposure, 2) the harm, and 3) the relative harm per occupant. The occupant exposure is the relative frequency of car crashes, as a function of general rollover parameters. The harm is a convenient way of quantifying the frequency and severity of injuries. For the analysis presented here, both quantities are evaluated as a percentage of the total for the specific crash variable under evaluation. The harm per occupant is the percentage, divided by the occupant exposure percentage. Harm per occupant provides an indication of the relative severity of a class of crash events relative to injury outcome.
These crash variables can be used to illustrate the importance of travel speed on injury severity. Table 11 shows car occupant exposure and harm as a function of travel speed. The analysis shows that both exposure and harm are largest in the 40-60 mph speed range. However, as speed increases, the harm increases rapidly, relative to the exposure. This effect is shown in Table 11. The relative harm per occupant increases dramatically with speed from 0.42 to 2.30. Pre-crash speed is one of the pivotal parameters which characterizes the crash severity relative to injury outcome. Other factors in Table 11 include the number of quarter turns. In each quarter turn, the vehicle rotates 90 degrees. Consequently, four quarter turns rolls the car completely, so that it is back on its wheels. The number of quarter turns generally correlates with pre-crash speed and is frequently used as a crash severity measure. This relationship is illustrated in Table 12. It may be noted from Table 12 that the higher speed rollovers tend to have higher numbers of quarter turns. Table 12. Distribution of Vehicle Quarter Turns vs Travel Speed Number of Quarter Turns, % Car Travel Speed One 2 or 3 4 or More40 or Less 37.3 39.9 22.6 41-50 19 48.9 32 51-60 7 42.4 50.5 Over 60 7.2 19.6 73.2 All Speeds 17.7 39.1 43.2 The extent of damage and intrusion to the vehicle is a strong factor associated with injury risk in rollovers. In Table 11, the intrusion is not separated by intruding part (roof, door, etc.). The presence of vehicle structural damage and intrusion increases the harm per occupant. The vast majority of rolls are about the roll axis. The 3.6% of occupants exposed to rolls about the pitch axis suffer a higher level of harm.
FHWA/NHTSA National Crash Analysis Center Page 13 of 32 Prepared by: Dr. Kennerly H. Digges
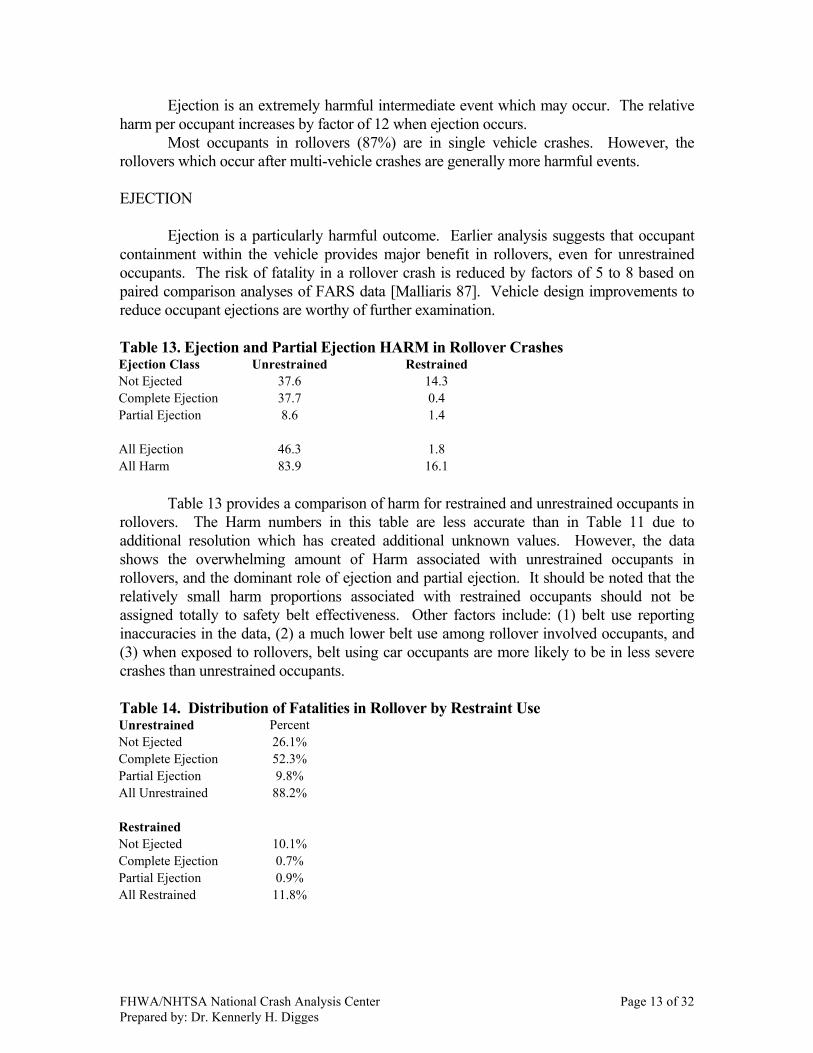
Ejection is an extremely harmful intermediate event which may occur. The relative harm per occupant increases by factor of 12 when ejection occurs. Most occupants in rollovers (87%) are in single vehicle crashes. However, the rollovers which occur after multi-vehicle crashes are generally more harmful events. EJECTION Ejection is a particularly harmful outcome. Earlier analysis suggests that occupant containment within the vehicle provides major benefit in rollovers, even for unrestrained occupants. The risk of fatality in a rollover crash is reduced by factors of 5 to 8 based on paired comparison analyses of FARS data [Malliaris 87]. Vehicle design improvements to reduce occupant ejections are worthy of further examination. Table 13. Ejection and Partial Ejection HARM in Rollover Crashes Ejection Class Unrestrained Restrained Not Ejected 37.6 14.3 Complete Ejection 37.7 0.4 Partial Ejection 8.6 1.4 All Ejection 46.3 1.8 All Harm 83.9 16.1 Table 13 provides a comparison of harm for restrained and unrestrained occupants in rollovers. The Harm numbers in this table are less accurate than in Table 11 due to additional resolution which has created additional unknown values. However, the data shows the overwhelming amount of Harm associated with unrestrained occupants in rollovers, and the dominant role of ejection and partial ejection. It should be noted that the relatively small harm proportions associated with restrained occupants should not be assigned totally to safety belt effectiveness. Other factors include: (1) belt use reporting inaccuracies in the data, (2) a much lower belt use among rollover involved occupants, and (3) when exposed to rollovers, belt using car occupants are more likely to be in less severe crashes than unrestrained occupants. Table 14. Distribution of Fatalities in Rollover by Restraint Use Unrestrained Percent Not Ejected 26.1% Complete Ejection 52.3% Partial Ejection 9.8% All Unrestrained 88.2% Restrained Not Ejected 10.1% Complete Ejection 0.7% Partial Ejection 0.9% All Restrained 11.8%
FHWA/NHTSA National Crash Analysis Center Page 14 of 32 Prepared by: Dr. Kennerly H. Digges
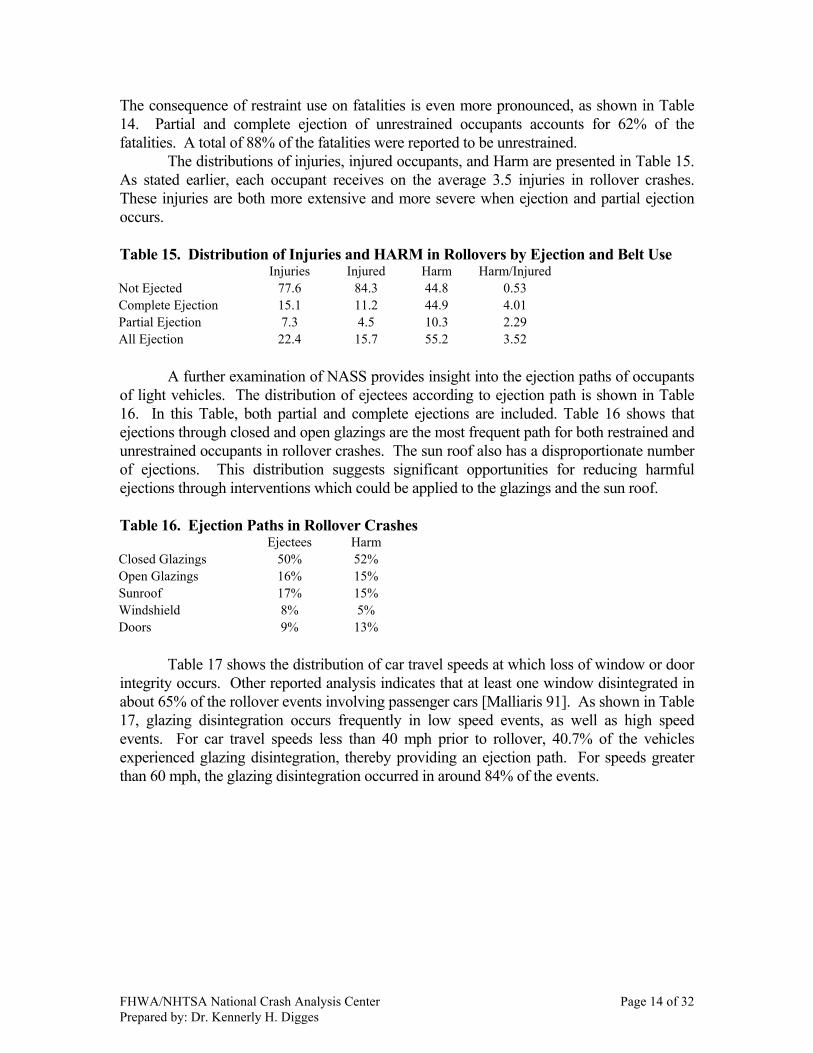
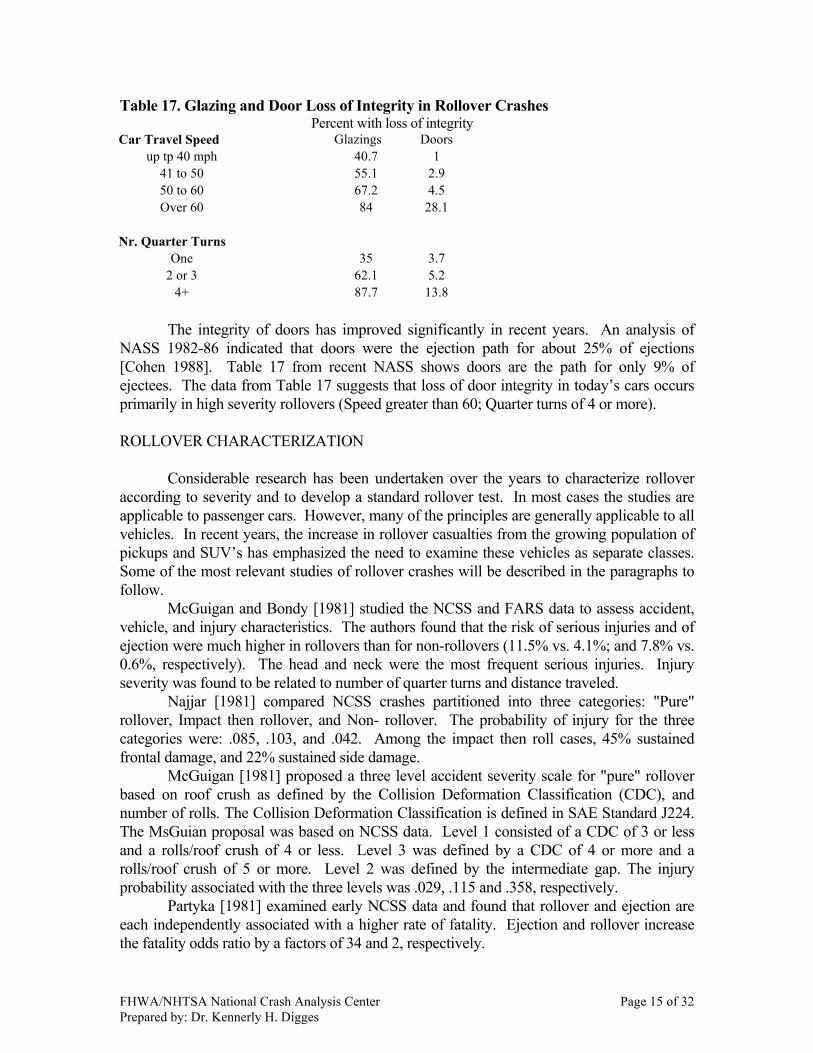
The consequence of restraint use on fatalities is even more pronounced, as shown in Table 14. Partial and complete ejection of unrestrained occupants accounts for 62% of the fatalities. A total of 88% of the fatalities were reported to be unrestrained. The distributions of injuries, injured occupants, and Harm are presented in Table 15. As stated earlier, each occupant receives on the average 3.5 injuries in rollover crashes. These injuries are both more extensive and more severe when ejection and partial ejection occurs. Table 15. Distribution of Injuries and HARM in Rollovers by Ejection and Belt Use Injuries Injured Harm Harm/InjuredNot Ejected 77.6 84.3 44.8 0.53 Complete Ejection 15.1 11.2 44.9 4.01 Partial Ejection 7.3 4.5 10.3 2.29 All Ejection 22.4 15.7 55.2 3.52 A further examination of NASS provides insight into the ejection paths of occupants of light vehicles. The distribution of ejectees according to ejection path is shown in Table 16. In this Table, both partial and complete ejections are included. Table 16 shows that ejections through closed and open glazings are the most frequent path for both restrained and unrestrained occupants in rollover crashes. The sun roof also has a disproportionate number of ejections. This distribution suggests significant opportunities for reducing harmful ejections through interventions which could be applied to the glazings and the sun roof. Table 16. Ejection Paths in Rollover Crashes Ejectees Harm Closed Glazings 50% 52% Open Glazings 16% 15% Sunroof 17% 15% Windshield 8% 5% Doors 9% 13% Table 17 shows the distribution of car travel speeds at which loss of window or door integrity occurs. Other reported analysis indicates that at least one window disintegrated in about 65% of the rollover events involving passenger cars [Malliaris 91]. As shown in Table 17, glazing disintegration occurs frequently in low speed events, as well as high speed events. For car travel speeds less than 40 mph prior to rollover, 40.7% of the vehicles experienced glazing disintegration, thereby providing an ejection path. For speeds greater than 60 mph, the glazing disintegration occurred in around 84% of the events.
FHWA/NHTSA National Crash Analysis Center Page 15 of 32 Prepared by: Dr. Kennerly H. Digges
Table 17. Glazing and Door Loss of Integrity in Rollover Crashes Percent with loss of integrity Car Travel Speed Glazings Doors
up tp 40 mph 40.7 1 41 to 50 55.1 2.9 50 to 60 67.2 4.5 Over 60 84 28.1
Nr. Quarter Turns
One 35 3.7 2 or 3 62.1 5.2
4+ 87.7 13.8 The integrity of doors has improved significantly in recent years. An analysis of NASS 1982-86 indicated that doors were the ejection path for about 25% of ejections [Cohen 1988]. Table 17 from recent NASS shows doors are the path for only 9% of ejectees. The data from Table 17 suggests that loss of door integrity in today’s cars occurs primarily in high severity rollovers (Speed greater than 60; Quarter turns of 4 or more). ROLLOVER CHARACTERIZATION Considerable research has been undertaken over the years to characterize rollover according to severity and to develop a standard rollover test. In most cases the studies are applicable to passenger cars. However, many of the principles are generally applicable to all vehicles. In recent years, the increase in rollover casualties from the growing population of pickups and SUV’s has emphasized the need to examine these vehicles as separate classes. Some of the most relevant studies of rollover crashes will be described in the paragraphs to follow. McGuigan and Bondy [1981] studied the NCSS and FARS data to assess accident, vehicle, and injury characteristics. The authors found that the risk of serious injuries and of ejection were much higher in rollovers than for non-rollovers (11.5% vs. 4.1%; and 7.8% vs. 0.6%, respectively). The head and neck were the most frequent serious injuries. Injury severity was found to be related to number of quarter turns and distance traveled. Najjar [1981] compared NCSS crashes partitioned into three categories: "Pure" rollover, Impact then rollover, and Non- rollover. The probability of injury for the three categories were: .085, .103, and .042. Among the impact then roll cases, 45% sustained frontal damage, and 22% sustained side damage. McGuigan [1981] proposed a three level accident severity scale for "pure" rollover based on roof crush as defined by the Collision Deformation Classification (CDC), and number of rolls. The Collision Deformation Classification is defined in SAE Standard J224. The MsGuian proposal was based on NCSS data. Level 1 consisted of a CDC of 3 or less and a rolls/roof crush of 4 or less. Level 3 was defined by a CDC of 4 or more and a rolls/roof crush of 5 or more. Level 2 was defined by the intermediate gap. The injury probability associated with the three levels was .029, .115 and .358, respectively. Partyka [1981] examined early NCSS data and found that rollover and ejection are each independently associated with a higher rate of fatality. Ejection and rollover increase the fatality odds ratio by a factors of 34 and 2, respectively.
FHWA/NHTSA National Crash Analysis Center Page 16 of 32 Prepared by: Dr. Kennerly H. Digges
Segal [1980] studied the accident case files of 267 severe rollover accidents in the National Crash Severity Study (NCSS). The NCSS files are based on crashes investigated from 1977 to 1979. Accidents were selected for case by case review, based on the presence of door opening, and/or significant roof crush. The cases studied were predominantly (89%) passenger cars. For about half of the cases, the pre accident speed was estimated to be greater than 50 mph. Segal observed that most rollover accidents involved some degree of skidding sideways prior to rollover. About 80% of the vehicles had a lateral velocity component before the rollover occurred, and most had a significant forward component as well. The overturning motion was primarily roll motion in 80% of the cases examined. About 15% of the vehicles had primarily pitch motion, and the remaining 5% combined pitch and roll. Most of the vehicles rolled four quarter turns or less. Segal noted that high injury severity to occupants appeared to be related to the number of quarter turns experienced by the vehicle. Door opening and ejection also appeared to increase with the number of quarter turns, which may account for the higher injury severity. The degree of roof crush was found to be relatively independent of roll turns, but was more associated with the vehicle coming to rest on its roof. To learn more about factors influencing rollover and ejection, Terhune [1988] examined single vehicle crashes involving 4,565 vehicle from the combined 1980-85 NASS file. As part of his study, he created a "clinical file" of 402 single vehicles crashes which included 192 rollovers. In order to study ejections in LTV's, he extracted a sample of 111 cases of pickups, vans, and utility vehicles. He concluded that LTV's involved in single vehicle accidents had significantly higher rollover rates than passenger cars. Utility vehicles had even higher rollover rates, ejection rates, and frequency of skidding or spinning prior to rollover. He found that a side force tripping phenomena preceded approximately 65% of passenger car rollovers and 85% of LTV rollovers. In controlling for crash severity, Terhune used the extent of roof crush, as defined by the Collision Deformation Classification. He found that, for passenger cars, ejection rates and injury rates for those not ejected generally increased with increasing top damage measured by CDC. For light trucks, the ejection rate at low values of roof crush CDC was higher than for passenger cars at high levels of roof CDC. No clear trend between moderate levels of top damage and ejection or injury rates was evident for LTV's. Terhune concluded that ejection is very dangerous to occupants, even in low severity crashes. Malliaris [1987] analyzed ejections and non-ejections reported in FARS between 1975 and 1985 and found that the odds of fatality for car ejectees are six times higher than for non-ejectees subjected to very similar crash conditions, irrespective of seating position. The fatality odds for light truck and van ejectees are 25% higher than for car ejectees. Cohen et.al. [1989] examined single vehicle longitudinal rollover cases reported in NASS 1981-86. He found that rollover frequencies were related inversely to vehicle size class for cars and pick-up trucks. The analysis suggested that the primary area of damage and extent of roof crush were good indicators of injury for restrained and unrestrained non-ejected occupants. For ejected occupants, number of quarter turns was an additional indicator variable. Ejection from two door cars was twice as likely as ejection from four door cars. Papers dealing with two different types of full scale car rollover tests have been reported by Habberstad, et.al. [1986] and Orlowski, et. al. [1985]. The Orlowski paper documented roll tests of Chevrolets with and without roof reinforcement. The authors
FHWA/NHTSA National Crash Analysis Center Page 17 of 32 Prepared by: Dr. Kennerly H. Digges
concluded that a roll cage did not reduce injury measures on a test dummy for the vehicle and roll condition tested (FMVSS 208 roll cart). The Habberstad paper reported full vehicle testing which involved severe tripping prior to the roll. The tests showed that severe dummy impacts with the vehicle interior could be induced early in the rollover event. Robertson [1897, 1988] found that fatal rollover of utility vehicles per 100,000 registered vehicles relative to cars during 1982-87 was strongly correlated to the static stability of the vehicles. Harwin and Brewer [1990] examined vehicle, driver and environmental factors which could be deduced from state accident records maintained by NHTSA (Cardfile) and found that vehicle stability factor had a strong influence on rollover involvement risk. Malliaris [1989] examined FARS and Cardfile to determine the significance of motor vehicle characteristics on rollover propensity, after controlling for nonvehicular influences. He found that wheelbase and stability factor were both influential. Four wheel drive vehicles also exhibited higher rollover risks, after controlling for exposure differences. Mengert, et. al. [1989] examined the single vehicle rollover risks for 40 vehicle make/models in the states of Maryland, Texas, and Washington. Vehicle stability factor and urban/rural location were found to be important predictors of rollover risk. Harwin and Emory [1989] examined a data base of 4,000 rollovers in Maryland (CARS) which contains data for precrash conditions. They found that 80% to 90% of the rollovers were tripped, generally by soil. They reported that injury severity correlated strongly with speed. Stability factor, and number of quarter turns were also influential. Terhune [1989] reported continuing analysis of the file created by his 1988 research. He found that the vehicle precrash orientations most related to overturn were lateral skidding and spinning/rotating. Ditches and sideslopes were the roadside features which exhibited the greatest overturn potential. Malliaris [1991] found "potential for lateral slide" was an important pre-crash factor that predicted rollover frequency. Vehicle pre-rollover speed was confirmed as a factor which is related to the severity of injuries in rollover events. Digges [1991] reported an analysis of 140 rollover cases with severe vehicle damage CDC of 4 or more), taken from the 1988-89 NASS files. The mean precrash speed for these cases was 56 mph, and the mean roll rate was between 1 and 2 rev/sec. In 89% of the cases, the rollover was the most harmful event. The tripping force was the most harmful event in most of the remaining cases. The roll direction was 43% clockwise, 46% counterclockwise, and 11% unknown. The amount of roof crush was found to have a strong influence of fatality risk. For moderate levels of roof crush, the fatality rate for non-ejected occupants was 5%. For severe roof crush the fatality rate was 20%. Partyka of NHTSA [1992] noted that studies of roof crush require control for crash severity. Friedman and Nash [2001] disagree. These authors contend that in most rollovers, each individual roof impact is a relatively low severity event, but one that may be repeated. They advocate a roof standard that would limit intrusion in repeated low severity impacts with the ground. Raines and Kanianthra of NHTSA [1995] examined relationships between roof crush and head/neck injuries among belted occupants in rollovers. Based on 155 cases of belted occupants in rollovers in NASS/CDS 1982-1989, the authors found that the risk of head/neck injury increased with reduced headroom. Further, it was found that when the initial headroom was higher, the incidence of head injury was reduced. Based on this study,
FHWA/NHTSA National Crash Analysis Center Page 18 of 32 Prepared by: Dr. Kennerly H. Digges
NHTSA has maintained that the initial head room is an important variable in examining injuries from roof crush. Parenteau [2000] studied driver rollover in single vehicle crashes, using 1992-96 NASS/CDS data. The authors found 27% of the unbelted drivers were ejected, compared with 1% for the belted drivers. Spinal injuries were most common when the vehicle rolled to the right. Head injuries occurred in both roll directions. Driver ejection generally occurred through left front openings. However, for right direction rollovers, ejection through left front openings and also roof openings. Friedman and Nash [2001] reanalyzed the Malibu rollover test raw data used by Orlowski [1985] and concluded the earlier analysis was flawed. These authors found that neck injuries would not have occurred in the vehicles with strengthened roofs as was predicted in the earlier paper. They recommended a revised 216 test procedure to provide roof strength suitable for multiple impacts with the ground and which limits the intrusion and speed of intrusion on each contact. UNITED STATES STANDARDS APPLICABLE TO ROLLOVER The following FMVSS have applications to considerations in rollover safety features. Roof Crush Resistance - FMVSS 216 The roof strength of vehicles is governed by FMVSS 216. Currently, the standard applies only to passenger cars. However, beginning in September 1992, the standard also applied to light trucks 0 -6000 lb. gross vehicle weight. The 216 standard requires a static test of the roof. The roof must support 1.5 times the vehicle weight without deforming more than 5 inches when loaded by an unyielding rectangular plate 30" by 72". The direction of load is 5 degrees from horizontal, applied at the front header, and 25 degrees from horizontal, applied at the side roof rails. (See Figure 1.) The maximum load requirement for passenger cars is limited to 5,000 Lbs. Both left and right sides of the vehicle must meet the test requirement. But a particular vehicle does not have to meet further requirements after having been tested in one location.
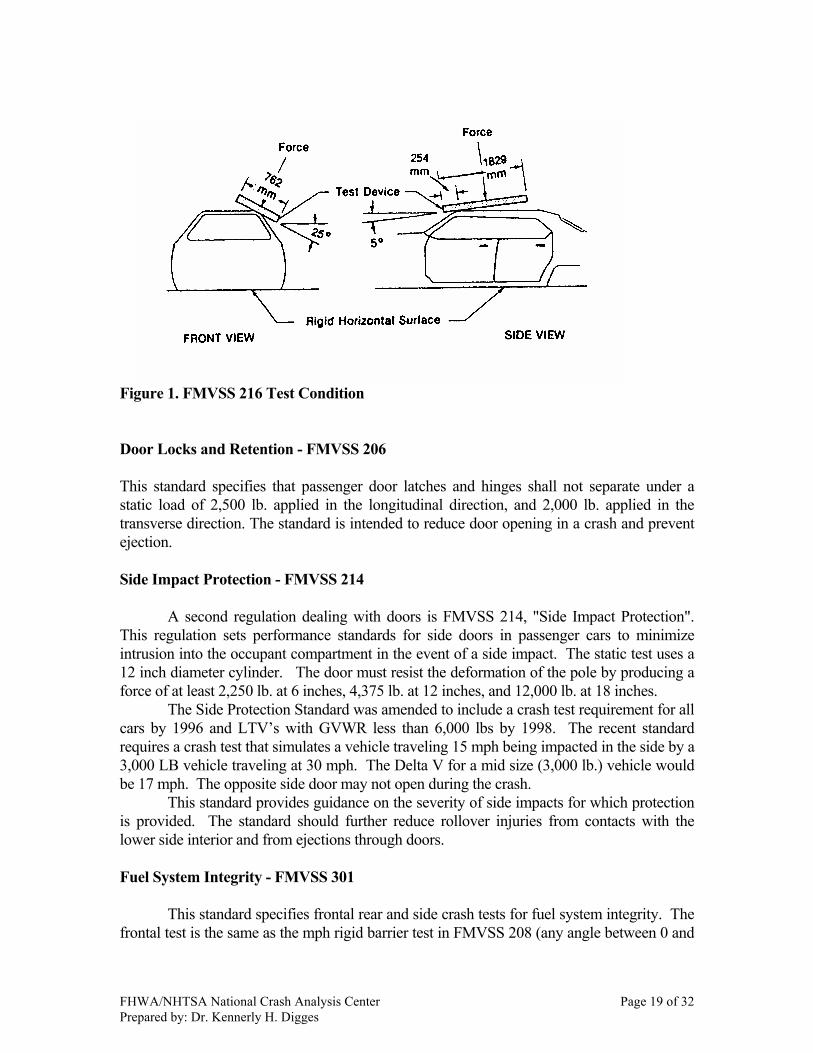
FHWA/NHTSA National Crash Analysis Center Page 19 of 32 Prepared by: Dr. Kennerly H. Digges
Figure 1. FMVSS 216 Test Condition Door Locks and Retention - FMVSS 206 This standard specifies that passenger door latches and hinges shall not separate under a static load of 2,500 lb. applied in the longitudinal direction, and 2,000 lb. applied in the transverse direction. The standard is intended to reduce door opening in a crash and prevent ejection. Side Impact Protection - FMVSS 214 A second regulation dealing with doors is FMVSS 214, "Side Impact Protection". This regulation sets performance standards for side doors in passenger cars to minimize intrusion into the occupant compartment in the event of a side impact. The static test uses a 12 inch diameter cylinder. The door must resist the deformation of the pole by producing a force of at least 2,250 lb. at 6 inches, 4,375 lb. at 12 inches, and 12,000 lb. at 18 inches. The Side Protection Standard was amended to include a crash test requirement for all cars by 1996 and LTV’s with GVWR less than 6,000 lbs by 1998. The recent standard requires a crash test that simulates a vehicle traveling 15 mph being impacted in the side by a 3,000 LB vehicle traveling at 30 mph. The Delta V for a mid size (3,000 lb.) vehicle would be 17 mph. The opposite side door may not open during the crash. This standard provides guidance on the severity of side impacts for which protection is provided. The standard should further reduce rollover injuries from contacts with the lower side interior and from ejections through doors. Fuel System Integrity - FMVSS 301 This standard specifies frontal rear and side crash tests for fuel system integrity. The frontal test is the same as the mph rigid barrier test in FMVSS 208 (any angle between 0 and

FHWA/NHTSA National Crash Analysis Center Page 20 of 32 Prepared by: Dr. Kennerly H. Digges
+/- 30 degrees and any speed up to 30 mph). The side test is by a moving barrier at 20 mph. The rear test is by a moving barrier at 30 mph. After each crash test, the vehicles is subjected to a quasi-static rollover. It is rotated along its longitudinal axis to each successive increment of 90 degrees. The rotation between each increment shall be uniform, over a time of 1 to 3 minutes. The vehicle shall be held at each increment for five minutes. At each increment, the fuel spillage shall not exceed 5 ounces in the first five minutes or more one ounce per minute for the remaining test period. This portion of the standard is to insure fuel integrity in rollover crashes. Occupant Crash Protection - FMVSS 208 This standard which requires air bags includes a rollover test as an option for vehicles in lieu of installing safety belts. For the rollover option, the vehicle is subjected to a rollover test with a lateral speed of 30 mph with test dummy in the front outboard seating position of the lower side as mounted on the test sled. The dummy must meet the standard injury criteria or all portions of the dummy must be contained within the outer surfaces of the occupant compartment throughout the test.
The FMVSS 208 rollover test device is shown in Figure 1. The platform is decelerated from 30 mph to 0 in a distance of not more than 3 ft. The deceleration rate must be a minimum of 20g for at least 0.04 seconds. The principal focus of FMVSS 208 is to provide crash protection in frontal crashes. It requires three point safety belts in all outboard passenger seating positions, and air bags for the driver and front outboard passenger. The three point belts in the frontal outboard positions must have adjustable shoulder anchorage’s or be integrated into the seat. The standard requires 30 mph crash test to assure vehicle safety performance. Before 1997, the crash dummies were required to meet the criteria without the use of safety belts which require action by the occupant to “buckle-up”. In addition, if manual belts were offered, the vehicle must pass the standard with the belts buckled. For vehicles with air bags and manual belts, two tests were required. One with the dummy unrestrained by the manual belts, and one with the manual belts fastened. The regulation required passenger cars manufactured after September 1989 and light trucks and vans under GVW 10,000 pounds manufactured after September 1991 to provide automatic crash protection which meets the test criteria. In 1992, the regulation was modified to require air bags for the driver and front passenger of all light vehicles by September 1998. In March 1997, another change temporarily eliminated the requirement for crash testing the vehicle with unrestrained dummies. A generic sled test of the air bag with unrestrained dummies was substituted. The reason for the latest change was to permit air bags which inflate less forcefully (depowered air bags). In May 2000, NHTSA again amended the 208 Standard to require additional tests for air bag injury to out of position child and small female dummies. Crash tests with belted small female dummies were also required. The vehicle crash test with the 50% male dummy was reinstated, but at a reduced speed of 25 mph. The requirements are phased in for MY 2003 and 2005. One consequence of the frontal protection improvements has been a significant increase in the number of vehicles with lap belt pretensioners that deploy in frontal crashes.
FHWA/NHTSA National Crash Analysis Center Page 21 of 32 Prepared by: Dr. Kennerly H. Digges
The principal influence of the 208 standard on rollover crash protection is that it specifies safety belt performance. It is significant to note that belts are tested for safety performance in frontal crashes, only. Rollover performance is not tested. Interior Protection -FMVSS 201 This standard provides friendly interiors to prevent occupant contact with sharp edges and rigid surfaces. It applies to all vehicles less than GVW 10,000 pounds. For production vehicles, it requires specific measurements on the instrument panel, seat backs, compartment doors, sun visors and arm rests. The main focus of 201 is the use of padding capable of absorbing energy and avoiding the use of sharp edges in compartment components.
Initially the standard applied to dashboards/instrument panels, sunvisors, seat backs, armrests, and interior compartment doors. In 1995, it was revised to apply test requirements for additional interior components. This revision will phase in a new test procedure for the following interior components: Front & Rear Headers; Left & Right Side Rails; Left & Right A, B, and Other Pillars; Upper Roof & Roll Bar; Brace or Stiffener; and Seat Belt Components. The test requires a Free Motion Headform (Hybrid III dummy head) to impact the vehicle interior components at 15 mph and at specified angles. A HIC of 1000 is allowed. The requirement was phased in beginning in September 1998. The standard should reduce contact injuries in all crashes, including rollovers. In April 1997, NHTSA published a Regulatory Analysis to support an Amendment to FMVSS 210 to encourage upper interior head protection using the Head-Impact Energy Absorbing Dynamic Systems (HEADS). Several additional test procedures were adopted as voluntary tests for deplorable head restraints.. The proposed alternative test includes a vehicle side impact into a rigid pole, 10 inches in diameter. This portion of the standard would add protection in rollover crashes that are preceded by a side impact. FMVSS 205 Glazing Materials and FMVSS 212 Windshield Mounting The FMVSS 205 standard specifies tests for chemical resistance, abrasion resistance, impact resistance, thermal stability and transparent properties of glazings. The FMVSS 212 standard requires that the mounting retain at least 50% of windshield the periphery in a 30 mph barrier test. The purpose of this standard is to reduce ejections through the windshield. NHTSA Rollover Rulemaking and Research In October of 2001, NHTSA published a request for comments on an increased roof crush standard. In the request, NHTSA noted that there was no correlation between vehicles that tested well and the rollover protection they offered occupants. They also noted that their research had shown the need to consider initial headroom in addition to the allowable roof crush. Furtherer they questioned the suitability of the test angles and test speed of the present 216 test, and the need for a dynamic test. A docket was established to provide public access to the comments supplied to NHTSA. In January 1992, NHTSA published an Advanced Notice of Proposed Rulemaking on Rollover. In this Notice, and the accompanying Preliminary Regulatory Evaluation, the
FHWA/NHTSA National Crash Analysis Center Page 22 of 32 Prepared by: Dr. Kennerly H. Digges
principal thrust is a vehicle stability requirement. However, comments on other alternatives, including increased roof strength, improved interior padding, and improved occupant restraints were solicited. The outcome of this rulemaking was a consumer information requirement for a rollover stability rating to be included in the window sticker of new vehicles. The regulatory analysis cited research by I.S. Jones [1974], and Harwin and Brewer [1990] which links the rollover propensity of vehicles to their static stability factor. The static stability factor is defined as the average half track width divided by the vertical center-of-gravity height. This parameter correlates very well with the tilt table ratio. The latter parameter is the tangent of the angle at which the wheels leave the ground, when the vehicle is placed on a tilt table. Harwin and Brewer found a strong correlation between the stability factor and the resistance to rollover. For vehicles with a stability factor of 1, 30 to 40 percent of the single vehicle accidents were found to be rollovers. For vehicles with a stability factor of 1.4, rollovers were only around 10%. The functional relationship for the range appeared to be linear. Based on this research, reductions in stability factor increase rollover propensity in proportion to the decrease in stability factor. NHTSA’s research and development program has tested a number of vehicles for geometry and suspension characteristics. In addition, they have an active and continuing program to conduct rollover tests on vehicles. The R&D rollover test involves rollover test cart. The cart carries the vehicle sideways at a speed of 30 mph. It decelerates, while actuating a hydraulic unit that rotates the base platform. The rotation is intended to impart a roll rate to the vehicle of about one revolution per second. The countermeasures under recent investigation at NHTSA include the following: active and passive belt systems, interior padding, improved door integrity, increased roof strength, and improved window design for occupant containment. A program initiated in 1997 evaluated the BMW Inflatable Tubular Structure for occupant containment in rollovers [Yaniv, 1998]. In this program, the authors demonstrated occupant containment in rollover tests of a Ford Explorers. THE ROLLOVER TEST AND EVALUATION PROBLEM Historically, rollover crashes have been characterized by a large number of highway parameters that may influence rollover outcomes at varying and often unknown ways. Examples of such parameters in the literature are the terrain topography at the time of the rollover crash; the first harmful event and its location with respect to the roadway; roadway grade, curvature and surface conditions. Within this diversity of influencing factors, safety engineers need to assess the efficacy of occupant protection countermeasures. Further, a basis for selecting test procedures, and relating compliance with these procedures to real world benefits is vitally needed. The problem of assessing countermeasures in rollover is confounded by the lack of dummies, laboratory test facilities, and test procedures to study rollover. There is no rollover test dummy which has been validated in a manner analogous to the Hybrid III in frontal crashes, or the SID, EUROSID, and BioSID in side impacts. Similarly, there is no laboratory facility in rollover that is equivalent to the crash test sleds used in planar impact
FHWA/NHTSA National Crash Analysis Center Page 23 of 32 Prepared by: Dr. Kennerly H. Digges
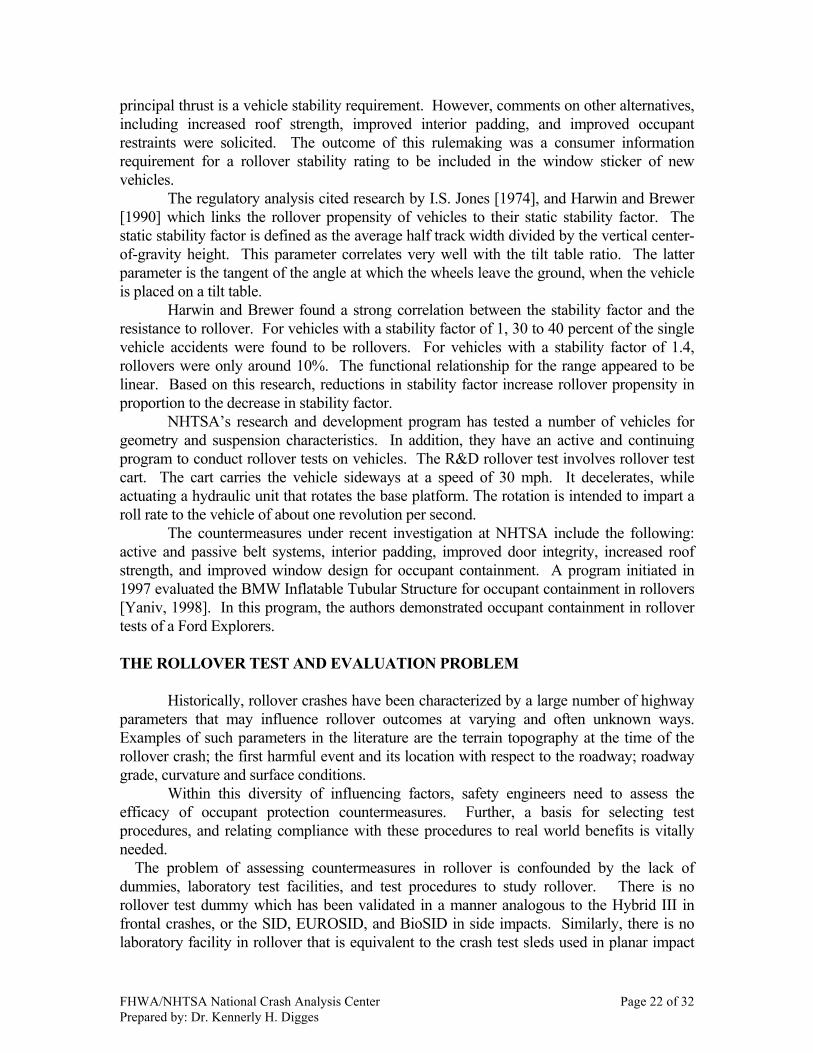
research. Rollover testing has relied principally on full vehicle rollover tests with their attendant expense and variability. There are several full vehicle rollover test procedures currently in use, and the relationship between them is undetermined. During the past fifteen years, rollover tests conducted by the Department of Transportation have been of three types. The first type of rollover is induced by a median barrier designed to redirect vehicles back into the roadway. However, as the angle and speed of engagement with the barrier are increased, a rollover may result. The roll rate observed when a midsize vehicle traveling at 60 mph engages the median barrier is about 1 rev/sec. Computer reconstructions of this type of test have been used to validate rollover models [Kaleps, 1986]. The second type uses a test procedure similar to that specified in FMVSS 208, described earlier, and shown in Figure 2. This test induces a mildly tripped rollover, but with a low roll rate. The vehicle generally impacts on the near side, rolls on its roof and continues for several more quarter turns.
Figure 2. FMVSS 208 Rollover Test Device The third type of test is a staged rollover induced by ejecting the vehicle from a moving a test cart. The test cart contains platform that is hinged perpendicular to the direction of travel. The vehicle is placed on the platform, which can be rotated relative to the direction of travel. The cart and vehicle are towed to speed (30 mph or less), and the vehicle is ejected by rapid rotation of the platform. The brakes are applied to the cart so that it does not interfere with the rolling vehicle. The roll rate is generally less than 1 rev/sec. The initial impact of the vehicle is generally on the roof or opposite side upper roof supporting structures. Earlier studies [Segel 1980, Terhune 1988, Malliaris 1991] suggest that the most common type of rollover involves a vehicle slipping sideways and incurring tripping acceleration, which induces the rollover. Terhune found that 70% of the cars, and 91% of
FHWA/NHTSA National Crash Analysis Center Page 24 of 32 Prepared by: Dr. Kennerly H. Digges
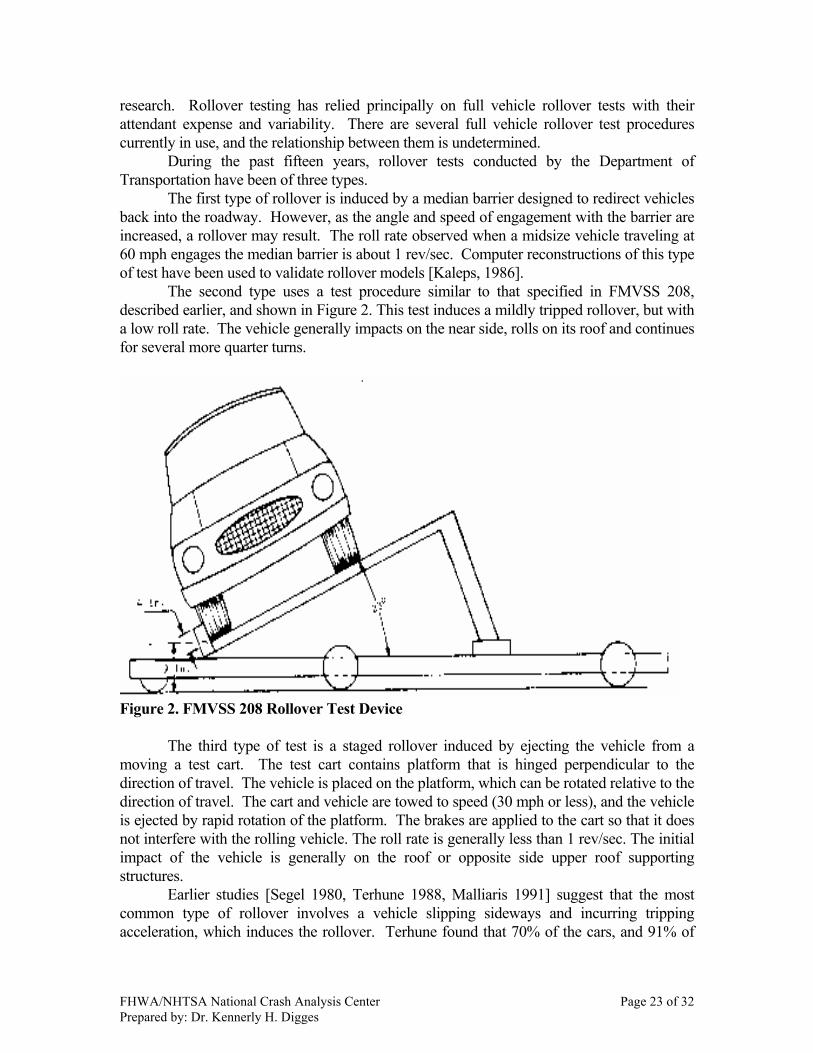
the vans and pickups had tripping induced rollovers. Malliaris reported that precrash events which can induce lateral slide are predictors of rollover incidence, and that vehicle angular motion about the roll axis is recorded in more than 95% of the rollover cases. Segel indicated that the initial impact on the vehicle roof or opposite B-pillar was most damaging. The NHTSA R&D test cart attempts to approach typical conditions. However, at 30 mph, and a roll rate of less than 1 rev/sec the median rollover energy is not achieved. The reduced kinetic energy is compensated to some degree by increased potential energy of the vehicle. The cg of the vehicle is much higher on the NHTSA R&D test cars than on the FMVSS 208 rollover test cart. The FMVSS 208 test cart has been criticized for its low kinetic energy - both in translation and rotation. A rollover test device has also been developed by Exponent in conjunction with Ford. In this device the test vehicle is placed on a spit mounted on the rear of a tractor trailer. The spit provides the rotation rate and the tractor trailer provides the longitudinal velocity. The test vehicle can be dropped at specified roof impact conditions and specified roll rates and linear velocities. A drop test procedure specified by SAE has also been used to evaluate roof strength (SAE J996, Jun80). Under this procedure, the test vehicle is inverted and dropped on the roof from a specified height, as shown in Figure 3.
Figure 3. SAE Drop Test Configuration COMPUTER MODELING The lack of rollover dummies, test facilities and test procedures provides an alternative opportunity for the application of vehicle and occupant models that simulate rollover. The models can assist in the identification of intervention opportunities and the evaluation of test protocols. Computer modeling of rollover crashes permits precise and repeatable control of the rollover environment, and permits the study of a wide range of rollover conditions at low cost. Computer simulations of vehicles and occupants in rollover crashes have been developed under sponsorship of NHTSA and published in the literature [Obergefell 1986, Smith 1993]. These papers describe models which have been validated for the two kinds of tests described above. However, in both of these rollover test types, the tripping acceleration which induced the rollover is relatively low. Digges reported computer simulations of trip induced rollovers in evaluating alternative countermeasures [Digges, 1994]. Based on an
FHWA/NHTSA National Crash Analysis Center Page 25 of 32 Prepared by: Dr. Kennerly H. Digges
analysis of the predominate rollover environments, scenarios for rollover simulations were developed. The initial goal of the simulation was to explore occupant motion during the initial phase of the rollover. This phase begins at the pre-roll conditions including skidding, tripping and launching accelerations. It includes the subsequent linear and angular motion of the vehicle, ending just before the first impact with the ground. For the simulations reported in the 1994 paper, the vehicle is initially sliding sideways. It trips, and then rolls about the vehicle roll axis. The magnitude of the tripping acceleration is specified by delta-V. It is applied in conjunction with angular acceleration over a period of 120 ms. COMPUTER MODELING AND TESTS OF BELT IMPROVEMENTS IN ROLLOVERS Computer simulations of rollovers evaluated the benefits that might be obtained by two belt improvements currently under development and/or in limited production. These improvements are belts with pretensioning, and belts integrated into the seat. Several manufacturers offer belts which are pretensioned in frontal collisions. Mercedes Benz offers a convertible which senses rollover and deploys additional occupant protection, including a roll bar. The use of pretensioning belts in rollover crashes is an alternative countermeasure which appears feasible using current technology. Another development underway in industry which may be beneficial to rollover protection is the integrated seat [Haberl 1989; Cole 1993]. The integrated seat provides the shoulder belt anchorage location on the seat back. As a consequence, the configuration provides the possibility of anchoring the entire upper torso to the seat back during a rollover crash. Reduced chest and head excursion should result. The characteristics of the pretensioned belt and the integrated seat were simulated during the initial 270 degrees of a simplified rollover [Digges, 94]. The occupant was a 50% male Hybrid III dummy seated in the driver position. For these simulations, the events included a 5 mph delta-V trip, followed by roll at a constant rate of 1 rev/sec clockwise (passenger side first) about the roll axis. The simulation examined only the dynamics of the tripping and subsequent roll. It did not include the ground impacts. The vehicle geometry was selected to simulate a typical compact car. The clearance between the head and roof was set at 10 cm. Belt slack was set at 6 cm. for the baseline cases, and 0 for the pretensioned cases. Typical results of the simulations are shown in Table 18. Table 18 - Computer Simulation for Rollovers - Pretensioned and Seat Mounted Belts Belt Anchorage Configuration Std. Std. Seat Seat Belt Slack 6 cm Pret. 6 cm Pret. Head Displacement Roof Contact ? Yes Yes No No Neck Compression ShoulderBelt Force
% of Allowable Force Ratio
1.9 2.0
0.7 1.0
0.0 34.
0.0 30
In these simulations, the conventional shoulder belt geometry (Std. column in Table 18) permitted the driver to slip out of the belt during a clockwise roll. As a result, the lap belt provided the principal restraint. Slack in the lap belt permitted the dummy head to
FHWA/NHTSA National Crash Analysis Center Page 26 of 32 Prepared by: Dr. Kennerly H. Digges
contact the roof, resulting in neck compressive loads were greater than the injury tolerance. Pretensioning the lap belt reduced the neck loads, but still permitted the head to contact the roof. The seat mounted shoulder belt (Seat column in Table 18) provided greater upper body restraint during the rollover. In the cases with 6 cm. of belt slack, the head did not contact the roof. Performance was improved by pretensioning the lap belt for this belt configuration, as shown in Table 18. In the seat mounted belt configuration, the shoulder belt carried much more of the occupant load than in the standard configuration. However, as the tripping severity increased, there was a tendency for the occupant to slip out of the shoulder belt in both configurations. This result suggest the need to pretension the shoulder belt as well as the lap belt. These simulations are useful in providing insights into the potential benefits of improved belt systems. However, due to the complexities of rollover events, additional data analysis, simulation and testing are required to accurately assess the benefits of pretensioning and belts integrated into the seat. Simplified tests of belt systems in rollovers have been reported by Arndt and Friedman [Arndt, 1995; Friedman, 1996]. Arndt examined the consequence of varying two parameters - (1) the lap belt angle at 45 degrees and 90 degrees, and (2) the belt slack at 50mm, 25mm, and 62Kn of pretension. Arndt’s evaluation consisted of two tests - A static test with an occupant or Hybrid III 95% male dummy rotated at 180 degrees, and a dynamic drop test with the dummy at 180 degrees. The speed at impact was 9.5 mph and a 5g deceleration pulse Friedman measured the head excursion for various restraint systems using volunteers seated in a test fixture that could be rotated at 100-300 degrees per second. The excursions observed in stock production systems ranged from 13 to 26 cm. A difference between dummies and real people is the extent of spinal extension in real people. Friedman noted a need for shoulder belt support in rollovers in order to control the upper torso motion, including spinal extension. The mitigation of head contacts with the upper vehicle structure has been investigated by NHTSA. Two staff members studied the NASS 1988-1992 files and found that for restrained occupants, the average residual headrooom for the uninjured was 6 cm more than for the injured in rollover crashes [Rains, 1995]. COMPUTER MODELING OF EJECTION CONTROL Increased restraint use is a readily available opportunity for reducing ejections. In addition, earlier analysis suggests that occupant containment within the vehicle provides major benefit in rollovers, even for unrestrained occupants [Malliaris 87]. Based on the ejection paths shown in Table 16, countermeasures to reduce ejections through side windows offer large opportunities for intervention. Other opportunities include the sun roof, and the windshield. Computer simulation to evaluate ejection control was reported by Digges [Digges, 1994]. The simulation selected to examine the side window ejection opportunity was the tripped rollover described earlier. Variation of two variables were investigated: the severity of the tripping event (specified by delta V), and the roll rate. The occupant was a 50% male Hybrid III dummy in the driver position. The roll motion was counterclockwise and the
FHWA/NHTSA National Crash Analysis Center Page 27 of 32 Prepared by: Dr. Kennerly H. Digges
simulation encompasses roll motion of 270 degrees. Post rollover ground contact was not included. In these simulations the side windows were initially open. Ejections were not produced during rollovers at 0.5 and 1.0 rev/sec when the tripping delta was only 1 mph. However, as the tripping severity increased to 5 mph, ejection of the head resulted at 0.5 rev/sec, and complete ejection resulted at 1.0 rev/sec. At higher tripping severities, complete ejection was produced at both roll rates. A repeat of the simulations with ejection resistant side window were made. The glazing characteristics similar to those exhibited in laminated windshields were assumed. The glazing prevented ejection in all cases. The maximum forces exerted on the glazing by the dummy were well below the strength of currently used windshield interlayers. NHTSA has reported successful testing of ejection resistant side windows and windshields [Clark 89]. This research evaluated the penetration resistance of the glazing by laboratory tests and the rollover performance by crash testing in actual vehicles. The stated design goals for ejection resistant glazings included resisting a 40 LB ball impact at 20 mph, and maintaining integrity during a rollover. Rollover tests of eight vehicles with experimental ejection resistant side windows have been reported. The integrity of the side glazing was maintained in all tests. In the eight tests reported, the number of quarter turns ranged from 1 to 8, and the vehicle deformation at the right A-pillar ranged from .4 to 9.1 inches. RECENT DEVELOPMENTS - HEAD PROTECTION/ EJECTION CONTROL (Inflatable Structures and Static Padding) The use of ejection resistant glazings has been impeded by deficiencies in durability and by higher cost, weight, and complexity. A better and more practical approach to the window ejection problem may be the inflatable devices such as the Inflatable Tubular Structure (ITS) offered in 1997 by BMW and the air curtain being adapted by Saab, Volvo, Ford and Daimler/Chrysler. These devices inflate and cover the front side windows, reducing head impacts and ejections through windows. The BMW device currently inflates in a side impact with a delta-V of 15 mph or greater. A large number of rollovers are preceded by a side or tripping acceleration sufficient to deploy the air cushion. Deployment of these devices in all rollovers may also be practical, using sensors like those under development at Ford and Mercedes Benz. The inflatable devices also offer head protection from impacts with interior surfaces. The ITS is approximately 9 inches in diameter. HIC levels can be reduced to much lower values with 9 inches of displacement than they can with one or two inches of upper interior static padding. In addition, protection can be provided to areas not practical to cover with padding. The benefits of head protective padding were researched by Monk and Willke [Monk, 1986]. This research shows that one inch of well chosen padding on an A-pillar can reduce head injury levels by 50% in a 25 mph impact. Based on this and other research, a revision to FMVSS 201 discussed earlier has been issued by NHTSA. . SIDE AIR BAGS
FHWA/NHTSA National Crash Analysis Center Page 28 of 32 Prepared by: Dr. Kennerly H. Digges
Side air bags were first introduced on the Volvo 850 in the early 1990’s. These air bags and their deployment mechanisms were completely contained in the front seats. They were deplored by an impact from the intruding door on a seat mounted initiator. A pyrotechnic ignition system ran from the initiator to the gas generator. The Volvo first generation system was designed to protect the chest. It did not extend upward sufficiently to protect the head. Other manufacturers now offer chest protecting side air bags supplemented by head protective air bags. These include BMW, Mercedes Benz, Saab and Volvo.
In addition, some manufacturers offer side bags which extend to provide head protection. There include Ford/Lincoln and Nissan/Infinity. Pretensioners Belt pretensioners that deploy in rollovers offer the possibility of reducing the translation of the occupants, which in turn should reduce the severity of head impacts. However, most pretensioners do not deploy in rollover crashes. A number of manufacturers offer pretensioners that deploy in frontal collisions. Mercedes Benz began offering pretensioners on shoulder belts in the early 1980’s. Their pretensioners were pyrotechnic and were deployed by the air bag sensor in frontal crashes. Volvo and BMW subsequently introduced mechanical pretensioners from Autoliv. These pretensioners, used cocked springs, which retracted the lap belt buckle about 3 inches upon impact. In MY 2000 Ford introduced pretensioners on all new platforms. In most cases the pretensioners deploy only in frontal and side crashes. Rollover Sensors A limitation in deploying belt pretensioners and inflatable protection devices in rollovers has been the lack of a reliable rollover sensor. Ford has announced that inflatable rollover protection (Safety Canopy) will be introduced on the 2002 Explorer and the 2003 Expedition released in May 2002. Other manufacturers are expected to offer this feature. SUMMARY AND CONCLUSIONS This paper summarizes the significant background research on rollover and roof crush. The research indicates that difficulties exist with the repeatability of dynamic rollover tests that attempt to duplicate real world rollover crashes. Further, difficulties exist in using existing dummies to evaluate rollover injuries due to the lack of biofidelity of dummies in rollover crashes. Under these conditions, computer simulation lends itself to problem solution. Computer simulations are highly repeatable, and permit the variation of parameters to evaluate sensitivity to different environmental conditions. Computer simulation allows direct comparison of different test techniques – full vehicle rollovers, vehicle drop tests, and quasi static tests (FMVSS 216 type) with various test conditions. These are the essential issues that NHTSA raised in their request for comments on roof crush testing [NHTSA 2001]. Computer modeling is the most practical approach to resolving the issues that impede an improved roof strength regulation.
FHWA/NHTSA National Crash Analysis Center Page 29 of 32 Prepared by: Dr. Kennerly H. Digges
The data analysis shows that for restrained occupants, head/neck/spine injuries caused by impacts with the upper vehicle interior account for 35.2% of the injury Harm. Mitigating these injuries constitutes the largest opportunity for reducing rollover casualties among restrained occupants. Improvements in restraint systems, interior padding, and roof intrusion control are candidate countermeasures. Future analysis needs to evaluate the benefits offered by roof crush through accident reconstruction of real world injuries and computer modeling of roof intrusion. It must be recognized that different classes of vehicles may have different requirements for roof intrusion control. Initial headroom had been observed by NHTSA to be an important variable. The subsequent analysis needs to examine the rollover characteristics and injury mechanisms for each vehicle class – passenger cars, vans, pickups and SUV’s. The conditions that cause injuries from contacts with the upper vehicle interior need to be investigated and modeled. Countermeasures to reduce the injury frequency and severity need to be evaluated along with test procedures to induce the countermeasures. Based on this analysis, the test procedures can be specified and the benefits estimated. REFERENCES Arndt, M,. Mowry, G., Dickerson, C., and Arndt, S., “Evaluation of Experimental Restraints in Rollover Conditions”, 39th Stapp Car Crash Conference, SAE 952712, November, 1995. Aronberg, R., "Airborn Trajectory Analysis for Use in Accident Reconstruction", SAE 900387, 1990. Cohen, D., Digges, K., and Nichols, H., "Rollover Crashworthiness Classification and Severity Indices," 12 ESV Conference, Paper Nr. 89-2B-0-012, May 1989. Digges, K., Malliaris, A., and DeBlois, H., "Opportunities for Casualty Reduction in Rollover Crashes”, ESV Conference, Paper No. 94-S5-O-11, 1994. Digges, K., Malliaris, A.C., and Ommaya, A., "The Mechanics and Biomechanics of Rollover Casualties", Wayne State Biomechanics Symposium, March 1991(a). Digges, K., "Application of Human Models to Evaluate Improvements in Motor Vehicle Crash Safety", 8th Conference of Mathematical Modeling, College Park, Maryland, May 1991(b). Digges, K., Malliaris, A.C., Ommaya, A., and McLean, "Characterization of Rollover Casualties", 1991 IRCOBI, Berlin, Germany, September 1991(c). Digges, K., "A Framework for the Study of Rollover Crashworthiness", 13th Safety Vehicle Conference, Paris, France, November 1991(d). "Fatal Accident Reporting System", Automated Files, National Highway Traffic Safety Administration, Annual Issues 1988-1990.
FHWA/NHTSA National Crash Analysis Center Page 30 of 32 Prepared by: Dr. Kennerly H. Digges
Friedman, D. and Nash, C., “Advanced Roof Design for Rollover Protection”, Paper 01-S12-W94, ESV Conference, 2001. Friedman, K., et.al., “Restraint Effectiveness During Rollover Motion”, 1996 IRCOBI Proceedings, p303-309, Sept., 1996 Garrott, W. R., and Monk, M. W., "Vehicle Inertial Parameters, Measured Values and Approximations", SAE Paper 881767, November, 1988. Habberstad, J., Wagner, R., and Thomas, T., "Rollover and Interior Kinematics Test Procedures Revisited," Proceedings of 30th Stapp Conference, SAE 861875, 1986. Harwin, A., and Emery, L., The Crash Avoidance Rollover Study: A Database for the Investigation of Single Vehicle Rollover Crashes", NHTSA Technical Report, May 1989. Harwin, A., and Brewer, H., "Analysis of the Relationship Between Vehicle Rollover Stability and Rollover Risk Using NHTSA Cardfile Accident Data Base", Journal of Traffic Medicine, Vol 18, No 3, 1990. Hinch, J., Klein, T., and Shadel, S., "Relationship between Vehicle Rollover Propensity and Vehicle Roll Stability Factors", 13th ESV Conference, 1991. Jones. I., "Vehicle Stability Related to Frequency of Overturning for Different Models of Car", Proceedings of the Seventh Australian Road Research Board Conference, Volume 7, Part 5, 1974. Kaleps, I., and Rizer, A., "Simulation of Vehicle Crash and Rollover Dynamics", NHTSA Report DOT HAS 807 049, June, 1986. Malliaris, A, and DeBlois, H., "Pivotal Characterization of Rollover", Proceedings of the 13th ESV Conference, 1991a. Malliaris., A., "Rollover in Motor Vehicle Accidents," NHTSA-TSC-HS978-1, July, 1989. Malliaris, A. C. and K. H. Digges, "Crash Protection Offered by Safety Belts", Proceedings of the 11th International Conference on Safety Vehicles, Washington, DC, May 1987 Mengert, P., Salvatore, S., DiSario,R., and Walter, R., "Statistical Estimation of Rollover Risk," DOT-HAS-807-446, August 1989. Miller, T., et al, "The Costs of Highway Crashes", The Urban Institute, Washington, DC, 1991(a).
FHWA/NHTSA National Crash Analysis Center Page 31 of 32 Prepared by: Dr. Kennerly H. Digges
Miller, T., "The Comprehensive Cost of Motor Vehicle Injuries by Body Region and AIS Severity". 35th Annual Proceedings of the AAAM, 1991(b). Miller, T., and Associates, "New Estimates of Highway Crash Costs", The Urban Institute Press, Washington DC, 1991(c). McGuigan and Bondy, "A Descriptive Study of Rollover Crashes", Mc Char, "The Severity of Rollover Crashes", Najjar, "The Truth About Rollovers", NHTSA Report DOT HAS 805 883, April, 1981 Nalecz, A.G., et. al., "Sensitivity Analysis of Vehicle Tripped Rollover Model", NHTSA Report DOT HAS 807 300 July, 1988. NHTSA 2001, “Request for Comment, FMVSS Roof Crush Resistance”, Docket No. NHTSA-1999-5572:Notice 2, NHTSA , Oct 2001. NHTSA "The National Accident Sampling System/CDS", (NASS) Automated Files, National Highway Traffic Safety Administration. NHTSA "1995-1997 National Accident Sampling System/CDS", NHTSA Report DOT HS 809 203, National Highway Traffic Safety Administration, February, 2001. Obergefell, L. A., et. al., "Prediction of an Occupant's Motion During Rollover Crashes", SAE Paper 861876, 1986. Orlowski, K., Bundorf, and Moffatt, E., "Rollover Crash Tests - The Influence of Roof Strength on Injury Mechanics," SAE 851734. Parenteau, C.S. and Shah, M., “Driver Injuries in Single-Event Rollovers”, SAE 2001-01-0633, March 2001. Partyka, S., "Fatal Accidents in the First Fifteen Months of NCSS", 23rd AAAM Conference, 1979. Partyka, S., "Roof Intrusion and Occupant Injury in Light Passenger Vehicles”, NHTSA Docket No. 88-06-GR, 1992. Raines, C., Kanianthra, J., “Determination of the Signifance of Roof Crush to Passenger Vehicle Occupants in Rollover Crashes”, SAE 950655, 1995. Robertson, L., and Kelly, B., "Static Stability as a Predictor of Rollover Crashes Fatal to Occupants of Cars and Utility Vehicles", Journal of Trauma, 1988.
FHWA/NHTSA National Crash Analysis Center Page 32 of 32 Prepared by: Dr. Kennerly H. Digges
Robertson, L., "Risk of Fatal Rollover in Utility Vehicles Relative to Static Stability", Presentation to 1988 SAE Government/Industry Meeting, May 3, 1988. Rosenthal, T. J., et.al., "Users Guide and Program Description for a Tripped Rollover Vehicle Simulation", STI Document 1216-2, Contract DTNH-84-D-17080, June, 1985. SAE Recommended Practices, Collision Deformation Classification, SAE J224, March 1980. Segal and McGrath, MGA Research Corporation, Final Report prepared for the National Highway Traffic Safety Administration, Sept. 1980. Terhune, K., "A Study of Light Truck and Passenger Car Rollover and Ejection in Single-Vehicle Crashes", Prepared for the Motor Vehicle Manufacturers Association, May 1988. Terhune, K., "Rollover Accident Research for NHTSA", NHTSA Technical Briefing, May 1989. Yanniv, G., Duffy, S., and Summers, S., “Rollover Ejection Mitigation Using an Inflatable Tubular Structure (ITS)”, Paper 98-S8-W-18, ESV Conference, pp 1811-1818, 1998.