Embed Size (px)
Citation preview
- 0 -
Summary Report of Basic Survey on Wage Structure (starting salary)
2010
Contents
Outline of Survey Page 1
Definitions Page 3
Summary of Results
1. Starting salary by school career Page 4
2. Starting salary by enterprise size Page 6
3. Starting salary by industry Page 7
4. Starting salary distribution Page 8
Statistical tables Page 9
Summary Report of Basic Survey on Wage Structure (starting salary) 2010【Japanese】 is
also posted on the website of Ministry of Health, Labour and Welfare
(http://www.mhlw.go.jp/toukei/index.html).
- 1 -
Outline of Survey
1. Objective
This survey is a fundamental statistics, and its objective is to clarify the wage structure of
employees in major industries by type of employment, type of work, occupation, sex,
age, school career, length of service, and occupational career, and others.
Of them, only the results of starting salary are compiled in this summary.
2. Scope of Survey
(1) Area
Nationwide (except some islands)
(2) Industry
The following 16 major industries, based on the Standard Industrial Classification
for Japan (revised in November 2007).
Mining and quarrying of stone and gravel
Construction,
Manufacturing,
Electricity, gas, heat supply and water,
Information and communications,
Transport and postal activities,
Wholesale and retail trade,
Finance and insurance,
Real estate and goods rental and leasing,
Scientific research, professional and technical services,
Accommodations, eating and drinking services,
Living-related and personal services and amusement services,
Education, learning support,
Medical, health care and welfare,
Compound services,
Services, n.e.c.
(3) Establishment
78,327 establishments were selected according to some sampling method from
private establishments with five or more regular employees (for establishments with
5-9 regular employees category, its enterprise size should be establishments with

- 2 -
5-9 regular employees) and public establishments with 10 or more regular
employees by prefecture, industry, and enterprise size.
As for starting salary sampling, 13,236 establishments which had hired new
graduates were selected from 46,226 establishments with valid response out of
62,673 private establishments with 10 or more regular employees.
3. Survey items
Characteristics of the establishment, the number of employees by type of employment,
total number of regular employees in enterprise, starting salary for new graduates and
the number of recruits
4. Survey period
The survey was conducted in July 2010, on the June wage of new graduates who were
employed as of the end of June 2010.
5. Survey method
The survey form was distributed and collected by staff and enumerators from Labour
Bureau and Labour Standards Inspection Offices in each prefecture.
6. Survey body
Statistics and Information Department, Minister’s Secretariat, Ministry of Health, Labour
and Welfare
|
Prefectural Labour Bureau
|
Labour Standards Inspection Office
|
Enumerator
|
Respondent
- 3 -
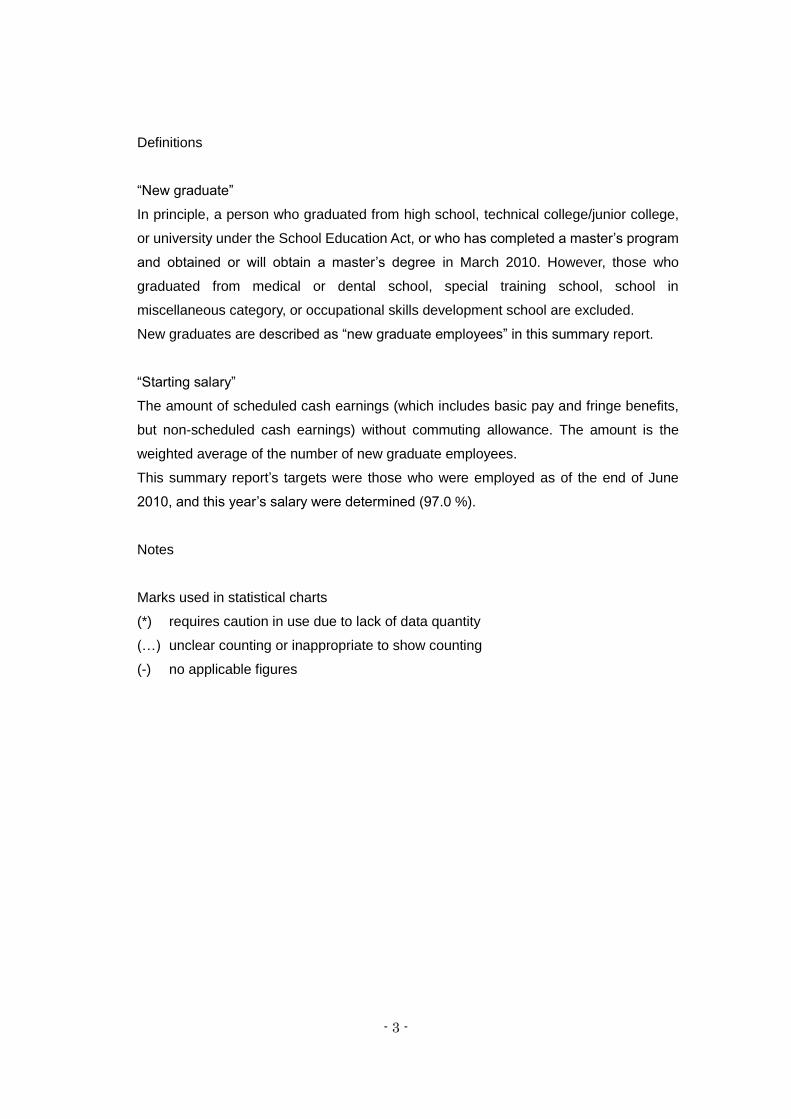
Definitions
“New graduate”
In principle, a person who graduated from high school, technical college/junior college,
or university under the School Education Act, or who has completed a master’s program
and obtained or will obtain a master’s degree in March 2010. However, those who
graduated from medical or dental school, special training school, school in
miscellaneous category, or occupational skills development school are excluded.
New graduates are described as “new graduate employees” in this summary report.
“Starting salary”
The amount of scheduled cash earnings (which includes basic pay and fringe benefits,
but non-scheduled cash earnings) without commuting allowance. The amount is the
weighted average of the number of new graduate employees.
This summary report’s targets were those who were employed as of the end of June
2010, and this year’s salary were determined (97.0 %).
Notes
Marks used in statistical charts
(*) requires caution in use due to lack of data quantity
(…) unclear counting or inappropriate to show counting
(-) no applicable figures
- 4 -
Summary of Results
1. Starting salary by school career
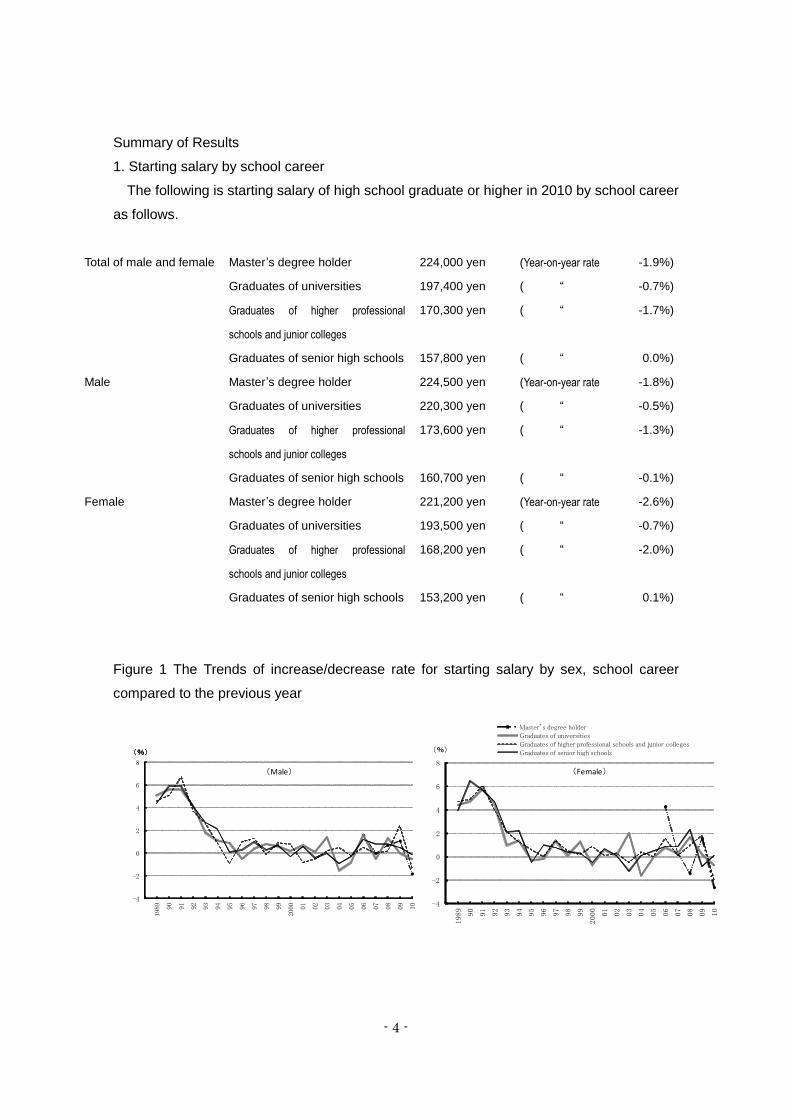
The following is starting salary of high school graduate or higher in 2010 by school career
as follows.
Total of male and female Master’s degree holder 224,000 yen (Year-on-year rate -1.9%)
Graduates of universities 197,400 yen ( “ -0.7%)
Graduates of higher professional
schools and junior colleges
170,300 yen ( “ -1.7%)
Graduates of senior high schools 157,800 yen ( “ 0.0%)
Male Master’s degree holder 224,500 yen (Year-on-year rate -1.8%)
Graduates of universities 220,300 yen ( “ -0.5%)
Graduates of higher professional
schools and junior colleges
173,600 yen ( “ -1.3%)
Graduates of senior high schools 160,700 yen ( “ -0.1%)
Female Master’s degree holder 221,200 yen (Year-on-year rate -2.6%)
Graduates of universities 193,500 yen ( “ -0.7%)
Graduates of higher professional
schools and junior colleges
168,200 yen ( “ -2.0%)
Graduates of senior high schools 153,200 yen ( “ 0.1%)
Figure 1 The Trends of increase/decrease rate for starting salary by sex, school career
compared to the previous year
-4
-2
0
2
4
6
8
1989 90
91
92
93
94
95
96
97
98
99
2000 01
02
03
04
05
06
07
08
09
10
(Male)
(%)(%)
-4
-2
0
2
4
6
8
1989
90
91
92
93
94
95
96
97
98
99
2000
01
02
03
04
05
06
07
08
09
10
Master’s degree holderGraduates of universitiesGraduates of higher professional schools and junior collegesGraduates of senior high schools(%)
(Female)
- 5 -
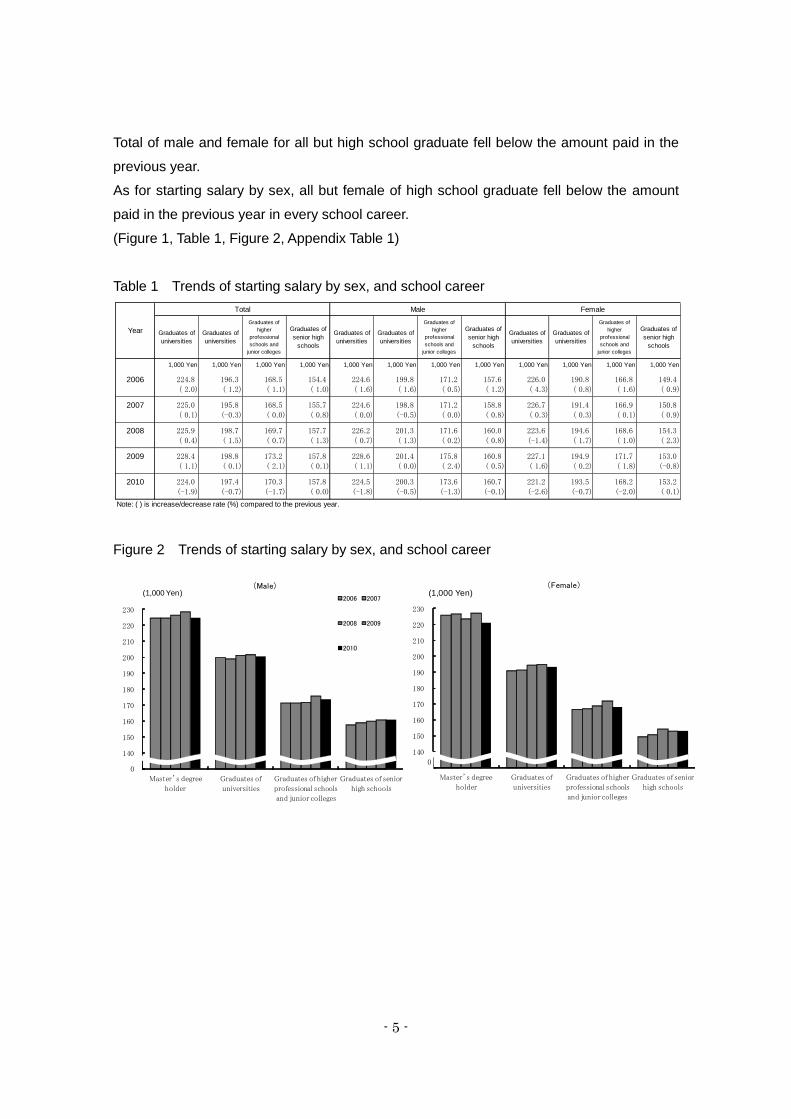
Total of male and female for all but high school graduate fell below the amount paid in the
previous year.
As for starting salary by sex, all but female of high school graduate fell below the amount
paid in the previous year in every school career.
(Figure 1, Table 1, Figure 2, Appendix Table 1)
Table 1 Trends of starting salary by sex, and school career
Figure 2 Trends of starting salary by sex, and school career
Graduates of
universities
Graduates of
universities
Graduates of
higher
professional
schools and
junior colleges
Graduates of
senior high
schools
Graduates of
universities
Graduates of
universities
Graduates of
higher
professional
schools and
junior colleges
Graduates of
senior high
schools
Graduates of
universities
Graduates of
universities
Graduates of
higher
professional
schools and
junior colleges
Graduates of
senior high
schools
1,000 Yen 1,000 Yen 1,000 Yen 1,000 Yen 1,000 Yen 1,000 Yen 1,000 Yen 1,000 Yen 1,000 Yen 1,000 Yen 1,000 Yen 1,000 Yen
224.8 196.3 168.5 154.4 224.6 199.8 171.2 157.6 226.0 190.8 166.8 149.4( 2.0) ( 1.2) ( 1.1) ( 1.0) ( 1.6) ( 1.6) ( 0.5) ( 1.2) ( 4.3) ( 0.8) ( 1.6) ( 0.9)
225.0 195.8 168.5 155.7 224.6 198.8 171.2 158.8 226.7 191.4 166.9 150.8
( 0.1) (-0.3) ( 0.0) ( 0.8) ( 0.0) (-0.5) ( 0.0) ( 0.8) ( 0.3) ( 0.3) ( 0.1) ( 0.9)
225.9 198.7 169.7 157.7 226.2 201.3 171.6 160.0 223.6 194.6 168.6 154.3( 0.4) ( 1.5) ( 0.7) ( 1.3) ( 0.7) ( 1.3) ( 0.2) ( 0.8) (-1.4) ( 1.7) ( 1.0) ( 2.3)
228.4 198.8 173.2 157.8 228.6 201.4 175.8 160.8 227.1 194.9 171.7 153.0( 1.1) ( 0.1) ( 2.1) ( 0.1) ( 1.1) ( 0.0) ( 2.4) ( 0.5) ( 1.6) ( 0.2) ( 1.8) (-0.8)
224.0 197.4 170.3 157.8 224.5 200.3 173.6 160.7 221.2 193.5 168.2 153.2
(-1.9) (-0.7) (-1.7) ( 0.0) (-1.8) (-0.5) (-1.3) (-0.1) (-2.6) (-0.7) (-2.0) ( 0.1)
Note: ( ) is increase/decrease rate (%) compared to the previous year.
Male Female
2006
2007
2008
2009
2010
Year
Total
130
140
150
160
170
180
190
200
210
220
230
Master’s degree
holder
Graduates of
universities
Graduates of higher
professional schools
and junior colleges
Graduates of senior
high schools
(Male)
2006 2007
2008 2009
2010
(1,000 Yen)
0 130
140
150
160
170
180
190
200
210
220
230
Master’s degree
holder
Graduates of
universities
Graduates of higher
professional schools
and junior colleges
Graduates of senior
high schools
(Female)
0
(1,000 Yen)
- 6 -
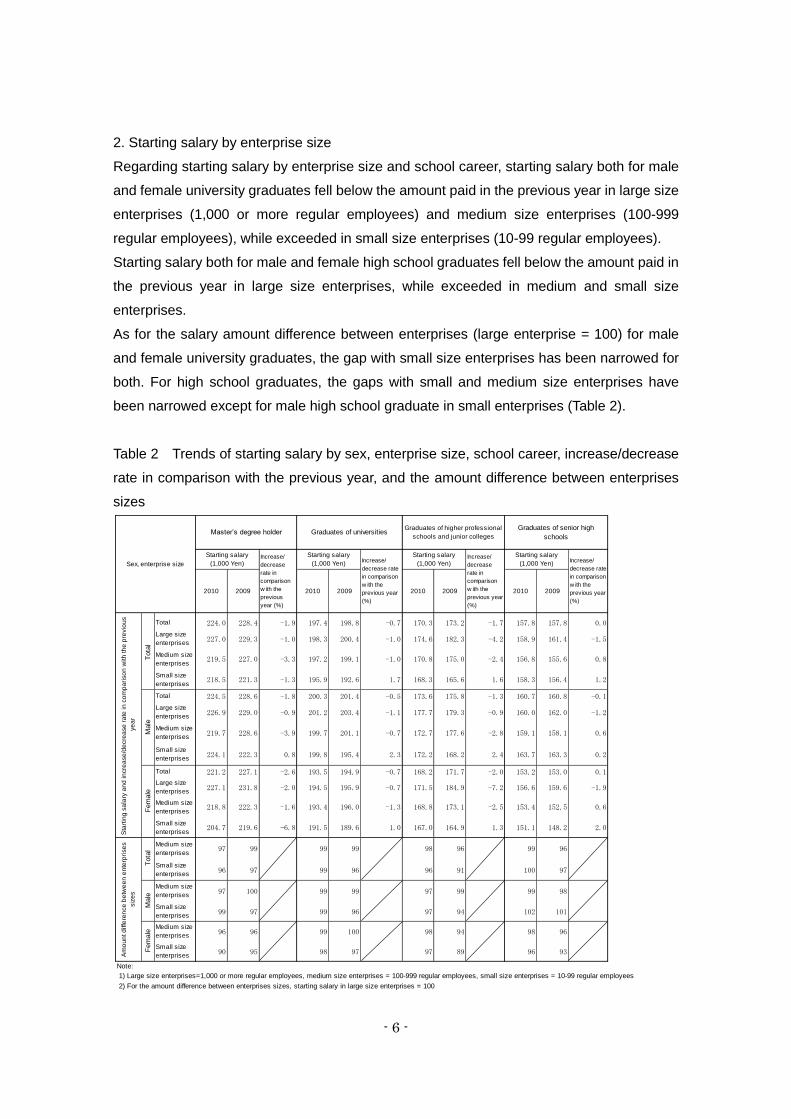
2. Starting salary by enterprise size
Regarding starting salary by enterprise size and school career, starting salary both for male
and female university graduates fell below the amount paid in the previous year in large size
enterprises (1,000 or more regular employees) and medium size enterprises (100-999
regular employees), while exceeded in small size enterprises (10-99 regular employees).
Starting salary both for male and female high school graduates fell below the amount paid in
the previous year in large size enterprises, while exceeded in medium and small size
enterprises.
As for the salary amount difference between enterprises (large enterprise = 100) for male
and female university graduates, the gap with small size enterprises has been narrowed for
both. For high school graduates, the gaps with small and medium size enterprises have
been narrowed except for male high school graduate in small enterprises (Table 2).
Table 2 Trends of starting salary by sex, enterprise size, school career, increase/decrease
rate in comparison with the previous year, and the amount difference between enterprises
sizes
2010 2009 2010 2009 2010 2009 2010 2009
Total 224.0 228.4 -1.9 197.4 198.8 -0.7 170.3 173.2 -1.7 157.8 157.8 0.0
Large size
enterprises227.0 229.3 -1.0 198.3 200.4 -1.0 174.6 182.3 -4.2 158.9 161.4 -1.5
Medium size
enterprises219.5 227.0 -3.3 197.2 199.1 -1.0 170.8 175.0 -2.4 156.8 155.6 0.8
Small size
enterprises218.5 221.3 -1.3 195.9 192.6 1.7 168.3 165.6 1.6 158.3 156.4 1.2
Total 224.5 228.6 -1.8 200.3 201.4 -0.5 173.6 175.8 -1.3 160.7 160.8 -0.1
Large size
enterprises226.9 229.0 -0.9 201.2 203.4 -1.1 177.7 179.3 -0.9 160.0 162.0 -1.2
Medium size
enterprises219.7 228.6 -3.9 199.7 201.1 -0.7 172.7 177.6 -2.8 159.1 158.1 0.6
Small size
enterprises224.1 222.3 0.8 199.8 195.4 2.3 172.2 168.2 2.4 163.7 163.3 0.2
Total 221.2 227.1 -2.6 193.5 194.9 -0.7 168.2 171.7 -2.0 153.2 153.0 0.1
Large size
enterprises227.1 231.8 -2.0 194.5 195.9 -0.7 171.5 184.9 -7.2 156.6 159.6 -1.9
Medium size
enterprises218.8 222.3 -1.6 193.4 196.0 -1.3 168.8 173.1 -2.5 153.4 152.5 0.6
Small size
enterprises204.7 219.6 -6.8 191.5 189.6 1.0 167.0 164.9 1.3 151.1 148.2 2.0
Medium size
enterprises97 99 99 99 98 96 99 96
Small size
enterprises96 97 99 96 96 91 100 97
Medium size
enterprises97 100 99 99 97 99 99 98
Small size
enterprises99 97 99 96 97 94 102 101
Medium size
enterprises96 96 99 100 98 94 98 96
Small size
enterprises90 95 98 97 97 89 96 93
Note:
1) Large size enterprises=1,000 or more regular employees, medium size enterprises = 100-999 regular employees, small size enterprises = 10-99 regular employees
2) For the amount difference between enterprises sizes, starting salary in large size enterprises = 100
Increase/
decrease rate
in comparison
w ith the
previous year
(%)
Starting salary
(1,000 Yen)Increase/
decrease
rate in
comparison
w ith the
previous year
(%)
Starting salary
(1,000 Yen)Increase/
decrease rate
in comparison
w ith the
previous year
(%)
Sta
rtin
g s
ala
ry a
nd
in
cre
ase
/de
cre
ase
ra
te in
co
mp
ari
so
n w
ith
th
e p
revio
us
ye
ar
Tota
lM
ale
Fem
ale
Sex, enterprise size
Master’s degree holder Graduates of universitiesGraduates of higher professional
schools and junior colleges
Graduates of senior high
schools
Starting salary
(1,000 Yen)Increase/
decrease
rate in
comparison
w ith the
previous
year (%)
Starting salary
(1,000 Yen)
Fem
ale
Am
ou
nt d
iffe
ren
ce
be
twe
en
en
terp
rise
s
siz
es
Tota
lM
ale
- 7 -
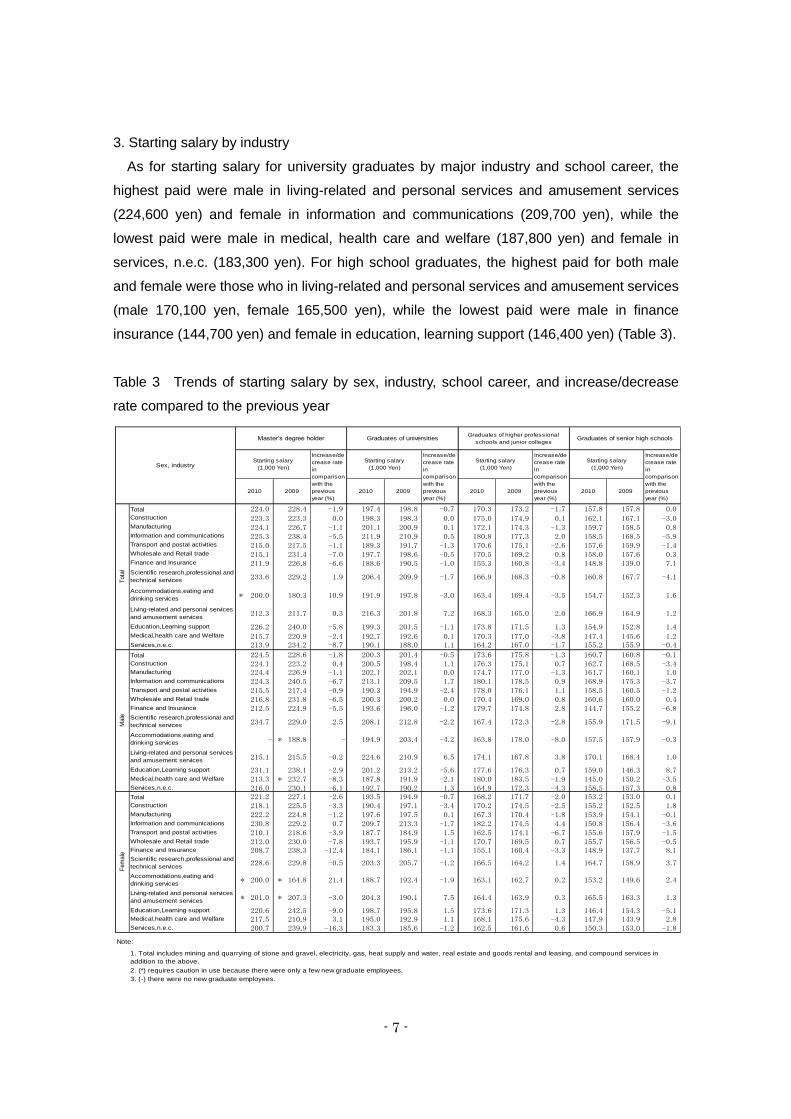
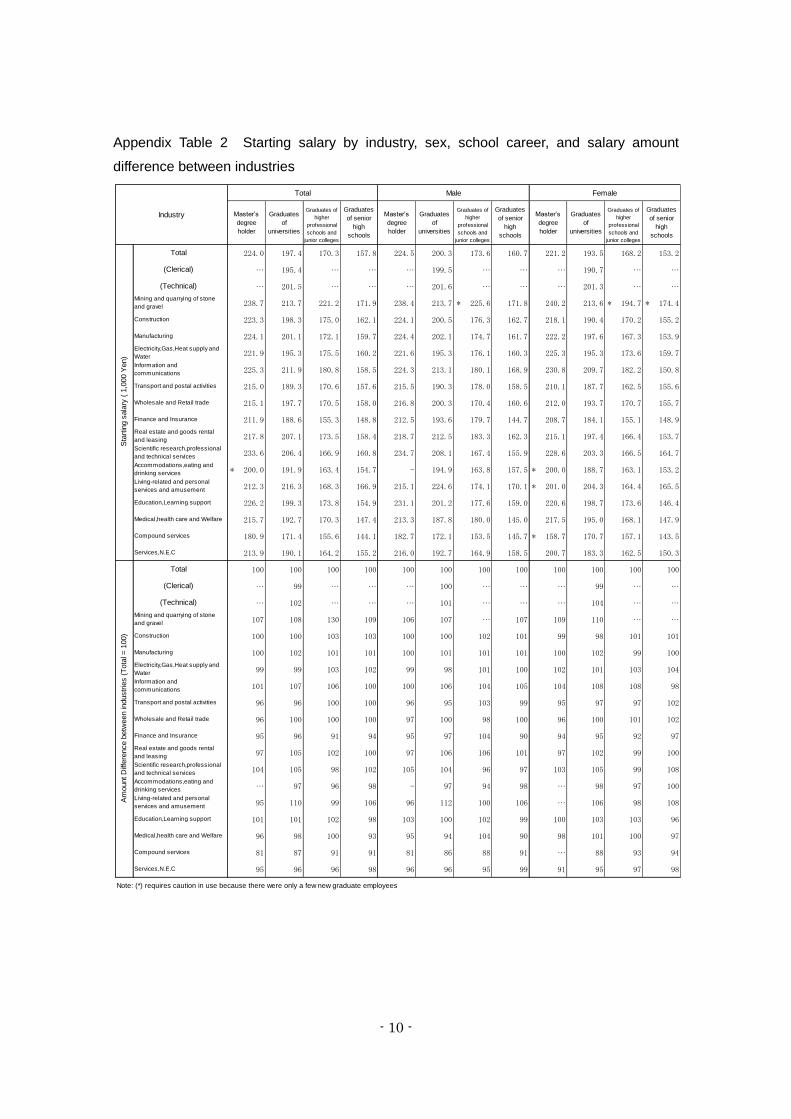
3. Starting salary by industry
As for starting salary for university graduates by major industry and school career, the
highest paid were male in living-related and personal services and amusement services
(224,600 yen) and female in information and communications (209,700 yen), while the
lowest paid were male in medical, health care and welfare (187,800 yen) and female in
services, n.e.c. (183,300 yen). For high school graduates, the highest paid for both male
and female were those who in living-related and personal services and amusement services
(male 170,100 yen, female 165,500 yen), while the lowest paid were male in finance
insurance (144,700 yen) and female in education, learning support (146,400 yen) (Table 3).
Table 3 Trends of starting salary by sex, industry, school career, and increase/decrease
rate compared to the previous year
Total 224.0 228.4 -1.9 197.4 198.8 -0.7 170.3 173.2 -1.7 157.8 157.8 0.0Construction 223.3 223.3 0.0 198.3 198.3 0.0 175.0 174.9 0.1 162.1 167.1 -3.0Manufacturing 224.1 226.7 -1.1 201.1 200.9 0.1 172.1 174.3 -1.3 159.7 158.5 0.8Information and communications 225.3 238.4 -5.5 211.9 210.9 0.5 180.8 177.3 2.0 158.5 168.5 -5.9Transport and postal activities 215.0 217.5 -1.1 189.3 191.7 -1.3 170.6 175.1 -2.6 157.6 159.9 -1.4Wholesale and Retail trade 215.1 231.4 -7.0 197.7 198.6 -0.5 170.5 169.2 0.8 158.0 157.6 0.3Finance and Insurance 211.9 226.8 -6.6 188.6 190.5 -1.0 155.3 160.8 -3.4 148.8 139.0 7.1Scientific research,professional and
technical services 233.6 229.2 1.9 206.4 209.9 -1.7 166.9 168.3 -0.8 160.8 167.7 -4.1
Accommodations,eating and
drinking services * 200.0 180.3 10.9 191.9 197.8 -3.0 163.4 169.4 -3.5 154.7 152.3 1.6
Living-related and personal services
and amusement services 212.3 211.7 0.3 216.3 201.8 7.2 168.3 165.0 2.0 166.9 164.9 1.2
Education,Learning support 226.2 240.0 -5.8 199.3 201.5 -1.1 173.8 171.5 1.3 154.9 152.8 1.4Medical,health care and Welfare 215.7 220.9 -2.4 192.7 192.6 0.1 170.3 177.0 -3.8 147.4 145.6 1.2Services,n.e.c. 213.9 234.2 -8.7 190.1 188.0 1.1 164.2 167.0 -1.7 155.2 155.9 -0.4
Total 224.5 228.6 -1.8 200.3 201.4 -0.5 173.6 175.8 -1.3 160.7 160.8 -0.1Construction 224.1 223.2 0.4 200.5 198.4 1.1 176.3 175.1 0.7 162.7 168.5 -3.4Manufacturing 224.4 226.9 -1.1 202.1 202.1 0.0 174.7 177.0 -1.3 161.7 160.1 1.0Information and communications 224.3 240.5 -6.7 213.1 209.5 1.7 180.1 178.5 0.9 168.9 175.3 -3.7Transport and postal activities 215.5 217.4 -0.9 190.3 194.9 -2.4 178.0 176.1 1.1 158.5 160.5 -1.2Wholesale and Retail trade 216.8 231.8 -6.5 200.3 200.2 0.0 170.4 169.0 0.8 160.6 160.0 0.4Finance and Insurance 212.5 224.9 -5.5 193.6 196.0 -1.2 179.7 174.8 2.8 144.7 155.2 -6.8Scientific research,professional and
technical services 234.7 229.0 2.5 208.1 212.8 -2.2 167.4 172.3 -2.8 155.9 171.5 -9.1
Accommodations,eating and
drinking services - * 188.8 - 194.9 203.4 -4.2 163.8 178.0 -8.0 157.5 157.9 -0.3
Living-related and personal services
and amusement services 215.1 215.5 -0.2 224.6 210.9 6.5 174.1 167.8 3.8 170.1 168.4 1.0
Education,Learning support 231.1 238.1 -2.9 201.2 213.2 -5.6 177.6 176.3 0.7 159.0 146.3 8.7Medical,health care and Welfare 213.3 * 232.7 -8.3 187.8 191.9 -2.1 180.0 183.5 -1.9 145.0 150.2 -3.5Services,n.e.c. 216.0 230.1 -6.1 192.7 190.2 1.3 164.9 172.3 -4.3 158.5 157.3 0.8Total 221.2 227.1 -2.6 193.5 194.9 -0.7 168.2 171.7 -2.0 153.2 153.0 0.1Construction 218.1 225.5 -3.3 190.4 197.1 -3.4 170.2 174.5 -2.5 155.2 152.5 1.8Manufacturing 222.2 224.8 -1.2 197.6 197.5 0.1 167.3 170.4 -1.8 153.9 154.1 -0.1Information and communications 230.8 229.2 0.7 209.7 213.3 -1.7 182.2 174.5 4.4 150.8 156.4 -3.6Transport and postal activities 210.1 218.6 -3.9 187.7 184.9 1.5 162.5 174.1 -6.7 155.6 157.9 -1.5Wholesale and Retail trade 212.0 230.0 -7.8 193.7 195.9 -1.1 170.7 169.5 0.7 155.7 156.5 -0.5Finance and Insurance 208.7 238.3 -12.4 184.1 186.1 -1.1 155.1 160.4 -3.3 148.9 137.7 8.1Scientific research,professional and
technical services 228.6 229.8 -0.5 203.3 205.7 -1.2 166.5 164.2 1.4 164.7 158.9 3.7
Accommodations,eating and
drinking services* 200.0 * 164.8 21.4 188.7 192.4 -1.9 163.1 162.7 0.2 153.2 149.6 2.4
Living-related and personal services
and amusement services * 201.0 * 207.3 -3.0 204.3 190.1 7.5 164.4 163.9 0.3 165.5 163.3 1.3
Education,Learning support 220.6 242.5 -9.0 198.7 195.8 1.5 173.6 171.3 1.3 146.4 154.3 -5.1Medical,health care and Welfare 217.5 210.9 3.1 195.0 192.9 1.1 168.1 175.6 -4.3 147.9 143.9 2.8Services,n.e.c. 200.7 239.9 -16.3 183.3 185.6 -1.2 162.5 161.6 0.6 150.3 153.0 -1.8
Note:
2. (*) requires caution in use because there were only a few new graduate employees.
3. (-) there were no new graduate employees.
1. Total includes mining and quarrying of stone and gravel, electricity, gas, heat supply and water, real estate and goods rental and leasing, and compound services in
addition to the above.
2009
Tota
lM
ale
Fem
ale
Increase/de
crease rate
in
comparison
with the
previous
year (%)
Starting salary
(1,000 Yen)
Increase/de
crease rate
in
comparison
with the
previous
year (%)
2010 2009 2010 2009 2010 2009 2010
Sex, industry
Master’s degree holder Graduates of universitiesGraduates of higher professional
schools and junior collegesGraduates of senior high schools
Starting salary
(1,000 Yen)
Increase/de
crease rate
in
comparison
with the
previous
year (%)
Starting salary
(1,000 Yen)
Increase/de
crease rate
in
comparison
with the
previous
year (%)
Starting salary
(1,000 Yen)
- 8 -
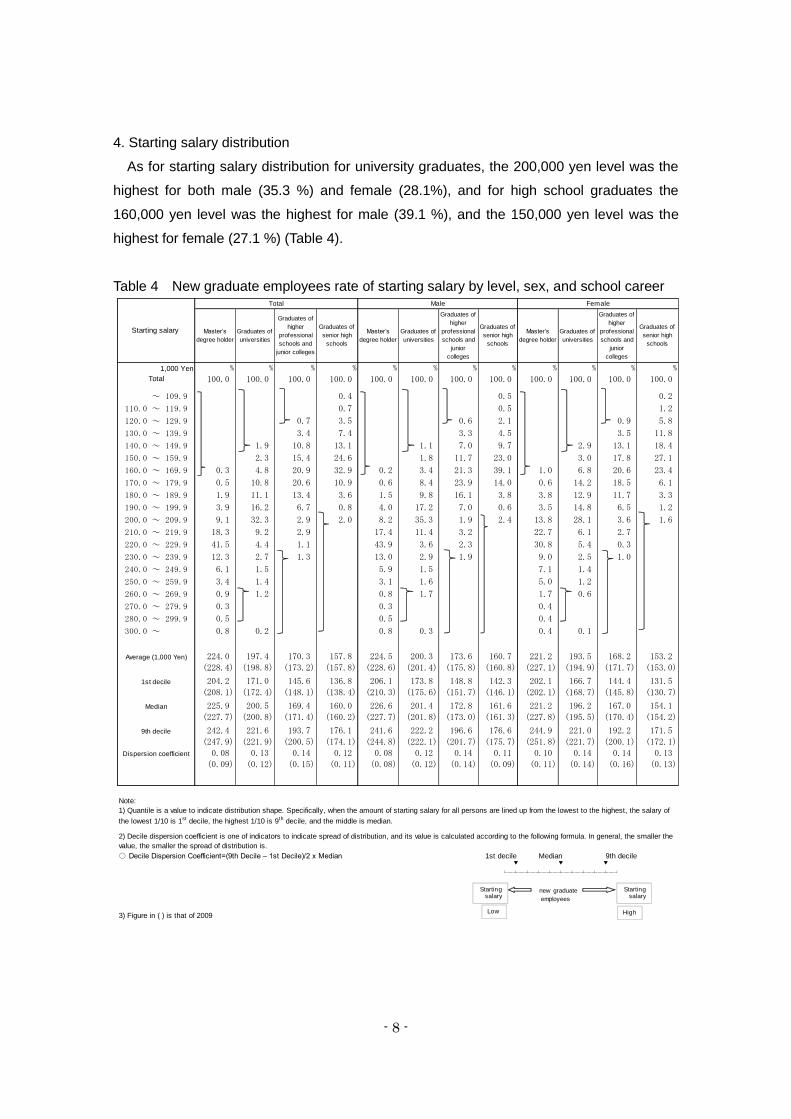
4. Starting salary distribution
As for starting salary distribution for university graduates, the 200,000 yen level was the
highest for both male (35.3 %) and female (28.1%), and for high school graduates the
160,000 yen level was the highest for male (39.1 %), and the 150,000 yen level was the
highest for female (27.1 %) (Table 4).
Table 4 New graduate employees rate of starting salary by level, sex, and school career
1,000 Yen % % % % % % % % % % % %
Total 100.0 100.0 100.0 100.0 100.0 100.0 100.0 100.0 100.0 100.0 100.0 100.0
~ 109.9 0.4 0.5 0.2
110.0 ~ 119.9 0.7 0.5 1.2
120.0 ~ 129.9 0.7 3.5 0.6 2.1 0.9 5.8
130.0 ~ 139.9 3.4 7.4 3.3 4.5 3.5 11.8
140.0 ~ 149.9 1.9 10.8 13.1 1.1 7.0 9.7 2.9 13.1 18.4
150.0 ~ 159.9 2.3 15.4 24.6 1.8 11.7 23.0 3.0 17.8 27.1
160.0 ~ 169.9 0.3 4.8 20.9 32.9 0.2 3.4 21.3 39.1 1.0 6.8 20.6 23.4
170.0 ~ 179.9 0.5 10.8 20.6 10.9 0.6 8.4 23.9 14.0 0.6 14.2 18.5 6.1
180.0 ~ 189.9 1.9 11.1 13.4 3.6 1.5 9.8 16.1 3.8 3.8 12.9 11.7 3.3
190.0 ~ 199.9 3.9 16.2 6.7 0.8 4.0 17.2 7.0 0.6 3.5 14.8 6.5 1.2
200.0 ~ 209.9 9.1 32.3 2.9 2.0 8.2 35.3 1.9 2.4 13.8 28.1 3.6 1.6
210.0 ~ 219.9 18.3 9.2 2.9 17.4 11.4 3.2 22.7 6.1 2.7
220.0 ~ 229.9 41.5 4.4 1.1 43.9 3.6 2.3 30.8 5.4 0.3
230.0 ~ 239.9 12.3 2.7 1.3 13.0 2.9 1.9 9.0 2.5 1.0
240.0 ~ 249.9 6.1 1.5 5.9 1.5 7.1 1.4
250.0 ~ 259.9 3.4 1.4 3.1 1.6 5.0 1.2
260.0 ~ 269.9 0.9 1.2 0.8 1.7 1.7 0.6
270.0 ~ 279.9 0.3 0.3 0.4
280.0 ~ 299.9 0.5 0.5 0.4
300.0 ~ 0.8 0.2 0.8 0.3 0.4 0.1
Average (1,000 Yen) 224.0 197.4 170.3 157.8 224.5 200.3 173.6 160.7 221.2 193.5 168.2 153.2(171.7)
1st decile 204.2 171.0 145.6 136.8 206.1 173.8 148.8 142.3 202.1 166.7 144.4 131.5
Median 225.9 200.5 169.4 160.0 226.6 201.4 172.8 161.6 221.2 196.2 167.0 154.1
9th decile 242.4 221.6 193.7 176.1 241.6 222.2 196.6 176.6 244.9 221.0 192.2 171.5
Dispersion coefficient 0.08 0.13 0.14 0.12 0.08 0.12 0.14 0.11 0.10 0.14 0.14 0.13
Note:
○ Decile Dispersion Coefficient=(9th Decile – 1st Decile)/2 x Median 1st decile ▼ ▼ ▼
└─┴─┴─┴─┴─┴─┴─┴─┴─┴─┘
3) Figure in ( ) is that of 2009
(201.4)
Starting salary
Total Male Female
Master’s
degree holder
Graduates of
universities
Graduates of
senior high
schools
Master’s
degree holder
Graduates of
universities
(228.4) (198.8) (173.2) (157.8) (228.6) (153.0)
Graduates of
senior high
schools
Master’s
degree holder
Graduates of
universities
Graduates of
senior high
schools
(175.8) (160.8) (227.1) (194.9) (171.7)
(130.7)(208.1) (172.4) (148.1) (138.4) (210.3) (175.6) (151.7) (146.1) (202.1) (168.7) (145.8)
(154.2)(227.7) (200.8) (171.4) (160.2) (227.7) (201.8) (173.0) (161.3) (227.8) (195.5) (170.4)
(172.1)(247.9) (221.9) (200.5) (174.1) (244.8) (222.1) (201.7) (175.7) (251.8) (221.7) (200.1)
(0.12) (0.15) (0.11) (0.08) (0.12)
Median 9th decile
new graduate
employees
Graduates of
higher
professional
schools and
junior colleges
Graduates of
higher
professional
schools and
junior
colleges
Graduates of
higher
professional
schools and
junior
colleges
1) Quantile is a value to indicate distribution shape. Specifically, when the amount of starting salary for all persons are lined up from the lowest to the highest, the salary of
the lowest 1/10 is 1st decile, the highest 1/10 is 9th decile, and the middle is median.
2) Decile dispersion coefficient is one of indicators to indicate spread of distribution, and its value is calculated according to the following formula. In general, the smaller the
value, the smaller the spread of distribution is.
(0.14) (0.09) (0.11) (0.14) (0.16) (0.13)(0.09)
Starting salary
Starting salary
Low High
- 9 -
Statistical Tables
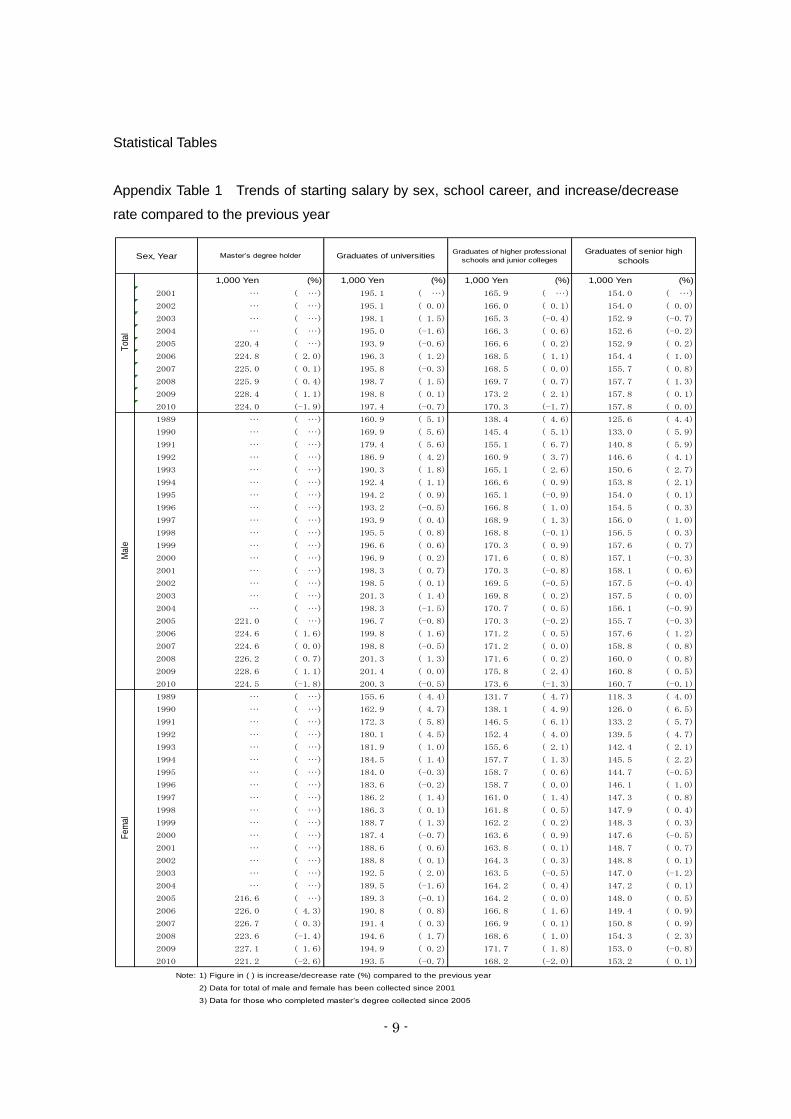
Appendix Table 1 Trends of starting salary by sex, school career, and increase/decrease
rate compared to the previous year
1,000 Yen (%) 1,000 Yen (%) 1,000 Yen (%) 1,000 Yen (%)
2001 … ( …) 195.1 ( …) 165.9 ( …) 154.0 ( …)
2002 … ( …) 195.1 ( 0.0) 166.0 ( 0.1) 154.0 ( 0.0)
2003 … ( …) 198.1 ( 1.5) 165.3 (-0.4) 152.9 (-0.7)
2004 … ( …) 195.0 (-1.6) 166.3 ( 0.6) 152.6 (-0.2)
2005 220.4 ( …) 193.9 (-0.6) 166.6 ( 0.2) 152.9 ( 0.2)
2006 224.8 ( 2.0) 196.3 ( 1.2) 168.5 ( 1.1) 154.4 ( 1.0)
2007 225.0 ( 0.1) 195.8 (-0.3) 168.5 ( 0.0) 155.7 ( 0.8)
2008 225.9 ( 0.4) 198.7 ( 1.5) 169.7 ( 0.7) 157.7 ( 1.3)
2009 228.4 ( 1.1) 198.8 ( 0.1) 173.2 ( 2.1) 157.8 ( 0.1)
2010 224.0 (-1.9) 197.4 (-0.7) 170.3 (-1.7) 157.8 ( 0.0)
1989 … ( …) 160.9 ( 5.1) 138.4 ( 4.6) 125.6 ( 4.4)
1990 … ( …) 169.9 ( 5.6) 145.4 ( 5.1) 133.0 ( 5.9)
1991 … ( …) 179.4 ( 5.6) 155.1 ( 6.7) 140.8 ( 5.9)
1992 … ( …) 186.9 ( 4.2) 160.9 ( 3.7) 146.6 ( 4.1)
1993 … ( …) 190.3 ( 1.8) 165.1 ( 2.6) 150.6 ( 2.7)
1994 … ( …) 192.4 ( 1.1) 166.6 ( 0.9) 153.8 ( 2.1)
1995 … ( …) 194.2 ( 0.9) 165.1 (-0.9) 154.0 ( 0.1)
1996 … ( …) 193.2 (-0.5) 166.8 ( 1.0) 154.5 ( 0.3)
1997 … ( …) 193.9 ( 0.4) 168.9 ( 1.3) 156.0 ( 1.0)
1998 … ( …) 195.5 ( 0.8) 168.8 (-0.1) 156.5 ( 0.3)
1999 … ( …) 196.6 ( 0.6) 170.3 ( 0.9) 157.6 ( 0.7)
2000 … ( …) 196.9 ( 0.2) 171.6 ( 0.8) 157.1 (-0.3)
2001 … ( …) 198.3 ( 0.7) 170.3 (-0.8) 158.1 ( 0.6)
2002 … ( …) 198.5 ( 0.1) 169.5 (-0.5) 157.5 (-0.4)
2003 … ( …) 201.3 ( 1.4) 169.8 ( 0.2) 157.5 ( 0.0)
2004 … ( …) 198.3 (-1.5) 170.7 ( 0.5) 156.1 (-0.9)
2005 221.0 ( …) 196.7 (-0.8) 170.3 (-0.2) 155.7 (-0.3)
2006 224.6 ( 1.6) 199.8 ( 1.6) 171.2 ( 0.5) 157.6 ( 1.2)
2007 224.6 ( 0.0) 198.8 (-0.5) 171.2 ( 0.0) 158.8 ( 0.8)
2008 226.2 ( 0.7) 201.3 ( 1.3) 171.6 ( 0.2) 160.0 ( 0.8)
2009 228.6 ( 1.1) 201.4 ( 0.0) 175.8 ( 2.4) 160.8 ( 0.5)
2010 224.5 (-1.8) 200.3 (-0.5) 173.6 (-1.3) 160.7 (-0.1)
1989 … ( …) 155.6 ( 4.4) 131.7 ( 4.7) 118.3 ( 4.0)
1990 … ( …) 162.9 ( 4.7) 138.1 ( 4.9) 126.0 ( 6.5)
1991 … ( …) 172.3 ( 5.8) 146.5 ( 6.1) 133.2 ( 5.7)
1992 … ( …) 180.1 ( 4.5) 152.4 ( 4.0) 139.5 ( 4.7)
1993 … ( …) 181.9 ( 1.0) 155.6 ( 2.1) 142.4 ( 2.1)
1994 … ( …) 184.5 ( 1.4) 157.7 ( 1.3) 145.5 ( 2.2)
1995 … ( …) 184.0 (-0.3) 158.7 ( 0.6) 144.7 (-0.5)
1996 … ( …) 183.6 (-0.2) 158.7 ( 0.0) 146.1 ( 1.0)
1997 … ( …) 186.2 ( 1.4) 161.0 ( 1.4) 147.3 ( 0.8)
1998 … ( …) 186.3 ( 0.1) 161.8 ( 0.5) 147.9 ( 0.4)
1999 … ( …) 188.7 ( 1.3) 162.2 ( 0.2) 148.3 ( 0.3)
2000 … ( …) 187.4 (-0.7) 163.6 ( 0.9) 147.6 (-0.5)
2001 … ( …) 188.6 ( 0.6) 163.8 ( 0.1) 148.7 ( 0.7)
2002 … ( …) 188.8 ( 0.1) 164.3 ( 0.3) 148.8 ( 0.1)
2003 … ( …) 192.5 ( 2.0) 163.5 (-0.5) 147.0 (-1.2)
2004 … ( …) 189.5 (-1.6) 164.2 ( 0.4) 147.2 ( 0.1)
2005 216.6 ( …) 189.3 (-0.1) 164.2 ( 0.0) 148.0 ( 0.5)
2006 226.0 ( 4.3) 190.8 ( 0.8) 166.8 ( 1.6) 149.4 ( 0.9)
2007 226.7 ( 0.3) 191.4 ( 0.3) 166.9 ( 0.1) 150.8 ( 0.9)
2008 223.6 (-1.4) 194.6 ( 1.7) 168.6 ( 1.0) 154.3 ( 2.3)
2009 227.1 ( 1.6) 194.9 ( 0.2) 171.7 ( 1.8) 153.0 (-0.8)
2010 221.2 (-2.6) 193.5 (-0.7) 168.2 (-2.0) 153.2 ( 0.1)
Note: 1) Figure in ( ) is increase/decrease rate (%) compared to the previous year
2) Data for total of male and female has been collected since 2001
3) Data for those who completed master’s degree collected since 2005
Mal
eF
emal
Sex, Year Master’s degree holder Graduates of universitiesGraduates of higher professional
schools and junior colleges
Graduates of senior high
schools
Tot
al
- 10 -
Appendix Table 2 Starting salary by industry, sex, school career, and salary amount
difference between industries
224.0 197.4 170.3 157.8 224.5 200.3 173.6 160.7 221.2 193.5 168.2 153.2
… 195.4 … … … 199.5 … … … 190.7 … …
… 201.5 … … … 201.6 … … … 201.3 … …
238.7 213.7 221.2 171.9 238.4 213.7 * 225.6 171.8 240.2 213.6 * 194.7 * 174.4
223.3 198.3 175.0 162.1 224.1 200.5 176.3 162.7 218.1 190.4 170.2 155.2
224.1 201.1 172.1 159.7 224.4 202.1 174.7 161.7 222.2 197.6 167.3 153.9
221.9 195.3 175.5 160.2 221.6 195.3 176.1 160.3 225.3 195.3 173.6 159.7
225.3 211.9 180.8 158.5 224.3 213.1 180.1 168.9 230.8 209.7 182.2 150.8
215.0 189.3 170.6 157.6 215.5 190.3 178.0 158.5 210.1 187.7 162.5 155.6
215.1 197.7 170.5 158.0 216.8 200.3 170.4 160.6 212.0 193.7 170.7 155.7
211.9 188.6 155.3 148.8 212.5 193.6 179.7 144.7 208.7 184.1 155.1 148.9
217.8 207.1 173.5 158.4 218.7 212.5 183.3 162.3 215.1 197.4 166.4 153.7
233.6 206.4 166.9 160.8 234.7 208.1 167.4 155.9 228.6 203.3 166.5 164.7
* 200.0 191.9 163.4 154.7 - 194.9 163.8 157.5 * 200.0 188.7 163.1 153.2
212.3 216.3 168.3 166.9 215.1 224.6 174.1 170.1 * 201.0 204.3 164.4 165.5
226.2 199.3 173.8 154.9 231.1 201.2 177.6 159.0 220.6 198.7 173.6 146.4
215.7 192.7 170.3 147.4 213.3 187.8 180.0 145.0 217.5 195.0 168.1 147.9
180.9 171.4 155.6 144.1 182.7 172.1 153.5 145.7 * 158.7 170.7 157.1 143.5
213.9 190.1 164.2 155.2 216.0 192.7 164.9 158.5 200.7 183.3 162.5 150.3
100 100 100 100 100 100 100 100 100 100 100 100
… 99 … … … 100 … … … 99 … …
… 102 … … … 101 … … … 104 … …
107 108 130 109 106 107 … 107 109 110 … …
100 100 103 103 100 100 102 101 99 98 101 101
100 102 101 101 100 101 101 101 100 102 99 100
99 99 103 102 99 98 101 100 102 101 103 104
101 107 106 100 100 106 104 105 104 108 108 98
96 96 100 100 96 95 103 99 95 97 97 102
96 100 100 100 97 100 98 100 96 100 101 102
95 96 91 94 95 97 104 90 94 95 92 97
97 105 102 100 97 106 106 101 97 102 99 100
104 105 98 102 105 104 96 97 103 105 99 108
… 97 96 98 - 97 94 98 … 98 97 100
95 110 99 106 96 112 100 106 … 106 98 108
101 101 102 98 103 100 102 99 100 103 103 96
96 98 100 93 95 94 104 90 98 101 100 97
81 87 91 91 81 86 88 91 … 88 93 94
95 96 96 98 96 96 95 99 91 95 97 98
Note: (*) requires caution in use because there were only a few new graduate employees
Graduates
of senior
high
schools
Master’s
degree
holder
Graduates
of
universities
Graduates
of senior
high
schools
Industry
Total Male Female
Master’s
degree
holder
Graduates
of
universities
Graduates
of senior
high
schools
Master’s
degree
holder
Graduates
of
universities
Accommodations,eating and
drinking services
Sta
rtin
g s
ala
ry (
1,0
00 Y
en)
Total
Mining and quarrying of stone
and gravel
Construction
Manufacturing
Electricity,Gas,Heat supply and
Water
Information and
communications
Transport and postal activities
Wholesale and Retail trade
Finance and Insurance
Real estate and goods rental
and leasing
Scientific research,professional
and technical services
Am
ount D
iffere
nce b
etw
een in
dustr
ies (
Tota
l = 1
00)
Total
Mining and quarrying of stone
and gravel
Construction
Manufacturing
Living-related and personal
services and amusement
Education,Learning support
Medical,health care and Welfare
Compound services
Services,N.E.C
Information and
communications
Transport and postal activities
Wholesale and Retail trade
Finance and Insurance
Real estate and goods rental
and leasing
Services,N.E.C
Graduates of
higher
professional
schools and
junior colleges
Graduates of
higher
professional
schools and
junior colleges
Graduates of
higher
professional
schools and
junior colleges
(Clerical)
(Technical)
(Clerical)
(Technical)
Scientific research,professional
and technical services
Accommodations,eating and
drinking services
Living-related and personal
services and amusement
Education,Learning support
Medical,health care and Welfare
Compound services
Electricity,Gas,Heat supply and
Water
- 11 -
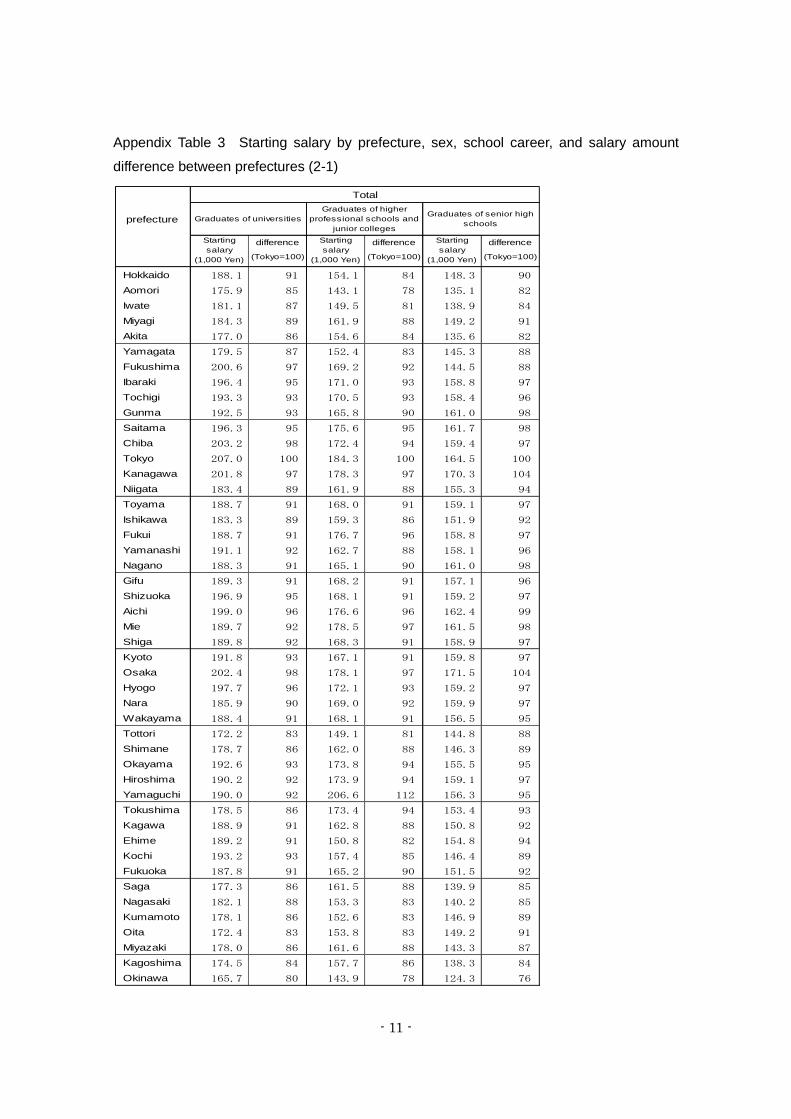
Appendix Table 3 Starting salary by prefecture, sex, school career, and salary amount
difference between prefectures (2-1)
prefecture
Graduates of higher
professional schools and
junior colleges
Hokkaido 188.1 91 154.1 84 148.3 90
Aomori 175.9 85 143.1 78 135.1 82
Iwate 181.1 87 149.5 81 138.9 84
Miyagi 184.3 89 161.9 88 149.2 91
Akita 177.0 86 154.6 84 135.6 82
Yamagata 179.5 87 152.4 83 145.3 88
Fukushima 200.6 97 169.2 92 144.5 88
Ibaraki 196.4 95 171.0 93 158.8 97
Tochigi 193.3 93 170.5 93 158.4 96
Gunma 192.5 93 165.8 90 161.0 98
Saitama 196.3 95 175.6 95 161.7 98
Chiba 203.2 98 172.4 94 159.4 97
Tokyo 207.0 100 184.3 100 164.5 100
Kanagawa 201.8 97 178.3 97 170.3 104
Niigata 183.4 89 161.9 88 155.3 94
Toyama 188.7 91 168.0 91 159.1 97
Ishikawa 183.3 89 159.3 86 151.9 92
Fukui 188.7 91 176.7 96 158.8 97
Yamanashi 191.1 92 162.7 88 158.1 96
Nagano 188.3 91 165.1 90 161.0 98
Gifu 189.3 91 168.2 91 157.1 96
Shizuoka 196.9 95 168.1 91 159.2 97
Aichi 199.0 96 176.6 96 162.4 99
Mie 189.7 92 178.5 97 161.5 98
Shiga 189.8 92 168.3 91 158.9 97
Kyoto 191.8 93 167.1 91 159.8 97
Osaka 202.4 98 178.1 97 171.5 104
Hyogo 197.7 96 172.1 93 159.2 97
Nara 185.9 90 169.0 92 159.9 97
Wakayama 188.4 91 168.1 91 156.5 95
Tottori 172.2 83 149.1 81 144.8 88
Shimane 178.7 86 162.0 88 146.3 89
Okayama 192.6 93 173.8 94 155.5 95
Hiroshima 190.2 92 173.9 94 159.1 97
Yamaguchi 190.0 92 206.6 112 156.3 95
Tokushima 178.5 86 173.4 94 153.4 93
Kagawa 188.9 91 162.8 88 150.8 92
Ehime 189.2 91 150.8 82 154.8 94
Kochi 193.2 93 157.4 85 146.4 89
Fukuoka 187.8 91 165.2 90 151.5 92
Saga 177.3 86 161.5 88 139.9 85
Nagasaki 182.1 88 153.3 83 140.2 85
Kumamoto 178.1 86 152.6 83 146.9 89
Oita 172.4 83 153.8 83 149.2 91
Miyazaki 178.0 86 161.6 88 143.3 87
Kagoshima 174.5 84 157.7 86 138.3 84
Okinawa 165.7 80 143.9 78 124.3 76
Graduates of universities
Starting
salary
(1,000 Yen)
Starting
salary
(1,000 Yen)
Starting
salary
(1,000 Yen)
Total
Graduates of senior high
schools
difference difference difference
(Tokyo=100) (Tokyo=100) (Tokyo=100)
- 12 -
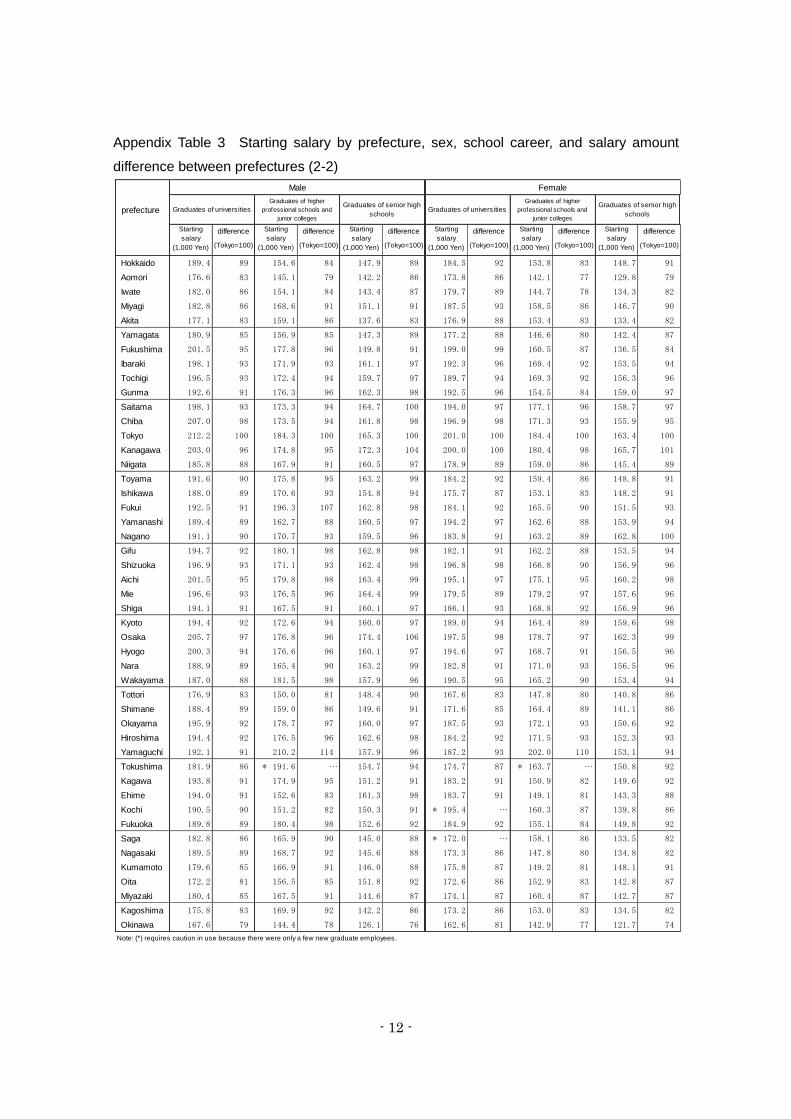
Appendix Table 3 Starting salary by prefecture, sex, school career, and salary amount
difference between prefectures (2-2)
prefecture Graduates of universities
Graduates of higher
professional schools and
junior colleges
Graduates of universities
Graduates of higher
professional schools and
junior colleges
Hokkaido 189.4 89 154.6 84 147.9 89 184.5 92 153.8 83 148.7 91
Aomori 176.6 83 145.1 79 142.2 86 173.8 86 142.1 77 129.8 79
Iwate 182.0 86 154.1 84 143.4 87 179.7 89 144.7 78 134.3 82
Miyagi 182.8 86 168.6 91 151.1 91 187.5 93 158.5 86 146.7 90
Akita 177.1 83 159.1 86 137.6 83 176.9 88 153.4 83 133.4 82
Yamagata 180.9 85 156.9 85 147.3 89 177.2 88 146.6 80 142.4 87
Fukushima 201.5 95 177.8 96 149.8 91 199.0 99 160.5 87 136.5 84
Ibaraki 198.1 93 171.9 93 161.1 97 192.3 96 169.4 92 153.5 94
Tochigi 196.5 93 172.4 94 159.7 97 189.7 94 169.3 92 156.3 96
Gunma 192.6 91 176.3 96 162.3 98 192.5 96 154.5 84 159.0 97
Saitama 198.1 93 173.3 94 164.7 100 194.0 97 177.1 96 158.7 97
Chiba 207.0 98 173.5 94 161.8 98 196.9 98 171.3 93 155.9 95
Tokyo 212.2 100 184.3 100 165.3 100 201.0 100 184.4 100 163.4 100
Kanagawa 203.0 96 174.8 95 172.3 104 200.0 100 180.4 98 165.7 101
Niigata 185.8 88 167.9 91 160.5 97 178.9 89 159.0 86 145.4 89
Toyama 191.6 90 175.8 95 163.2 99 184.2 92 159.4 86 148.8 91
Ishikawa 188.0 89 170.6 93 154.8 94 175.7 87 153.1 83 148.2 91
Fukui 192.5 91 196.3 107 162.8 98 184.1 92 165.5 90 151.5 93
Yamanashi 189.4 89 162.7 88 160.5 97 194.2 97 162.6 88 153.9 94
Nagano 191.1 90 170.7 93 159.5 96 183.8 91 163.2 89 162.8 100
Gifu 194.7 92 180.1 98 162.8 98 182.1 91 162.2 88 153.5 94
Shizuoka 196.9 93 171.1 93 162.4 98 196.8 98 166.8 90 156.9 96
Aichi 201.5 95 179.8 98 163.4 99 195.1 97 175.1 95 160.2 98
Mie 196.6 93 176.5 96 164.4 99 179.5 89 179.2 97 157.6 96
Shiga 194.1 91 167.5 91 160.1 97 186.1 93 168.8 92 156.9 96
Kyoto 194.4 92 172.6 94 160.0 97 189.0 94 164.4 89 159.6 98
Osaka 205.7 97 176.8 96 174.4 106 197.5 98 178.7 97 162.3 99
Hyogo 200.3 94 176.6 96 160.1 97 194.6 97 168.7 91 156.5 96
Nara 188.9 89 165.4 90 163.2 99 182.8 91 171.0 93 156.5 96
Wakayama 187.0 88 181.5 98 157.9 96 190.5 95 165.2 90 153.4 94
Tottori 176.9 83 150.0 81 148.4 90 167.6 83 147.8 80 140.8 86
Shimane 188.4 89 159.0 86 149.6 91 171.6 85 164.4 89 141.1 86
Okayama 195.9 92 178.7 97 160.0 97 187.5 93 172.1 93 150.6 92
Hiroshima 194.4 92 176.5 96 162.6 98 184.2 92 171.5 93 152.3 93
Yamaguchi 192.1 91 210.2 114 157.9 96 187.2 93 202.0 110 153.1 94
Tokushima 181.9 86 * 191.6 … 154.7 94 174.7 87 * 163.7 … 150.8 92
Kagawa 193.8 91 174.9 95 151.2 91 183.2 91 150.9 82 149.6 92
Ehime 194.0 91 152.6 83 161.3 98 183.7 91 149.1 81 143.3 88
Kochi 190.5 90 151.2 82 150.3 91 * 195.4 … 160.3 87 139.8 86
Fukuoka 189.8 89 180.4 98 152.6 92 184.9 92 155.1 84 149.8 92
Saga 182.8 86 165.9 90 145.0 88 * 172.0 … 158.1 86 133.5 82
Nagasaki 189.5 89 168.7 92 145.6 88 173.3 86 147.8 80 134.8 82
Kumamoto 179.6 85 166.9 91 146.0 88 175.8 87 149.2 81 148.1 91
Oita 172.2 81 156.5 85 151.8 92 172.6 86 152.9 83 142.8 87
Miyazaki 180.4 85 167.5 91 144.6 87 174.1 87 160.4 87 142.7 87
Kagoshima 175.8 83 169.9 92 142.2 86 173.2 86 153.0 83 134.5 82
Okinawa 167.6 79 144.4 78 126.1 76 162.6 81 142.9 77 121.7 74
Note: (*) requires caution in use because there were only a few new graduate employees.
Graduates of senior high
schools
difference difference difference difference difference differenceStarting
salary
(1,000 Yen)
Starting
salary
(1,000 Yen)
Starting
salary
(1,000 Yen)
Starting
salary
(1,000 Yen)
Starting
salary
(1,000 Yen)
Starting
salary
(1,000 Yen)(Tokyo=100) (Tokyo=100) (Tokyo=100) (Tokyo=100) (Tokyo=100) (Tokyo=100)
Male Female
Graduates of senior high
schools