Embed Size (px)
Citation preview

1
ECIRP WAGE SURVEY 2020https://ecirp.org
Purdue Center for Regional DevelopmentRoberto Gallardo, Ph.D.
2
MethodologyThe East Central Indiana Regional Partnership conducted a wage and benefit online survey among businesses in their region. The survey gathered data for three weeks in October 2020 resulting in 189 valid responses.
The survey included questions regarding the impact of COVID-19 and total number of employees. It also asked about number of hourly and salaried workers as well as the entry, average, and highest wages for 113 different jobs grouped into 14 major categories. Types of benefits offered were also included in the survey including but not limited to health and dental insurance, life and disability insurance, bonus programs, and personal time off and vacation.
Overview of Responses and COVID ImpactA total of 189 valid responses were received from businesses in multiple counties. Figure 1 below shows the response breakdown by county. Business in Wayne County had the highest share with a little more than one-fifth (22.3%) followed by Madison with 18.6% and Delaware with 18.1%. Jay County had the lowest response share with 4.8%.
Blackford
Delaware
Grant
Henry
Jay
Madison
Randolph
Rush
Wayne
Figure 1. County Breakdownn range = 188
3.7%4.8%
4.3%
8%
6.4%
18.6%
18.1%
13.8%
22.3%
3
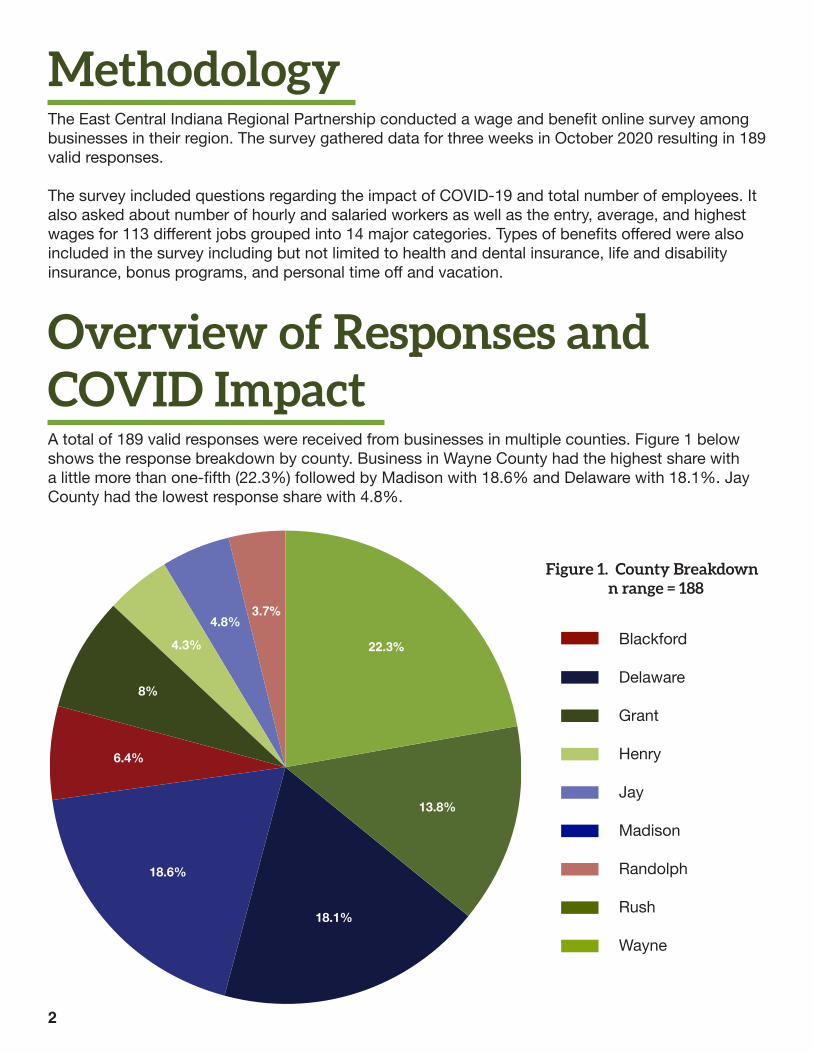
Regarding the number of full and part-time employees, Figure 2 shows that roughly a little more than one-third (34.4%) of respondents had between 1 and 20 full-time employees compared to 28% with 21-99 full-time employees and 37.6% with 100 or more full-time employees. Regarding part-time employees, smaller businesses (between 1 and 20 employees) rely more on these types of employees (65.4%) compared to only 14.4% of those with more than 100 employees.
Regarding the impact of COVID-19, more than half (58.2%) of respondents said it had a negative impact on their workforce as shown in Figure 3. However, among those impacted in a negative way, 58.2% indicated they had to reduce more than 10% of their full time equivalent (FTEs) jobs while 11.4% said they had to completely shut down as shown in Figure 4.
Full-time Part-time
Figure 3. COVID Workforce Impact
n range = 170
Figure 4. COVID FTE Reductionn range = 79
Figure 2. Responses by Number and Type of Employeesn range =104-189
1-20
Positive
More than 10% reductionMore than 20% reductionMore than 50% reductionCompletely shut down
21-99
Negative
100+
37.6%
14.4%
28%
20.2%
34.4%
65.4%
58.2%41.8%
6.3%
24.1%
11.4%
58.2%
4
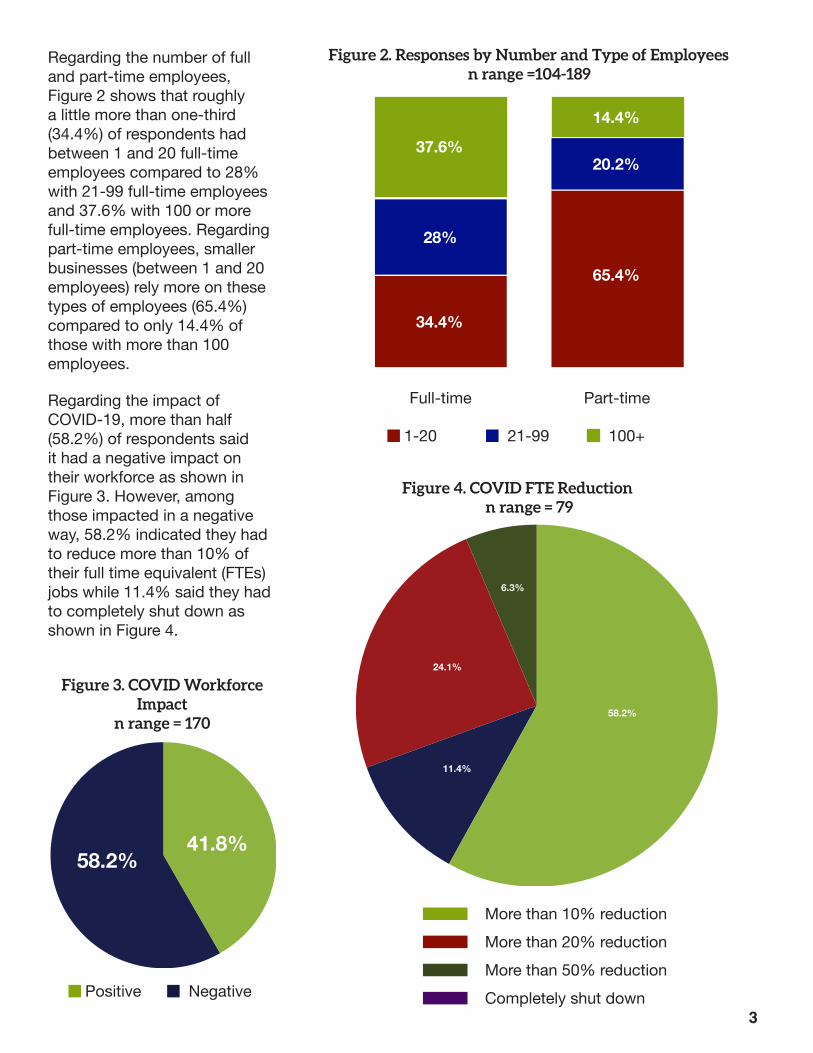
Moreover, roughly 13.6% of respondents said they do not expect their business and workforce op-erations to return to pre-COVID levels in the foreseeable future. About 47% of those who responded said they expect to return to pre-COVID levels this year (Q3 & Q4) while roughly 38% hope to get there by mid-2021 (Q1 & Q2 2021).
In summary, 58% of responses came from Wayne, Madison, and Delaware counties. Smaller busi-nesses (between 1 and 20 employees) had a higher share of part-time employees and more than half of respondents were negatively impacted by COVID-19. On the other hand, more than half of those affected by COVID-19 reduced more than 10% of full-time equivalent jobs compared to 11.4% which had to completely shut down.
13.6%
16%
22.4% 13.6%
34.4%
Q3 2020Q4 2020Q1 2021Q2 2021
Not in the foreseeable future
Figure 5. Business & Workforce back to pre-COVID Levels
n range = 125
5
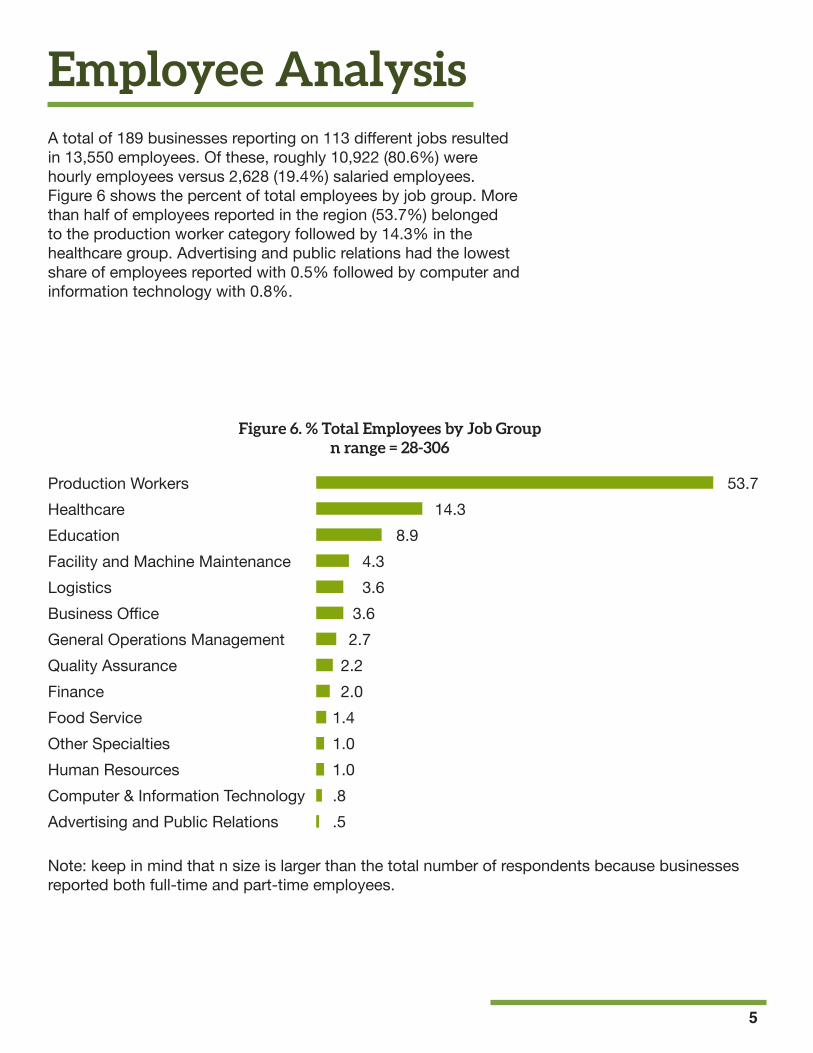
Figure 6. % Total Employees by Job Groupn range = 28-306
Employee AnalysisA total of 189 businesses reporting on 113 different jobs resulted in 13,550 employees. Of these, roughly 10,922 (80.6%) were hourly employees versus 2,628 (19.4%) salaried employees. Figure 6 shows the percent of total employees by job group. More than half of employees reported in the region (53.7%) belonged to the production worker category followed by 14.3% in the healthcare group. Advertising and public relations had the lowest share of employees reported with 0.5% followed by computer and information technology with 0.8%.
Production Workers 53.7
Business Office 3.6
Other Specialties 1.0
Healthcare 14.3
General Operations Management 2.7
Human Resources 1.0
Education 8.9
Quality Assurance 2.2
Advertising and Public Relations .5
Note: keep in mind that n size is larger than the total number of respondents because businesses reported both full-time and part-time employees.
Facility and Machine Maintenance 4.3
Finance 2.0
Computer & Information Technology .8
Logistics 3.6
Food Service 1.4
6
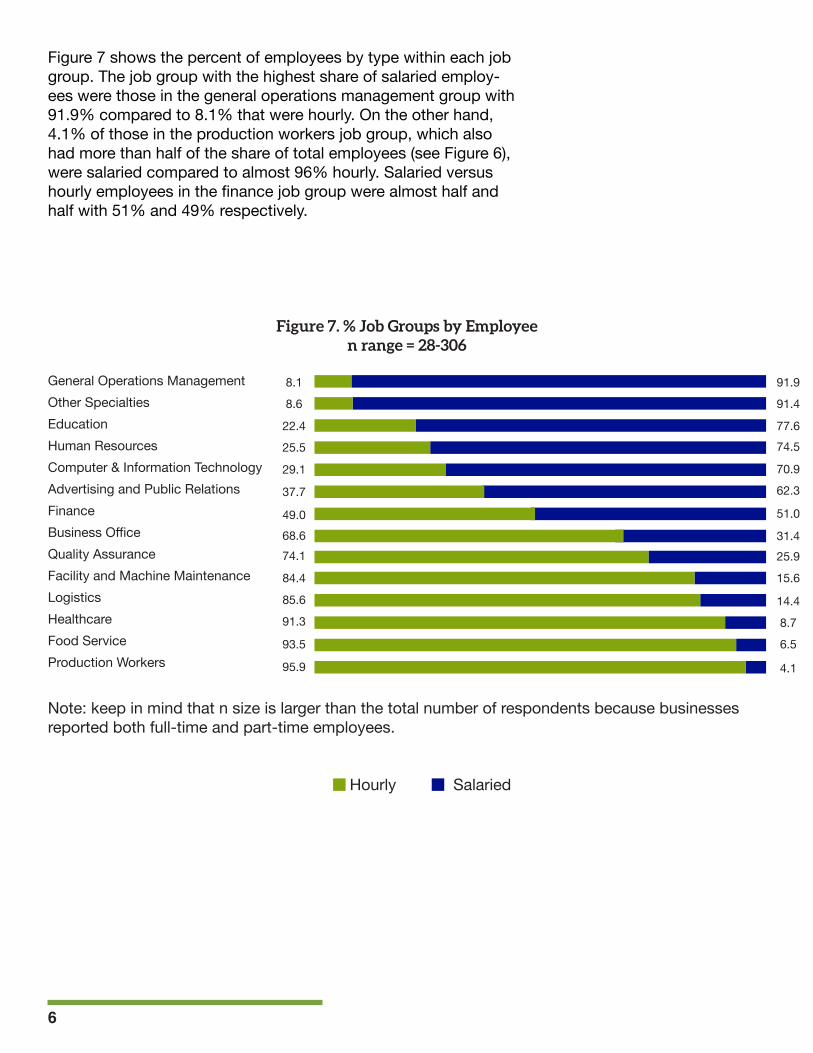
Figure 7 shows the percent of employees by type within each job group. The job group with the highest share of salaried employ-ees were those in the general operations management group with 91.9% compared to 8.1% that were hourly. On the other hand, 4.1% of those in the production workers job group, which also had more than half of the share of total employees (see Figure 6), were salaried compared to almost 96% hourly. Salaried versus hourly employees in the finance job group were almost half and half with 51% and 49% respectively.
Figure 7. % Job Groups by Employeen range = 28-306
General Operations Management
Business Office
Production Workers
Other Specialties
Food ServiceHealthcare
Education
Quality Assurance
Advertising and Public Relations
Human Resources
Finance
Computer & Information Technology
LogisticsFacility and Machine Maintenance
Note: keep in mind that n size is larger than the total number of respondents because businesses reported both full-time and part-time employees.
Hourly Salaried
8.1
29.1
22.4
68.6
91.3
85.6
95.9
8.6
49.0
37.7
84.4
25.5
74.1
93.5
91.9
70.9
77.6
31.4
8.7
14.4
4.1
91.4
51.0
62.3
15.6
74.5
25.9
6.5
7
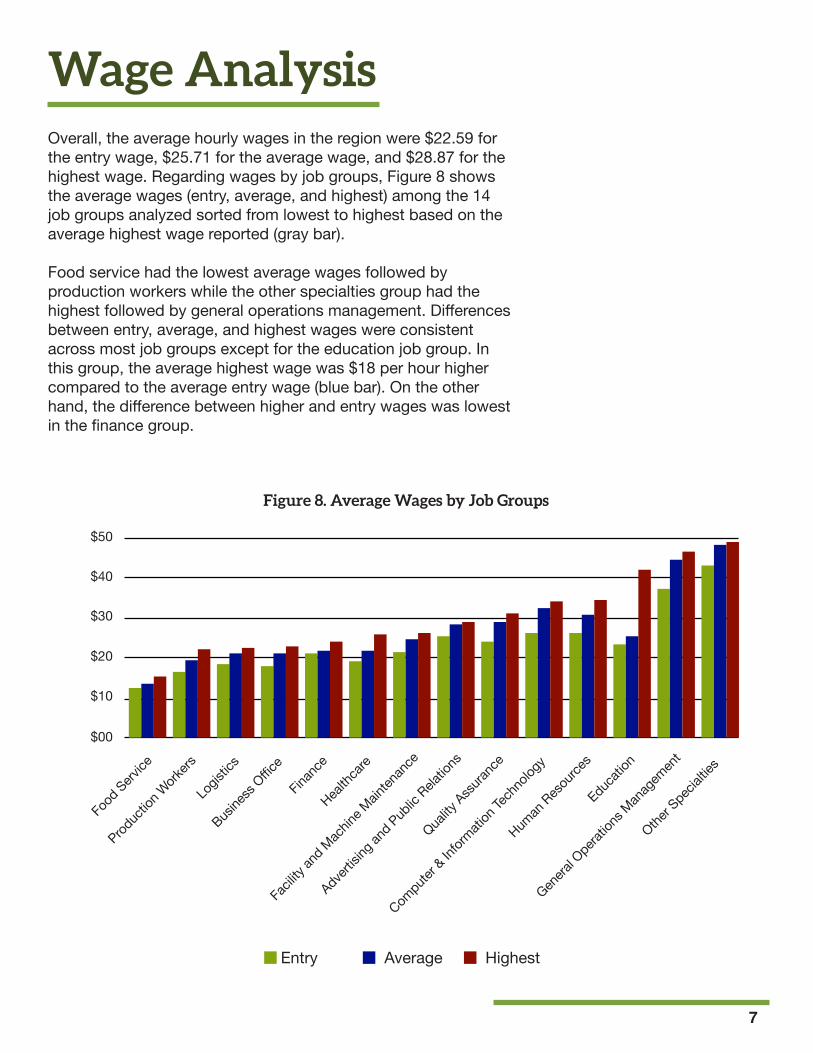
Figure 8. Average Wages by Job Groups
$50
$40
$30
$20
$10
$00
Genera
l Opera
tions
Man
agem
ent
Busine
ss Office
Produc
tion W
orkers
Other S
pecialt
ies
Food
Service
Health
care
Educati
on
Quality
Assuran
ce
Advertis
ing an
d Public
Relatio
ns
Human
Resou
rces
Finan
ce
Compute
r & In
formati
on Te
chno
logy
Logis
tics
Facili
ty an
d Mac
hine M
ainten
ance
Wage AnalysisOverall, the average hourly wages in the region were $22.59 for the entry wage, $25.71 for the average wage, and $28.87 for the highest wage. Regarding wages by job groups, Figure 8 shows the average wages (entry, average, and highest) among the 14 job groups analyzed sorted from lowest to highest based on the average highest wage reported (gray bar).
Food service had the lowest average wages followed by production workers while the other specialties group had the highest followed by general operations management. Differences between entry, average, and highest wages were consistent across most job groups except for the education job group. In this group, the average highest wage was $18 per hour higher compared to the average entry wage (blue bar). On the other hand, the difference between higher and entry wages was lowest in the finance group.
Entry Average Highest
8
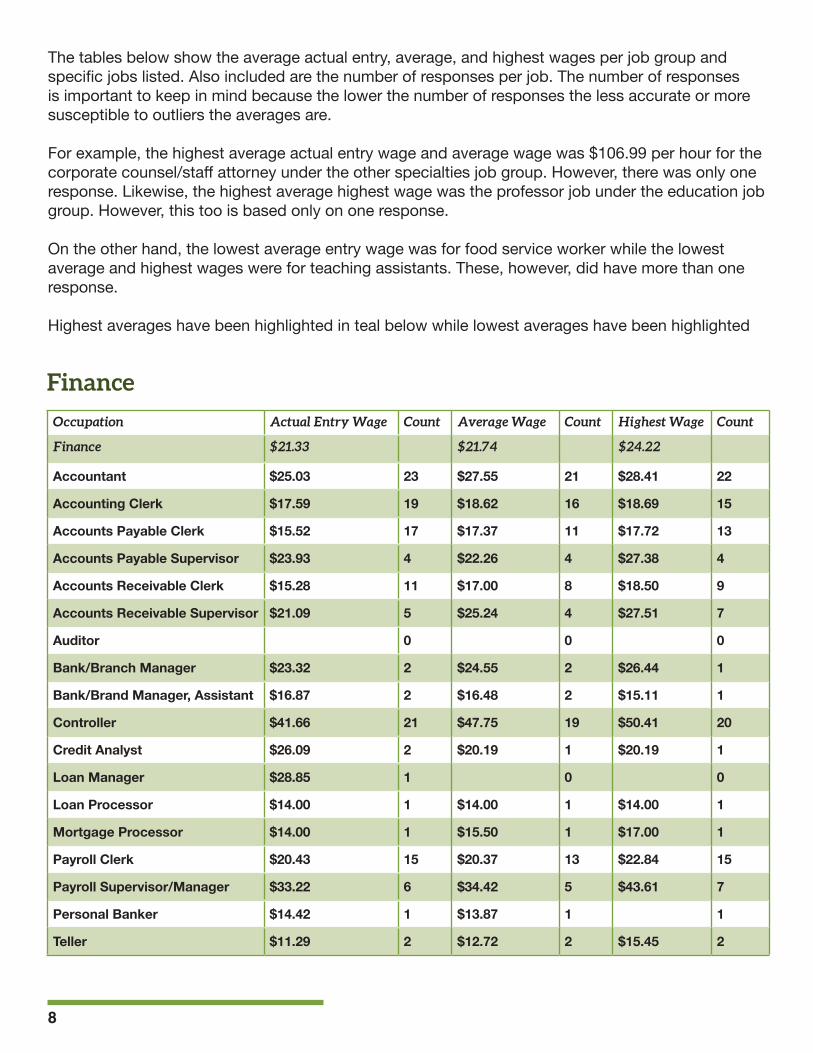
Finance
Occupation Actual Entry Wage Count Average Wage Count Highest Wage Count
Finance $21.33 $21.74 $24.22
Accountant $25.03 23 $27.55 21 $28.41 22
Accounting Clerk $17.59 19 $18.62 16 $18.69 15
Accounts Payable Clerk $15.52 17 $17.37 11 $17.72 13
Accounts Payable Supervisor $23.93 4 $22.26 4 $27.38 4
Accounts Receivable Clerk $15.28 11 $17.00 8 $18.50 9
Accounts Receivable Supervisor $21.09 5 $25.24 4 $27.51 7
Auditor 0 0 0
Bank/Branch Manager $23.32 2 $24.55 2 $26.44 1
Bank/Brand Manager, Assistant $16.87 2 $16.48 2 $15.11 1
Controller $41.66 21 $47.75 19 $50.41 20
Credit Analyst $26.09 2 $20.19 1 $20.19 1
Loan Manager $28.85 1 0 0
Loan Processor $14.00 1 $14.00 1 $14.00 1
Mortgage Processor $14.00 1 $15.50 1 $17.00 1
Payroll Clerk $20.43 15 $20.37 13 $22.84 15
Payroll Supervisor/Manager $33.22 6 $34.42 5 $43.61 7
Personal Banker $14.42 1 $13.87 1 1
Teller $11.29 2 $12.72 2 $15.45 2
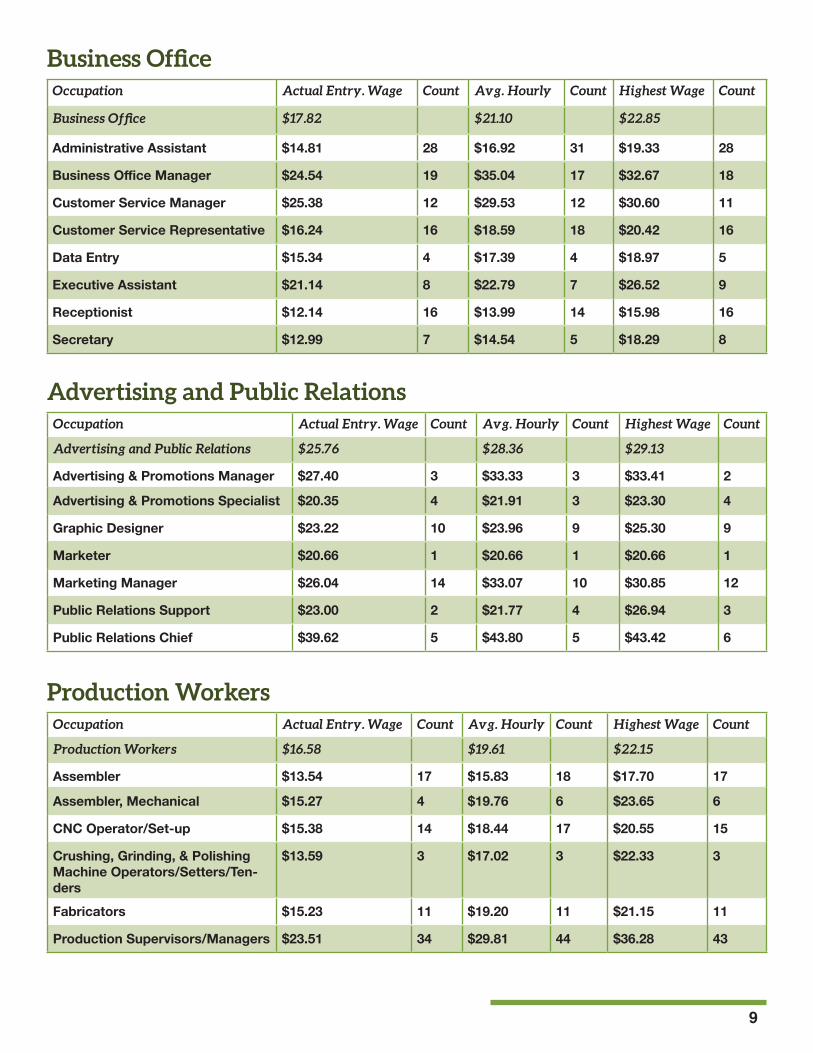
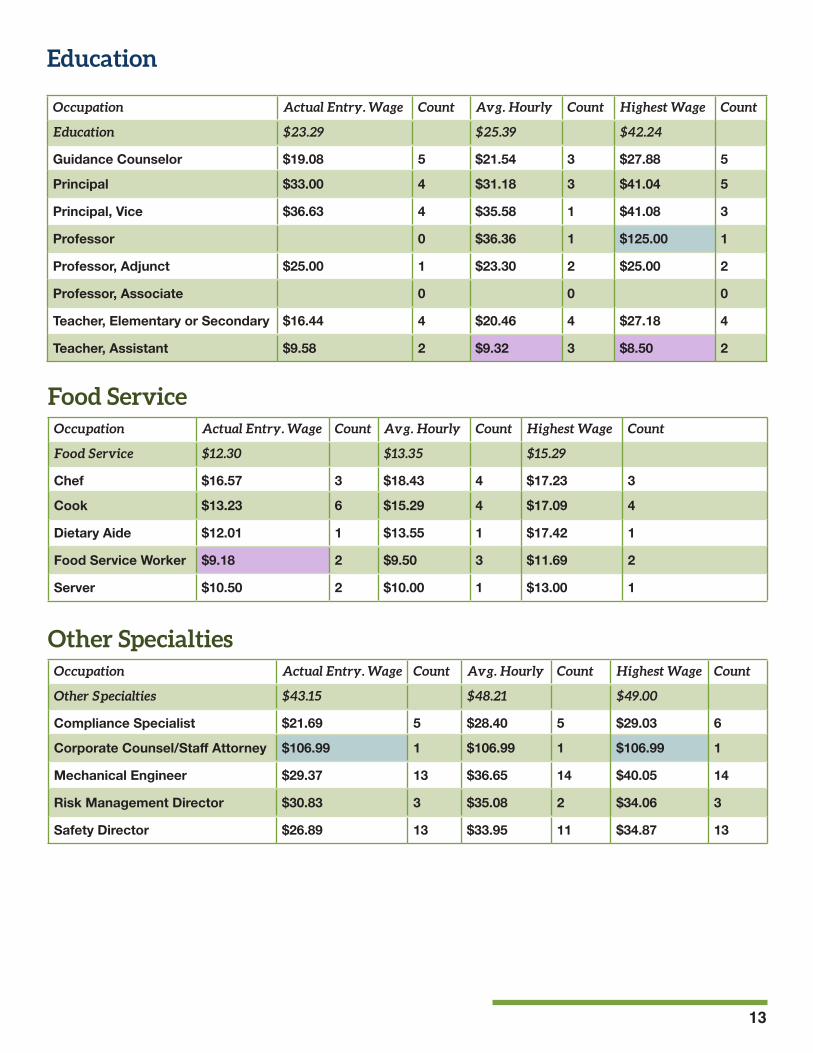
The tables below show the average actual entry, average, and highest wages per job group and specific jobs listed. Also included are the number of responses per job. The number of responses is important to keep in mind because the lower the number of responses the less accurate or more susceptible to outliers the averages are.
For example, the highest average actual entry wage and average wage was $106.99 per hour for the corporate counsel/staff attorney under the other specialties job group. However, there was only one response. Likewise, the highest average highest wage was the professor job under the education job group. However, this too is based only on one response.
On the other hand, the lowest average entry wage was for food service worker while the lowest average and highest wages were for teaching assistants. These, however, did have more than one response.
Highest averages have been highlighted in teal below while lowest averages have been highlighted
9
Business Office
Production Workers
Advertising and Public Relations
Occupation Actual Entry. Wage Count Avg. Hourly Count Highest Wage Count
Business Office $17.82 $21.10 $22.85
Administrative Assistant $14.81 28 $16.92 31 $19.33 28
Business Office Manager $24.54 19 $35.04 17 $32.67 18
Customer Service Manager $25.38 12 $29.53 12 $30.60 11
Customer Service Representative $16.24 16 $18.59 18 $20.42 16
Data Entry $15.34 4 $17.39 4 $18.97 5
Executive Assistant $21.14 8 $22.79 7 $26.52 9
Receptionist $12.14 16 $13.99 14 $15.98 16
Secretary $12.99 7 $14.54 5 $18.29 8
Occupation Actual Entry. Wage Count Avg. Hourly Count Highest Wage Count
Production Workers $16.58 $19.61 $22.15
Assembler $13.54 17 $15.83 18 $17.70 17
Assembler, Mechanical $15.27 4 $19.76 6 $23.65 6
CNC Operator/Set-up $15.38 14 $18.44 17 $20.55 15
Crushing, Grinding, & Polishing Machine Operators/Setters/Ten-ders
$13.59 3 $17.02 3 $22.33 3
Fabricators $15.23 11 $19.20 11 $21.15 11
Production Supervisors/Managers $23.51 34 $29.81 44 $36.28 43
Occupation Actual Entry. Wage Count Avg. Hourly Count Highest Wage Count
Advertising and Public Relations $25.76 $28.36 $29.13
Advertising & Promotions Manager $27.40 3 $33.33 3 $33.41 2
Advertising & Promotions Specialist $20.35 4 $21.91 3 $23.30 4
Graphic Designer $23.22 10 $23.96 9 $25.30 9
Marketer $20.66 1 $20.66 1 $20.66 1
Marketing Manager $26.04 14 $33.07 10 $30.85 12
Public Relations Support $23.00 2 $21.77 4 $26.94 3
Public Relations Chief $39.62 5 $43.80 5 $43.42 6
10
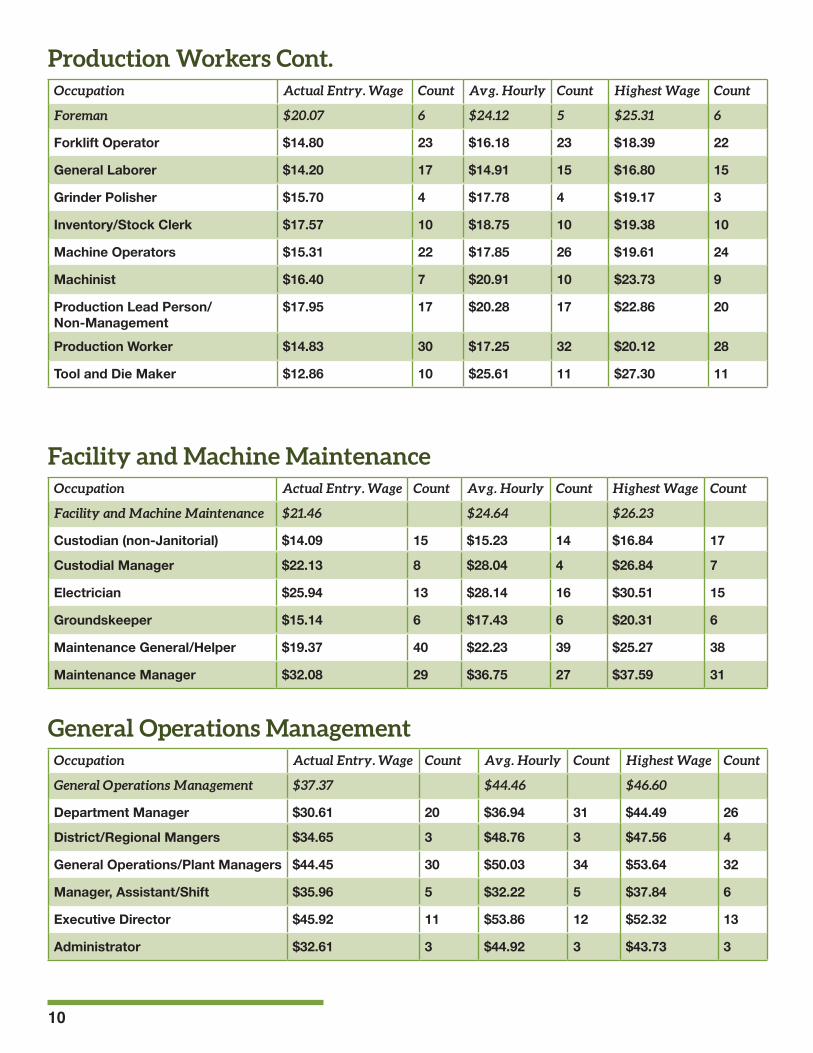
General Operations Management
Facility and Machine Maintenance
Occupation Actual Entry. Wage Count Avg. Hourly Count Highest Wage Count
General Operations Management $37.37 $44.46 $46.60
Department Manager $30.61 20 $36.94 31 $44.49 26
District/Regional Mangers $34.65 3 $48.76 3 $47.56 4
General Operations/Plant Managers $44.45 30 $50.03 34 $53.64 32
Manager, Assistant/Shift $35.96 5 $32.22 5 $37.84 6
Executive Director $45.92 11 $53.86 12 $52.32 13
Administrator $32.61 3 $44.92 3 $43.73 3
Occupation Actual Entry. Wage Count Avg. Hourly Count Highest Wage Count
Facility and Machine Maintenance $21.46 $24.64 $26.23
Custodian (non-Janitorial) $14.09 15 $15.23 14 $16.84 17
Custodial Manager $22.13 8 $28.04 4 $26.84 7
Electrician $25.94 13 $28.14 16 $30.51 15
Groundskeeper $15.14 6 $17.43 6 $20.31 6
Maintenance General/Helper $19.37 40 $22.23 39 $25.27 38
Maintenance Manager $32.08 29 $36.75 27 $37.59 31
Production Workers Cont.Occupation Actual Entry. Wage Count Avg. Hourly Count Highest Wage Count
Foreman $20.07 6 $24.12 5 $25.31 6
Forklift Operator $14.80 23 $16.18 23 $18.39 22
General Laborer $14.20 17 $14.91 15 $16.80 15
Grinder Polisher $15.70 4 $17.78 4 $19.17 3
Inventory/Stock Clerk $17.57 10 $18.75 10 $19.38 10
Machine Operators $15.31 22 $17.85 26 $19.61 24
Machinist $16.40 7 $20.91 10 $23.73 9
Production Lead Person/Non-Management
$17.95 17 $20.28 17 $22.86 20
Production Worker $14.83 30 $17.25 32 $20.12 28
Tool and Die Maker $12.86 10 $25.61 11 $27.30 11
11
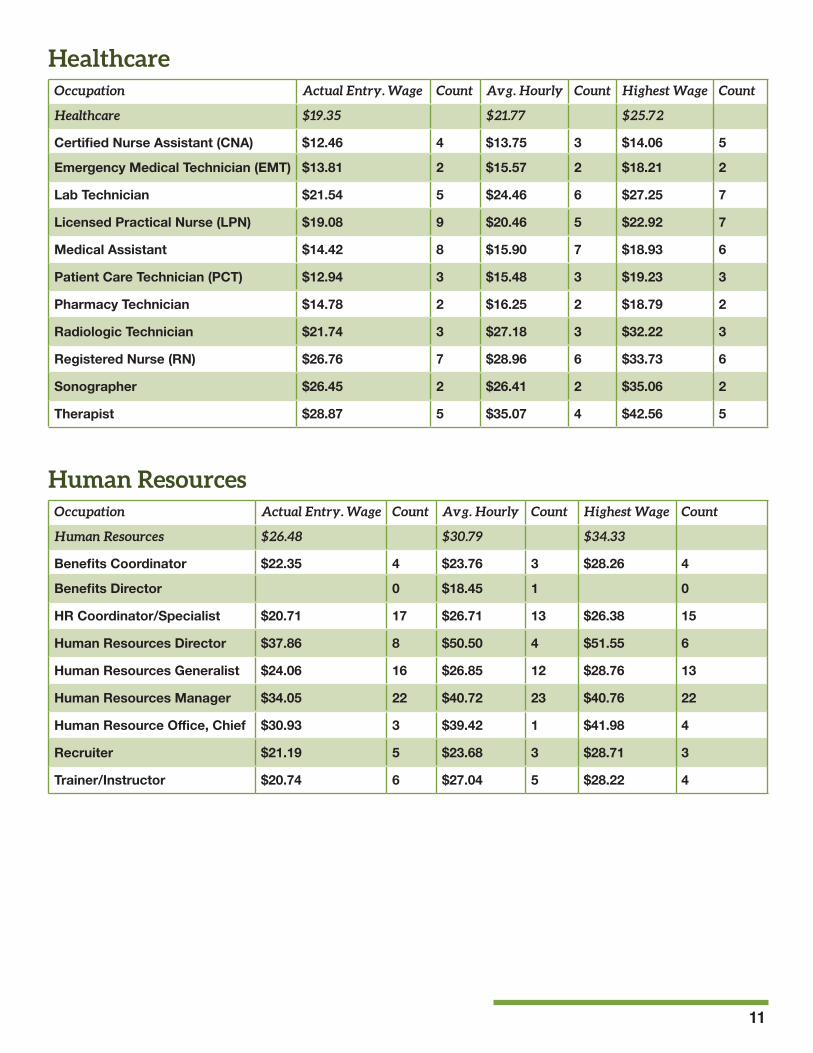
Human Resources
Healthcare
Occupation Actual Entry. Wage Count Avg. Hourly Count Highest Wage Count
Human Resources $26.48 $30.79 $34.33
Benefits Coordinator $22.35 4 $23.76 3 $28.26 4
Benefits Director 0 $18.45 1 0
HR Coordinator/Specialist $20.71 17 $26.71 13 $26.38 15
Human Resources Director $37.86 8 $50.50 4 $51.55 6
Human Resources Generalist $24.06 16 $26.85 12 $28.76 13
Human Resources Manager $34.05 22 $40.72 23 $40.76 22
Human Resource Office, Chief $30.93 3 $39.42 1 $41.98 4
Recruiter $21.19 5 $23.68 3 $28.71 3
Trainer/Instructor $20.74 6 $27.04 5 $28.22 4
Occupation Actual Entry. Wage Count Avg. Hourly Count Highest Wage Count
Healthcare $19.35 $21.77 $25.72
Certified Nurse Assistant (CNA) $12.46 4 $13.75 3 $14.06 5
Emergency Medical Technician (EMT) $13.81 2 $15.57 2 $18.21 2
Lab Technician $21.54 5 $24.46 6 $27.25 7
Licensed Practical Nurse (LPN) $19.08 9 $20.46 5 $22.92 7
Medical Assistant $14.42 8 $15.90 7 $18.93 6
Patient Care Technician (PCT) $12.94 3 $15.48 3 $19.23 3
Pharmacy Technician $14.78 2 $16.25 2 $18.79 2
Radiologic Technician $21.74 3 $27.18 3 $32.22 3
Registered Nurse (RN) $26.76 7 $28.96 6 $33.73 6
Sonographer $26.45 2 $26.41 2 $35.06 2
Therapist $28.87 5 $35.07 4 $42.56 5
12
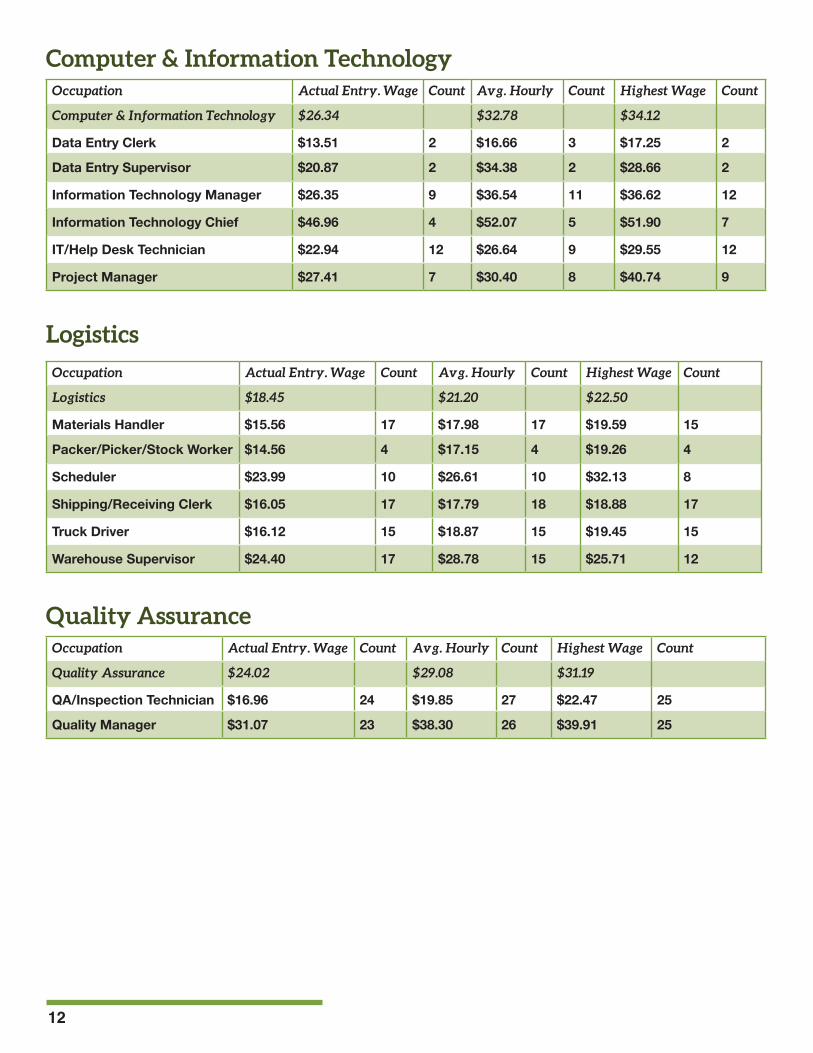
Logistics
Computer & Information Technology
Quality Assurance
Occupation Actual Entry. Wage Count Avg. Hourly Count Highest Wage Count
Logistics $18.45 $21.20 $22.50
Materials Handler $15.56 17 $17.98 17 $19.59 15
Packer/Picker/Stock Worker $14.56 4 $17.15 4 $19.26 4
Scheduler $23.99 10 $26.61 10 $32.13 8
Shipping/Receiving Clerk $16.05 17 $17.79 18 $18.88 17
Truck Driver $16.12 15 $18.87 15 $19.45 15
Warehouse Supervisor $24.40 17 $28.78 15 $25.71 12
Occupation Actual Entry. Wage Count Avg. Hourly Count Highest Wage Count
Computer & Information Technology $26.34 $32.78 $34.12
Data Entry Clerk $13.51 2 $16.66 3 $17.25 2
Data Entry Supervisor $20.87 2 $34.38 2 $28.66 2
Information Technology Manager $26.35 9 $36.54 11 $36.62 12
Information Technology Chief $46.96 4 $52.07 5 $51.90 7
IT/Help Desk Technician $22.94 12 $26.64 9 $29.55 12
Project Manager $27.41 7 $30.40 8 $40.74 9
Occupation Actual Entry. Wage Count Avg. Hourly Count Highest Wage Count
Quality Assurance $24.02 $29.08 $31.19
QA/Inspection Technician $16.96 24 $19.85 27 $22.47 25
Quality Manager $31.07 23 $38.30 26 $39.91 25
13
Other Specialties
Food Service
Occupation Actual Entry. Wage Count Avg. Hourly Count Highest Wage Count
Other Specialties $43.15 $48.21 $49.00
Compliance Specialist $21.69 5 $28.40 5 $29.03 6
Corporate Counsel/Staff Attorney $106.99 1 $106.99 1 $106.99 1
Mechanical Engineer $29.37 13 $36.65 14 $40.05 14
Risk Management Director $30.83 3 $35.08 2 $34.06 3
Safety Director $26.89 13 $33.95 11 $34.87 13
Occupation Actual Entry. Wage Count Avg. Hourly Count Highest Wage Count
Food Service $12.30 $13.35 $15.29
Chef $16.57 3 $18.43 4 $17.23 3
Cook $13.23 6 $15.29 4 $17.09 4
Dietary Aide $12.01 1 $13.55 1 $17.42 1
Food Service Worker $9.18 2 $9.50 3 $11.69 2
Server $10.50 2 $10.00 1 $13.00 1
Education
Occupation Actual Entry. Wage Count Avg. Hourly Count Highest Wage Count
Education $23.29 $25.39 $42.24
Guidance Counselor $19.08 5 $21.54 3 $27.88 5
Principal $33.00 4 $31.18 3 $41.04 5
Principal, Vice $36.63 4 $35.58 1 $41.08 3
Professor 0 $36.36 1 $125.00 1
Professor, Adjunct $25.00 1 $23.30 2 $25.00 2
Professor, Associate 0 0 0
Teacher, Elementary or Secondary $16.44 4 $20.46 4 $27.18 4
Teacher, Assistant $9.58 2 $9.32 3 $8.50 2
14
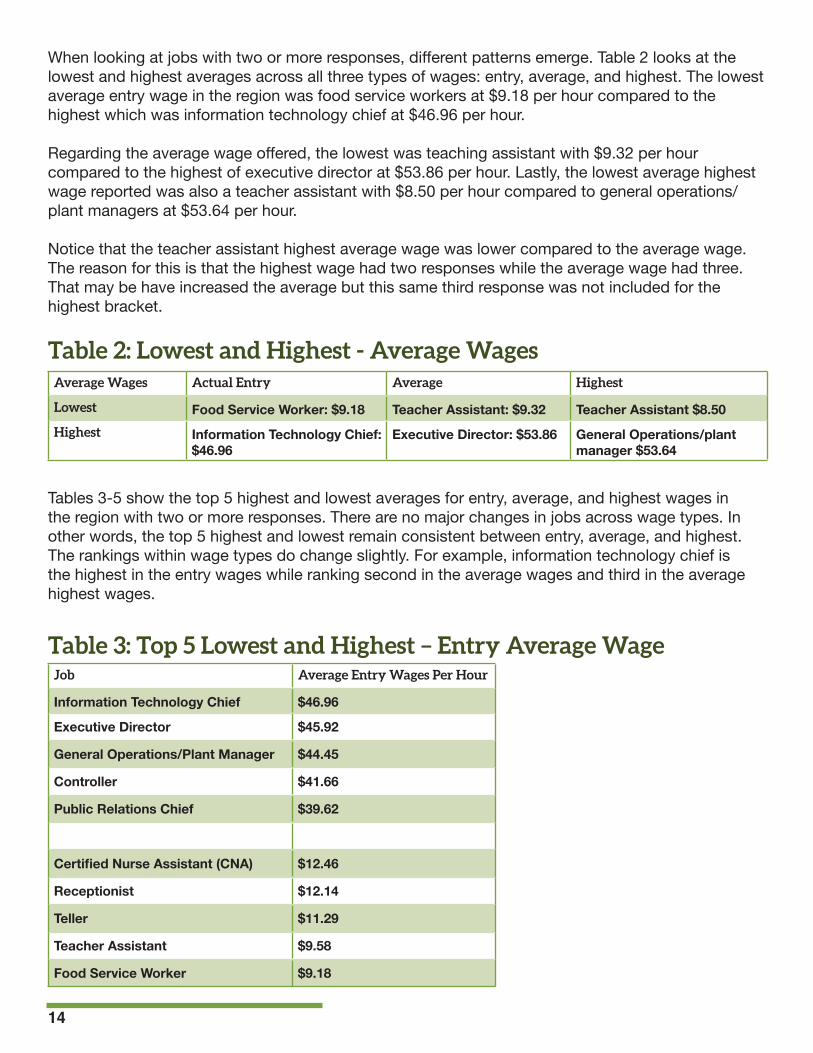
When looking at jobs with two or more responses, different patterns emerge. Table 2 looks at the lowest and highest averages across all three types of wages: entry, average, and highest. The lowest average entry wage in the region was food service workers at $9.18 per hour compared to the highest which was information technology chief at $46.96 per hour.
Regarding the average wage offered, the lowest was teaching assistant with $9.32 per hour compared to the highest of executive director at $53.86 per hour. Lastly, the lowest average highest wage reported was also a teacher assistant with $8.50 per hour compared to general operations/plant managers at $53.64 per hour.
Notice that the teacher assistant highest average wage was lower compared to the average wage. The reason for this is that the highest wage had two responses while the average wage had three. That may be have increased the average but this same third response was not included for the highest bracket.
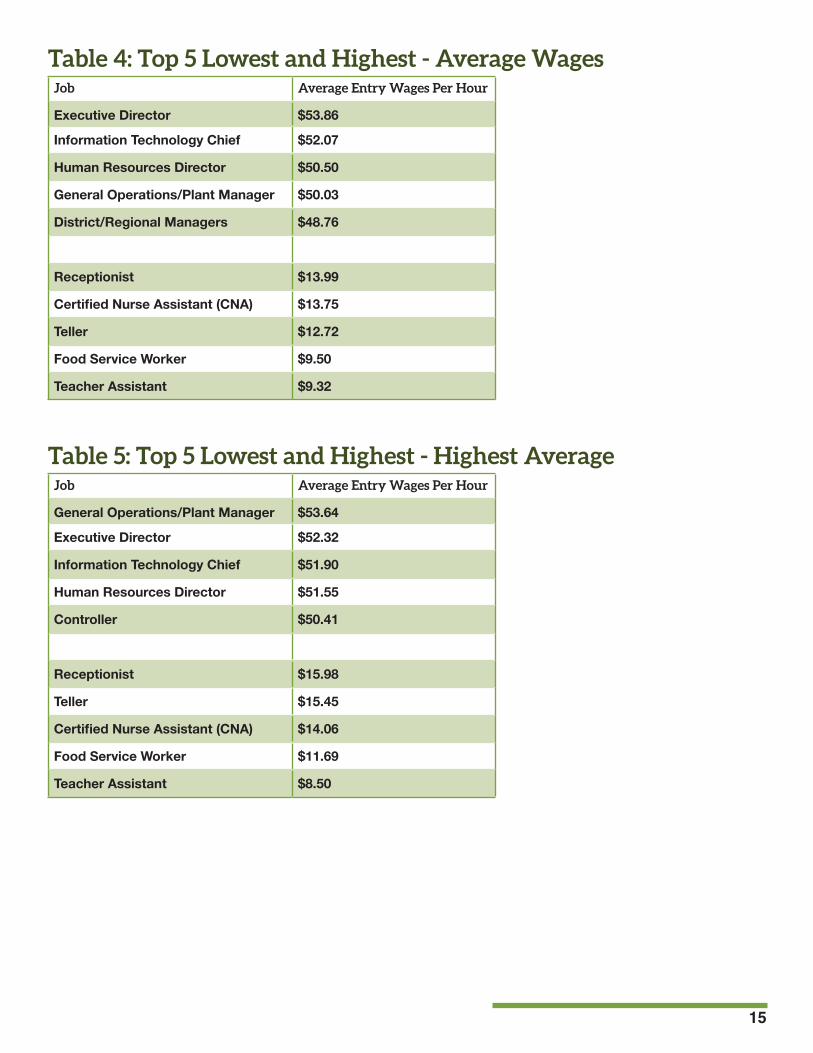
Tables 3-5 show the top 5 highest and lowest averages for entry, average, and highest wages in the region with two or more responses. There are no major changes in jobs across wage types. In other words, the top 5 highest and lowest remain consistent between entry, average, and highest. The rankings within wage types do change slightly. For example, information technology chief is the highest in the entry wages while ranking second in the average wages and third in the average highest wages.
Table 2: Lowest and Highest - Average WagesAverage Wages Actual Entry Average Highest
Lowest Food Service Worker: $9.18 Teacher Assistant: $9.32 Teacher Assistant $8.50Highest Information Technology Chief:
$46.96Executive Director: $53.86 General Operations/plant
manager $53.64
Table 3: Top 5 Lowest and Highest – Entry Average WageJob Average Entry Wages Per Hour
Information Technology Chief $46.96
Executive Director $45.92
General Operations/Plant Manager $44.45
Controller $41.66
Public Relations Chief $39.62
Certified Nurse Assistant (CNA) $12.46
Receptionist $12.14
Teller $11.29
Teacher Assistant $9.58
Food Service Worker $9.18
15
Table 4: Top 5 Lowest and Highest - Average Wages
Table 5: Top 5 Lowest and Highest - Highest Average
Job Average Entry Wages Per Hour
Executive Director $53.86
Information Technology Chief $52.07
Human Resources Director $50.50
General Operations/Plant Manager $50.03
District/Regional Managers $48.76
Receptionist $13.99
Certified Nurse Assistant (CNA) $13.75
Teller $12.72
Food Service Worker $9.50
Teacher Assistant $9.32
Job Average Entry Wages Per Hour
General Operations/Plant Manager $53.64
Executive Director $52.32
Information Technology Chief $51.90
Human Resources Director $51.55
Controller $50.41
Receptionist $15.98
Teller $15.45
Certified Nurse Assistant (CNA) $14.06
Food Service Worker $11.69
Teacher Assistant $8.50
16
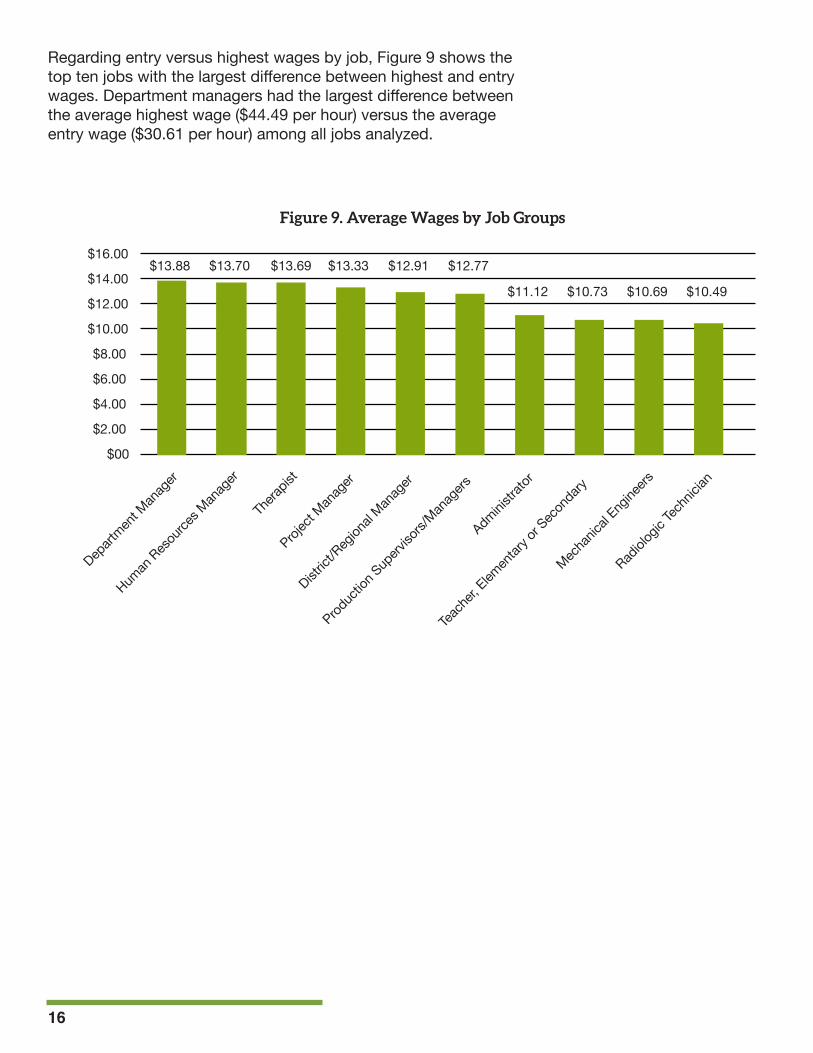
Regarding entry versus highest wages by job, Figure 9 shows the top ten jobs with the largest difference between highest and entry wages. Department managers had the largest difference between the average highest wage ($44.49 per hour) versus the average entry wage ($30.61 per hour) among all jobs analyzed.
Figure 9. Average Wages by Job Groups
$16.00$13.88 $13.70 $13.69 $13.33 $12.91 $12.77
$11.12 $10.73 $10.69 $10.49$14.00
$12.00
$6.00
$10.00
$4.00
$8.00
$2.00
$00
Human
Resou
rces M
anag
er
Distric
t/Reg
ional
Manag
er
Administra
tor
Mecha
nical
Engine
ers
Projec
t Man
ager
Depart
ment M
anag
er
Thera
pist
Produc
tion S
uperv
isors/
Manag
ers
Teach
er, Elem
entar
y or S
econ
dary
Radiol
ogic
Techn
ician
17
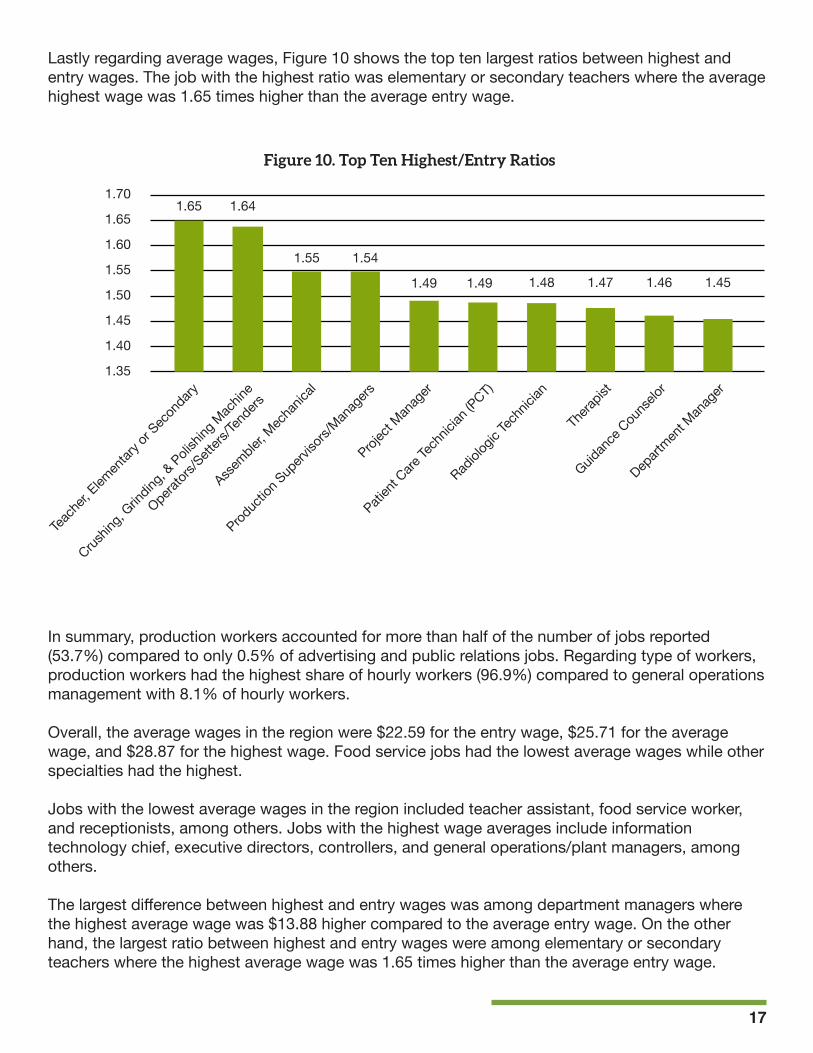
Lastly regarding average wages, Figure 10 shows the top ten largest ratios between highest and entry wages. The job with the highest ratio was elementary or secondary teachers where the average highest wage was 1.65 times higher than the average entry wage.
In summary, production workers accounted for more than half of the number of jobs reported (53.7%) compared to only 0.5% of advertising and public relations jobs. Regarding type of workers, production workers had the highest share of hourly workers (96.9%) compared to general operations management with 8.1% of hourly workers.
Overall, the average wages in the region were $22.59 for the entry wage, $25.71 for the average wage, and $28.87 for the highest wage. Food service jobs had the lowest average wages while other specialties had the highest.
Jobs with the lowest average wages in the region included teacher assistant, food service worker, and receptionists, among others. Jobs with the highest wage averages include information technology chief, executive directors, controllers, and general operations/plant managers, among others.
The largest difference between highest and entry wages was among department managers where the highest average wage was $13.88 higher compared to the average entry wage. On the other hand, the largest ratio between highest and entry wages were among elementary or secondary teachers where the highest average wage was 1.65 times higher than the average entry wage.
Figure 10. Top Ten Highest/Entry Ratios
1.651.70
1.50
1.65
1.45
1.60
1.40
1.55
1.35
1.64
1.55 1.54
1.49 1.49 1.48 1.47 1.46 1.45
Patien
t Care
Tech
nician
(PCT)
Projec
t Man
ager
Depart
ment M
anag
er
Guidan
ce Cou
nselo
r
Thera
pist
Produc
tion S
uperv
isors/
Manag
ers
Teach
er, Elem
entar
y or S
econ
dary
Crushin
g, Grin
ding, &
Polish
ing M
achin
e
Operator
s/Sett
ers/Te
nders
Assembler,
Mec
hanic
al
Radiol
ogic
Techn
ician
18
0% 40% 80%20% 60% 100%
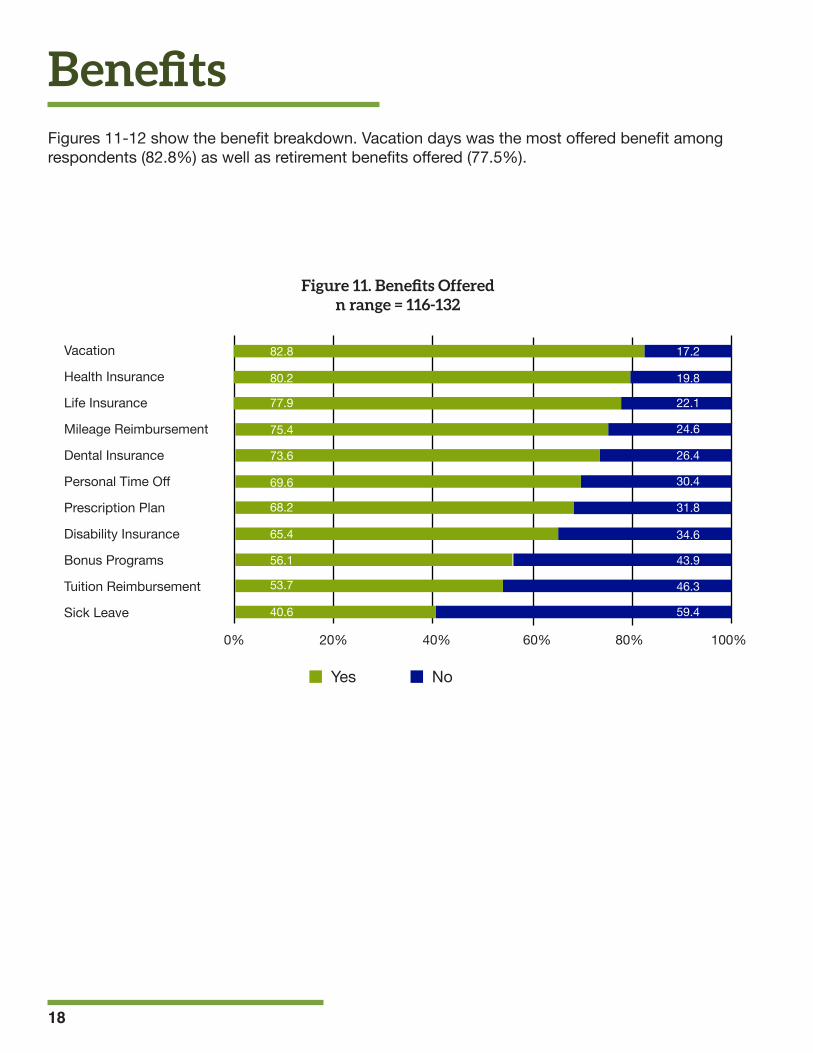
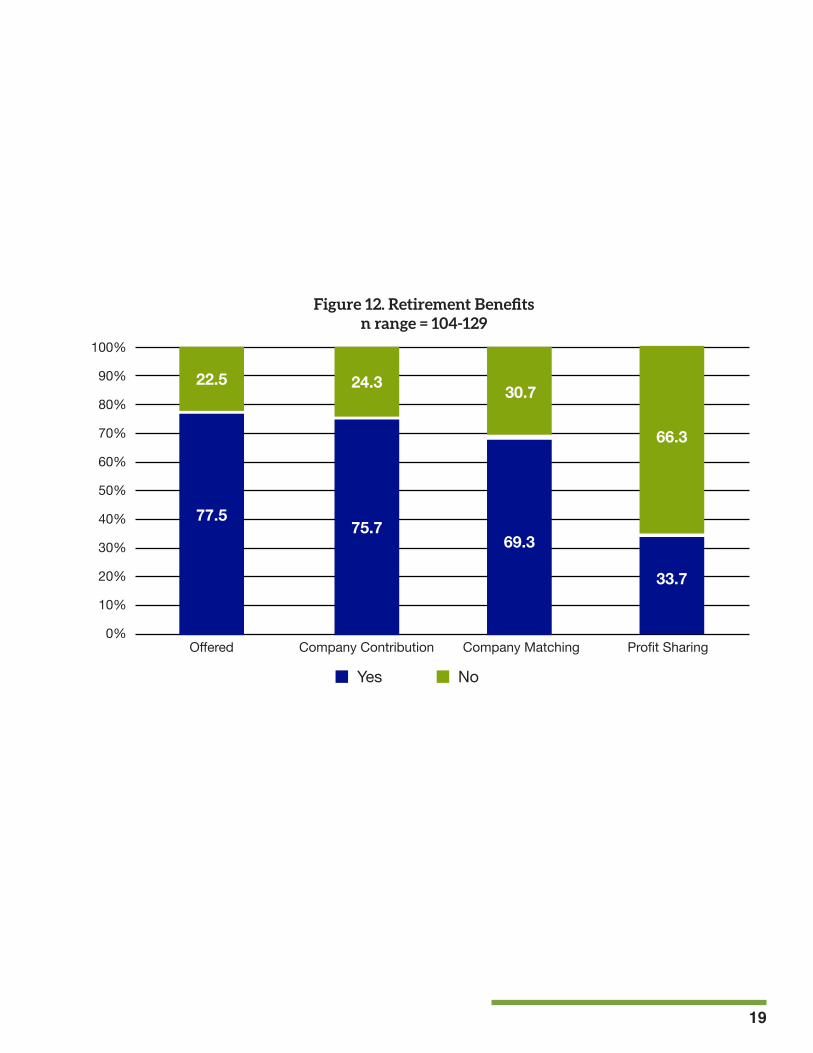
BenefitsFigures 11-12 show the benefit breakdown. Vacation days was the most offered benefit among respondents (82.8%) as well as retirement benefits offered (77.5%).
Figure 11. Benefits Offeredn range = 116-132
Vacation
Disability Insurance
Health Insurance
Life Insurance
Bonus Programs
Personal Time Off
Mileage Reimbursement
Prescription Plan
Dental Insurance
Sick Leave
Tuition Reimbursement
Yes No
82.8
73.6
77.9
68.2
53.7
80.2
69.6
56.1
75.4
65.4
40.6
17.2
26.4
22.1
31.8
46.3
19.8
30.4
43.9
24.6
34.6
59.4
19
60%
100%
90%
70%
50%
30%
Offered Company Contribution Company Matching Profit Sharing
40%
80%
20%
10%
0%
Figure 12. Retirement Benefitsn range = 104-129
Yes No
22.5 24.3
77.575.7
69.3
30.7
33.7
66.3

20