Embed Size (px)
Citation preview

UCSB ATR-2 2017-1
Milestone: M3LW-17OR0402012
Summary of Progress on the ATR-2 Experiment Post-Irradiation Examination of
Reactor Pressure Vessel Alloys
Prepared by
G. R. Odette, T. Yamamoto, P. B. Wells, N. Almirall, K. Fields, D. Gragg
University of California, Santa Barbara
R. K. Nanstad, J. P. Robertson Oak Ridge National Laboratory
K. Wilford, N. Riddle and T. Williams
Rolls-Royce Document Completed: March 31, 2017
Prepared for
Dr. Keith Leonard (ORNL) Dr. John Wagner (INL)
Dr. Richard Reister (DOE)

ii
Disclaimer
This report was prepared as an account of work sponsored by an agency of the United
States Government. Neither the United States Government nor any agency thereof, nor any of
their employees, makes any warranty, express or implied, or assumes any legal liability or
responsibility for the accuracy, completeness, or usefulness of any information, apparatus,
product, or process disclosed, or represents that its use would not infringe privately owned
rights. The above also applies to UCSB as an ORNL subcontractor. Reference herein to any
specific commercial product, process, or service by trade name, trademark, manufacturer, or
otherwise, does not necessarily constitute or imply its endorsement, recommendation, or
favoring by the United States Government or any agency thereof. The views and opinions of
authors expressed herein do not necessarily state or reflect those of the United States
Government or any agency thereof.

iii
Contents
1. Introduction ....................................................................................................................... 1
1.1 Irradiation Conditions ................................................................................................. 1
1.2 RPV Steel Matrices ..................................................................................................... 2
1.2.1 UCSB Matrix ........................................................................................................ 2 1.2.2 Surveillance and Program Alloy Matrix ............................................................... 4 1.2.3 Advanced Steel Matrix (ASM) ............................................................................. 5
1.3 Characterization Techniques ....................................................................................... 7
1.3.1 Automated SPT ..................................................................................................... 7 1.3.2 Microhardness Testing .......................................................................................... 9
1.4 Status of Characterization and Testing ........................................................................ 9
1.4.1 Microstructural Characterization ........................................................................ 10 1.4.2 Mechanical Property Testing .............................................................................. 10
2. Results and Preliminary Analysis ................................................................................... 11
2.1 Atom Probe Tomography .......................................................................................... 11
2.1.1 Surveillance and Program Steels ........................................................................ 11 2.1.2 Advanced Steel Matrix ....................................................................................... 15
2.1.2.1 Effects of Ni and Mn in Low Cu Steels ......................................................... 16 2.1.2.2 ASM – Mn Starvation .................................................................................... 19
2.2 Small Angle Neutron Scattering ............................................................................... 22
2.2.1 UCSB Alloys ...................................................................................................... 22 2.2.2 Surveillance Alloys ............................................................................................. 24 2.2.3 ASM .................................................................................................................... 24
2.3 Automated SPT ......................................................................................................... 26
2.3.1 Baseline Testing .................................................................................................. 26 2.3.2 ATR-2, Cup 8 Testing......................................................................................... 27
2.4 Microhardness ........................................................................................................... 30
3. Conclusions and Future Work ........................................................................................ 31
3.1 Conclusions ............................................................................................................... 31
3.2 Updated Testing Plan ................................................................................................ 31
4. References ....................................................................................................................... 31

iv
List of Figures
Figure 1.1. Range of Mn and Ni contents for all ASM alloys with 0.20 wt.% Si (blue dots), along with boxes showing the range of compositions explored in previous UCSB irradiations (blue box) and the in ATR-2 irradiation (red box). .................................... 5
Figure 1.2. The automated SPT instrument. ............................................................................. 8
Figure 2.1. APT solute maps for a high 0.30Cu, intermediate 0.60Ni, 1.30Mn, 0.50Si surveillance weld (SW6) with a large precipitate f ≈ 0.67. ......................................... 11
Figure 2.2. APT solute maps for an irradiated low 0.01Cu, high 1.70Ni, 1.30Mn, 0.20Si program plate (FE) with f ≈ 0.49% .............................................................................. 12
Figure 2.3. APT solute maps for an irradiated low 0.04Cu, medium-high 0.95Ni, 1.40Mn, 0.45Si surveillance weld (SW5) showing solute segregation and precipitation on dislocations with f ≈ 0.26%. ........................................................................................ 13
Figure 2.4. APT f versus the measured bulk Cu content (at.%) for the surveillance and program alloys showing the strong effect of both Cu and Ni. ..................................... 15
Figure 2.5. Solute maps for the irradiated ASM alloys with varying Ni contents from 0.30-3.50 wt.% Ni. The nominal bulk contents of the other solutes are ≈ 0.05Cu, 1.50Mn, 0.20Si. .......................................................................................................................... 17
Figure 2.6. The average precipitate <d> (left) and N (right) for 7 steels in the ASM. ............ 18
Figure 2.7. APT f vs. bulk Ni (at.%) for the 9 ASM alloys listed in Table 2.4. ..................... 18
Figure 2.8. Solute maps for the ASM high Ni (3.5wt%) steels with low Mn (left, 0.25wt.%) and high Mn (right, 1.50wt.%). .................................................................................... 19
Figure 2.9. The APT f vs. the bulk Mn for the very high 3.5Ni, low Cu ASM steels. ........... 20
Figure 2.10. APT precipitate compositions for the ASM alloy matrix plotted on the Mn-Ni-Si ternary phase diagram. Each point represents data from a single APT tip. ................. 21
Figure 2.11. APT f as a function of measured bulk 2Ni+Cu from: a) conventional RPV steels at very high ATR-1 fluence condition (1.1x10²¹ n/cm2); and, b) ASM alloys with two different bulk Mn content (0.25% & 1.50% Mn) from ATR-2, in cup 8 (1.4x10²⁰ n/cm2). .......................................................................................................................... 22
Figure 2.12. SANS 45° scattering curves from a angle on the detector that are higher at intermediate q due to the precipitates. Note that there is less scattering in the irradiated low Cu, medium Ni steel (LG: left) compared to the high Cu, high Ni steel (LD: right). ................................................................................................................... 23
Figure 2.13. Manual vs. automated τy for various automated SPT offsets. ............................. 26
Figure 2.14. Baseline tensile σy vs. SPT τy for the ASM alloys. ............................................. 27
Figure 2.15. Measured manual vs. automated SPT Smax. ......................................................... 27
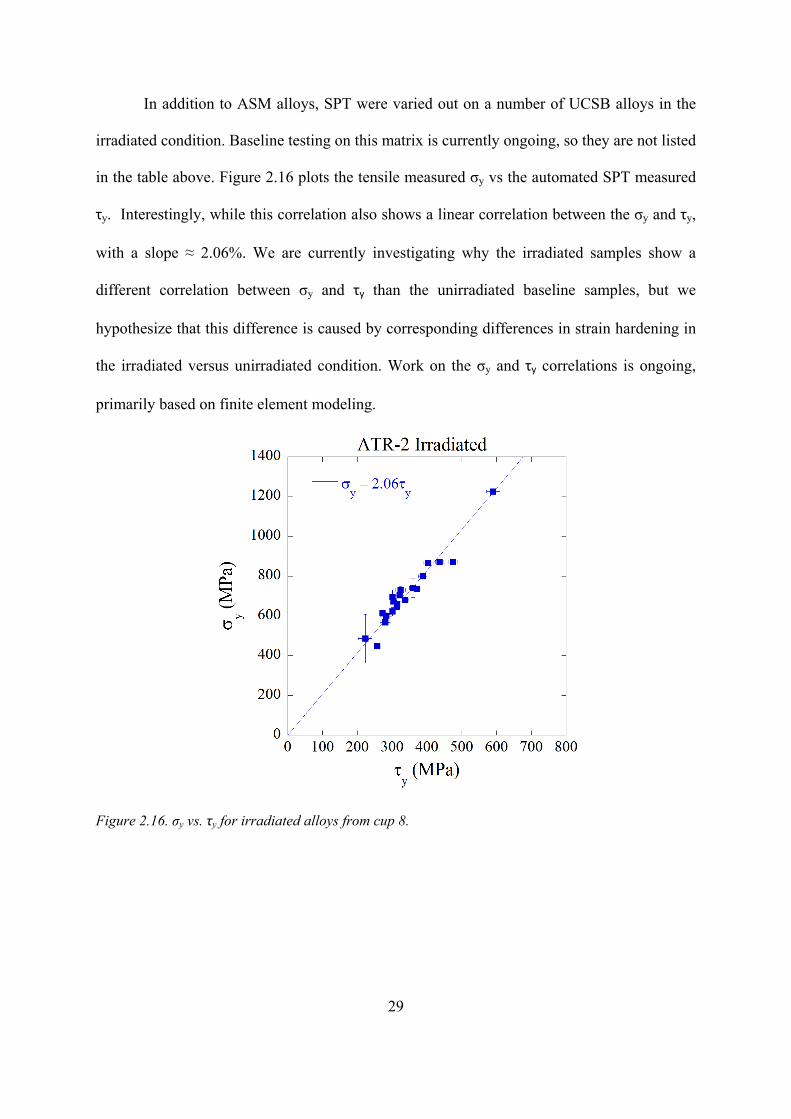
Figure 2.16. σy vs. τy for irradiated alloys from cup 8. ........................................................... 29

v
List of Tables
Table 1.1 Neutron flux, fluence (E > 1 MeV) and temperature for the various cups in the ATR-2 irradiation. .......................................................................................................... 2
Table 1.2 Composition of UCSB split melt steels included in the tensile matrix. .................... 3
Table 1.3 Composition (wt.%) of surveillance and program alloys. ......................................... 4
Table 1.4 Composition (wt.%) of Advanced Steel Matrix alloys. ............................................. 6
Table 1.5 Status of automated shear punch testing for cups 7 and 8. ...................................... 10
Table 2.1. APT bulk, matrix and precipitate compositions for 9 surveillance alloys and 3 program alloys in the cup 7 irradiated condition. ........................................................ 14
Table 2.2 APT precipitate <d>, N and f for 9 surveillance and 3 program alloys. .................. 14
Table 2.3 APT bulk, matrix and precipitate compositions for 9 ASM alloys in cup 8. ........... 15
Table 2.4 APT precipitate <d>, N and f for 9 ASM alloys in cup 8. ....................................... 16
Table 2.5 Small Angle Neutron Scattering precipitate <d>, N, f, and M/N for the measured UCSB alloys form cup 8. ............................................................................................. 24
Table 2.6 Small Angle Neutron Scattering precipitate <d>, N, f, and M/N for the measured surveillance alloys from cup 8. .................................................................................... 24
Table 2.7 Small Angle Neutron Scattering precipitate <d>, N, f, and M/N for the measured ASM alloys form cup 8. ............................................................................................... 25
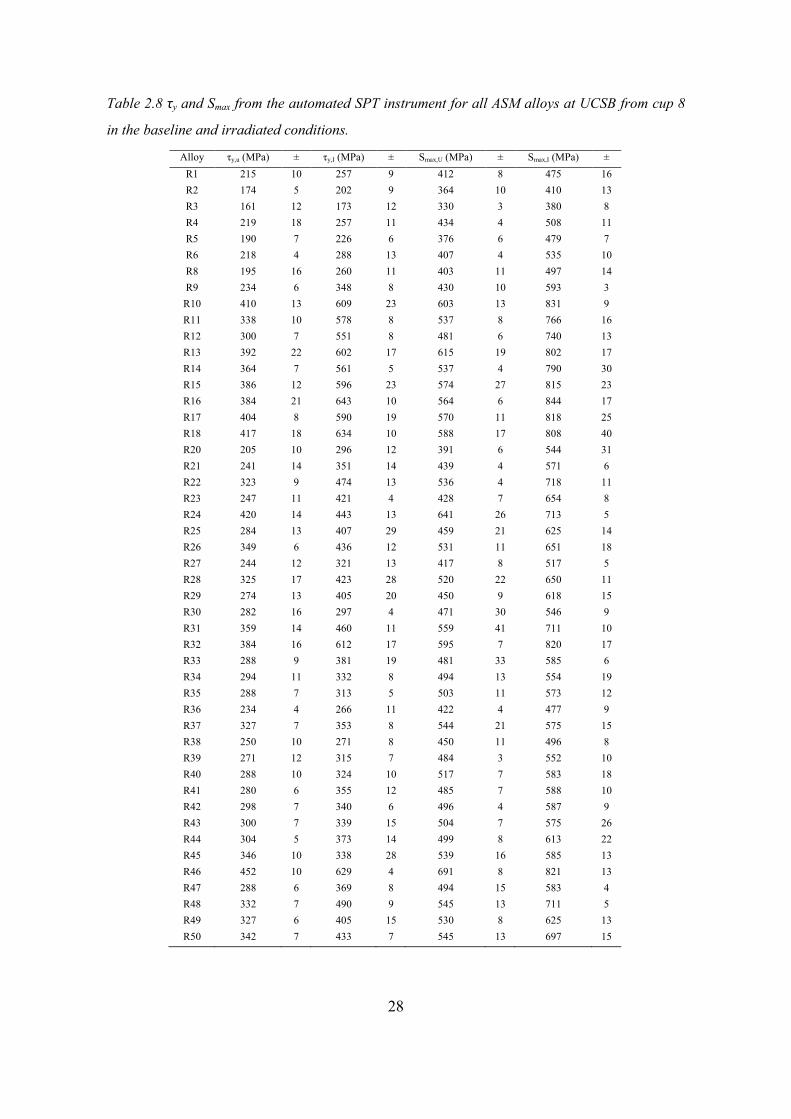
Table 2.8 τy and Smax from the automated SPT instrument for all ASM alloys at UCSB from cup 8 in the baseline and irradiated conditions. ........................................................... 28
Table 2.9 Microhardness data for ASM alloys tested at UCSB. The change in Vickers hardness due to irradiation at the ATR-2 condition was converted to shifts in yield stress. ............................................................................................................................ 30
vi
Acknowledgements
We wish to acknowledge many individuals who have contributed to this work. First
and foremost, the ATR-2 irradiation was made possible by the Nuclear Science User
Facilities and the outstanding team of scientists, engineers and managers at the Idaho
National Lab led by Michel Meyer, and including Michael Sprenger, Paul Murray, Joseph
Nielson, Collin Knight, Thomas Maddock, Dan Ogden, James Cole, Todd Allen and Rory
Kennedy. Other contributors include Keith Wilford and Tim Williams at Rolls Royce, Keith
Leonard and Phil Edmondson at Oak Ridge National Lab, William Server at ATI consulting,
Lynne Ecker and David Sprouster at Brookhaven National Lab, Timothy Hardin at EPRI,
Grace Burke and Raymond Stofanak at BMPC and Naoki Soneda at CRIEPI. Rolls Royce
provided the advanced steel matrix (ASM) for this experiment. The National Institute of
Standards and Technology (NIST) provided the neutron research facilities to conduct the
SANS studies and John Barker has contributed significantly in helping conduct these
experiments. We would also like to acknowledge the Center for Advanced Energy Studies
(CAES) Microscopy and Characterization Suite (MaCS) where the sample preparation for
Atom Probe Tomography was completed, including Jatu Burns, Allyssa Bateman, and Joanna
Taylor who significantly contributed to this process. Many other individuals at UCSB also
contributed most notably Doug Klingensmith, Nicholas Cunningham and Yuan Wu. The
work was financially supported by DOE through the NSUF, NEUP and LWRS Program (via
ORNL).
vii
Executive Summary
The UCSB ATR-2 irradiation experiment is designed to generate a new database on a
wide variety of irradiated reactor pressure vessel (RPV) steels to fill a critical gap in
predicting high fluence embrittlement for extended plant operation up to 80 years. The
resulting database will serve as a foundation for the development of a physically based
predictive model, that will address contribution to embrittlement from so-called, “late
blooming” Mn-Ni-Si precipitate (MNSP) phases, which are not included in current regulatory
models. Thus a major focus in this experiment is to characterize the effects of irradiation
temperature, neutron flux and fluence, and alloy chemistry on MNSP evolution, and model
how these features impact hardening and embrittlement, manifested as shifts in ductile-to-
brittle transition temperature.
This report details the progress that has been made since July 1, 2016 in the UCSB
ATR-2 post irradiation examination (PIE) program. A few highlights include:
• Atom probe tomography (APT) has been carried out on a number of surveillance
steels, as well as a subset of alloys from the advanced steel matrix (ASM). These
studies show that large volume fractions (f) of MNSPs can form even in low Cu steels
at the high ATR fluence of ≈ 1.4x10²⁰ n/cm2 and 290°C.
• The square root of MNSP f (√f) correlates well with the increases in yield stress (∆σy)
with a relation that is well understood and modeled. This is illustrated in Figure 1
below for a large √f-∆σy database that UCSB has assembled including the ATR-2
results. Likewise, empirically validated physical models can relate the ∆σy to shifts in
the ductile to brittle fracture temperature (∆T).
• The APT results show that the alloy Ni content plays a strong role in mediating the
MNSP f as a function of neutron fluence.
viii
• However at the ATR-2 fluence, which falls short of that needed for full precipitation,
Cu also has a strong influence on f.
• The Advanced Steel Matrix (ASM) is intended to explore the possibility of
developing higher Ni (3.5%) pressure vessel steels that have a number of attractive
attributes, like higher unirradiated strength and toughness than conventional RPV
steels. However, as noted above, in conventional steels f increases with Ni and, in Cu
bearing steels, in some proportion to 2Ni + Cu. APT confirms the fact that an
extremely high MNSP f form in 3.5% Ni advanced steels, but f decreases linearly
with the alloy Mn content. This is due to the fact that precipitating a Ni atom requires
approximately 1 (Si + Mn) atom to form MNSPs. Thus if the alloy is “Mn starved,”
more Ni stays in solution.
• A large number of Small Angle Neutron Scattering (SANS) and Small Angle X-ray
Scattering (SAXS) measurements have also been carried out on the ATR-2 alloys. In
conventional RPV steels, the MNSPs have SANS magnetic-to-nuclear scattering
ratios (M/N) that are very similar to what would be expected for either the G or Γ2
phases. In this case there is generally a reasonably good agreement between APT,
SANS and SAXS f.
• However for alloys in the ASM that have low Mn contents, the precipitates have very
high SANS M/N, which is consistent with the Ni3Si phase as compositionally
observed in APT. Thus the assumption of G or Γ2 breaks down for both SANS and
SAXS. Thus work is ongoing to allow a wider range of phase selection and to better
quantify f by incorporating the actual APT measured precipitate compositions and
combining SANS and SAXS measurements.

ix
• Automated shear punch testing (SPT) has been completed on almost all alloys at
UCSB. For the baseline condition, the automated SPT data correlates well with
unirradiated tensile data, for example, with normal yield stress σy = 1.78τy, where τy is
the shear yield stress. The corresponding correlation for the irradiated condition is σy
= 2.06τy. This difference between the baseline and ATR-2 condition is thought to be
due to the reduction in strain hardening caused by irradiation. SPT tests have been
carried out on essentially all of the ATR-2 alloys at UCSB to estimate ∆σy. All alloys
provided to UCSB by ORNL will be subject to SPT in the future.
• Vickers microhardness measurements (µHv) have also been carried out on all paired
unirradiated and ATR-2 irradiated alloys at UCSB.
Ongoing work includes comparing multiple techniques and optimizing ways to use
data from different mechanical property testing and microstructural characterization
techniques. Finally, a major focus of work through the rest of this fiscal year will be on
completing SPT measurements on high fluence 290°C UCSB alloys and a large number
of alloys in lower temperature (250 and 270°C) cups.
Figure 1 Δσy vs √f for the UCSB irradiated RPV steel database

1
1. Introduction
Here we describe continuation of work that was last summarized in “Update on the
ATR–2 Reactor Pressure Vessel Steel High Fluence Irradiation Project,” submitted on June
30, 2016 [1]. This report covers activities related to the ATR–2 irradiation experiment at the
University of California, Santa Barbara for the period from July 1, 2016 to March 31, 2017.
While the ultimate goal of this research is to create a new embrittlement prediction model for
reactor pressure vessel (RPV) steels at high fluence and low flux, the focus to date has been
on completing post irradiation examination (PIE) on the wide variety of RPV alloys included
in the ATR-2 experiment. The major objective is to understand and model Cu-rich (CRPs)
and especially MnNiSi-rich (MNSPs) precipitates, which form at high fluence, where the
latter may cause significant unanticipated embrittlement that is currently unaccounted for in
regulatory models.
1.1 Irradiation Conditions
The UCSB ATR-2 experiment reached a peak fluence of ≈ 1.4x10²⁰ n/cm2, which is
about 40% higher than what most in service reactor pressure vessel (RPV) steels will reach at
an 80 year extended life. In addition, four other capsules reached a peak fluence ranging from
5.1x10¹⁹ to 9.1x10¹⁹ n/cm2. These capsules will be used to directly compare data from this
experiment to lower fluence data, including what may be available in surveillance programs.
The specimens were irradiated at four nominal temperatures: 250, 270, 290 and 310°C. The ≈
109 cm long test train consisted of an assembly of concentric tubes, with an inner tube
containing 13 thin-walled (0.125 mm) specimen cups.
The average flux, fluence and irradiation temperature (target and as run) for each cup
are given in Table 1.1. Except for the two bottom and two top cups, the as-run temperatures
2
were very close to their target values. Details regarding determining the flux and temperature
profiles in ATR-2 can be found in the INL as-run reports [2, 3].
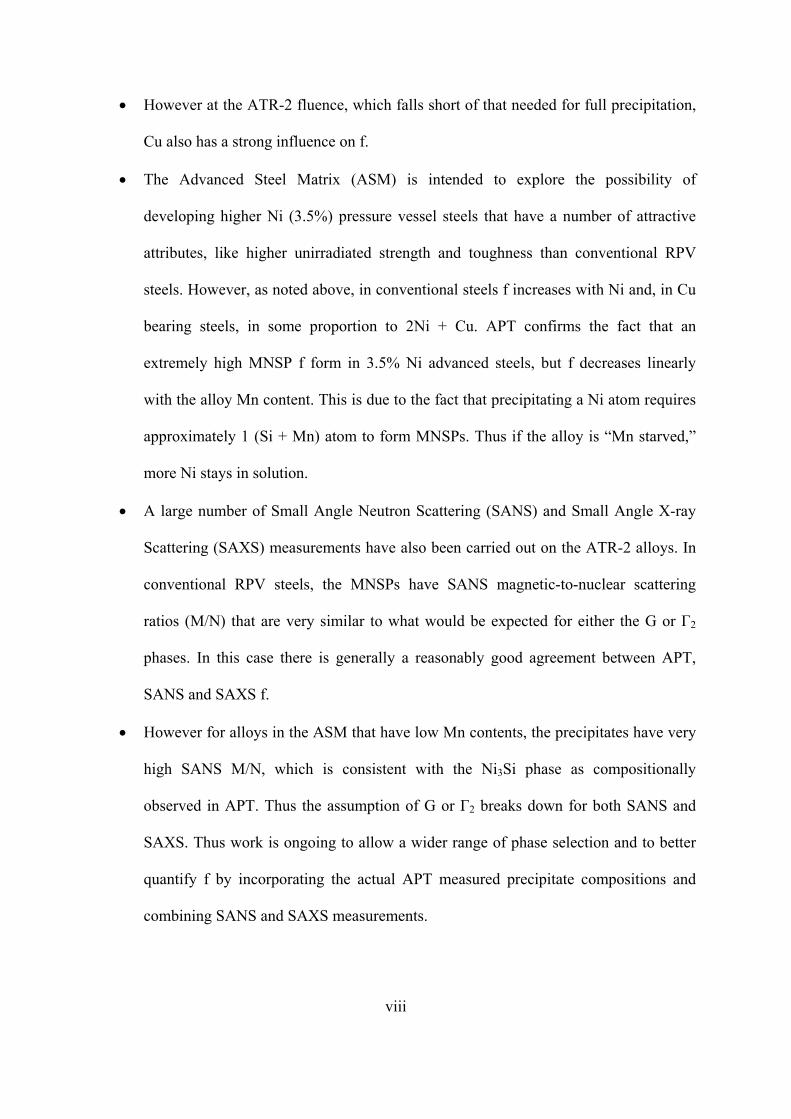
To date the focus of all testing has been on samples from cups 7 and 8, which were at
the highest fluence ≈ 13.8x10¹⁹ n/cm2 and 292°C.
Table 1.1 Neutron flux, fluence (E > 1 MeV) and temperature for the various cups in the ATR-2
irradiation.
Cup Flux (1012 n/cm2-s) Fluence (1019 n/cm2) Target Tirr (°C) Actual Tirr (°C) 1 1.34 5.11 290 247 2 1.94 7.43 290 268 3 2.54 10.35 290 280 4 3.13 11.90 270 268 5 3.36 12.80 250 255 6 3.58 13.70 290 285 7 3.64 13.90 290 291 8 3.60 13.70 290 293 9 3.47 13.20 290 293
10 3.21 12.30 310 319 11 2.89 11.05 290 292 12 2.17 9.08 290 264 13 1.52 5.79 290 238
1.2 RPV Steel Matrices
A number of different RPV steel matrices were included in the ATR-2 experiment,
each with its own purpose. The sections below give a brief overview of a subset of these
matrices, which were a focus of PIE over the past 9 months. This report almost entirely deals
with PIE on disc multipurpose coupon specimens (DMC).
1.2.1 UCSB Matrix
The UCSB matrix includes 34 split-melt steels (SMS) with systematic variations in
Cu, Ni and Mn contents to investigate the individual and combined effects of these solutes.
The SMS were processed and have microstructures and properties that are typical of A-533B
steels used for RPVs. The SMS include the L and CM series, based on their supplier. The L

3
and CM series are similar, but the CMs have a slightly larger base Mn content and a wider
range of Ni. The compositions of the UCSB SMS alloys are shown in Table 1.2. In addition
to the SMS, 11 simple model ferritic alloys variously containing only Cu, Ni, Mn, Si and Mo
were also included in the experiment, though have not been examined.
Table 1.2 Composition of UCSB split melt steels included in the tensile matrix.
Alloy Code Cu% Ni% Mn% Cr% Mo% P% C% S% Si% Fe% LA 0.40 0.00 1.37 0.06 0.54 0.005 0.14 0.005 0.22 97.26 LB 0.40 0.18 1.35 0.06 0.53 0.005 0.16 0.005 0.22 97.10 LC 0.41 0.86 1.44 0.06 0.55 0.005 0.14 0.008 0.23 96.30 LP 0.41 0.86 1.44 0.06 0.55 0.005 0.14 0.008 0.23 96.30 LD 0.38 1.25 1.38 0.070 0.53 0.005 0.19 0.015 0.23 96.02 LK 0.80 0.81 1.13 0.05 0.56 0.005 0.13 0.005 0.13 96.39 LJ 0.42 0.81 1.34 0.05 0.56 0.005 0.13 0.005 0.13 96.56 LG 0.01 0.74 1.37 0.05 0.55 0.005 0.16 0.005 0.22 96.90 LH 0.11 0.74 1.39 0.09 0.55 0.005 0.16 0.005 0.24 96.72 LI 0.20 0.74 1.37 0.09 0.55 0.005 0.16 0.005 0.24 96.65 LO 0.41 0.86 1.44 0.06 0.55 0.005 0.14 0.008 0.23 96.30 C1 0.01 0.01 1.67 0.04 0.56 0.003 0.13 0.004 0.15 97.42 C2 0.01 0.01 1.65 0.04 0.56 0.041 0.14 0.004 0.16 97.39 C3 0.02 0.85 1.60 0.00 0.49 0.006 0.13 0.000 0.16 96.74 C4 0.02 0.86 1.53 0.05 0.55 0.031 0.16 0.003 0.16 96.64 C5 0.02 0.86 1.61 0.04 0.53 0.050 0.15 0.000 0.16 96.58 C6 0.02 1.68 1.50 0.05 0.54 0.007 0.15 0.003 0.17 95.88 C7 0.00 1.70 1.55 0.05 0.56 0.047 0.16 0.003 0.17 95.76 C8 0.01 0.86 0.01 0.04 0.55 0.004 0.13 0.002 0.14 98.25 C9 0.01 0.86 0.85 0.04 0.55 0.003 0.15 0.003 0.15 97.38
C10 0.02 0.88 1.66 0.05 0.53 0.008 0.16 0.004 0.17 96.52 C11 0.34 0.85 1.64 0.02 0.53 0.006 0.15 0.003 0.18 96.28 C12 0.86 0.84 1.65 0.02 0.51 0.006 0.15 0.003 0.17 95.79 C13 0.11 0.83 1.61 0.00 0.51 0.004 0.15 0.000 0.16 96.63 C14 0.11 0.83 1.62 0.00 0.52 0.040 0.16 0.000 0.17 96.55 C15 0.22 0.02 1.59 0.02 0.58 0.002 0.14 0.003 0.15 97.28 C16 0.22 0.82 1.58 0.00 0.51 0.004 0.16 0.000 0.25 96.46 C17 0.22 1.59 1.54 0.00 0.50 0.004 0.16 0.000 0.25 95.74 C18 0.43 0.02 1.70 0.02 0.56 0.002 0.14 0.003 0.15 96.98 C19 0.42 0.85 1.63 0.01 0.51 0.005 0.16 0.003 0.16 96.25 C20 0.43 1.69 1.63 0.02 0.50 0.006 0.16 0.003 0.16 95.40 C21 0.42 0.84 0.01 0.02 0.58 0.002 0.14 0.003 0.14 97.85 C22 0.42 0.84 0.84 0.02 0.56 0.002 0.14 0.003 0.14 97.04 C31 0.01 0.80 1.65 0.05 0.51 0.006 0.16 0.003 0.17 96.64

4
1.2.2 Surveillance and Program Alloy Matrix
Nine surveillance alloys were procured specifically for the ATR-2 experiment. In
addition, eleven other archival surveillance alloys, which had mostly been previously studied
by UCSB in the Irradiation Variables Program (IVAR), were also included. While flux
effects have been extensively studied for many years, they are still not fully understood.
Thus, the surveillance alloys will allow for direct comparison of results from the ATR-2
intermediate-flux test reactor irradiation with those from the much lower flux surveillance
irradiations. The compositions of the surveillance alloys are given in Table 1.3. Note the 9
new surveillance alloys are not identified by the plant specific vessel code.
Table 1.3 Composition (wt.%) of surveillance and program alloys.
*Procured by ORNL and ATI Consulting **Program alloy
Alloy Cu% Ni% Mn% Cr% Mo% P% C% S% Si% Fe% SB1* 0.20 0.60 1.33 0.11 0.49 0.005 0.22 0.016 0.23 96.82 SB2* 0.06 0.75 0.79 0.35 0.58 0.010 0.20 0.009 0.28 96.97 SB3* 0.05 0.56 1.32 0.08 0.59 0.010 0.24 0.016 0.24 96.89 SW1* 0.14 0.19 1.06 0.06 0.50 0.016 0.13 0.009 0.27 95.90 SW2* 0.36 0.78 1.42 0.04 0.49 0.013 0.18 0.011 0.18 96.54 SW3* 0.22 0.72 1.37 0.09 0.48 0.016 0.12 0.011 0.20 96.77 SW4* 0.03 0.90 0.94 0.03 0.23 0.004 0.14 0.014 0.32 97.39 SW5* 0.04 0.95 1.41 0.13 0.48 0.009 0.09 0.009 0.45 96.44 SW6* 0.29 0.60 1.44 0.14 0.36 0.014 0.10 0.011 0.50 96.55 QC1 0.24 0.54 1.70 0.06 0.43 0.014 0.09 0.016 0.56 96.35 QC2 0.24 0.56 1.68 0.07 0.40 0.014 0.09 0.016 0.55 96.38 D3 0.28 0.63 1.59 0.08 0.43 0.011 0.09 0.015 0.51 96.36 HB 0.22 0.07 1.37 0.16 0.46 0.014 0.13 0.016 0.29 97.27 MP 0.19 1.02 1.30 0.05 0.51 0.017 0.11 0.015 0.18 96.61 TW 0.15 0.08 1.61 0.15 0.49 0.019 0.12 0.014 0.28 97.09 WA 0.21 0.63 1.69 0.14 0.40 0.014 0.08 0.013 0.45 96.37 WB 0.28 0.69 1.63 0.10 0.40 0.018 0.09 0.009 0.54 96.52 WC 0.06 0.62 1.30 0.08 0.31 0.009 0.08 0.010 0.37 97.22 W62 0.23 0.60 1.61 0.12 0.39 0.016 0.08 0.007 0.59 96.59 W63 0.3 0.69 1.65 0.10 0.43 0.016 0.10 0.011 0.63 96.37 W65 0.22 0.60 1.45 0.09 0.39 0.015 0.08 0.015 0.48 96.88 W67 0.18 0.61 1.27 0.14 0.43 0.009 0.10 0.009 0.50 97.99 EC** 0.35 0.60 1.30 0.04 0.44 0.005 0.16 0.009 0.17 96.93 ED** 0.40 0.60 1.36 0.04 0.44 0.006 0.12 0.013 0.51 96.51 FE** 0.01 1.69 1.30 0.02 0.51 0.009 0.21 0.006 0.20 96.05

5
1.2.3 Advanced Steel Matrix (ASM)
RPV steels in US light water reactors (LWR) have typical alloy compositions (wt.%)
ranging from ≈ .02 to 0.4Cu, 0.2 to 1.0Ni, 1.0 to 1.8 Mn, and 0.1 to 0.5 Si. Rolls Royce (RR)
supplied a new advanced steel matrix (ASM) to the ATR-2 experiment with a much wider
range of solute contents than in typical US RPV steels. The purpose of this matrix is twofold.
First, the wide range of compositions in these alloys will improve the understanding of the
synergistic relationships among the various solutes. Second, this matrix will assist in the
development of new alloys for future light water reactors. High Ni steels have a number of
attractive attributes, like higher unirradiated strength and toughness than conventional RPV
steels, but are potentially more susceptible to irradiation embrittlement due to the strong
correlation between alloy Ni content and MNSP formation. The key question is whether this
effect will still be observed if the alloy Mn and/or Si are significantly reduced. Figure 1.1
shows the ranges of compositions explored in previous UCSB irradiations (blue box) and the
ATR-2 irradiation (red box) due to the addition of the ASM (blue points).
Figure 1.1. Range of Mn and Ni contents for all ASM alloys with 0.20 wt.% Si (blue dots), along
with boxes showing the range of compositions explored in previous UCSB irradiations (blue box)
and the in ATR-2 irradiation (red box).

6
Table 1.4 Composition (wt.%) of Advanced Steel Matrix alloys.
Alloy Cu% Ni% Mn% Cr% Mo% P% C% Si% Fe% R1 0.06 0.30 0.26 0.10 0.49 0.005 0.21 0.21 98.37 R2 0.06 0.27 0.25 0.11 0.49 0.006 0.15 0.20 98.46 R3 0.06 0.27 0.25 0.10 0.52 0.004 0.07 0.20 98.53 R4 0.06 0.26 0.26 0.11 0.53 0.006 0.20 0.62 97.95 R5 0.06 0.27 0.25 0.10 0.52 0.005 0.20 0.05 98.55 R6 0.20 0.25 0.26 0.10 0.52 0.006 0.20 0.22 98.24 R7 0.58 0.25 0.25 0.10 0.53 0.005 0.23 0.20 97.86 R8 0.06 0.25 0.26 0.10 0.52 0.035 0.21 0.20 98.37 R9 0.58 0.25 0.26 0.10 0.52 0.033 0.21 0.21 97.84 R10 0.06 3.53 1.47 0.10 0.48 0.008 0.27 0.22 93.86 R11 0.06 3.49 1.46 0.10 0.52 0.005 0.16 0.20 94.01 R12 0.06 3.51 1.44 0.10 0.52 0.005 0.05 0.20 94.12 R13 0.07 3.49 1.48 0.10 0.52 0.005 0.23 0.63 93.48 R14 0.06 3.44 1.48 0.10 0.52 0.006 0.22 0.03 94.14 R15 0.31 3.47 1.48 0.10 0.52 0.008 0.21 0.20 93.70 R16 0.60 3.46 1.50 0.10 0.52 0.004 0.22 0.20 93.40 R17 0.06 3.45 1.51 0.10 0.50 0.029 0.23 0.20 93.92 R18 0.59 3.44 1.50 0.10 0.50 0.029 0.21 0.20 93.43 R19 0.06 1.66 0.26 0.13 0.52 0.008 0.23 0.20 96.93 R20 0.06 1.66 0.26 0.10 0.52 0.005 0.07 0.20 97.13 R21 0.06 1.66 0.26 0.10 0.52 0.005 0.23 0.05 97.12 R22 0.06 1.68 1.50 0.10 0.52 0.006 0.29 0.21 95.63 R23 0.06 1.66 1.48 0.10 0.50 0.006 0.06 0.21 95.92 R24 0.06 1.71 1.51 0.10 0.50 0.005 0.26 0.59 95.27 R25 0.06 1.68 1.50 0.10 0.50 0.004 0.05 0.63 95.48 R26 0.05 3.48 0.25 0.10 0.52 0.009 0.26 0.19 95.14 R27 0.06 3.43 0.24 0.10 0.52 0.003 0.06 0.20 95.39 R28 0.06 3.47 0.25 0.10 0.52 0.006 0.27 0.62 94.70 R29 0.06 3.48 0.26 0.10 0.52 0.004 0.05 0.62 94.91 R30 0.06 0.21 2.02 0.10 0.52 0.004 0.19 0.20 96.70 R31 0.06 1.67 2.02 0.10 0.53 0.005 0.21 0.20 95.21 R32 0.06 3.53 2.06 0.13 0.53 0.010 0.22 0.23 93.23 R33 0.06 3.45 0.16 0.10 0.52 0.005 0.22 0.20 95.29 R34 0.07 3.44 0.08 0.09 0.52 0.006 0.22 0.19 95.38 R35 0.06 0.23 1.50 0.11 0.49 0.007 0.27 0.21 97.12 R36 0.06 0.23 1.50 0.11 0.49 0.007 0.27 0.21 97.12 R37 0.06 0.21 1.48 0.10 0.52 0.005 0.06 0.21 97.36 R38 0.06 0.21 1.49 0.10 0.52 0.007 0.27 0.62 96.72 R39 0.06 0.21 1.48 0.10 0.52 0.003 0.05 0.59 96.99 R40 0.04 0.70 1.46 0.11 0.49 0.004 0.21 0.21 96.78 R41 0.12 0.69 1.52 0.10 0.52 0.005 0.20 0.20 96.65 R42 0.04 0.69 1.50 0.10 0.52 0.015 0.20 0.21 96.73 R43 0.08 0.68 1.48 0.10 0.52 0.017 0.23 0.19 96.70 R44 0.13 0.69 1.51 0.10 0.52 0.021 0.21 0.21 96.61 R45 0.06 0.26 0.27 2.28 0.52 0.003 0.21 0.20 96.20 R46 0.06 3.46 1.45 2.34 0.52 0.006 0.21 0.20 91.75 R47 0.06 1.68 0.76 0.10 0.50 0.005 0.28 0.21 96.41 R48 0.07 3.49 0.76 0.10 0.50 0.003 0.28 0.21 94.59 R49 0.06 1.67 0.51 1.21 0.50 0.005 0.22 0.20 95.63 R50 0.06 1.68 0.51 2.32 0.51 0.003 0.23 0.20 94.49
7
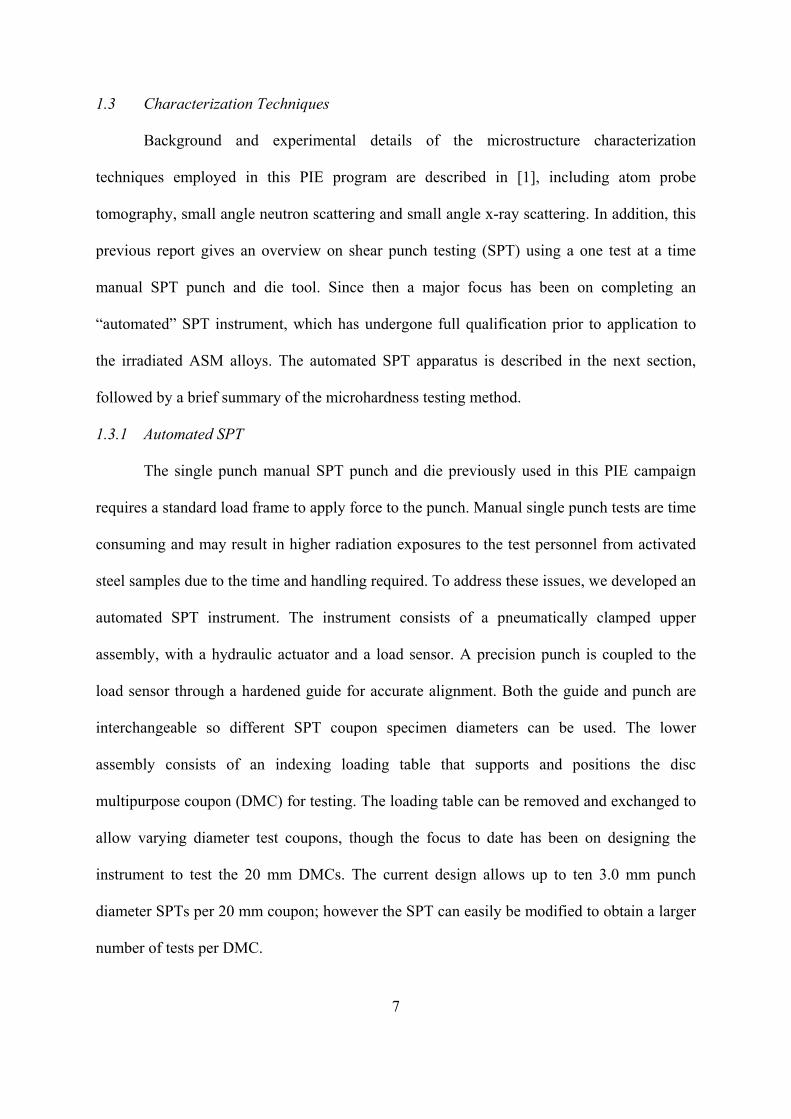
1.3 Characterization Techniques
Background and experimental details of the microstructure characterization
techniques employed in this PIE program are described in [1], including atom probe
tomography, small angle neutron scattering and small angle x-ray scattering. In addition, this
previous report gives an overview on shear punch testing (SPT) using a one test at a time
manual SPT punch and die tool. Since then a major focus has been on completing an
“automated” SPT instrument, which has undergone full qualification prior to application to
the irradiated ASM alloys. The automated SPT apparatus is described in the next section,
followed by a brief summary of the microhardness testing method.
1.3.1 Automated SPT
The single punch manual SPT punch and die previously used in this PIE campaign
requires a standard load frame to apply force to the punch. Manual single punch tests are time
consuming and may result in higher radiation exposures to the test personnel from activated
steel samples due to the time and handling required. To address these issues, we developed an
automated SPT instrument. The instrument consists of a pneumatically clamped upper
assembly, with a hydraulic actuator and a load sensor. A precision punch is coupled to the
load sensor through a hardened guide for accurate alignment. Both the guide and punch are
interchangeable so different SPT coupon specimen diameters can be used. The lower
assembly consists of an indexing loading table that supports and positions the disc
multipurpose coupon (DMC) for testing. The loading table can be removed and exchanged to
allow varying diameter test coupons, though the focus to date has been on designing the
instrument to test the 20 mm DMCs. The current design allows up to ten 3.0 mm punch
diameter SPTs per 20 mm coupon; however the SPT can easily be modified to obtain a larger
number of tests per DMC.

8
A precision die placed under the test specimen that is exactly matched to the punch
for optimal clearance. A spring-loaded follower contacts the bottom face of the test
specimens and tracks the corresponding deflection throughout the punching process. The load
cell and deflection sensor provide the load-displacement data to compute shear stress and
strain. The SPT tool is computer-controlled (clamping, load actuation and digital data
acquisition).
The main benefit of the automated instrument, shown in Figure 1.2, is a much higher
testing throughput relative to the single punch manual fixture. Another advantage is that the
automated SPT instrument is self-contained, occupying a relatively small footprint, and does
not require a load frame. Further, automated SPT reduces radiation exposures. Testing on the
entire Advanced Steel Matrix in the baseline condition has recently been completed to
determine the “optimal” offset to use when determining the shear yield, as discussed further
section 2.3. The results from the automated SPT instrument and data reduction procedure
compare very favorably with the previous manual tester.
Figure 1.2. The automated SPT instrument.

9
1.3.2 Microhardness Testing
Vickers microhardness (μHv) testing was carried out at UCSB on the ASM matrix. All
µHv measurements were performed on a LECO 400 series microhardness tester with digitized
image analysis. A square-base diamond-pyramid indenter was used with a 500g load and a 10
second dwell time. Both diagonal lengths of the indents were measured and the average value
of the two was used to determine the microhardness. Prior to each test series the system is
recalibrated/validated by measuring five indents on a certified hardness calibration block.
Changes in μHv were used to estimate the corresponding changes in yield stress (∆σy) based
on a nominal relation, Δσy (MPa) = 3.33*ΔµHv (kg/mm2).
Seven 3 mm discs were loaded into multi-specimen holders and polished using 600
and 1200 grit followed by fine polishing on a vibromet with 0.3 μm alumina in an ethelyne
glycol solution to produce a mirror surface finish. Ten automated indents were made on each
3 mm disc. The spacing between indents was at minimum 2.5 times the indent diagonal, in
order to avoid the previously plastically deformed region. The indents diameters were read
off a digital image with a camera coupled to a 40x viewing scope. If the difference between
two indent diagonal lengths was greater than 5.0%, the data was discarded. The average and
standard deviation for the indents were calculated for each alloy/condition and the standard
error was determined by S.E. = S.D./√n. The S.E. was used as the uncertainty for the
measurement of a given condition. The uncertainty for the ΔμHv was determined using a root-
sum-square of the uncertainties from both the baseline and irradiated conditions.
1.4 Status of Characterization and Testing
The progress made since the previous report [1] is described in the following two
sections.
10
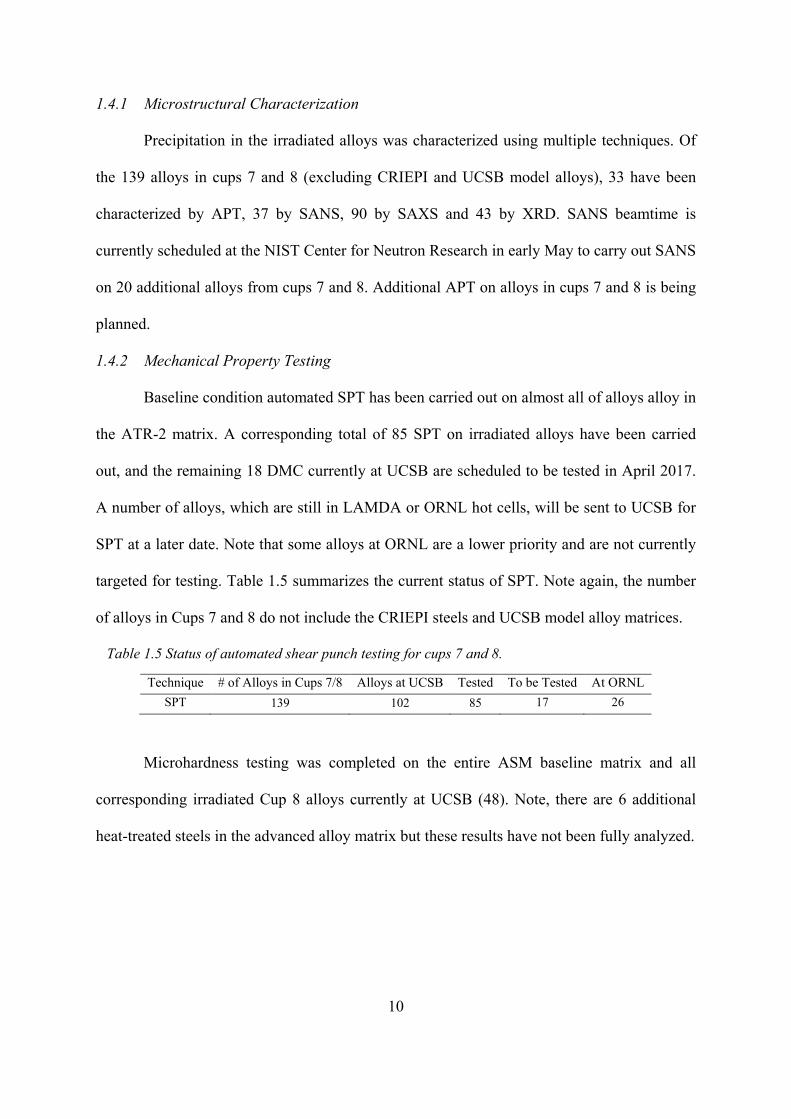
1.4.1 Microstructural Characterization
Precipitation in the irradiated alloys was characterized using multiple techniques. Of
the 139 alloys in cups 7 and 8 (excluding CRIEPI and UCSB model alloys), 33 have been
characterized by APT, 37 by SANS, 90 by SAXS and 43 by XRD. SANS beamtime is
currently scheduled at the NIST Center for Neutron Research in early May to carry out SANS
on 20 additional alloys from cups 7 and 8. Additional APT on alloys in cups 7 and 8 is being
planned.
1.4.2 Mechanical Property Testing
Baseline condition automated SPT has been carried out on almost all of alloys alloy in
the ATR-2 matrix. A corresponding total of 85 SPT on irradiated alloys have been carried
out, and the remaining 18 DMC currently at UCSB are scheduled to be tested in April 2017.
A number of alloys, which are still in LAMDA or ORNL hot cells, will be sent to UCSB for
SPT at a later date. Note that some alloys at ORNL are a lower priority and are not currently
targeted for testing. Table 1.5 summarizes the current status of SPT. Note again, the number
of alloys in Cups 7 and 8 do not include the CRIEPI steels and UCSB model alloy matrices.
Table 1.5 Status of automated shear punch testing for cups 7 and 8.
Technique # of Alloys in Cups 7/8 Alloys at UCSB Tested To be Tested At ORNL SPT 139 102 85 17 26
Microhardness testing was completed on the entire ASM baseline matrix and all
corresponding irradiated Cup 8 alloys currently at UCSB (48). Note, there are 6 additional
heat-treated steels in the advanced alloy matrix but these results have not been fully analyzed.
11
2. Results and Preliminary Analysis
2.1 Atom Probe Tomography
This section focuses on the results and analysis of microstructural characterization of
a subset of the alloys in cups 7 and 8. During this period we focused on the effect of Ni and
Mn on precipitation in the ASM alloys and also on characterizing the surveillance steels,
including the 9 new welds and base metals. A few program alloys were also characterized.
Ultimately this microstructural data will allow us to characterize the effect of a wide range of
flux, fluence and alloy composition on the volume fraction (f), number density (N), average
size (<d>), composition and character of precipitates. We also compare the results of SANS
and APT measurements.
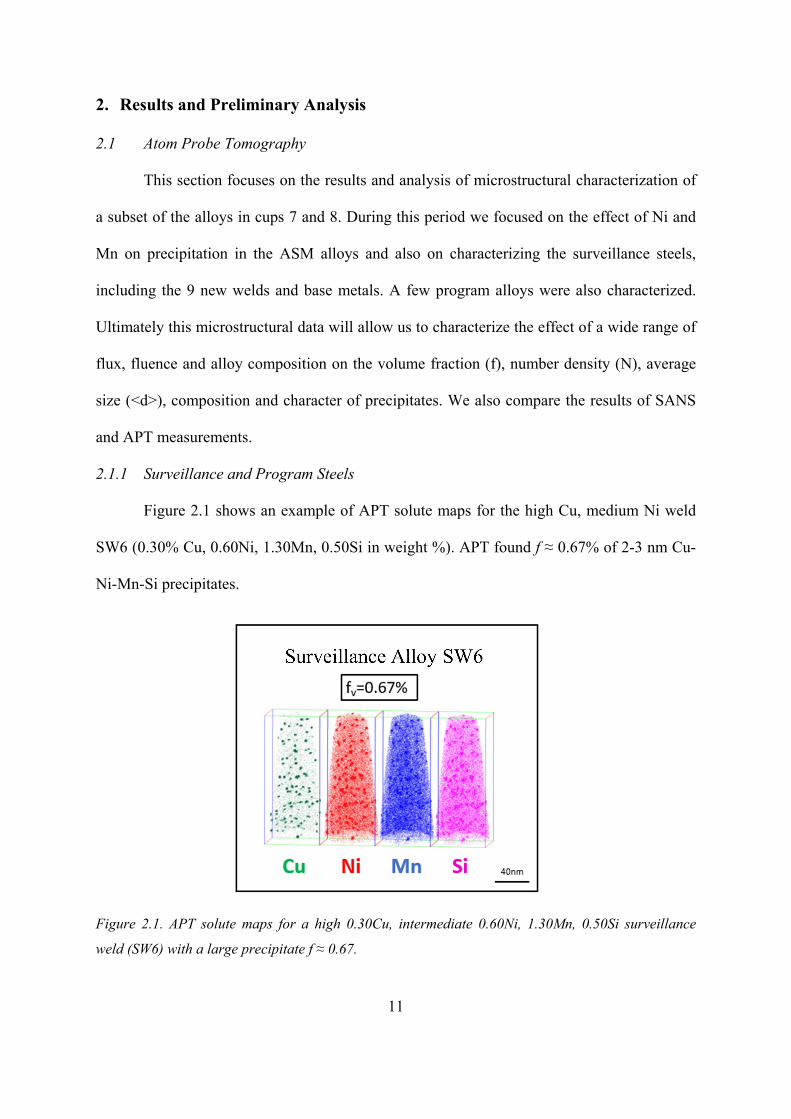
2.1.1 Surveillance and Program Steels
Figure 2.1 shows an example of APT solute maps for the high Cu, medium Ni weld
SW6 (0.30% Cu, 0.60Ni, 1.30Mn, 0.50Si in weight %). APT found f ≈ 0.67% of 2-3 nm Cu-
Ni-Mn-Si precipitates.
Figure 2.1. APT solute maps for a high 0.30Cu, intermediate 0.60Ni, 1.30Mn, 0.50Si surveillance
weld (SW6) with a large precipitate f ≈ 0.67.

12
Figure 2.2 shows solute maps and f for the program alloy FE with 0.01% Cu, 1.70%
Ni, 1.30% Mn, 0.20% Si demonstrating that MNSPs form even in the absence of a significant
amount of Cu at high fluence, especially at high Ni.
Figure 2.2. APT solute maps for an irradiated low 0.01Cu, high 1.70Ni, 1.30Mn, 0.20Si program
plate (FE) with f ≈ 0.49%
Ongoing APT analysis includes the mapping of precipitate size distributions,
quantifying segregation of Cu-Ni-Mn-Si-P and examining precipitate nucleation on
dislocations and loops that are made visible by their solute atmospheres. For example, Figure
2.3 shows APT solute maps of Mn-Ni-Si in a low (0.04% Cu), medium-high (0.95% Ni)
surveillance weld, SW5. Segregation of the solutes, especially Si, to what appears to be a
helical dislocation and perhaps another dislocation segment are obvious. Precipitates form in
the segregated regions. These associations are more clearly shown by the 4% Si
isoconcentration surfaces. The compositions of the precipitates on dislocations are similar to
those in the matrix. A general observation is that MNSPs in low Cu and medium Ni steels
predominantly heterogeneously nucleate on dislocations, loops and grain boundaries. Indeed,
matrix MNSP may nucleate on small loops and envelope them during growth. Future work

13
includes S/TEM mapping of precipitate-dislocation interactions, as well as measuring
dislocation loop densities and quantifying solute segregation at various microstructural
features. These results will inform the advanced thermo-kinetic models of MNSP
precipitation being developed in our collaboration with Professor Dane Morgan’s group at the
University of Wisconsin.
Figure 2.3. APT solute maps for an irradiated low 0.04Cu, medium-high 0.95Ni, 1.40Mn, 0.45Si
surveillance weld (SW5) showing solute segregation and precipitation on dislocations with f ≈ 0.26%.
A summary of APT compositions for the 9 new surveillance and 3 program alloys is
shown in Table 2.1. This table shows that all alloys with bulk Cu > 0.15 at.% form
precipitates rich in Cu (15-35% Cu) and deplete the matrix Cu to ≈ 0.06-0.07%. This is
consistent with previous studies that show that well defined Cu precipitates (CRPs) will form
only at Cu levels ≥ 0.07% [4]. Though CRPs may not form, Cu still has a catalyzing effect
for formation of MNSPs even at levels < 0.07%. Table 2.2 shows the precipitate <d>, N and f
for the surveillance alloys. Figure 2.4 shows the APT f as a function of the alloy bulk Cu
content for the surveillance and program alloys. Increased Cu leads to significantly increased
precipitate f at typical Ni contents of 0.5 – 1.0 at.%, but this effect is decreases at lower Ni
contents (0 – 0.49 at.%).
14
Table 2.1. APT bulk, matrix and precipitate compositions for 9 surveillance alloys and 3 program
alloys in the cup 7 irradiated condition.
Alloy Bulk Matrix Precipitate
Cu Ni Mn Si Cu Ni Mn Si Cu Ni Mn Si
SW1 0.15 0.13 0.86 0.40 0.06 0.10 0.82 0.35 35.0 15.4 30.0 19.6 SB1 0.16 0.59 0.87 0.55 0.06 0.42 0.78 0.45 21.4 35.7 20.4 22.4 SB2 0.04 0.61 0.55 0.51 0.04 0.55 0.54 0.46 2.0 46.8 12.3 38.9 SW2 0.19 0.78 1.09 0.37 0.06 0.50 0.94 0.26 20.9 36.7 25.0 17.5 SB3 0.04 0.47 0.88 0.51 0.04 0.39 0.84 0.44 1.4 38.9 22.1 37.7 SW3 0.27 0.70 0.90 0.40 0.06 0.46 0.75 0.28 28.0 33.6 21.4 17.0 SW4 0.03 0.92 0.99 0.94 0.03 0.77 0.93 0.82 0.6 44.0 19.5 35.9 SW5 0.03 0.79 1.06 0.79 0.03 0.68 1.02 0.71 0.4 44.9 18.2 36.5 SW6 0.23 0.58 1.19 0.92 0.07 0.39 1.06 0.77 25.0 29.1 21.7 24.2 EC* 0.25 0.61 0.97 0.36 0.04 0.44 0.85 0.27 23.2 33.5 26.5 16.8 ED* 0.25 0.50 1.02 1.03 0.06 0.36 0.91 0.87 15.4 27.9 23.2 33.4 FE* 0.00 1.70 1.02 0.08 0.00 1.48 0.90 0.06 0.1 60.3 32.0 7.7
*Program Alloy
Table 2.2 APT precipitate <d>, N and f for 9 surveillance and 3 program alloys.
Alloy APT Bulk Composition <d> +/- N +/- f +/-
Cu Ni Mn Si (nm) (nm) (1023 m-3) (1023 m-3) (%) (%)
SW1 0.15 0.13 0.86 0.40 2.94 0.20 1.90 0.51 0.25 0.03 SB1 0.16 0.59 0.87 0.55 2.95 0.02 3.88 1.00 0.49 0.05 SB2 0.04 0.61 0.55 0.51 2.32 0.16 1.95 0.31 0.14 0.07 SW2 0.19 0.78 1.09 0.37 3.32 0.20 3.64 0.86 0.66 0.14 SB3 0.04 0.47 0.88 0.51 2.60 0.52 8.02 0.50 0.21 0.15 SW3 0.27 0.70 0.90 0.40 3.11 0.21 4.11 0.61 0.75 0.05 SW4 0.03 0.92 0.99 0.94 2.50 0.08 3.78 0.40 0.37 0.04 SW5 0.03 0.79 1.06 0.79 2.40 0.07 3.18 0.51 0.25 0.03 SW6 0.23 0.58 1.19 0.92 2.83 0.05 5.73 0.15 0.67 0.01 EC* 0.25 0.61 0.97 0.36 3.02 0.22 3.78 0.18 0.53 0.08 ED* 0.25 0.50 1.02 1.03 2.88 0.35 3.38 0.28 0.53 0.03 FE* 0.00 1.70 1.02 0.08 3.26 0.50 2.59 0.60 0.39 0.11
* Program Alloy

15
Figure 2.4. APT f versus the measured bulk Cu content (at.%) for the surveillance and program alloys
showing the strong effect of both Cu and Ni.
2.1.2 Advanced Steel Matrix
Atom probe tomography has been completed on 9 alloys from the ASM with
systematic variations in bulk Ni and Mn contents at low Cu (< 0.06 at.%). A summary of this
data is shown in Table 2.3 and Table 2.4.
Table 2.3 APT bulk, matrix and precipitate compositions for 9 ASM alloys in cup 8.
Alloy Bulk Matrix Precipitate
Cu Ni Mn Si Cu Ni Mn Si Cu Ni Mn Si
R1 0.05 0.24 0.24 0.49 0.04 0.21 0.22 0.44 1.5 37.1 14.6 46.8 R17 0.04 3.50 1.04 0.44 0.02 2.15 0.51 0.15 0.9 62.8 23.9 12.5 R19 0.05 1.80 0.24 0.47 0.05 1.55 0.22 0.35 1.0 64.4 5.1 29.4 R22 0.05 1.62 1.23 0.46 0.04 1.25 1.06 0.33 0.8 54.1 26.5 18.6 R26 0.04 3.40 0.22 0.39 0.04 2.91 0.19 0.25 0.9 73.5 4.7 20.8 R34 0.06 3.39 0.06 0.40 0.05 3.09 0.06 0.31 0.9 75.9 1.2 22.0 R35 0.04 0.19 1.34 0.46 0.04 0.17 1.27 0.44 1.3 26.4 42.4 30.0 R39 0.03 0.75 0.80 0.46 0.03 0.63 0.75 0.37 0.8 46.8 19.7 32.7 R48 0.05 3.45 0.48 0.42 0.04 2.58 0.32 0.19 1.0 69.2 12.5 17.2

16
Table 2.4 APT precipitate <d>, N and f for 9 ASM alloys in cup 8.
Alloy APT Bulk Composition <d> +/- N +/- f +/-
Cu Ni Mn Si (nm) (nm) (1023 m-3) (1023 m-3) (%) (%)
R1 0.05 0.24 0.24 0.49 2.31 0.02 0.92 0.40 0.08 0.15 R17 0.04 3.50 1.04 0.44 2.58 0.09 22.2 0.12 2.44 0.17 R19 0.05 1.80 0.24 0.47 2.47 0.03 5.07 0.09 0.42 0.04 R22 0.05 1.62 1.23 0.46 2.15 0.08 13.4 0.15 0.89 0.12 R26 0.04 3.40 0.22 0.39 2.46 0.04 8.37 1.69 0.69 0.11 R34 0.06 3.39 0.06 0.40 2.17 0.10 6.53 2.05 0.44 0.10 R35 0.04 0.19 1.34 0.46 2.22 0.03 1.83 0.27 0.11 0.08 R39 0.03 0.75 0.80 0.46 2.60 0.13 2.42 0.40 0.29 0.04 R48 0.05 3.45 0.48 0.42 2.29 0.08 21.2 0.60 1.41 0.22
2.1.2.1 Effects of Ni and Mn in Low Cu Steels
Figure 2.5 to Figure 2.7 show the effect of Ni and Mn on precipitation of MNSPs.
Solute maps for four low Cu (< 0.07%) steels with varying Ni contents from 0.3 to 3.5% are
shown in Figure 2.5. These alloys all nominally contained 0.04 – 0.06 wt.% Cu, 1.46 – 1.51
wt.% Mn, 0.20 – 0.21 wt.% Si. APT finds 2-3 nm diameter MNSPs with number densities of
1023-1024 m-3. There is a strong correlation between bulk Ni content of the alloys and the
MNSP f, that increases from 0.08% in the low 0.3Ni steel to 2.44% in the highest 3.50Ni
steel. These results are consistent with previous observations of the dominant role of Ni on
significant precipitation at very high ϕt, even in low Cu steels [5].
Note that in the case of 0.8 wt.% Ni alloy most precipitates are located on dislocations
and grain boundaries. Mn, Ni and Si all segregate to these microstructural features, especially
Si. It is known that Cu precipitates catalyze the initial formation of MNSPs. In the effective
absence of Cu, and at lower bulk Ni, the precipitates have difficulty nucleating
homogeneously in the defect free matrix. Thus microstructural features such as dislocations,
loops and grain boundaries act as heterogeneous nucleation sites for MNSPs. Such
precipitate-dislocation associations were also observed in the ATR-2 surveillance steels.
17
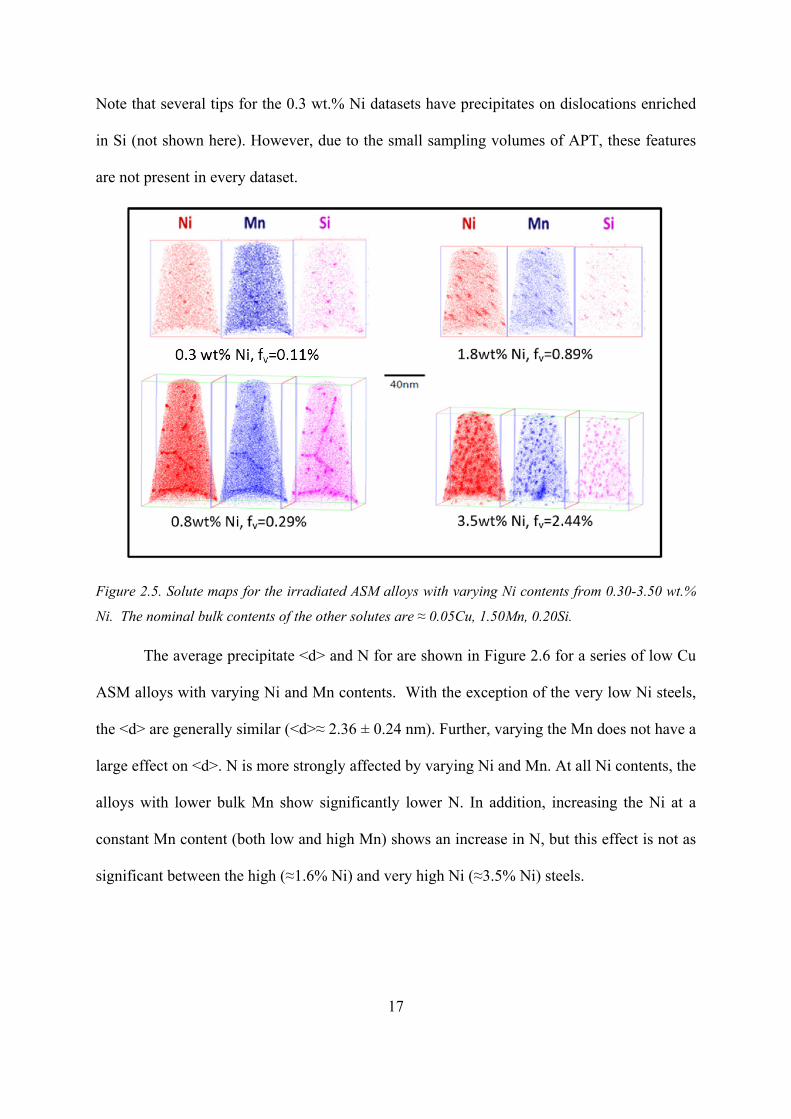
Note that several tips for the 0.3 wt.% Ni datasets have precipitates on dislocations enriched
in Si (not shown here). However, due to the small sampling volumes of APT, these features
are not present in every dataset.
Figure 2.5. Solute maps for the irradiated ASM alloys with varying Ni contents from 0.30-3.50 wt.%
Ni. The nominal bulk contents of the other solutes are ≈ 0.05Cu, 1.50Mn, 0.20Si.
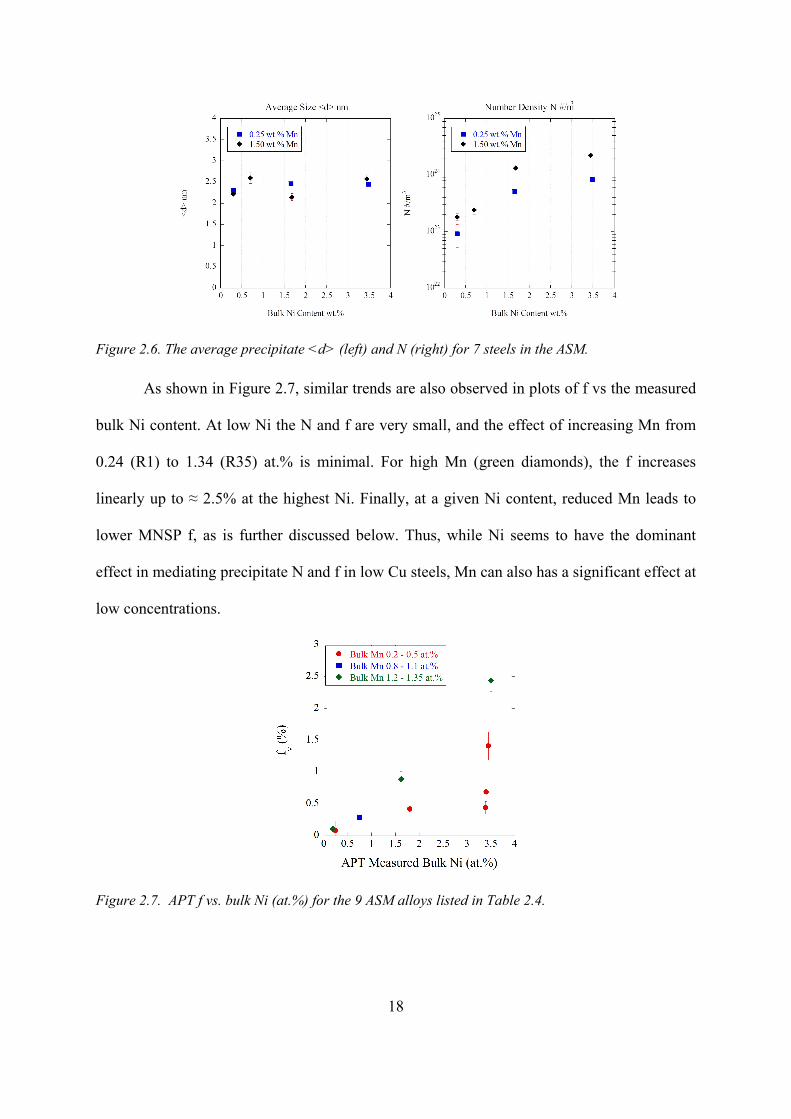
The average precipitate <d> and N for are shown in Figure 2.6 for a series of low Cu
ASM alloys with varying Ni and Mn contents. With the exception of the very low Ni steels,
the <d> are generally similar (<d>≈ 2.36 ± 0.24 nm). Further, varying the Mn does not have a
large effect on <d>. N is more strongly affected by varying Ni and Mn. At all Ni contents, the
alloys with lower bulk Mn show significantly lower N. In addition, increasing the Ni at a
constant Mn content (both low and high Mn) shows an increase in N, but this effect is not as
significant between the high (≈1.6% Ni) and very high Ni (≈3.5% Ni) steels.
18
Figure 2.6. The average precipitate <d> (left) and N (right) for 7 steels in the ASM.
As shown in Figure 2.7, similar trends are also observed in plots of f vs the measured
bulk Ni content. At low Ni the N and f are very small, and the effect of increasing Mn from
0.24 (R1) to 1.34 (R35) at.% is minimal. For high Mn (green diamonds), the f increases
linearly up to ≈ 2.5% at the highest Ni. Finally, at a given Ni content, reduced Mn leads to
lower MNSP f, as is further discussed below. Thus, while Ni seems to have the dominant
effect in mediating precipitate N and f in low Cu steels, Mn can also has a significant effect at
low concentrations.
Figure 2.7. APT f vs. bulk Ni (at.%) for the 9 ASM alloys listed in Table 2.4.

19
2.1.2.2 ASM – Mn Starvation
The previous section demonstrated that high Ni contents lead to higher MNSP f at
conventional Mn concentrations, and that this effect is exacerbated at very high Mn. A
corollary is that severe embrittlement can be avoided even at high Ni contents if the bulk Mn
content is low enough. The ASM matrix is aimed at testing the high-Ni, low-Mn hypothesis,
that we call “Mn starvation”. Another goal is to develop a better general understanding of the
role of Mn (and Si) in steels with a very wide range of Ni contents up to 3.5%.
Figure 2.8 shows the effect of Mn starvation on precipitation. Large MNSP f are
avoided by reducing the bulk Mn content of the alloy to 0.25%. Preliminary APT of two high
Ni content steels showed a large difference in the precipitate volume fraction for a low Mn of
0.25% (f = 0.65% averaging 4 tips) and high Mn of 1.5% (f = 2.44% averaging 2 tips) alloys.
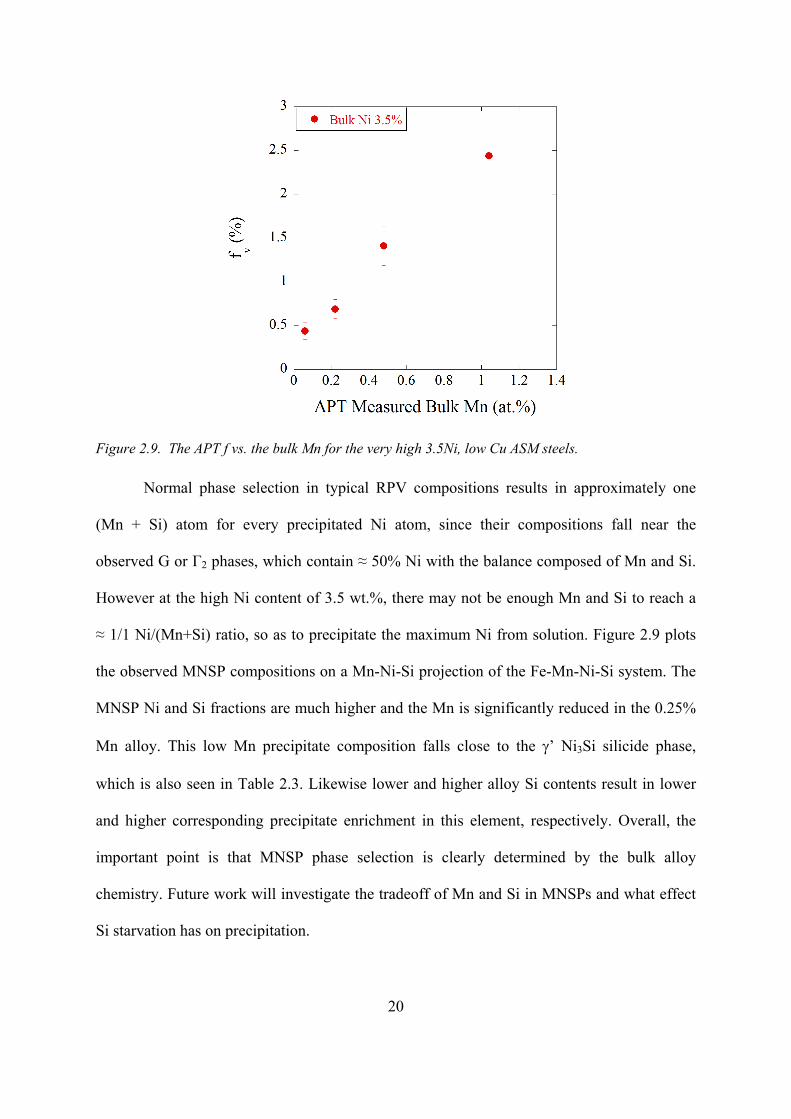
This is also seen in Figure 2.9, plotting f vs the measured bulk Mn content for the 3.5% Ni
ASM alloys, showing an almost linear trend.
Figure 2.8. Solute maps for the ASM high Ni (3.5wt%) steels with low Mn (left, 0.25wt.%) and high
Mn (right, 1.50wt.%).
20
Figure 2.9. The APT f vs. the bulk Mn for the very high 3.5Ni, low Cu ASM steels.
Normal phase selection in typical RPV compositions results in approximately one
(Mn + Si) atom for every precipitated Ni atom, since their compositions fall near the
observed G or Γ2 phases, which contain ≈ 50% Ni with the balance composed of Mn and Si.
However at the high Ni content of 3.5 wt.%, there may not be enough Mn and Si to reach a
≈ 1/1 Ni/(Mn+Si) ratio, so as to precipitate the maximum Ni from solution. Figure 2.9 plots
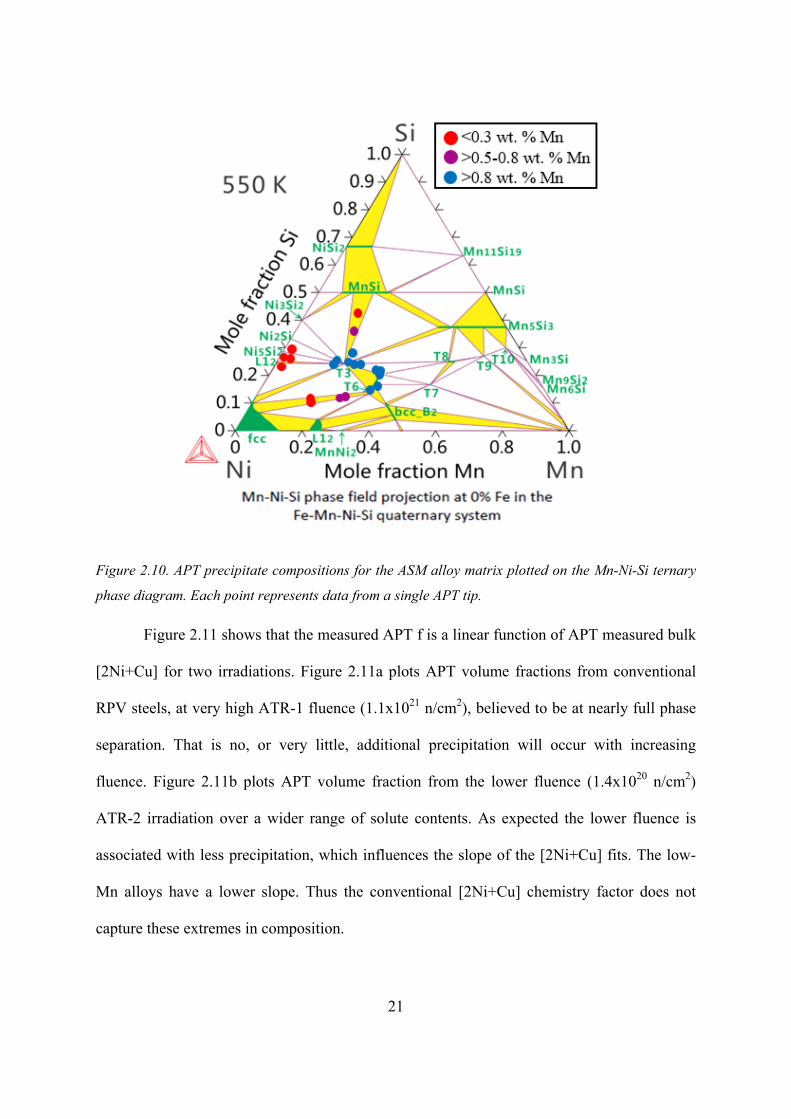
the observed MNSP compositions on a Mn-Ni-Si projection of the Fe-Mn-Ni-Si system. The
MNSP Ni and Si fractions are much higher and the Mn is significantly reduced in the 0.25%
Mn alloy. This low Mn precipitate composition falls close to the γ’ Ni3Si silicide phase,
which is also seen in Table 2.3. Likewise lower and higher alloy Si contents result in lower
and higher corresponding precipitate enrichment in this element, respectively. Overall, the
important point is that MNSP phase selection is clearly determined by the bulk alloy
chemistry. Future work will investigate the tradeoff of Mn and Si in MNSPs and what effect
Si starvation has on precipitation.
21
Figure 2.10. APT precipitate compositions for the ASM alloy matrix plotted on the Mn-Ni-Si ternary
phase diagram. Each point represents data from a single APT tip.
Figure 2.11 shows that the measured APT f is a linear function of APT measured bulk
[2Ni+Cu] for two irradiations. Figure 2.11a plots APT volume fractions from conventional
RPV steels, at very high ATR-1 fluence (1.1x10²¹ n/cm2), believed to be at nearly full phase
separation. That is no, or very little, additional precipitation will occur with increasing
fluence. Figure 2.11b plots APT volume fraction from the lower fluence (1.4x10²⁰ n/cm2)
ATR-2 irradiation over a wider range of solute contents. As expected the lower fluence is
associated with less precipitation, which influences the slope of the [2Ni+Cu] fits. The low-
Mn alloys have a lower slope. Thus the conventional [2Ni+Cu] chemistry factor does not
capture these extremes in composition.

22
Figure 2.11. APT f as a function of measured bulk 2Ni+Cu from: a) conventional RPV steels at very
high ATR-1 fluence condition (1.1x10²¹ n/cm2); and, b) ASM alloys with two different bulk Mn content
(0.25% & 1.50% Mn) from ATR-2, in cup 8 (1.4x10²⁰ n/cm2).
2.2 Small Angle Neutron Scattering
Small angle neutron scattering has been completed on 8 UCSB alloys, 9 surveillance
alloys and 20 ASM alloys. These results are shown below. There are compared with
measured APT data in a later section and show qualitatively similar results.
2.2.1 UCSB Alloys
Figure 2.12 shows scattering curves for the baseline and irradiated samples for two
UCSB alloys, LG (low Cu, medium Ni) on the left and LD (high Cu, high Ni) on the right.
Note that the high Cu, high Ni steel has much more scattering from the precipitates,
consistent with APT data.

23
Figure 2.12. SANS 45° scattering curves from an angle on the detector that are higher at intermediate
q due to the precipitates. Note that there is less scattering in the irradiated low Cu, medium Ni steel
(LG: left) compared to the high Cu, high Ni steel (LD: right).
Table 2.5 shows the SANS measured precipitate <d>, N, f and magnetic-to-nuclear
scattering ratios (M/N). The general trends of the effects of Cu and Ni are consistent the APT
data. The M/N reflect the composition and atomic density of the precipitates. For example,
the measured M/N vary from 1.41 to 2.32 in the UCSB steel matrix. APT shows that the
precipitates do not have exact stoichiometric compositions compared to the Γ2 and G phases.
Assuming the APT measured MNSP compositions for LD, the M/N are estimated to be 2.32
and 2.50 for the Γ2 and G-phases, respectively. These results are preliminary, and the analysis
is ongoing. Future work will expand the analysis to the rest of the alloys, and use
complementary SAXS data to help to further constrain the compositions and structures
precipitates phases.

24
Table 2.5 Small Angle Neutron Scattering precipitate <d>, N, f, and M/N for the measured UCSB
alloys form cup 8.
Alloy <d> (nm) +/- (nm) N (1023 m-3) +/- (1023 m-3) f (%) +/- (%) M/N C7 2.52 0.13 4.50 1.13 0.37 0.06 1.66 C9 2.96 0.15 1.02 0.26 0.14 0.02 2.35
C13 3.54 0.18 1.00 0.25 0.22 0.03 1.41 C16 4.04 0.20 1.18 0.30 0.40 0.06 2.07 C17 3.64 0.18 3.39 0.85 0.84 0.13 1.60 LD 3.90 0.20 1.79 0.45 0.55 0.08 2.32 LG 3.56 0.18 0.56 0.41 0.13 0.02 2.17 LI 4.20 0.21 0.75 0.19 0.29 0.04 2.27
2.2.2 Surveillance Alloys
Table 2.6 shows SANS data for 9 surveillance alloys. Note that the surveillance M/N
are very consistent with the UCSB alloys except in the case of KP, which has the lowest Mn
content in both. This is consistent with the high M/N ratio.
Table 2.6 Small Angle Neutron Scattering precipitate <d>, N, f, and M/N for the measured
surveillance alloys from cup 8.
Alloy <d> (nm) +/- (nm) N (1023 m-3) +/- (1023 m-3) f (%) +/- (%) M/N QC1 3.06 0.15 2.81 0.70 0.42 0.06 2.22 D3 2.98 0.15 3.52 0.88 0.49 0.07 2.55
SW1 2.92 0.15 1.79 0.45 0.23 0.03 1.59 SB1 2.88 0.14 3.05 0.76 0.38 0.06 2.13 SB2 2.64 0.13 1.46 0.37 0.14 0.02 14.75 SW2 3.24 0.16 3.66 0.91 0.65 0.10 2.17 SW3 3.48 0.17 2.96 0.74 0.65 0.10 2.58 SW4 2.62 0.13 2.11 0.53 0.2 0.03 2.1 SW5 2.64 0.13 2.17 0.54 0.21 0.03 2.68
2.2.3 ASM
Table 2.7 shows the SANS measured precipitate <d>, N, f and M/N for 20 ASM
alloys. The ASM alloys show very large ranges of M/N, and a number of them have M/N >

25
10 or < 1.5. This is very different than the UCSB and surveillance matrices where most M/N
fell between 1.5 and 2.5.
Table 2.7 Small Angle Neutron Scattering precipitate <d>, N, f, and M/N for the measured ASM
alloys form cup 8.
Alloy <d> (nm) +/- N (m-3) +/- f (%) +/- M/N R1 3.84 0.19 1.20E+22 3.00E+21 0.04 0.01 9.96 R4 4.64 0.23 7.58E+21 1.90E+21 0.04 0.01 10.87
R10 2.24 0.11 3.00E+24 7.50E+23 1.77 0.27 1.78 R14 3.86 0.19 4.50E+23 1.13E+23 1.35 0.20 1.17 R17 2.28 0.11 2.90E+24 7.25E+23 1.82 0.27 1.69 R18 2.70 0.14 2.25E+24 5.63E+23 2.31 0.35 1.93 R20 2.28 0.11 3.00E+23 7.50E+22 0.19 0.03 10.68 R21 2.92 0.15 1.10E+23 2.75E+22 0.15 0.02 15.22 R22 2.22 0.11 9.40E+23 2.35E+23 0.54 0.08 1.54 R26 2.26 0.11 6.30E+23 1.58E+23 0.39 0.06 19.3 R28 2.52 0.13 6.30E+23 1.58E+23 0.53 0.08 22.9 R32 1.49 0.07 1.25E+24 3.13E+23 1.72 0.26 1.31 R33 2.20 0.11 5.70E+23 1.43E+23 0.32 0.05 13.6 R34 3.04 0.15 9.10E+22 2.28E+22 0.13 0.02 > 100 R35 2.22 0.11 1.21E+23 3.03E+22 0.09 0.01 0.98 R37 2.50 0.13 7.70E+22 1.93E+22 0.06 0.01 1.36 R39 2.58 0.13 1.39E+23 3.48E+22 0.13 0.02 1.65 R42 1.74 0.09 1.74E+24 4.35E+23 0.49 0.07 3 R47 1.78 0.09 1.10E+24 2.75E+23 0.32 0.05 3.44 R48 2.16 0.11 1.50E+24 3.75E+23 0.81 0.12 2.8
The large variation of M/N ratios is due to the wide range of compositions in the
ASM, hence, corresponding differences in precipitate compositions and phases (see Figure
2.10). For example, as noted previously, the precipitates in R34 and R26 have compositions
of approximately Ni3Si, while in SANS they have M/N of 19.3 and > 100, respectively. The
scattering length of the Ni3Si precipitates similar to that of the Fe matrix, so the
corresponding scattering contrast is small, leading to very large M/N assuming these features
are not magnetic. The two unknowns are the actual phase and corresponding atomic density
and the magnetization of the precipitate, if any.

26
2.3 Automated SPT
Automated SPT was completed on the full baseline matrix of ASM alloys, along with
the 48 ASM alloys from cup 8 currently at UCSB.
2.3.1 Baseline Testing
Before testing the irradiated samples from the ATR-2 experiment, the automated SPT
instrument required qualification and calibration, including establishing the “optimal” offset
for defining the shear yield stress (τy). As shown in
Figure 2.13, the calibration was carried out on the entire ASM baseline matrix by determining
automated SPT τy at various offsets compared to the corresponding τy from the manual tester,
which used a 0.2% offset. Figure 2.13a-d show the results for automated SPT offsets of a)
0.2%, b) 0.4%, c) 0.6% and d) 0.9%, respectively. An automated SPT offset of 0.9% provides
the best agreement, so it was used to determine τy for the baseline. The reason that the offsets
differ is corresponding differences in the loading compliance in the two cases.
Figure 2.13. Manual vs. automated τy for various automated SPT offsets.

27
Figure 2.14 shows the tensile σy vs. the automated SPT measured τy using a 0.9%
offset. The linear least square fit slope is 1.78 that is, as expected, similar to the original τy
vs. σy relation for the manual SPT of 1.77 [6]. Note that there are two outliers, R24 and R46,
which will be retested.
Figure 2.14. Baseline tensile σy vs. SPT τy for the ASM alloys.
Figure 2.15 shows an almost 1:1 agreement between the Smax for the manual and
automated SPT measurements. However, the 2 outliers also persist in these cases.
Figure 2.15. Measured manual vs. automated SPT Smax.
2.3.2 ATR-2, Cup 8 Testing
Automated SPT was completed on all ASM irradiated alloys currently at UCSB. The
baseline and irradiated τy (using an offset of 0.9%) and Smax are shown in Table 2.8.
28
Table 2.8 τy and Smax from the automated SPT instrument for all ASM alloys at UCSB from cup 8
in the baseline and irradiated conditions.
Alloy τy,u (MPa) ± τy,I (MPa) ± Smax,U (MPa) ± Smax,I (MPa) ± R1 215 10 257 9 412 8 475 16 R2 174 5 202 9 364 10 410 13 R3 161 12 173 12 330 3 380 8 R4 219 18 257 11 434 4 508 11 R5 190 7 226 6 376 6 479 7 R6 218 4 288 13 407 4 535 10 R8 195 16 260 11 403 11 497 14 R9 234 6 348 8 430 10 593 3 R10 410 13 609 23 603 13 831 9 R11 338 10 578 8 537 8 766 16 R12 300 7 551 8 481 6 740 13 R13 392 22 602 17 615 19 802 17 R14 364 7 561 5 537 4 790 30 R15 386 12 596 23 574 27 815 23 R16 384 21 643 10 564 6 844 17 R17 404 8 590 19 570 11 818 25 R18 417 18 634 10 588 17 808 40 R20 205 10 296 12 391 6 544 31 R21 241 14 351 14 439 4 571 6 R22 323 9 474 13 536 4 718 11 R23 247 11 421 4 428 7 654 8 R24 420 14 443 13 641 26 713 5 R25 284 13 407 29 459 21 625 14 R26 349 6 436 12 531 11 651 18 R27 244 12 321 13 417 8 517 5 R28 325 17 423 28 520 22 650 11 R29 274 13 405 20 450 9 618 15 R30 282 16 297 4 471 30 546 9 R31 359 14 460 11 559 41 711 10 R32 384 16 612 17 595 7 820 17 R33 288 9 381 19 481 33 585 6 R34 294 11 332 8 494 13 554 19 R35 288 7 313 5 503 11 573 12 R36 234 4 266 11 422 4 477 9 R37 327 7 353 8 544 21 575 15 R38 250 10 271 8 450 11 496 8 R39 271 12 315 7 484 3 552 10 R40 288 10 324 10 517 7 583 18 R41 280 6 355 12 485 7 588 10 R42 298 7 340 6 496 4 587 9 R43 300 7 339 15 504 7 575 26 R44 304 5 373 14 499 8 613 22 R45 346 10 338 28 539 16 585 13 R46 452 10 629 4 691 8 821 13 R47 288 6 369 8 494 15 583 4 R48 332 7 490 9 545 13 711 5 R49 327 6 405 15 530 8 625 13 R50 342 7 433 7 545 13 697 15
29
In addition to ASM alloys, SPT were varied out on a number of UCSB alloys in the
irradiated condition. Baseline testing on this matrix is currently ongoing, so they are not listed
in the table above. Figure 2.16 plots the tensile measured σy vs the automated SPT measured
τy. Interestingly, while this correlation also shows a linear correlation between the σy and τy,
with a slope ≈ 2.06%. We are currently investigating why the irradiated samples show a
different correlation between σy and τy than the unirradiated baseline samples, but we
hypothesize that this difference is caused by corresponding differences in strain hardening in
the irradiated versus unirradiated condition. Work on the σy and τy correlations is ongoing,
primarily based on finite element modeling.
Figure 2.16. σy vs. τy for irradiated alloys from cup 8.

30
2.4 Microhardness
Vickers microhardness was also completed on all ASM alloys currently at UCSB.
This data, along with the converted Δσy, which was calculated as Δσy = 3.33*ΔμH, is given in
Table 2.9.
Table 2.9 Microhardness data for ASM alloys tested at UCSB. The change in Vickers hardness due to
irradiation at the ATR-2 condition was converted to shifts in yield stress.
Alloy μHBL (kg/mm2) ± μHIrr (kg/mm2) ± Δσy (MPa) ± R1 160.7 1.8 175.9 4.0 50.7 14.4 R2 144.0 2.0 181.5 2.4 124.7 10.4 R3 150.5 2.7 188.1 4.0 125.3 15.9 R4 175.3 3.1 205.1 4.8 99.3 19.0 R5 149.9 1.9 161.1 1.8 37.2 8.7 R6 170.4 2.9 233.8 7.6 211.1 27.2
R7* 187.0 2.5
R8 173.6 2.9 224.6 3.0 169.8 14.0 R9 172.8 1.9 282.4 3.3 365.0 12.6 R10 290.8 3.9 422.9 7.8 440.1 29.2 R11 250.3 4.6 424.6 5.9 580.6 25.0 R12 235.3 2.0 403.2 4.6 559.2 16.6 R13 289.8 1.4 436.0 6.2 486.7 21.3 R14 249.7 3.3 429.0 2.9 597.1 14.6 R15 284.2 1.4 461.3 2.1 589.6 8.4 R16 282.7 1.7 443.1 4.5 534.1 15.9 R17 298.0 2.7 426.5 2.8 427.7 13.1 R18 292.7 2.1 439.7 4.4 489.5 16.1
R19* 222.5 3.0
R20 178.6 5.9 239.5 4.6 203.1 25.0 R21 201.1 2.2 285.2 5.4 279.9 19.4 R22 253.3 2.7 351.3 3.9 326.1 15.7 R23 202.4 2.5 332.1 5.6 431.8 20.5 R24 286.0 3.1 318.2 11.0 107.1 38.0 R25 223.5 4.0 322.3 4.0 329.1 18.8 R26 253.8 4.0 336.4 4.1 275.1 18.9 R27 206.4 5.3 275.6 2.2 230.5 18.9 R28 269.7 5.4 346.0 4.6 254.2 23.8 R29 230.8 3.8 304.6 5.7 245.8 22.8 R30 208.2 6.1 258.4 4.6 167.2 25.6 R31 287.5 5.7 360.1 5.2 241.6 25.7 R32 266.1 4.0 459.8 1.8 644.9 14.7 R33 234.7 3.2 277.4 4.2 142.1 17.6 R34 237.5 3.8 287.1 2.8 165.1 15.6 R35 238.9 3.2 274.1 3.8 117.2 16.6 R36 184.8 7.4 224.8 2.3 133.4 25.7 R37 264.3 2.7 276.4 3.7 40.3 15.4 R38 208.7 5.1 234.1 4.0 84.8 21.5 R39 217.6 4.4 258.3 4.3 135.5 20.6 R40 223.0 5.1 271.3 2.9 161.0 19.6 R41 237.0 2.8 301.5 3.8 214.9 15.6 R42 221.8 5.1 293.8 5.8 239.6 25.8 R43 239.1 3.5 287.0 4.5 159.6 19.1 R44 235.3 3.1 295.6 5.8 201.1 22.0 R45 258.7 1.7 299.6 3.6 136.0 13.2 R46 306.0 6.7 476.8 2.6 568.5 23.9 R47 229.8 4.0 296.6 9.7 222.4 34.9 R48 295.6 6.6 357.0 7.5 204.4 33.3 R49 242.7 2.7 328.1 3.8 284.4 15.4 R50 272.9 3.9 353.6 3.1 268.4 16.7
*Irradiated samples not yet at UCSB

31
3. Conclusions and Future Work
3.1 Conclusions
The ATR-2 experiment will generate a huge database on both microstructure and
mechanical property data for a large number of RPV steels with a wide range of alloy
compositions for different irradiation conditions. This report gives a brief overview of the
ATR-2 PIE data taken over the past 9 months. While a major focus of upcoming work is to
continue testing and characterization of additional irradiated alloys, especially those from
lower temperature cups, future work will expand the analysis of both current and new data,
developing correlations between the measurables derived from the various techniques.
3.2 Updated Testing Plan
UCSB is currently awaiting for what is likely to be the final shipment of irradiated
alloys from cups 7 and 8. We will finish irradiated SPT on the highest priority alloys in these
high fluence cups and save small discs for future mechanical property testing and
microstructural characterization. In addition, we are in the process of completing baseline
SPT on the remaining alloys in the ATR-2 irradiation. Once these tasks are completed,
targeted to be within the next few months, the focus of testing will move to the two lower
temperature (250 and 270°C) ATR-2 conditions at fluences of ≈ 1.2x10²⁰ n/cm2.
4. References
1. Odette GR, Yamamoto T, Wells PB, Almirall N, et al. "Update on the ATR-2 Reactor
Pressure Vessel Steel High Fluence Irradiation Project," 2016; UCSB ATR-2 2016-1.
2. "As-Run Thermal Analysis of the UCSB-2 Experiment in the ATR," 2016; ATR
NSUF ECAR No. 3218, Project No. 30946.
3. "As-Run Physics Analysis for hte UCSB-2 Leadout Experiment in I-22," 2016; ATR
NSUF ECAR No. 3219, Project No. 30946.
4. Eason ED, Odette GR, Nanstad RK and Yamamoto T. "A physically based correlation
of irradiation-induced transition temperature shifts for RPV steels," Oak Ridge

32
National Lab, 2007; ORNL/TM-2006/530.
5. Wells PB, Yamamoto T, Miller B, Milot T, et al. "Evolution of manganese–nickel–
silicon-dominated phases in highly irradiated reactor pressure vessel steels", Acta
Mater. 2014;80:205–219.
6. Milot TS. "Establishing Correlations for Predicting Tensile Properties Based on the
Shear Punch Test and Vickers Microhardness Data" [PhD Thesis]. University of
California, Santa Barbara, 2013.


![Engineering Geology...AAU Office of the Registrar De 't: Civil En ineerin Program: Section: 4 course Code; CENG ID.NO ATR12152]05 ATR/5749/05 ATR/4526/05 ATR/7587/06 ATR/2774/05 ATR/5278/05](https://img.pdfslide.us/doc/110x75/60f5164ac9e9827e9d545c73/engineering-geology-aau-office-of-the-registrar-de-t-civil-en-ineerin-program.jpg)