Embed Size (px)
Citation preview
Special Topics
Sugarcane Mosaic Virus: Shape of the Inoculum-InfectionCurve Near the Origin
Jack L. Dean
Research Plant Pathologist, Science and Education Administration (SEA), U.S. Department of Agriculture, U.S. Sugarcane FieldStation, Canal Point, FL 33438.
I thank Victor Chew, Mathematical Statistician, SEA, USDA, Gainesville, Florida, for statistical advice during preparation of themanuscript and for analysis of data.
Accepted for publication 17 August 1978.
ABSTRACT
DEAN J. L. 1979. Sugarcane mosaic virus: shape of the inoclulum-infection curve near the origin. Phytopathology 69:179-181.
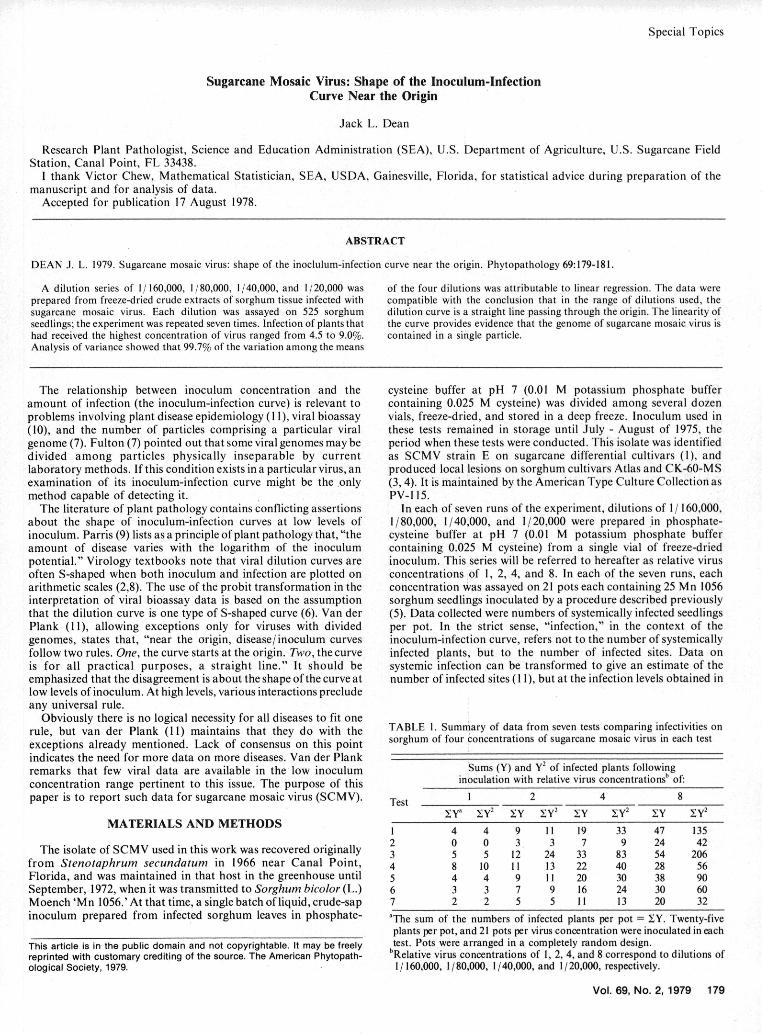
A dilution series of 1/160,000, 1/80,000, 1/40,000, and 1/20,000 was of the four dilutions was attributable to linear regression. The data wereprepared from freeze-dried crude extracts of sorghum tissue infected with compatible with the conclusion that in the range of dilutions used, thesugarcane mosaic virus. Each dilution was assayed on 525 sorghum dilution curve is a straight line passing through the origin. The linearity ofseedlings; the experiment was repeated seven times. Infection of plants that the curve provides evidence that the genome of sugarcane mosaic virus ishad received the highest concentration of virus ranged from 4.5 to 9.0%. contained in a single particle.Analysis of variance showed that 99.7% of the variation among the means
The relationship between inoculum concentration and the cysteine buffer at pH 7 (0.01 M potassium phosphate bufferamount of infection (the inoculum-infection curve) is relevant to containing 0.025 M cysteine) was divided among several dozenproblems involving plant disease epidemiology (11), viral bioassay vials, freeze-dried, and stored in a deep freeze. Inoculum used in(10), and the number of particles comprising a particular viral these tests remained in storage until July - August of 1975, thegenome (7). Fulton (7) pointed out that some viral genomes may be period when these tests were conducted. This isolate was identifieddivided among particles physically inseparable by current as SCMV strain E on sugarcane differential cultivars (1), andlaboratory methods. If this condition exists in a particular virus, an produced local lesions on sorghum cultivars Atlas and C K-60-M Sexamination of its inoculum-infection curve might be the only (3, 4). It is maintained by the American Type Culture Collection asmethod capable of detecting it. PV-1 15.
The literature of plant pathology contains conflicting assertions In each of seven runs of the experiment, dilutions of 1/ 160,000,about the shape of inoculum-infection curves at low levels of 1/80,000, 1/40,000, and 1/20,000 were prepared in phosphate-inoculum. Parris (9) lists as a principle of plant pathology that, "the cysteine buffer at pH 7 (0.01 M potassium phosphate bufferamount of disease varies with the logarithm of the inoculum containing 0.025 M cysteine) from a single vial of freeze-driedpotential." Virology textbooks note that viral dilution curves are inoculum. This series will be referred to hereafter as relative virusoften S-shaped when both inoculum and infection are plotted on concentrations of 1, 2, 4, and 8. In each of the seven runs, eacharithmetic scales (2,8). The use of the probit transformation in the concentration was assayed on 21 pots each containing 25 Mn 1056interpretation of viral bioassay data is based on the assumption sorghum seedlings inoculated by a procedure described previouslythat the dilution curve is one type of S-shaped curve (6). Van der (5). Data collected were numbers of systemically infected seedlingsPlank (11), allowing exceptions only for viruses with divided per pot. In the strict sense, "infection," in the context of thegenomes, states that, "near the origin, disease/inoculum curves inoculum-infection curve, refers not to the number of systemicallyfollow two rules. One, the curve starts at the origin. Two, the curve infected plants, but to the number of infected sites. Data onis for all practical purposes, a straight line." It should be systemic infection can be transformed to give an estimate of theemphasized that the disagreement is about the shape of the curve at number of infected sites (11), but at the infection levels obtained inlow levels of inoculum. At high levels, various interactions precludeany universal rule.
Obviously there is no logical necessity for all diseases to fit onerule, but van der Plank (11) maintains that they do with the TABLE 1. Summary of data from seven tests comparing infectivities on
exceptions already mentioned. Lack of consensus on this point sorghum of four concentrations of sugarcane mosaic virus in each test
indicates the need for more data on more diseases. Van der Plankremarks that few viral data are available in the low inoculum Sums (Y)and y2 of infected plants followingconcentration range pertinent to this issue. The purpose of this inoculation with relative virus concentrationsb of:
paper is to report such data for sugarcane mosaic virus (SCMV). Test 1 2 4 8.y yl lY .yl Zy Xy Y •y2
MATERIALS AND METHODS 1 4 4 9 11 19 33 47 1352 0 0 3 3 7 9 24 42
The isolate of SCMV used in this work was recovered originally 3 5 5 12 24 33 83 54 206from Stenotaphrum secundatum in 1966 near Canal Point, 4 8 10 11 13 22 40 28 56Florida, and was maintained in that host in the greenhouse until 5 4 4 9 11 20 30 38 90September, 1972, when it was transmitted to Sorghum bicolor (L.) 6 3 3 7 9 16 24 30 60Moench 'Mn 1056.' At that time, a single batch of liquid, crude-sap 7 2 2 5 5 11 13 20 32inoculum prepared from infected sorghum leaves in phosphate- aThe sum of the numbers of infected plants per pot = 1Y. Twenty-five
plants per pot, and 21 pots per virus concentration were inoculated in eachThis article is in the public domain and not copyrightable. It may be freely test. Pots were arranged in a completely random design.reprinted with customary crediting of the source. The American Phytopath- bRelative virus concentrations of 1, 2, 4, and 8 correspond to dilutions ofological Society, 1979. 1 / 160%000, 1/80,000, 1/40,000, and 1/20,000, respectively.
Vol. 69, No. 2,1979 179

these tests, the effect of the transformation is negligible (5, 11), andit was not applied.
RESULTS AND DISCUSSION
Table 1 supplies data needed for calculation of the statisticsdiscussed in this paper or for calculation of others that may be ofinterest to the reader. Fig. 1 shows lines and data points for linearregression of mean number of infected plants per pot on inoculumconcentration. A line is shown for each test separately and for alltests combined.
In the combined analysis of all tests (Table 2), a comparison ofthe sum of squares for variation among means with the sum ofsquares for linear regression on means shows that practically all(99.7%) of the variation among means is accounted for by linearregression. Departure from linearity did not approach significance.
7 Also for each test separately it was shown that linear regressionaccounted for most of the variation among the four concentrationmeans; r2 values ranged from 0.918 to 0.998, and regression wassignificant at P = 0.001 for every test.
Each test was analyzed individually for deviation of the-0 regression line from passage through the origin. Two of the seven
lines deviated significantly at P = 0.05, but one of these (Test 2) hada positive intercept and the other (Test 4) had a negative intercept.This suggests random variation rather than a trend in the data. Ifthe seven lines are regarded as a sample from a population of lines,the average intercept (-0.192 with a standard error of 0.0169) doesnot differ significantly from zero.
Significance among tests in Table 2 indicates only that the meanpercentage of infection (averaged over all virus concentrations)differed among tests. Significance of tests X linear trends showsthat there were differences among slopes of the seven regressionlines. This is a condition commonly found when essentially similar
0- viral bioassays are repeated in time (10). The infectivity of thepreserved inoculum used in these tests remained constant over the 3
3 j yr preceeding the tests and for at least 1 yr after the tests; the3 .sampling error involved in removal from storage and reconstitu-
U * tion of the freeze-dried inoculum was not significant (J. L. Dean,unpublished). Because inoculum activity was constant, andinoculation procedures were standardized, differences in slopeamong regression lines probably are attributable to week-to-weekdifferences in test plant resistance to infection.
Fig. 1. Linear regression of infection with sugarcane mosaic virus, strain E,on concentration for Tests 1-7 separately and for Tests 1-7 combined. Incurves for separate tests, each data point represents the mean of 21 pots eachcontaining 25 test plants per pot. In the curve for all tests combined, eachpoint is based on 147 pots. Relative virus concentrations of 1, 2, 4, and 8
0 2 4 6 correspond to dilutions of 1/ 160,000, 1/80,000, 1/40,000, and 1/20,000,REL. VI RUS CONCENT RAT ION respectively.
TABLE 2. Analysis of variance of data from seven tests comparing infectivities on sorghum of four concentrations of sugarcane mosaic virus in each test
Degrees of Sum of MeanSources of variation freedom squares squares F-ratioa
Among tests 6 42.12 7.02 12.53 **Among concentration means 3 186.58
Linear regression on means (1) (186.06) 186.06 332.25 **Departure from linearity (2) (0.52) 0.26
Tests X concentrations 18 68.80Tests X linear trends (6) (61.32) 10.22 18.25 **Tests X nonlinear trends (12) (7.48) 0.62 1.90 NS
Error 560 313.59 0.56Total 587 611.08
aThe asterisks (**) indicate statisticalsignificance, P = 0.01, and the abbreviation NS = not significant.
180 PHYTOPATHOLOGY

The data presented are compatible with the conclusion that, at Soc. Sugar Cane Technol. Proc. I (N. Ser.):48-51.low levels of inoculum, the inoculum-infection curve for this host- 5. DEAN, J. L. 1971. Systemic-host assay of sugarcane mosaic virus.
virus system is a straight line passing through the origin. Since Phytopathology 61:526-531.
multiple-hit curves are nonlinear, lack of a significant nonlinear 6. FINNEY, D. J. 1952. Probit Analysis. 2nd Ed. Cambridge University
component in these data is evidence that the genome of SCMV is Press, Cambridge, England. 318 pp.
undivided. FULTON, R. W. 1974. The biological activity of heterogeneousparticle types of plant viruses. Pages 723-755 in E. Kurtsak and K.Maramarosch, eds. Viruses, Evolution, and Cancer. Academic Press,New York. 813 p.
LITERATURE CITED 8. MATTHEWS, R. E. F. 1970. Plant Virology. Academic Press, NewYork. 778 p.
1. ABBOTT, E. V. and R. L. TIPPETT. 1966. Strains of sugarcane 9. PARRIS, G. K. 1970. Basic Plant Pathology. G. K. Parris(Publisher),mosaic virus. U.S. Dep. Agric. Tech. Bull. 1340. 25 p. State College, MS. 442 p.
2. BAWDEN, F. C. 1964. Plant Viruses and Virus Diseases. Ronald 10. ROBERTS, D. A. 1964. Local lesion assay. Pages 194-210 in M. K.Press, New York. 361 p. Corbett and H. D. Sisler, eds. Plant Virology. University of Florida
3. DEAN, J. L. 1970. A local lesion host for strain E of the sugarcane Press, Gainesville. 527 p.mosaic virus. Phytopathology 60:569-570. 11. VAN DER PLANK, J. E. 1975. Principles of Plant Infection. Academ-
4. DEAN, J. L. 1971. Strains of sugarcane mosaic virus in Florida. Am. ic Press, New York. 216 p.
Vol. 69, No. 2,1979 181


![Dasheen Mosaic Virus (taro disease) [typescript]](https://img.pdfslide.us/doc/110x75/568c0d0f1a28ab955a8b4862/dasheen-mosaic-virus-taro-disease-typescript.jpg)