Embed Size (px)
DESCRIPTION
Virologie engleza
Citation preview
STUDIES ON MUNGBEAN YELLOW MOSAIC VIRUS DISEASE ON GREENGRAM
Thesis submitted to the University of Agricultural sciences, dharwad
In partial fulfillment of the requirements for the
Degree of
MASTER OF SCIENCE (AGRICULTURE)
In
PLANT PATHOLOGY
By
SHAIK ABDUL SALAM
DEPARTMENT OF PLANT PATHOLOGY COLLEGE OF AGRICULTURE, DHARWAD
UNIVERSITY OF AGRICULTURAL SCIENCES, DHARWAD-580005
DECEMBER, 2005
ADVISORY COMMITTEE
Dharwad (M.S. PATIL) December, 2005 MAJOR ADVISOR Approved by:
Chairman : _____________________ (M.S. PATIL) Members : 1.____________________ (A.S. BYADGI) 2.____________________ (P.M. SALIMATH) 3.____________________ (C.P. MANSUR)

CONTENTS
Chapter No.
Title Page No.
I INTRODUCTION
II REVIEW OF LITERATURE
III
MATERIAL AND METHODS
IV EXPERIMENTAL RESULTS
V
DISCUSSION
VI SUMMARY
VII
REFERENCES
LIST OF TABLES
Table No. Title Page No.
1 Survey for MYMV incidence during kharif 2005 in five districts of Karnataka under rainfed conditions
2 Average MYMV incidence in various taluks of north Karnataka during kharif, 2005
3
Transmission studies on mungbean yellow mosaic virus
4 Seed transmission of mungbean yellow mosaic virus in mungbean
5
Development of mungbean yellow mosaic virus disease and whitefly population on greengram (cv. Chinamung) in relation to various meteorological factors during rabi summer, 2005
6 Correlation coefficients for effect of various parameters on per cent disease incidence and whitefly population during rabi-summer, 2005
7 Integrated disease management of MYMV during rabi summer 2005
8
Effect of different integrated disease management components on vector population during rabi-summer,2005
9 Effect of mungbean yellow mosaic virus disease on growth and yield parameters of mungbean
10
Yield and economics of integrated disease management of MYMV at UAS, Dharwad during rabi summer 2005
11 Screening of mungbean genotypes against MYMV during rabi-summer, 2004 (January-April) under irrigated conditions
12 Screening of mungbean genotypes against MYMV during rabi-summer, 2005 (January-April)
13 Grouping of genotypes screened against MYMV during rabi summer 2004 under irrigated conditions
14 Grouping of genotypes screened against MYMV rabi summer 2005 under irrigated conditions

LIST OF FIGURES
Figure No.
Title Between pages
1 Integrated disease management of MYMV during rabi summer 2005
2 Effect of different integrated disease management components on vector population during rabi summer, 2005
LIST OF PLATES
Plate No.
Title Between pages
1. Syptomatology of MYMV on greengram (cv. Chimanung)
2. Effect of MYMV on pods and seeds
3. Transmission of MYMV on greengram (cv. Chimamung)
4. Electron micrograph of MYMV showing Geminate particles
5. Photo showing severe MYMV infection on greengram under epidemiological studies plot
6. Photos showing effect of different managemental components on MYMV incidence during rabi summer 2005 in greengram (cv. Chinamung)
7. Genotypes showin reaction against MYMV during rabi summer 2005 (Resistant genotypes)
8. Genotypes showing reaction against MYMV during rabi summer 2005 (Susceptible genotypes)
I. INTRODUCTION
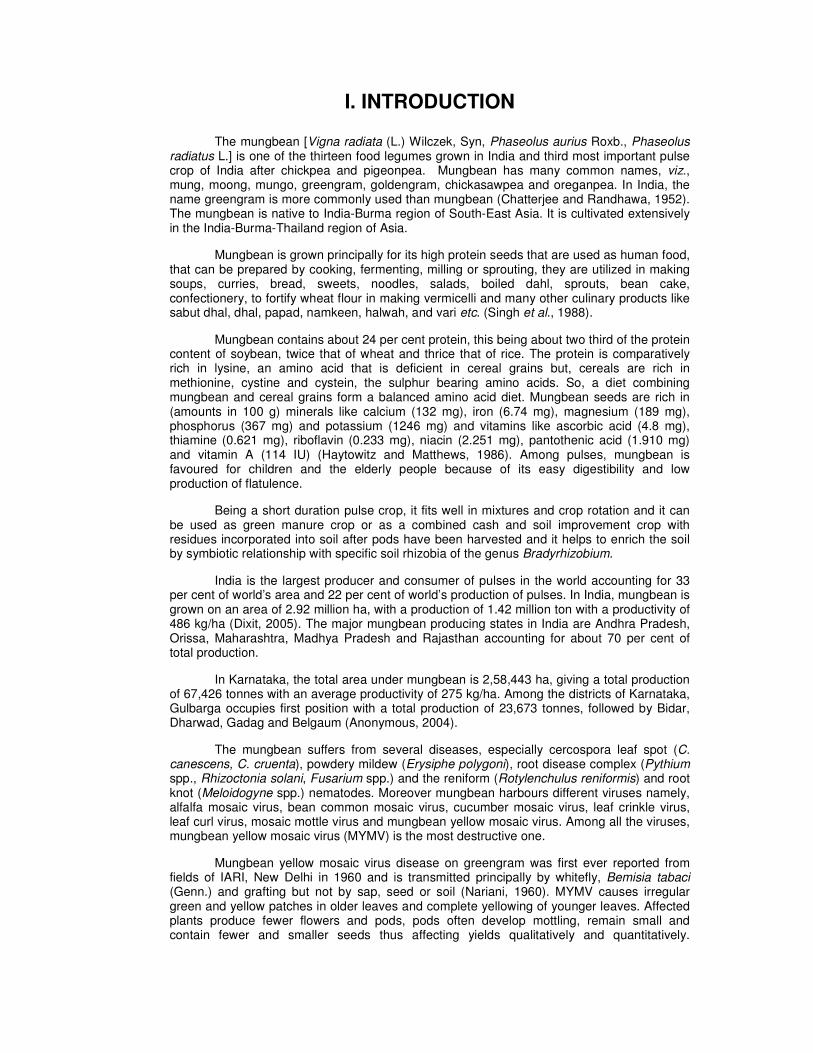
The mungbean [Vigna radiata (L.) Wilczek, Syn, Phaseolus aurius Roxb., Phaseolus radiatus L.] is one of the thirteen food legumes grown in India and third most important pulse crop of India after chickpea and pigeonpea. Mungbean has many common names, viz., mung, moong, mungo, greengram, goldengram, chickasawpea and oreganpea. In India, the name greengram is more commonly used than mungbean (Chatterjee and Randhawa, 1952). The mungbean is native to India-Burma region of South-East Asia. It is cultivated extensively in the India-Burma-Thailand region of Asia.
Mungbean is grown principally for its high protein seeds that are used as human food, that can be prepared by cooking, fermenting, milling or sprouting, they are utilized in making soups, curries, bread, sweets, noodles, salads, boiled dahl, sprouts, bean cake, confectionery, to fortify wheat flour in making vermicelli and many other culinary products like sabut dhal, dhal, papad, namkeen, halwah, and vari etc. (Singh et al., 1988).
Mungbean contains about 24 per cent protein, this being about two third of the protein content of soybean, twice that of wheat and thrice that of rice. The protein is comparatively rich in lysine, an amino acid that is deficient in cereal grains but, cereals are rich in methionine, cystine and cystein, the sulphur bearing amino acids. So, a diet combining mungbean and cereal grains form a balanced amino acid diet. Mungbean seeds are rich in (amounts in 100 g) minerals like calcium (132 mg), iron (6.74 mg), magnesium (189 mg), phosphorus (367 mg) and potassium (1246 mg) and vitamins like ascorbic acid (4.8 mg), thiamine (0.621 mg), riboflavin (0.233 mg), niacin (2.251 mg), pantothenic acid (1.910 mg) and vitamin A (114 IU) (Haytowitz and Matthews, 1986). Among pulses, mungbean is favoured for children and the elderly people because of its easy digestibility and low production of flatulence.
Being a short duration pulse crop, it fits well in mixtures and crop rotation and it can be used as green manure crop or as a combined cash and soil improvement crop with residues incorporated into soil after pods have been harvested and it helps to enrich the soil by symbiotic relationship with specific soil rhizobia of the genus Bradyrhizobium.
India is the largest producer and consumer of pulses in the world accounting for 33 per cent of world’s area and 22 per cent of world’s production of pulses. In India, mungbean is grown on an area of 2.92 million ha, with a production of 1.42 million ton with a productivity of 486 kg/ha (Dixit, 2005). The major mungbean producing states in India are Andhra Pradesh, Orissa, Maharashtra, Madhya Pradesh and Rajasthan accounting for about 70 per cent of total production.
In Karnataka, the total area under mungbean is 2,58,443 ha, giving a total production of 67,426 tonnes with an average productivity of 275 kg/ha. Among the districts of Karnataka, Gulbarga occupies first position with a total production of 23,673 tonnes, followed by Bidar, Dharwad, Gadag and Belgaum (Anonymous, 2004).
The mungbean suffers from several diseases, especially cercospora leaf spot (C. canescens, C. cruenta), powdery mildew (Erysiphe polygoni), root disease complex (Pythium spp., Rhizoctonia solani, Fusarium spp.) and the reniform (Rotylenchulus reniformis) and root knot (Meloidogyne spp.) nematodes. Moreover mungbean harbours different viruses namely, alfalfa mosaic virus, bean common mosaic virus, cucumber mosaic virus, leaf crinkle virus, leaf curl virus, mosaic mottle virus and mungbean yellow mosaic virus. Among all the viruses, mungbean yellow mosaic virus (MYMV) is the most destructive one.
Mungbean yellow mosaic virus disease on greengram was first ever reported from fields of IARI, New Delhi in 1960 and is transmitted principally by whitefly, Bemisia tabaci (Genn.) and grafting but not by sap, seed or soil (Nariani, 1960). MYMV causes irregular green and yellow patches in older leaves and complete yellowing of younger leaves. Affected plants produce fewer flowers and pods, pods often develop mottling, remain small and contain fewer and smaller seeds thus affecting yields qualitatively and quantitatively.

Reduction in number of pods/plant, seeds/pod and seed weight are the main contributing factors for yield reduction (Nene, 1973; Dhingra and Chenulu, 1985).
Though there is large area under mungbean cultivation in Karnataka, the productivity levels are low because of MYMV infections. Therefore, there is a need to study the disease occurrence, distribution, symptomatology, epidemiology and management. With this background, the present study was undertaken with the following objectives.
1. Survey for MYMV in Northern districts of Karnataka 2. Symptomatology 3. Identification of virus through transmission studies and electron microscopy 4. Epidemiological studies 5. Integrated disease management 6. Screening of mungbean germplasms against MYMV
II. REVIEW OF LITERATURE
SURVEY
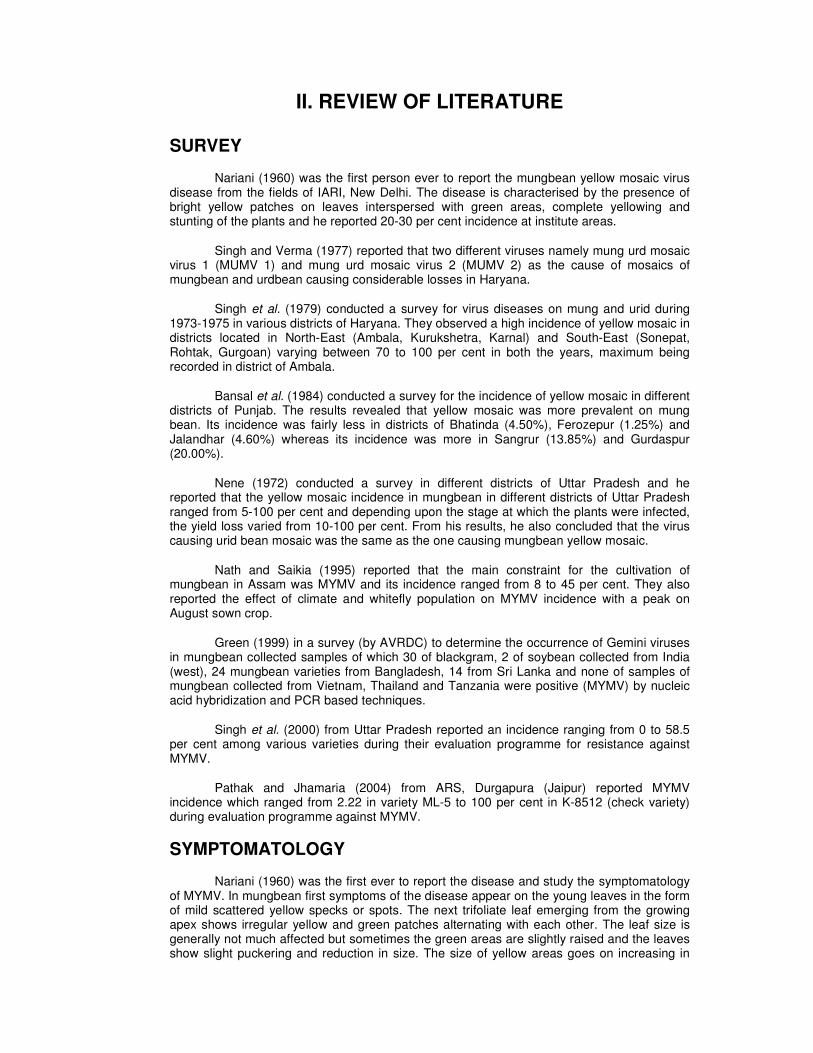
Nariani (1960) was the first person ever to report the mungbean yellow mosaic virus disease from the fields of IARI, New Delhi. The disease is characterised by the presence of bright yellow patches on leaves interspersed with green areas, complete yellowing and stunting of the plants and he reported 20-30 per cent incidence at institute areas.
Singh and Verma (1977) reported that two different viruses namely mung urd mosaic virus 1 (MUMV 1) and mung urd mosaic virus 2 (MUMV 2) as the cause of mosaics of mungbean and urdbean causing considerable losses in Haryana.
Singh et al. (1979) conducted a survey for virus diseases on mung and urid during 1973-1975 in various districts of Haryana. They observed a high incidence of yellow mosaic in districts located in North-East (Ambala, Kurukshetra, Karnal) and South-East (Sonepat, Rohtak, Gurgoan) varying between 70 to 100 per cent in both the years, maximum being recorded in district of Ambala.
Bansal et al. (1984) conducted a survey for the incidence of yellow mosaic in different districts of Punjab. The results revealed that yellow mosaic was more prevalent on mung bean. Its incidence was fairly less in districts of Bhatinda (4.50%), Ferozepur (1.25%) and Jalandhar (4.60%) whereas its incidence was more in Sangrur (13.85%) and Gurdaspur (20.00%).
Nene (1972) conducted a survey in different districts of Uttar Pradesh and he reported that the yellow mosaic incidence in mungbean in different districts of Uttar Pradesh ranged from 5-100 per cent and depending upon the stage at which the plants were infected, the yield loss varied from 10-100 per cent. From his results, he also concluded that the virus causing urid bean mosaic was the same as the one causing mungbean yellow mosaic.
Nath and Saikia (1995) reported that the main constraint for the cultivation of mungbean in Assam was MYMV and its incidence ranged from 8 to 45 per cent. They also reported the effect of climate and whitefly population on MYMV incidence with a peak on August sown crop.
Green (1999) in a survey (by AVRDC) to determine the occurrence of Gemini viruses in mungbean collected samples of which 30 of blackgram, 2 of soybean collected from India (west), 24 mungbean varieties from Bangladesh, 14 from Sri Lanka and none of samples of mungbean collected from Vietnam, Thailand and Tanzania were positive (MYMV) by nucleic acid hybridization and PCR based techniques.
Singh et al. (2000) from Uttar Pradesh reported an incidence ranging from 0 to 58.5 per cent among various varieties during their evaluation programme for resistance against MYMV.
Pathak and Jhamaria (2004) from ARS, Durgapura (Jaipur) reported MYMV incidence which ranged from 2.22 in variety ML-5 to 100 per cent in K-8512 (check variety) during evaluation programme against MYMV.
SYMPTOMATOLOGY
Nariani (1960) was the first ever to report the disease and study the symptomatology of MYMV. In mungbean first symptoms of the disease appear on the young leaves in the form of mild scattered yellow specks or spots. The next trifoliate leaf emerging from the growing apex shows irregular yellow and green patches alternating with each other. The leaf size is generally not much affected but sometimes the green areas are slightly raised and the leaves show slight puckering and reduction in size. The size of yellow areas goes on increasing in
the new growth and ultimately some of the apical leaves turn completely yellow. The diseased plants usually mature late and bear very few flowers and pods. The size of the pod is reduced and more frequently immature and small sized seeds are obtained from the pods of diseased plants. On Phaseolus mungo symptoms are essentially similar as that in mungbean. Bright yellow and green patches appear on young leaves after 12-15 days and continue to appear on new growth.
Gautam (1990) described yellow mosaic of soybean, caused by MYMV. This disease starts after 3 weeks of plant life, which was characterized by bright yellow patches developing on leaves, whereas these patches dispersed with green area along the major veins. Further, the young leaves turn completely yellow colour in severe infection.
TRANSMISSION STUDIES
Mechanical transmission
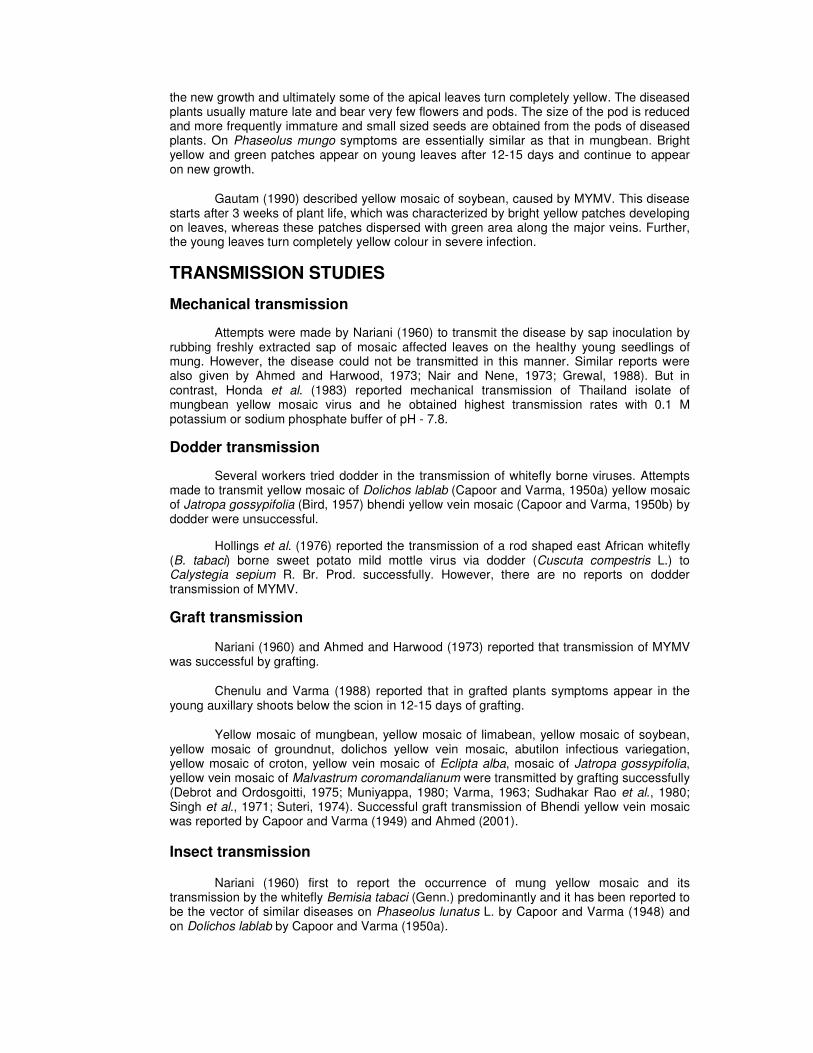
Attempts were made by Nariani (1960) to transmit the disease by sap inoculation by rubbing freshly extracted sap of mosaic affected leaves on the healthy young seedlings of mung. However, the disease could not be transmitted in this manner. Similar reports were also given by Ahmed and Harwood, 1973; Nair and Nene, 1973; Grewal, 1988). But in contrast, Honda et al. (1983) reported mechanical transmission of Thailand isolate of mungbean yellow mosaic virus and he obtained highest transmission rates with 0.1 M potassium or sodium phosphate buffer of pH - 7.8.
Dodder transmission
Several workers tried dodder in the transmission of whitefly borne viruses. Attempts made to transmit yellow mosaic of Dolichos lablab (Capoor and Varma, 1950a) yellow mosaic of Jatropa gossypifolia (Bird, 1957) bhendi yellow vein mosaic (Capoor and Varma, 1950b) by dodder were unsuccessful.
Hollings et al. (1976) reported the transmission of a rod shaped east African whitefly (B. tabaci) borne sweet potato mild mottle virus via dodder (Cuscuta compestris L.) to Calystegia sepium R. Br. Prod. successfully. However, there are no reports on dodder transmission of MYMV.
Graft transmission
Nariani (1960) and Ahmed and Harwood (1973) reported that transmission of MYMV was successful by grafting.
Chenulu and Varma (1988) reported that in grafted plants symptoms appear in the young auxillary shoots below the scion in 12-15 days of grafting.
Yellow mosaic of mungbean, yellow mosaic of limabean, yellow mosaic of soybean, yellow mosaic of groundnut, dolichos yellow vein mosaic, abutilon infectious variegation, yellow mosaic of croton, yellow vein mosaic of Eclipta alba, mosaic of Jatropa gossypifolia, yellow vein mosaic of Malvastrum coromandalianum were transmitted by grafting successfully (Debrot and Ordosgoitti, 1975; Muniyappa, 1980; Varma, 1963; Sudhakar Rao et al., 1980; Singh et al., 1971; Suteri, 1974). Successful graft transmission of Bhendi yellow vein mosaic was reported by Capoor and Varma (1949) and Ahmed (2001).
Insect transmission
Nariani (1960) first to report the occurrence of mung yellow mosaic and its transmission by the whitefly Bemisia tabaci (Genn.) predominantly and it has been reported to be the vector of similar diseases on Phaseolus lunatus L. by Capoor and Varma (1948) and on Dolichos lablab by Capoor and Varma (1950a).
Nair and Nene (1973) reported that, the whitefly, Bemisia tabaci transmits MYMV in a circulatory manner. Fifteen minutes starvation before acquisition increases transmission from 15.5 to 39 per cent and starvation before inoculation increases transmission from 12.5 to 50 per cent.
Rathi and Nene (1976) reported that the minimum acquisition and inoculation access periods (AAP and IAP) for the vector to acquire and inoculate the virus are 10-15 minutes each, although, the optimum AAP and IAP were between 4-6 and 3-4 hours, respectively.
Rathi and Nene (1974a, b) reported that female whiteflies are better transmitters and also retain the virus for a longer period (10 days) than the male (3 days). These differences have been explained on the basis of greater food intake by female whiteflies because of their larger size and because of the regurgitation of the acquired virus particles by male whiteflies.
Chenulu et al. (1979) pre-acquisition and pre-inoculation starvation have no effect on efficiency of transmission of the virus and also reported that the virus, MYMV is not transmitted transovarially by the vector.
Seed transmission
Capoor and Varma (1950a) reported that dolichos yellow mosaic virus was not seed transmissible. Similarly, Bock (1982) reported that none of the gemini viruses appears to be seed transmitted. Nariani (1960) found that mungbean seed does not transmit mungbean yellow mosaic virus. Similar observations have been reported by Ahmed and Harwood (1973), Nair and Nene (1973), Dhingra and Chenulu (1985), Grewal (1988) and Gautam (1990).
Electron microscopy
Thongmeearkom et al. (1981) was the first person to see the MYMV particles in Vigna radiata leaf cells. The virus particles often form loose aggregates, some times for almost completely and nuclei of infected phloem cells. In Vigna radiata, hypertrophied nucleoli, aggregates of virus particles and fibrillar bodies appear in nuclei of phloem cells as early as two days before symptom appearance and they some times form double cylindrical arrangements in the vacuoles of infected sieve elements.
Krishnareddy (1989) reported that young unfolded leaves were a better source of the virus than old leaves for virus purification.
Honda et al. (1983) was first to purify MYMV particles. The virus particles are geminate, 30 x 18 nm, the protein shells can perhaps be regarded as formed by the fusion of two quasi-icosahedra. The particles are stable in 2 per cent sodium phosphotungstate (pH 3.5) or 2 per cent uranyl acetate without any previous fixation. The nucleic acid of MYMV consists of circular single-stranded (Ss) DNA, about 20 per cent of particle weight (Ikegami et al., 1985).
Muniyappa et al. (1987) reported the presence of typical geminate particles, measuring 15-18 x 30 nm, in uranyl acetate – stained plant extracts of naturally infected plants of Bambara groundnut, French bean, groundnut, horsegram, limabean, mungbean and soybean.
EPIDEMIOLOGY
Murugesan and Chelliah (1977) reported a yellow mosaic on greengram sown during March to May months. The increased disease incidence might be attributed to the higher temperatures prevalent during these months, which was favourable for the vector, Bemisia tabaci to develop and multiply.
Murugesan et al. (1977) conducted simple correlation and regression analysis of whitefly population and yellow mosaic disease with weather factors. They revealed a positive correlation of whitefly population on 20 and 30 day crop and disease incidence at 45 days old crop with maximum temperatures. Partial regression coefficient of maximum temperature alone was the important variable in predicting whitefly population.
Narasimhan and Arjunan (1976) have analysed the whitefly population in relation to incidence of mosaic in cassava varieties at Salem (Tamil Nadu). They found out a high significant correlation between whitefly population and disease incidence. There was an incidence of 62.5 to 93.7 per cent disease with whitefly population of more than 50 per five highly susceptible plants. The resistance in cassava varieties to mosaic may be due to some physical or chemical factors.
Butler et al. (1983) observed the development of Bemisia tabaci Genn. in relation to temperature in constant temperature cabinets. The duration of egg stage varied from 22.5 days at 16.7°C to 5.0 days at 32.5°C, whereas eggs failed to hatch at a constant temperature of 36.0°C. The total developmental time from egg to adult varied from 65.1 days at 14.9°C to 16.6 days at 30.0°C. The average number of eggs laid per female was 81 at 26.7°C and 72 at 32.2°C. Male longevity ranged from 7.6 to 11.7 days and that of females ranged from 8.0 to 10.4 days, at 26.7 and 32.2°C, respectively.
Mohanty and Basu (1991) monitored the aerial populations of the whitefly vector for a number of virus diseases, with the help of yellow water pan traps in the fields of IARI, New Delhi. They reported that the number of trapped whiteflies were maximum during June, 1983 with maximum temperature of 38.8°C and again they recorded highest number in May, 1984 coinciding with a maximum temperature of 42.4°C. This is due to the dispersal of whiteflies from maturing spring crops to main kharif crops.
Singh and Gurha (1994) studied the influence of cropping seasons on incidence of yellow mosaic in mungbean genotypes. All the genotypes showed a higher disease incidence during summer compared to spring and rainy season crops. This is attributed to unfavourable conditions for multiplication of the vector Bemisia tabaci in spring and rainy seasons.
Nath (1994) studied the effect of weather parameters on whitefly population and incidence of yellow mosaic virus on green gram during 1990-91 in Assam. He reported a simple positive significant correlation between MYMV disease incidence and whitefly population, temperature, relative humidity, rainfall and number of rainy days and yield of green gram had a negative correlation with disease incidence.
INTEGRATED DISEASE MANAGEMENT
Cultural control
Cohen and Marco (1973) studied the efficacy of yellow sticky traps in reducing aphid-transmitted viruses. They achieved an obvious reduction in spread of cucumber mosaic virus and potato virus in treated plots than in untreated plots. They obtained 60, 38, 77, 80 and 51 per cent protection, respectively at 53, 72, 87, 90 and 114 days after planting in yellow sticky traps used plots. They insisted for further investigation in order to determine whether yellow polyethylene sheets act as mechanical barrier or the actively attracted vectors lose their virus charge in attempts to feed on it.
Singh (1985) studied the effect of barrier crops in managing viral diseases of vegetable crops and he reported that maximum protection by barriers depended on many factors such as vigour, thickness and height of barriers, environmental factors like the wind velocity and wind direction and growth of the crop. These barriers were fast growing and taller than mungbean and thus acted as hindrance in movement of whiteflies.
Sridhar (1986) reported that sunflower, sorghum and maize barriers reduced the incidence of CMV in chillies and increased the yield.
Ravindrababu (1987) reported that maize, sorghum and pearl millet barrier crops, sprayed with endosulfan were effective in reducing the incidence of mungbean mosaic as compared to barrier crops, which were not sprayed.
Uthamasamy (1989) studied the effectiveness of yellow sticky traps in cotton for monitoring the whitefly population. He reported that the traps set up at a height of 30 cm over the ground level in the cotton crop attracted most of the adult flies over that kept at 60, 90 and 120 cm height.
Raghupathi and Sabitha (1994) investigated the effect of different barrier crops on the incidence of soybean yellow mosaic virus and whitefly population. Maize and pearl millet as barrier crops for soybean reduced the incidence of yellow mosaic by 9.88 and 9.81 per cent respectively. The population of whitefly per plant was also less in soybean grown as border crop with maize (2.36) and pearl millet (2.46) as compared to control (8.62). The yellow sticky traps reduced whitefly population but not disease incidence.
Plant products and derivatives
Phadke et al. (1988) studied the effect of Neemark formulations on the incidence of whiteflies and yield of cotton and they reported that Neemark @ 0.4 per cent was on par with endosulphan @ 0.1 per cent in controlling whiteflies and bollworm incidence. Neemark @ 0.5 per cent was superior to fenvalerate @ 0.0125 per cent in controlling whitefly eggs. As far as yield is concerned, Neemark @ 0.5 per cent recorded the best yield.
Nandihalli et al. (1990) evaluated neem and neem products against cotton whitefly at RRS, Raichur, Karnataka. They reported that combinations of commercially available neem products like, Neemguard and Neemark @ 3 ml per litre each with monocrotophos 36 WSC @ 1 ml per litre were found effective in controlling whitefly with an average of 10.51 and 14.82 per cent, respectively compared to monocrotophos 36 WSC @ 1.5 ml per litre which recorded 19.08 whiteflies per leaf.
Verma and Verma (1993) reported two fold increase in nodulation and grain yield with 50 per cent reduction in mungbean yellow mosaic incidence when dry leaf powder of Clerodendron aculeatum was applied as soil amendment in addition to six times foliar spray at weekly interval.
Patel et al. (1994) tested the efficacy of Neemark (azadirachtin) as ovipositional deterrent against pests of cotton. They reported that neemark 0.5 per cent recorded only 30.39 per cent egg laying as against significantly high percentage 69.61 per cent of egg laying in untreated check by Bemisia tabaci Genn.
Verma and Varsha (1995) demonstrated the protection of Crotalaria juncea against sunnhemp rosette virus by combined treatment of CA + modifiers (CA-M) were equally effective as primed CA extract against viruses causing systemic symptoms. It was presumed that development of resistance was dependent on transcriptional machinery of the cell leading to the production of virus inhibitory agent (VIA), which is responsible for immunity of plants against viral infections.
Varma et al. (1996) purified a non phytotoxic, systemic resistance inducing agent present in Clerodendrum aculeatum leaves. It was a specific basic protein [C. aculeatum systemic resistance inducing (CA-SRI] with a molecular mass of 34 kDa and was observed in leaf extracts by sodium dodecyl sulfate polyacrylamide gel electrophoresis (SDS-PAGE). Treatment of plants with purified protein preparations induced a very high level of systemic resistance against virus infections.
Somashekara et al. (1997) reported that among neem products tested, NSKE (4%) induced high whitefly mortality while neem leaf extract and neem cake powder were ineffective against whiteflies. Further, hundred per cent mortality of B. tabaci was observed up to eight days in triazophos (0.15%) mixed with either neemark/RD9/Replin/Aphidin.
Baranwal and Ahmed (1997) reported that the plant height and tomato yield were higher when Clerodendron leaf extract was applied to soil and or sprayed. The symptoms in Clerodendron aculeatum treated plants were less than untreated plants. The foliar spray combined with soil application was most effective.
Chandrasekharan and Balasubramanian (2002) evaluated the efficacy of botanicals and insecticides against sucking pests, viz., aphid, Aphis craccivora Koch. and whitefly, Bemisia tabaci Genn. on greengram. They reported that among the treatments, acephate 75 SP @ 0.075 per cent and TNAU neem oil (C) 60 EC at 3.0 per cent were found significantly superior by recording higher percentage of reduction in aphid population and yellow mosaic virus (YMV) incidence due to whitefly and also with grain yield recording 8.5 and 7.4 q/ha, respectively.
Senguttuvan et al. (2005) evaluated Melia dubia and neem products against pests of tomato. They reported that melia seed kernel extract (MSKE) and neem seed kernel extract (NSKE) at 5 per cent concentration registered 60.19 and 69.37 per cent reductions of whitefly (Bemisia tabaci) respectively which were on par with endosulfan treatment which gave 74.62 per cent control.
Chemical control
Sastry and Singh (1973) evaluated different insecticides for control of whiteflies under field conditions and reported that ekatox (0.02%), metasystox (0.02%) and rogor (0.05%) were found superior over other treatments by registering lowest whitefly population and yellow vein mosaic incidence on okra.
Sastry and Singh (1974) conducted experiments to restrict the spread of MYMV by controlling its vector population. They reported that four sprays, each of parathion (0.02%), oxydematon methyl (0.02%) and dimethoate (0.05%) at 10 day intervals starting from the germination of okra seeds or only one application of phorate 10G (15 kg/ha) at the time of sowing the seeds not only reduced the vector, whitefly (Bemisia tabaci) but also restricted the spread of virus to a greater extent.
Mote (1976) reported that among different systemic insecticides evaluated, three applications of dimethoate or monocrotophos at 0.05 per cent at fortnightly intervals starting from 2 weeks after transplanting were found promising in controlling whitefly and also increased the yield to 307.48 and 265.19 per cent respectively.
Borah (1995) reported that the foliar application of cypermethrin (0.01, 0.015%), deltamethrin (0.0028, 0.0042%) and dimethoate (0.03, 0.04 – 5%) were effective in reducing whitefly incidence in green gram.
Borah and Nath (1995) reported that 2 sprays of dimethoate (0.03%) at 15 and 30 days after germination were found highly effective in reducing the incidence of whitefly, transmitting bhendi yellow vein mosaic virus disease.
Ahmed (2001) reported that soil application of carbofuran 3G (15 kg/ha) twice (once at sowing and 20 days after sowing) + 5 sprays of metasystox (0.2%) at 15 days interval recorded least (29.33%) incidence of bhendi yellow vein mosaic as against 91.26 per cent incidence in control plots.
Rajakumar (2001) reported that monocrotophos (1 ml/l) was the most effective treatment with lowest tomato mosaic disease incidence (8.22%) as well as least aphid population (2.71 aphids/leaf) as against 12.97 per cent disease and 11.12 aphids/leaf in control.
Imidacloprid
Mote et al. (1993) evaluated different insecticides in managing sucking pests of cotton viz., aphids, jassids, thrips, mites and whiteflies. They reported that imidacloprid seed treatment (@ 10 g/kg) effectively checked aphid and jassid population up to 60 days but for thrips and whiteflies a higher dose of 15 g/kg was found effective. Plant growth characters like plant height, number of leaves, leaf area and yield were quite superior in imidacloprid treated plots.
Mote et al. (1994a) used imidacloprid 70 WS as seed dresser on okra @ 5, 7.5, 10 and 15 g/kg seed for the control of sucking pests of okra. Seed treatment @ 15 g/kg consistently recorded least number of white flies at all observations (i.e., 20, 35 and 50 days) and also recorded least percentage of yellow vein mosaic incidence (0.8%) compared to untreated control (10%).
Jarande and Dethe (1994) reported that imidacloprid 70 WS seed treatment @ 15 g/kg seeds followed by seedlings root dip in 0.03 per cent imidacloprid gave excellent control of sucking pests and also recorded a yield of 63.47 q/ha as against 37.12 q/ha in untreated crop.
Mote et al. (1994b) tested the efficacy of imidacloprid as seed treatment and root dip against sucking pests of chilli and reported that the treatment, imidacloprid 10 g/kg seed treatment + 0.04 per cent root dip gave better protection from pests and gave good yield of dry chillies.
Walunj and Mote (1995) tested the efficacy of imidacloprid as seed treatment and root dip against sucking pests of tomato during kharif 1993, at Ahmednagar and reported that imidacloprid seed treatment (10 g/kg) + 0.04 per cent root dip gave the highest protection against pests with only 4.00 whiteflies/plant, 3.00 thrips/plant and highest yield of 74.70 q/ha as against 7.00 whiteflies/plant, 15.00 thrips/plant and 26.00 q/ha yield in untreated control.
Dandale et al. (2001) tested imidacloprid (Gaucho 70 WS) as seed treatment chemical for the control of sucking pests of cotton. They reported that a lower dose of 5 g/kg seed recorded 1.20 whiteflies/3 leaves/plant which was on par with control (0.77 whiteflies/3 leaves/plant). The cotton yield was highest in imidacloprid seed treatment at 10 g/kg followed by seed treatment at 5 g/kg.
Kotreshe (2002) reported a combination of seedling dip with confidor followed by 2 sprays of confidor and sorghum leaf extract + a spray of confidor + a spray of vertimec were found effective in reducing incidence of cucumber mosaic virus in chilli by recording 6.22 per cent incidence as against 39.85 per cent in control.
Growth attributes and losses
Premchand and Varma (1983) screened the mung and urd bean cultivars for growth components and yield against yellow mosaic disease incidence. There was a reduction of 9.6 to 38.2 per cent in height, 7 to 28.5 per cent in fresh weight of shoot and 4.3 to 22.1 per cent in dry weight, 25.7 per cent in 1000 seed weight of susceptible cultivar. However, the germinability of seeds was apparently unaffected due to yellow mosaic.
Bisht et al. (1988) studied four promising greengram cultivars, PIMS-1, PIMS-2, PIMS-3 and PIMS-4 to assess loss in growth components and yield against MYMV incidence under natural conditions. They found that average reduction in plant height and fresh plant weight were statistically non significant. Average reduction in number of pods were 5.90, 5.83; 25.65 and 24.76; average reduction in 100-grain weight were 4.95, 4.85, 27.42 and 27.02 and average reduction in yield per plant were 6.47, 6.35, 26.07 and 25.58 per cent over healthy plants, respectively in varieties PIMS-1, PIMS-2, PIMS-3 and PIMS-4.
Quaiser Ahmed (1991) reported a yield loss of 83.9 per cent and a maximum growth reduction of 62.94 per cent in Vigna radiata cv. Pusa baisakhi due to mungbean yellow mosaic gemini virus infection and he also concluded that early crop infection reduced yield more than late infection.
Aftab et al. (1993) reported MYMV infection on Vigna (Ungiliculata sub sp.) sesquipedalis at Islamabad, Pakistan. The disease spread rapidly with increase in whitefly population. Plant height, number of pods, seeds and yield/plant were reduced by 10.3, 50.5, 44.7 and 49.2 per cent, respectively.
Bhagat (1999) carried out the quantitative assessment of growth and yield parameters of three bhendi cultivars against bhindi yellow vein mosaic virus (BYVMV) incidence. He found that, yield and other attributes such as number of fruits per plant, number of leaves, plant height, length, girth and fruit weight were less affected in the resistant cultivar, Parbhani kranti compared to Vaishali vadhu (susceptible) and Pusa sawani (highly susceptible) cultivars.
Evaluation of germplasm
Chenulu et al. (1979) taken up varietal screening for resistance against MYMV at IARI, New Delhi and reported that Jalgaon-781, T-2, Khargaon and Mung local showed cent per cent infection, however, Pusa baisakhi showed least infection.
Singh et al. (1980) reported that mungbean, Hyb-4-3 A and Hyb-12-4, remained free from disease at Ludhiana. Mungbean selections 15229, L 24-2 in Punjab, ML-220, PLS 274 in Tamil Nadu and L 80, ML 326, PDM 54 and PDM 62 in UP were also reported to be resistant to yellow mosaic.
Kuldip Singh et al. (1996) screened 126 mungbean germplasm lines for resistance against MYMV. They found ML 267, ML 337, ML 393, ML 395, ML 409, ML 443, ML 591, ML 593, ML 605, MUG 225, PDM 84-143, PDM 219 and Pusa 8731 germplasms were resistant against MYMV.
Asthana (1998) from Indian Institute of Pulses Research, Kanpur reported PDM-11, PDM-54, PDM-84-139, PDM-84-143 varieties as yellow mosaic resistant and can be utilized in breeding programmes.
Siddiqui et al. (1999) evaluated some indigenous soybean lines for resistance against mungbean yellow mosaic bigemini virus, transmitted by Bemisia tabaci at IARI, New Delhi and found PK-1189, PK-1180, SL-443 and SL-444 were consistent and most promising sources of resistance.
Basandrai et al. (1999) evaluated one hundred diverse stocks of blackgram (Phaseolus mungo L.) for resistance against five different diseases widely prevalent in Himachal Pradesh. They found HPBU 38, HPBU 153, LBG 626 and UG 367 were resistant against mung bean yellow mosaic and web blight. WVG 108 was found resistant against Cercospora leaf spot and MYMV and UG 407 was resistant against Cercospora leaf spot, MYMV and powdery mildew.
Raje and Rao (2002) found that the genotypes, PLM 19, PLM 25, PLM 32, PLM 42, PLM 113, PLM 122, PLM 618, IC-1396-3, IC-2153, IC-43591, EL-3902-A-EC-5551 and J-45 were resistant to yellow mosaic virus, Cercospora leaf spot and powdery mildew under field conditions.
Marappa et al. (2003) evaluated mungbean genotypes for resistance against powdery mildew, yellow mosaic and bacterial blight at Bangalore, and they found that the genotypes AKM-9911, AKM-8803, Co-4, KM-2194, KM-188-3, MIVT-842, MIVT-854, MIVT-867, ML-173, ML-1380, DBGG-11, PMB-43, PS-16, SML-151, UPM-99-3, V-2964 and LM-56 were free from MYMV incidence.
Ganapathy et al. (2003) in view of identifying resistance against mungbean yellow mosaic virus, urdbean leaf crinkle virus and leaf curl virus in urdbean, evaluated 71 entries at NPRC, Vamban, Tamil Nadu. They found that RU 2229, VBG 86, 2KU 54, VBG 89, SU16 were highly resistant to MYMV.
Pathak and Jhamaria (2004) evaluated fourteen mungbean varieties for resistance against yellow mosaic virus at ARS Navgaon. They found ML-5 and MUM-2 were resistant with only 2.22 and 3.12 per cent infection as against cent per cent infection in K-851, a check cultivar.
Peerajade et al. (2004) tested 85 genotypes against MYMV at MARS, Dharwad. Among them, GG 41 and GG 42 were found resistant and GG 52 showed moderate resistance.

III. MATERIAL AND METHODS
In the present investigation, the following work has been carried out viz., survey, identification of virus through transmission studies and electron microscopy, epidemiology, integrated disease management and screening of germplasms against disease incidence.
3.1 MAINTENANCE OF INOCULUM
3.1.1 Raising healthy mungbean plants
Mungbean seeds were sown in polythene bags of size 6 x 4 inches filled with soil + sand + FYM. When the seedlings were of 20-30 days old, they were used for various experiments.
3.1.2 Mungbean yellow mosaic virus culture
The culture of MYMV was obtained from the maintenance plots raised in field. The healthy seedlings were frequently placed in field for natural infection. The healthy plants were also inoculated with viruliferous whiteflies collected from field. After symptom development, they were maintained in insect proof chambers for further use.
3.1.3 Vector culture
The whiteflies were collected from field by gently turning the leaves slightly upwards and sucking with an aspirator. The whiteflies were released on plants (cotton cv. DCH-32) kept in insect rearing net and subsequently maintained by frequently introducing the young plants into the net.
3.1.4 Whitefly rearing net
A net made of muslin cloth measuring 2.5 x 1.0 x 2.0 meter was hanged on to the plants (cotton cv. DCH-32) with wires. Into this net, whiteflies collected from field were frequently released for rearing.
3.2 SURVEY
Roving survey was carried out in some of the mungbean growing areas of Dharwad, Gadag, Haveri, Gulbarga and Bidar districts of Karnataka to record the incidence of mungbean yellow mosaic virus disease in the months of June-July, 2005, when crop was 1-2½ months old. Five fields were selected randomly in each village and in each field, five lines were randomly selected and disease incidence was assessed by counting total number of plants and number of plants showing distinct disease symptoms. Observations were also recorded on type of insects feeding on crop, variety grown, stage of crop, irrigated or rainfed, symptoms, etc.
3.3 SYMPTOMATOLOGY
To study the symptoms, greengram seeds of variety Chinamung were sown in polybags of size 6” x 4” filled with soil and farmyard manure. When the plants were of 7-15 days old, viruliferous whiteflies were released on plants kept in insect rearing nets. The plants were maintained in glasshouse for symptom development.
3.4 IDENTIFICATION OF VIRUS THROUGH TRANSMISSION STUDIES AND ELECTRON MICROSCOPY
3.4.1 Mechanical transmission
The MYMV infected leaves were harvested 15 days after inoculation and macerated in a pestle and mortar by adding 0.1 M phosphate buffer, pH 7.0, containing 1 per cent of 2-mercaptoethanol. The resulting pulp was strained through a muslin cloth.
Carborandum was dusted on to first and second trifoliate leaves of test plants for making microscopic punctures in epidermis. Then, the inoculation was made by rubbing the surface of leaves with cotton swab dipped in extract (inoculum) gently, unidirectionally. The leaf to be inoculated was supported by a card sheet from below to ensure uniform pressure during inoculation. Excess inoculum was washed with water using a wash bottle and the inoculated plants were kept in an insect proof glasshouse for symptom production.
3.4.2 Dodder transmission
The growing ends of the dodder (Cuscuta reflexa Roxb.) collected from healthy weeds (Lantana camara, Eichhornia crassipes etc.) were twined to young growing shoots of infected mungbean plants in anti-clockwise direction. And the growing end of dodder, established on diseased plant was twined on the young shoots of healthy test plants in anti-clockwise direction. The dodder so established was allowed to grow as bridge between donor and recipient plants for 30 days and then removed. The test plants were kept in insect proof glasshouse for symptom production.
3.4.3 Graft transmission
Wedge grafting method was employed for graft transmission. The diseased scions from MYMV infected plants were made into a ‘V’ shaped structure. The scions were inserted into slanting cut made on the healthy stock plants of mungbean. The grafted portion was tied tightly with a high-density polythene strip. The inoculated plants were kept in insect proof glasshouse for symptom production.
3.4.4 Whitefly transmission
Whiteflies were collected from rearing net and released into poly vinyl chloride (PVC) tubes in which, MYMV infected branches were inserted previously and allowed to feed for 24 h (acquisition access period). Then, the viruliferous whiteflies were released on to healthy mungbean plants by using aspirator and were allowed to feed for 24 h (Inoculation access period). After inoculation, the plants were sprayed with 0.1 per cent dimethoate to kill all the whiteflies. The inoculated plants were kept in insect proof glasshouse for symptom development.
3.4.5 Seed transmission
The matured seeds were collected from plants showing distinct yellow mosaic symptoms and also from healthy plants of variety Chinamung. Hundred seeds each from healthy and diseased plants were sown in polythene bags containing soil + sand + farmyard manure mixture. After recording germination percentage, the seedlings were kept in insect proof glasshouse for symptom production.
3.4.6 Electron microscopy
The MYMV infected leaf samples (40-45 days old) of cv. Chinamung were sent to IARI for virus identification through electron microscopy. The partially purified preparation of MYMV was negatively stained using freshly prepared one per cent aqueous uranyl acetate at

pH 3.7. Carbon coated grids were used. Samples were observed in JOEL-100 EX-II transmission electron microscope (IARI, New Delhi) at 1,00,000x magnification.
3.5 INTEGRATED DISEASE MANAGEMENT
To know the effectiveness of different management practices against MYMV, the experiment was laid out at UAS, Dharwad during rabi-summer, 2005, with the following treatments.
Rabi-Summer, 2005
Design : Randomized Block Design (RBD)
Plot size : 3.0 m x 2.7 m
Replications : 3
Treatments : 13
Spacing : 30 cm x 10 cm
Variety : Chinamung
T1 - Maize as border row (1 row)
T2 - Seed treatment with imidacloprid 70 WS (5 g/kg)
T3 - Two sprays with imidacloprid 17.8 SL (0.24 ml/l)
T4 - Two sprays with Clerodendrum aculeatum leaf extract (1:5)
T5 - Two sprays with azadirachtin 0.03 EC (5 ml/l)
T6 - Two sprays with dimethoate 30 EC (1.5 ml/l)
T7 - Marigold as trap crop + yellow sticky traps (8/ha)
T8 - T2 + T3
T9 - T2 + T4
T10 - T2 + T5
T11 - T2 + T6
T12 - Package of practices [Rhizobium (375 g/ha) + Carbendazim 2 g/kg + fenvalerate (1.5 ml/l)]
T13 - Untreated check
The imidacloprid, dimethoate, Clerodendrum leaf extract and nimbicidine sprays were taken up at 45 and 60 days after sowing.
3.5.1 Per cent disease incidence
It was calculated by counting number of plants infected and total number of plants in a plot.
Number of plants infected in a row Per cent disease incidence = X 100
Total number of plants in a row
The readings were recorded at 15 days before initiation of sprays, 15 days after first and 15 days after second sprays and the data were analysed statistically. The per cent disease inhibition over control was calculated by using the formula given by Vincent (1927).
(C-T) Per cent disease inhibition = X 100
C
Where,
C = Per cent disease in control
T = Per cent disease in treatment
3.5.2 Vector population
The number of whiteflies on top 3 trifoliate leaves per plant from each of five randomly selected plants at one day before and 5 days after sprays were recorded in each treatment. Per cent reduction over control was calculated by using formula.
Number of whiteflies in
control Number of whiteflies in
treatment
X 100
Per cent reduction over control = Number of whiteflies in control
3.5.3 Growth and yield parameters
Randomly five plants from each treatment were collected (at harvesting stage) for assessing growth and yield parameters. The effect of MYMV on plant height, pods per plant, seed yield per plant, 100 seed weight and yield per ha was studied and the five plant average data was analysed statistically.
3.5.4 Yield and economics
Net returns from each treatment were calculated by taking into account of yield obtained and cost of treatment application on hectare basis. Benefit : cost ratio was calculated to compare the feasibility of various treatments economically and whatever the increased yield obtained over control was because of the plant protection measures applied only.
3.6 EPIDEMIOLOGY
To assess the effect of various weather parameters on vector population and per cent disease incidence, a plot of 3.0 x 7.0 mt (cv. Chinamung) was raised at Main Agricultural Research Station, Dharwad during rabi-summer, 2005. The data on whitefly population per plant (5 plants average), per cent disease incidence were recorded weekly. The data was correlated with various weather parameters and multiple regression equations were computed to know the influence of weather on whitefly vector in spreading the disease.
3.7 SCREENING GERMPLASMS AGAINST MYMV INCIDENCE
Studies were undertaken to test the resistance of local mungbean germplasms against mungbean yellow mosaic virus disease. Field experiments were conducted during rabi-summer, 2004 and rabi-summer, 2005 under irrigated conditions at Main Agricultural Research Station, Dharwad.
A total of 103 genotypes and various crosses during rabi-summer 2004 and 25 genotypes during rabi-summer, 2005 were collected from MULLaRP, Main Agricultural Research Station, Dharwad and were planted in 2 rows of 5 meter each with Chinamung as

susceptible check after every 5 test entries. Per cent disease incidence was calculated by using the following formula.
Number of plants infected in a row Per cent disease incidence = X 100
Total number of plants in a row
The genotypes were later grouped into different categories based on 0 to 9 scale from immune to highly susceptible according to Mayee and Datar (1986).
Scale Description Category
0 No plants showing any symptoms Immune
1 1% or less plants exhibiting symptoms Resistant
3 1-10% plants exhibiting symptoms Moderately resistant
5 11-20% plants exhibiting symptoms Moderately susceptible
7 21-50% plants exhibiting symptoms Susceptible
9 51% plants exhibiting symptoms Highly susceptible
IV. EXPERIMENTAL RESULTS
The results of the investigations carried out on MYMV during the year 2003-04 and 2004-05 were presented hereunder.
4.1 SURVEY
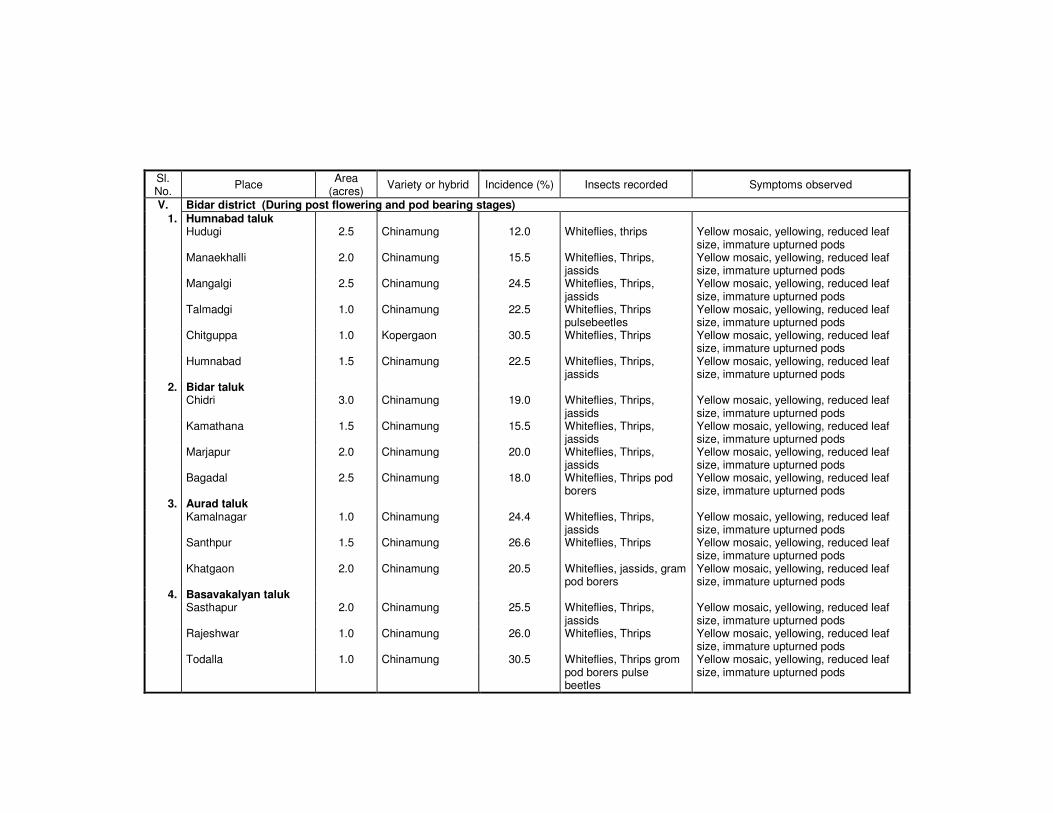
A roving survey to know the incidence of mungbean yellow mosaic virus was undertaken in parts of five districts of north Karnataka viz., Dharwad, Gadag, Haveri, Gulbarga and Bidar during kharif, 2005 when the crop was in vegetative growth, flowering and pod bearing stages. During this period, a total of 98 villages i.e., 18, 19, 17, 28 and 16 villages in Dharwad, Gadag, Haveri, Gulbarga and Bidar districts, respectively were surveyed. All the plants in the randomly selected area of the fields were first counted and then number of plants showing the symptoms of MYMV were recorded separately to calculate the per cent disease incidence. The survey results were presented in Table 1. They indicated a low incidence of yellow mosaic during kharif, 2005 ranging from 0 to 30.5 per cent.
Table 1. Survey for MYMV incidence during kharif 2005 in five districts of Karnataka under rainfed conditions
Among the villages surveyed, Chitguppa of Humnabad taluk and Todalla of Basavakalyan taluk of Bidar have recorded maximum incidence of MYMV to the order of 30.5 per cent. This was followed by 26.6 per cent at Santhpur of Aurad taluk, 26.0 per cent at Rajeshwar of Basavakalyan taluk, 25.5 per cent at Sasthapur of Basavakalyan taluk of Bidar, 24.8 per cent was recorded at Shahbad of Jevargi taluk and Savoor of Yadgir taluk of Gulbarga district. Among the taluks, highest average per cent disease incidence was noticed in Basavakalyan and Aurad recording 27.3 and 23.8 per cent, respectively. Sedam taluk recorded the highest average PDI of 20.2 in Gulbarga district. Ron taluk of Gadag district was free of disease with zero average PDI (Table 2).
Table 2. Average MYMV incidence in various taluks of north Karnataka during kharif, 2005
The MYMV incidence was 0 to 11.5 per cent in Dharwad district and it was 1.5 to 16.5 per cent in Haveri district. In Gadag district, there was almost no incidence of MYMV and its infection was very meagre. But, Morab was the only village of Navalgund taluk showing an incidence of 15 per cent in Gadag district.
The disease incidence was comparatively more in Bidar district followed by Gulbarga, Haveri, Dharwad and Gadag districts. Among the varieties grown, Chinamung is the sole variety that occupied 95 per cent of area in these 5 districts and the remaining area was under Selection-4 and Kopergoan. However, all the varieties were found susceptible to MYMV infection. It was noticed that the crop infected at early stage suffered more with severe symptoms with almost all the leaves exhibited mosaic and complete yellowing and reduction in leaf size. In the severely infected leaves, the green areas become thick, leathery and raised showing puckering. The plants showed late maturity giving few flowers and pods. The flower stalk was condensed very much. The pods were reduced in size, yellowish in colour, turned upwards, giving few under developed and immatured seeds.
Invariably whiteflies were found feeding in most of the fields surveyed along with jassids, thrips, pod borers and pulse beetles in some of the fields.
4.2 SYMPTOMATOLOGY
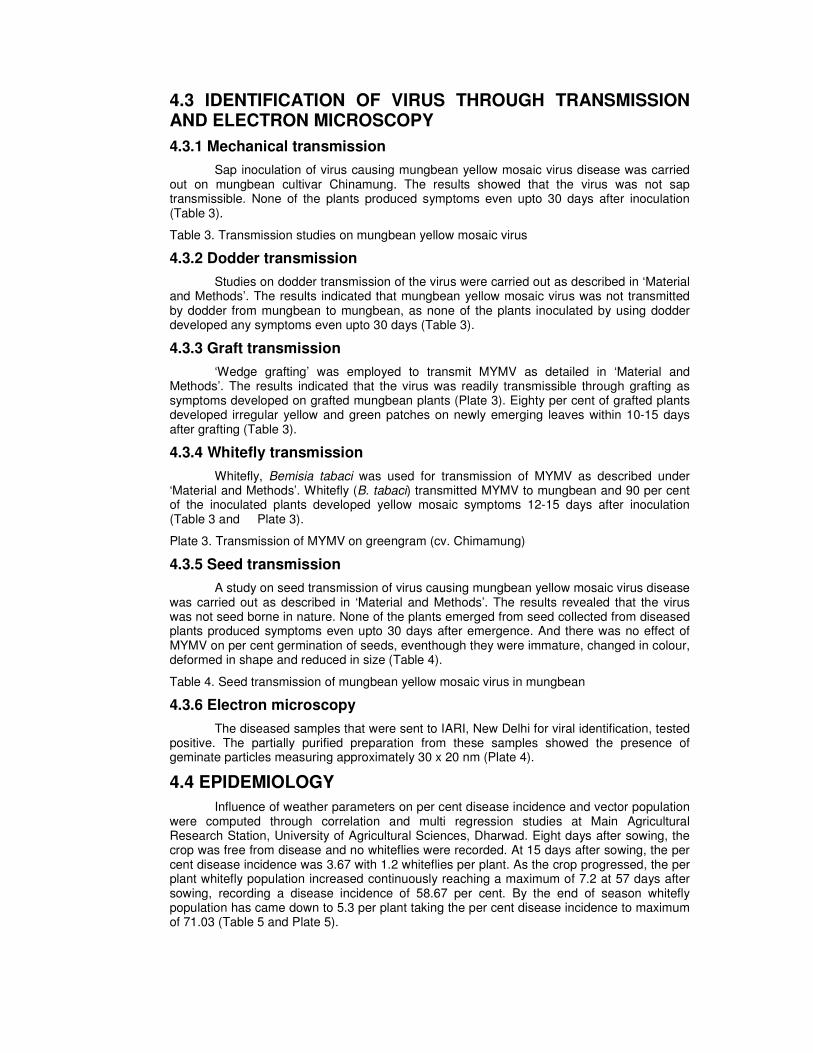
All the test plants of mungbean cv. Chinamung inoculated with the virus developed characteristic symptoms of MYMV viz., irregular yellow and green patches on trifoliate leaves, puckering and raised green areas on leaves, reduction in leaf size and complete yellowing of apical leaves, bare peduncle with stunted internodes and few flowers and pods. Pods were bleached to yellow, turned upwards bearing few immature and small sized seeds (Plate 1 and 2).
Plate 1. Symptomatology of MYMV on greengram (cv. Chimanung)
Plate 2. Effect of MYMV on pods and seeds
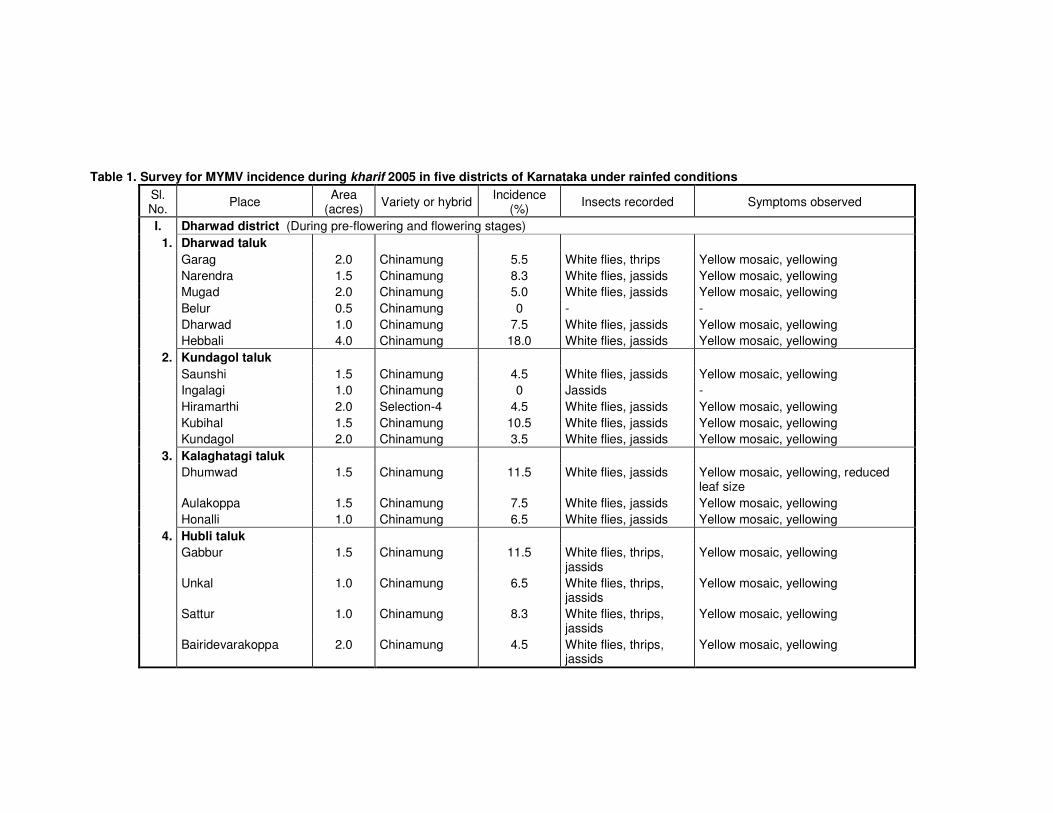
Table 1. Survey for MYMV incidence during kharif 2005 in five districts of Karnataka under rainfed conditions
Sl. No.
Place Area
(acres) Variety or hybrid
Incidence (%)
Insects recorded Symptoms observed
I. Dharwad district (During pre-flowering and flowering stages)
1. Dharwad taluk
Garag 2.0 Chinamung 5.5 White flies, thrips Yellow mosaic, yellowing
Narendra 1.5 Chinamung 8.3 White flies, jassids Yellow mosaic, yellowing
Mugad 2.0 Chinamung 5.0 White flies, jassids Yellow mosaic, yellowing
Belur 0.5 Chinamung 0 - -
Dharwad 1.0 Chinamung 7.5 White flies, jassids Yellow mosaic, yellowing
Hebbali 4.0 Chinamung 18.0 White flies, jassids Yellow mosaic, yellowing
2. Kundagol taluk
Saunshi 1.5 Chinamung 4.5 White flies, jassids Yellow mosaic, yellowing
Ingalagi 1.0 Chinamung 0 Jassids -
Hiramarthi 2.0 Selection-4 4.5 White flies, jassids Yellow mosaic, yellowing
Kubihal 1.5 Chinamung 10.5 White flies, jassids Yellow mosaic, yellowing
Kundagol 2.0 Chinamung 3.5 White flies, jassids Yellow mosaic, yellowing
3. Kalaghatagi taluk
Dhumwad 1.5 Chinamung 11.5 White flies, jassids Yellow mosaic, yellowing, reduced leaf size
Aulakoppa 1.5 Chinamung 7.5 White flies, jassids Yellow mosaic, yellowing
Honalli 1.0 Chinamung 6.5 White flies, jassids Yellow mosaic, yellowing
4. Hubli taluk
Gabbur 1.5 Chinamung 11.5 White flies, thrips, jassids
Yellow mosaic, yellowing
Unkal 1.0 Chinamung 6.5 White flies, thrips, jassids
Yellow mosaic, yellowing
Sattur 1.0 Chinamung 8.3 White flies, thrips, jassids
Yellow mosaic, yellowing
Bairidevarakoppa 2.0 Chinamung 4.5 White flies, thrips, jassids
Yellow mosaic, yellowing
Sl. No.
Place Area
(acres) Variety or hybrid
Incidence (%)
Insects recorded Symptoms observed
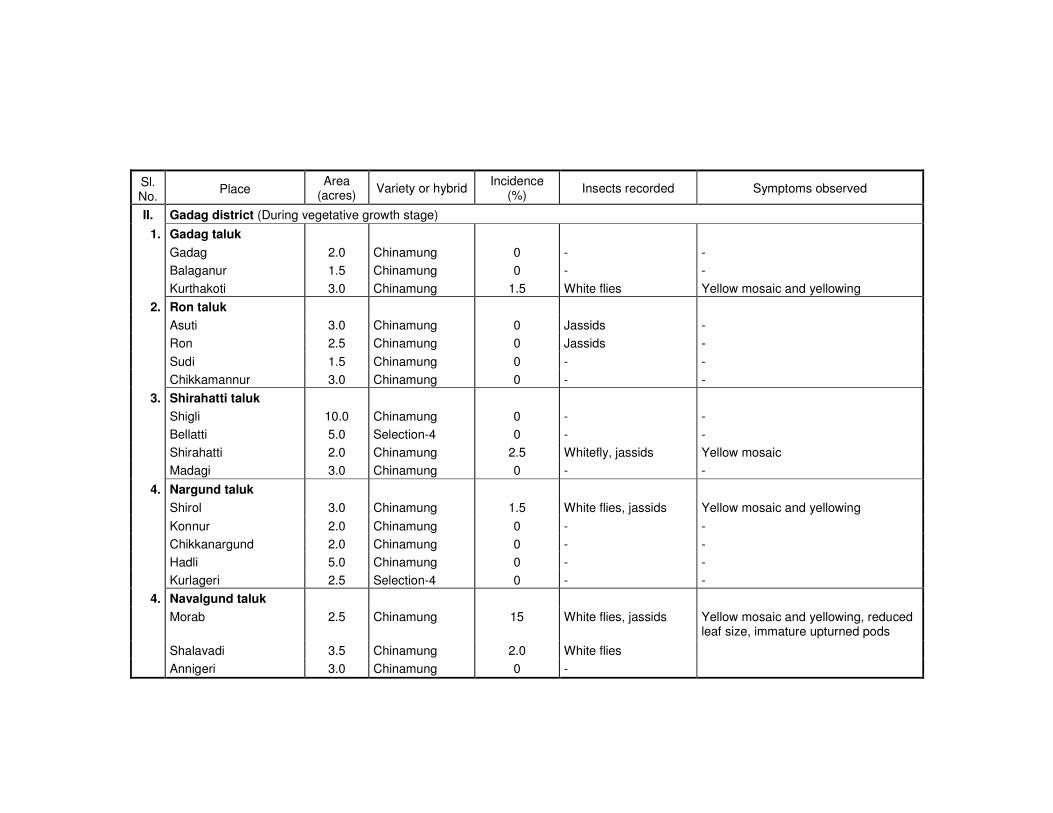
II. Gadag district (During vegetative growth stage)
1. Gadag taluk
Gadag 2.0 Chinamung 0 - -
Balaganur 1.5 Chinamung 0 - -
Kurthakoti 3.0 Chinamung 1.5 White flies Yellow mosaic and yellowing
2. Ron taluk
Asuti 3.0 Chinamung 0 Jassids -
Ron 2.5 Chinamung 0 Jassids -
Sudi 1.5 Chinamung 0 - -
Chikkamannur 3.0 Chinamung 0 - -
3. Shirahatti taluk
Shigli 10.0 Chinamung 0 - -
Bellatti 5.0 Selection-4 0 - -
Shirahatti 2.0 Chinamung 2.5 Whitefly, jassids Yellow mosaic
Madagi 3.0 Chinamung 0 - -
4. Nargund taluk
Shirol 3.0 Chinamung 1.5 White flies, jassids Yellow mosaic and yellowing
Konnur 2.0 Chinamung 0 - -
Chikkanargund 2.0 Chinamung 0 - -
Hadli 5.0 Chinamung 0 - -
Kurlageri 2.5 Selection-4 0 - -
4. Navalgund taluk
Morab 2.5 Chinamung 15 White flies, jassids Yellow mosaic and yellowing, reduced leaf size, immature upturned pods
Shalavadi 3.5 Chinamung 2.0 White flies
Annigeri 3.0 Chinamung 0 -
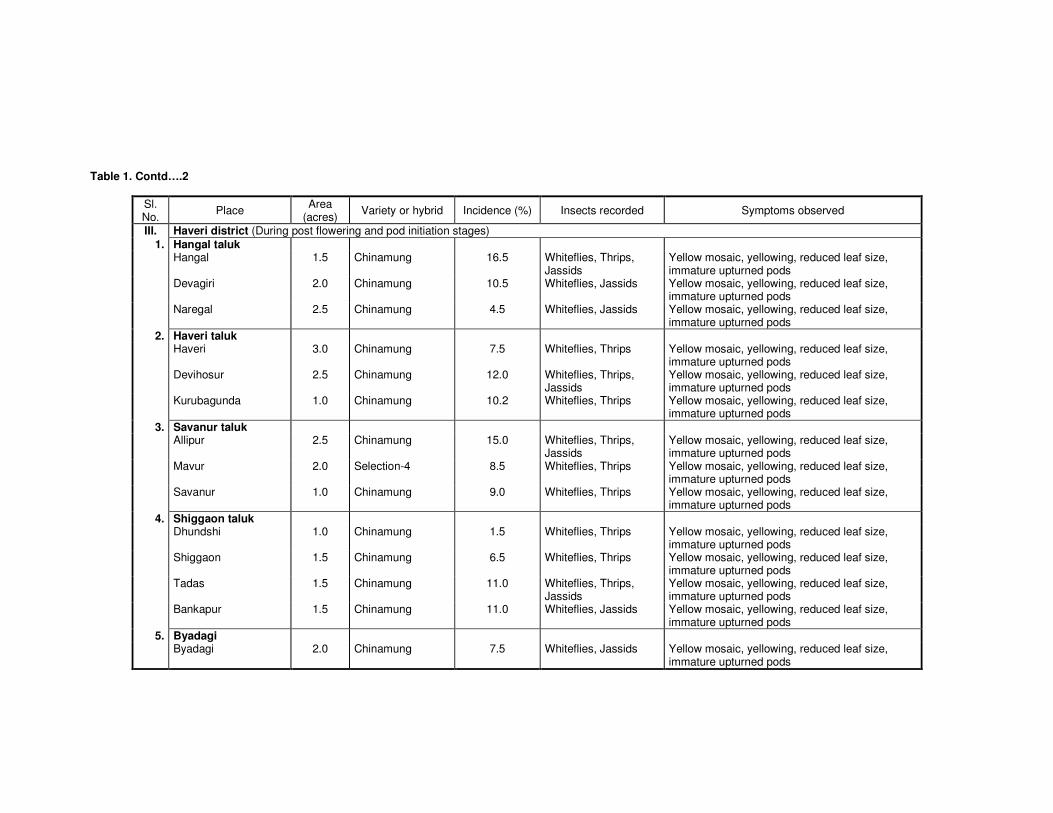
Table 1. Contd….2
Sl. No.
Place Area
(acres) Variety or hybrid Incidence (%) Insects recorded Symptoms observed
III. Haveri district (During post flowering and pod initiation stages)
1. Hangal taluk Hangal 1.5 Chinamung 16.5 Whiteflies, Thrips,
Jassids Yellow mosaic, yellowing, reduced leaf size, immature upturned pods
Devagiri 2.0 Chinamung 10.5 Whiteflies, Jassids Yellow mosaic, yellowing, reduced leaf size, immature upturned pods
Naregal 2.5 Chinamung 4.5 Whiteflies, Jassids Yellow mosaic, yellowing, reduced leaf size, immature upturned pods
2. Haveri taluk Haveri 3.0 Chinamung 7.5 Whiteflies, Thrips Yellow mosaic, yellowing, reduced leaf size,
immature upturned pods Devihosur 2.5 Chinamung 12.0 Whiteflies, Thrips,
Jassids Yellow mosaic, yellowing, reduced leaf size, immature upturned pods
Kurubagunda 1.0 Chinamung 10.2 Whiteflies, Thrips Yellow mosaic, yellowing, reduced leaf size, immature upturned pods
3. Savanur taluk Allipur 2.5 Chinamung 15.0 Whiteflies, Thrips,
Jassids Yellow mosaic, yellowing, reduced leaf size, immature upturned pods
Mavur 2.0 Selection-4 8.5 Whiteflies, Thrips Yellow mosaic, yellowing, reduced leaf size, immature upturned pods
Savanur 1.0 Chinamung 9.0 Whiteflies, Thrips Yellow mosaic, yellowing, reduced leaf size, immature upturned pods
4. Shiggaon taluk Dhundshi 1.0 Chinamung 1.5 Whiteflies, Thrips Yellow mosaic, yellowing, reduced leaf size,
immature upturned pods Shiggaon 1.5 Chinamung 6.5 Whiteflies, Thrips Yellow mosaic, yellowing, reduced leaf size,
immature upturned pods Tadas 1.5 Chinamung 11.0 Whiteflies, Thrips,
Jassids Yellow mosaic, yellowing, reduced leaf size, immature upturned pods
Bankapur 1.5 Chinamung 11.0 Whiteflies, Jassids Yellow mosaic, yellowing, reduced leaf size, immature upturned pods
5. Byadagi Byadagi 2.0 Chinamung 7.5 Whiteflies, Jassids Yellow mosaic, yellowing, reduced leaf size,
immature upturned pods
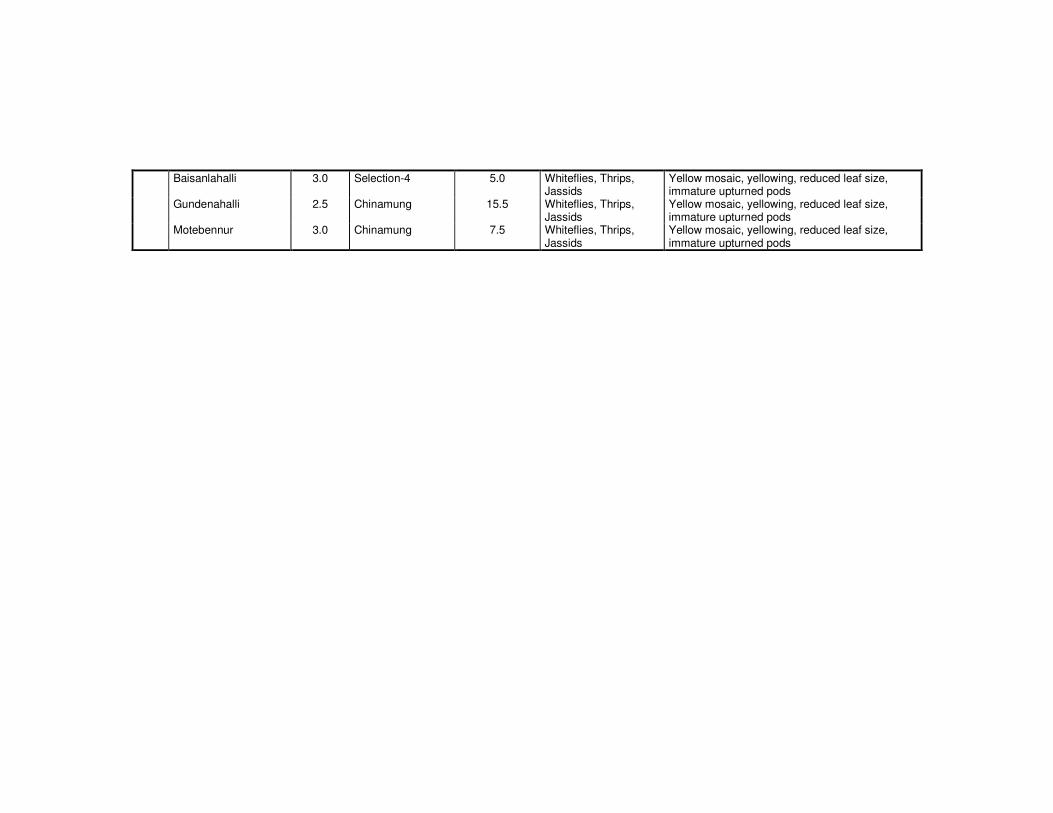
Baisanlahalli 3.0 Selection-4 5.0 Whiteflies, Thrips, Jassids
Yellow mosaic, yellowing, reduced leaf size, immature upturned pods
Gundenahalli 2.5 Chinamung 15.5 Whiteflies, Thrips, Jassids
Yellow mosaic, yellowing, reduced leaf size, immature upturned pods
Motebennur 3.0 Chinamung 7.5 Whiteflies, Thrips, Jassids
Yellow mosaic, yellowing, reduced leaf size, immature upturned pods
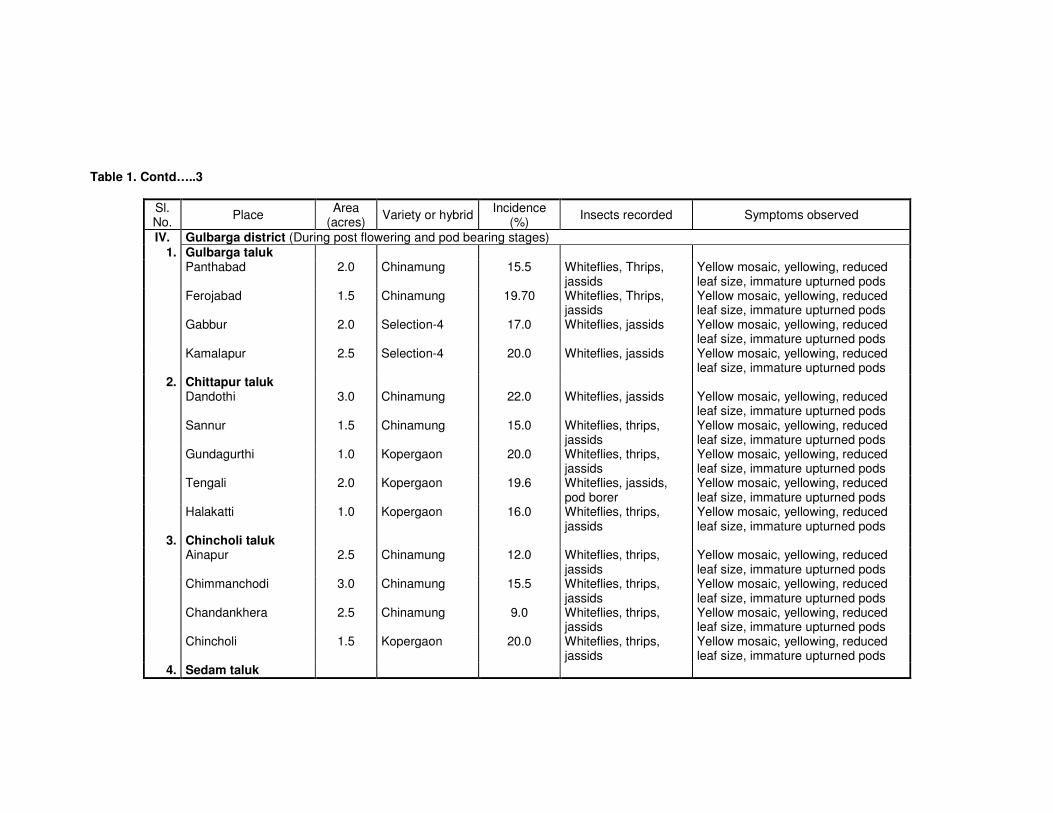
Table 1. Contd…..3
Sl. No.
Place Area
(acres) Variety or hybrid
Incidence (%)
Insects recorded Symptoms observed
IV. Gulbarga district (During post flowering and pod bearing stages)
1. Gulbarga taluk Panthabad 2.0 Chinamung 15.5 Whiteflies, Thrips,
jassids Yellow mosaic, yellowing, reduced leaf size, immature upturned pods
Ferojabad 1.5 Chinamung 19.70 Whiteflies, Thrips, jassids
Yellow mosaic, yellowing, reduced leaf size, immature upturned pods
Gabbur 2.0 Selection-4 17.0 Whiteflies, jassids Yellow mosaic, yellowing, reduced leaf size, immature upturned pods
Kamalapur 2.5 Selection-4 20.0 Whiteflies, jassids Yellow mosaic, yellowing, reduced leaf size, immature upturned pods
2. Chittapur taluk Dandothi 3.0 Chinamung 22.0 Whiteflies, jassids Yellow mosaic, yellowing, reduced
leaf size, immature upturned pods Sannur 1.5 Chinamung 15.0 Whiteflies, thrips,
jassids Yellow mosaic, yellowing, reduced leaf size, immature upturned pods
Gundagurthi 1.0 Kopergaon 20.0 Whiteflies, thrips, jassids
Yellow mosaic, yellowing, reduced leaf size, immature upturned pods
Tengali 2.0 Kopergaon 19.6 Whiteflies, jassids, pod borer
Yellow mosaic, yellowing, reduced leaf size, immature upturned pods
Halakatti 1.0 Kopergaon 16.0 Whiteflies, thrips, jassids
Yellow mosaic, yellowing, reduced leaf size, immature upturned pods
3. Chincholi taluk Ainapur 2.5 Chinamung 12.0 Whiteflies, thrips,
jassids Yellow mosaic, yellowing, reduced leaf size, immature upturned pods
Chimmanchodi 3.0 Chinamung 15.5 Whiteflies, thrips, jassids
Yellow mosaic, yellowing, reduced leaf size, immature upturned pods
Chandankhera 2.5 Chinamung 9.0 Whiteflies, thrips, jassids
Yellow mosaic, yellowing, reduced leaf size, immature upturned pods
Chincholi 1.5 Kopergaon 20.0 Whiteflies, thrips, jassids
Yellow mosaic, yellowing, reduced leaf size, immature upturned pods
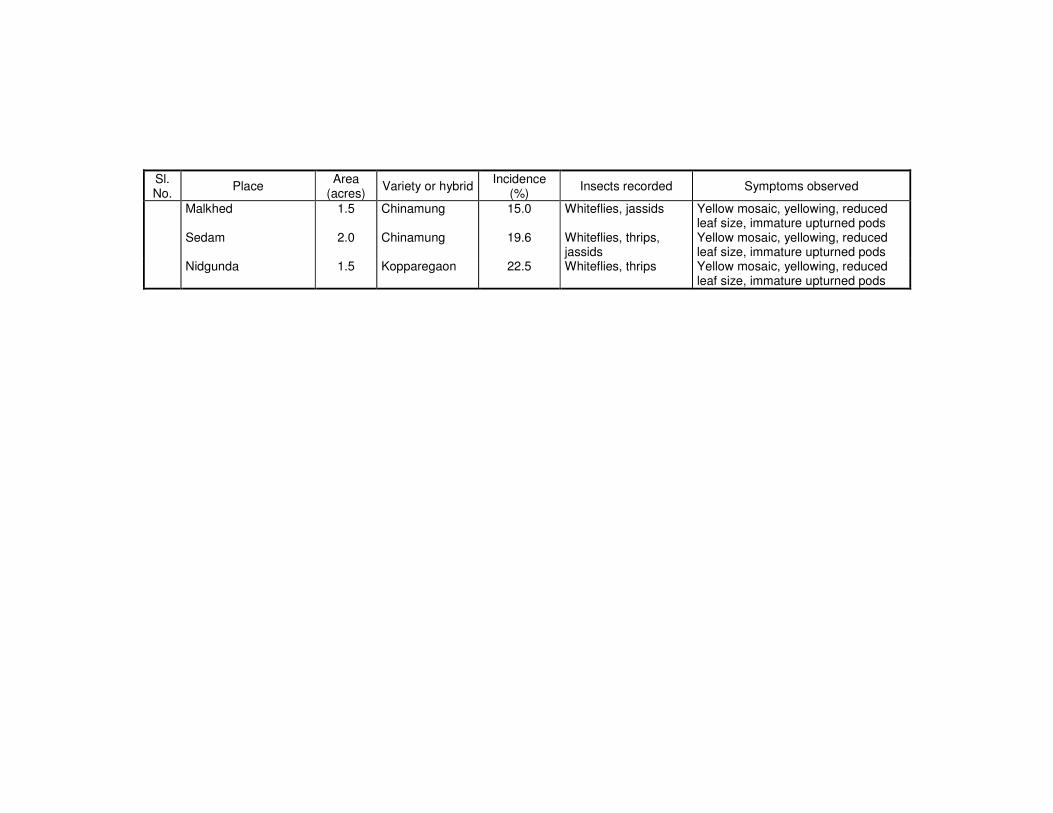
4. Sedam taluk
Sl. No.
Place Area
(acres) Variety or hybrid
Incidence (%)
Insects recorded Symptoms observed
Malkhed 1.5 Chinamung 15.0 Whiteflies, jassids Yellow mosaic, yellowing, reduced leaf size, immature upturned pods
Sedam 2.0 Chinamung 19.6 Whiteflies, thrips, jassids
Yellow mosaic, yellowing, reduced leaf size, immature upturned pods
Nidgunda 1.5 Kopparegaon 22.5 Whiteflies, thrips Yellow mosaic, yellowing, reduced leaf size, immature upturned pods
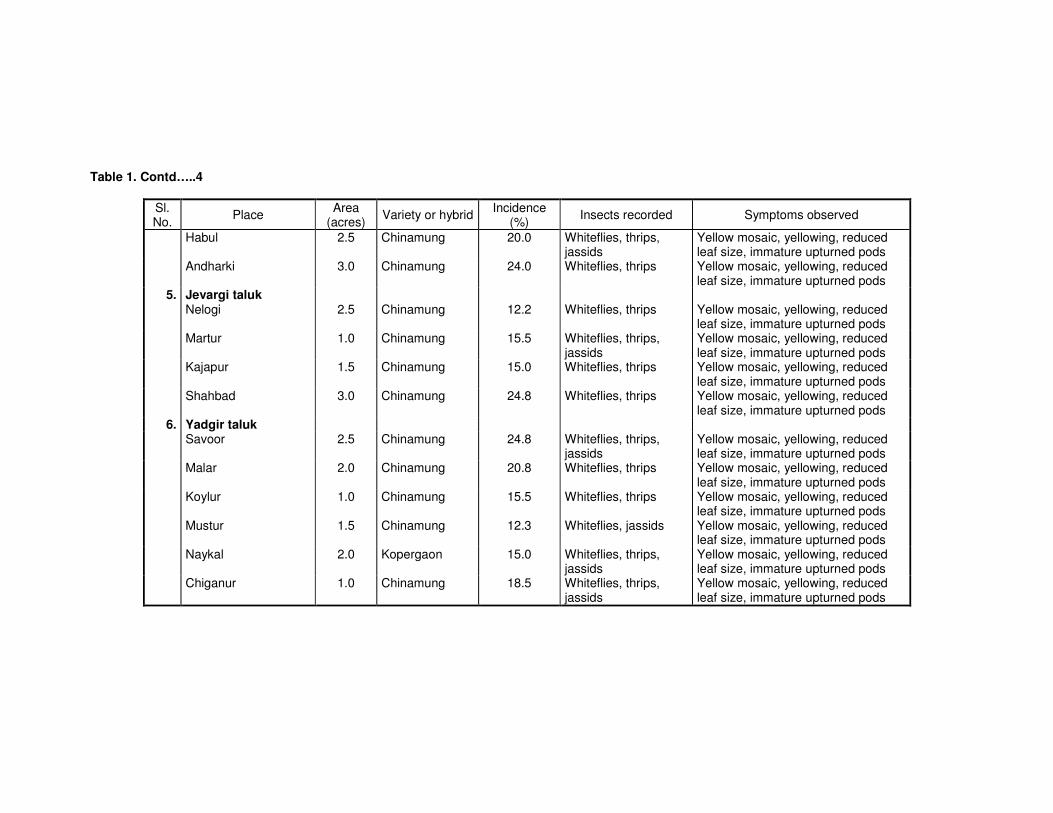
Table 1. Contd…..4
Sl. No.
Place Area
(acres) Variety or hybrid
Incidence (%)
Insects recorded Symptoms observed
Habul 2.5 Chinamung 20.0 Whiteflies, thrips, jassids
Yellow mosaic, yellowing, reduced leaf size, immature upturned pods
Andharki 3.0 Chinamung 24.0 Whiteflies, thrips Yellow mosaic, yellowing, reduced leaf size, immature upturned pods
5. Jevargi taluk Nelogi 2.5 Chinamung 12.2 Whiteflies, thrips Yellow mosaic, yellowing, reduced
leaf size, immature upturned pods Martur 1.0 Chinamung 15.5 Whiteflies, thrips,
jassids Yellow mosaic, yellowing, reduced leaf size, immature upturned pods
Kajapur 1.5 Chinamung 15.0 Whiteflies, thrips Yellow mosaic, yellowing, reduced leaf size, immature upturned pods
Shahbad 3.0 Chinamung 24.8 Whiteflies, thrips Yellow mosaic, yellowing, reduced leaf size, immature upturned pods
6. Yadgir taluk Savoor 2.5 Chinamung 24.8 Whiteflies, thrips,
jassids Yellow mosaic, yellowing, reduced leaf size, immature upturned pods
Malar 2.0 Chinamung 20.8 Whiteflies, thrips Yellow mosaic, yellowing, reduced leaf size, immature upturned pods
Koylur 1.0 Chinamung 15.5 Whiteflies, thrips Yellow mosaic, yellowing, reduced leaf size, immature upturned pods
Mustur 1.5 Chinamung 12.3 Whiteflies, jassids Yellow mosaic, yellowing, reduced leaf size, immature upturned pods
Naykal 2.0 Kopergaon 15.0 Whiteflies, thrips, jassids
Yellow mosaic, yellowing, reduced leaf size, immature upturned pods
Chiganur 1.0 Chinamung 18.5 Whiteflies, thrips, jassids
Yellow mosaic, yellowing, reduced leaf size, immature upturned pods
Sl. No.
Place Area
(acres) Variety or hybrid Incidence (%) Insects recorded Symptoms observed
V. Bidar district (During post flowering and pod bearing stages)
1. Humnabad taluk Hudugi 2.5 Chinamung 12.0 Whiteflies, thrips Yellow mosaic, yellowing, reduced leaf
size, immature upturned pods Manaekhalli 2.0 Chinamung 15.5 Whiteflies, Thrips,
jassids Yellow mosaic, yellowing, reduced leaf size, immature upturned pods
Mangalgi 2.5 Chinamung 24.5 Whiteflies, Thrips, jassids
Yellow mosaic, yellowing, reduced leaf size, immature upturned pods
Talmadgi 1.0 Chinamung 22.5 Whiteflies, Thrips pulsebeetles
Yellow mosaic, yellowing, reduced leaf size, immature upturned pods
Chitguppa 1.0 Kopergaon 30.5 Whiteflies, Thrips Yellow mosaic, yellowing, reduced leaf size, immature upturned pods
Humnabad 1.5 Chinamung 22.5 Whiteflies, Thrips, jassids
Yellow mosaic, yellowing, reduced leaf size, immature upturned pods
2. Bidar taluk Chidri 3.0 Chinamung 19.0 Whiteflies, Thrips,
jassids Yellow mosaic, yellowing, reduced leaf size, immature upturned pods
Kamathana 1.5 Chinamung 15.5 Whiteflies, Thrips, jassids
Yellow mosaic, yellowing, reduced leaf size, immature upturned pods
Marjapur 2.0 Chinamung 20.0 Whiteflies, Thrips, jassids
Yellow mosaic, yellowing, reduced leaf size, immature upturned pods
Bagadal 2.5 Chinamung 18.0 Whiteflies, Thrips pod borers
Yellow mosaic, yellowing, reduced leaf size, immature upturned pods
3. Aurad taluk Kamalnagar 1.0 Chinamung 24.4 Whiteflies, Thrips,
jassids Yellow mosaic, yellowing, reduced leaf size, immature upturned pods
Santhpur 1.5 Chinamung 26.6 Whiteflies, Thrips Yellow mosaic, yellowing, reduced leaf size, immature upturned pods
Khatgaon 2.0 Chinamung 20.5 Whiteflies, jassids, gram pod borers
Yellow mosaic, yellowing, reduced leaf size, immature upturned pods
4. Basavakalyan taluk Sasthapur 2.0 Chinamung 25.5 Whiteflies, Thrips,
jassids Yellow mosaic, yellowing, reduced leaf size, immature upturned pods
Rajeshwar 1.0 Chinamung 26.0 Whiteflies, Thrips Yellow mosaic, yellowing, reduced leaf size, immature upturned pods
Todalla 1.0 Chinamung 30.5 Whiteflies, Thrips grom pod borers pulse beetles
Yellow mosaic, yellowing, reduced leaf size, immature upturned pods
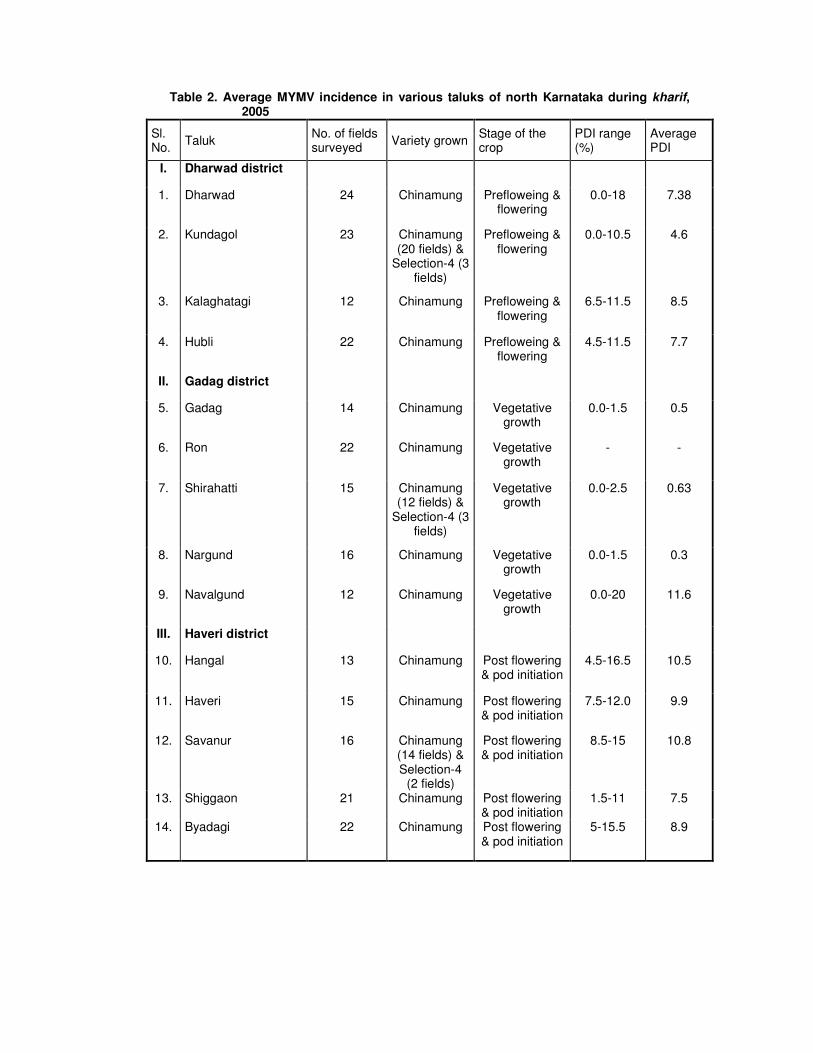
Table 2. Average MYMV incidence in various taluks of north Karnataka during kharif, 2005
Sl. No.
Taluk No. of fields surveyed
Variety grown Stage of the crop
PDI range (%)
Average PDI
I. Dharwad district
1. Dharwad 24 Chinamung Prefloweing & flowering
0.0-18 7.38
2. Kundagol 23 Chinamung (20 fields) &
Selection-4 (3 fields)
Prefloweing & flowering
0.0-10.5 4.6
3. Kalaghatagi 12 Chinamung Prefloweing & flowering
6.5-11.5 8.5
4. Hubli 22 Chinamung Prefloweing & flowering
4.5-11.5 7.7
II. Gadag district
5. Gadag 14 Chinamung Vegetative growth
0.0-1.5 0.5
6. Ron 22 Chinamung Vegetative growth
- -
7. Shirahatti 15 Chinamung (12 fields) &
Selection-4 (3 fields)
Vegetative growth
0.0-2.5 0.63
8. Nargund 16 Chinamung Vegetative growth
0.0-1.5 0.3
9. Navalgund 12 Chinamung Vegetative growth
0.0-20 11.6
III. Haveri district
10. Hangal 13 Chinamung Post flowering & pod initiation
4.5-16.5 10.5
11. Haveri 15 Chinamung Post flowering & pod initiation
7.5-12.0 9.9
12. Savanur 16 Chinamung (14 fields) & Selection-4
(2 fields)
Post flowering & pod initiation
8.5-15 10.8
13. Shiggaon 21 Chinamung Post flowering & pod initiation
1.5-11 7.5
14. Byadagi 22 Chinamung Post flowering & pod initiation
5-15.5 8.9
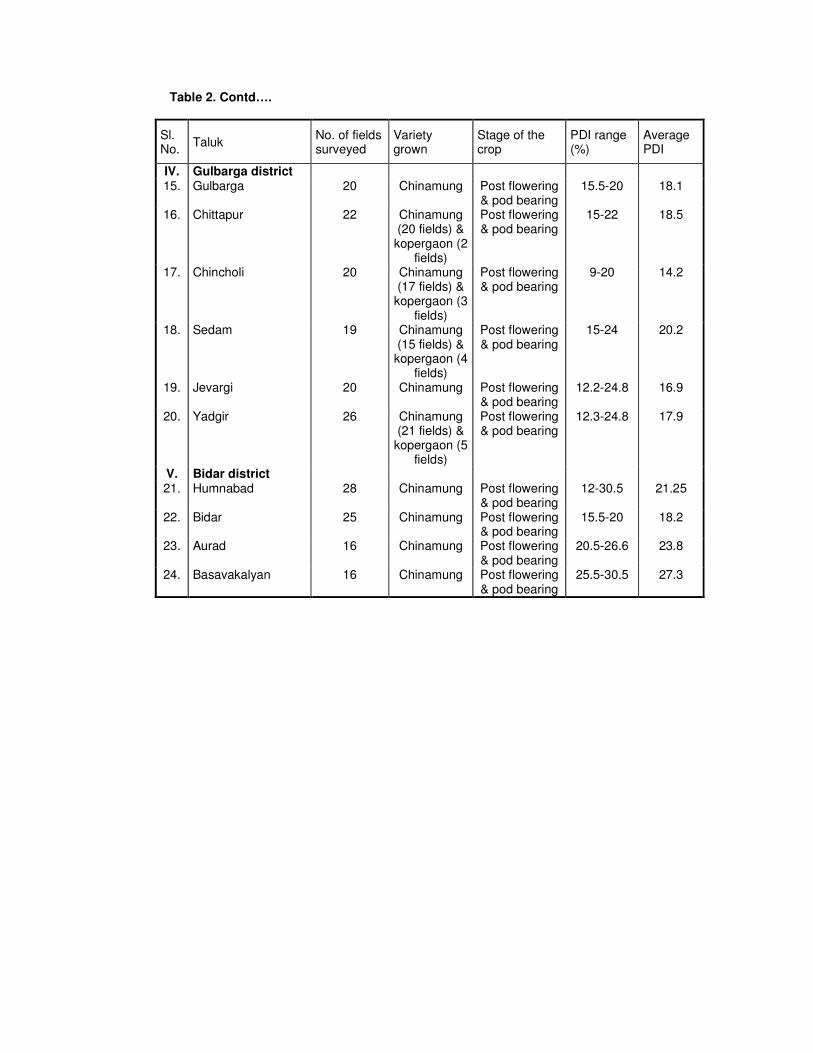
Table 2. Contd….
Sl. No.
Taluk No. of fields surveyed
Variety grown
Stage of the crop
PDI range (%)
Average PDI
IV. Gulbarga district 15. Gulbarga 20 Chinamung Post flowering
& pod bearing 15.5-20 18.1
16. Chittapur 22 Chinamung (20 fields) &
kopergaon (2 fields)
Post flowering & pod bearing
15-22 18.5
17. Chincholi 20 Chinamung (17 fields) &
kopergaon (3 fields)
Post flowering & pod bearing
9-20 14.2
18. Sedam 19 Chinamung (15 fields) &
kopergaon (4 fields)
Post flowering & pod bearing
15-24 20.2
19. Jevargi 20 Chinamung Post flowering & pod bearing
12.2-24.8 16.9
20. Yadgir 26 Chinamung (21 fields) &
kopergaon (5 fields)
Post flowering & pod bearing
12.3-24.8 17.9
V. Bidar district 21. Humnabad 28 Chinamung Post flowering
& pod bearing 12-30.5 21.25
22. Bidar 25 Chinamung Post flowering & pod bearing
15.5-20 18.2
23. Aurad 16 Chinamung Post flowering & pod bearing
20.5-26.6 23.8
24. Basavakalyan 16 Chinamung Post flowering & pod bearing
25.5-30.5 27.3
4.3 IDENTIFICATION OF VIRUS THROUGH TRANSMISSION AND ELECTRON MICROSCOPY
4.3.1 Mechanical transmission
Sap inoculation of virus causing mungbean yellow mosaic virus disease was carried out on mungbean cultivar Chinamung. The results showed that the virus was not sap transmissible. None of the plants produced symptoms even upto 30 days after inoculation (Table 3).
Table 3. Transmission studies on mungbean yellow mosaic virus
4.3.2 Dodder transmission
Studies on dodder transmission of the virus were carried out as described in ‘Material and Methods’. The results indicated that mungbean yellow mosaic virus was not transmitted by dodder from mungbean to mungbean, as none of the plants inoculated by using dodder developed any symptoms even upto 30 days (Table 3).
4.3.3 Graft transmission
‘Wedge grafting’ was employed to transmit MYMV as detailed in ‘Material and Methods’. The results indicated that the virus was readily transmissible through grafting as symptoms developed on grafted mungbean plants (Plate 3). Eighty per cent of grafted plants developed irregular yellow and green patches on newly emerging leaves within 10-15 days after grafting (Table 3).
4.3.4 Whitefly transmission
Whitefly, Bemisia tabaci was used for transmission of MYMV as described under ‘Material and Methods’. Whitefly (B. tabaci) transmitted MYMV to mungbean and 90 per cent of the inoculated plants developed yellow mosaic symptoms 12-15 days after inoculation (Table 3 and Plate 3).
Plate 3. Transmission of MYMV on greengram (cv. Chimamung)
4.3.5 Seed transmission
A study on seed transmission of virus causing mungbean yellow mosaic virus disease was carried out as described in ‘Material and Methods’. The results revealed that the virus was not seed borne in nature. None of the plants emerged from seed collected from diseased plants produced symptoms even upto 30 days after emergence. And there was no effect of MYMV on per cent germination of seeds, eventhough they were immature, changed in colour, deformed in shape and reduced in size (Table 4).
Table 4. Seed transmission of mungbean yellow mosaic virus in mungbean
4.3.6 Electron microscopy
The diseased samples that were sent to IARI, New Delhi for viral identification, tested positive. The partially purified preparation from these samples showed the presence of geminate particles measuring approximately 30 x 20 nm (Plate 4).
4.4 EPIDEMIOLOGY
Influence of weather parameters on per cent disease incidence and vector population were computed through correlation and multi regression studies at Main Agricultural Research Station, University of Agricultural Sciences, Dharwad. Eight days after sowing, the crop was free from disease and no whiteflies were recorded. At 15 days after sowing, the per cent disease incidence was 3.67 with 1.2 whiteflies per plant. As the crop progressed, the per plant whitefly population increased continuously reaching a maximum of 7.2 at 57 days after sowing, recording a disease incidence of 58.67 per cent. By the end of season whitefly population has came down to 5.3 per plant taking the per cent disease incidence to maximum of 71.03 (Table 5 and Plate 5).
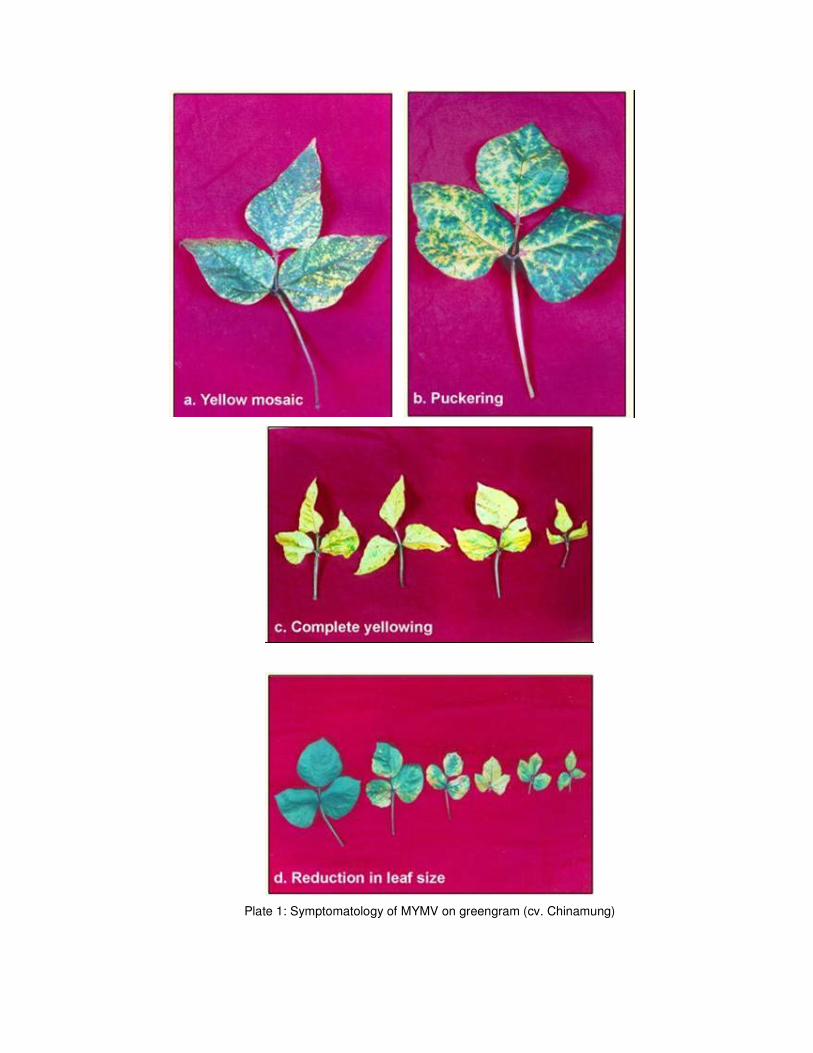
Plate 1: Symptomatology of MYMV on greengram (cv. Chinamung)
C. MYMV infected seed
Plate 2. Effect of MYMV on pods and seeds
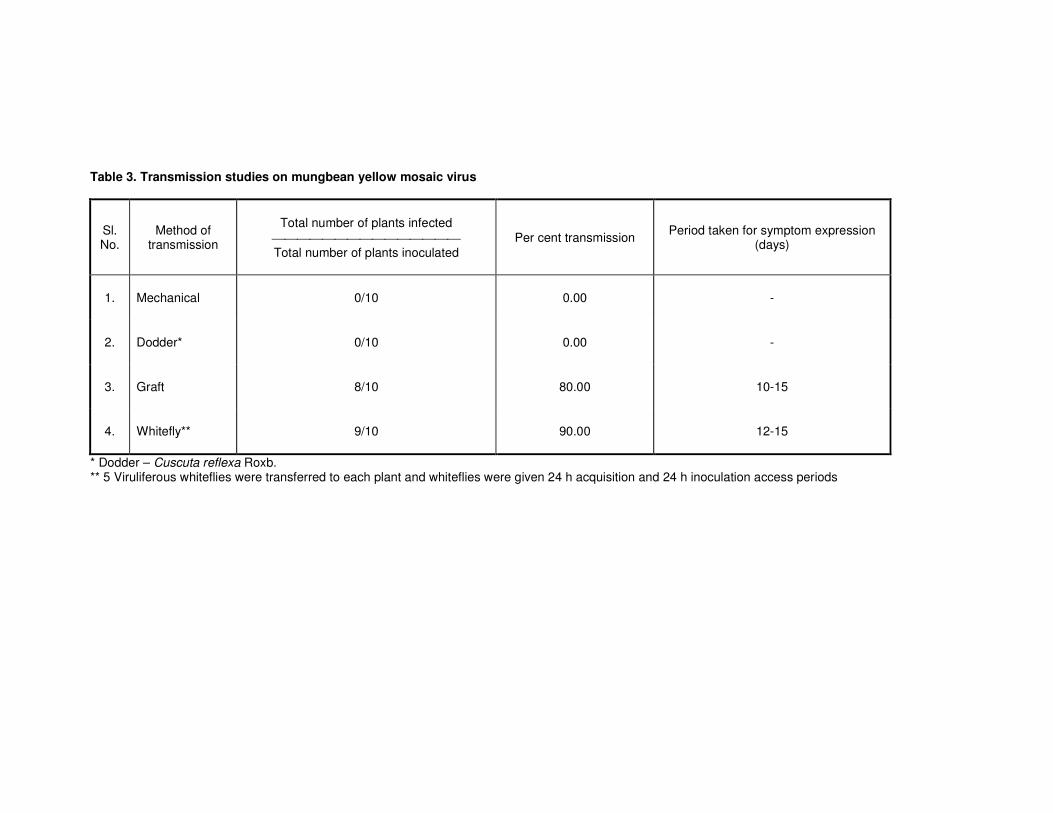
Table 3. Transmission studies on mungbean yellow mosaic virus
Sl. No.
Method of transmission
Total number of plants infected
Total number of plants inoculated
Per cent transmission Period taken for symptom expression
(days)
1. Mechanical 0/10 0.00 -
2. Dodder* 0/10 0.00 -
3. Graft 8/10 80.00 10-15
4. Whitefly** 9/10 90.00 12-15
* Dodder – Cuscuta reflexa Roxb. ** 5 Viruliferous whiteflies were transferred to each plant and whiteflies were given 24 h acquisition and 24 h inoculation access periods
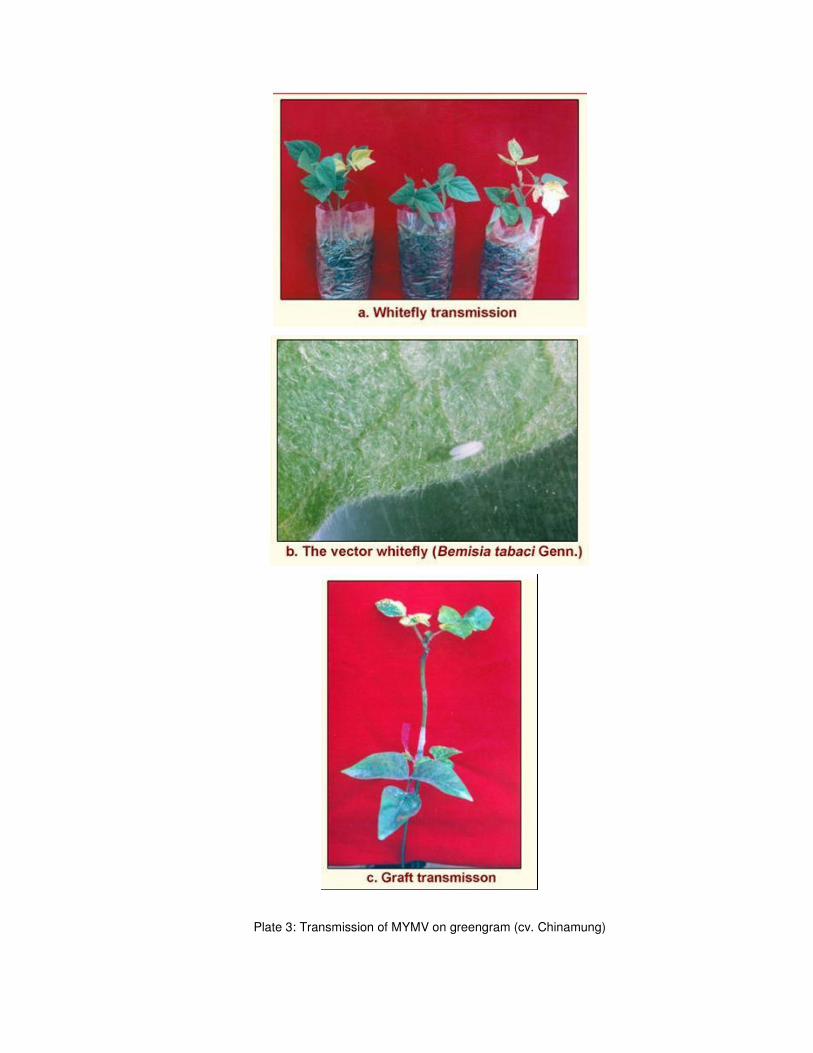
Plate 3: Transmission of MYMV on greengram (cv. Chinamung)
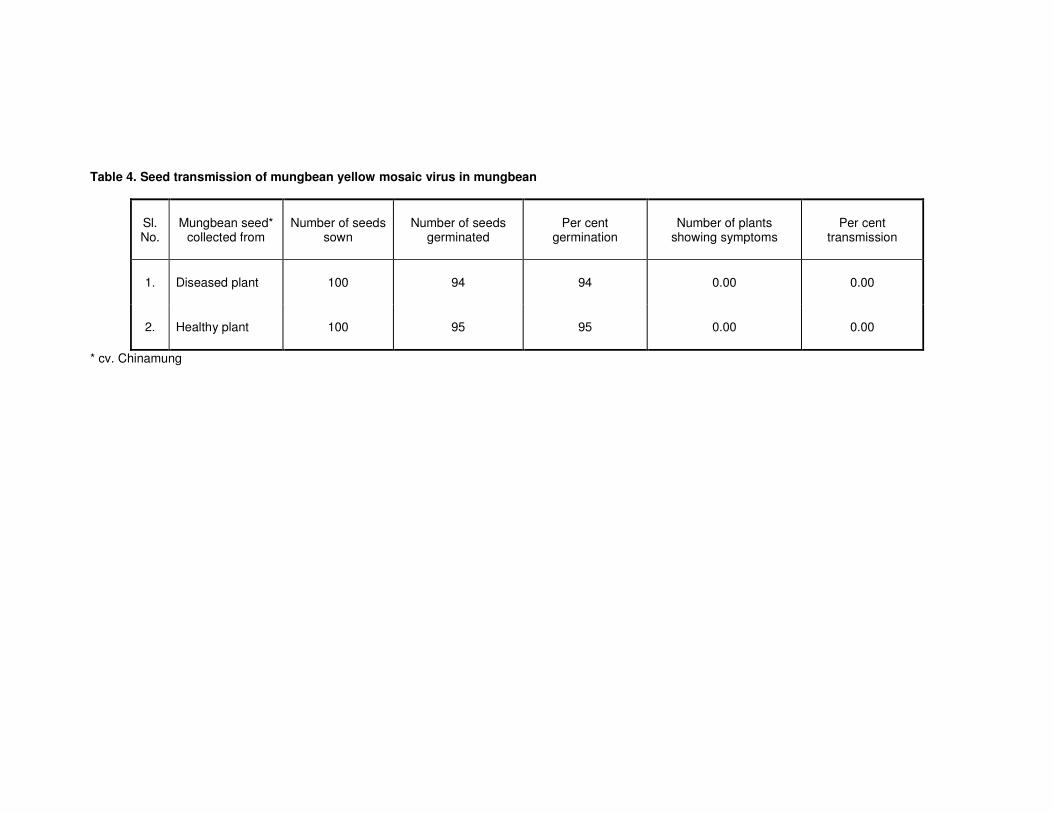
Table 4. Seed transmission of mungbean yellow mosaic virus in mungbean
Sl. No.
Mungbean seed* collected from
Number of seeds sown
Number of seeds germinated
Per cent germination
Number of plants showing symptoms
Per cent transmission
1. Diseased plant 100 94 94 0.00 0.00
2. Healthy plant 100 95 95 0.00 0.00
* cv. Chinamung
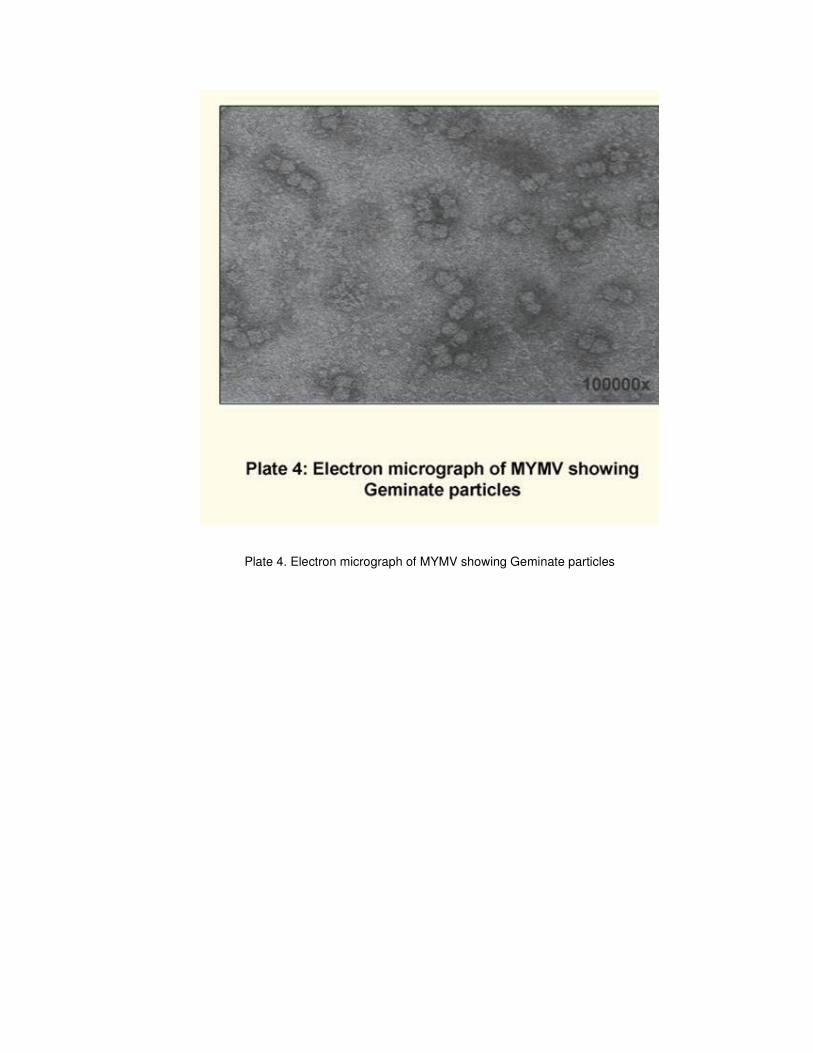
Plate 4. Electron micrograph of MYMV showing Geminate particles
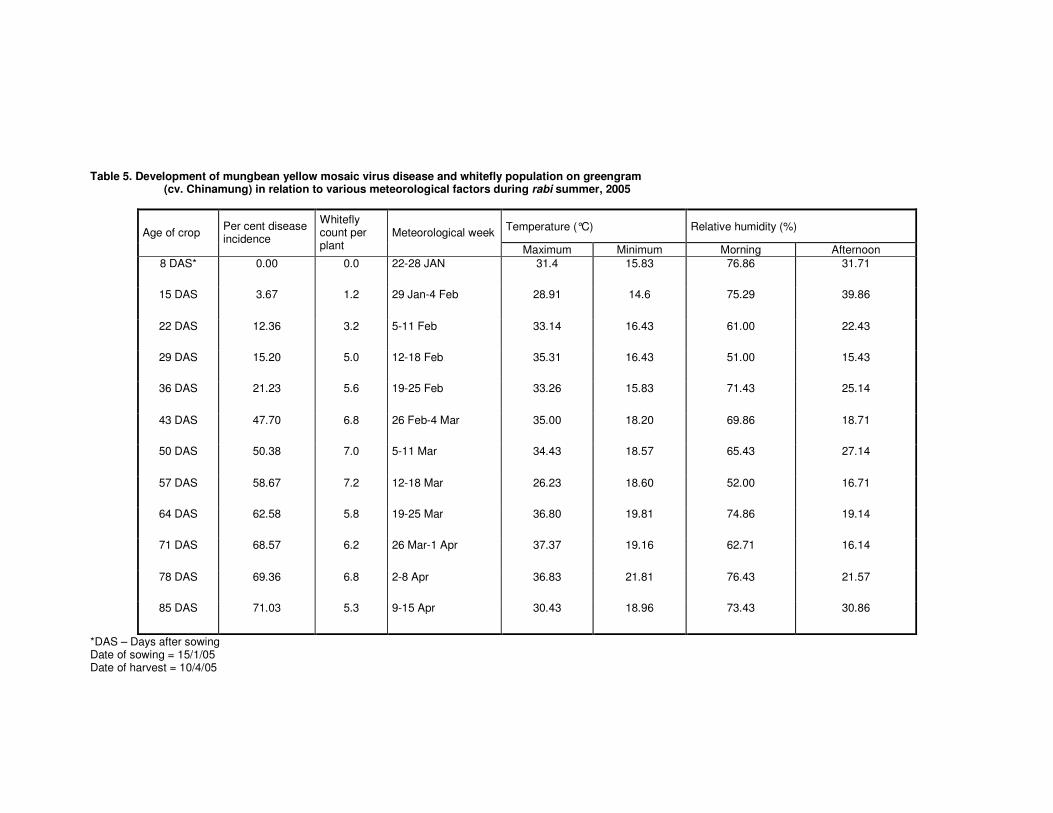
Table 5. Development of mungbean yellow mosaic virus disease and whitefly population on greengram (cv. Chinamung) in relation to various meteorological factors during rabi summer, 2005
Temperature (°C) Relative humidity (%) Age of crop
Per cent disease incidence
Whitefly count per plant
Meteorological week
Maximum Minimum Morning Afternoon
8 DAS* 0.00 0.0 22-28 JAN 31.4 15.83 76.86 31.71
15 DAS 3.67 1.2 29 Jan-4 Feb 28.91 14.6 75.29 39.86
22 DAS 12.36 3.2 5-11 Feb 33.14 16.43 61.00 22.43
29 DAS 15.20 5.0 12-18 Feb 35.31 16.43 51.00 15.43
36 DAS 21.23 5.6 19-25 Feb 33.26 15.83 71.43 25.14
43 DAS 47.70 6.8 26 Feb-4 Mar 35.00 18.20 69.86 18.71
50 DAS 50.38 7.0 5-11 Mar 34.43 18.57 65.43 27.14
57 DAS 58.67 7.2 12-18 Mar 26.23 18.60 52.00 16.71
64 DAS 62.58 5.8 19-25 Mar 36.80 19.81 74.86 19.14
71 DAS 68.57 6.2 26 Mar-1 Apr 37.37 19.16 62.71 16.14
78 DAS 69.36 6.8 2-8 Apr 36.83 21.81 76.43 21.57
85 DAS 71.03 5.3 9-15 Apr 30.43 18.96 73.43 30.86
*DAS – Days after sowing Date of sowing = 15/1/05 Date of harvest = 10/4/05
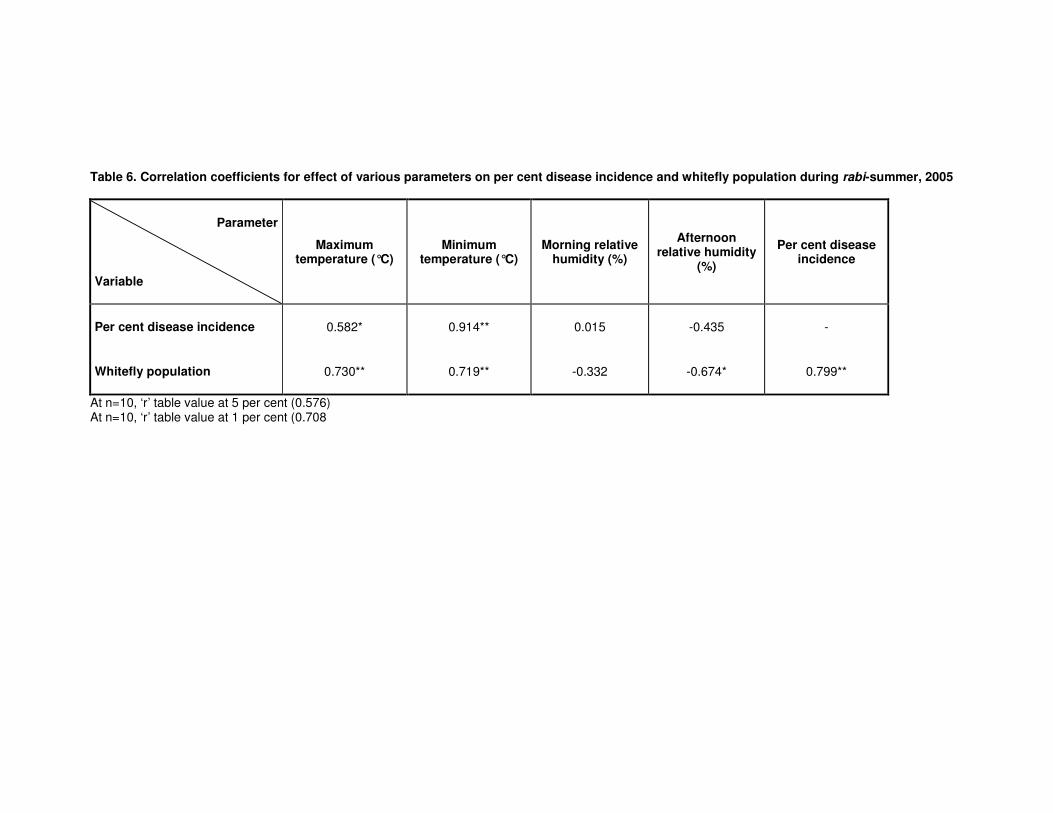
Table 6. Correlation coefficients for effect of various parameters on per cent disease incidence and whitefly population during rabi-summer, 2005
Parameter
Variable
Maximum temperature (°C)
Minimum temperature (°C)
Morning relative humidity (%)
Afternoon relative humidity
(%)
Per cent disease incidence
Per cent disease incidence 0.582* 0.914** 0.015 -0.435 -
Whitefly population 0.730** 0.719** -0.332 -0.674* 0.799**
At n=10, ‘r’ table value at 5 per cent (0.576) At n=10, ‘r’ table value at 1 per cent (0.708
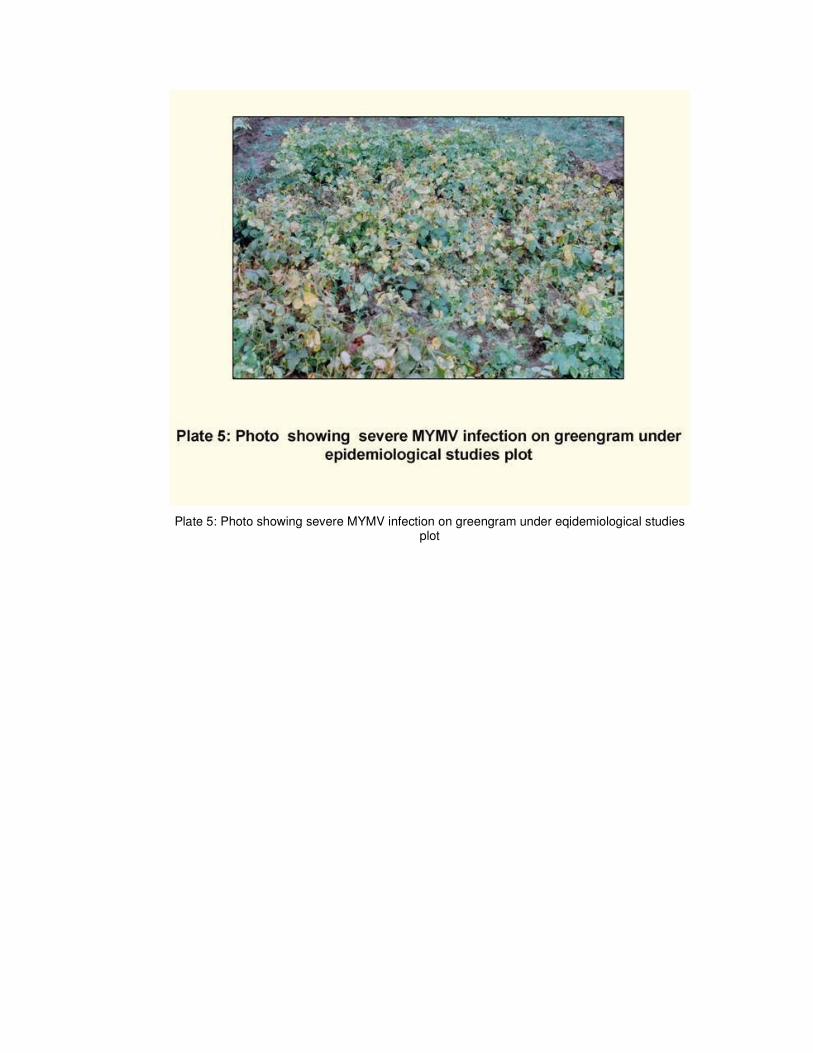
Plate 5: Photo showing severe MYMV infection on greengram under eqidemiological studies plot
Table 5. Development of mungbean yellow mosaic virus disease and whitefly population on greengram (cv. Chinamung) in relation to various meteorological factors during rabi summer, 2005
Plate 5. Photo showing severe MYMV infection on greengram under epidemiological studies plot
Both per cent disease incidence and whitefly count had highly significant positive correlation with maximum temperature (0.582* and 0.730**, respectively). Morning relative humidity had non-significant positive correlation with disease incidence and non-significant negative correlation with number of whiteflies (Table 6).
Table 6. Correlation coefficients for effect of various parameters on per cent disease incidence and whitefly population during rabi-summer, 2005
Afternoon relative humidity had a significant negative correlation (-0.674*) with incidence of whiteflies and a non-significant negative correlation with disease incidence.
The per cent disease incidence had a highly significant positive correlation (0.799**) with number of whiteflies.
The multiple linear regression equation for the influence of weather factors on per cent disease incidence is:
Y = -3.11 x1 + 1.09 x2 – 1.40 x3 – 1.04 x4,
Where,
x1 = Maximum temperature,
x2 = Minimum temperature,
x3 = Morning relative humidity,
x4 = Afternoon relative humidity.
Weather parameters were together responsible for the incidence of disease to the extent of 85.7 per cent.
Among all the weather parameters, temperature had profound effect on MYMV incidence.
The multiple linear regression equation for the influence of various weather parameters on the occurrence of whiteflies is
Y = 5.84 x1 + 6.35 x2 – 2.77 x3 – 1.42 x4
All the weather factors together influenced the whitefly population to the tune of 68.7 per cent.
4.5 INTEGRATED DISEASE MANAGEMENT OF MYMV
An experiment was conducted during rabi-summer, 2005 at Main Agricultural Research Station, University of Agricultural Sciences, Dharwad to evaluate the efficiency of various management practices in controlling MYMV as described in Material and Methods. Per cent disease incidence, vector population, growth and yield parameters and economics in each treatment were computed.
4.5.1 Per cent disease incidence
When no sprays were given, the per cent disease incidence varied from 9.76 to 12.30 per cent (Table 7).
Table 7. Integrated disease management of MYMV during rabi summer 2005
After first spray, seed treatment with imidacloprid 70 WS @ 5 g/kg along with 2 sprays of imidacloprid 17.8 SL @ 0.24 ml/l (T8) recorded significantly lowest (38.32%) incidence which was on par with two sprays of imidacloprid 17.8 SL @ 0.24 ml/l alone (T3), package of practices (T12), seed treatment with imidacloprid 70 WS @ 5 g/kg along with 2 sprays of dimethoate 30 EC @ 1.5 ml/l (T11) and 2 sprays of dimethoate 30 EC @ 1.5 ml/l
alone (T6) with incidences of 39.20, 41.76, 43.16 and 43.99 per cent, respectively. In control plot disease incidence was 59.91 per cent.
Fifteen days after second spray, 2 sprays of imidacloprid 17.8 SL @ 0.24 ml/l along with imidacloprid 70 WS @ 5 g/kg seed treatment (T8) recorded the lowest per cent disease incidence (41.70), which was on par with 2 sprays of imidacloprid 17.8 SL @ 0.24 ml/l (T3), package of practices (T12) and seed treatment with imidacloprid 70 WS @ 5 g/kg along with 2 sprays of dimethoate 30 EC @ 1.5 ml/l (T11) which recorded incidences of 42.14, 46.13 and 46.35 per cent, respectively. Maize as border row (T1) was found ineffective and recorded an incidence of 65.56 per cent whereas, control plot recorded 76.16 per cent.
On an average, at the end of experimental period, significantly lowest mean disease incidences were recorded by 2 sprays of imidacloprid 17.8 SL @ 0.24 ml/l along with imidacloprid 70 WS @ 5g/kg seed treatment (T8), 2 sprays of imidacloprid 17.8 SL @ 0.24 ml/l alone (T3), package of practices (T12) and 2 sprays of dimethoate 30 EC @ 1.5 ml/l along with imidacloprid 70 WS @ 5 g/kg seed treatment (T11) with mean incidences of 30.29, 30.36, 32.66 and 33.56 per cent in order of their effectiveness, whereas the disease incidence in control plot was 49.19 per cent (Table 7 and Plate 6).
Plate 6. Photos showing effect of different managemental components on MYMV incidence during rabi summer 2005 in greengram (cv. Chinamung)
The treatments, 2 sprays of imidacloprid 17.8 SL @ 0.24 ml/l along with imidacloprid 70 WS @ 5 g/kg seed treatment (T8) and 2 sprays of imidacloprid 17.8 SL @ 0.24 ml/l alone (T3) recorded the highest per cent disease reductions over control (38.42 and 38.28 per cent, respectively). Maize as border row (T1) recorded least (9.51%) disease reduction over control.
4.5.2 Vector population
The vector (Bemisia tabaci Genn.) population per plant at one day before the first spray varied from 4.81 to 5.43 (Table 8). Five days after first spray, imidacloprid seed treatment @ 5 g/kg along with 2 sprays of imidacloprid @ 0.24 ml/l (T8) recorded the least per plant vector population of 1.53 giving 76.05 per cent reduction over control which was on par with 2 sprays of imidacloprid @ 0.24 ml/l alone (T3) which recorded vector population of 1.73 and reduction of 72.92 per cent over control. Marigold as trap crop and yellow sticky traps @ 8/ha (T7) was found to be the next best treatment recording per plant vector population of 2.00 with 68.75 per cent reduction over control.
Table 8. Effect of different integrated disease management components on vector population during rabi-summer, 2005
One day before second spray, imidacloprid @ 5 g/kg seed treatment along with 2 sprays of imidacloprid @ 0.24 ml/l (T8) and 2 sprays of imidacloprid alone (T3) recorded the least per plant vector populations of 2.27 and 2.47, respectively and were on par with each other. The next lowest population of 3.00 per plant was recorded in package of practices (T12). The highest vector population was recorded in control plot (6.93 per plant).
Five days after second spray, the per plant vector population ranged from 1.73 to 7.00. In treatment T3 i.e. 2 sprays of imidacloprid @ 0.24 ml/l alone has given the best control of vector recording only 1.73 whiteflies per plant which was on par with T8 (imidacloprid seed treatment @ 5 g/kg along with 2 sprays of imidacloprid @ 0.24 ml/l) recording 1.87 whiteflies per plant with per cent reductions over control of 75.24 and 73.33, respectively.
The next best control was observed in package of practices (2.40) with 65.71 per cent reduction over control followed by imidacloprid seed treatment @ 5 g/kg along with 2 sprays of dimethoate @ 1.5 ml/l and 2 sprays of dimethoate @ 1.5 ml/l alone which recorded 2.67 and 2.80 whiteflies per plant which were on par with each other giving 61.90 and 60.00 per cent reductions over control, respectively.
Imidacloprid seed treatment @ 5 g/kg along with 2 sprays of Clerodendrum
aculeatum leaf extract (1:5), imidacloprid seed treatment @ 5 g/kg alone and maize as border row recorded 5.20, 5.60 and 6.20 whiteflies per plant, respectively and were significantly superior over control plot which recorded 7.00 whiteflies per plant.
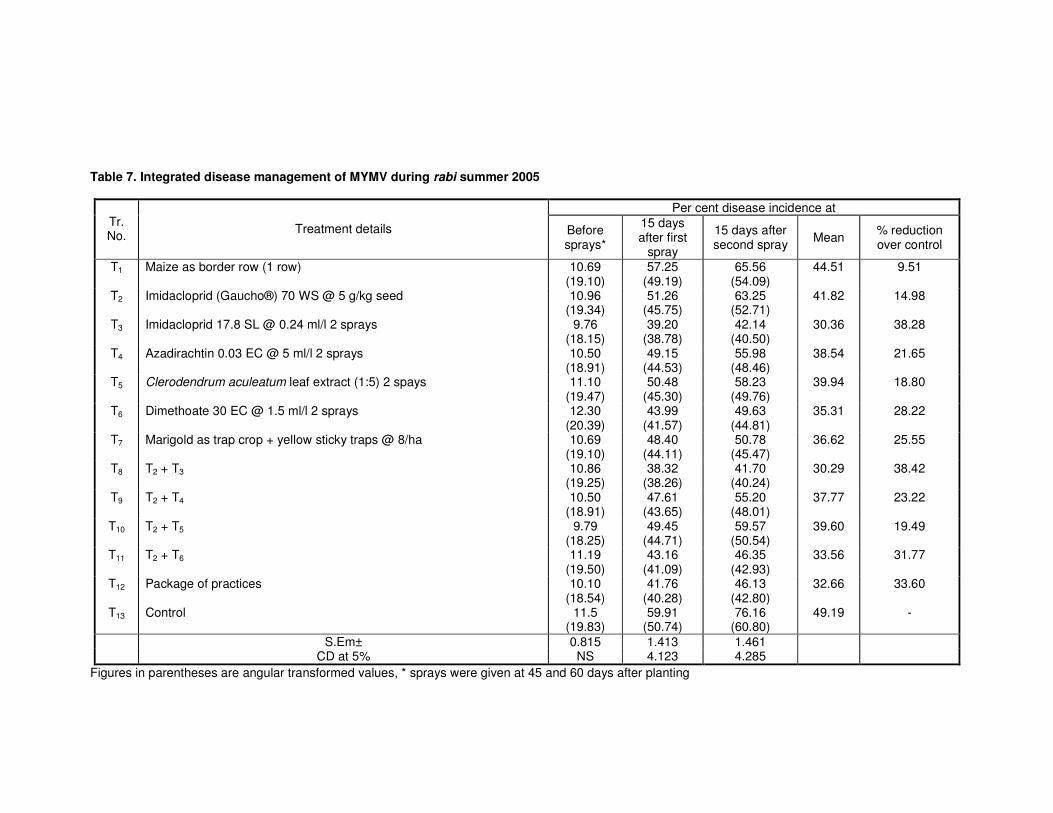
Table 7. Integrated disease management of MYMV during rabi summer 2005
Per cent disease incidence at Tr. No.
Treatment details Before sprays*
15 days after first
spray
15 days after second spray
Mean % reduction over control
T1 Maize as border row (1 row) 10.69 (19.10)
57.25 (49.19)
65.56 (54.09)
44.51 9.51
T2 Imidacloprid (Gaucho®) 70 WS @ 5 g/kg seed 10.96 (19.34)
51.26 (45.75)
63.25 (52.71)
41.82 14.98
T3 Imidacloprid 17.8 SL @ 0.24 ml/l 2 sprays 9.76 (18.15)
39.20 (38.78)
42.14 (40.50)
30.36 38.28
T4 Azadirachtin 0.03 EC @ 5 ml/l 2 sprays 10.50 (18.91)
49.15 (44.53)
55.98 (48.46)
38.54 21.65
T5 Clerodendrum aculeatum leaf extract (1:5) 2 spays 11.10 (19.47)
50.48 (45.30)
58.23 (49.76)
39.94 18.80
T6 Dimethoate 30 EC @ 1.5 ml/l 2 sprays 12.30 (20.39)
43.99 (41.57)
49.63 (44.81)
35.31 28.22
T7 Marigold as trap crop + yellow sticky traps @ 8/ha 10.69 (19.10)
48.40 (44.11)
50.78 (45.47)
36.62 25.55
T8 T2 + T3 10.86 (19.25)
38.32 (38.26)
41.70 (40.24)
30.29 38.42
T9 T2 + T4 10.50 (18.91)
47.61 (43.65)
55.20 (48.01)
37.77 23.22
T10 T2 + T5 9.79 (18.25)
49.45 (44.71)
59.57 (50.54)
39.60 19.49
T11 T2 + T6 11.19 (19.50)
43.16 (41.09)
46.35 (42.93)
33.56 31.77
T12 Package of practices 10.10 (18.54)
41.76 (40.28)
46.13 (42.80)
32.66 33.60
T13 Control 11.5 (19.83)
59.91 (50.74)
76.16 (60.80)
49.19 -
S.Em± 0.815 1.413 1.461 CD at 5% NS 4.123 4.285
Figures in parentheses are angular transformed values, * sprays were given at 45 and 60 days after planting
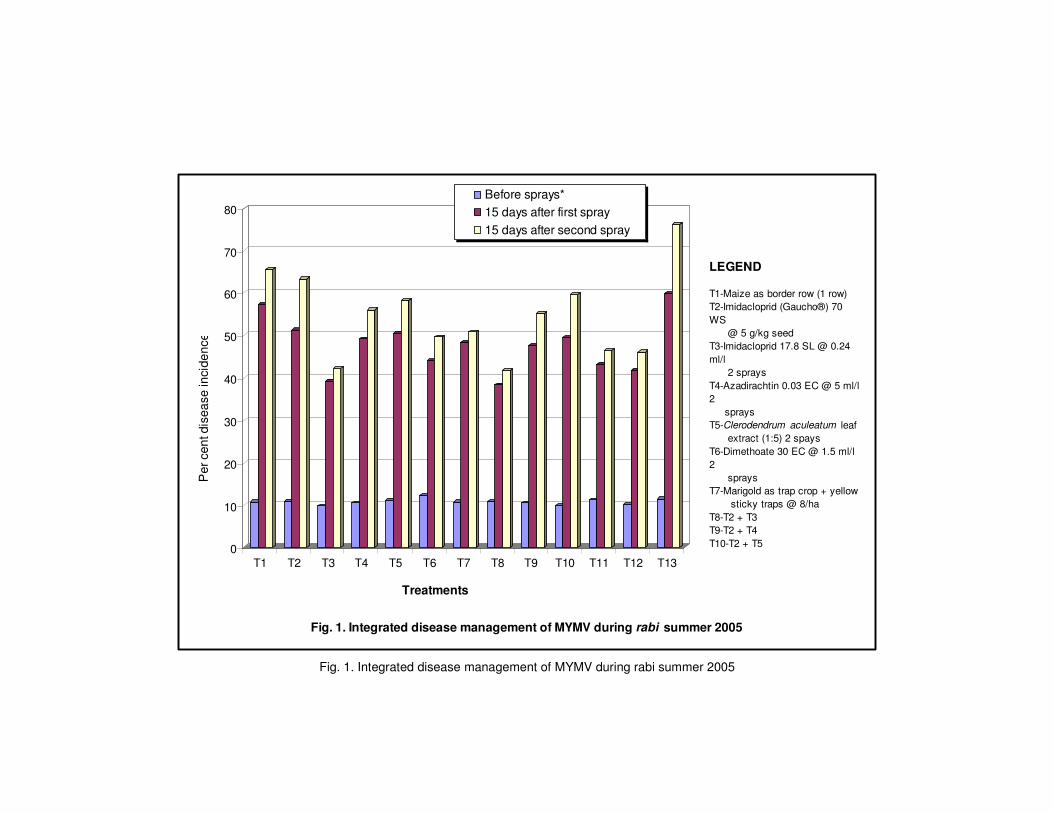
0
10
20
30
40
50
60
70
80
T1 T2 T3 T4 T5 T6 T7 T8 T9 T10 T11 T12 T13
Before sprays*
15 days after first spray
15 days after second spray
LEGEND
T1-Maize as border row (1 row)
T2-Imidacloprid (Gaucho®) 70
WS
@ 5 g/kg seed
T3-Imidacloprid 17.8 SL @ 0.24
ml/l
2 sprays
T4-Azadirachtin 0.03 EC @ 5 ml/l
2
sprays
T5-Clerodendrum aculeatum leaf
extract (1:5) 2 spays
T6-Dimethoate 30 EC @ 1.5 ml/l
2
sprays
T7-Marigold as trap crop + yellow
sticky traps @ 8/ha
T8-T2 + T3
T9-T2 + T4
T10-T2 + T5
T11-T2 + T6
Per
cen
t dis
ea
se in
cid
en
ce
Treatments
Fig. 1. Integrated disease management of MYMV during rabi summer 2005
Fig. 1. Integrated disease management of MYMV during rabi summer 2005
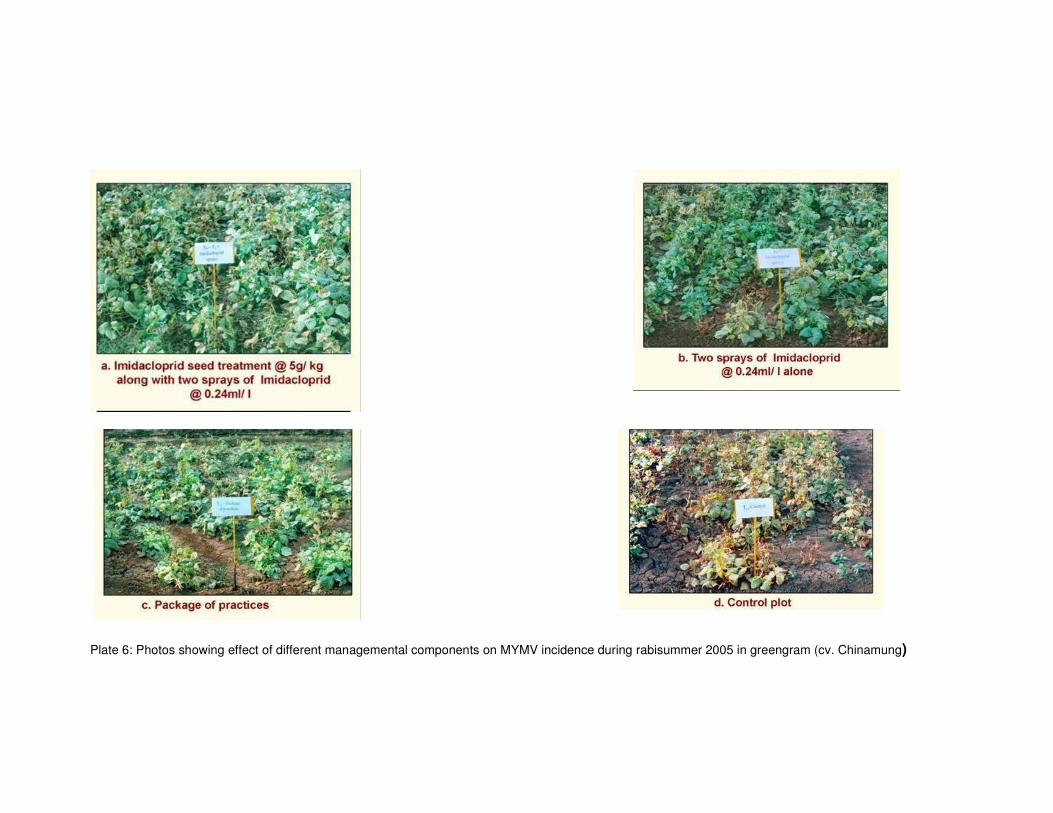
Plate 6: Photos showing effect of different managemental components on MYMV incidence during rabisummer 2005 in greengram (cv. Chinamung)
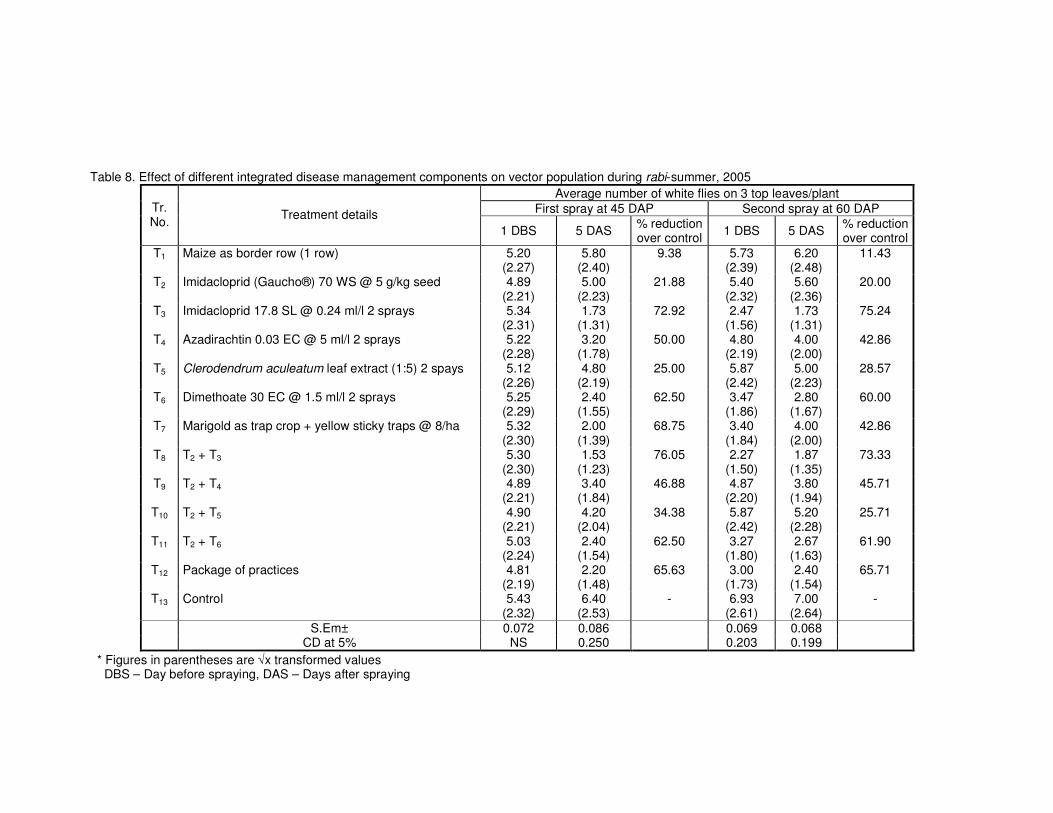
Table 8. Effect of different integrated disease management components on vector population during rabi-summer, 2005
Average number of white flies on 3 top leaves/plant
First spray at 45 DAP Second spray at 60 DAP Tr. No.
Treatment details
1 DBS 5 DAS % reduction over control
1 DBS 5 DAS % reduction over control
T1 Maize as border row (1 row) 5.20 (2.27)
5.80 (2.40)
9.38 5.73 (2.39)
6.20 (2.48)
11.43
T2 Imidacloprid (Gaucho®) 70 WS @ 5 g/kg seed 4.89 (2.21)
5.00 (2.23)
21.88 5.40 (2.32)
5.60 (2.36)
20.00
T3 Imidacloprid 17.8 SL @ 0.24 ml/l 2 sprays 5.34 (2.31)
1.73 (1.31)
72.92 2.47 (1.56)
1.73 (1.31)
75.24
T4 Azadirachtin 0.03 EC @ 5 ml/l 2 sprays 5.22 (2.28)
3.20 (1.78)
50.00 4.80 (2.19)
4.00 (2.00)
42.86
T5 Clerodendrum aculeatum leaf extract (1:5) 2 spays 5.12 (2.26)
4.80 (2.19)
25.00 5.87 (2.42)
5.00 (2.23)
28.57
T6 Dimethoate 30 EC @ 1.5 ml/l 2 sprays 5.25 (2.29)
2.40 (1.55)
62.50 3.47 (1.86)
2.80 (1.67)
60.00
T7 Marigold as trap crop + yellow sticky traps @ 8/ha 5.32 (2.30)
2.00 (1.39)
68.75 3.40 (1.84)
4.00 (2.00)
42.86
T8 T2 + T3 5.30 (2.30)
1.53 (1.23)
76.05 2.27 (1.50)
1.87 (1.35)
73.33
T9 T2 + T4 4.89 (2.21)
3.40 (1.84)
46.88 4.87 (2.20)
3.80 (1.94)
45.71
T10 T2 + T5 4.90 (2.21)
4.20 (2.04)
34.38 5.87 (2.42)
5.20 (2.28)
25.71
T11 T2 + T6 5.03 (2.24)
2.40 (1.54)
62.50 3.27 (1.80)
2.67 (1.63)
61.90
T12 Package of practices 4.81 (2.19)
2.20 (1.48)
65.63 3.00 (1.73)
2.40 (1.54)
65.71
T13 Control 5.43 (2.32)
6.40 (2.53)
- 6.93 (2.61)
7.00 (2.64)
-
S.Em± 0.072 0.086 0.069 0.068 CD at 5% NS 0.250 0.203 0.199
* Figures in parentheses are √x transformed values DBS – Day before spraying, DAS – Days after spraying
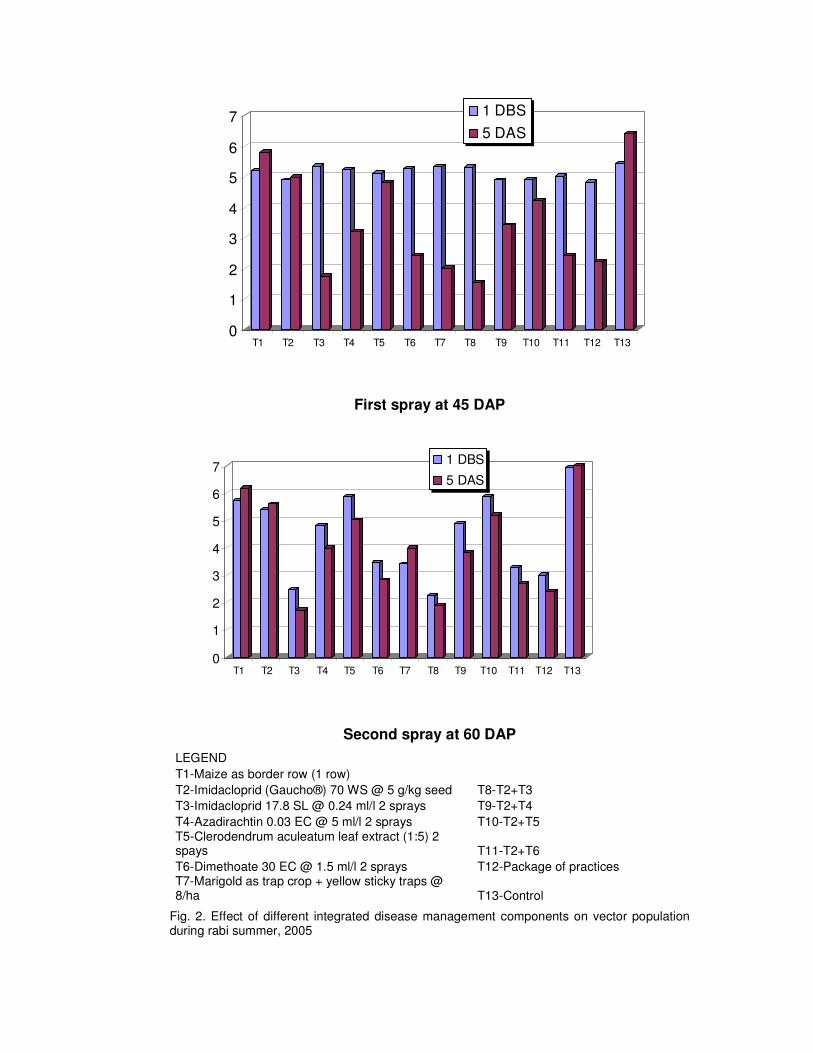
First spray at 45 DAP
Second spray at 60 DAP
LEGEND
T1-Maize as border row (1 row)
T2-Imidacloprid (Gaucho®) 70 WS @ 5 g/kg seed T8-T2+T3
T3-Imidacloprid 17.8 SL @ 0.24 ml/l 2 sprays T9-T2+T4
T4-Azadirachtin 0.03 EC @ 5 ml/l 2 sprays T10-T2+T5 T5-Clerodendrum aculeatum leaf extract (1:5) 2 spays T11-T2+T6
T6-Dimethoate 30 EC @ 1.5 ml/l 2 sprays T12-Package of practices T7-Marigold as trap crop + yellow sticky traps @ 8/ha T13-Control
Fig. 2. Effect of different integrated disease management components on vector population during rabi summer, 2005
0
1
2
3
4
5
6
7
T1 T2 T3 T4 T5 T6 T7 T8 T9 T10 T11 T12 T13
1 DBS
5 DAS
0
1
2
3
4
5
6
7
T1 T2 T3 T4 T5 T6 T7 T8 T9 T10 T11 T12 T13
1 DBS
5 DAS
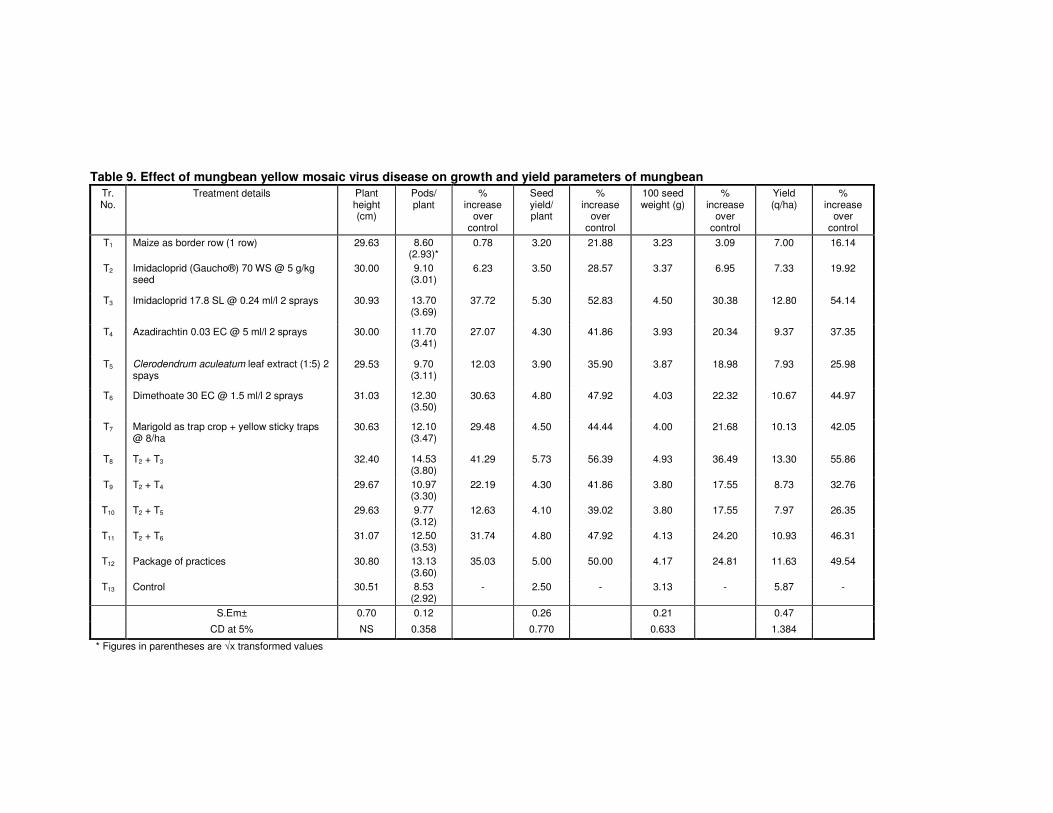
Table 9. Effect of mungbean yellow mosaic virus disease on growth and yield parameters of mungbean
Tr. No.
Treatment details Plant height (cm)
Pods/ plant
% increase
over control
Seed yield/ plant
% increase
over control
100 seed weight (g)
% increase
over control
Yield (q/ha)
% increase
over control
T1 Maize as border row (1 row) 29.63 8.60 (2.93)*
0.78 3.20 21.88 3.23 3.09 7.00 16.14
T2 Imidacloprid (Gaucho®) 70 WS @ 5 g/kg seed
30.00 9.10 (3.01)
6.23 3.50 28.57 3.37 6.95 7.33 19.92
T3 Imidacloprid 17.8 SL @ 0.24 ml/l 2 sprays 30.93 13.70 (3.69)
37.72 5.30 52.83 4.50 30.38 12.80 54.14
T4 Azadirachtin 0.03 EC @ 5 ml/l 2 sprays 30.00 11.70 (3.41)
27.07 4.30 41.86 3.93 20.34 9.37 37.35
T5 Clerodendrum aculeatum leaf extract (1:5) 2 spays
29.53 9.70 (3.11)
12.03 3.90 35.90 3.87 18.98 7.93 25.98
T6 Dimethoate 30 EC @ 1.5 ml/l 2 sprays 31.03 12.30 (3.50)
30.63 4.80 47.92 4.03 22.32 10.67 44.97
T7 Marigold as trap crop + yellow sticky traps @ 8/ha
30.63 12.10 (3.47)
29.48 4.50 44.44 4.00 21.68 10.13 42.05
T8 T2 + T3 32.40 14.53 (3.80)
41.29 5.73 56.39 4.93 36.49 13.30 55.86
T9 T2 + T4 29.67 10.97 (3.30)
22.19 4.30 41.86 3.80 17.55 8.73 32.76
T10 T2 + T5 29.63 9.77 (3.12)
12.63 4.10 39.02 3.80 17.55 7.97 26.35
T11 T2 + T6 31.07 12.50 (3.53)
31.74 4.80 47.92 4.13 24.20 10.93 46.31
T12 Package of practices 30.80 13.13 (3.60)
35.03 5.00 50.00 4.17 24.81 11.63 49.54
T13 Control 30.51 8.53 (2.92)
- 2.50 - 3.13 - 5.87 -
S.Em± 0.70 0.12 0.26 0.21 0.47
CD at 5% NS 0.358 0.770 0.633 1.384
* Figures in parentheses are √x transformed values
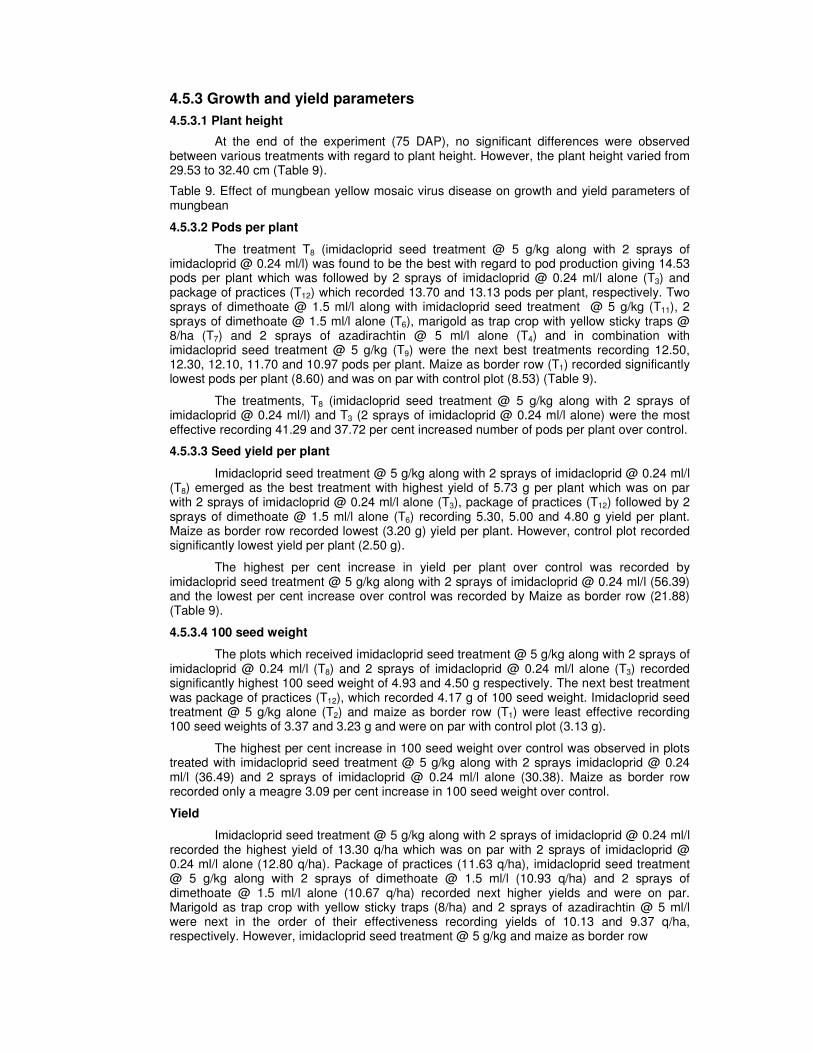
4.5.3 Growth and yield parameters
4.5.3.1 Plant height
At the end of the experiment (75 DAP), no significant differences were observed between various treatments with regard to plant height. However, the plant height varied from 29.53 to 32.40 cm (Table 9).
Table 9. Effect of mungbean yellow mosaic virus disease on growth and yield parameters of mungbean
4.5.3.2 Pods per plant
The treatment T8 (imidacloprid seed treatment @ 5 g/kg along with 2 sprays of imidacloprid @ 0.24 ml/l) was found to be the best with regard to pod production giving 14.53 pods per plant which was followed by 2 sprays of imidacloprid @ 0.24 ml/l alone (T3) and package of practices (T12) which recorded 13.70 and 13.13 pods per plant, respectively. Two sprays of dimethoate @ 1.5 ml/l along with imidacloprid seed treatment @ 5 g/kg (T11), 2 sprays of dimethoate @ 1.5 ml/l alone (T6), marigold as trap crop with yellow sticky traps @ 8/ha (T7) and 2 sprays of azadirachtin @ 5 ml/l alone (T4) and in combination with imidacloprid seed treatment @ 5 g/kg (T9) were the next best treatments recording 12.50, 12.30, 12.10, 11.70 and 10.97 pods per plant. Maize as border row (T1) recorded significantly lowest pods per plant (8.60) and was on par with control plot (8.53) (Table 9).
The treatments, T8 (imidacloprid seed treatment @ 5 g/kg along with 2 sprays of imidacloprid @ 0.24 ml/l) and T3 (2 sprays of imidacloprid @ 0.24 ml/l alone) were the most effective recording 41.29 and 37.72 per cent increased number of pods per plant over control.
4.5.3.3 Seed yield per plant
Imidacloprid seed treatment @ 5 g/kg along with 2 sprays of imidacloprid @ 0.24 ml/l (T8) emerged as the best treatment with highest yield of 5.73 g per plant which was on par with 2 sprays of imidacloprid @ 0.24 ml/l alone (T3), package of practices (T12) followed by 2 sprays of dimethoate @ 1.5 ml/l alone (T6) recording 5.30, 5.00 and 4.80 g yield per plant. Maize as border row recorded lowest (3.20 g) yield per plant. However, control plot recorded significantly lowest yield per plant (2.50 g).
The highest per cent increase in yield per plant over control was recorded by imidacloprid seed treatment @ 5 g/kg along with 2 sprays of imidacloprid @ 0.24 ml/l (56.39) and the lowest per cent increase over control was recorded by Maize as border row (21.88) (Table 9).
4.5.3.4 100 seed weight
The plots which received imidacloprid seed treatment @ 5 g/kg along with 2 sprays of imidacloprid @ 0.24 ml/l (T8) and 2 sprays of imidacloprid @ 0.24 ml/l alone (T3) recorded significantly highest 100 seed weight of 4.93 and 4.50 g respectively. The next best treatment was package of practices (T12), which recorded 4.17 g of 100 seed weight. Imidacloprid seed treatment @ 5 g/kg alone (T2) and maize as border row (T1) were least effective recording 100 seed weights of 3.37 and 3.23 g and were on par with control plot (3.13 g).
The highest per cent increase in 100 seed weight over control was observed in plots treated with imidacloprid seed treatment @ 5 g/kg along with 2 sprays imidacloprid @ 0.24 ml/l (36.49) and 2 sprays of imidacloprid @ 0.24 ml/l alone (30.38). Maize as border row recorded only a meagre 3.09 per cent increase in 100 seed weight over control.
Yield
Imidacloprid seed treatment @ 5 g/kg along with 2 sprays of imidacloprid @ 0.24 ml/l recorded the highest yield of 13.30 q/ha which was on par with 2 sprays of imidacloprid @ 0.24 ml/l alone (12.80 q/ha). Package of practices (11.63 q/ha), imidacloprid seed treatment @ 5 g/kg along with 2 sprays of dimethoate @ 1.5 ml/l (10.93 q/ha) and 2 sprays of dimethoate @ 1.5 ml/l alone (10.67 q/ha) recorded next higher yields and were on par. Marigold as trap crop with yellow sticky traps (8/ha) and 2 sprays of azadirachtin @ 5 ml/l were next in the order of their effectiveness recording yields of 10.13 and 9.37 q/ha, respectively. However, imidacloprid seed treatment @ 5 g/kg and maize as border row
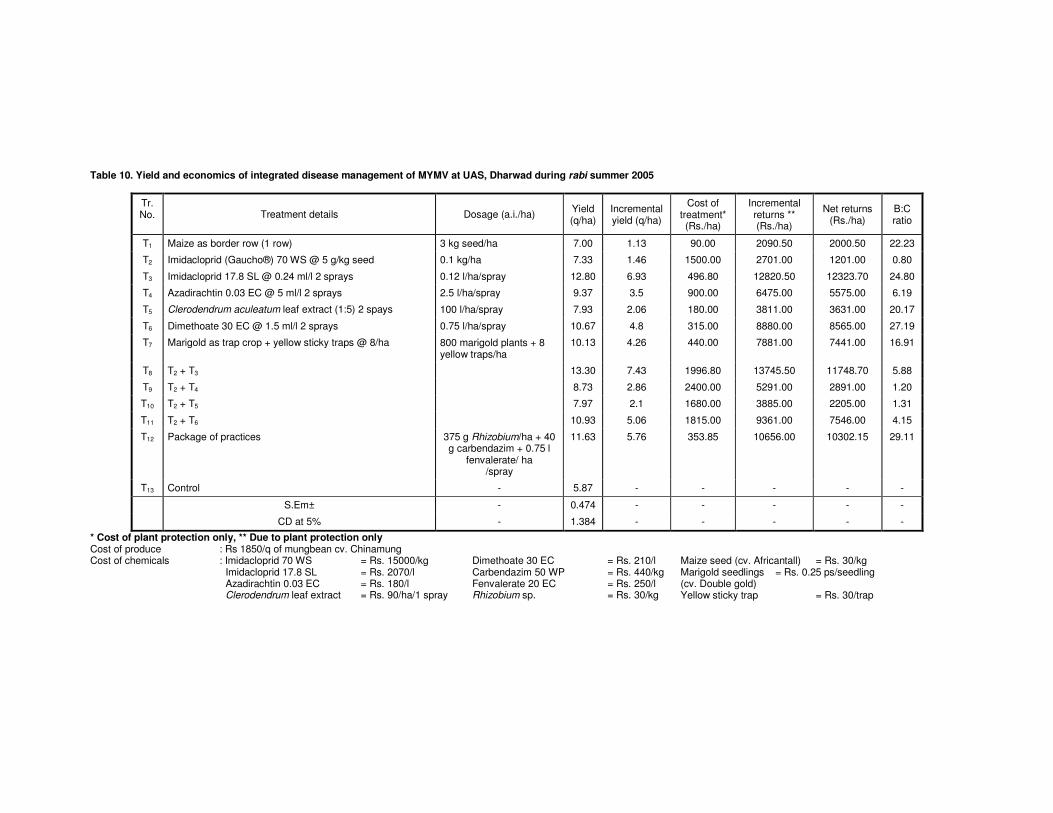
Table 10. Yield and economics of integrated disease management of MYMV at UAS, Dharwad during rabi summer 2005
Tr. No. Treatment details Dosage (a.i./ha)
Yield (q/ha)
Incremental yield (q/ha)
Cost of treatment* (Rs./ha)
Incremental returns ** (Rs./ha)
Net returns (Rs./ha)
B:C ratio
T1 Maize as border row (1 row) 3 kg seed/ha 7.00 1.13 90.00 2090.50 2000.50 22.23
T2 Imidacloprid (Gaucho®) 70 WS @ 5 g/kg seed 0.1 kg/ha 7.33 1.46 1500.00 2701.00 1201.00 0.80
T3 Imidacloprid 17.8 SL @ 0.24 ml/l 2 sprays 0.12 l/ha/spray 12.80 6.93 496.80 12820.50 12323.70 24.80
T4 Azadirachtin 0.03 EC @ 5 ml/l 2 sprays 2.5 l/ha/spray 9.37 3.5 900.00 6475.00 5575.00 6.19
T5 Clerodendrum aculeatum leaf extract (1:5) 2 spays 100 l/ha/spray 7.93 2.06 180.00 3811.00 3631.00 20.17
T6 Dimethoate 30 EC @ 1.5 ml/l 2 sprays 0.75 l/ha/spray 10.67 4.8 315.00 8880.00 8565.00 27.19
T7 Marigold as trap crop + yellow sticky traps @ 8/ha 800 marigold plants + 8 yellow traps/ha
10.13 4.26 440.00 7881.00 7441.00 16.91
T8 T2 + T3 13.30 7.43 1996.80 13745.50 11748.70 5.88
T9 T2 + T4 8.73 2.86 2400.00 5291.00 2891.00 1.20
T10 T2 + T5 7.97 2.1 1680.00 3885.00 2205.00 1.31
T11 T2 + T6 10.93 5.06 1815.00 9361.00 7546.00 4.15
T12 Package of practices 375 g Rhizobium/ha + 40 g carbendazim + 0.75 l
fenvalerate/ ha /spray
11.63 5.76 353.85 10656.00 10302.15 29.11
T13 Control - 5.87 - - - - -
S.Em± - 0.474 - - - - -
CD at 5% - 1.384 - - - - -
* Cost of plant protection only, ** Due to plant protection only Cost of produce : Rs 1850/q of mungbean cv. Chinamung Cost of chemicals : Imidacloprid 70 WS = Rs. 15000/kg Dimethoate 30 EC = Rs. 210/l Maize seed (cv. Africantall) = Rs. 30/kg Imidacloprid 17.8 SL = Rs. 2070/l Carbendazim 50 WP = Rs. 440/kg Azadirachtin 0.03 EC = Rs. 180/l Fenvalerate 20 EC = Rs. 250/l
Marigold seedlings = Rs. 0.25 ps/seedling (cv. Double gold)
Clerodendrum leaf extract = Rs. 90/ha/1 spray Rhizobium sp. = Rs. 30/kg Yellow sticky trap = Rs. 30/trap
recorded lower yields (7.33 and 7.00 q/ha, respectively) and the lowest yield was recorded in control plot (5.87 q/ha).
The highest per cent increase in yield over control was recorded in imidacloprid seed treatment along with 2 sprays of imidacloprid @ 0.24 ml/l (55.86) whereas the least was recorded in maize as border row (16.14%).
4.5.4 Yield and economics
At the end of experiment, the yield and economics varied as follows.
4.5.4.1 Incremental yield
The incremental yield in different treatments varied from 1.13 to 7.43 q/ha. Imidacloprid seed treatment @ 5 g/kg along with 2 sprays of imidacloprid @ 0.24 ml/l recorded the highest incremental yield (7.43) followed by 2 sprays of imidacloprid @ 0.24 ml/l alone (6.93), package of practices (5.76) and imidacloprid seed treatment @ 5 g/kg along with 2 sprays of dimethoate @ 1.5 ml/l (5.06 q/ha). Maize as border row recorded the lowest incremental yield of 1.13 q/ha (Table 10).
Table 10. Yield and economics of integrated disease management of MYMV at UAS, Dharwad during rabi summer 2005
4.5.4.2 Incremental returns
Following the application of various treatments the incremental returns varied from Rs. 2090.50 to Rs. 13,745.50/ha. Imidacloprid seed treatment @ 5 g/kg along with 2 sprays of imidacloprid @ 0.24 ml/l has recorded highest incremental return (Rs. 13,745.50) followed by 2 sprays of imidacloprid @ 0.24 ml/l alone (Rs. 12,820.50). However, maize as border row recorded lowest incremental returns (Rs. 2090.50/ha) (Table 10).
4.5.4.3 Net returns
The net returns from the crop varied from Rs. 1201.00 to Rs. 12,323.70/ha. The plot that received 2 sprays of imidacloprid @ 0.24 ml/l alone recorded highest net return (Rs. 12,323.70/ha) followed by the plots with imidacloprid seed treatment @ 5 g/kg along with 2 sprays of imidacloprid @ 0.24 ml/l (Rs. 11,748.70) and package of practices (Rs.10,302.15). Two sprays of dimethoate @ 1.5 ml/l alone and in combination with imidacloprid @ 5 g/kg seed treatment and marigold as trap crop with yellow sticky traps have recorded next higher net returns of Rs.8565.00, Rs.7546.00 and Rs.7441.00/ha, respectively. The lowest net return (Rs. 1201.00/ha) was recorded in imidacloprid seed treatment @ 5 g/kg alone treated plot (Table 10).
4.5.4.4 Benefit: Cost ratio (BCR)
The BCRs of various treatments were in the range of 0.80 to 29.11. Package of practices (T12) emerged as the best treatment with B: C ratio of 29.11. Two sprays of dimethoate @ 1.5 ml/l alone (T6) with a B: C ratio of 27.19 found to be the next best treatment. Whereas, the lowest B: C ratio of 0.80 was observed in plot that received imidacloprid seed treatment @ 5 g/kg alone (Table 10).
4.6 SCREENING OF MUNGBEAN GENOTYPES AGAINST MUNGBEAN YELLOW MOSAIC VIRUS DISEASE
A total of 101 genotypes including various crosses during rabi-summer 2004 and 25 genotypes during rabi-summer, 2005 were screened against MYMV to identify the sources of resistance at Main Agricultural Research Station, Dharwad under irrigated field conditions. The per cent disease incidence was recorded at pre-flowering stage during 2004 and pod formation stages during 2005 as described in ‘Material and Methods’. The results are presented in Tables 11 and 12.
Table 11. Screening of mungbean genotypes against MYMV during rabi-summer, 2004 (January-April) under irrigated conditions
Table 12. Screening of mungbean genotypes against MYMV during rabi-summer, 2005 (January-April)
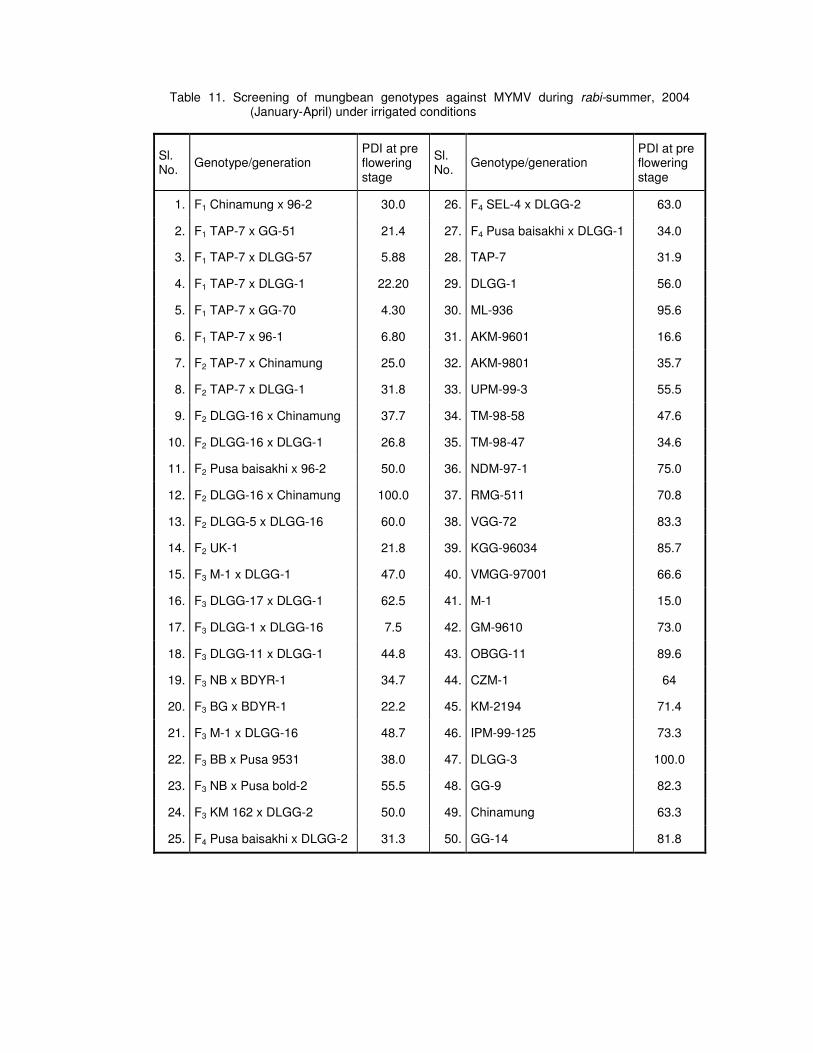
Table 11. Screening of mungbean genotypes against MYMV during rabi-summer, 2004 (January-April) under irrigated conditions
Sl. No.
Genotype/generation PDI at pre flowering stage
Sl. No.
Genotype/generation PDI at pre flowering stage
1. F1 Chinamung x 96-2 30.0 26. F4 SEL-4 x DLGG-2 63.0
2. F1 TAP-7 x GG-51 21.4 27. F4 Pusa baisakhi x DLGG-1 34.0
3. F1 TAP-7 x DLGG-57 5.88 28. TAP-7 31.9
4. F1 TAP-7 x DLGG-1 22.20 29. DLGG-1 56.0
5. F1 TAP-7 x GG-70 4.30 30. ML-936 95.6
6. F1 TAP-7 x 96-1 6.80 31. AKM-9601 16.6
7. F2 TAP-7 x Chinamung 25.0 32. AKM-9801 35.7
8. F2 TAP-7 x DLGG-1 31.8 33. UPM-99-3 55.5
9. F2 DLGG-16 x Chinamung 37.7 34. TM-98-58 47.6
10. F2 DLGG-16 x DLGG-1 26.8 35. TM-98-47 34.6
11. F2 Pusa baisakhi x 96-2 50.0 36. NDM-97-1 75.0
12. F2 DLGG-16 x Chinamung 100.0 37. RMG-511 70.8
13. F2 DLGG-5 x DLGG-16 60.0 38. VGG-72 83.3
14. F2 UK-1 21.8 39. KGG-96034 85.7
15. F3 M-1 x DLGG-1 47.0 40. VMGG-97001 66.6
16. F3 DLGG-17 x DLGG-1 62.5 41. M-1 15.0
17. F3 DLGG-1 x DLGG-16 7.5 42. GM-9610 73.0
18. F3 DLGG-11 x DLGG-1 44.8 43. OBGG-11 89.6
19. F3 NB x BDYR-1 34.7 44. CZM-1 64
20. F3 BG x BDYR-1 22.2 45. KM-2194 71.4
21. F3 M-1 x DLGG-16 48.7 46. IPM-99-125 73.3
22. F3 BB x Pusa 9531 38.0 47. DLGG-3 100.0
23. F3 NB x Pusa bold-2 55.5 48. GG-9 82.3
24. F3 KM 162 x DLGG-2 50.0 49. Chinamung 63.3
25. F4 Pusa baisakhi x DLGG-2 31.3 50. GG-14 81.8
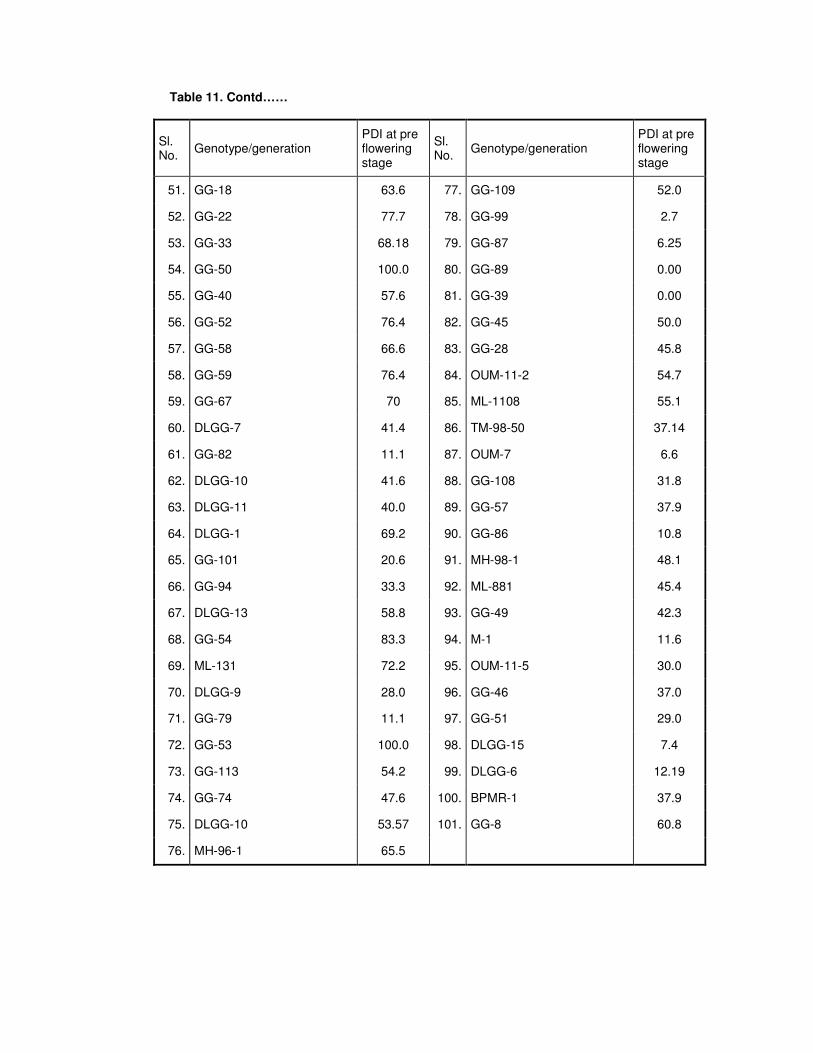
Table 11. Contd……
Sl. No.
Genotype/generation PDI at pre flowering stage
Sl. No.
Genotype/generation PDI at pre flowering stage
51. GG-18 63.6 77. GG-109 52.0
52. GG-22 77.7 78. GG-99 2.7
53. GG-33 68.18 79. GG-87 6.25
54. GG-50 100.0 80. GG-89 0.00
55. GG-40 57.6 81. GG-39 0.00
56. GG-52 76.4 82. GG-45 50.0
57. GG-58 66.6 83. GG-28 45.8
58. GG-59 76.4 84. OUM-11-2 54.7
59. GG-67 70 85. ML-1108 55.1
60. DLGG-7 41.4 86. TM-98-50 37.14
61. GG-82 11.1 87. OUM-7 6.6
62. DLGG-10 41.6 88. GG-108 31.8
63. DLGG-11 40.0 89. GG-57 37.9
64. DLGG-1 69.2 90. GG-86 10.8
65. GG-101 20.6 91. MH-98-1 48.1
66. GG-94 33.3 92. ML-881 45.4
67. DLGG-13 58.8 93. GG-49 42.3
68. GG-54 83.3 94. M-1 11.6
69. ML-131 72.2 95. OUM-11-5 30.0
70. DLGG-9 28.0 96. GG-46 37.0
71. GG-79 11.1 97. GG-51 29.0
72. GG-53 100.0 98. DLGG-15 7.4
73. GG-113 54.2 99. DLGG-6 12.19
74. GG-74 47.6 100. BPMR-1 37.9
75. DLGG-10 53.57 101. GG-8 60.8
76. MH-96-1 65.5
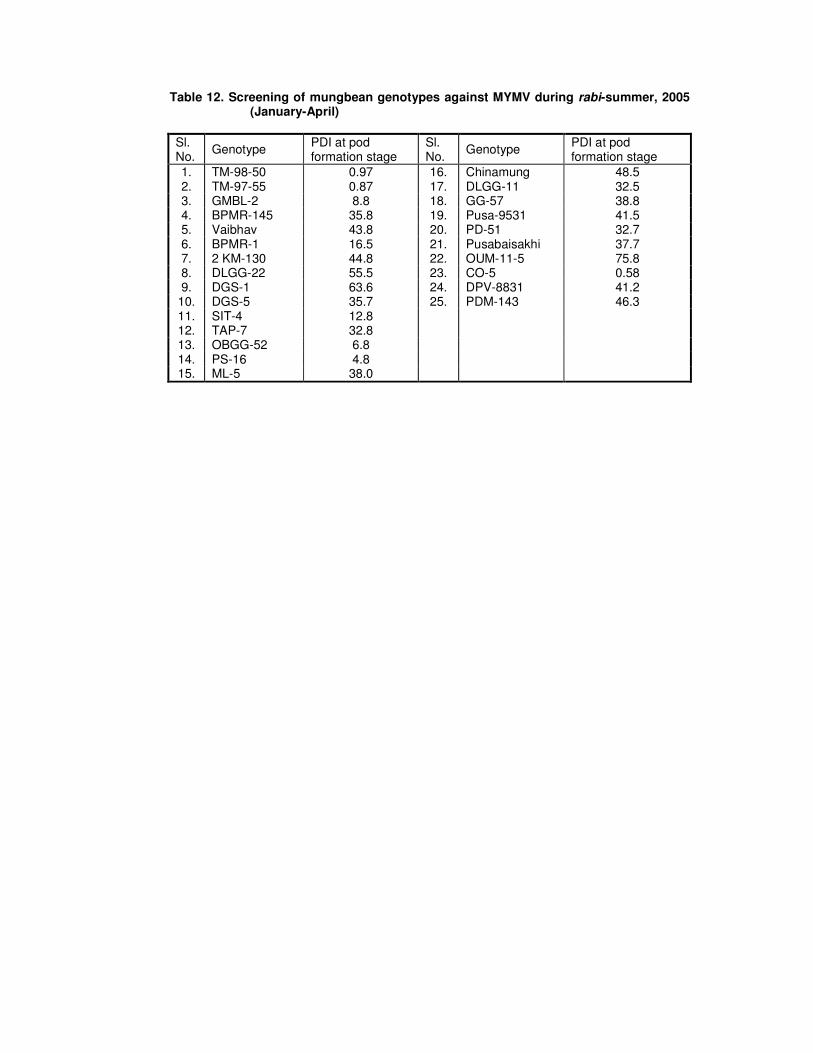
Table 12. Screening of mungbean genotypes against MYMV during rabi-summer, 2005 (January-April)
Sl. No.
Genotype PDI at pod formation stage
Sl. No.
Genotype PDI at pod formation stage
1. TM-98-50 0.97 16. Chinamung 48.5 2. TM-97-55 0.87 17. DLGG-11 32.5 3. GMBL-2 8.8 18. GG-57 38.8 4. BPMR-145 35.8 19. Pusa-9531 41.5 5. Vaibhav 43.8 20. PD-51 32.7 6. BPMR-1 16.5 21. Pusabaisakhi 37.7 7. 2 KM-130 44.8 22. OUM-11-5 75.8 8. DLGG-22 55.5 23. CO-5 0.58 9. DGS-1 63.6 24. DPV-8831 41.2
10. DGS-5 35.7 25. PDM-143 46.3 11. SIT-4 12.8 12. TAP-7 32.8 13. OBGG-52 6.8 14. PS-16 4.8 15. ML-5 38.0
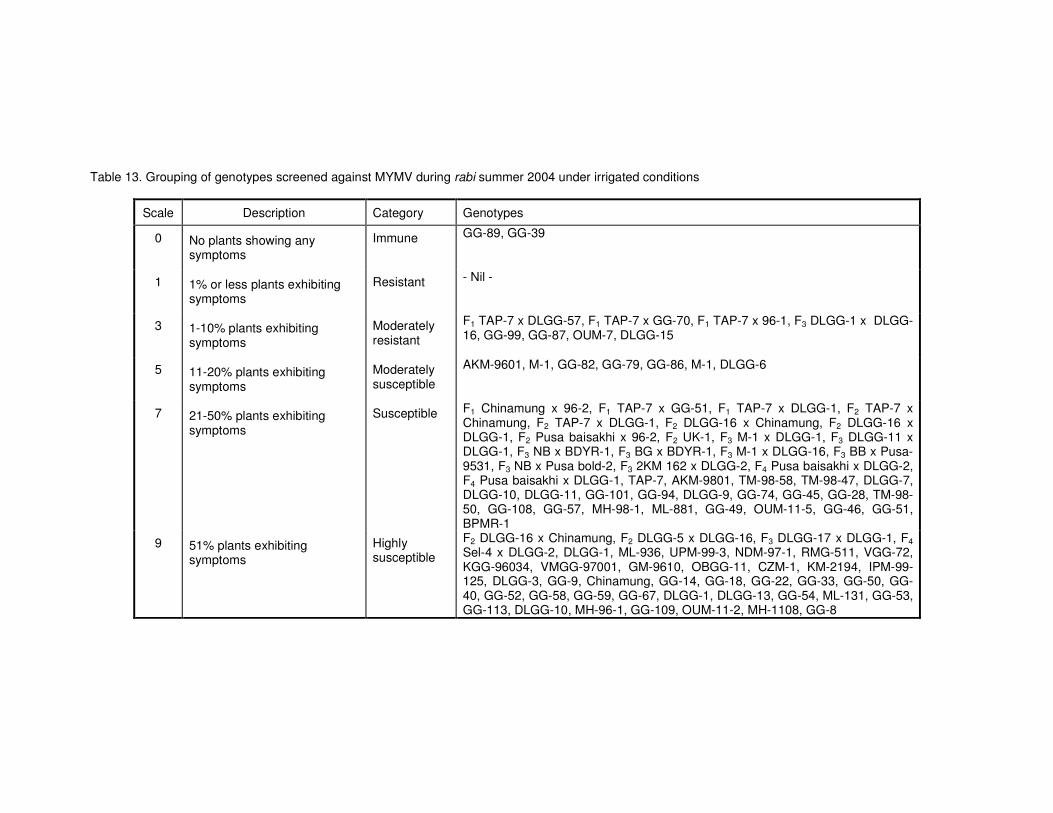
Table 13. Grouping of genotypes screened against MYMV during rabi summer 2004 under irrigated conditions
Scale Description Category Genotypes
0 No plants showing any symptoms
Immune GG-89, GG-39
1 1% or less plants exhibiting symptoms
Resistant - Nil -
3 1-10% plants exhibiting symptoms
Moderately resistant
F1 TAP-7 x DLGG-57, F1 TAP-7 x GG-70, F1 TAP-7 x 96-1, F3 DLGG-1 x DLGG-16, GG-99, GG-87, OUM-7, DLGG-15
5 11-20% plants exhibiting symptoms
Moderately susceptible
AKM-9601, M-1, GG-82, GG-79, GG-86, M-1, DLGG-6
7 21-50% plants exhibiting symptoms
Susceptible F1 Chinamung x 96-2, F1 TAP-7 x GG-51, F1 TAP-7 x DLGG-1, F2 TAP-7 x Chinamung, F2 TAP-7 x DLGG-1, F2 DLGG-16 x Chinamung, F2 DLGG-16 x DLGG-1, F2 Pusa baisakhi x 96-2, F2 UK-1, F3 M-1 x DLGG-1, F3 DLGG-11 x DLGG-1, F3 NB x BDYR-1, F3 BG x BDYR-1, F3 M-1 x DLGG-16, F3 BB x Pusa-9531, F3 NB x Pusa bold-2, F3 2KM 162 x DLGG-2, F4 Pusa baisakhi x DLGG-2, F4 Pusa baisakhi x DLGG-1, TAP-7, AKM-9801, TM-98-58, TM-98-47, DLGG-7, DLGG-10, DLGG-11, GG-101, GG-94, DLGG-9, GG-74, GG-45, GG-28, TM-98-50, GG-108, GG-57, MH-98-1, ML-881, GG-49, OUM-11-5, GG-46, GG-51, BPMR-1
9 51% plants exhibiting symptoms
Highly susceptible
F2 DLGG-16 x Chinamung, F2 DLGG-5 x DLGG-16, F3 DLGG-17 x DLGG-1, F4 Sel-4 x DLGG-2, DLGG-1, ML-936, UPM-99-3, NDM-97-1, RMG-511, VGG-72, KGG-96034, VMGG-97001, GM-9610, OBGG-11, CZM-1, KM-2194, IPM-99-125, DLGG-3, GG-9, Chinamung, GG-14, GG-18, GG-22, GG-33, GG-50, GG-40, GG-52, GG-58, GG-59, GG-67, DLGG-1, DLGG-13, GG-54, ML-131, GG-53, GG-113, DLGG-10, MH-96-1, GG-109, OUM-11-2, MH-1108, GG-8
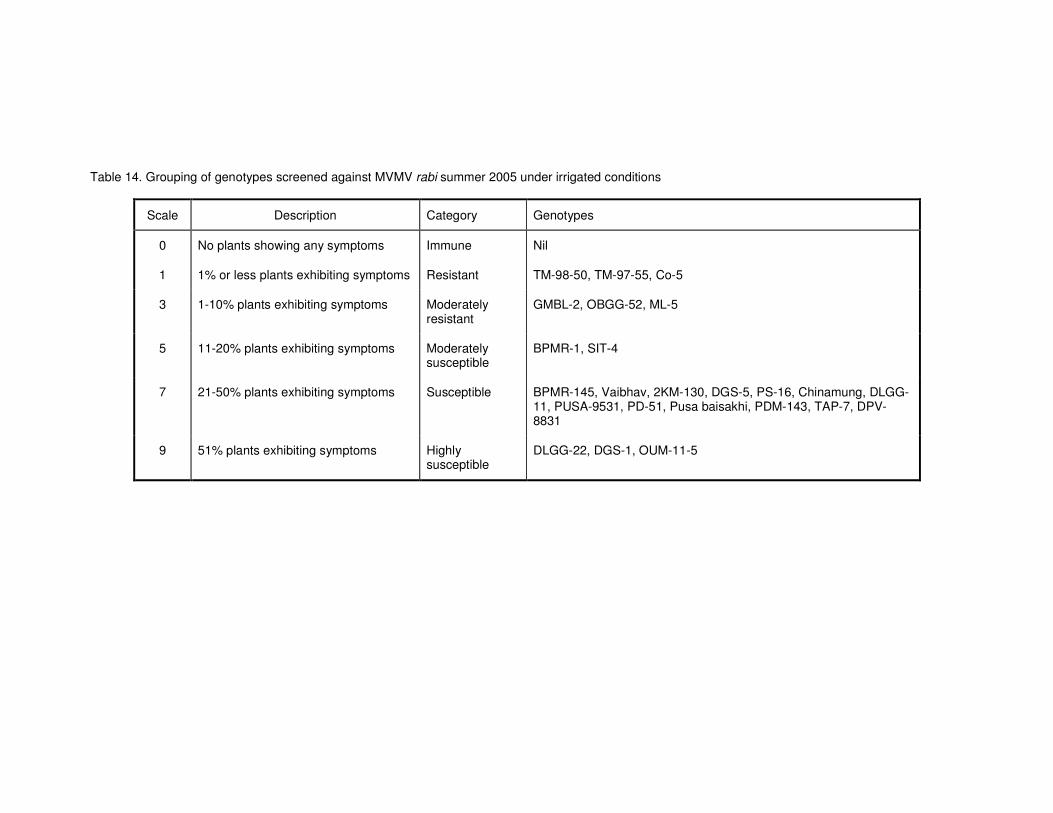
Table 14. Grouping of genotypes screened against MVMV rabi summer 2005 under irrigated conditions
Scale Description Category Genotypes
0 No plants showing any symptoms Immune Nil
1 1% or less plants exhibiting symptoms Resistant TM-98-50, TM-97-55, Co-5
3 1-10% plants exhibiting symptoms Moderately resistant
GMBL-2, OBGG-52, ML-5
5 11-20% plants exhibiting symptoms Moderately susceptible
BPMR-1, SIT-4
7 21-50% plants exhibiting symptoms Susceptible BPMR-145, Vaibhav, 2KM-130, DGS-5, PS-16, Chinamung, DLGG-11, PUSA-9531, PD-51, Pusa baisakhi, PDM-143, TAP-7, DPV-8831
9 51% plants exhibiting symptoms Highly susceptible
DLGG-22, DGS-1, OUM-11-5
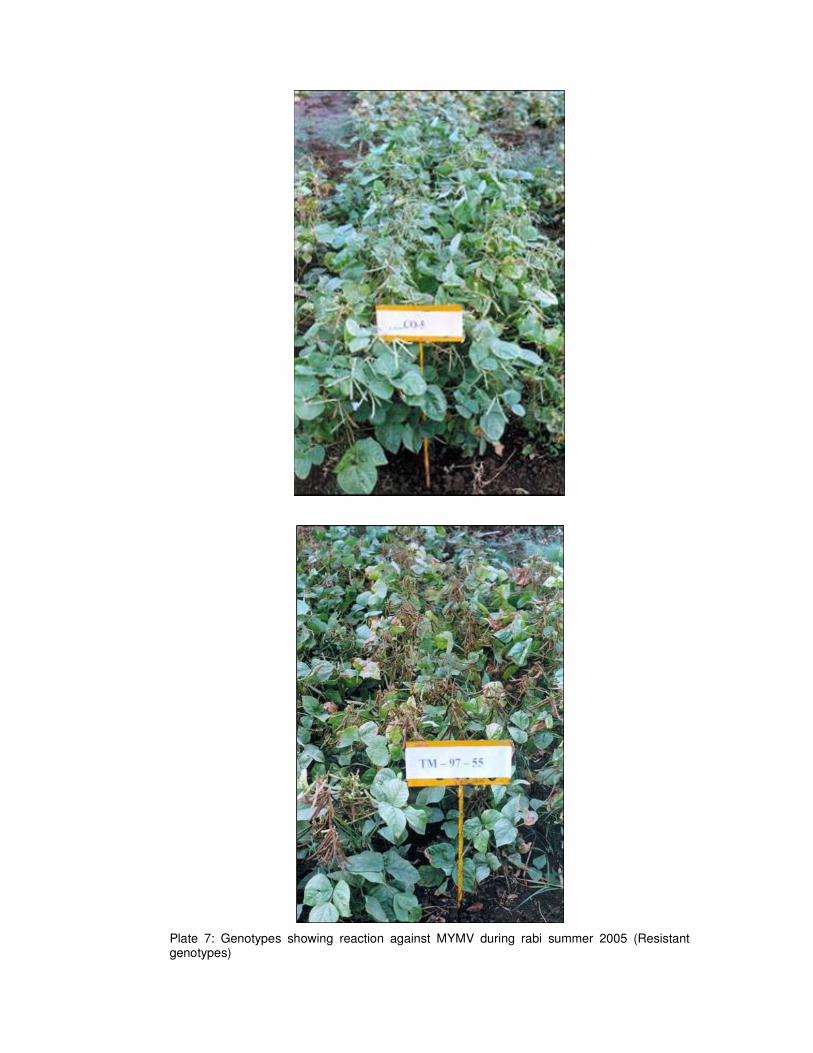
Plate 7: Genotypes showing reaction against MYMV during rabi summer 2005 (Resistant genotypes)
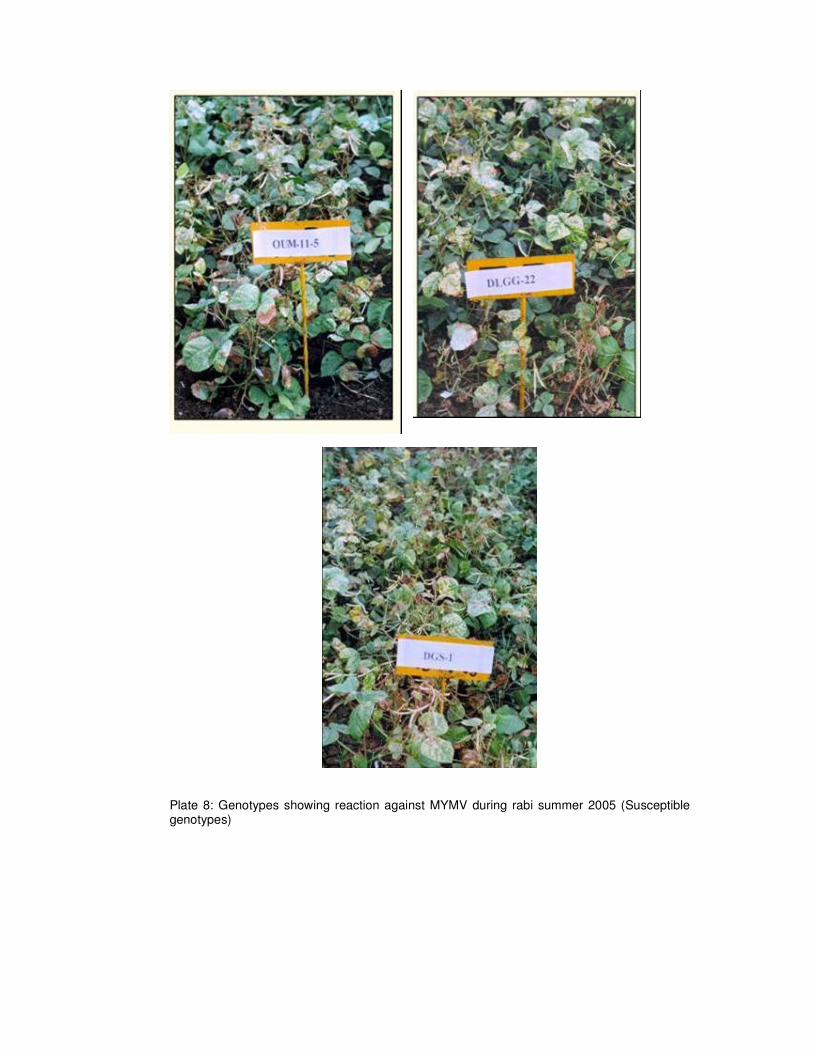
Plate 8: Genotypes showing reaction against MYMV during rabi summer 2005 (Susceptible genotypes)
During rabi-summer, 2004 yellow mosaic incidence varied from 0.00 in GG-89 and GG-39 to 100 per cent in GG-53 and GG-50. The F1 generation of TAP-7 x DLGG-57, TAP-7 x 96-1, F3
generation of DLGG-1 x DLGG-16, genotypes GG-99, GG-87, OUM-7, DLGG-15 were found moderately resistant with per cent disease incidence of 5.88, 6.80, 7.50, 2.70, 6.25, 6.60 and 7.40, respectively (Table 11).
The F2 generation of DLGG-16 x Chinamung, genotypes GG-50, GG-53, DLGG-3 were found highly susceptible showing 100 per cent disease incidence.
During rabi-summer, 2005 no genotype was found to be immune and the disease incidence varied from 0.58 per cent in Co-5 to 75.8 per cent in OUM-11-5 (Table 12, Plate 7 and Plate 8).
Plate 7. Genotyeps showin reaction against MYMV during rabi summer 2005 (Resistant genotypes)
Plate8. Genotypes showing reaction against MYMV during rabi summer 2005 (Susceptible genotypes)
Further, these genotypes were grouped into different categories based on 0-9 scale (Table 13 and 14). During rabi-summer, 2004, 18 crosses and 24 genotypes were found susceptible with PDI in the range of 21-50 per cent. Forty two entries of which 4 crosses and 38 genotypes were found highly susceptible and showed more than 51 per cent disease incidence (Table 13). During rabi summer 2005 also most of the genotypes (13) were found susceptible with yellow mosaic incidence ranging between 21 to 50 per cent (Table 14). The genotype TM-98-50 which recorded a disease incidence of 37.14 per cent during 2004, recorded only 0.97 per cent during 2005. OUM-11-5 recorded 30.00 per cent during 2004 but showed 75.8 per cent during rabi summer 2005.
Table 13. Grouping of genotypes screened against MYMV during rabi summer 2004 under irrigated conditions
Table 14. Grouping of genotypes screened against MYMV rabi summer 2005 under irrigated conditions
V. DISCUSSION
Mungbean yellow mosaic virus (MYMV) is the most destructive viral disease affecting yield potential of mungbean both quantitatively and qualitatively. MYMV incidence was first reported from the fields of IARI, New Delhi by Nariani (1960). This disease is well spread throughout the Indian subcontinent. In Karnataka, the work on MYMV was meagre. Therefore, the present study was carried out on various aspects viz., survey, virus identification, epidemiology and management. All the laboratory experiments were carried out at Department of Plant Pathology and field experiments at Main Agricultural Research Station, University of Agricultural Sciences, Dharwad.
Roving survey was conducted to know the distribution of mungbean yellow mosaic virus in northern parts of Karnataka during kharif, 2005 in major mungbean growing areas of Dharwad, Gadag, Haveri, Gulbarga and Bidar districts. The disease incidence ranged from zero to a maximum of 30.5 per cent. The highest average per cent disease incidence was noticed in Basavakalyan Taluk (27.3) of Bidar and Sedam Taluk (20.2) in Gulbarga district (Table 2). In Dharwad the disease incidence ranged between 0.0 in Belur and Ingalagi to a maximum of 18.0 in Hebbali. In Gadag district, most of the fields surveyed were free of disease but, Morab of Navalagund taluk recorded the maximum disease incidence of 15.0 per cent. In Haveri district, maximum disease incidence was recorded in Hangal (16.5%). Comparatively high disease incidence was noticed in Bidar and Gulbarga districts where it ranged from 9.0 to 30.5 per cent with highest per cent disease incidence recorded in Shahbad and Savoor (24.8) of Gulbarga district, Chitguppa and Todalla (30.5) of Bidar districts. Similar types of surveys were earlier documented by Nariani (1960), Nene (1972), Singh and Varma (1977), Singh et al. (1979), Bansal et al. (1984), Green (1999), Singh et al. (2000), Pathak and Jhamaria (2004).
The variation in disease incidence might be because of variation in temperature and relative humidity that may have direct influence on vector population and its migration. Similar effect of climate on vector population was earlier reported by Nath and Saikia (1995) and Singh and Gurha (1994).
In every infected field surveyed, whiteflies were found invariably. However, jassids, thrips and pod borers were the other insects noticed.
In all the mungbean fields surveyed, infected plants exhibited, irregular yellow and green patches on trifoliate leaves, puckering, reduction in leaf size, complete yellowing, bare peduncle with stunted internodes bearing few flowers and upturned pods with small and immature seeds. Similar range of symptoms were obtained in whitefly inoculated mungbean plants under glass house conditions also. These symptoms are in confirmation with those described by Nariani (1960).
In the present investigation, MYMV was not sap transmissible as none of the plants inoculated have shown symptoms. Further, the virus under study was not seed borne and was not transmitted through seeds as none of the seedlings raised from seeds obtained from diseased plants developed any symptoms even upto 30 days after emergence. Unsuccessful transmission of MYMV by sap, seed and soil was previously reported by Nariani (1960), Ahmed and Harwood (1973), Dhingra and Chenulu (1985), Grewal (1988) and Gautam (1990). However, Honda et al. (1983) were successful in sap transmission of Thailand isolate of MYMV.
Similarly, dodder (Cucscuta reflexa Roxb.) could not transmit MYMV from diseased to healthy mungbean plants as no symptoms were developed on healthy plants even at 30 days after dodder establishment. Unsuccessful attempts for dodder transmission of whitefly borne viruses were made by Bird (1957), Capoor and Varma (1950a), Capoor and Verma (1950b) and Ahmed (2001).
It was observed that MYMV was transmissible by grafting and yellow mosaic symptoms were observed 10-15 days after grafting on the newly emerging trifoliate leaves of rootstock. Graft transmissible nature of MYMV was previously reported by Nariani (1960), Ahmed and Harwood (1973), Chenulu and Varma (1988) and Ahmed (2001) with BYVMV in bhendi.
MYMV was transmitted readily by an insect vector i.e., whitefly (Bemisia tabaci Genn.) as all the inoculated plants developed yellow mosaic symptoms within 12-15 days. Several workers have reported insect transmission of MYMV. Nariani (1960) was first to report whitefly transmission of MYMV. MYMV is transmitted by whitefly in circulatory manner, 15 minutes starvation before acquisition increases transmission rates upto 39 per cent. Even a single whitefly is enough to transmit virus (Nair and Nene, 1973). MYMV is not transmitted transovarially (Ahmed and Harwood, 1973). Several other scientists who worked on whitefly transmission were Rathi and Nene (1976), Murugesan and Chelliah (1977), Chenulu et al. (1979), Muniyappa et al. (1987) and Krishnareddy (1989).
Electron microscopic studies revealed the presence of typical geminate particles measuring 30 x 20 nm (approximately) in diseased samples of mungbean. These particles have similar morphology as those of other Begomoviruses. Similar type of geminate particles were earlier reported by Muniyappa et al. (1987), Honda et al. (1983) and Thongmeearkom et
al. (1981).
The correlation and regression studies of weather parameters with per cent disease incidence and whitefly population revealed a significant positive correlation with maximum temperature (0.582* and 0.730**, respectively). Whitefly population showed a significant negative correlation with afternoon relative humidity. Further, a highly significant positive correlation was obtained between per cent disease incidence and whitefly population. Similar results were earlier published by Murugesan et al. (1977), Murugesan and Chelliah (1977) and Nath (1994). Narasimhan and Arjunan (1976) reported a highly significant positive correlation between whitefly population and incidence of cassava mosaic. The need of high temperatures for whitefly development and dispersal was earlier reported by Butler et al. (1983) and Mohanty and Basu (1991).
Among the various treatments tested for managing mungbean yellow mosaic virus disease, seed treatment with imidacloprid along with two sprays of imidacloprid and two sprays of imidacloprid alone found highly effective and recorded the lowest per cent disease incidence and least number of whiteflies (1.53 and 1.73 whiteflies per plant 5 days after first spray and 1.87 and 1.73 whiteflies per plant 5 days after second spray, respectively). This consequently led to least incidence of MYMV both at 60 days after planting (38.32 and 39.20%) and 75 days after planting (41.70 and 42.14%).
Effectiveness of imidacloprid for the management of whiteflies was earlier reported by Mote et al. (1993), Walunj and Mote (1995) and Dandale et al. (2001).
Two sprays of azadirachtin 0.03 EC (5 ml/l) and leaf extract of Clerodendrum
aculeatum (1:5) were moderately effective recording an incidence of 49.15 and 50.48 per cent at 15 days after first spray and 55.98 and 58.23 per cent at 15 days after second spray and also lower whitefly counts of 3.20 and 4.80 per plant at 5 days after first spray and 4.0 and 5.0 whiteflies per plant at 5 days after second spray. Baranwal and Ahmed (1997) reported the increased plant height and yields in tomato that were sprayed with Clerodendrum leaf extract against ToLCV. The plots protected by two sprays of dimethoate 30 EC, marigold as trap crop along with yellow sticky traps, seed treatment with imidacloprid followed by 2 sprays with dimethoate and package of practices were the next best treatments recording lower whitefly counts ranging from 2 to 2.40 whiteflies per plant after first spray. The same trend was noticed after the second spray also with whitefly population ranging from 2.40 to 2.80 per plant (Table 8).
Borah (1995), Sastry and Singh (1973) and Mote (1976) reported that the foliar spray of dimethoate @ 0.03 per cent was highly effective in reducing whitefly incidence in greengram fields.
Borah and Nath (1995) reported the reduced incidence of whitefly transmitted yellow vein mosaic disease due to dimethoate sprays at 15 and 30 days after germination.
The effectiveness of sticky traps in controlling whiteflies has been reported by Raghupathi and Sabitha (1994) in soybean, Uthamasamy (1989) in cotton, Cohen and Marco (1973) for the management of cucumber mosaic virus and potato viruses.
Maize as a barrier crop was found ineffective by recording 6.20 whiteflies per plant. The effectiveness of barrier crop depends on many factors like vigour, thickness and height,
environmental factors like wind velocity and direction and growth of the crop (Singh, 1985 and Raghupathi and Sabitha, 1994). Ravindrababu (1987) reported that barrier crops sprayed with endosulfan were more effective in reducing incidence of mungbean yellow mosaic compared to unsprayed barriers.
With respect to disease incidence, 2 sprays of imidacloprid 17.8 SL, 2 sprays of dimethoate 30 EC, seed treatment with imidacloprid along with 2 sprays of imidacloprid 17.8 SL, seed treatment with imidacloprid along with 2 sprays of dimethoate 30 EC, were found equally effective in recording lower disease incidence (38.32 to 43.99% at 15 days after first spray) and the same trend was noticed with respect to second spray. This was obviously due to the reduced whitefly populations in the above said treatments.
The effect of mungbean yellow mosaic virus disease on various growth and yield parameters viz., plant height, pods per plant, seed yield per plant, 100 seed weight and yield per hectare in different treatments were evaluated. It is evident from the results that the treatments which recorded least whitefly population and per cent disease incidence have shown a significant positive effect on all the growth and yield parameters evaluated.
Among the treatments, imidacloprid 70 WP @ 5 g/kg seed treatment along with 2 sprays imidacloprid 17.8 SL @ 0.24 ml/l and 2 sprays of imidacloprid 17.8 SL @ 0.24 ml/l alone recorded highest number of pods per plant (14.53 and 13.70, respectively), seed yield per plant (5.73 and 5.30 g, respectively), 100 seed weight (4.93 and 4.50 g, respectively) and yield (13.30 and 12.80 q/ha, respectively). The superiority of imidacloprid in controlling sucking pests was earlier documented by several workers like Mote et al. (1993), Jarande and Dethe (1994), Mote et al. (1994a and b), Walunj and Mote (1995) and Dandale et al. (2001) on various other crops. However, plant height in all the treatments was found statistically non-significant.
The treatment package of practices was the next best treatment with 13.13 pods per plant, seed weight per plant of 5.00 g, 100 seed weight of 4.17 g and yield of 11.63 q/ha.
Previously several authors have documented the negative effect of virus diseases on growth and yield parameters. Bisht et al. (1988) reported an average reduction of 24.76 per cent in pods per plant, 27.02 per cent reduction in 100 seed weight, 25.28 per cent reduction in yield per plant in highly susceptible variety of greengram, PIMS-4. Further they reported that there was no significant difference in plant height and fresh plant weight. Similar type of results were reported by Premchand and Varma (1983), Quaiser Ahmed (1991) and Aftab et
al. (1993) in mungbean and Bhagat (1999) in okra against bhendi yellow vein mosaic virus infections.
Single row of maize, grown as border row was inefficient and recorded lowest figures in all the parameters and was on par with control. This was in contradiction with documentations of Ravindrababu (1987) and Singh (1985) where they emphasized the factors like vigour, thickness, height of barrier and insecticidal spray to the barrier were effective in controlling the vector movement, decreased disease incidence and increased the yields.
The plots that were protected with marigold as trap crop along with yellow sticky traps (8/ha), 2 sprays of azadirachtin 0.03 EC @ 5 ml/l alone and in combination with imidacloprid 75 WS @ 5 g/kg seed treatment, 2 sprays of Clerodendrum aculeatum leaf extract (1:5) alone and in combination with imidacloprid 75 WS 5 g/kg seed treatment were found inferior to that of the plots that were protected with insecticidal sprays, with respect to growth and yield parameters ranging between 9.70 to 12.10 pods per plant, 4.10 to 4.50 g seed weight per plant, 3.80 to 4.00 g 100 seed weight and 7.97 to 10.13 q/ha of yield.
The effectiveness of insecticides was attributed to greater residual activity, high level of protection, quick knock down effect of insecticides on viruliferous vectors compared to botanicals, plant products and cultural practices that act indirectly by enhancing growth of plant, delaying disease appearance as reported by Baranwal and Ahmed (1997), by inducing resistance as reported by Verma and Varsha (1995) or by changing feeding behavior, by deterring settling activity of vector or becoming toxic to vector before inoculating virus as reported by Somashekara et al. (1997) or by acting as ovipositional deterrents (Patel et al., 1994) which are not sharp and accurate enough to restrict the activity of viruliferous vectors.
The treatmentwise yield and cost of treatment application was worked out. Based on the data, net returns and benefit: cost ratio were computed and presented in Table 10.
The highest yield of 13.30 q/ha was recorded in treatment of 2 sprays of imidacloprid 17.8 SL @ 0.24 ml/l along with imidacloprid 70 WS seed treatment @ 5.0 g/kg seed (T8). The next best yield recorded was 12.80 q/ha in the treatment, 2 sprays of imidacloprid 17.8 SL @ 0.24 ml/l alone (T3). The lowest yield of 7.00 q/ha was recorded in maize as border row (T1).
The treatment T3 i.e. 2 spray of imidacloprid 17.8 SL @ 0.24 ml/l recorded highest net returns of Rs.12,323.70. The next to follow were T8 (2 sprays of imidacloprid 17.8 SL @ 0.24 ml/l along with imidacloprid 70 WS @ 5 g/kg seed treatment) and T12 (package of practices) that gave Rs.11,748.70 and Rs.10,513.40, respectively.
Package of practices (T12) recorded highest benefit: cost ratio of 29.11, though the yield recorded was not highest but because of the less cost of plant protection measures involved. Two sprays of dimethoate 30 EC @ 1.5 ml/l (T6) emerged as second best with B: C ratio of 27.19. The treatment T3 (2 sprays of imidacloprid 17.8 SL @ 0.24 ml/l) though recorded highest net returns, it gave a B: C ratio of 24.80, which is next best treatment to T6. The treatment T8 (2 sprays of imidacloprid 17.8 SL @ 0.24 ml/l along with seed treatment with imidacloprid 70 WS @ 5 g/kg) recorded good net returns but shown a meagre B: C ratio of 5.88 because of high cost of insecticide.
The lowest net return was realized (Rs.1201.00) in seed treatment with imidacloprid 70 WS @ 5 g/kg seed alone with a least B: C ratio of 0.80. This is because the seed treatment alone could protect the crop for a limited period may be upto 30 to 35 days and after that it might have lost it’s effectiveness. Similar results were earlier reported by Mote et
al. (1993), Mote et al. (1994a), Jarande and Dethe (1994) and Walunj and Mote (1995). The treatment T7 (marigold as trap crop + yellow sticky taps @ 8/ha) recorded fairly good yield of 10.13 q/ha with a B: C ratio of 16.91 and it was next best to T3 (2 sprays of imidacloprid 17.8 SL @ 0.24 ml/l). Similarly, the effectiveness of yellow sticky traps in reducing vector population was previously discussed by Cohen and Marco (1973), Uthamasamy (1989) and Raghupathi and Sabitha (1994).
Identification of resistant genotypes is one of the most important aspects in the management of viral diseases, which will be the best possible solution to the viral disease problems. In the present investigation, a total of 103 genotypes during rabi-summer 2004 and 25 genotypes during rabi-summer 2005 were screened under irrigated field conditions. The disease incidence varied from 0.00 to 100.0 per cent during rabi-summer 2004 and 0.58 to 75.8 per cent during rabi-summer 2005 in various genotypes.
Two genotypes GG-89 and GG-39 showed immune reaction, the F1 generation of TAP-7 x DLGG-57, TAP-7 x 96-1, F3 generation of DLGG-1 x DLGG-16 and the genotypes GG-99, GG-87, OUM-7, and DLGG-15 showed moderately resistant reactions with <10 per cent of disease incidence during rabi-summer 2004. However, there were no immune entries during rabi-summer, 2005 but the genotypes, TM-98-50, TM-97-55 and CO-5 were found resistant with only <1 per cent disease incidence. GMBL-2, OBGG-52 and ML-5 were found moderately resistant with disease incidence in range of 1 to 10 per cent. Chinamung, the mung variety preferred and grown all over Karnataka was found susceptible in both the years of screening.
In general, overall disease incidence was more and the majority of genotypes tested have recorded susceptible and highly susceptible reaction against MYMV. Similar type of varietal evaluations were previously documented by several workers (Chenulu et al., 1979; Singh et al., 1980; Kuldip Singh et al., 1996; Asthana, 1998; Basandrai et al., 1999; Siddiqui et al., 1999; Raje and Rao, 2002; Marappa et al. 2003; Ganapathy et al., 2003; Pathak and Jhamaria, 2004 and Peerajade et al., 2004). However, the genotypes now showing some degree of resistance should be tested again by artificial inoculation or at the hot spot areas like Bidar and Gulbarga districts that recorded high incidences during surveys before including them either in resistance breeding programme or recommending directly as resistant varieties.
FUTURE LINE OF WORK
1. Detailed survey has to be taken up throughout Karnataka to know the distribution and hotspots of disease
2. More emphasis should be given for characterization of virus/virus strains associated with MYMV in this area
3. Detailed studies on epidemiology of MYMV should be taken up under various agro-climatic zones of Karnataka
4. Efficacy of insecticides, botanicals, plant extracts and other managements practices should be further evaluated in hot spots with susceptible cultivars over seasons
5. The genotypes found immune and resistant during this investigation need to be screened again, at locations with high disease incidence before their recommendation for disease management
6. The mechanism of resistance to the virus, the vector and characterization of stable resistance to MYMV in mungbean and related species should be emphasized
VI. SUMMARY
The mungbean or greengram (Vigna radiata (L.) Wilczek) is the third most important pulse crop grown in India. Mungbean suffers from several diseases with substantial losses in yields. Of all the diseases, mungbean yellow mosaic virus (MYMV) disease is the most destructive, which takes heavy toll in Indian subcontinent and adjacent areas of South-East Asia, causing 0-100 per cent losses in yields. The present investigation was carried out on different aspects of MYMV viz., distribution, symptomatology, transmission, management, epidemiology and varietal screening.
Roving survey during kharif 2005 revealed an incidence of 0.0 in Gadag district to a maximum of 9.0 to 30.5 per cent in Gulbarga and Bidar districts. The variety Chinamung that covers maximum area in Karnataka was found susceptible to MYMV. Whiteflies, thrips, jassids and pod borers were the common insects observed in almost all the diseased fields surveyed.
MYMV infection produced the symptoms like yellow mosaic, complete yellowing, size reduction, slight puckering of leaves, stunting of flower stalk bearing few flowers and yellow, upturned pods with immature and shriveled seeds.
MYMV was not transmitted by sap, seed or through dodder but was transmitted by grafting and whitefly, Bemisia tabaci Genn. to a tune of 90 per cent.
Electron microscopic studies revealed the presence of typical geminate particles in partially purified preparation from diseased samples of cv. Chinamung.
Studies on integrated disease management of MYMV proved the superiority of insecticidal sprays in controlling whitefly vector over all other management practices. Thus, the crop can be protected by seed treatment with imidacloprid 70 WS (5 g/kg) along with two sprays of imidacloprid 17.8 SL (0.24 ml/l) at 45 and 60 DAP or two sprays of imidacloprid 17.8 SL (0.24 ml/l) alone at 45 and 60 DAP which recorded least number of whiteflies per plant and brought out significant increase in all the growth and yield parameters assessed. However, package of practices recorded the best benefit: cost ratio besides giving on par results with above said treatments.
Epidemiological studies revealed a positive significant correlation of maximum temperature with both per cent disease incidence and whitefly population. Further, there was a highly significant positive correlation between whitefly population and per cent disease incidence.
Among a total of 103 genotypes and crosses evaluated for resistance against MYMV during rabi-summer, 2004 under irrigated field conditions, the genotypes GG-89 and GG-39 were found immune and GG-99, GG-87, OUM-7, DLGG-1 were found moderately resistant. The genotypes TM-98-50, TM-97-55 and Co-5 have shown resistant reaction and the genotypes GMBL-2, OBGG-52, ML-5 were moderately resistant against MYMV incidence during rabi-summer 2005. Most of the genotypes evaluated showed susceptible reaction. Chinamung that covers most of the greengram growing area in Karnataka was found highly susceptible to MYMV.
VII. REFERENCES
AFTAB, M., ASAD, S., KHOKHAR, K.M., AYUB, M.A. AND BUTT, T.B., 1993, Effect of mungbean yellow mosaic virus on the yield and growth components of asparagus bean. Pakistan Journal of Phytopathology, 5(1-2): 58-61.
AHMED, M. AND HARWOOD, R.F., 1973, Studies on whitefly transmitted yellow mosaic of urd bean (Phaseolus mungo). Plant Disease Reporter, 57: 800-802.
AHMED, Z., 2001, Studies on okra (bhendi) yellow vein mosaic virus, M.Sc. Thesis, University of Agricultural Sciences, Dharwad.
ANONYMOUS, 2004, Fully Revised Estimates of Principal Crops in Karnataka for the Year 2001-02. Directorate of Economics and Statistics, Bangalore, Government of Karnataka, p.118.
ASTHANA, A.N., 1998, Pulse crops research in India. Indian Journal of Agricultural Sciences, 68(8): 448-452.
BANSAL, R.D., KHATRI, H.L., SHARMA, O.P. AND SINGH, I.P., 1984, Epidemiological studies on viral diseases of mung and mash in Punjab. Journal of Research, Punjab Agricultural University, 21(1): 54-58.
BARANWAL, V.K. AND AHMED, N., 1997, Effect of Clerodendrum aculeatum leaf extract on tomato leaf curl virus. Indian Phytopathology, 50(2): 297-299.
BASANDRAI, A.K., GARTAN, S.L., BASANDRAI, D. AND KALIA, V., 1999, Blackgram (Phseolus mungo) germplasm evaluation against different diseases. Indian Journal of Agricultural Sciences, 69(7): 506-508.
BHAGAT, A.P., 1999, Effect of Bhendi Yellow Vein Mosaic Virus (BYVMV) on growth and yield of Bhendi. Journal of Mycology and Plant Pathology, 30(1): 110-111.
BIRD, J., 1957, A whitefly transmitted mosaic of Jatropa gossypifolia. Technical Paper No. 22, Agricultural Experimental Station, University of Puerto Rico.
BISHT, I.S., SHAMSHER SINGH AND DABAS, B.S., 1988, Effect of yellow mosaic virus on growth components and yields of four promising cultures of mungbean. Indian Journal of Mycology and Plant Pathology, 18(2): 204-205.
BOCK, K.R., 1982, Gemini virus disease in tropical crops. Plant Disease, 66: 266-270.
BORAH, R.K., 1995, Effect of synthetic pyrethroids and organophosphorus insecticides on the incidence of whitefly, Bemisia tabaci (Genn.) and yellow mosaic virus in greengram, Vigna radiata (L.) Wilczek. Indian Journal of Virology, 11(1): 75-76.
BORAH, R.K. AND NATH, P.D., 1995, Evaluation of an insecticide schedule on the incidence of whitefly, Bemisia tabaci (Genn.) and yellow vein mosaic in okra. Indian Journal of Virology, 11(2): 65-67.
BUTLER, JR., G.D., HENNEBERRY, T.J. AND CLAYTON, T.E., 1983, Bemisia tabaci (Homoptera:Aleyrodidae):Development, oviposition and longevity in relation to temperature. Annals of Entomological Society of America, 76: 310-313.
CAPOOR, S.P. AND VARMA, P.M., 1948, Yellow mosaic of Phaseolus lunatus L. Current Science, 17(5): 152-153.
CAPOOR, S.P. AND VARMA, P.M., 1949, Bhendi mosaic and it’s control in Poona. Indian Farming, 2: 14-16.
CAPOOR, S.P. AND VARMA, P.M., 1950a, New virus disease of Dolichos lablab. Current Science, 19: 248-249.
CAPOOR, S.P. AND VARMA, P.M., 1950b, Yellow vein mosaic of H. esculentus L. Indian Journal of Agricultural Sciences, 20: 217-230.
CHANDRASEKHARAN, M. AND BALASUBRAMANIAN, G., 2002, Evaluation of plant products and insecticides against sucking pests of greengram. Pestology, 26(1): 48-50.
CHATTERJEE, D. AND RANDHAWA, G.S., 1952, Standardized names of cultivated plants in India-II. Cereals, pulses, vegetables and spices. Indian Journal of Horticulture, 9: 64-84.
CHENULU, V.V. AND VERMA, A., 1988, Virus and virus like diseases of pulse crops commonly grown in India. In: Pulse Crops, Eds. Baldev, B., Ramanujam, S. and Jain, H.K., Oxford and IBH Publishing Co., New Delhi, pp.338-370.
CHENULU, V.V., VENKATESWARLU, V. AND RANGARAJU, R., 1979, Studies on yellow mosaic disease of mungbean. Indian Phytopathology, 32: 230-235.
COHEN, S. AND MARCO, S., 1973, Reducing the spread of aphid-transmitted viruses in peppers by trapping the aphids on sticky yellow polyethylene sheets. Phytopathology, 63: 1207-1209.
DANDALE, H.G., THAKARE, A.Y., TIKAR, S.N., RAO, N.G.V. AND NIMBALKAR, S.A., 2001, Effect of seed treatment on sucking pests of cotton and yield of seed cotton. Pestology, 25(3): 20-23.
DEBROT, C.E.A. AND ORDOSGOITTI, F.A., 1975, Studies on a yellow mosaic of soybean in Venezuela. Agronomy Tropics, 25: 435-449.
DHINGRA, K.L. AND CHENULU, V.V., 1985, Effect of yellow mosaic on yield and nodulation of soybean. Indian Phytopathology, 38: 248-251.
DIXIT, G.P., 2005, Project Coordinators Report. Annual Group Meet (kharif, 2005). Indian Institute of Pulses Research, Kanpur.
GANAPATHY, T., KURUPPIAH, R. AND GUNASEKARAN, K., 2003, Identifying the source of resistance for mungbean yellow mosaic virus (MYMV), urd bean leaf crinkle virus and leaf curl virus disease in urd bean (Vigna mungo (L.) Hepper). In Annual Meeting and Symposium on recent Developments in the diagnosis and Management of Plant Diseases for Meeting Global Challenges, December 18-20, 2003, University of Agricultural Sciences, Dharwad, p.30.
GAUTAM, H.C., 1990, Identification of soybean diseases and their integrated control. Farmer and Parliament, May 1990, pp.15-22.
GREEN, S.K., 1999, In project 3, legumes for crop diversification. AVRDC Report – 1999, pp.35-43.
GREWAL, J.S., 1988, Diseases of pulse crops – an overview. Indian Phytopathology, 41(1): 1-14.
HAYTOWITZ, O.B. AND MATTHEWS, R.H., 1986, Composition of foods : legumes and legume products. United States Department of Agriculture. Agriculture Hand Book, pp.8-16.
HOLLINGS, M., STONE, A.A., OLWEN, M. AND BOCK, K.R., 1976, Purification and properties of sweet potato mild mottle, a white fly borne virus from sweet potato (Ipomoea batatas) in East Africa. Annals of Applied Biology, 82: 511-528.
HONDA, Y., IWAKI, M., SAITO, Y., THONGAMEEAKOM, P., KITTISAK, K. AND DEEMA, N., 1983, Mechanical transmission, purification and some properties of whitefly borne mungbean yellow mosaic in Thailand. Plant Disease, 67: 801-804.
IKEGAMI, M., YAZAKI, K., HONDA, Y., IWAKI, M., FUJII, H., MORINAGA, T. AND MINRA, K., 1985, Single stranded DNA in mungbean yellow mosaic virus. Microbiology and Immunology, 29(8): 783-789.
JARANDE, N.T. AND DETHE, M.D., 1994, Imidacloprid for effective control of sucking pests of chilli. Pestology, 18(12): 15-18.
KOTRESHE, N., 2002, Histology and biochemical studies on mosaic complex of chilli (Capsicum annuum L.). M.Sc. Thesis, University of Agricultural Sciences, Dharwad.
KRISHNAREDDY, M., 1989, Studies on yellow mosaic and leaf crinkle disease of blackgram. Ph.D. Thesis, Post Graduate School, IARI, New Delhi.
KULDIP SINGH, SARVJEET SINGH AND GUMBER, R.K., 1996, Resistance to mungbean yellow mosaic virus in mungbean. Indian Journal of Pulses Research, 9(1): 90.
MARAPPA, N., SAVITHRAMMA, D.L., NAGARAJU, PRAMEELA, H.A. AND KRISHNAMURTHY, R.A., 2003, Evaluation of mungbean genotypes against powdery mildew, yellow mosaic virus and bacterial blight diseases at Bangalore. In: Annual Meeting and Symposium on Recent Developments in the Diagnosis and Management of Plant Diseases for Meeting Global Challenges, December 18-20, 2003, University of Agricultural Sciences, Dharwad, p.31.
MAYEE, C.D. AND DATAR, V.V., 1986, Phytopathometry, Marathawada Agricultural University, Parbhani. Technical Bulletin No. 1, pp.145-146.
MOHANTY, A.K. AND BASU, A.N., 1991, Seasonal variations in the aerial populations of the whitefly vector Bemisia tabaci under Delhi conditions. Indian Phytopathology, 44: 494-496.
MOTE, U.N., 1976, Effect of different insecticides on the control of whitefly (Bemisia tabaci Gennadius) population in tomato crop and the incidence of the tomato leaf curl virus. Journal of Maharashtra Agricultural Universities, 1(1): 42-45.
MOTE, U.N., DATKHILE, R..V AND PAWAR, S.A., 1993, A new insecticide, imidacloprid, as a seed dresser for the control of sucking pests of cotton. Pestology, 17(12): 5-9.
MOTE, U.N., DATKHILE, R.V. AND PAWAR, S.A., 1994a, Efficiency of imidacloprid as seed treatment and root dip against sucking pests of chilli. Pestology, 18(2): 5-9.
MOTE, U.N., DATKHILE, R..V AND PAWAR, S.A., 1994b, Imidacloprid as seed dresser against sucking pests of okra. Pestology, 18(3): 5-10.
MUNIYAPPA, V., 1980, Whiteflies, In: Vectors of Plant Pathogens, Eds. Harris K. F. and Maramorosch K., Academic Press, New York, pp.39-85.
MUNIYAPPA, V., RAJESWARI, R., BHARATHAN, N., REDDY, D.V.R. AND NOLT, B.L., 1987, Isolation and characterization of a Gemini virus causing yellow mosaic disease of horsegram (Macrotyloma uniflorum (Lam.) Verdc.) in India. Journal of Phytopathology, 119: 81-87.
MURUGESAN, S. AND CHELLIAH, S., 1977, Influence of sowing time on the incidence of the vector Bemisia tabaci (Genn.) and the yellow mosaic disease of greengram. Madras Agricultural Journal, 64(2): 128-130.
MURUGESAN, S., CHELLIAH, S. AND MURUGESAN, M., 1977, Prediction of whitefly vector Bemisia tabaci (Genn.) and yellow mosaic disease incidence in greengram. Madras Agricultural Journal, 64(1): 22-28.
NAIR, N.G. AND NENE, Y.L., 1973, Studies on yellow mosaic of urd bean (Phaseolus mungo L.) caused by mungbean yellow mosaic virus I. transmission studies. Indian Journal of Farm Science, 1: 109-110.
NANDIHALLI, B.S., HUGAR, P. AND PATIL, B.V., 1990, Evaluation of neem and neem products against cotton whitefly Bemisia tabaci (Gennadius). Karnataka Journal of Agricultural Sciences, 3(1&2): 58-61.
NARASIMHAN, V. AND ARJUNAN, G., 1976, Whitefly population in relation to the incidence of mosaic in Cassava varieties at Salem (Tamil Nadu). Indian Journal of Mycology and Plant Pathology, 6: 187-188
NARIANI, T.K., 1960, Yellow mosaic of mung (Phaseolus aureus). Indian Phytopathology, 13: 24-29.
NATH, P.D., 1994, Effect of sowing time on the incidence of yellow mosaic virus disease and whitefly population on greengram. Annals of Agricultural Research, 15(2): 174-177.
NATH, P.D. AND SAIKIA, A.K., 1995, Effect of time of sowing on the incidence of mungbean yellow mosaic virus disease and whitefly (Bemisia tabaci Genn.) population in greengram. Annals of Agricultural Research, 16(4): 483-484.
NENE, Y.L., 1972, A survey of viral diseases of pulse crops in Uttar Pradesh. Uttar Pradesh Agricultural University, Pantnagar, Research Bulletin No. 4, p.191.
NENE, Y.L., 1973, Viral diseases of some warm weather pulse crops in India. Plant Disease Reporter, 57: 463-467.
PATEL, M.S., YADAV, D.N. AND RAI, A.B., 1994, Neemark (azadirachtin) as ovipositional deterrent against cotton pests. Pestology, 18(8): 17-19.
PATHAK, A.K. AND JHAMARIA, S.L., 2004, Evaluation of mungbean (Vigna radiata L.) varieties to yellow mosaic virus. Journal of Mycology and Plant Pathology, 34(1): 64-65.
PEERAJADE, D.A., RAVIKUMAR, R.L. AND RAO, M.S.L., 2004, Screening of local mungbean collections for powdery mildew and yellow mosaic virus resistance. Indian Journal of Pulses Research, 17(2): 190-191.
PHADKE, A.D., KHANDAL, V.S. AND RAHALKAR, S.R., 1988, Use of a neem product in insecticide resistance management (IRM) in cotton. Pesticides, 22(4): pp.36-37.
PREMCHAND AND VARMA, J.P., 1983, Effect of yellow mosaic on growth components and yield of mungbean and urdbean. Haryana Agricultural University Journal of Research, 13(1): 98-102.
QUAISER AHMED, 1991, Growth attributes and grain yield of mungbean plants affected by mungbean yellow mosaic virus in field. Indian Phytopathology, 43(4): 559-560.
RAGHUPATHI, N. AND SABITHA, D., 1994, Effect of barrier crops, mulching and yellow sticky traps in the management of yellow mosaic virus disease of soybean. In Crop Diseases - Innovative Techniques and Management. Eds. Sivaprakasam, K. and Seetharaman, K., Kalyani Publishers, New Delhi, pp.419-420.
RAJAKUMAR, N., 2001, Studies on mosaic disease of tomato (Lycopersicon esculentum Mill.) M.Sc. Thesis, University of Agricultural Sciences, Dharwad.
RAJE, R.S. AND RAO, S.K., 2002, Screening of mungbean (Vigna radiata L. Wilczek) germplasm for yellow mosaic virus, cercospora leaf spot and powdery mildew. Legume Research, 25(2): 99-104.
RATHI, Y.P.S., AND NENE, Y.L., 1974a, Some aspects of relationship between mungbean yellow mosaic virus and it’s vector, Bemisia tabaci. Indian Phytopathology, 27: 459-462.
RATHI, Y.P.S. AND NENE, Y.L., 1974b, Sex of Bemisia tabaci Genn. in relation to the transmission of mungbean yellow mosaic virus. Acta Botanica Indica, 2: 74-76.
RATHI, Y.P.S. AND NENE, Y.L., 1976, Influence of different host combinations on virus vector relation to mungbean yellow mosaic virus. Pantnagar Journal of Research, 1: 107-111.
RAVINDRABABU, R., 1987, Studies on mung bean yellow mosaic virus disease. Ph.D. Thesis, Tamil Nadu Agricultural University, Coimbatore.
SASTRY, K.S.M. AND SINGH, S.J., 1973, Field evaluation of insecticides for the control of whitefly (Bemisia tabaci) in relation to the incidence of yellow vein mosaic of okra (Abelmoschus esculentus). Indian Phytopathology, 26(1): 129-138.
SASTRY, K.S.M. AND SINGH, S.J., 1974, Effect of yellow vein mosaic virus infection on growth and yield of okra crop. Indian Phytopathology, 27: 294-297.
SENGUTTUVAN, K., KUTTALAM, S., MANOHARAN, T. AND SRINIVASAN, T., 2005, Bioefficacy of Melia dubia Cav. and neem products against major insect pests of tomato. Pestology, 29(1): 47-49.
SIDDIQUI, K.H., TRIMOHAN, RANA, V.K.S. AND LAL, S.K., 1999, Location of sources of resistance amongst soybean genotypes to yellow mosaic virus disease due to whitefly, Bemisia tabaci Genn. under natural conditions. Shashpa, 6(1): 37-40.
SINGH, B.R., CHANDRA S., RAM, S., 2000, Evaluation of mungbean varieties against yellow mosaic virus. Annals of Plant Protection Sciences, 8(2): 233-280.
SINGH, G., SINGH, K., GILL, A.S. AND CHHABRA, K.S., 1980, National Seminar on Disease Resistance in Crop Plants. Tamil Nadu Agricultural University, Coimbatore, 22 and 23 December, 1980.
SINGH, H., SANDHU, G.S. AND MAVI, G.S., 1971, Control of yellow mosaic virus in soybean Glycine max (L.) Merrill by the use of granular insecticides. Indian Journal of Entomology, 33: 272-278.
SINGH, J.P. AND VARMA, J.P., 1977, Mosaic disease of mung and urdbean in Haryana. Proceedings of National Academy of Sciences, India, 47: 33-40.
SINGH, J.P., KADIAN, O.P. AND VARMA, J.P., 1979, Survey of virus disease of mung bean and urd bean in Haryana. Haryana Agricultural University Journal of Research, 9(4): 345-347.
SINGH, S.J., 1985, Management of virus diseases of vegetable crops. In: Integrated Pest and Disease Management. Eds. Jayaraj S., Proceedings National Seminar, Tamil Nadu Agricultural University, Coimbatore, pp.193-201.
SINGH, R.A. AND GURHA, S.N., 1994, Influence of cropping seasons on the incidence of yellow mosaic disease in mungbean genotypes. Indian Journal of Pulses Research, 7(12): 206-208.
SINGH, V.P., CHHABRA, A. AND KHARB, R.P.S., 1988, Production and utilization of mungbean in India. In Proceedings of the Second International Symposium 16-20, November, 1987 Bangkok, Thailand, AVRDC, Shanhua, Tainan, p.588.
SOMASHEKARA, Y.M., NATESHAN, H.M. AND MUNIYAPPA, V., 1997, Evaluation of neem products and insecticides against whitefly (Bemisia tabaci), a vector of tomato leaf curl geminivirus disease. Indian Journal of Plant Protection, 25(1): 56-59.
SRIDHAR, K., 1986, Studies on cucumber mosaic virus infection on chillies (Capsicum annuum L.). M.Sc.(Agri.) Thesis, Tamil Nadu Agricultural University, Coimbatore, p.82.
SUDHAKAR RAO, A., PRASAD RAO, R.D.V.J. AND REDDY, P.S., 1980, Whitefly transmitted yellow mosaic disease of groundnut (Arachis hypogaea L.). Current Science, 49: 160.
SUTERI, B.D., 1974, Occurrence of soybean yellow mosaic in Uttar Pradesh. Current Science, 43: 689-690.
THONGMEEARKOM, P., HONDA, Y., SAITO, Y. AND SYAMANANDA, R., 1981, Nuclear ultra structural changes and aggregates of virus – like particles in mungbean cells affected by mungbean yellow mosaic disease. Phytopathology, 71(1): 41-44.
UTHAMASAMY, S., 1989, Whitefly - the emerging pest. In: State Level Plant Protection Workers Project, May 2-3, CPPS, Tamil Nadu Agricultural University, Coimbatore, pp.62-63.
VARMA, P.M., 1963, Transmission of plant viruses by whiteflies. Bulletin of National Institute of Science, India, 24: 11-23.
VERMA, A. AND VERMA, H.N., 1993, Management of viral diseases of mungbean by Clerodendrum leaf extract. Indian Journal of Plant Pathology, 11(1&2): 63-65.
VERMA, H.N. AND VARSHA, 1995, Induction of systemic resistance by leaf extract of Clerodendrum aculeatum in sunnhemp against sunnhemp rosette virus. Indian Phytopathology, 48(2): 218-221.
VERMA, H.N., SRIVASTAVA, S., VARSHA AND KUMAR, D., 1996, Induction of systemic resistance in plants against viruses by a basic protein from Clerodendrum aculeatum leaves. Phytopathology, 86: 485-492.
VINCENT, J.M., 1927, Distortion of fungal hyphae in the presence of certain inhibitors. Nature, 159: 850.

WALUNJ, A.R. AND MOTE, U.N., 1995, Evaluation of imidacloprid against thrips and whitefly on tomato. Pestology, 19(11): 21-23.
STUDIES ON MUNGBEAN YELLOW MOSAIC VIRUS
DISEASE ON GREENGRAM
SHAIK ABDUL SALAM 2005 Dr. M. S. PATIL
MAJOR ADVISOR
ABSTRACT
Mungbean is one of the inexpensive sources of vegetable dietary protein in India. It is known to be affected by several pests and diseases. However, among those, mungbean yellow mosaic virus (MYMV) is most destructive and has become a major limiting factor for mungbean cultivation. MYMV infection produced the symptoms like yellow mosaic, complete yellowing, puckering, stunting of flower stalk bearing few bleached and upturned pods with immature and misshaped seeds. The survey was undertaken in five northern districts of Karnataka viz., Dharwad, Gadag, Haveri, Gulbarga and Bidar. Gulbarga and Bidar districts recorded maximum incidence of 30.5 per cent whereas Gadag district recorded no disease incidence. The virus was readily transmissible by whiteflies and grafting but not by sap, seed or through dodder. The electron microscopic observation showed the presence of geminate particles in diseased samples of cv. Chinamung.
Epidemiological studies indicated significant and positive correlation between maximum temperature and both whitefly population and MYMV incidence and also between whitefly population and MYMV incidence. Among many management practices taken up, seed treatment with imidacloprid 70 WS (5 g/kg) followed by two sprays of imidacloprid 17.8 SL (0.24 ml/l) at 45 and 60 DAP or two sprays of imidacloprid (0.24 ml/l) alone at 45 and 60 DAP were found effective in controlling whiteflies and in reducing disease incidence. Screening under field conditions during rabi summer 2004, GG-89 and GG-39 were found immune among 101 genotypes and during rabi-summer 2005, TM-98-50, TM-97-55 and Co-5 were found resistant among 25 genotypes. The commonly cultivated variety Chinamung in Karnataka was found highly susceptible to MYMV.


![Dasheen Mosaic Virus (taro disease) [typescript]](https://img.pdfslide.us/doc/110x75/568c0d0f1a28ab955a8b4862/dasheen-mosaic-virus-taro-disease-typescript.jpg)