Embed Size (px)
Citation preview
Suffolk changes in the Index of Multiple Deprivation from 2010 to 2015 Knowledge & Intelligence Team Public Health & Protection Suffolk County Council
V1.0
2
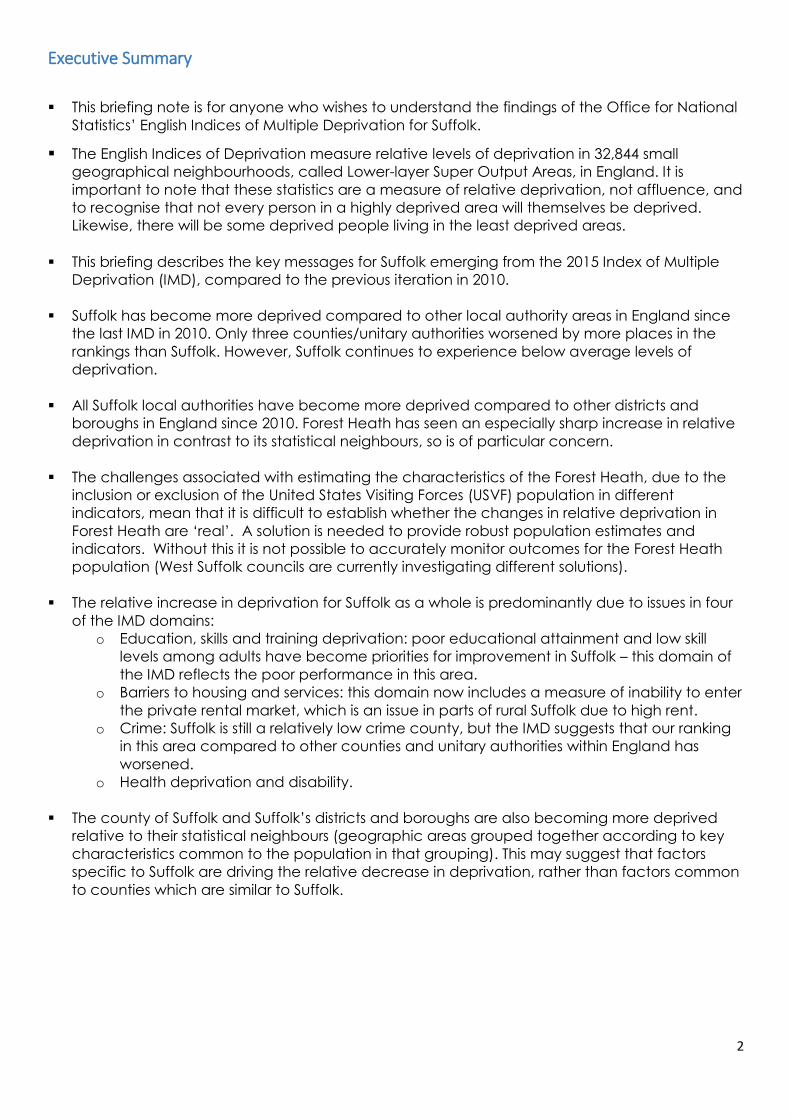
Executive Summary
This briefing note is for anyone who wishes to understand the findings of the Office for National
Statistics’ English Indices of Multiple Deprivation for Suffolk.
The English Indices of Deprivation measure relative levels of deprivation in 32,844 small
geographical neighbourhoods, called Lower-layer Super Output Areas, in England. It is
important to note that these statistics are a measure of relative deprivation, not affluence, and
to recognise that not every person in a highly deprived area will themselves be deprived.
Likewise, there will be some deprived people living in the least deprived areas.
This briefing describes the key messages for Suffolk emerging from the 2015 Index of Multiple
Deprivation (IMD), compared to the previous iteration in 2010.
Suffolk has become more deprived compared to other local authority areas in England since
the last IMD in 2010. Only three counties/unitary authorities worsened by more places in the
rankings than Suffolk. However, Suffolk continues to experience below average levels of
deprivation.
All Suffolk local authorities have become more deprived compared to other districts and
boroughs in England since 2010. Forest Heath has seen an especially sharp increase in relative
deprivation in contrast to its statistical neighbours, so is of particular concern.
The challenges associated with estimating the characteristics of the Forest Heath, due to the
inclusion or exclusion of the United States Visiting Forces (USVF) population in different
indicators, mean that it is difficult to establish whether the changes in relative deprivation in
Forest Heath are ‘real’. A solution is needed to provide robust population estimates and
indicators. Without this it is not possible to accurately monitor outcomes for the Forest Heath
population (West Suffolk councils are currently investigating different solutions).
The relative increase in deprivation for Suffolk as a whole is predominantly due to issues in four
of the IMD domains:
o Education, skills and training deprivation: poor educational attainment and low skill
levels among adults have become priorities for improvement in Suffolk – this domain of
the IMD reflects the poor performance in this area.
o Barriers to housing and services: this domain now includes a measure of inability to enter
the private rental market, which is an issue in parts of rural Suffolk due to high rent.
o Crime: Suffolk is still a relatively low crime county, but the IMD suggests that our ranking
in this area compared to other counties and unitary authorities within England has
worsened.
o Health deprivation and disability.
The county of Suffolk and Suffolk’s districts and boroughs are also becoming more deprived
relative to their statistical neighbours (geographic areas grouped together according to key
characteristics common to the population in that grouping). This may suggest that factors
specific to Suffolk are driving the relative decrease in deprivation, rather than factors common
to counties which are similar to Suffolk.

3
Introduction The Index of Multiple Deprivation (IMD) 2015 was published by the Department for Communities
and Local Government on 30 September 2015. Previous comparable iterations of the indices were
published in 2004, 2007 and 2010.
The IMD provides a way of comparing relative deprivation across the country using a set of
measures of deprivation for 32,844 small areas (Lower-layer Super Output Areas, or LSOAs) across
England. There are 37 separate measures organised within seven domains of deprivation using
appropriate weights (see table below) to produce a score for each LSOA.
Table 1: Domain weights for the IMD
Domain Domain weight (%)
Income Deprivation 22.5
Employment Deprivation 22.5
Health Deprivation and Disability 13.5
Education, Skills and Training Deprivation 13.5
Barriers to Housing and Services 9.3
Crime 9.3
Living Environment Deprivation 9.3
Source: 1
The score is an absolute measure of deprivation, and allows the 32,844 LSOAs in England to be
ranked relative to one another. The higher the deprivation score, the lower the rank. Hence, the
area ranked number 1 has the highest deprivation score and is the most deprived area. Scores
can then be aggregated to provide the basis for comparative analysis of larger areas such as
districts and boroughs and counties.
For the purposes of this report, ranks for upper-tier local authorities (counties and unitary
authorities) and lower-tier local authorities (districts and boroughs) for the 2010 and 2015 indices
have been produced to allow analysis of the changes between the iterations of the IMD at these
geographical levels.
However, the Index of Multiple Deprivation must be treated with extreme caution for Forest Heath.
This is due to difficulties with measuring the impact of US Visiting Forces and their families (who
make up around 18% of the population).
The IMD methodology does not allow for sub-populations such as USVF to be excluded when
calculating individual scores relating to issues that only affect the non-USVF population. For
example, while 2,500 US children are educated in schools on the US military bases in Forest Heath,
they are still included in the denominator for calculating indicators relating to the UK school
system. Similarly, while USVF spouses and dependents do not have recourse to benefits such as
income support, the denominator for income-related indicators still includes USVF. In general
terms, the inclusion of USVF will mean that Forest Heath appears less deprived in the IMD than it is
in reality.
Due to these problems with population estimates and the calculation of indices in Forest Heath it is
difficult to establish whether the changes in relative deprivation are real or an artefact. A solution
is needed to provide robust population estimates. Without this it is not possible to accurately
monitor outcomes for the Forest Heath population, and this could, in turn, have a modest knock
on effect on Suffolk as a whole. West Suffolk councils are currently investigating different
approaches which may provide a clearer picture for Forest Heath, including recalculating
indicators to take out the impact of the USVF within certain domains, such as income and
employment.
4
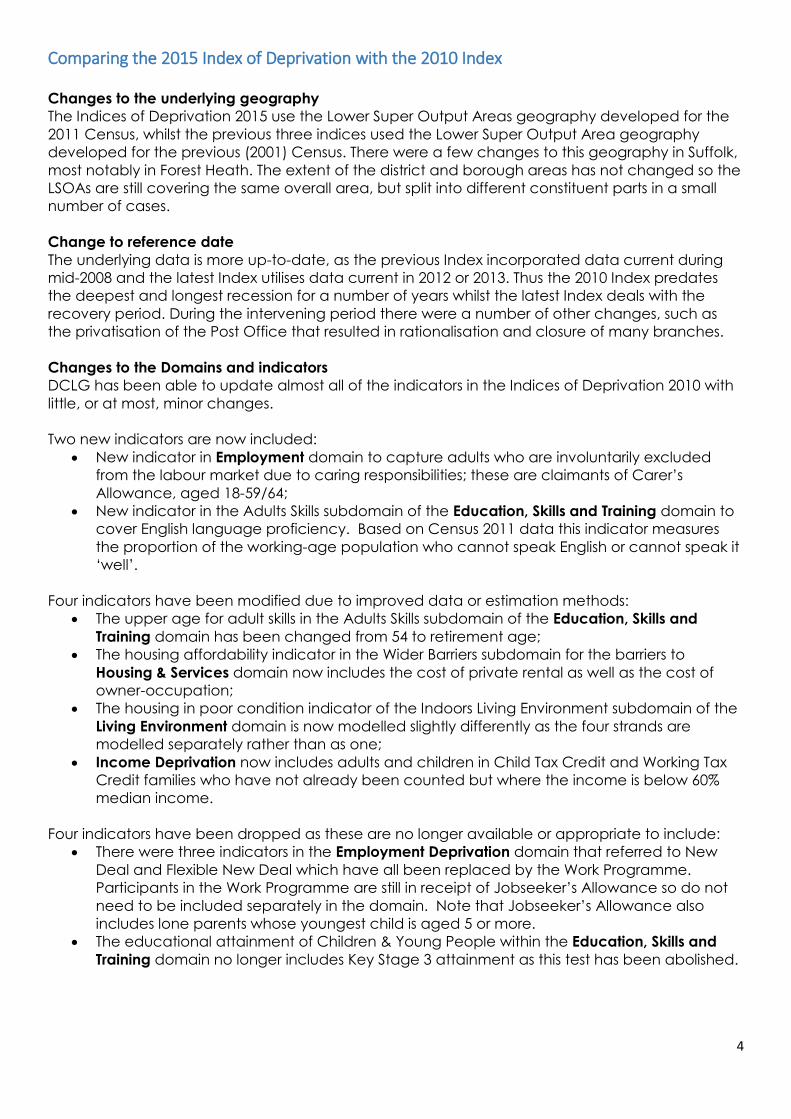
Comparing the 2015 Index of Deprivation with the 2010 Index
Changes to the underlying geography
The Indices of Deprivation 2015 use the Lower Super Output Areas geography developed for the
2011 Census, whilst the previous three indices used the Lower Super Output Area geography
developed for the previous (2001) Census. There were a few changes to this geography in Suffolk,
most notably in Forest Heath. The extent of the district and borough areas has not changed so the
LSOAs are still covering the same overall area, but split into different constituent parts in a small
number of cases.
Change to reference date
The underlying data is more up-to-date, as the previous Index incorporated data current during
mid-2008 and the latest Index utilises data current in 2012 or 2013. Thus the 2010 Index predates
the deepest and longest recession for a number of years whilst the latest Index deals with the
recovery period. During the intervening period there were a number of other changes, such as
the privatisation of the Post Office that resulted in rationalisation and closure of many branches.
Changes to the Domains and indicators
DCLG has been able to update almost all of the indicators in the Indices of Deprivation 2010 with
little, or at most, minor changes.
Two new indicators are now included:
New indicator in Employment domain to capture adults who are involuntarily excluded
from the labour market due to caring responsibilities; these are claimants of Carer’s
Allowance, aged 18-59/64;
New indicator in the Adults Skills subdomain of the Education, Skills and Training domain to
cover English language proficiency. Based on Census 2011 data this indicator measures
the proportion of the working-age population who cannot speak English or cannot speak it
‘well’.
Four indicators have been modified due to improved data or estimation methods:
The upper age for adult skills in the Adults Skills subdomain of the Education, Skills and
Training domain has been changed from 54 to retirement age;
The housing affordability indicator in the Wider Barriers subdomain for the barriers to
Housing & Services domain now includes the cost of private rental as well as the cost of
owner-occupation;
The housing in poor condition indicator of the Indoors Living Environment subdomain of the
Living Environment domain is now modelled slightly differently as the four strands are
modelled separately rather than as one;
Income Deprivation now includes adults and children in Child Tax Credit and Working Tax
Credit families who have not already been counted but where the income is below 60%
median income.
Four indicators have been dropped as these are no longer available or appropriate to include:
There were three indicators in the Employment Deprivation domain that referred to New
Deal and Flexible New Deal which have all been replaced by the Work Programme.
Participants in the Work Programme are still in receipt of Jobseeker’s Allowance so do not
need to be included separately in the domain. Note that Jobseeker’s Allowance also
includes lone parents whose youngest child is aged 5 or more.
The educational attainment of Children & Young People within the Education, Skills and
Training domain no longer includes Key Stage 3 attainment as this test has been abolished.
5
There have been a number of other minor changes; for example the homelessness indicator uses
an average over three years rather than two; and the national targets on air quality refer to
particulate matter with a smaller diameter.
Weighting of the Indices
The weights are the same as were used for constructing the 2010 Index.
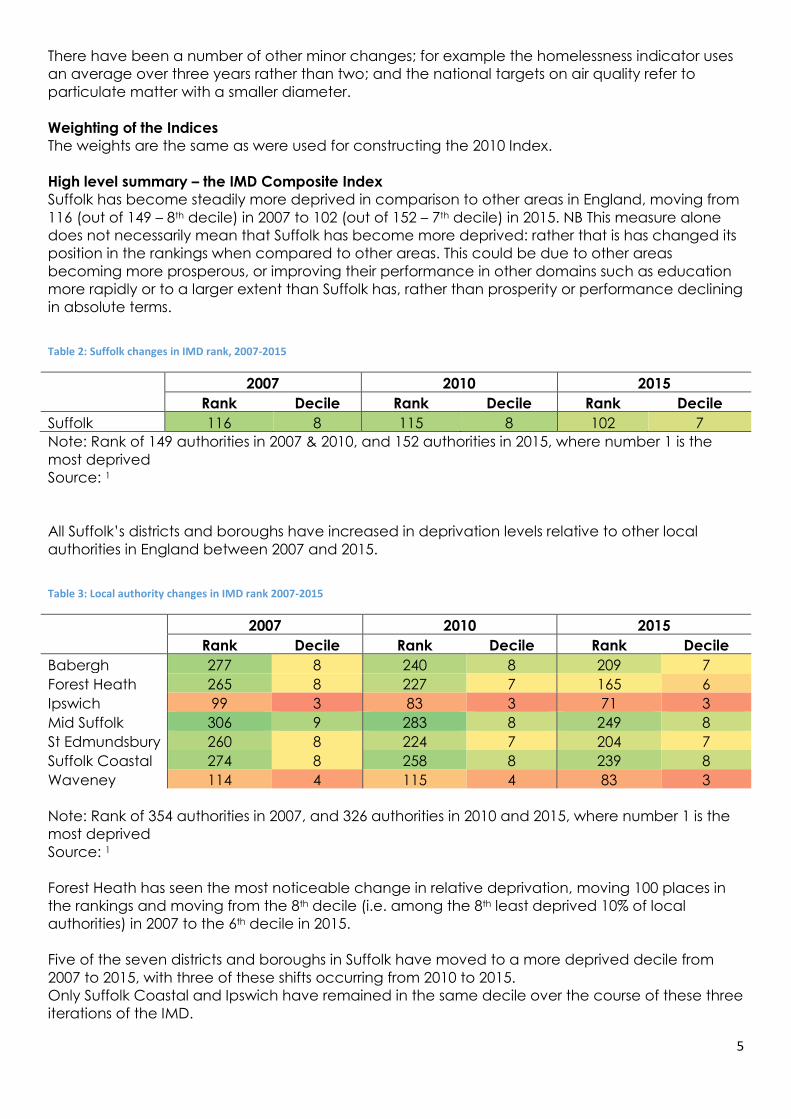
High level summary – the IMD Composite Index
Suffolk has become steadily more deprived in comparison to other areas in England, moving from
116 (out of 149 – 8th decile) in 2007 to 102 (out of 152 – 7th decile) in 2015. NB This measure alone
does not necessarily mean that Suffolk has become more deprived: rather that is has changed its
position in the rankings when compared to other areas. This could be due to other areas
becoming more prosperous, or improving their performance in other domains such as education
more rapidly or to a larger extent than Suffolk has, rather than prosperity or performance declining
in absolute terms.
Table 2: Suffolk changes in IMD rank, 2007-2015
2007 2010 2015
Rank Decile Rank Decile Rank Decile
Suffolk 116 8 115 8 102 7
Note: Rank of 149 authorities in 2007 & 2010, and 152 authorities in 2015, where number 1 is the
most deprived
Source: 1
All Suffolk’s districts and boroughs have increased in deprivation levels relative to other local
authorities in England between 2007 and 2015.
Table 3: Local authority changes in IMD rank 2007-2015
2007 2010 2015
Rank Decile Rank Decile Rank Decile
Babergh 277 8 240 8 209 7
Forest Heath 265 8 227 7 165 6
Ipswich 99 3 83 3 71 3
Mid Suffolk 306 9 283 8 249 8
St Edmundsbury 260 8 224 7 204 7
Suffolk Coastal 274 8 258 8 239 8
Waveney 114 4 115 4 83 3
Note: Rank of 354 authorities in 2007, and 326 authorities in 2010 and 2015, where number 1 is the
most deprived
Source: 1
Forest Heath has seen the most noticeable change in relative deprivation, moving 100 places in
the rankings and moving from the 8th decile (i.e. among the 8th least deprived 10% of local
authorities) in 2007 to the 6th decile in 2015.
Five of the seven districts and boroughs in Suffolk have moved to a more deprived decile from
2007 to 2015, with three of these shifts occurring from 2010 to 2015.
Only Suffolk Coastal and Ipswich have remained in the same decile over the course of these three
iterations of the IMD.
6
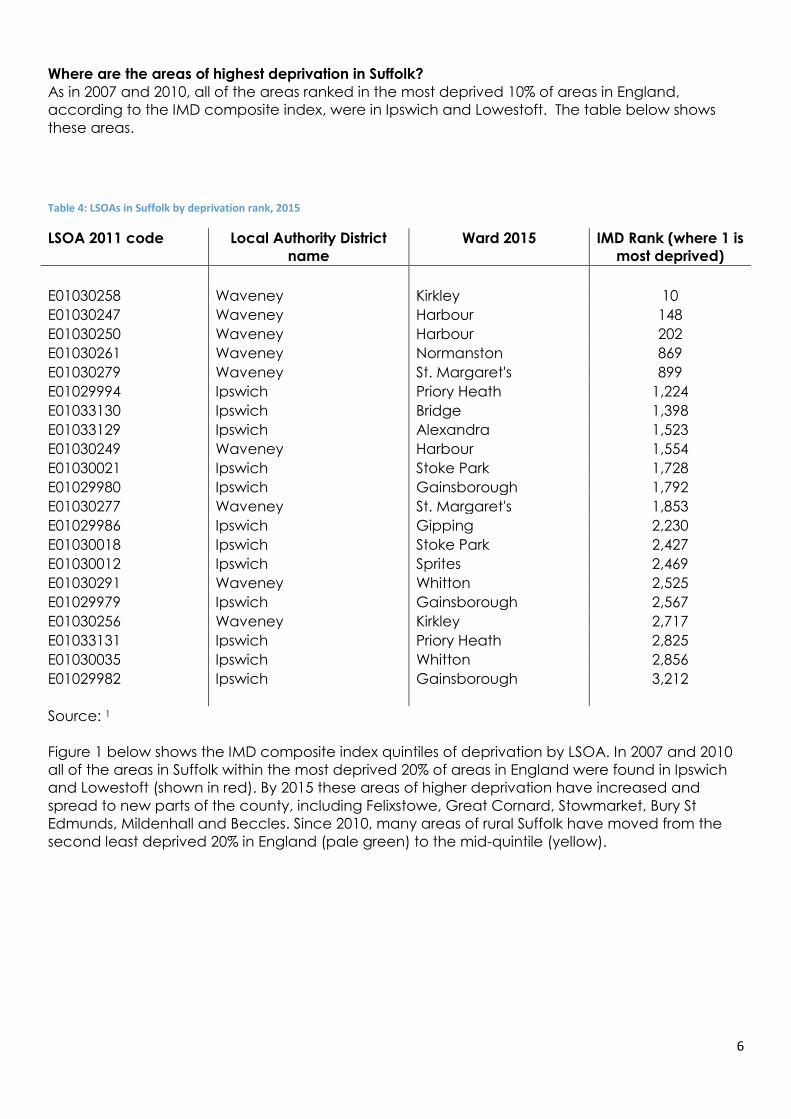
Where are the areas of highest deprivation in Suffolk?
As in 2007 and 2010, all of the areas ranked in the most deprived 10% of areas in England,
according to the IMD composite index, were in Ipswich and Lowestoft. The table below shows
these areas.
Table 4: LSOAs in Suffolk by deprivation rank, 2015
LSOA 2011 code Local Authority District
name
Ward 2015 IMD Rank (where 1 is
most deprived)
E01030258 Waveney Kirkley 10
E01030247 Waveney Harbour 148
E01030250 Waveney Harbour 202
E01030261 Waveney Normanston 869
E01030279 Waveney St. Margaret's 899
E01029994 Ipswich Priory Heath 1,224
E01033130 Ipswich Bridge 1,398
E01033129 Ipswich Alexandra 1,523
E01030249 Waveney Harbour 1,554
E01030021 Ipswich Stoke Park 1,728
E01029980 Ipswich Gainsborough 1,792
E01030277 Waveney St. Margaret's 1,853
E01029986 Ipswich Gipping 2,230
E01030018 Ipswich Stoke Park 2,427
E01030012 Ipswich Sprites 2,469
E01030291 Waveney Whitton 2,525
E01029979 Ipswich Gainsborough 2,567
E01030256 Waveney Kirkley 2,717
E01033131 Ipswich Priory Heath 2,825
E01030035 Ipswich Whitton 2,856
E01029982 Ipswich Gainsborough 3,212
Source: 1
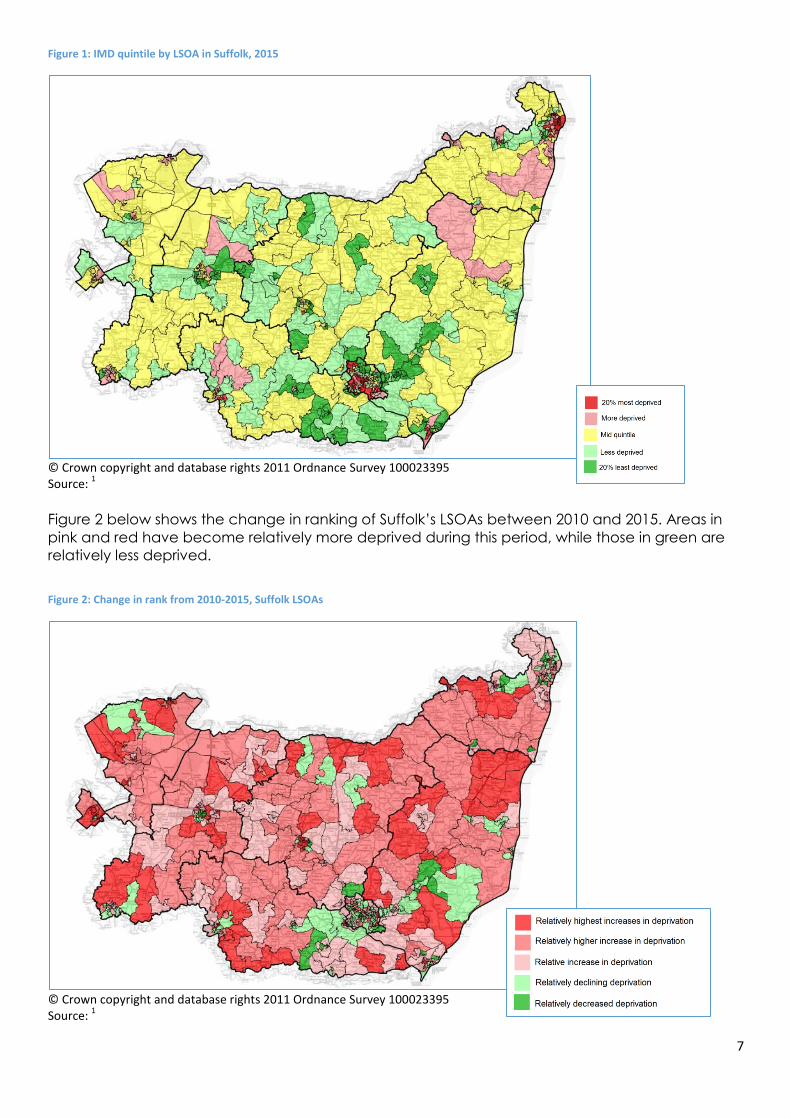
Figure 1 below shows the IMD composite index quintiles of deprivation by LSOA. In 2007 and 2010
all of the areas in Suffolk within the most deprived 20% of areas in England were found in Ipswich
and Lowestoft (shown in red). By 2015 these areas of higher deprivation have increased and
spread to new parts of the county, including Felixstowe, Great Cornard, Stowmarket, Bury St
Edmunds, Mildenhall and Beccles. Since 2010, many areas of rural Suffolk have moved from the
second least deprived 20% in England (pale green) to the mid-quintile (yellow).
7
Figure 1: IMD quintile by LSOA in Suffolk, 2015
© Crown copyright and database rights 2011 Ordnance Survey 100023395 Source:
1
Figure 2 below shows the change in ranking of Suffolk’s LSOAs between 2010 and 2015. Areas in
pink and red have become relatively more deprived during this period, while those in green are
relatively less deprived.
Figure 2: Change in rank from 2010-2015, Suffolk LSOAs
© Crown copyright and database rights 2011 Ordnance Survey 100023395 Source:
1
8
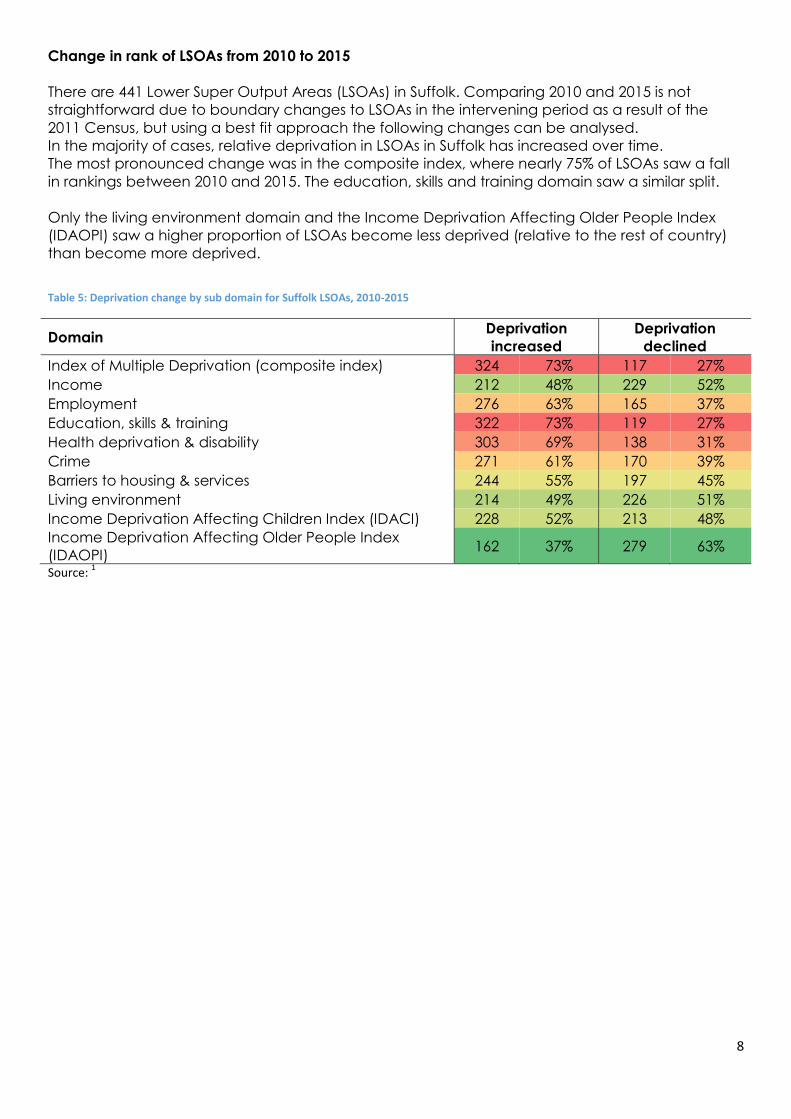
Change in rank of LSOAs from 2010 to 2015
There are 441 Lower Super Output Areas (LSOAs) in Suffolk. Comparing 2010 and 2015 is not
straightforward due to boundary changes to LSOAs in the intervening period as a result of the
2011 Census, but using a best fit approach the following changes can be analysed.
In the majority of cases, relative deprivation in LSOAs in Suffolk has increased over time.
The most pronounced change was in the composite index, where nearly 75% of LSOAs saw a fall
in rankings between 2010 and 2015. The education, skills and training domain saw a similar split.
Only the living environment domain and the Income Deprivation Affecting Older People Index
(IDAOPI) saw a higher proportion of LSOAs become less deprived (relative to the rest of country)
than become more deprived.
Table 5: Deprivation change by sub domain for Suffolk LSOAs, 2010-2015
Domain Deprivation
increased
Deprivation
declined
Index of Multiple Deprivation (composite index) 324 73% 117 27%
Income 212 48% 229 52%
Employment 276 63% 165 37%
Education, skills & training 322 73% 119 27%
Health deprivation & disability 303 69% 138 31%
Crime 271 61% 170 39%
Barriers to housing & services 244 55% 197 45%
Living environment 214 49% 226 51%
Income Deprivation Affecting Children Index (IDACI) 228 52% 213 48%
Income Deprivation Affecting Older People Index
(IDAOPI) 162 37% 279 63%
Source: 1
9
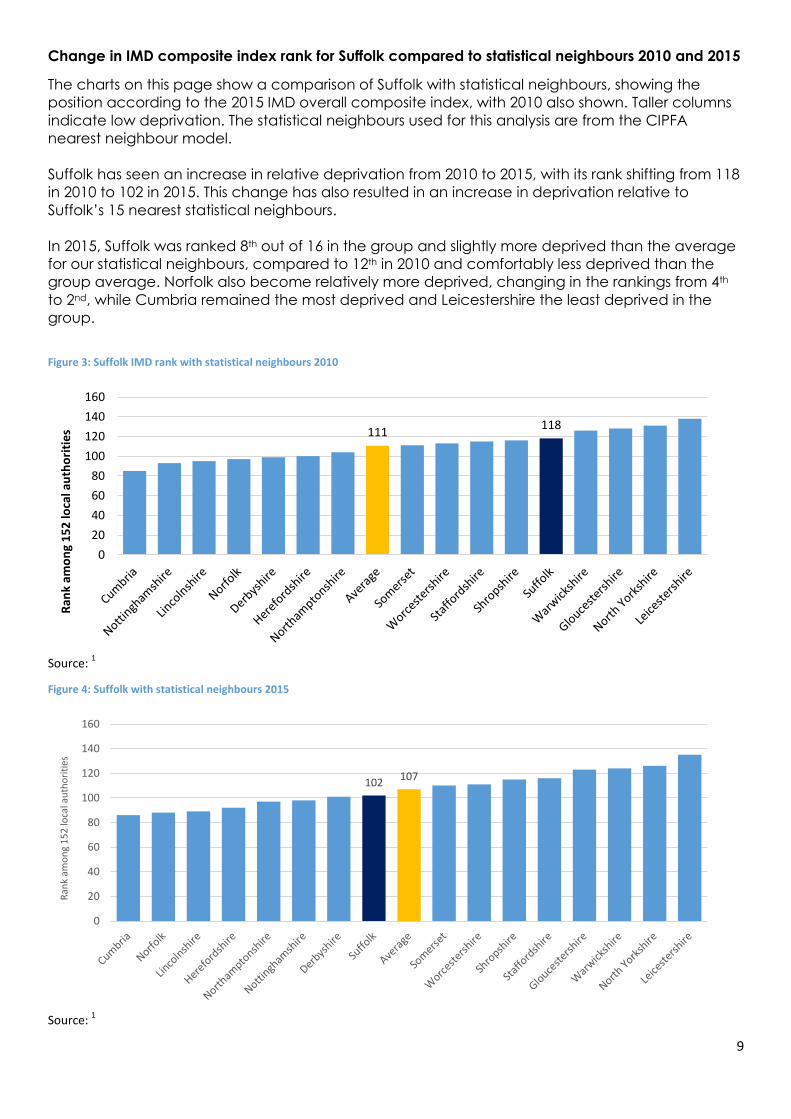
Change in IMD composite index rank for Suffolk compared to statistical neighbours 2010 and 2015
The charts on this page show a comparison of Suffolk with statistical neighbours, showing the
position according to the 2015 IMD overall composite index, with 2010 also shown. Taller columns
indicate low deprivation. The statistical neighbours used for this analysis are from the CIPFA
nearest neighbour model.
Suffolk has seen an increase in relative deprivation from 2010 to 2015, with its rank shifting from 118
in 2010 to 102 in 2015. This change has also resulted in an increase in deprivation relative to
Suffolk’s 15 nearest statistical neighbours.
In 2015, Suffolk was ranked 8th out of 16 in the group and slightly more deprived than the average
for our statistical neighbours, compared to 12th in 2010 and comfortably less deprived than the
group average. Norfolk also become relatively more deprived, changing in the rankings from 4th
to 2nd, while Cumbria remained the most deprived and Leicestershire the least deprived in the
group.
Figure 3: Suffolk IMD rank with statistical neighbours 2010
Source:
1
Figure 4: Suffolk with statistical neighbours 2015
Source:
1
111 118
0
20
40
60
80
100
120
140
160
Ran
k am
on
g 1
52
loca
l au
tho
riti
es
102 107
0
20
40
60
80
100
120
140
160
Ran
k am
on
g 1
52
loca
l au
tho
riti
es
10
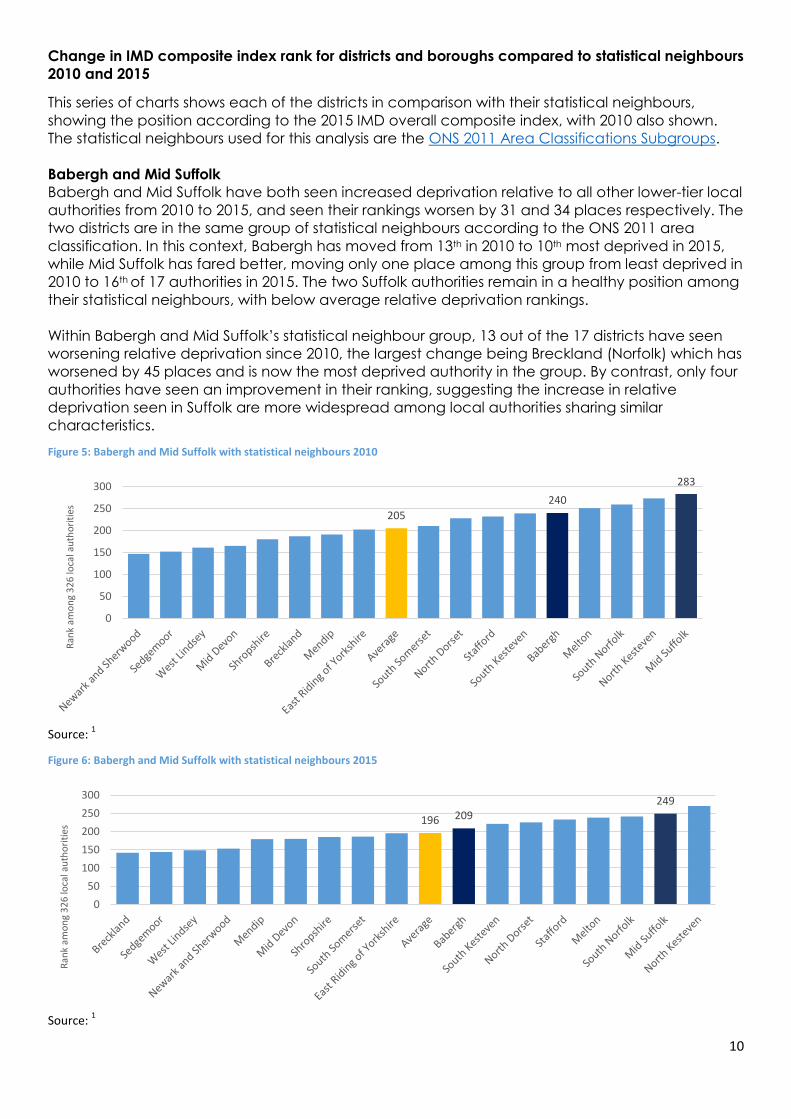
Change in IMD composite index rank for districts and boroughs compared to statistical neighbours
2010 and 2015
This series of charts shows each of the districts in comparison with their statistical neighbours,
showing the position according to the 2015 IMD overall composite index, with 2010 also shown.
The statistical neighbours used for this analysis are the ONS 2011 Area Classifications Subgroups.
Babergh and Mid Suffolk
Babergh and Mid Suffolk have both seen increased deprivation relative to all other lower-tier local
authorities from 2010 to 2015, and seen their rankings worsen by 31 and 34 places respectively. The
two districts are in the same group of statistical neighbours according to the ONS 2011 area
classification. In this context, Babergh has moved from 13th in 2010 to 10th most deprived in 2015,
while Mid Suffolk has fared better, moving only one place among this group from least deprived in
2010 to 16th of 17 authorities in 2015. The two Suffolk authorities remain in a healthy position among
their statistical neighbours, with below average relative deprivation rankings.
Within Babergh and Mid Suffolk’s statistical neighbour group, 13 out of the 17 districts have seen
worsening relative deprivation since 2010, the largest change being Breckland (Norfolk) which has
worsened by 45 places and is now the most deprived authority in the group. By contrast, only four
authorities have seen an improvement in their ranking, suggesting the increase in relative
deprivation seen in Suffolk are more widespread among local authorities sharing similar
characteristics.
Figure 5: Babergh and Mid Suffolk with statistical neighbours 2010
Source:
1
Figure 6: Babergh and Mid Suffolk with statistical neighbours 2015
Source:
1
205
240
283
0
50
100
150
200
250
300
Ran
k am
on
g 3
26
loca
l au
tho
riti
es
196 209 249
0
50
100
150
200
250
300
Ran
k am
on
g 3
26
loca
l au
tho
riti
es
11
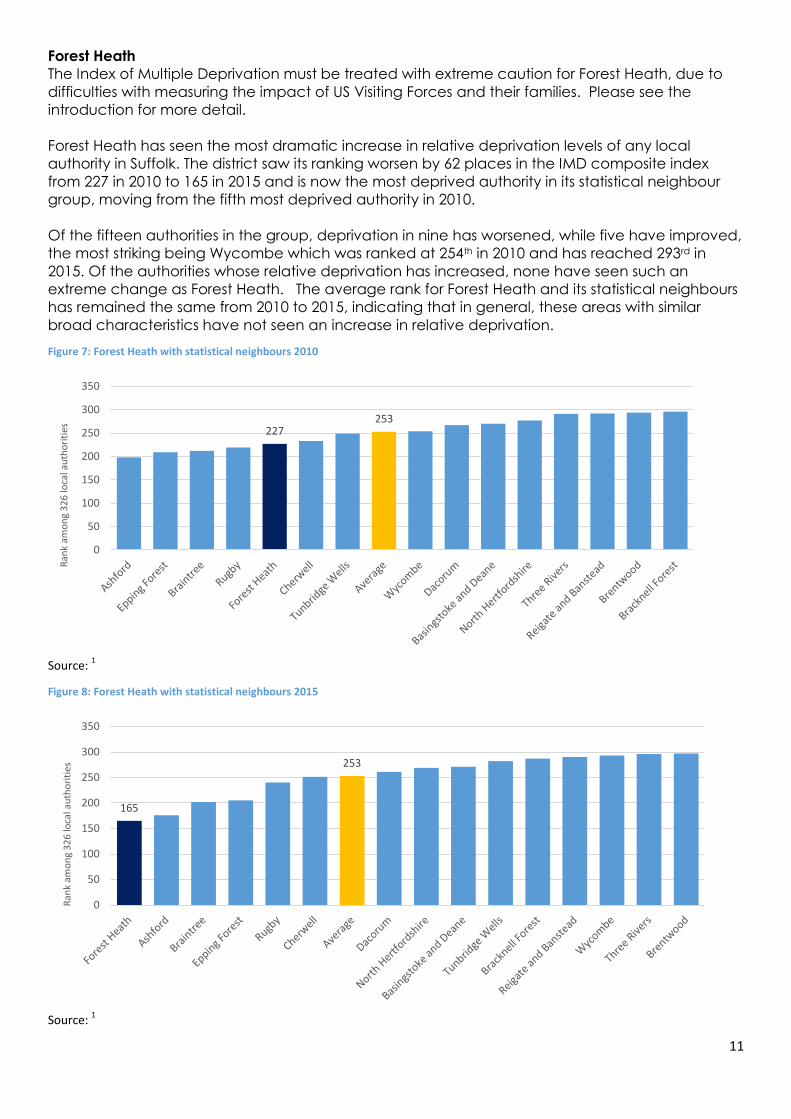
Forest Heath
The Index of Multiple Deprivation must be treated with extreme caution for Forest Heath, due to
difficulties with measuring the impact of US Visiting Forces and their families. Please see the
introduction for more detail.
Forest Heath has seen the most dramatic increase in relative deprivation levels of any local
authority in Suffolk. The district saw its ranking worsen by 62 places in the IMD composite index
from 227 in 2010 to 165 in 2015 and is now the most deprived authority in its statistical neighbour
group, moving from the fifth most deprived authority in 2010.
Of the fifteen authorities in the group, deprivation in nine has worsened, while five have improved,
the most striking being Wycombe which was ranked at 254th in 2010 and has reached 293rd in
2015. Of the authorities whose relative deprivation has increased, none have seen such an
extreme change as Forest Heath. The average rank for Forest Heath and its statistical neighbours
has remained the same from 2010 to 2015, indicating that in general, these areas with similar
broad characteristics have not seen an increase in relative deprivation.
Figure 7: Forest Heath with statistical neighbours 2010
Source:
1
Figure 8: Forest Heath with statistical neighbours 2015
Source:
1
227 253
0
50
100
150
200
250
300
350
Ran
k am
on
g 3
26
loca
l au
tho
riti
es
165
253
0
50
100
150
200
250
300
350
Ran
k am
on
g 3
26
loca
l au
tho
riti
es
12
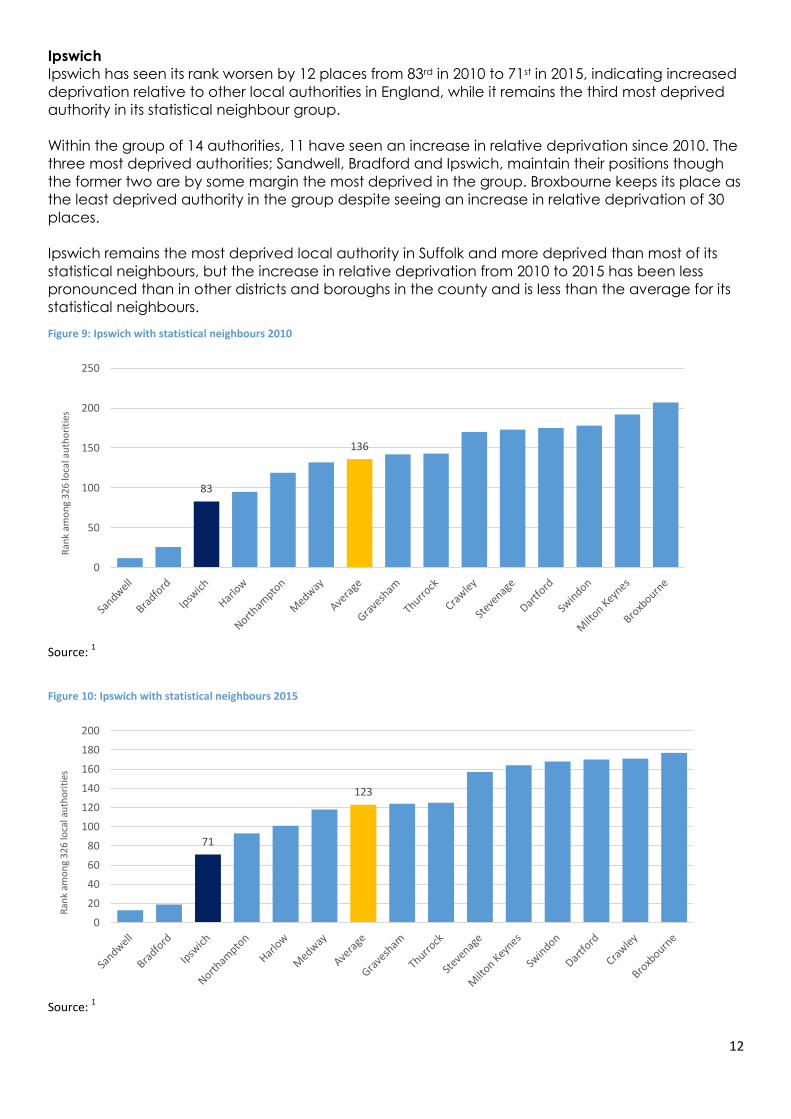
Ipswich
Ipswich has seen its rank worsen by 12 places from 83rd in 2010 to 71st in 2015, indicating increased
deprivation relative to other local authorities in England, while it remains the third most deprived
authority in its statistical neighbour group.
Within the group of 14 authorities, 11 have seen an increase in relative deprivation since 2010. The
three most deprived authorities; Sandwell, Bradford and Ipswich, maintain their positions though
the former two are by some margin the most deprived in the group. Broxbourne keeps its place as
the least deprived authority in the group despite seeing an increase in relative deprivation of 30
places.
Ipswich remains the most deprived local authority in Suffolk and more deprived than most of its
statistical neighbours, but the increase in relative deprivation from 2010 to 2015 has been less
pronounced than in other districts and boroughs in the county and is less than the average for its
statistical neighbours.
Figure 9: Ipswich with statistical neighbours 2010
Source:
1
Figure 10: Ipswich with statistical neighbours 2015
Source:
1
83
136
0
50
100
150
200
250
Ran
k am
on
g 3
26
loca
l au
tho
riti
es
71
123
0
20
40
60
80
100
120
140
160
180
200
Ran
k am
on
g 3
26
loca
l au
tho
riti
es
13
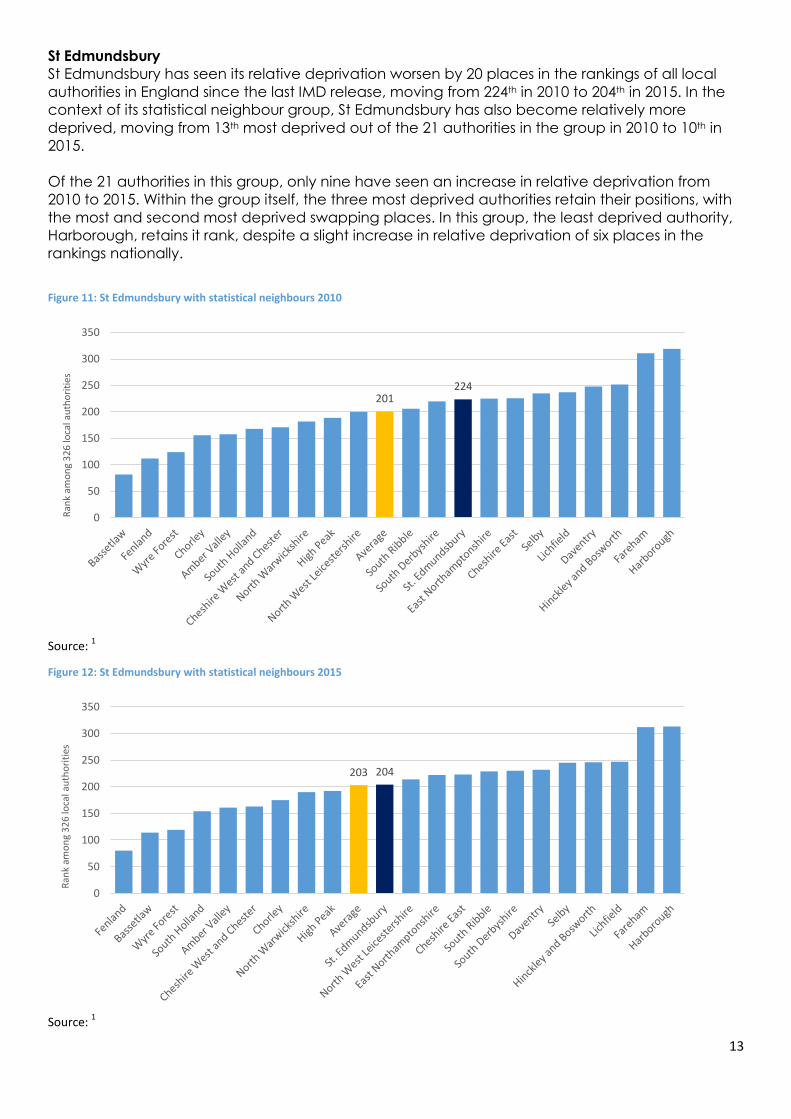
St Edmundsbury
St Edmundsbury has seen its relative deprivation worsen by 20 places in the rankings of all local
authorities in England since the last IMD release, moving from 224th in 2010 to 204th in 2015. In the
context of its statistical neighbour group, St Edmundsbury has also become relatively more
deprived, moving from 13th most deprived out of the 21 authorities in the group in 2010 to 10th in
2015.
Of the 21 authorities in this group, only nine have seen an increase in relative deprivation from
2010 to 2015. Within the group itself, the three most deprived authorities retain their positions, with
the most and second most deprived swapping places. In this group, the least deprived authority,
Harborough, retains it rank, despite a slight increase in relative deprivation of six places in the
rankings nationally.
Figure 11: St Edmundsbury with statistical neighbours 2010
Source:
1
Figure 12: St Edmundsbury with statistical neighbours 2015
Source:
1
201 224
0
50
100
150
200
250
300
350
Ran
k am
on
g 3
26
loca
l au
tho
riti
es
203 204
0
50
100
150
200
250
300
350
Ran
k am
on
g 3
26
loca
l au
tho
riti
es
14
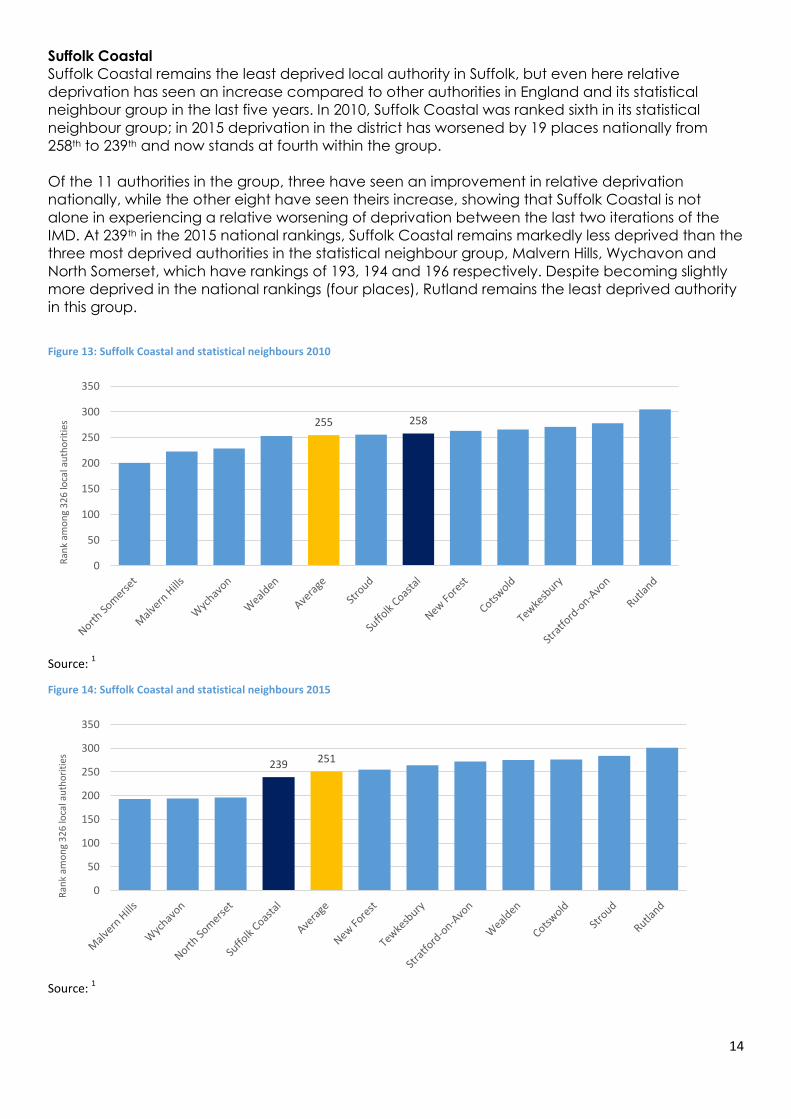
Suffolk Coastal
Suffolk Coastal remains the least deprived local authority in Suffolk, but even here relative
deprivation has seen an increase compared to other authorities in England and its statistical
neighbour group in the last five years. In 2010, Suffolk Coastal was ranked sixth in its statistical
neighbour group; in 2015 deprivation in the district has worsened by 19 places nationally from
258th to 239th and now stands at fourth within the group.
Of the 11 authorities in the group, three have seen an improvement in relative deprivation
nationally, while the other eight have seen theirs increase, showing that Suffolk Coastal is not
alone in experiencing a relative worsening of deprivation between the last two iterations of the
IMD. At 239th in the 2015 national rankings, Suffolk Coastal remains markedly less deprived than the
three most deprived authorities in the statistical neighbour group, Malvern Hills, Wychavon and
North Somerset, which have rankings of 193, 194 and 196 respectively. Despite becoming slightly
more deprived in the national rankings (four places), Rutland remains the least deprived authority
in this group.
Figure 13: Suffolk Coastal and statistical neighbours 2010
Source:
1
Figure 14: Suffolk Coastal and statistical neighbours 2015
Source:
1
255 258
0
50
100
150
200
250
300
350
Ran
k am
on
g 3
26
loca
l au
tho
riti
es
239 251
0
50
100
150
200
250
300
350
Ran
k am
on
g 3
26
loca
l au
tho
riti
es
15
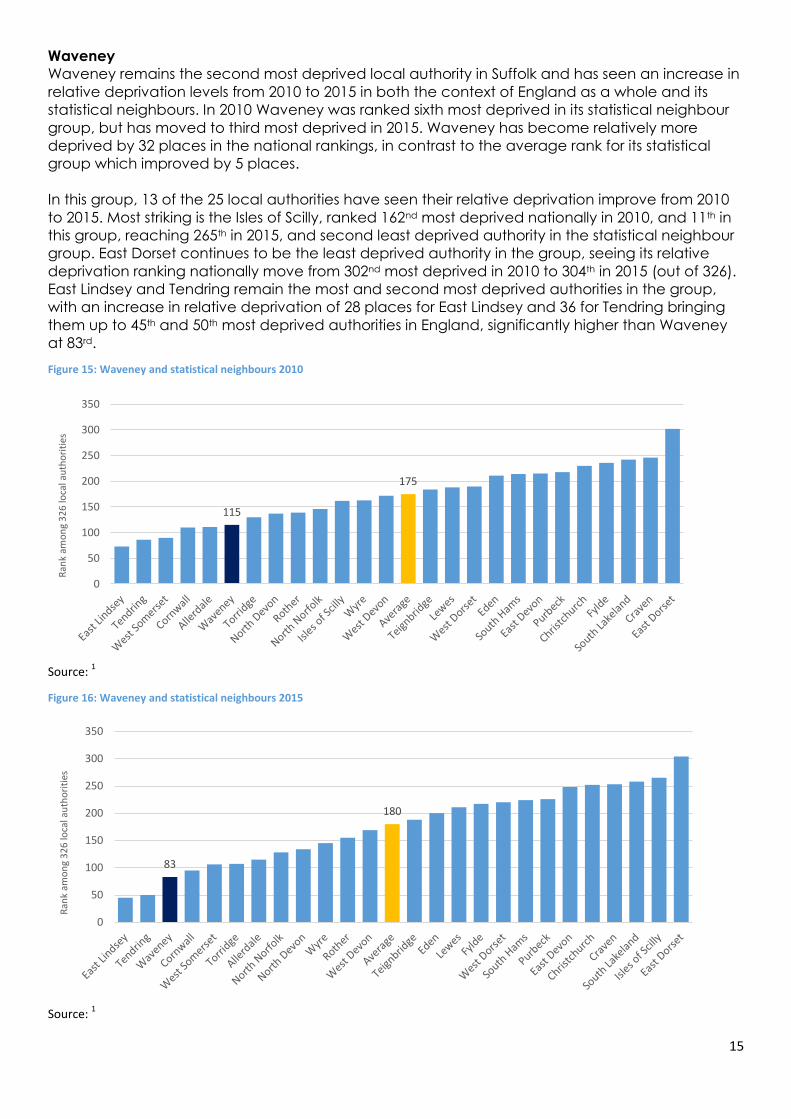
Waveney
Waveney remains the second most deprived local authority in Suffolk and has seen an increase in
relative deprivation levels from 2010 to 2015 in both the context of England as a whole and its
statistical neighbours. In 2010 Waveney was ranked sixth most deprived in its statistical neighbour
group, but has moved to third most deprived in 2015. Waveney has become relatively more
deprived by 32 places in the national rankings, in contrast to the average rank for its statistical
group which improved by 5 places.
In this group, 13 of the 25 local authorities have seen their relative deprivation improve from 2010
to 2015. Most striking is the Isles of Scilly, ranked 162nd most deprived nationally in 2010, and 11th in
this group, reaching 265th in 2015, and second least deprived authority in the statistical neighbour
group. East Dorset continues to be the least deprived authority in the group, seeing its relative
deprivation ranking nationally move from 302nd most deprived in 2010 to 304th in 2015 (out of 326).
East Lindsey and Tendring remain the most and second most deprived authorities in the group,
with an increase in relative deprivation of 28 places for East Lindsey and 36 for Tendring bringing
them up to 45th and 50th most deprived authorities in England, significantly higher than Waveney
at 83rd.
Figure 15: Waveney and statistical neighbours 2010
Source:
1
Figure 16: Waveney and statistical neighbours 2015
Source:
1
115
175
0
50
100
150
200
250
300
350
Ran
k am
on
g 3
26
loca
l au
tho
riti
es
83
180
0
50
100
150
200
250
300
350
Ran
k am
on
g 3
26
loca
l au
tho
riti
es
16
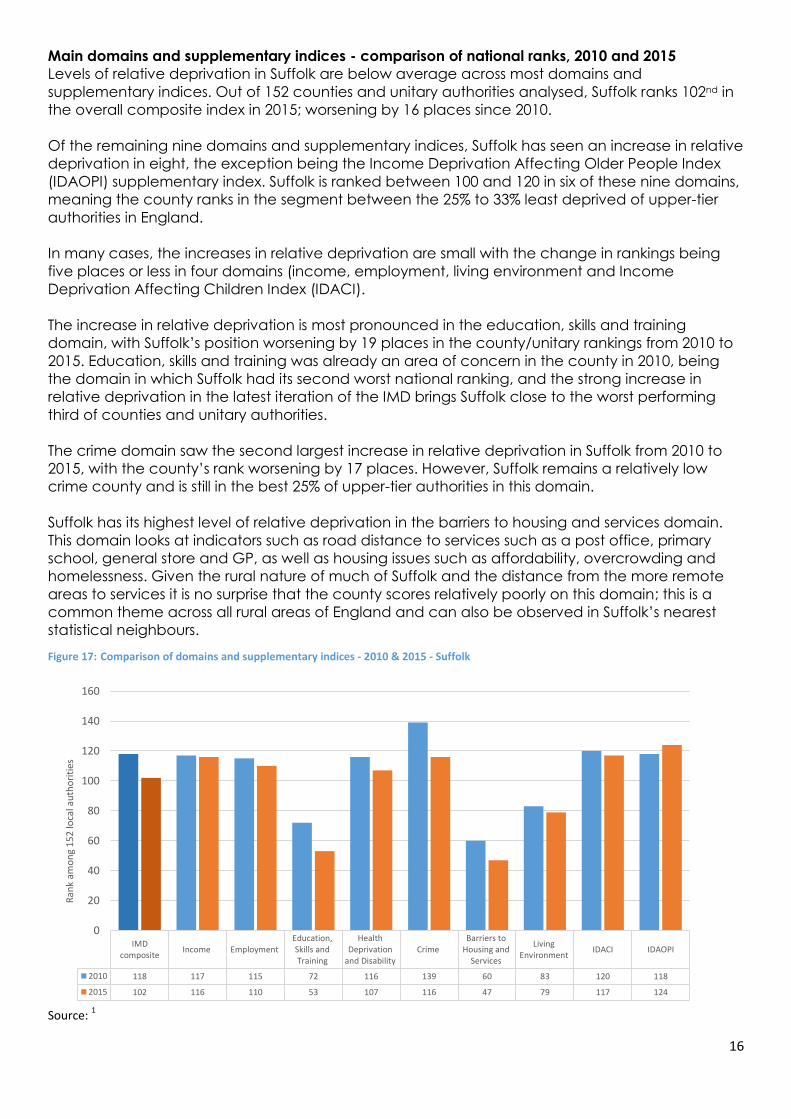
Main domains and supplementary indices - comparison of national ranks, 2010 and 2015
Levels of relative deprivation in Suffolk are below average across most domains and
supplementary indices. Out of 152 counties and unitary authorities analysed, Suffolk ranks 102nd in
the overall composite index in 2015; worsening by 16 places since 2010.
Of the remaining nine domains and supplementary indices, Suffolk has seen an increase in relative
deprivation in eight, the exception being the Income Deprivation Affecting Older People Index
(IDAOPI) supplementary index. Suffolk is ranked between 100 and 120 in six of these nine domains,
meaning the county ranks in the segment between the 25% to 33% least deprived of upper-tier
authorities in England.
In many cases, the increases in relative deprivation are small with the change in rankings being
five places or less in four domains (income, employment, living environment and Income
Deprivation Affecting Children Index (IDACI).
The increase in relative deprivation is most pronounced in the education, skills and training
domain, with Suffolk’s position worsening by 19 places in the county/unitary rankings from 2010 to
2015. Education, skills and training was already an area of concern in the county in 2010, being
the domain in which Suffolk had its second worst national ranking, and the strong increase in
relative deprivation in the latest iteration of the IMD brings Suffolk close to the worst performing
third of counties and unitary authorities.
The crime domain saw the second largest increase in relative deprivation in Suffolk from 2010 to
2015, with the county’s rank worsening by 17 places. However, Suffolk remains a relatively low
crime county and is still in the best 25% of upper-tier authorities in this domain.
Suffolk has its highest level of relative deprivation in the barriers to housing and services domain.
This domain looks at indicators such as road distance to services such as a post office, primary
school, general store and GP, as well as housing issues such as affordability, overcrowding and
homelessness. Given the rural nature of much of Suffolk and the distance from the more remote
areas to services it is no surprise that the county scores relatively poorly on this domain; this is a
common theme across all rural areas of England and can also be observed in Suffolk’s nearest
statistical neighbours.
Figure 17: Comparison of domains and supplementary indices - 2010 & 2015 - Suffolk
Source:
1
IMDcomposite
Income EmploymentEducation,Skills andTraining
HealthDeprivation
and DisabilityCrime
Barriers toHousing and
Services
LivingEnvironment
IDACI IDAOPI
2010 118 117 115 72 116 139 60 83 120 118
2015 102 116 110 53 107 116 47 79 117 124
0
20
40
60
80
100
120
140
160
Ran
k am
on
g 1
52
loca
l au
tho
riti
es
17
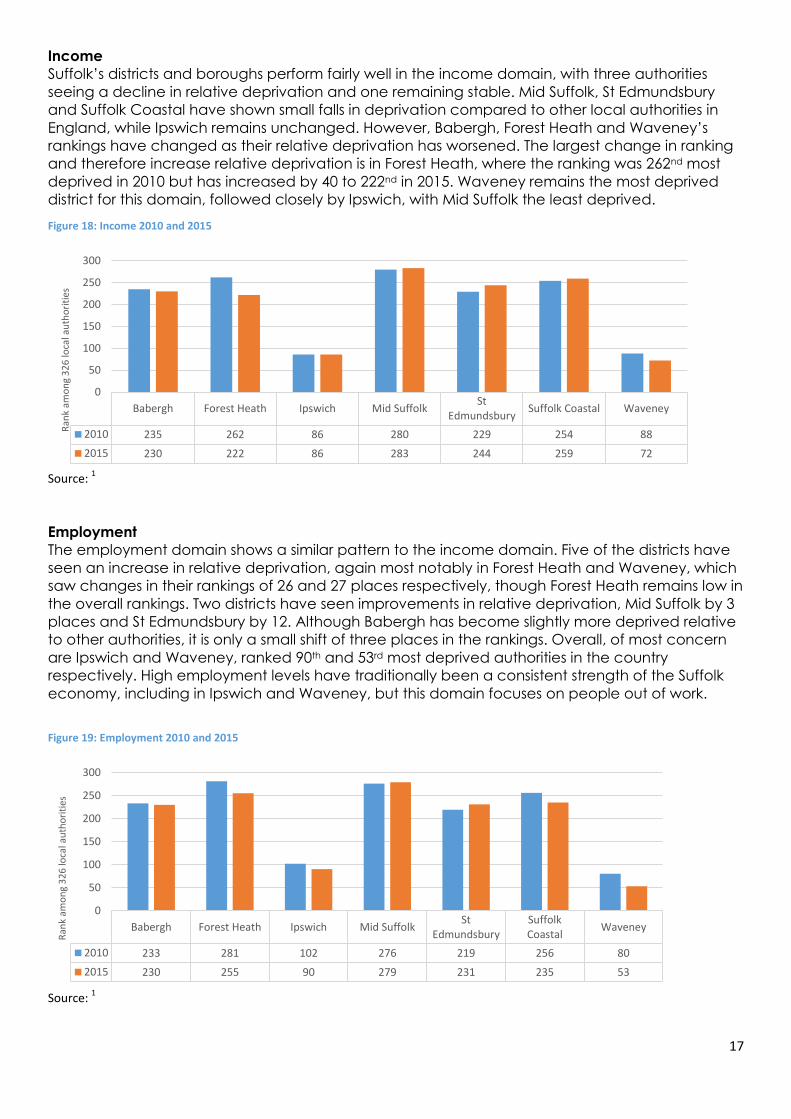
Income
Suffolk’s districts and boroughs perform fairly well in the income domain, with three authorities
seeing a decline in relative deprivation and one remaining stable. Mid Suffolk, St Edmundsbury
and Suffolk Coastal have shown small falls in deprivation compared to other local authorities in
England, while Ipswich remains unchanged. However, Babergh, Forest Heath and Waveney’s
rankings have changed as their relative deprivation has worsened. The largest change in ranking
and therefore increase relative deprivation is in Forest Heath, where the ranking was 262nd most
deprived in 2010 but has increased by 40 to 222nd in 2015. Waveney remains the most deprived
district for this domain, followed closely by Ipswich, with Mid Suffolk the least deprived.
Figure 18: Income 2010 and 2015
Source:
1
Employment
The employment domain shows a similar pattern to the income domain. Five of the districts have
seen an increase in relative deprivation, again most notably in Forest Heath and Waveney, which
saw changes in their rankings of 26 and 27 places respectively, though Forest Heath remains low in
the overall rankings. Two districts have seen improvements in relative deprivation, Mid Suffolk by 3
places and St Edmundsbury by 12. Although Babergh has become slightly more deprived relative
to other authorities, it is only a small shift of three places in the rankings. Overall, of most concern
are Ipswich and Waveney, ranked 90th and 53rd most deprived authorities in the country
respectively. High employment levels have traditionally been a consistent strength of the Suffolk
economy, including in Ipswich and Waveney, but this domain focuses on people out of work.
Figure 19: Employment 2010 and 2015
Source:
1
Babergh Forest Heath Ipswich Mid SuffolkSt
EdmundsburySuffolk Coastal Waveney
2010 235 262 86 280 229 254 88
2015 230 222 86 283 244 259 72
0
50
100
150
200
250
300
Ran
k am
on
g 3
26
loca
l au
tho
riti
es
Babergh Forest Heath Ipswich Mid SuffolkSt
EdmundsburySuffolkCoastal
Waveney
2010 233 281 102 276 219 256 80
2015 230 255 90 279 231 235 53
0
50
100
150
200
250
300
Ran
k am
on
g 3
26
loca
l au
tho
riti
es
18
The maps overleaf show the LSOA distribution of the income and employment domains by quintile
(20% bands of deprivation across England).
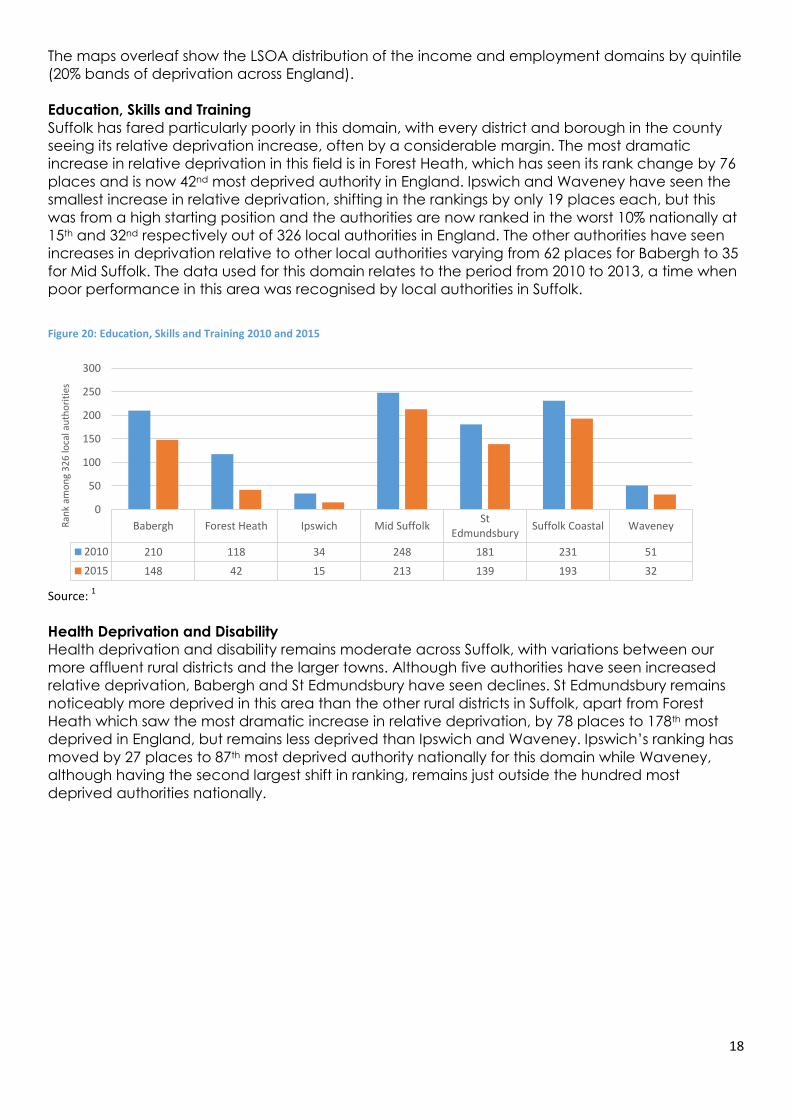
Education, Skills and Training
Suffolk has fared particularly poorly in this domain, with every district and borough in the county
seeing its relative deprivation increase, often by a considerable margin. The most dramatic
increase in relative deprivation in this field is in Forest Heath, which has seen its rank change by 76
places and is now 42nd most deprived authority in England. Ipswich and Waveney have seen the
smallest increase in relative deprivation, shifting in the rankings by only 19 places each, but this
was from a high starting position and the authorities are now ranked in the worst 10% nationally at
15th and 32nd respectively out of 326 local authorities in England. The other authorities have seen
increases in deprivation relative to other local authorities varying from 62 places for Babergh to 35
for Mid Suffolk. The data used for this domain relates to the period from 2010 to 2013, a time when
poor performance in this area was recognised by local authorities in Suffolk.
Figure 20: Education, Skills and Training 2010 and 2015
Source:
1
Health Deprivation and Disability
Health deprivation and disability remains moderate across Suffolk, with variations between our
more affluent rural districts and the larger towns. Although five authorities have seen increased
relative deprivation, Babergh and St Edmundsbury have seen declines. St Edmundsbury remains
noticeably more deprived in this area than the other rural districts in Suffolk, apart from Forest
Heath which saw the most dramatic increase in relative deprivation, by 78 places to 178th most
deprived in England, but remains less deprived than Ipswich and Waveney. Ipswich’s ranking has
moved by 27 places to 87th most deprived authority nationally for this domain while Waveney,
although having the second largest shift in ranking, remains just outside the hundred most
deprived authorities nationally.
Babergh Forest Heath Ipswich Mid SuffolkSt
EdmundsburySuffolk Coastal Waveney
2010 210 118 34 248 181 231 51
2015 148 42 15 213 139 193 32
0
50
100
150
200
250
300
Ran
k am
on
g 3
26
loca
l au
tho
riti
es

19
Figure 21: Health Deprivation and Disability 2010 and 2015
Source:
1
The maps overleaf show the LSOA distribution of the education, skills and training and health
deprivation and disability domains by quintile (20% bands of deprivation across England).
Crime
Suffolk is a relatively low-crime county, though relative to other local authorities across England
there has been an increase in deprivation from 2010 to 2015. Every local authority in Suffolk, with
the exception of Ipswich, has seen a move in ranking indicating an increase in relative deprivation
in the domain of crime. Ipswich has improved by 13 places to reach 70th nationally but is still the
most deprived authority within Suffolk. Forest Heath, Babergh and St Edmundsbury have seen the
largest increases in relative deprivation by 73, 73 and 69 places respectively; a considerable
change in five years, and Forest Heath now ranks as the second most deprived authority in Suffolk
in this domain. Although Mid Suffolk has seen its rank worsen by 11 places, it still has very low levels
of relative deprivation, at 305th most deprived out of 326 nationally.
Figure 22: Crime 2010 and 2015
Source:
1
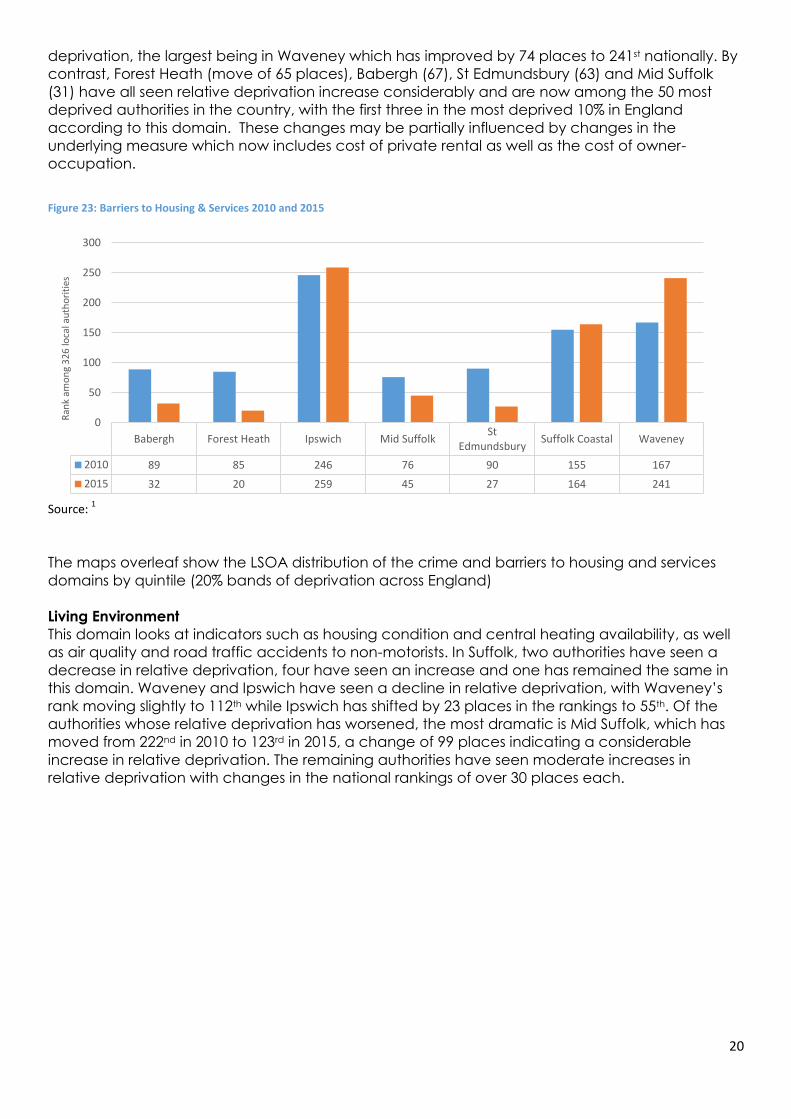
Barriers to Housing & Services
This domain sees the most variation in rankings between the local authorities in Suffolk and the
opposite picture to that seen in many of the other domains. The most deprived authority in Suffolk
is Forest Heath at 20th nationally while the least deprived is Ipswich at 259th. Since 2010, Ipswich,
Suffolk Coastal and Waveney have all seen changed rankings indicating improved relative
Babergh Forest Heath Ipswich Mid SuffolkSt
EdmundsburySuffolk Coastal Waveney
2010 244 256 114 310 194 265 160
2015 258 178 87 288 203 241 101
0
50
100
150
200
250
300
350
Ran
k am
on
g 3
26
loca
l au
tho
riti
es
Babergh Forest Heath Ipswich Mid SuffolkSt
EdmundsburySuffolk Coastal Waveney
2010 290 216 57 316 273 308 237
2015 207 143 70 305 204 280 191
0
50
100
150
200
250
300
350
Ran
k am
on
g 3
26
loca
l au
tho
riti
es
20
deprivation, the largest being in Waveney which has improved by 74 places to 241st nationally. By
contrast, Forest Heath (move of 65 places), Babergh (67), St Edmundsbury (63) and Mid Suffolk
(31) have all seen relative deprivation increase considerably and are now among the 50 most
deprived authorities in the country, with the first three in the most deprived 10% in England
according to this domain. These changes may be partially influenced by changes in the
underlying measure which now includes cost of private rental as well as the cost of owner-
occupation.
Figure 23: Barriers to Housing & Services 2010 and 2015
Source:
1
The maps overleaf show the LSOA distribution of the crime and barriers to housing and services
domains by quintile (20% bands of deprivation across England)
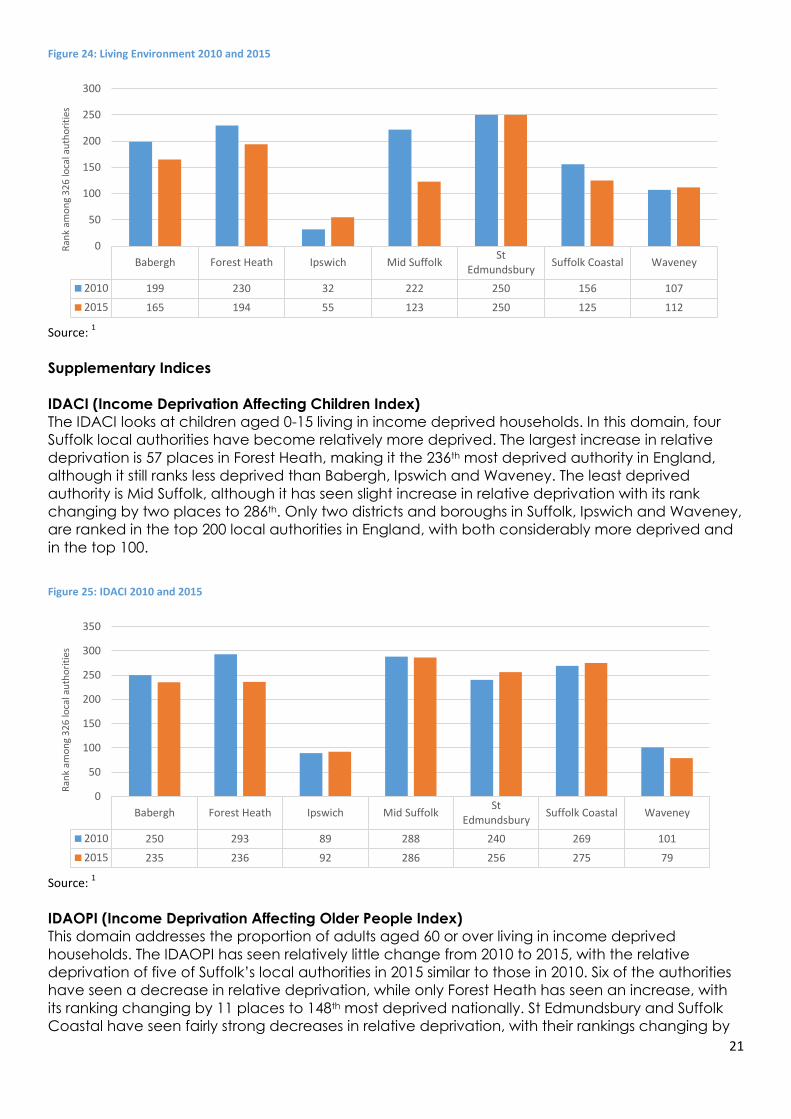
Living Environment
This domain looks at indicators such as housing condition and central heating availability, as well
as air quality and road traffic accidents to non-motorists. In Suffolk, two authorities have seen a
decrease in relative deprivation, four have seen an increase and one has remained the same in
this domain. Waveney and Ipswich have seen a decline in relative deprivation, with Waveney’s
rank moving slightly to 112th while Ipswich has shifted by 23 places in the rankings to 55th. Of the
authorities whose relative deprivation has worsened, the most dramatic is Mid Suffolk, which has
moved from 222nd in 2010 to 123rd in 2015, a change of 99 places indicating a considerable
increase in relative deprivation. The remaining authorities have seen moderate increases in
relative deprivation with changes in the national rankings of over 30 places each.
Babergh Forest Heath Ipswich Mid SuffolkSt
EdmundsburySuffolk Coastal Waveney
2010 89 85 246 76 90 155 167
2015 32 20 259 45 27 164 241
0
50
100
150
200
250
300
Ran
k am
on
g 3
26
loca
l au
tho
riti
es
21
Figure 24: Living Environment 2010 and 2015
Source:
1
Supplementary Indices
IDACI (Income Deprivation Affecting Children Index)
The IDACI looks at children aged 0-15 living in income deprived households. In this domain, four
Suffolk local authorities have become relatively more deprived. The largest increase in relative
deprivation is 57 places in Forest Heath, making it the 236th most deprived authority in England,
although it still ranks less deprived than Babergh, Ipswich and Waveney. The least deprived
authority is Mid Suffolk, although it has seen slight increase in relative deprivation with its rank
changing by two places to 286th. Only two districts and boroughs in Suffolk, Ipswich and Waveney,
are ranked in the top 200 local authorities in England, with both considerably more deprived and
in the top 100.
Figure 25: IDACI 2010 and 2015
Source:
1
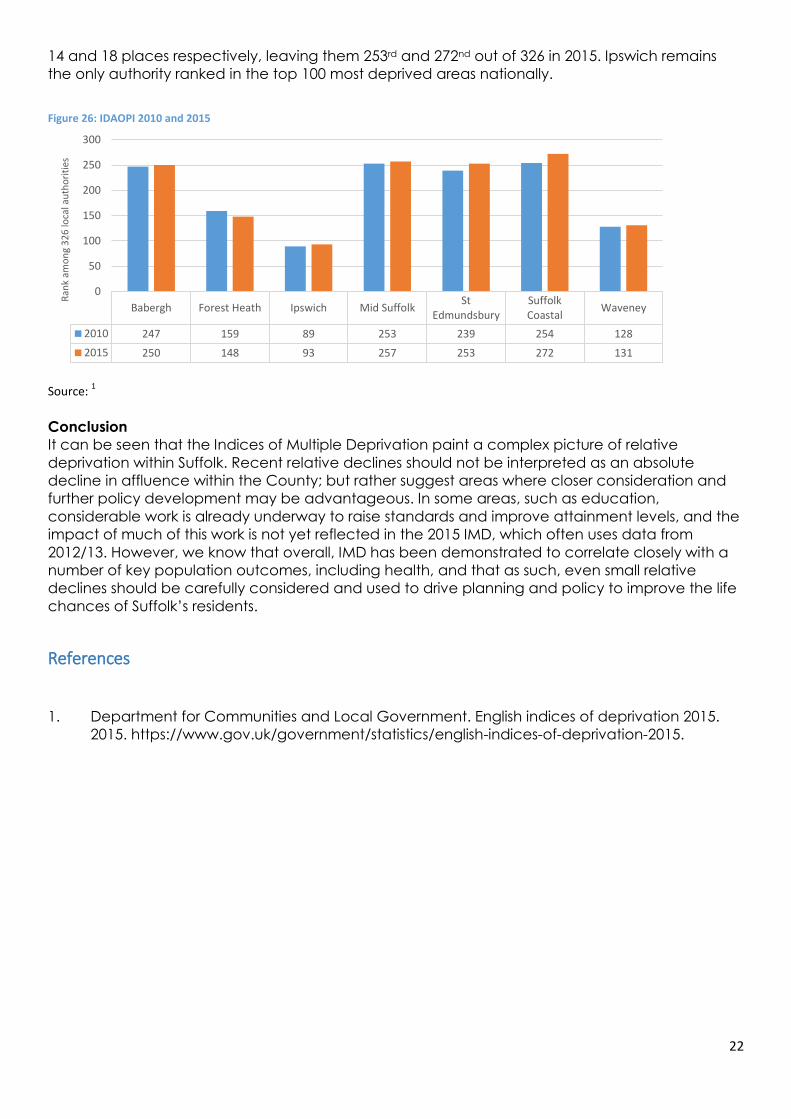
IDAOPI (Income Deprivation Affecting Older People Index)
This domain addresses the proportion of adults aged 60 or over living in income deprived
households. The IDAOPI has seen relatively little change from 2010 to 2015, with the relative
deprivation of five of Suffolk’s local authorities in 2015 similar to those in 2010. Six of the authorities
have seen a decrease in relative deprivation, while only Forest Heath has seen an increase, with
its ranking changing by 11 places to 148th most deprived nationally. St Edmundsbury and Suffolk
Coastal have seen fairly strong decreases in relative deprivation, with their rankings changing by
Babergh Forest Heath Ipswich Mid SuffolkSt
EdmundsburySuffolk Coastal Waveney
2010 199 230 32 222 250 156 107
2015 165 194 55 123 250 125 112
0
50
100
150
200
250
300
Ran
k am
on
g 3
26
loca
l au
tho
riti
es
Babergh Forest Heath Ipswich Mid SuffolkSt
EdmundsburySuffolk Coastal Waveney
2010 250 293 89 288 240 269 101
2015 235 236 92 286 256 275 79
0
50
100
150
200
250
300
350
Ran
k am
on
g 3
26
loca
l au
tho
riti
es
22
14 and 18 places respectively, leaving them 253rd and 272nd out of 326 in 2015. Ipswich remains
the only authority ranked in the top 100 most deprived areas nationally.
Figure 26: IDAOPI 2010 and 2015
Source: 1
Conclusion
It can be seen that the Indices of Multiple Deprivation paint a complex picture of relative
deprivation within Suffolk. Recent relative declines should not be interpreted as an absolute
decline in affluence within the County; but rather suggest areas where closer consideration and
further policy development may be advantageous. In some areas, such as education,
considerable work is already underway to raise standards and improve attainment levels, and the
impact of much of this work is not yet reflected in the 2015 IMD, which often uses data from
2012/13. However, we know that overall, IMD has been demonstrated to correlate closely with a
number of key population outcomes, including health, and that as such, even small relative
declines should be carefully considered and used to drive planning and policy to improve the life
chances of Suffolk’s residents.
References
1. Department for Communities and Local Government. English indices of deprivation 2015.
2015. https://www.gov.uk/government/statistics/english-indices-of-deprivation-2015.
Babergh Forest Heath Ipswich Mid SuffolkSt
EdmundsburySuffolkCoastal
Waveney
2010 247 159 89 253 239 254 128
2015 250 148 93 257 253 272 131
0
50
100
150
200
250
300
Ran
k am
on
g 3
26
loca
l au
tho
riti
es