Embed Size (px)
Citation preview
Summary Report of the 2015 Index of Multiple Deprivation
Introduction The Index of Multiple Deprivation (IMD) provides a relative measure of multiple deprivation
experienced by people living in an area and is calculated for every Lower layer Super Output
Area (LSOA)1, or neighbourhood, in England. Every such neighbourhood in England is ranked
according to its level of deprivation relative to that of other areas.
The 2015 update of the IMD2 was released in September 2015. This is the fourth release of
the index (2004, 2007, 2010 and 2015). In order to reflect the broad range of deprivation
that people can experience, the IMD is based on 37 separate indicators, organised across
seven distinct domains; income, employment, health and disability, education, skills and
training, barriers to housing and services, living environment and crime. A full breakdown of
all of the indicators is given in Appendix 1.
This report provides an overview of the findings of the English IMD 2015 in relation to
Barnet.
Executive Summary Barnet is amongst the 50% most deprived local authorities in England
Barnet is the 157th most deprived local authority in England, out of a total of 326 local
authorities. In 2010 Barnet ranked 176th which means that over these five years it has
become comparatively more deprived and is now amongst the 50% deprived local
authorities in England.
Although, it continues to compare favourably to other local authorities in London
Barnet is the 24th most deprived local authority in London. Despite a small increase in
comparative deprivation reduction since 2010 when Barnet was the 25th most deprived
local authority in, it continues to compare favourably against other local authorities in
London.
In Barnet the highest levels of deprivation continue to be in the west of the borough
As in 2010, areas in the west of the borough continue to exhibit the highest levels of
deprivation. These are especially concentrated in areas of Burnt Oak, Colindale, Child’s Hill
1 A Lower Super Output Area (LSOA) is a geography for the collection and publication of small area statistics.
They are used on the Neighbourhood Statistics site and across National Statistics. 2 https://www.gov.uk/government/statistics/english-indices-of-deprivation-2015
and West Hendon. By ward, the highest concentration of deprived LSOAs are located in
Burnt Oak, where 80% of LSOAs fall within the 30% most deprived LSOAs in England.
The most deprived LSOAs in the borough are located in around the West Hendon estate and
the Grahame Park estate in Colindale. Both of these LSOAs are amongst the 10% most
deprived LSOAs in England, and the top 5% most deprived LSOAs in London. These two
LSOAs have experienced the highest increases in comparative deprivation in Barnet since
2010.
The map of deprivation across Barnet closely follows this pattern to a greater or lesser
extent for the other specific domains of deprivation
The spatial pattern of total deprivation across Barnet is evident in most of the other
domains of deprivation, with areas towards the west of the borough displaying the highest
levels of deprivation. Although in some cases, the extent of the deprivation is more wide
scale, as is evident on the Barriers to Housing and Services domain and the Crime and
Disorder domain.
However there are other pockets of substantial deprivation across the borough
Despite the west of the borough displaying the highest levels of deprivation, pockets of
deprivation exist in other areas of the borough. Areas of Underhill, East Finchley,
Woodhouse, East Barnet, Brunswick Park, Coppetts and Mill Hill all have LSOAs that fall
within the 30% most deprived LSOAs in England. And since 2010, all LSOAs in East Barnet
and Underhill have become comparatively more deprived.
There has been some improvement over time for some areas in Barnet
Between 2010 and 2015 no wards experienced a reduction in deprivation across all LSOAs
within their boundary. However, more LSOAs in East Finchley, West Finchley, Totteridge and
Finchley Church End became less deprived than more deprived over this period.
In 2010 the Strawberry Vale estate in East Finchley was identified as the most deprived
LSOA in the borough. Despite remaining as one of 10% most deprived LSOAs in Barnet, it
now ranks as the 15th most deprived LSOA in the borough.
Barriers to Housing and Services, Crime and the Living Environment domains have the
highest levels of deprivation
The Barriers to Housing and Services domain contains the highest levels of deprivation in
Barnet, with 21% (45) of Barnet’s LSOAs in the 10% most deprived nationally and 72% (152)
of LSOAs in the 30% most deprived. Since 2010 an additional 53 Barnet LSOAs fall within the
30% most deprived nationally for this domain, the highest increase across all domains.
Across London many local authorities rate badly on this domain, with only four London
boroughs not in the 50% most deprived local authorities in England. It is likely that London
has high levels of deprivation in relation to this domain due to the comparatively high cost
of housing in the capital.
There is also a high level of deprivation on the Crime and Disorder domain, where Barnet is
the 49th most deprived nationally. Once again this appears to be a common occurrence
across the whole of London with only one borough not within the 50% most deprived
nationally for this domain.
Similarly, there appears to be a high level of deprivation across London within the Living
Environment domain with 85% of London boroughs amongst the 50% most deprived local
authorities in England. For this domain Barnet is the 81st most deprived nationally and the
25th most deprived across London. Despite relatively high levels of deprivation attributed to
this domain, between 2010 and 2015 the number of Barnet LSOAs in the 30% most deprived
nationally has reduced by 22, the largest reduction across all domains.
Health Deprivation and Disability, Education, Skills and Training and Employment domains
have lower levels of deprivation
Levels of deprivation in the Health Deprivation and Disability and the Education, Skills and
Training domains are considerably lower than for those domains mentioned above. No
Barnet LSOAs fall with the top 10% most deprived nationally for either domain and Barnet
ranks within the least 25% across both domains nationally. Barnet also has relatively low
levels of deprivation for the Employment domain where it is the 127th least deprived local
authority in England.
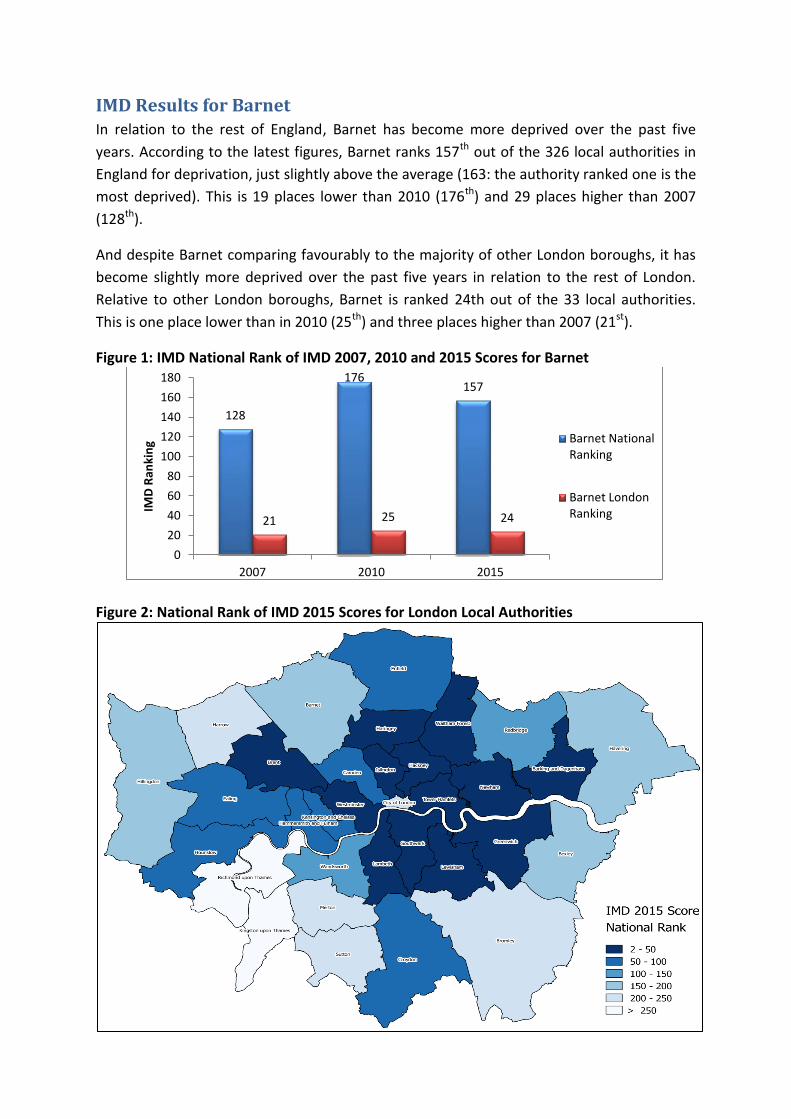
IMD Results for Barnet In relation to the rest of England, Barnet has become more deprived over the past five
years. According to the latest figures, Barnet ranks 157th out of the 326 local authorities in
England for deprivation, just slightly above the average (163: the authority ranked one is the
most deprived). This is 19 places lower than 2010 (176th) and 29 places higher than 2007
(128th).
And despite Barnet comparing favourably to the majority of other London boroughs, it has
become slightly more deprived over the past five years in relation to the rest of London.
Relative to other London boroughs, Barnet is ranked 24th out of the 33 local authorities.
This is one place lower than in 2010 (25th) and three places higher than 2007 (21st).
Figure 1: IMD National Rank of IMD 2007, 2010 and 2015 Scores for Barnet
Figure 2: National Rank of IMD 2015 Scores for London Local Authorities
128
176 157
21 25 24
0
20
40
60
80
100
120
140
160
180
2007 2010 2015
IMD
Ran
kin
g Barnet NationalRanking
Barnet LondonRanking
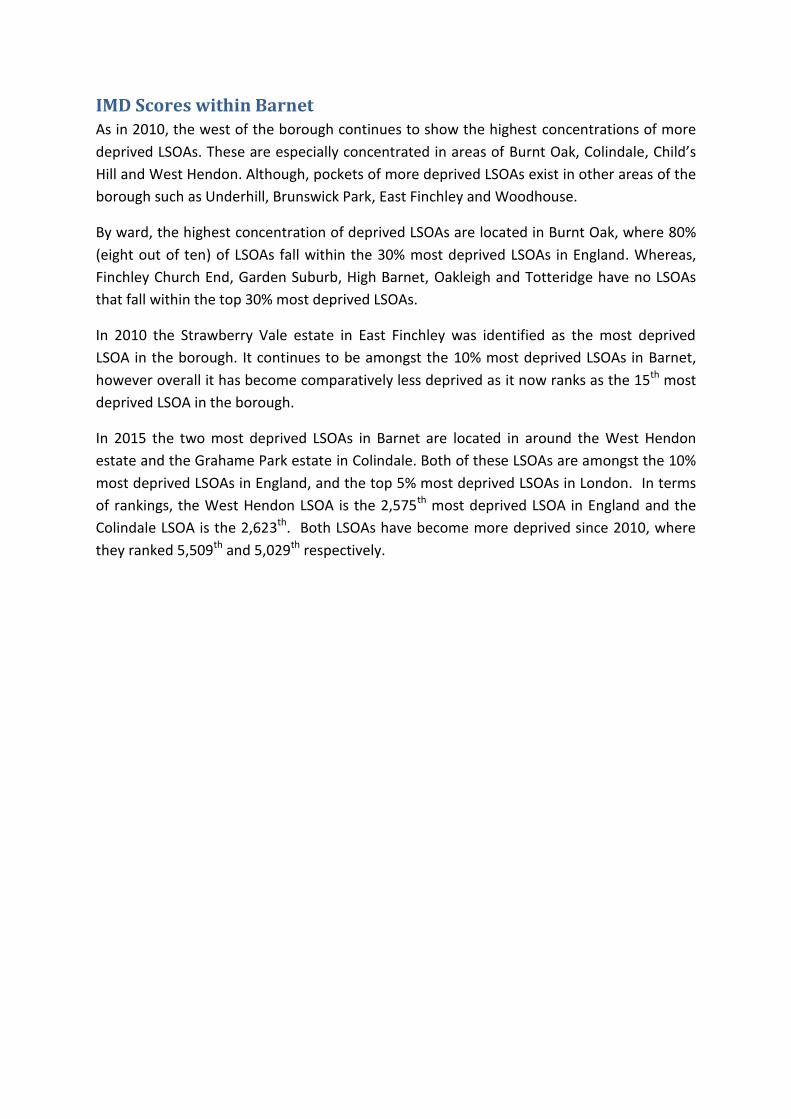
IMD Scores within Barnet As in 2010, the west of the borough continues to show the highest concentrations of more
deprived LSOAs. These are especially concentrated in areas of Burnt Oak, Colindale, Child’s
Hill and West Hendon. Although, pockets of more deprived LSOAs exist in other areas of the
borough such as Underhill, Brunswick Park, East Finchley and Woodhouse.
By ward, the highest concentration of deprived LSOAs are located in Burnt Oak, where 80%
(eight out of ten) of LSOAs fall within the 30% most deprived LSOAs in England. Whereas,
Finchley Church End, Garden Suburb, High Barnet, Oakleigh and Totteridge have no LSOAs
that fall within the top 30% most deprived LSOAs.
In 2010 the Strawberry Vale estate in East Finchley was identified as the most deprived
LSOA in the borough. It continues to be amongst the 10% most deprived LSOAs in Barnet,
however overall it has become comparatively less deprived as it now ranks as the 15th most
deprived LSOA in the borough.
In 2015 the two most deprived LSOAs in Barnet are located in around the West Hendon
estate and the Grahame Park estate in Colindale. Both of these LSOAs are amongst the 10%
most deprived LSOAs in England, and the top 5% most deprived LSOAs in London. In terms
of rankings, the West Hendon LSOA is the 2,575th most deprived LSOA in England and the
Colindale LSOA is the 2,623th. Both LSOAs have become more deprived since 2010, where
they ranked 5,509th and 5,029th respectively.
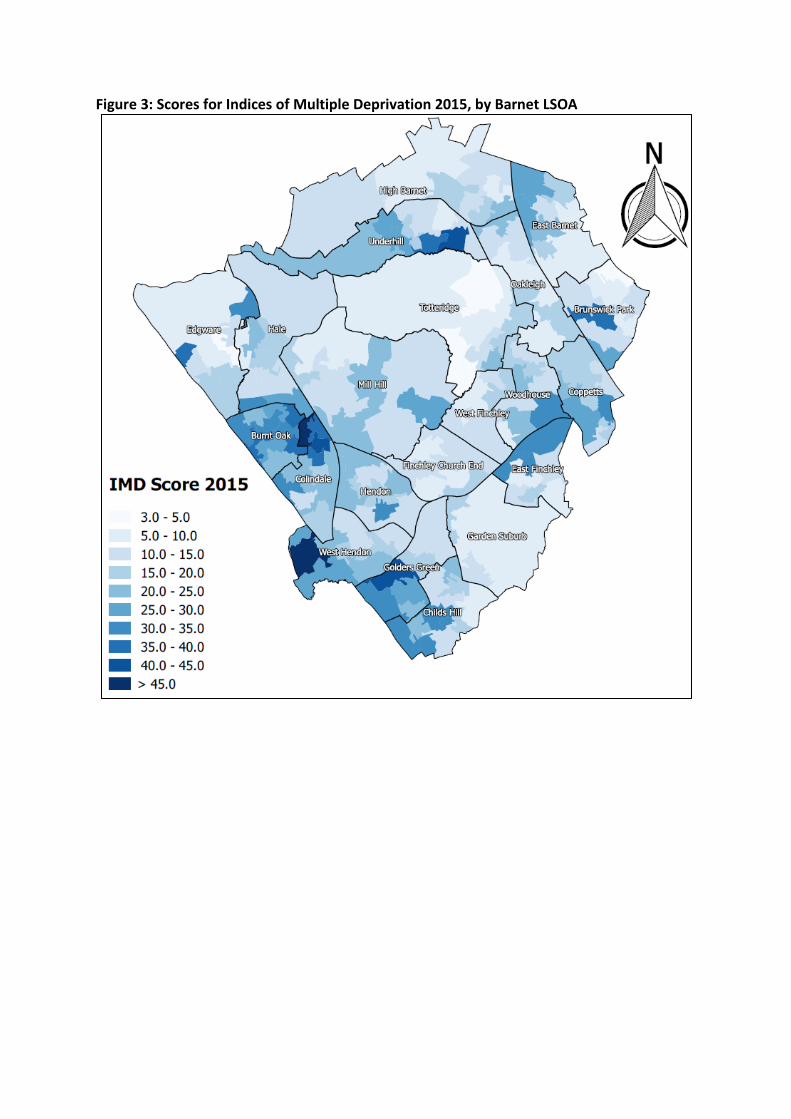
Figure 3: Scores for Indices of Multiple Deprivation 2015, by Barnet LSOA
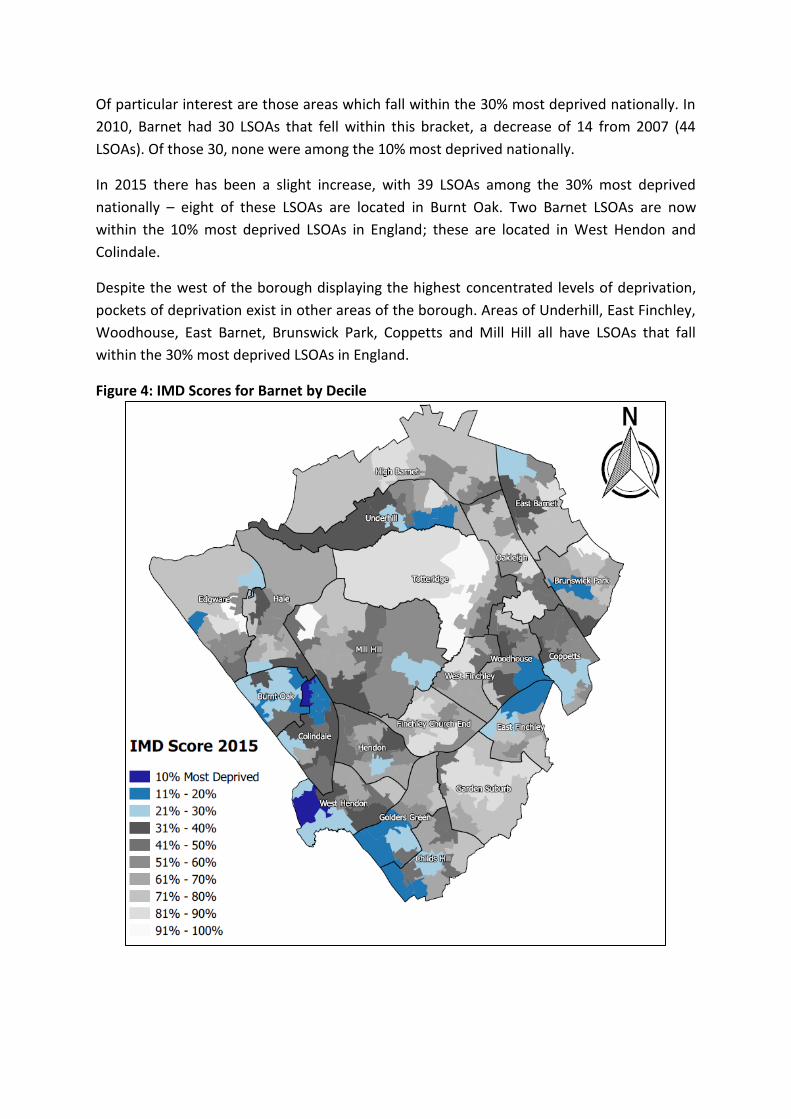
Of particular interest are those areas which fall within the 30% most deprived nationally. In
2010, Barnet had 30 LSOAs that fell within this bracket, a decrease of 14 from 2007 (44
LSOAs). Of those 30, none were among the 10% most deprived nationally.
In 2015 there has been a slight increase, with 39 LSOAs among the 30% most deprived
nationally – eight of these LSOAs are located in Burnt Oak. Two Barnet LSOAs are now
within the 10% most deprived LSOAs in England; these are located in West Hendon and
Colindale.
Despite the west of the borough displaying the highest concentrated levels of deprivation,
pockets of deprivation exist in other areas of the borough. Areas of Underhill, East Finchley,
Woodhouse, East Barnet, Brunswick Park, Coppetts and Mill Hill all have LSOAs that fall
within the 30% most deprived LSOAs in England.
Figure 4: IMD Scores for Barnet by Decile
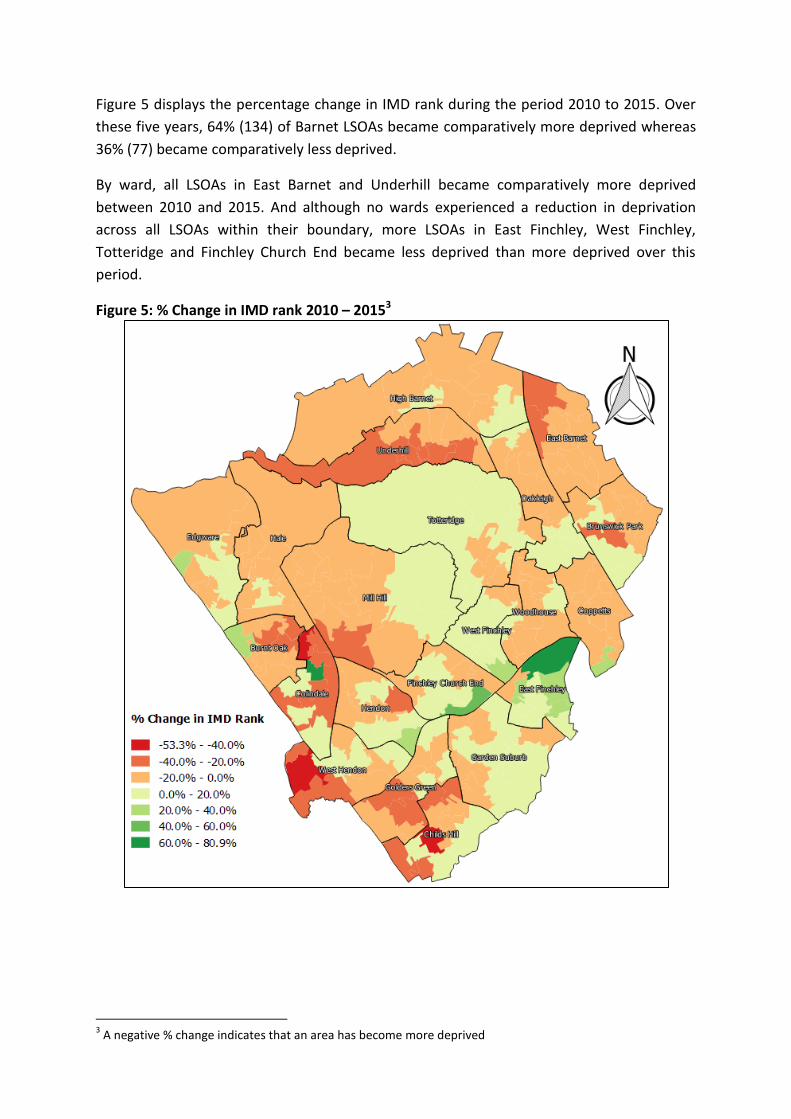
Figure 5 displays the percentage change in IMD rank during the period 2010 to 2015. Over
these five years, 64% (134) of Barnet LSOAs became comparatively more deprived whereas
36% (77) became comparatively less deprived.
By ward, all LSOAs in East Barnet and Underhill became comparatively more deprived
between 2010 and 2015. And although no wards experienced a reduction in deprivation
across all LSOAs within their boundary, more LSOAs in East Finchley, West Finchley,
Totteridge and Finchley Church End became less deprived than more deprived over this
period.
Figure 5: % Change in IMD rank 2010 – 20153
3 A negative % change indicates that an area has become more deprived
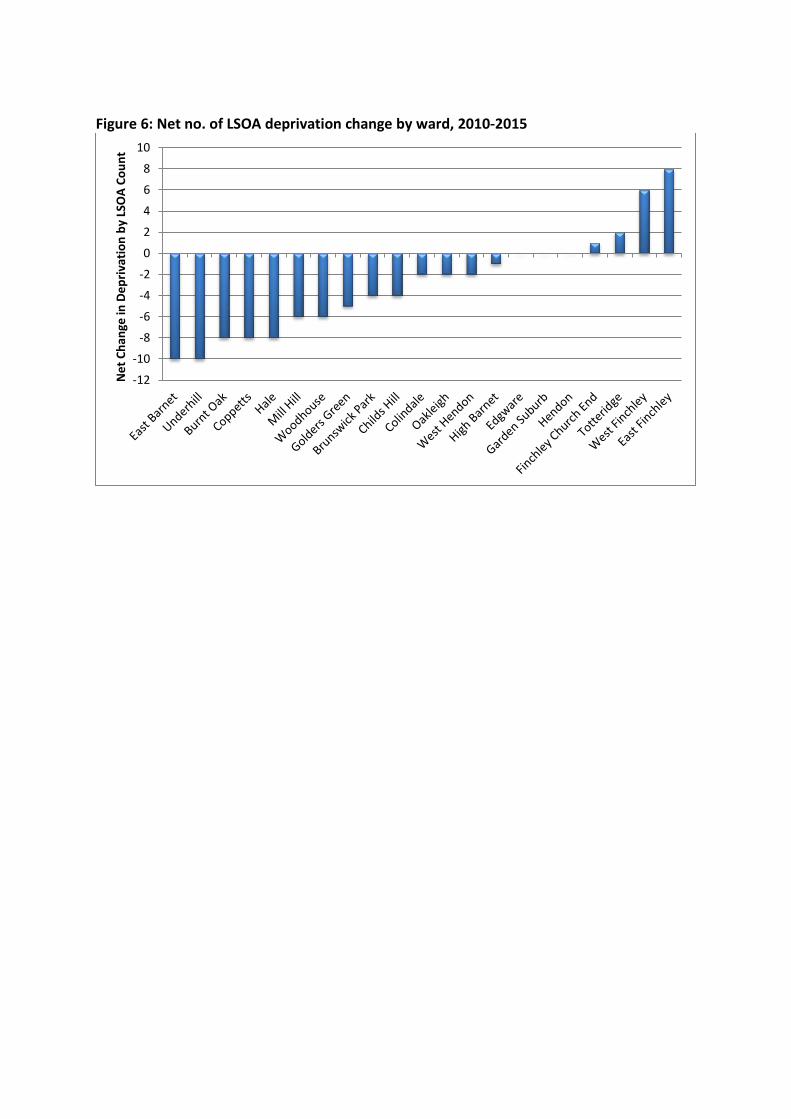
Figure 6: Net no. of LSOA deprivation change by ward, 2010-2015
-12
-10
-8
-6
-4
-2
0
2
4
6
8
10
Ne
t C
han
ge in
De
pri
vati
on
by
LSO
A C
ou
nt
Domain Analysis The IMD is based on 37 separate indicators, organised across seven distinct domains;
Income, Employment, Health and Disability, Education, Skills and Training, Barriers to
Housing and Services, Living Environment and Crime and Disorder. A full breakdown of all of
the indicators is given in Appendix 1.
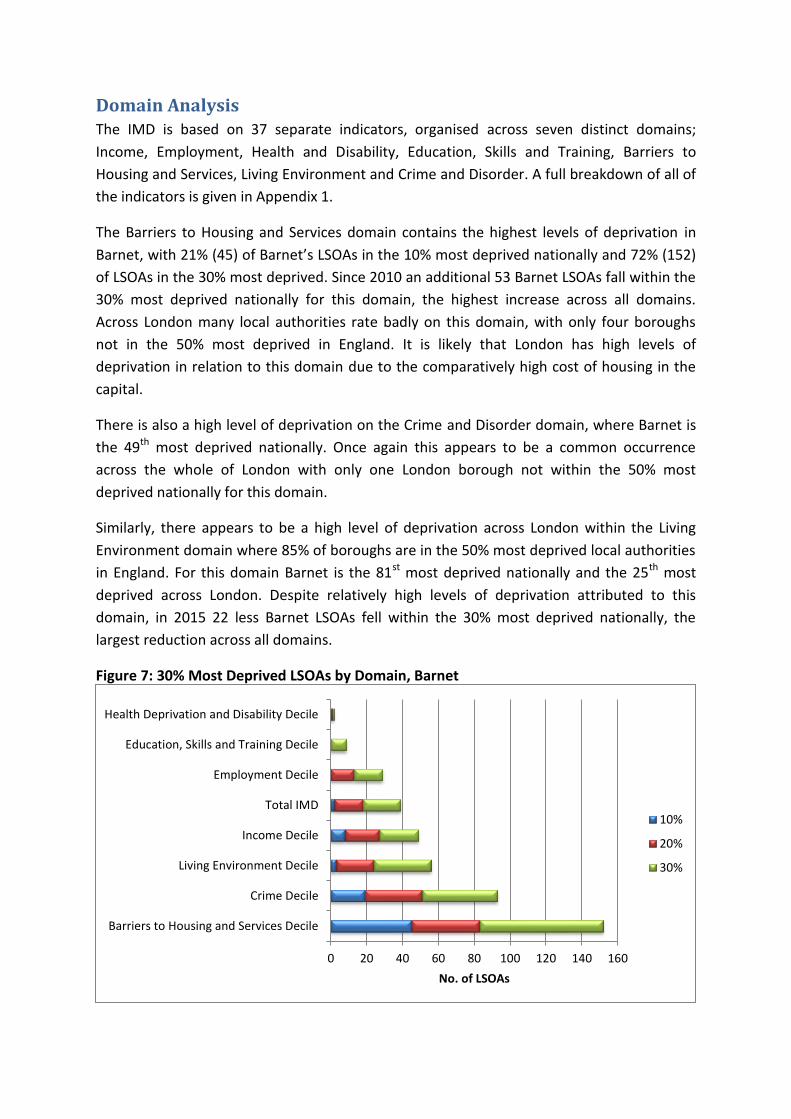
The Barriers to Housing and Services domain contains the highest levels of deprivation in
Barnet, with 21% (45) of Barnet’s LSOAs in the 10% most deprived nationally and 72% (152)
of LSOAs in the 30% most deprived. Since 2010 an additional 53 Barnet LSOAs fall within the
30% most deprived nationally for this domain, the highest increase across all domains.
Across London many local authorities rate badly on this domain, with only four boroughs
not in the 50% most deprived in England. It is likely that London has high levels of
deprivation in relation to this domain due to the comparatively high cost of housing in the
capital.
There is also a high level of deprivation on the Crime and Disorder domain, where Barnet is
the 49th most deprived nationally. Once again this appears to be a common occurrence
across the whole of London with only one London borough not within the 50% most
deprived nationally for this domain.
Similarly, there appears to be a high level of deprivation across London within the Living
Environment domain where 85% of boroughs are in the 50% most deprived local authorities
in England. For this domain Barnet is the 81st most deprived nationally and the 25th most
deprived across London. Despite relatively high levels of deprivation attributed to this
domain, in 2015 22 less Barnet LSOAs fell within the 30% most deprived nationally, the
largest reduction across all domains.
Figure 7: 30% Most Deprived LSOAs by Domain, Barnet
0 20 40 60 80 100 120 140 160
Barriers to Housing and Services Decile
Crime Decile
Living Environment Decile
Income Decile
Total IMD
Employment Decile
Education, Skills and Training Decile
Health Deprivation and Disability Decile
No. of LSOAs
10%
20%
30%
Barriers to Housing and Services Domain
The Barriers to Housing and Services domain measures the physical and financial
accessibility of housing and key local services. This domain contains the highest levels of
deprivation in Barnet. Since 2010 an additional 53 Barnet LSOAs fall within the 30% most
deprived nationally for this domain, the highest increase across all domains.
Across London many local authorities rate badly on this domain, with only four London
boroughs not in the 50% most deprived in England. Out of all London local authorities
Barnet is the 15th most deprived and the 17th most deprived nationally. It is likely that
London has high levels of deprivation in relation to this domain due to the comparatively
high cost of housing in the capital.
In line with overall deprivation levels, the west of the borough exhibits the highest
concentration of deprivation in relation to the Barriers to Housing and Services domain.
Although this domain impacts on almost the whole of the borough, with a large spread of
LSOAs across Barnet within the 30% most deprived in England.
Barnet ranks 17th out of all local authorities in England and 15th within local authorities
in London for the Barriers to Housing and Services domain. This is the highest rank
across all domains.
72% (152) of LSOAs in Barnet fall within the 30% most deprived in England for this
domain, compared to 47% (99) in 2010.
Of all the domains this has the highest number of Barnet LSOAs in the 10%, 20% and
30% most deprived areas; 45, 38 and 69 respectively.
For this domain the most deprived LSOA is located around Grahame Park in Colindale,
which ranks 9th nationally. This is the lowest ranking across all domains.
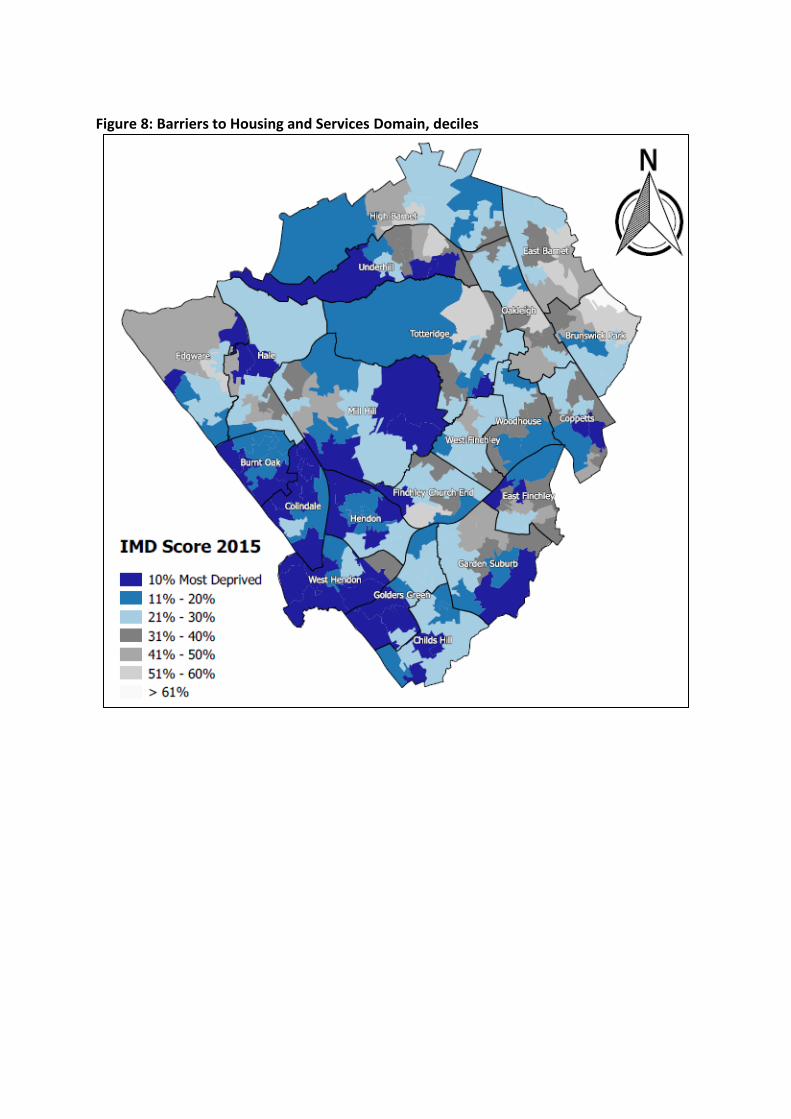
Figure 8: Barriers to Housing and Services Domain, deciles
Crime and Disorder Domain
The Crime and Disorder domain measures the risk of personal and material victimisation at
local level. The 2015 IMD indicates that the Crime and Disorder domain is the second most
deprived domain across Barnet. Deprivation levels relating to this domain increased
between 2010 and 2015, with an additional 19 Barnet LSOAs within the 30% most deprived
LSOAs in England.
Across London many local authorities rate badly on this domain, with only two London
boroughs (Kingston upon Thames and City of London) outside of the 50% most deprived
local authorities in England.
As with overall deprivation levels the west of the borough exhibits some of the highest
levels of deprivation relating to the Crime and Disorder domain. However, unlike overall
deprivation levels, there is a much higher degree of deprivation located towards the East of
the borough, specifically around Coppetts, Brunswick Park, Woodhouse and Oakleigh.
Barnet ranks 49th out of all local authorities in England and 24th within local authorities in
London for the Crime and Disorder domain.
19 Barnet LSOAs fall within the 10% most deprived nationally for the Crime and Disorder
domain; this has increased from 10 in 2010. Child’s Hill has the largest number (four
(33%)) of LSOAs in the top 10%; followed by Burnt Oak, Coppetts and West Hendon
which all have three (30%).
A further 21 areas are ranked within the 20% most deprived nationally and 32 are ranked
within the 30% most deprived nationally.
Burnt Oak, Coppetts and West Hendon each have eight out of their 10 LSOAs within the
30% most deprived, whereas Child’s Hill has the largest number of LSOAs in the top 30%
(nine out of 12 (75%)).
Totteridge is the only ward with no LSOAs in the 30% most deprived nationally for this
domain.
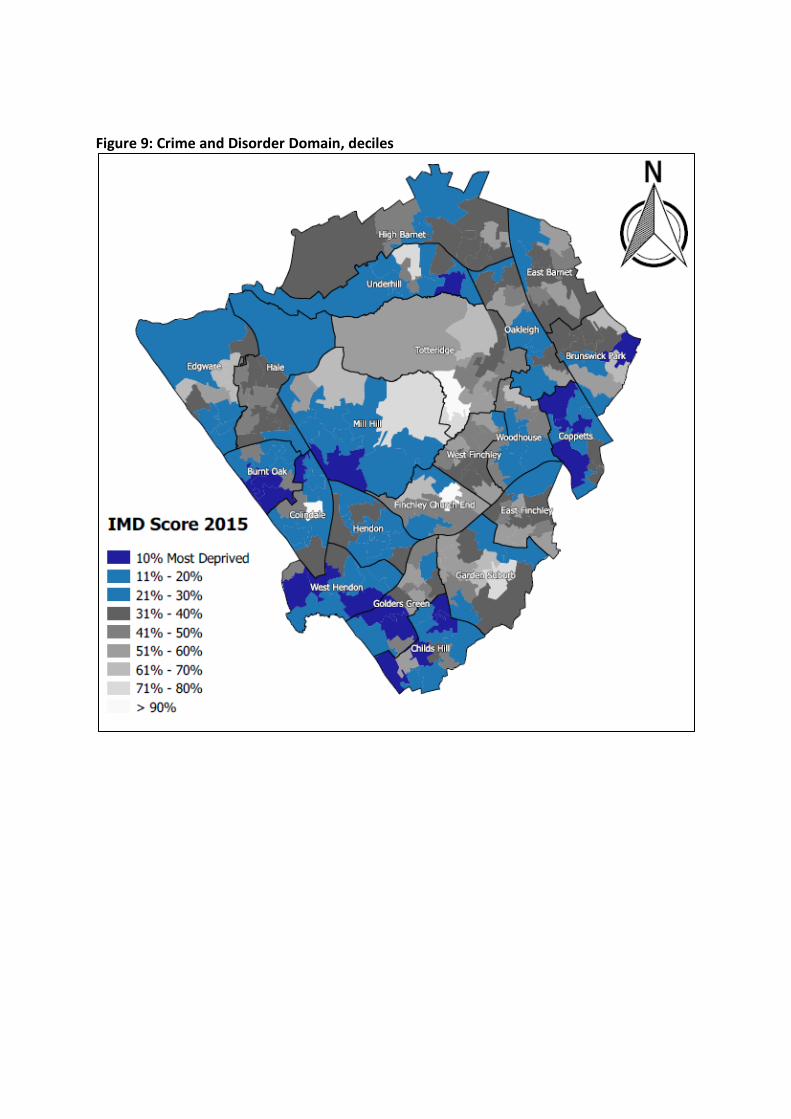
Figure 9: Crime and Disorder Domain, deciles
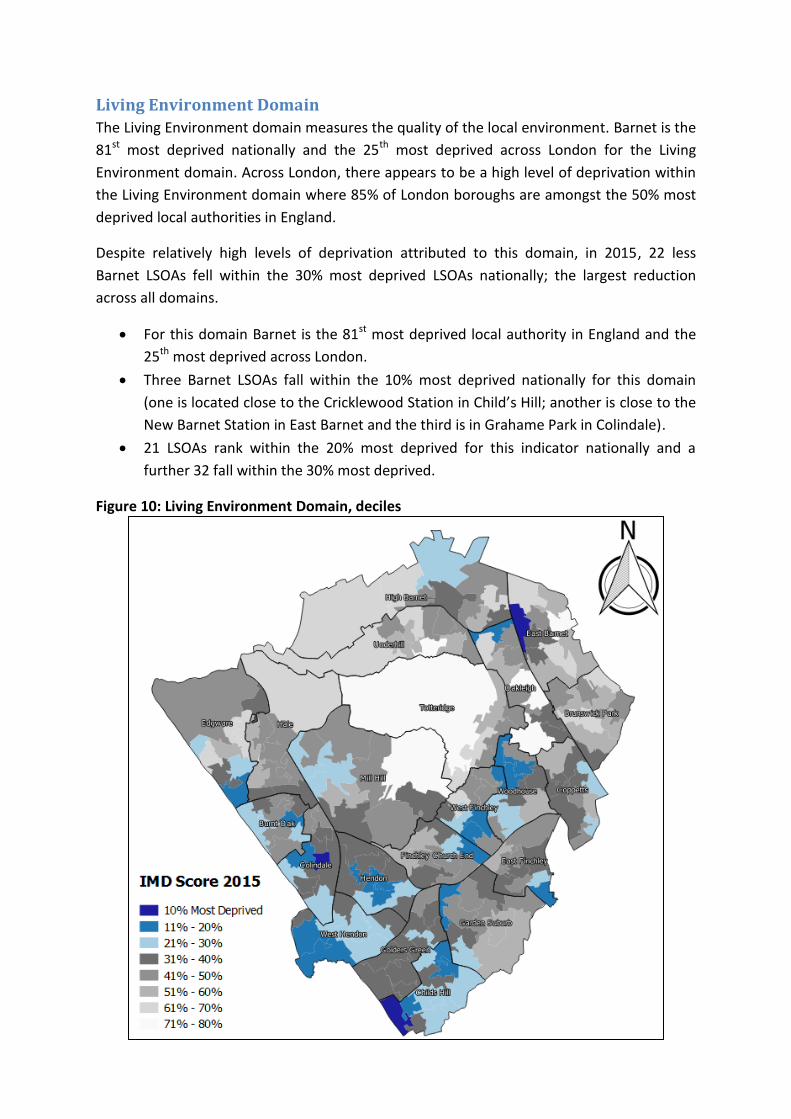
Living Environment Domain
The Living Environment domain measures the quality of the local environment. Barnet is the
81st most deprived nationally and the 25th most deprived across London for the Living
Environment domain. Across London, there appears to be a high level of deprivation within
the Living Environment domain where 85% of London boroughs are amongst the 50% most
deprived local authorities in England.
Despite relatively high levels of deprivation attributed to this domain, in 2015, 22 less
Barnet LSOAs fell within the 30% most deprived LSOAs nationally; the largest reduction
across all domains.
For this domain Barnet is the 81st most deprived local authority in England and the
25th most deprived across London.
Three Barnet LSOAs fall within the 10% most deprived nationally for this domain
(one is located close to the Cricklewood Station in Child’s Hill; another is close to the
New Barnet Station in East Barnet and the third is in Grahame Park in Colindale).
21 LSOAs rank within the 20% most deprived for this indicator nationally and a
further 32 fall within the 30% most deprived.
Figure 10: Living Environment Domain, deciles
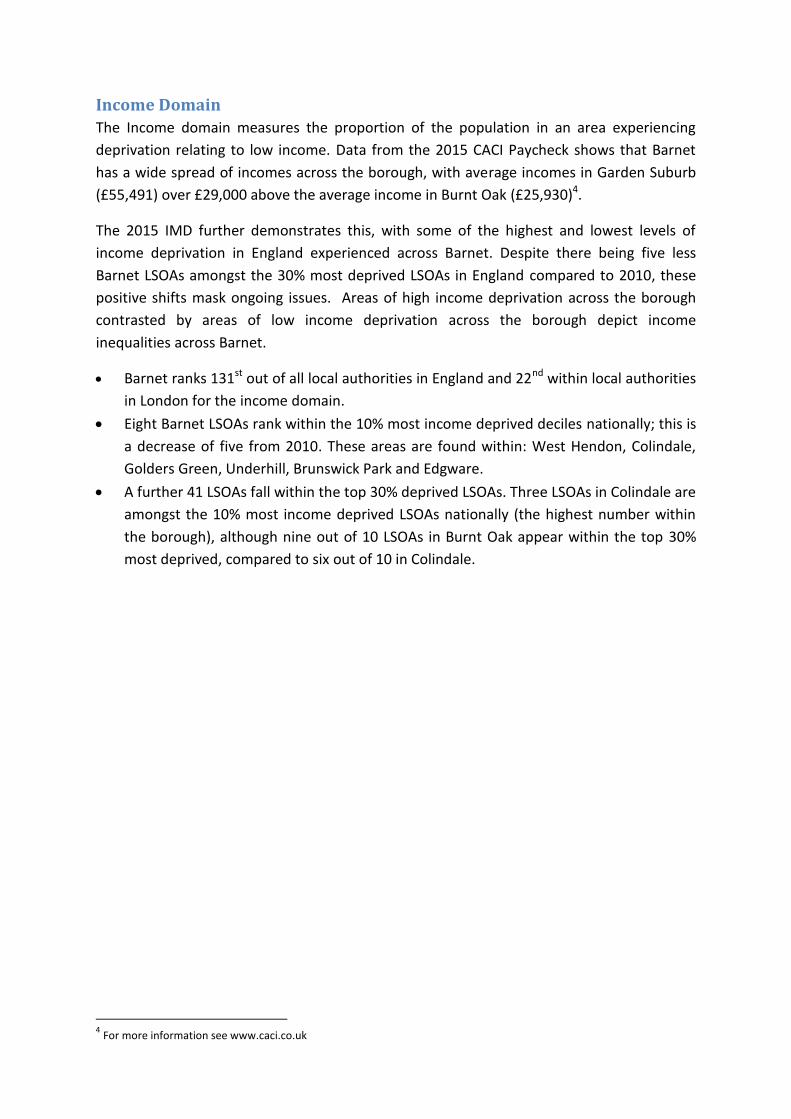
Income Domain
The Income domain measures the proportion of the population in an area experiencing
deprivation relating to low income. Data from the 2015 CACI Paycheck shows that Barnet
has a wide spread of incomes across the borough, with average incomes in Garden Suburb
(£55,491) over £29,000 above the average income in Burnt Oak (£25,930)4.
The 2015 IMD further demonstrates this, with some of the highest and lowest levels of
income deprivation in England experienced across Barnet. Despite there being five less
Barnet LSOAs amongst the 30% most deprived LSOAs in England compared to 2010, these
positive shifts mask ongoing issues. Areas of high income deprivation across the borough
contrasted by areas of low income deprivation across the borough depict income
inequalities across Barnet.
Barnet ranks 131st out of all local authorities in England and 22nd within local authorities
in London for the income domain.
Eight Barnet LSOAs rank within the 10% most income deprived deciles nationally; this is
a decrease of five from 2010. These areas are found within: West Hendon, Colindale,
Golders Green, Underhill, Brunswick Park and Edgware.
A further 41 LSOAs fall within the top 30% deprived LSOAs. Three LSOAs in Colindale are
amongst the 10% most income deprived LSOAs nationally (the highest number within
the borough), although nine out of 10 LSOAs in Burnt Oak appear within the top 30%
most deprived, compared to six out of 10 in Colindale.
4 For more information see www.caci.co.uk
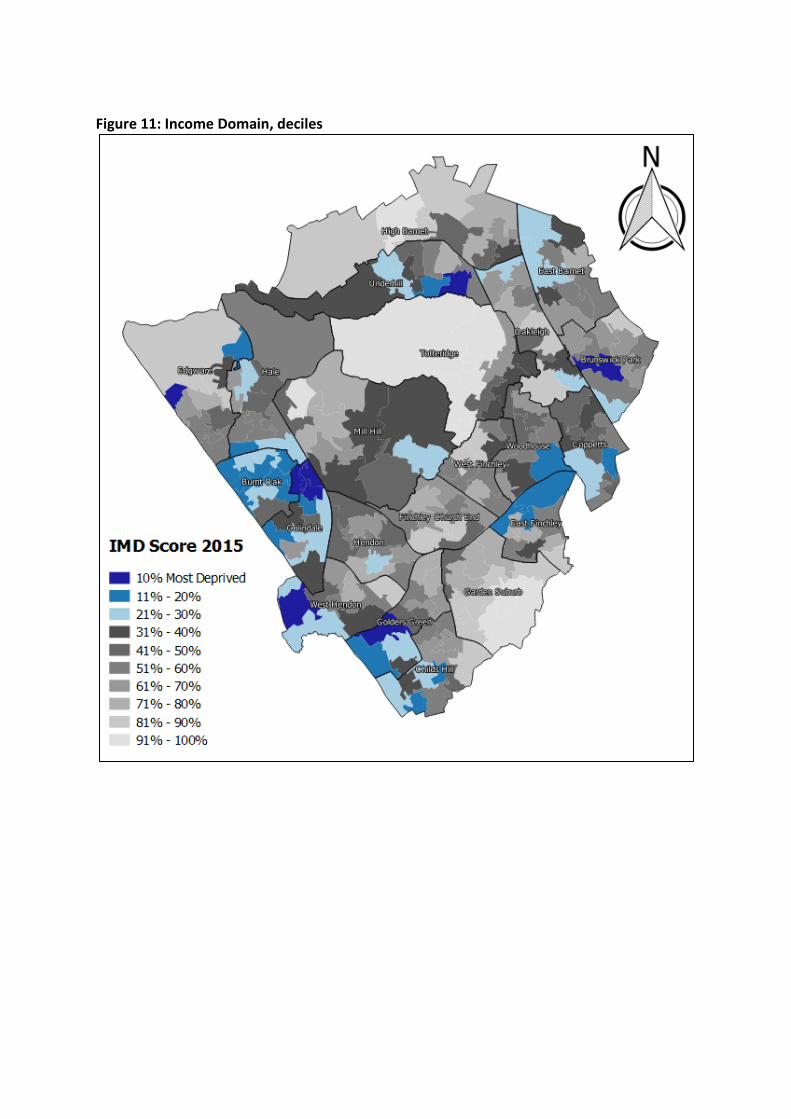
Figure 11: Income Domain, deciles
Employment Domain
The Employment domain measures the proportion of the working age population in an area,
involuntarily excluded from the labour market. Barnet performs quite well across this
domain with the 2015 IMD data ranking Barnet as the 199th least deprived local authority in
England and the 24th least deprived across local authorities in London.
Despite this, in 2015 29 Barnet LSOAs remained amongst the 30% most deprived LSOAs in
England, the same as in 2010. Although in 2010 two LSOAs were amongst the top 10% most
deprived in England and in 2015 no LSOAs fall within this group, which suggests some
positive movement across this domain.
Barnet ranks 199th out of all local authorities in England and 24th within local authorities
in London for the employment domain.
No LSOAs in Barnet fall into the 10% most deprived nationally for employment; this is
an improvement since 2010 where two LSOAs were in the top 10%.
13 LSOAs fall into the top 20% most deprived nationally, these are located in West
Hendon, Colindale, Golders Green, Underhill, Brunswick Park, Burnt Oak, Childs Hill,
East Finchley, Woodhouse and Coppetts.
Figure 12: Employment Domain, deciles
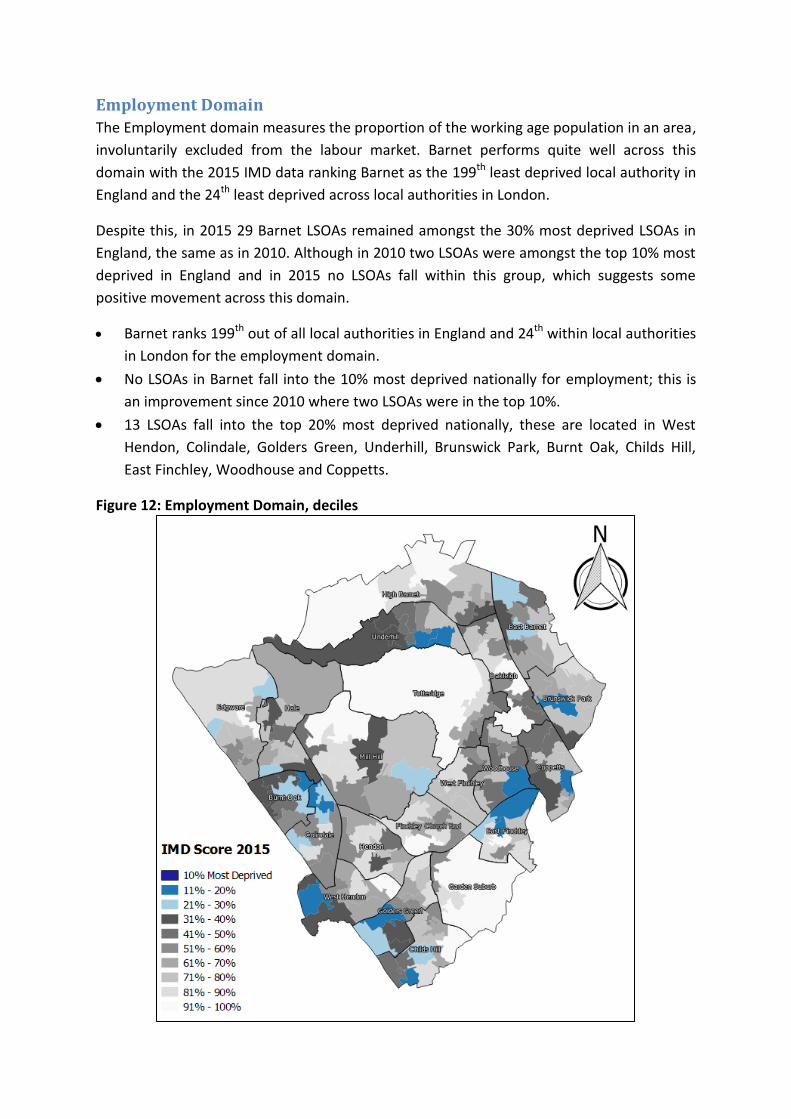
Health Deprivation and Disability Domain
The Health Deprivation and Disability domain measures the risk of premature death and the
impairment of quality of life through poor physical or mental health. Barnet has one of the
lowest comparative levels for the Health Deprivation and Disability domain.
In 2010 no Barnet LSOAs were in the top 30% most deprived in the country, however in
2015 one LSOA in Brunswick Park is amongst the 20% most deprived and one in Burnt Oak is
within the 30% most deprived. Both of these areas are amongst the 30% most deprived
(overall IMD) LSOAs in England.
Barnet ranks 259th out of all local authorities in England and 29th within local
authorities in London for the living environment domain.
No Barnet LSOAs were in the top 10% most deprived nationally and just one in the
top 20% and 30% respectively; these are located in Brunswick Park and Burnt Oak.
Figure 13: Health Derivation and Disability Domain, deciles
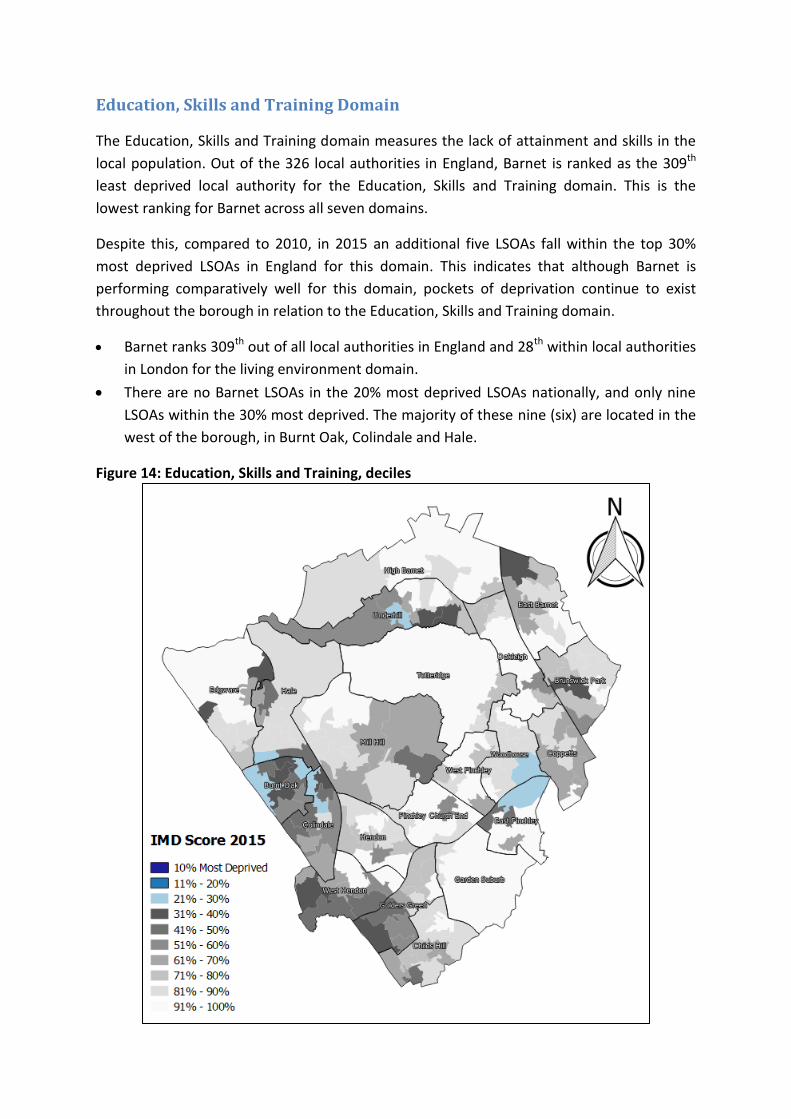
Education, Skills and Training Domain
The Education, Skills and Training domain measures the lack of attainment and skills in the
local population. Out of the 326 local authorities in England, Barnet is ranked as the 309th
least deprived local authority for the Education, Skills and Training domain. This is the
lowest ranking for Barnet across all seven domains.
Despite this, compared to 2010, in 2015 an additional five LSOAs fall within the top 30%
most deprived LSOAs in England for this domain. This indicates that although Barnet is
performing comparatively well for this domain, pockets of deprivation continue to exist
throughout the borough in relation to the Education, Skills and Training domain.
Barnet ranks 309th out of all local authorities in England and 28th within local authorities
in London for the living environment domain.
There are no Barnet LSOAs in the 20% most deprived LSOAs nationally, and only nine
LSOAs within the 30% most deprived. The majority of these nine (six) are located in the
west of the borough, in Burnt Oak, Colindale and Hale.
Figure 14: Education, Skills and Training, deciles
Appendix 1 – Domain Indicators
Income Deprivation Domain
The Income Deprivation Domain measures the proportion of the population in an area experiencing
deprivation relating to low income. The definition of low income used includes both those people
that are out-of-work, and those that are in work but who have low earnings (and who satisfy the
respective means tests). A combined count of income deprived individuals per Lower-layer Super
Output Area is calculated by summing the following six non-overlapping indicators:
Adults and children in Income Support families
Adults and children in income-based Jobseeker’s Allowance families
Adults and children in income-based Employment and Support Allowance families
Adults and children in Pension Credit (Guarantee) families
Adults and children in Working Tax Credit and Child Tax Credit families not already counted,
that is those who are not in receipt of Income Support, income-based Jobseeker’s
Allowance, income-based Employment and Support Allowance or Pension Credit
(Guarantee) and whose equivalised income (excluding housing benefit) is below 60 per cent
of the median before housing costs
Asylum seekers in England in receipt of subsistence support, accommodation support, or
both.
In addition an Income Deprivation Affecting Children Index and an Income Deprivation Affecting
Older People Index were created, respectively representing the proportion of children aged 0-15,
and people aged 60 and over, living in income deprived households.
Employment Deprivation Domain
The Employment Deprivation Domain measures the proportion of the working age population in an
area involuntarily excluded from the labour market. This includes people who would like to work but
are unable to do so due to unemployment, sickness or disability, or caring responsibilities. A
combined count of employment deprived individuals per Lower-layer Super Output Area is
calculated by summing the following five non-overlapping indicators:
Claimants of Jobseeker’s Allowance (both contribution-based and income based), women
aged 18 to 59 and men aged 18 to 64
Claimants of Employment and Support Allowance, women aged 18 to 59 and men aged 18
to 64
Claimants of Incapacity Benefit, women aged 18 to 59 and men aged 18 to 64
Claimants of Severe Disablement Allowance, women aged 18 to 59 and men aged 18 to 64
Claimants of Carer’s Allowance, women aged 18 to 59 and men aged 18 to 64.
Education, Skills and Training Deprivation Domain
The Education, Skills and Training Domain measures the lack of attainment and skills in the local
population. The indicators fall into two sub-domains: one relating to children and young people and
one relating to adult skills. These two subdomains are designed to reflect the ‘flow’ and ‘stock’ of
educational disadvantage within an area respectively. That is, the ‘children and young people’ sub-
domain measures the attainment of qualifications and associated measures (‘flow’), while the ‘skills’
sub-domain measures the lack of qualifications in the resident working age adult population
(‘stock’).
Children and Young People sub-domain
Key Stage 2 attainment: The average points score of pupils taking reading, writing and
mathematics Key Stage 2 exams12
Key Stage 4 attainment: The average capped points score of pupils taking Key Stage 4
Secondary school absence: The proportion of authorised and unauthorised absences from
secondary school
Staying on in education post 16: The proportion of young people not staying on in school or
non-advanced education above age 16
Entry to higher education: A measure of young people aged under 21 not entering higher
education.
Adult Skills sub-domain
The Adult Skills sub-domain is a non-overlapping count of two indicators:
Adult skills: The proportion of working age adults with no or low qualifications, women aged
25 to 59 and men aged 25 to 64
English language proficiency: The proportion of working age adults who cannot speak
English or cannot speak English well, women aged 25 to 59 and men aged 25 to 64.
Health Deprivation and Disability Domain
The Health Deprivation and Disability Domain measures the risk of premature death and the
impairment of quality of life through poor physical or mental health. The domain measures
morbidity, disability and premature mortality but not aspects of behaviour or environment that may
be predictive of future health deprivation.
Years of potential life lost: An age and sex standardised measure of premature death
Comparative illness and disability ratio: An age and sex standardised morbidity/disability
ratio
Acute morbidity: An age and sex standardised rate of emergency admission to hospital
Mood and anxiety disorders: A composite based on the rate of adults suffering from mood
and anxiety disorders, hospital episodes data, suicide mortality data and health benefits
data.
Crime Domain
Crime is an important feature of deprivation that has major effects on individuals and communities.
The Crime Domain measures the risk of personal and material victimisation at local level.
Violence – number of reported violent crimes (18 reported crime types) per 1000 at risk
population
Burglary – number of reported burglaries (4 reported crime types) per 1000 at risk
population
Theft – number of reported thefts (5 reported crime types) per 1000 at risk population
Criminal damage – number of reported crimes (8 reported crime types) per 1000 at risk
population.
Barriers to Housing and Services Domain
This domain measures the physical and financial accessibility of housing and key local services. The
indicators fall into two sub-domains: ‘geographical barriers’, which relate to the physical proximity of
local services, and ‘wider barriers’ which includes issues relating to access to housing such as
affordability.
Geographical Barriers sub-domain
Road distance to a post office
Road distance to a primary school
Road distance to a general store or supermarket
Road distance to a GP surgery.
Wider Barriers sub-domain
Household overcrowding: The proportion of all households in a Lower-layer Super Output
Area which are judged to have insufficient space to meet the household’s needs
Homelessness: Local authority district level rate of acceptances for housing assistance under
the homelessness provisions of the 1996 Housing Act, assigned to the constituent Lower-
layer Super Output Areas
Housing affordability: Difficulty of access to owner-occupation or the private rental market,
expressed as the inability to afford to enter owner occupation or the private rental market.
Living Environment Deprivation Domain
The Living Environment Deprivation Domain measures the quality of the local environment. The
indicators fall into two sub-domains. The ‘indoors’ living environment measures the quality of
housing; while the ‘outdoors’ living environment contains measures of air quality and road traffic
accidents.
Indoors sub-domain
Houses without central heating: The proportion of houses that do not have central heating
Housing in poor condition: The proportion of social and private homes that fail to meet the
Decent Homes standard.
Outdoors sub-domain
Air quality: A measure of air quality based on emissions rates for four pollutants
Road traffic accidents involving injury to pedestrians and cyclists: A measure of road traffic
accidents involving injury to pedestrians and cyclists among the resident and workplace
population.