Embed Size (px)
Citation preview

Subjective well-being among Spanish adolescents according to their self-categorization as audiovisual media consumers
Ferran Casas, Sara Malo, Irma Bertran, Carme Montserrat & Mònica González
http://www.udg.edu/eridiqv

Where is our sample from?
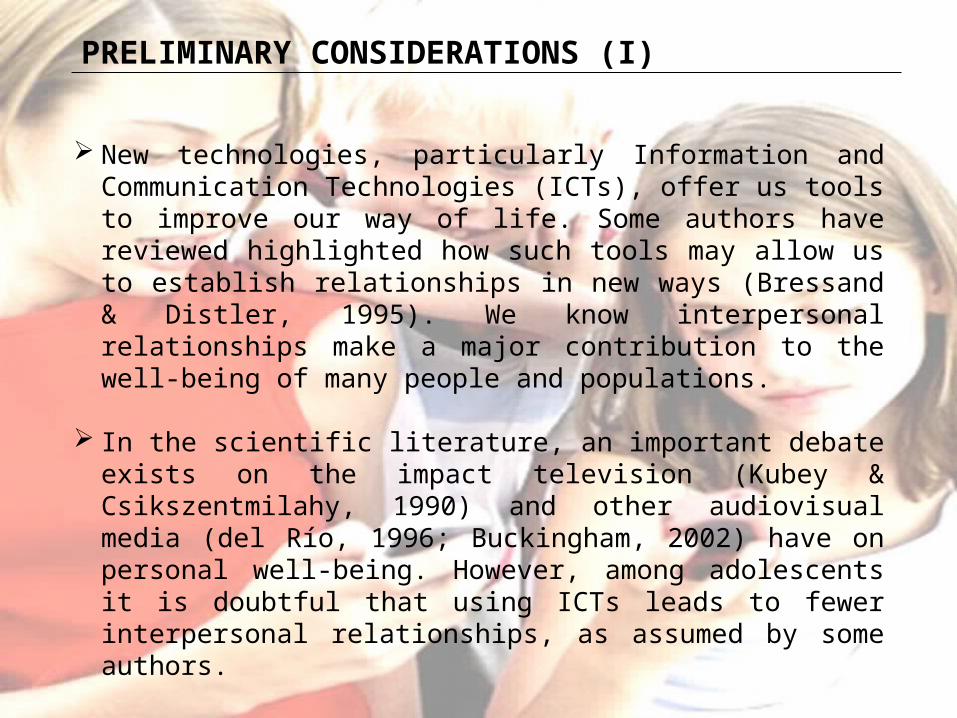
PRELIMINARY CONSIDERATIONS (I)
New technologies, particularly Information and Communication Technologies (ICTs), offer us tools to improve our way of life. Some authors have reviewed highlighted how such tools may allow us to establish relationships in new ways (Bressand & Distler, 1995). We know interpersonal relationships make a major contribution to the well-being of many people and populations.
In the scientific literature, an important debate exists on the impact television (Kubey & Csikszentmilahy, 1990) and other audiovisual media (del Río, 1996; Buckingham, 2002) have on personal well-being. However, among adolescents it is doubtful that using ICTs leads to fewer interpersonal relationships, as assumed by some authors.

PRELIMINARY CONSIDERATIONS (II)
Time spent watching TV or using other media is frequently evaluated through a lengthy set of self-reported questions on the number of hours or minutes of everyday consumption, which in fact become very boring for children and adolescents.
In a representative sample of 12-16 Catalan adolescents, a rather high significant correlation (r=0.457) was observed between time of television consumption and self-categorization as television consumer. As a consequence, we decided to use this single self-categorization item in this research rather than the traditional set of time reporting items (Casas, Madorell et al., 2007).

AIM OF THIS PRESENTATION
In this study, we analyze the subjective well-being of a Spanish sample of N=3,504 12 to 18-year-old adolescents in relation to different levels of audiovisual media consumption.
Subjects were asked to categorize themselves on 5 different consumer levels for each of 4 audiovisual media (television, Internet, videogames, mobile phone).
Subjective well-being was analyzed using 3 different measures (PWI, SWLS and OLS) according to their different self-categorization as audiovisual media consumers.

METHODInstruments (I)
All data were obtained through a questionnaire measuring items on a 0 to 10 scale. The psychometric instruments included were:
PWI (Cummins, 2003; Cummins et al., 2003): We used the 7-item version. The item on satisfaction with religion or spirituality was not included. The maximum score for this index is 100.
SWLS (Diener et al., 1985): Notice that in our results the maximum score is 50 points rather than the usual 35.
OLS: 1 item on overall life satisfaction.
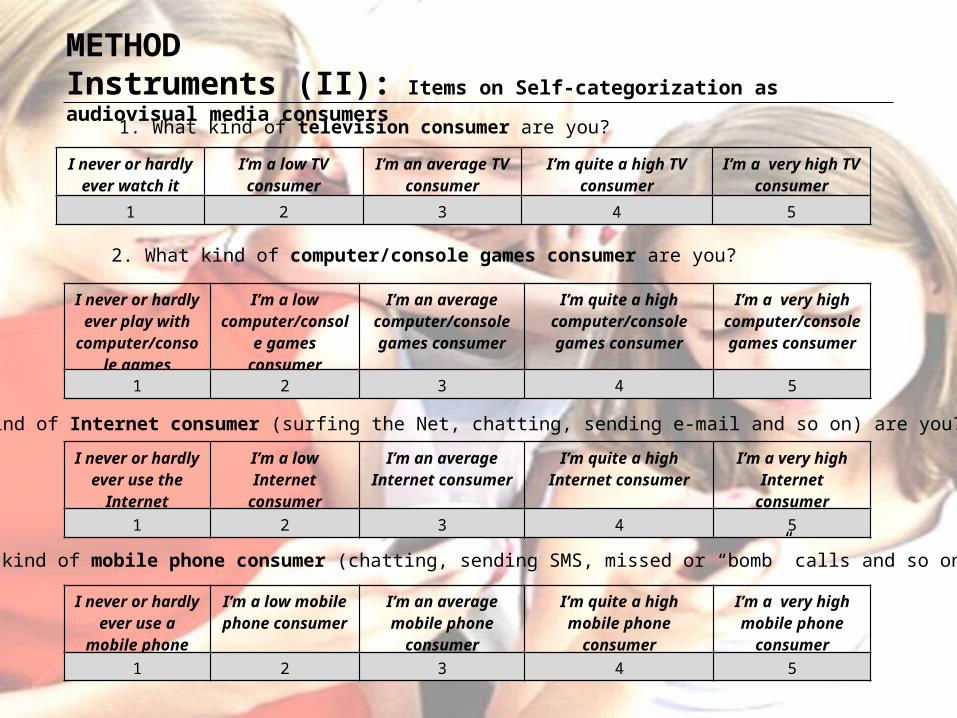
METHODInstruments (II): Items on Self-categorization as audiovisual media consumers
1. What kind of television consumer are you?
I never or hardly ever watch it
I’m a low TV consumer
I’m an average TV consumer
I’m quite a high TV consumer
I’m a very high TV consumer
1 2 3 4 5
2. What kind of computer/console games consumer are you?
I never or hardly ever play with
computer/console games
I’m a low computer/console games consumer
I’m an average computer/console games consumer
I’m quite a high computer/console games
consumer
I’m a very high computer/console games consumer
1 2 3 4 5
3. What kind of Internet consumer (surfing the Net, chatting, sending e-mail and so on) are you?I never or hardly
ever use the Internet
I’m a low Internet consumer
I’m an average Internet consumer
I’m quite a high Internet consumer
I’m a very high Internet consumer
1 2 3 4 5
4. What kind of mobile phone consumer (chatting, sending SMS, missed or “bomb” calls and so on) are you?
I never or hardly ever use a mobile
phone
I’m a low mobile phone consumer
I’m an average mobile phone consumer
I’m quite a high mobile phone consumer
I’m a very high mobile phone
consumer
1 2 3 4 5

METHODProcedure
A two-stage cluster sampling design was used to select the sample. In the first stage, 18 secondary schools were randomly selected within the four provinces of Catalonia.
In each school, we reported our aims to the Director/Principal and to the Parents' Association, and proceeded in accordance with regular ethical guidelines for administering questionnaires to children.
We randomly selected a number of classrooms in each school, in order to have a sample of all age groups from compulsory secondary education and post-compulsory education, and we asked the teacher for their co-operation. Compulsory education usually finishes the year adolescents turn 16, with a few exceptions.
Adolescents were asked for their co-operation and were informed that data would be treated confidentially and that they were free to refuse. The questionnaires were group administered in their regular classroom. One of their usual teachers and one or two researchers were present during administration to clarify any of the adolescents’ questions that arose.

Sample characteristics
Boys Girls Total
Age
12 282 245 527
13 273 301 574
14 291 350 641
15 254 250 504
16 285 402 687
17 215 247 462
18 50 59 109
Total 1650(47.09%)
1854(52.91%)
3504

RESULTSSelf-categorization as audiovisual media consumers
I never or hardly ever watch/use it
I'm a low consumer
I'm an average
consumer
I'm quite a high
consumer
I'm a very high
consumer Total
Internet
Boy 85 187 397 612 368 1649
Girl 42 162 415 687 540 1846
Total 127 349 812 1299 908 3495
3.63% 9.99% 23.23% 37.17% 25.98% 100%
MobileBoy 363 488 433 251 113 1648
Girl 147 317 535 470 377 1846
Total 510 805 968 721 490 3494
14.60% 23.04% 27.70% 20.64% 14.02% 100%
TV
Boy 65 357 774 363 87 1646
Girl 70 362 914 420 80 1846
Total 135 719 1688 783 167 3492
3.87% 20.69% 48.34% 22.42% 4.78% 100%
Video-games
Boy 138 333 493 416 268 1648
Girl 825 575 265 124 58 1847
Total 963 908 758 540 326 3495
27.55% 25.98% 21.69% 15.45% 9.33% 100%
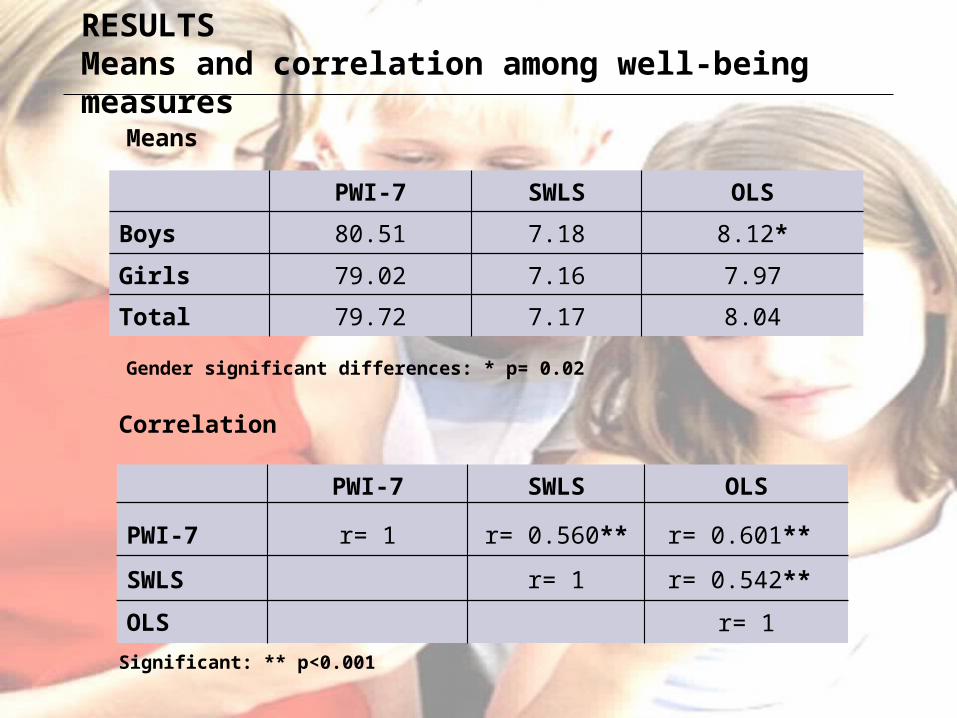
RESULTSMeans and correlation among well-being measures
PWI-7 SWLS OLS
PWI-7 r= 1 r= 0.560** r= 0.601**
SWLS r= 1 r= 0.542**
OLS r= 1
Significant: ** p<0.001
PWI-7 SWLS OLS
Boys 80.51 7.18 8.12*
Girls 79.02 7.16 7.97
Total 79.72 7.17 8.04
Means
Correlation
Gender significant differences: * p= 0.02

RESULTSWell-being measures according to self-categorization as consumers of different audiovisual media
I never or hardly ever watch/use it
I'm a low consumer
I'm an average
consumer
I'm quite a high
consumer
I'm a very high
consumer
TV
PWI-7 81.44 78.68 79.43 81.43 77.94
SWLS 7.15 7.07 7.26 7.12 6.92
OLS 8.03 7.95 8.09 8.06 7.72
Video-games
PWI-7 79.29 78.93 81.83 78.54 80.28
SWLS 7.21 7.14 7.18 7.14 7.19
OLS 7.92 8.02 8.07 8.10 8.22
Internet
PWI-7 78.19 78.89 79.69 78.94 81.40
SWLS 6.88 7.09 7.23 7.21 7.14
OLS 8.02 8.04 8.11 8.02 8.00
Mobile
PWI-7 80.31 78.97 78.93 81.44 80.24
SWLS 7.29 7.07 7.18 7.19 7.15
OLS 8.29 8.01 8.07 7.97 7.85
I never or hardly ever watch/use it
I'm a low consumer
I'm an average
consumer
I'm quite a high
consumer
I'm a very high
consumer
TV
PWI-7 81.44 77.94
SWLS 7.26 6.92
OLS 8.09 7.72
Video-games
PWI-7 81.83 78.54
SWLS 7.21 7.14
OLS 7.92 8.22
Internet
PWI-7 78.19 81.40
SWLS 6.88 7.23
OLS 8.11 8.00
Mobile
PWI-7 78.93 81.44
SWLS 7.29 7.07
OLS 8.29 7.85
TVI never or
hardly ever watch/use it
I'm a low consumer
I'm an average
consumer
I'm quite a high
consumer
I'm a very high
consumer
PWI
Boy 84.4* 80.24* 78.83 83.56 81.26*
Girl 78.78 77.12 79.94 79.58 74.47
Total 81.44 78.68 79.43 81.43 77.94
SWLS
Boy 7.23 7.14 7.22 7.12 7.26*
Girl 7.08 7.00 7.31 7.12 6.56
Total 7.15 7.07 7.26 7.12 6.92
OLS
Boy 8.18 8.09 8.07 8.14 8.47*
Girl 7.88 7.82 8.11 8.00 6.91
Total 8.03 7.95 8.09 8.06 7.72
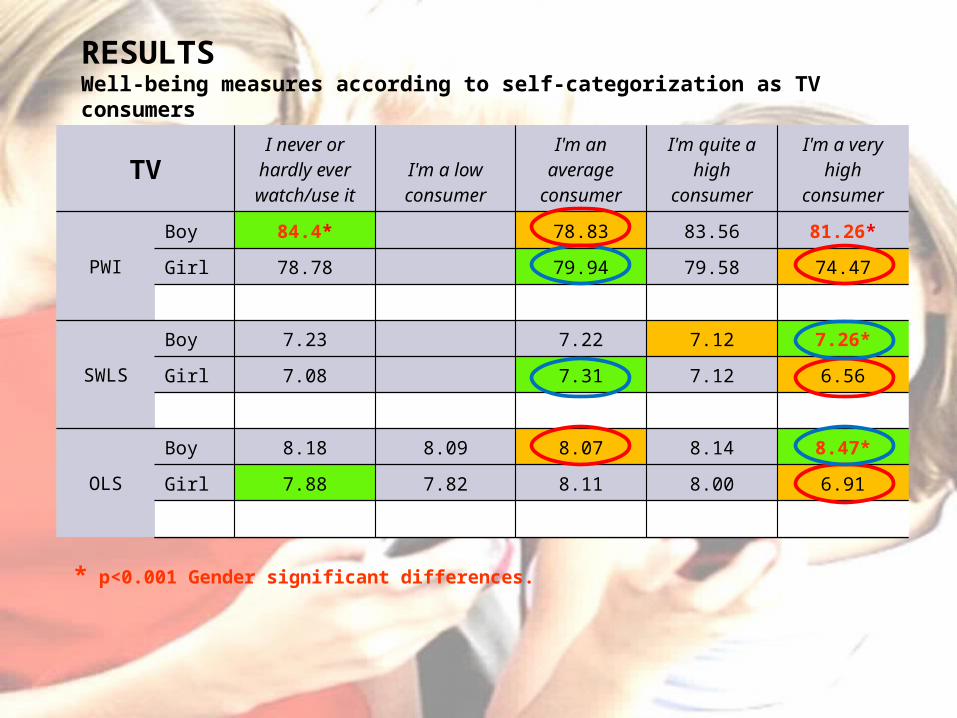
TVI never or
hardly ever watch/use it
I'm a low consumer
I'm an average
consumer
I'm quite a high
consumer
I'm a very high
consumer
PWI
Boy 84.4* 78.83 83.56 81.26*
Girl 78.78 79.94 79.58 74.47
SWLS
Boy 7.23 7.22 7.12 7.26*
Girl 7.08 7.31 7.12 6.56
OLS
Boy 8.18 8.09 8.07 8.14 8.47*
Girl 7.88 7.82 8.11 8.00 6.91
* p<0.001 Gender significant differences.
RESULTSWell-being measures according to self-categorization as TV consumers

VIDEO-GAMES
I never or hardly ever watch/use it
I'm a low consumer
I'm an average
consumer
I'm quite a high
consumer
I'm a very high
consumer
PWI
Boy 80.55 78.87 83.22 78.67 80.25
Girl 79.09 78.96 79.16 78.09 80.39
Total 79.29 78.93 81.83 78.54 80.28
SWLS
Boy 7.20 7.09 7.26 7.14 7.21
Girl 7.21 7.17 7.03 7.17 7.06
Total 7.21 7.14 7.18 7.14 7.19
OLS
Boy 7.91 7.96 8.15 8.13 8.33*
Girl 7.92 8.06 7.93 8.00 7.72
Total 7.92 8.02 8.07 8.1 8.22
VIDEO-GAMES
I never or hardly ever watch/use it
I'm a low consumer
I'm an average
consumer
I'm quite a high
consumer
I'm a very high
consumer
PWI
Boy 83.22 78.67
Girl 78.09 80.39
SWLS
Boy 7.09 7.26
Girl 7.21 7.03
OLS
Boy 7.91 8.33*
Girl 7.93 7.72
* p<0.001 Gender significant differences.
RESULTSWell-being measures according to self-categorization as Video-Games consumers

INTERNETI never or
hardly ever watch/use it
I'm a low consumer
I'm an average
consumer
I'm quite a high
consumer
I'm a very high
consumer
PWI
Boy 79.02 79.21 80.1 78.66 84.98
Girl 76.00 78.53 79.29 79.19 78.99
Total 78.19 78.89 79.69 78.94 81.4
SWLS
Boy 7.09 7.13 7.17 7.14 7.30*
Girl 6.46 7.04 7.28 7.27 7.03
Total 6.88 7.09 7.23 7.21 7.14
OLS
Boy 7.96 8.01 8.12 8.09 8.26**
Girl 8.12 8.07 8.10 7.97 7.82
Total 8.02 8.04 8.11 8.02 8.00
Gender significant differences: * p<0.001 ** p<0.0005
INTERNETI never or
hardly ever watch/use it
I'm a low consumer
I'm an average
consumer
I'm quite a high
consumer
I'm a very high
consumer
PWI
Boy 78.66 84.98
Girl 76.00 79.29
SWLS
Boy 7.09 7.30*
Girl 6.46 7.28
OLS
Boy 7.96 8.26**
Girl 8.12 7.82
RESULTSWell-being measures according to self-categorization as Internet consumers

MOBILEI never or
hardly ever watch/use it
I'm a low consumer
I'm an average
consumer
I'm quite a high
consumer
I'm a very high
consumer
PWI
Boy 79.30 78.62 79.36 86.75 82.63*
Girl 82.82* 77.98 78.57 78.6 79.56
Total 80.31 78.97 78.93 81.44 80.24
SWLS
Boy 7.21 7.07 7.14 7.30 7.49*
Girl 7.51 7.08 7.22 7.13 7.06
Total 7.29 7.07 7.18 7.19 7.15
OLS
Boy 8.20 8.01 8.09 8.14 8.35**
Girl 8.51 8.01 8.05 7.88 7.70
Total 8.29 8.01 8.07 7.97 7.85
Gender significant differences: * p<0.001 ** p<0.0005
MOBILEI never or
hardly ever watch/use it
I'm a low consumer
I'm an average
consumer
I'm quite a high
consumer
I'm a very high
consumer
PWI
Boy 79.30 86.75 82.63*
Girl 82.82* 77.98
SWLS
Boy 7.07 7.49*
Girl 7.51 7.06
OLS
Boy 8.01 8.35**
Girl 8.51 7.70
RESULTSWell-being measures according to self-categorization as mobile phone consumers
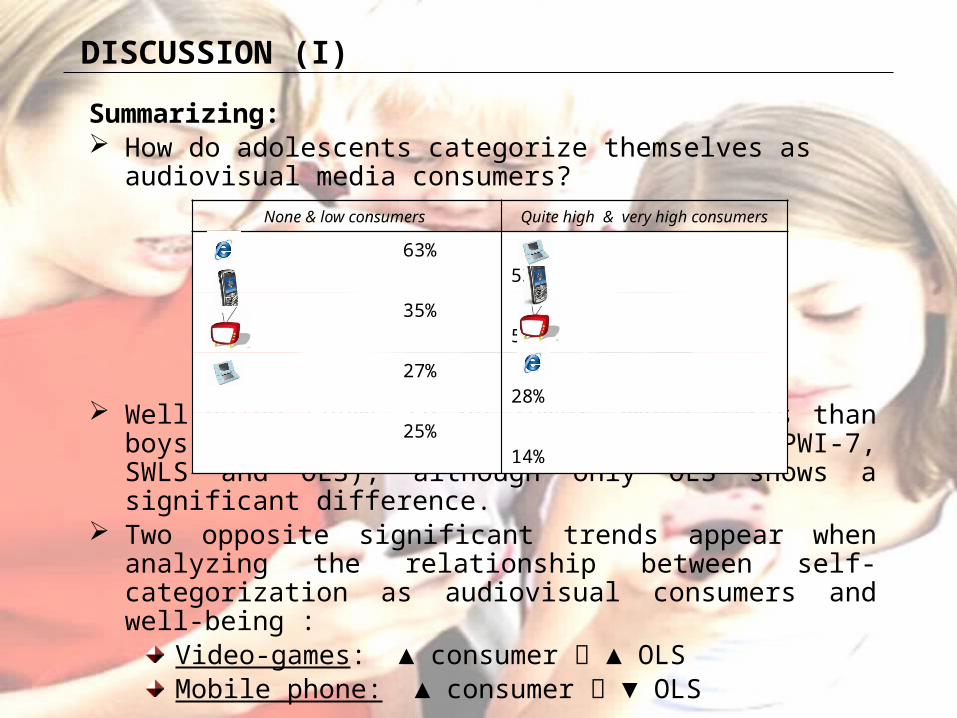
DISCUSSION (I)
Summarizing: How do adolescents categorize themselves as audiovisual
media consumers?
Well-being seems to be lower among girls than boys according to the 3 indicators used (PWI-7, SWLS and OLS), although only OLS shows a significant difference.
Two opposite significant trends appear when analyzing the relationship between self-categorization as audiovisual consumers and well-being :
Video-games: ▲ consumer ▲ OLSMobile phone: ▲ consumer ▼ OLS
None & low consumers Quite high & very high consumers
63% 53%
35% 52%
27% 28%
25% 14%
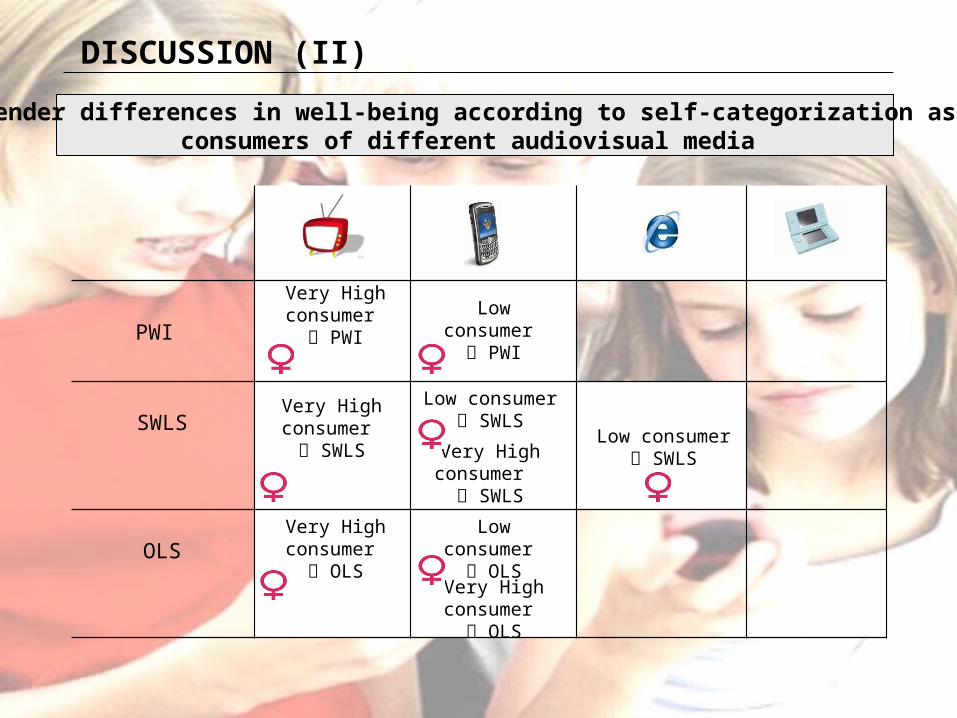
DISCUSSION (II)
Gender differences in well-being according to self-categorization as consumers of different audiovisual media
Very High consumer
PWIPWI
SWLS
OLS
Very High consumer
SWLS
Very High consumer
OLS
Low consumer SWLS
Low consumer
PWI
Low consumer SWLS
Low consumer
OLS
Very High consumer
SWLS
Very High consumer
OLS
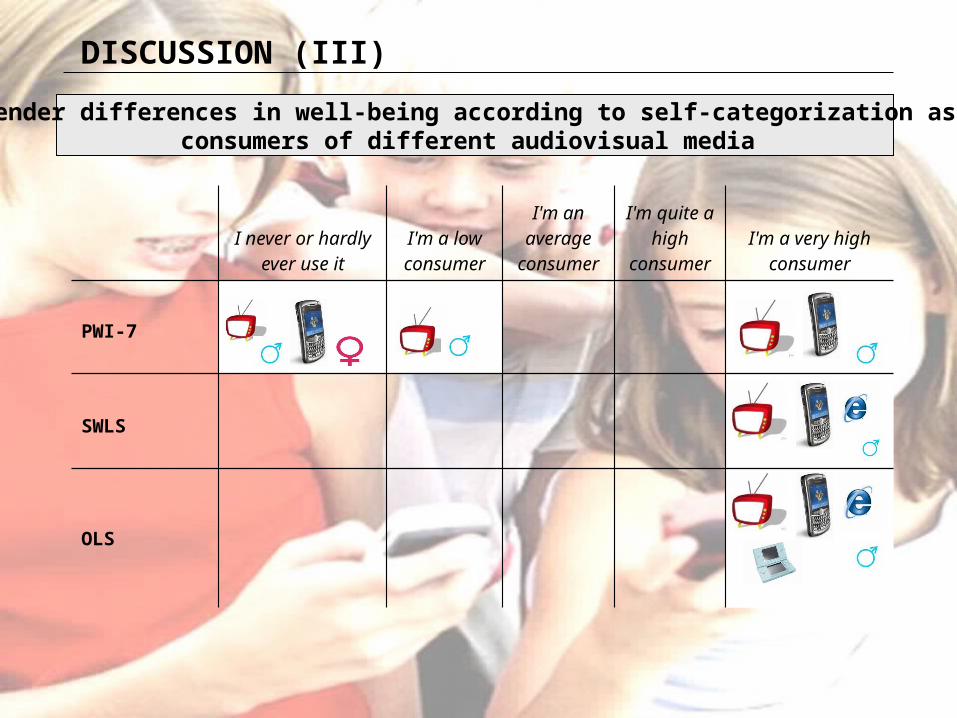
DISCUSSION (III)
Gender differences in well-being according to self-categorization as consumers of different audiovisual media
I never or hardly
ever use itI'm a low consumer
I'm an average
consumer
I'm quite a high
consumerI'm a very high
consumer
PWI-7
SWLS
OLS
DISCUSSION (IV)
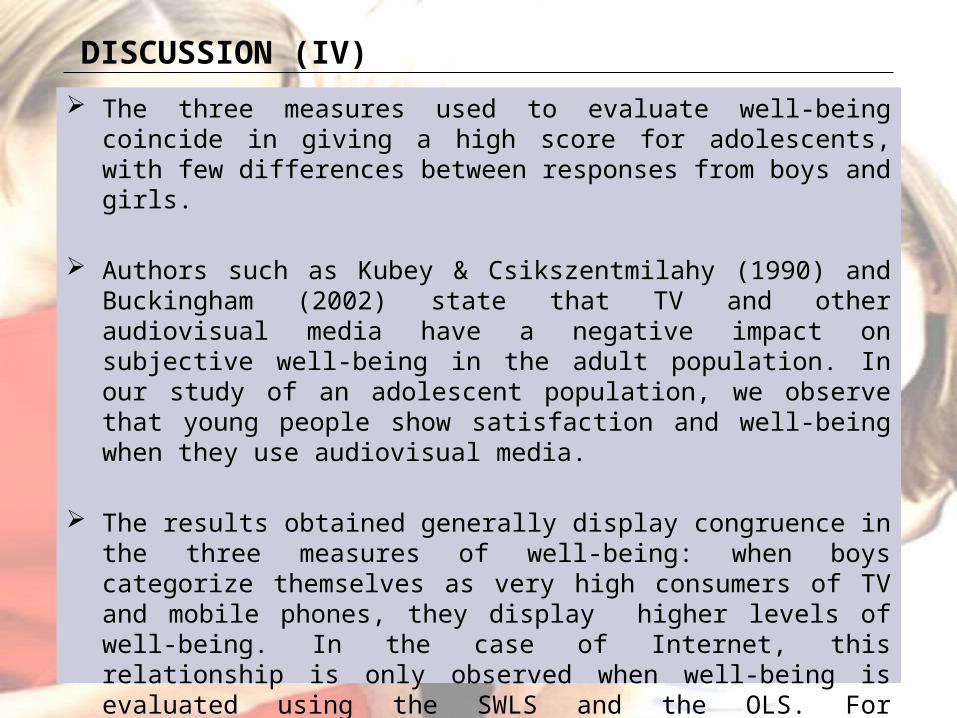
The three measures used to evaluate well-being coincide in giving a high score for adolescents, with few differences between responses from boys and girls.
Authors such as Kubey & Csikszentmilahy (1990) and Buckingham (2002) state that TV and other audiovisual media have a negative impact on subjective well-being in the adult population. In our study of an adolescent population, we observe that young people show satisfaction and well-being when they use audiovisual media.
The results obtained generally display congruence in the three measures of well-being: when boys categorize themselves as very high consumers of TV and mobile phones, they display higher levels of well-being. In the case of Internet, this relationship is only observed when well-being is evaluated using the SWLS and the OLS. For videogames, the indicators only coincide when young people categorize themselves as average consumers.

DISCUSSION (VII)
These differences indicate that some of the results obtained vary according to the instrument used to explore well-being.
Future research should carry out a more in-depth analysis of gender differences using other types of statistical analysis.
It would also be interesting to explore reasons why well-being among adolescents in some cases differs according to the well-being measure used.
Furthermore, other multidimensional quantitative measures and qualitative research techniques might also be used.
BIBLIOGRAPHY
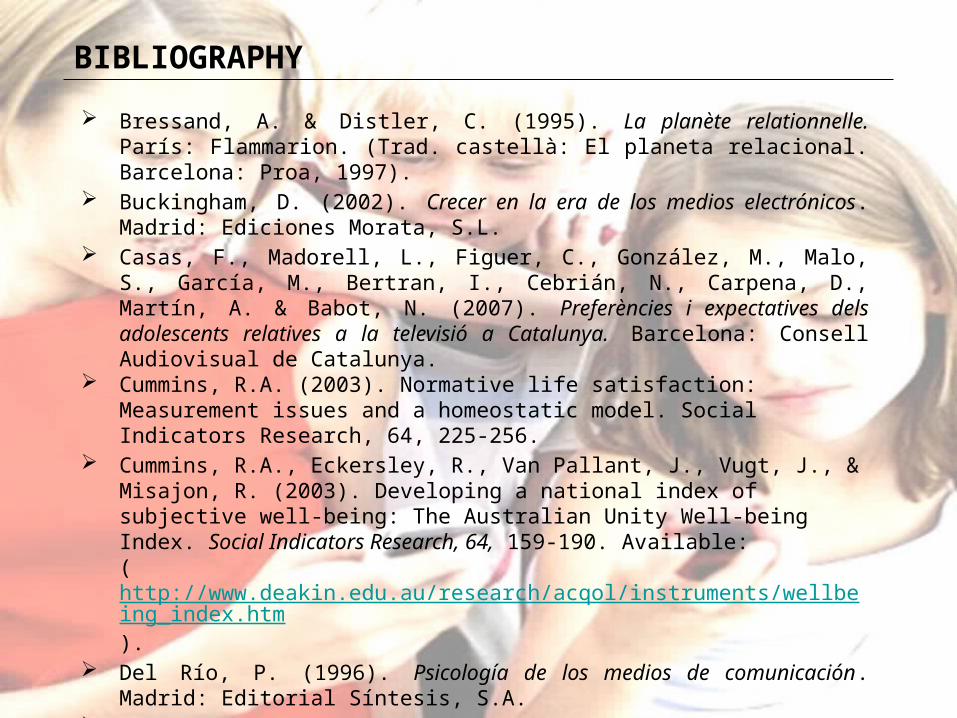
Bressand, A. & Distler, C. (1995). La planète relationnelle. París: Flammarion. (Trad. castellà: El planeta relacional. Barcelona: Proa, 1997).
Buckingham, D. (2002). Crecer en la era de los medios electrónicos. Madrid: Ediciones Morata, S.L.
Casas, F., Madorell, L., Figuer, C., González, M., Malo, S., García, M., Bertran, I., Cebrián, N., Carpena, D., Martín, A. & Babot, N. (2007). Preferències i expectatives dels adolescents relatives a la televisió a Catalunya. Barcelona: Consell Audiovisual de Catalunya.
Cummins, R.A. (2003). Normative life satisfaction: Measurement issues and a homeostatic model. Social Indicators Research, 64, 225-256.
Cummins, R.A., Eckersley, R., Van Pallant, J., Vugt, J., & Misajon, R. (2003). Developing a national index of subjective well-being: The Australian Unity Well-being Index. Social Indicators Research, 64, 159-190. Available:(http://www.deakin.edu.au/research/acqol/instruments/wellbeing_index.htm).
Del Río, P. (1996). Psicología de los medios de comunicación. Madrid: Editorial Síntesis, S.A.
Diener, E., Emmons, R., Larsen, R. & Smith, H.L. (1985). The satisfaction with life scale. Journal of Personality Assessment, 49 (1), 71-75.
Kubey, R. & Csikszentmihalyi, M. (1990). Television and quality of life: How viewing everyday experience. Hillsdale, New Jersey: Erlbaum.

THANKS TO
The authors acknowledge the financial support of the Spanish Ministry of Education and Science through the National Plan of Scientific Research, Development and Technological Innovation, for research project, with reference SEJ2007-62813/PSIC.

Subjective well-being among Spanish adolescents according to their self-categorization as audiovisual media consumers
Ferran Casas, Sara Malo, Irma Bertran, Carme Montserrat & Mònica González
http://www.udg.edu/eridiqv


![191_manual de Consenso Sfc Ferran[1]](https://img.pdfslide.us/doc/110x75/5571f33e49795947648db852/191manual-de-consenso-sfc-ferran1.jpg)