Embed Size (px)
Citation preview
HAL Id: hal-01510926https://hal.archives-ouvertes.fr/hal-01510926
Submitted on 20 Apr 2017
HAL is a multi-disciplinary open accessarchive for the deposit and dissemination of sci-entific research documents, whether they are pub-lished or not. The documents may come fromteaching and research institutions in France orabroad, or from public or private research centers.
L’archive ouverte pluridisciplinaire HAL, estdestinée au dépôt et à la diffusion de documentsscientifiques de niveau recherche, publiés ou non,émanant des établissements d’enseignement et derecherche français ou étrangers, des laboratoirespublics ou privés.
The street as an area of human exposure in anearthquake aftermath: the case of Lorca, Spain, 2011
Marc Bertran Rojo, Elise Beck, Céline Lutoff
To cite this version:Marc Bertran Rojo, Elise Beck, Céline Lutoff. The street as an area of human exposure in an earth-quake aftermath: the case of Lorca, Spain, 2011. Natural Hazards and Earth System Sciences, Coper-nicus Publ. / European Geosciences Union, 2017, 17 (4), pp.581-594. �10.5194/nhess-17-581-2017�.�hal-01510926�
Nat. Hazards Earth Syst. Sci., 17, 581–594, 2017www.nat-hazards-earth-syst-sci.net/17/581/2017/doi:10.5194/nhess-17-581-2017© Author(s) 2017. CC Attribution 3.0 License.
The street as an area of human exposure in an earthquakeaftermath: the case of Lorca, Spain, 2011Marc Bertran Rojo, Elise Beck, and Céline LutoffPACTE-Université de Grenoble-Alpes, PACTE UMR 5194 (CNRS, IEPG, UJF, UPMF),Grenoble, 38041, France
Correspondence to: Marc Bertran Rojo ([email protected])
Received: 31 March 2016 – Discussion started: 10 May 2016Revised: 23 February 2017 – Accepted: 8 March 2017 – Published: 19 April 2017
Abstract. The earthquake which struck the city of Lorca,Spain, on 11 May 2011 killed 9 people, injured over 300and caused considerable damage, including one collapsedbuilding. Streets near buildings were the main danger areasfor people. This article proposes an dynamic ad hoc spatio-temporal method for studying individual evacuation after anearthquake. Its application to the Lorca case shows the spatialand temporal variability of individual exposure levels in thestreet during the hours following the shock. As yet little stud-ied, human exposure deserves more attention, particularly inzones of moderate seismicity like the Euro-Mediterraneanarea. The results of this study could be helpful for enhanc-ing the evacuation planning after an earthquake, stressing thespecific dangers in the street.
1 Introduction
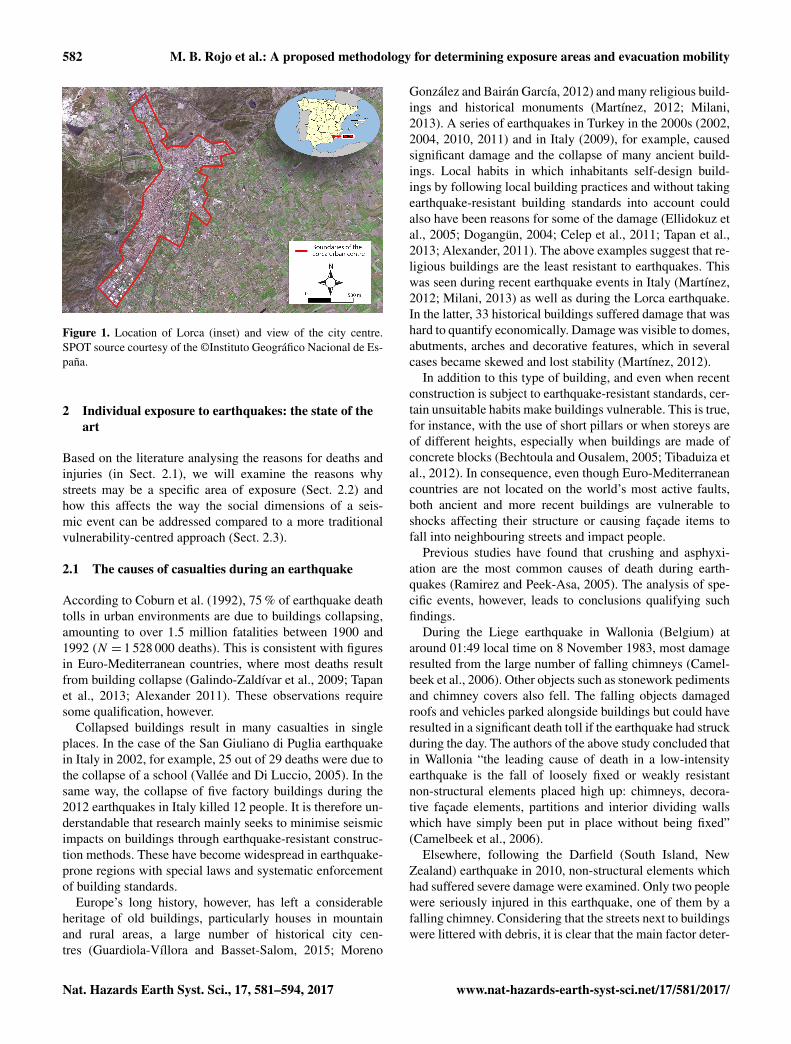
On 11 May 2011, exactly 2 months after the Fukushima dis-aster in Japan, a two-shock earthquake struck the city ofLorca, located about 60 km southwest of Murcia in southernSpain. The earthquake mainly affected the city centre, hometo 60 000 of the municipality’s 90 000 inhabitants (Fig. 1).The Lorca earthquake was not one of the deadliest in theMediterranean area but did display several novel features.
The Iberian peninsula had not experienced such a deadlyearthquake since 1956, when an earthquake killed 13 peoplein southeast Spain, near the city of Granada (Solares, 2012).In 2011, the magnitude Mw 5.2 Lorca earthquake occurredat around 18.47 h local time (16.47 h GMT), after anothermagnitude Mw 4.6 foreshock had occurred almost 2 h before.With an epicentre intensity of VII (EMS-98), the quake killed
9 people and injured 300. One building collapsed completelyand 1164 others were severely damaged. Economic losseswere estimated by Lorca municipality at EUR 1 200 millionin November 2011 (Oterino et al., 2012). The casualties werecaused in streets near buildings and were due not to col-lapsing buildings but to falling cornices, balconies and otherfaçade elements (Martínez Moreno et al., 2012).
The shock lasted only a few seconds, developing a max-imum acceleration of 0.37 g, as recorded in the city 3 kmfrom the epicentre. It was the highest acceleration recordedin Spain since the first accelerometers were installed in theregion in 1984 (Rodríguez et al., 2011). Site effects, shallowfocal depth, high acceleration and the relatively high vulner-ability of infrastructure seem to be the main factors explain-ing the damage (Díaz, 2012). They probably helped restrictdamage to the city itself, as there was hardly any visible dam-age only a few kilometres outside the city limits. The nearestoutside measuring station, located 24 km from the epicentre,actually recorded a peak acceleration of only 0.02 g, nearly20 times less than that recorded inside the city (Oterino et al.,2012).
In Lorca, casualties mainly occurred outdoors (outside thebuildings), whereas they are usually found under the ruins ofdamaged buildings (Coburn et al., 1992). Hence, we focus onthe individuals’ exposure over the time, along the main pub-lic areas. Following other recent studies, we chose to adaptthe most common approach that primarily examines struc-tural defects caused by earthquakes and how these can causecausalities (Quagliarini et al., 2016; Ferreira, et al., 2014).
Published by Copernicus Publications on behalf of the European Geosciences Union.
582 M. B. Rojo et al.: A proposed methodology for determining exposure areas and evacuation mobility
Figure 1. Location of Lorca (inset) and view of the city centre.SPOT source courtesy of the ©Instituto Geográfico Nacional de Es-paña.
2 Individual exposure to earthquakes: the state of theart
Based on the literature analysing the reasons for deaths andinjuries (in Sect. 2.1), we will examine the reasons whystreets may be a specific area of exposure (Sect. 2.2) andhow this affects the way the social dimensions of a seis-mic event can be addressed compared to a more traditionalvulnerability-centred approach (Sect. 2.3).
2.1 The causes of casualties during an earthquake
According to Coburn et al. (1992), 75 % of earthquake deathtolls in urban environments are due to buildings collapsing,amounting to over 1.5 million fatalities between 1900 and1992 (N = 1 528 000 deaths). This is consistent with figuresin Euro-Mediterranean countries, where most deaths resultfrom building collapse (Galindo-Zaldívar et al., 2009; Tapanet al., 2013; Alexander 2011). These observations requiresome qualification, however.
Collapsed buildings result in many casualties in singleplaces. In the case of the San Giuliano di Puglia earthquakein Italy in 2002, for example, 25 out of 29 deaths were due tothe collapse of a school (Vallée and Di Luccio, 2005). In thesame way, the collapse of five factory buildings during the2012 earthquakes in Italy killed 12 people. It is therefore un-derstandable that research mainly seeks to minimise seismicimpacts on buildings through earthquake-resistant construc-tion methods. These have become widespread in earthquake-prone regions with special laws and systematic enforcementof building standards.
Europe’s long history, however, has left a considerableheritage of old buildings, particularly houses in mountainand rural areas, a large number of historical city cen-tres (Guardiola-Víllora and Basset-Salom, 2015; Moreno
González and Bairán García, 2012) and many religious build-ings and historical monuments (Martínez, 2012; Milani,2013). A series of earthquakes in Turkey in the 2000s (2002,2004, 2010, 2011) and in Italy (2009), for example, causedsignificant damage and the collapse of many ancient build-ings. Local habits in which inhabitants self-design build-ings by following local building practices and without takingearthquake-resistant building standards into account couldalso have been reasons for some of the damage (Ellidokuz etal., 2005; Dogangün, 2004; Celep et al., 2011; Tapan et al.,2013; Alexander, 2011). The above examples suggest that re-ligious buildings are the least resistant to earthquakes. Thiswas seen during recent earthquake events in Italy (Martínez,2012; Milani, 2013) as well as during the Lorca earthquake.In the latter, 33 historical buildings suffered damage that washard to quantify economically. Damage was visible to domes,abutments, arches and decorative features, which in severalcases became skewed and lost stability (Martínez, 2012).
In addition to this type of building, and even when recentconstruction is subject to earthquake-resistant standards, cer-tain unsuitable habits make buildings vulnerable. This is true,for instance, with the use of short pillars or when storeys areof different heights, especially when buildings are made ofconcrete blocks (Bechtoula and Ousalem, 2005; Tibaduiza etal., 2012). In consequence, even though Euro-Mediterraneancountries are not located on the world’s most active faults,both ancient and more recent buildings are vulnerable toshocks affecting their structure or causing façade items tofall into neighbouring streets and impact people.
Previous studies have found that crushing and asphyxi-ation are the most common causes of death during earth-quakes (Ramirez and Peek-Asa, 2005). The analysis of spe-cific events, however, leads to conclusions qualifying suchfindings.
During the Liege earthquake in Wallonia (Belgium) ataround 01:49 local time on 8 November 1983, most damageresulted from the large number of falling chimneys (Camel-beek et al., 2006). Other objects such as stonework pedimentsand chimney covers also fell. The falling objects damagedroofs and vehicles parked alongside buildings but could haveresulted in a significant death toll if the earthquake had struckduring the day. The authors of the above study concluded thatin Wallonia “the leading cause of death in a low-intensityearthquake is the fall of loosely fixed or weakly resistantnon-structural elements placed high up: chimneys, decora-tive façade elements, partitions and interior dividing wallswhich have simply been put in place without being fixed”(Camelbeek et al., 2006).
Elsewhere, following the Darfield (South Island, NewZealand) earthquake in 2010, non-structural elements whichhad suffered severe damage were examined. Only two peoplewere seriously injured in this earthquake, one of them by afalling chimney. Considering that the streets next to buildingswere littered with debris, it is clear that the main factor deter-
Nat. Hazards Earth Syst. Sci., 17, 581–594, 2017 www.nat-hazards-earth-syst-sci.net/17/581/2017/
M. B. Rojo et al.: A proposed methodology for determining exposure areas and evacuation mobility 583
mining the low number of casualties was that the earthquakestruck at 04:35 (Dhakal, 2010).
Even if building collapse is one of the main causes of deathduring an earthquake, the exposure of people on streets andnear buildings should also be regarded as a significant fac-tor, especially in regions of moderate seismic activity. Someof the latest research has in fact refined the environmentalcharacteristics people are faced with after an earthquake anddrawn a distinction between internal and external damage(Quagliarini et al., 2016). In the Afyon (Turkey) earthquakein 2002, the death toll was higher indoors than outdoors, butthe difference was not statistically significant (Ellidokuz etal., 2005). Other accounts of the same earthquake stressedthat many non-structural elements of buildings suffered se-vere damage. The most frequently observed problem comesfrom the flimsiness of dividing walls not included in initialarchitectural plans and added later (Tapan et al., 2013).
In the Lorca case only one building collapsed, with no-body being injured inside (the investigations did not give usenough details for understanding why). The people injuredwere those struck in the street near buildings. Once again, in-juries were not due to buildings collapsing but to falling cor-nices, balconies and other façade and roofing items (MartínezMoreno et al., 2012).
2.2 Exposure in the street
Putting people at the centre of a study requires paying closeattention to the new surroundings people find themselves inthe aftermath of an earthquake. A number of psycholog-ical and medical papers have listed typologies of injuriesand traumas caused by earthquakes. Some have investigatedthe origins of injuries (Ellidokuz et al., 2005; Armenian etal., 1997; Chou et al., 2004). A few have described peo-ple’s behaviour following an earthquake and examined thereasons for it by assessing perceptions of danger (Bolton,1993; Weiss et al., 2011; Goltz et al., 1992). In Japan, whereclosed-circuit camera surveillance is widespread, a new lineof research seeks to analyse individual behaviour during theearthquake itself and during subsequent mass evacuations(Yang et al., 2011). Such studies enable clear differences tobe seen between real-life escape panic and the mimicry dis-played during simulated exercises. Observational data on in-dividual evacuation behaviour remain rare, however. It is forthis reason that a number of recent initiatives have soughtto create video databases. Analysing images enables be-havioural models to be defined and people’s movements insuch situations to be more accurately quantified (Bernardiniet al., 2016b).
After an earthquake such as that in Lorca, people haveto adapt immediately to more or less altered surroundings.Awareness of the new situation and subsequent decision-making processes are linked to individual and collectiveassessments of the new environment (Weiss et al., 2011).Nevertheless, in a troubled situation (especially with distur-
bances to electrical and telephone networks), this is mainlydone when people physically go to see what has happened,thus increasing individual mobility. Such movements maytake place near weakened buildings, however, leading to in-creased individual exposure.
In order to analyse the exposure of individuals in the street,it is therefore necessary to understand how people move fromthe moment of the earthquake up to the time they reach asafe area (outside the city in the Lorca case). To this end,our study resorted to an approach proposed by time geog-raphy, which observes individuals and their daily journeysand activities over time and through space. This methodol-ogy has been developing since the 1960s to evaluate peo-ple’s daily mobility at a local scale, usually an urban area(Chardonnel and Stock, 2005; Thevenin et al., 2007). In or-der to observe and represent people’s movements in their en-vironments as accurately as possible, we used the conceptof spatio-temporal trajectories developed by time geography.This approach enables mobility to be represented as a suc-cession of places or positions and journeys to be defined pre-cisely in time and space. It therefore seems very suitable foranalysing people’s mobility during a disaster (André-Poyaudet al., 2009) and has been tested for other types of suddenevent such as flash floods (Debionne et al., 2016).
Over the last decade much work has been done in order tounderstand warning processes and how people adapt to en-vironments altered by sudden rises in water levels (Ruin andLutoff, 2004; Ruin, 2007; Ruin et al., 2008; Creutin et al.,2009; Créton-Cazanave and Lutoff, 2013; Ruin et al., 2013;Calianno et al., 2013). A specific methodology for collectingand analysing data has been developed by these studies. Theanalysis of several flood events found that people’s mobil-ity and their location on roads and streets were determiningfactors in their exposure (Ruin, 2007). The fact that peopleare able to, have to or want to move during a flood can thusput individual lives in danger. Our question was whether thiswould be similar for earthquakes. We therefore applied themobility analysis method for flash floods to the Lorca earth-quake in order to examine the conditions for exposure duringa seismic crisis.
Finally, to evaluate the exposure of people in the streets,it is necessary to identify the area of exposure due to de-bris falling from buildings. A number of exhaustive stud-ies have used aerial photographs to analyse and digitalisedisaster areas caused by earthquakes (indoors and outdoors)(Quagliarini et al., 2016). In Lorca, unfortunately, this couldnot be done as the streets and roads had been clearedvery quickly in order to allow emergency vehicles to movearound. As far as we have been able to establish, there are nopictures of debris in Lorca just after the earthquake. In ad-dition, only one building actually collapsed during the earth-quake. Other studies incorporate the area covered by debrisinto their analysis of people’s behaviour after an earthquake(D’Orazio et al., 2014). Such work uses a large quantity ofvideo images, however, and focuses on the actual time of
www.nat-hazards-earth-syst-sci.net/17/581/2017/ Nat. Hazards Earth Syst. Sci., 17, 581–594, 2017
584 M. B. Rojo et al.: A proposed methodology for determining exposure areas and evacuation mobility
shaking and the immediate aftermath of the shock (a fewminutes only).
2.3 Exposure vs. vulnerability
Our focus on the concept of exposure requires theoretical ex-planations of the geography of hazards.
The literature on the social approach to hazards – espe-cially in geography – tends to concentrate on the concept ofvulnerability but only rarely focuses on exposure. Accordingto Reghezza (2006), “The approach centred on vulnerabilityleaves exposure with a secondary role, especially because ofthe difficulties in characterising the interaction between theelement exposed and the event” (our translation). Our goalwas to deal with these difficulties and analyse the fluctuationsof human exposure in the time and space of a seismic crisis.We therefore relied on Leone’s (2007) definition of exposureas a spatial and temporal co-incidence between a hazard andan individual.
To meet our goal it was necessary to take a dynamic ratherthan a static approach. The issue was to analyse how peo-ple become exposed after an earthquake depending on theirmovements and the way in which the earthquake will havealtered the built environment. The alteration of the environ-ment after an earthquake modifies individuals’ behaviour.This is the reason why current predictive models of be-haviour during a crisis increasingly incorporate environmen-tal elements such as the external damage caused by the earth-quake (Quagliarini et al., 2016).
Analysing exposure thus requires a dynamic approach totake into account the spatial and temporal dimensions both ofpeople’s journeys and of the threat (Chardonnel and Stock,2005). An example of this type of dynamic approach wasshown at a small historical site in Japan with 21 inhabitants.The study enabled an individual evacuation plan to be drawnup, with possible scenarios adapted to each person (with orwithout mobility problems) and to each dwelling (Mishimaet al., 2014). In our case the temporal window we analysedcorresponded to the time taken by individual respondentsto evacuate the ruined city. The spatial dimension was de-termined by the extent of the damage, which in Lorca wasconcentrated in the city centre (Fig. 1) (Alfaro et al., 2011;Tibaduiza et al., 2012). This definition of the spatio-temporalwindow to be observed led to a more precise definition of theconcept of evacuation, to wit, evacuation means leaving thearea impacted by the earthquake and thus reducing exposureby increasing one’s distance from buildings weakened by theearthquake. This definition was adopted to account for thespecific features of our case study. When a person reacheda “safe area” inside the city, he or she was temporarily safe.Before being able to reach the exterior of the city, however, amajority of respondents explained that they had to re-exposethemselves to danger by passing alongside weakened build-ings. Consequently, the limits of our study’s time windowcorresponded to the evacuation of the city for each individ-
ual, which allowed us to define the temporality of what weconsidered to be the seismic crisis.
Works focusing on crisis periods are not new. Researchundertaken in the late 1980s and early 1990s highlightedthe importance of addressing seismic crisis periods (Quar-antelli, 1982; Goltz et al., 1992; Bolton, 1993). These stud-ies – mostly quantitative and based on large sample groups– tend to focus on individuals’ main actions, on the damagesuffered and the reasons causing people to evacuate. Theyhave contributed statistically significant information enhanc-ing the understanding of affected individuals’ main activities,but the information is disconnected from the time and placein which the activities occurred. Only a few recent studieshave analysed differences in exposure according to the activ-ities carried out, i.e. have assessed whether the activities ledto an increase or decrease in human exposure or whether theyhad no influence on it (Bernardini et al., 2016a). The presentpaper proposes a methodology for the dynamic analysis ofhuman exposure during the moderate earthquakes that occurin the Euro-Mediterranean context.
3 Methodology for analysing dynamic exposure
This section describes the details of the present paper datacollection methodology (Sect. 3.1). Two different analyticalmethods will also be described: a spatial analysis of expo-sure (Sect. 3.2) and a temporal analysis of exposure usingactograms (Sect. 3.3).
In both cases, the spatio-temporal window retained for theanalysis included the seismic crisis period as it occurred inLorca city centre. Our focus will be on a sample of individ-uals who were inside the city when the earthquake struckuntil the time they were evacuated outside the city. When re-spondents were outside the affected area (Fig. 1), they wereconsidered to have no longer been in a seismic crisis periodand no further data on them were collected. Nevertheless, asshown below, respondents were exposed more or less con-stantly while inside the city, which for the purposes of thisstudy corresponded to the crisis period.
3.1 Data
Data were collected in two stages. The first one took place4 days after the earthquake and was a field trip to preparethe interview stage. It enabled observations on participationto be made, authorities to be contacted and visual material(photographs and videos) to be produced in the immediatepost-crisis period. The second stage was made 9 months afterthe event to carry out interviews.
We carried out 20 interviews of Lorca residents using qual-itative enquiries focusing on how people had reacted duringthe crisis (Ruin et al., 2013). As we already pointed out, othersimilar works are based on the same number of individuals
Nat. Hazards Earth Syst. Sci., 17, 581–594, 2017 www.nat-hazards-earth-syst-sci.net/17/581/2017/
M. B. Rojo et al.: A proposed methodology for determining exposure areas and evacuation mobility 585
(Mishima et al., 2014). In all we interviewed 8 men and 12women aged 24 to 80, 9 of them with dependent children.
We used snowball sampling techniques while seeking thewidest possible diversity of spatial situations despite the lim-ited number of respondents. As in other studies, respondentswere required to fulfil two conditions: to be residents ofLorca and to have been present in Lorca during the earth-quake (Prati et al., 2012).
The interviews enabled us to describe and map all thejourneys each respondent made between the first shock(11 May 2011 at 17:05 LT, local time) and the evacuation ofthe city. A great deal of spatial parameters can influence peo-ple’s behaviour, such as place of residence, workplace andthe situation when the first and second shocks occurred. Fol-lowing more conventional vulnerability parameters noted inthe literature, we also attempted to obtain a diversity of re-spondents in terms of age and gender (Cutter et al., 2000).From this sample group we collected a database of 229 activ-ities and 115 journeys which had occurred during the seismiccrisis period.
To collect data we adapted an interview grid originally de-veloped for the analysis of mobility behaviour during flashfloods (Ruin et al., 2013). The grid was based on a chrono-logical scale on which time is split into a succession of placesor positions and journeys. For each of these we asked abouta number of qualitative details linked to a precise spaceand time for each respondent. We thus collected addresses,timetables and details of the activities undertaken and withwhom. For journeys we noted the means of transport, howand why itineraries may have been modified (such as a detourto see the state of a property) and abnormal characteristics ofitineraries such as traffic jams. This grid allowed us to workwith precise time schedules (“I remember calling my son at08:14”) or durations by default (“I don’t know what time Igot there but I usually do this trip in 15 min”).
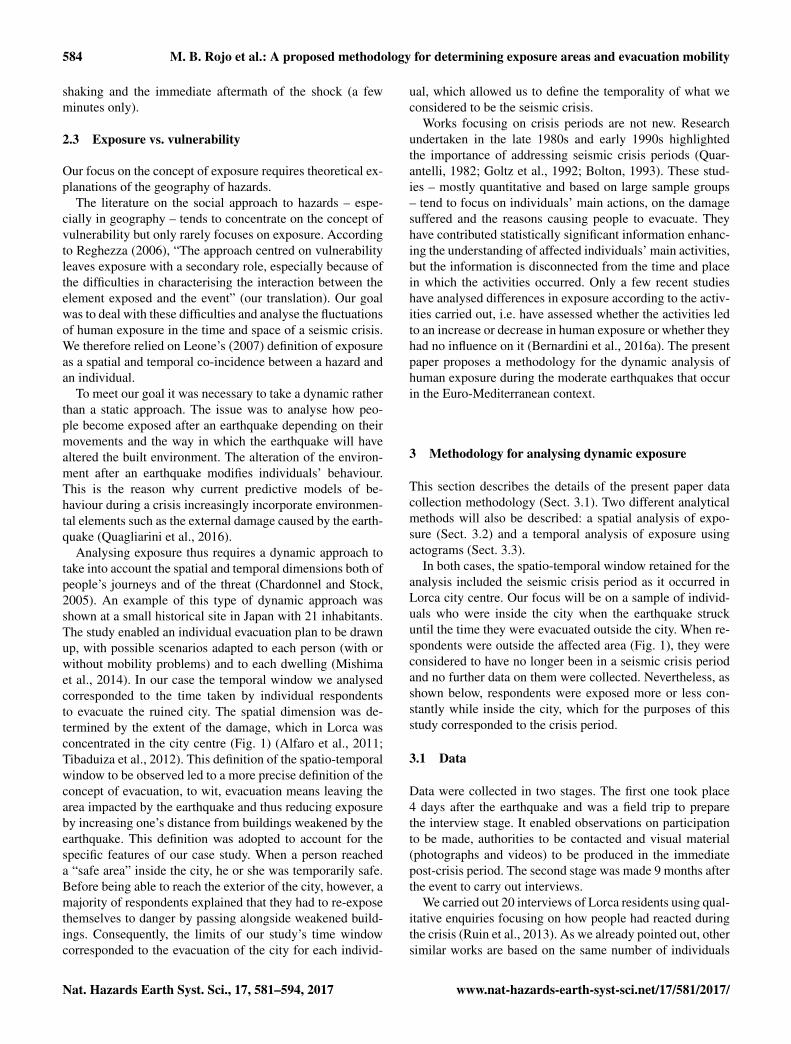
While completing the grid with the respondents, we drewa map of their itineraries, the places they went to and theplaces where they had experienced the earthquake (Fig. 2).Using the map during the interviews allowed people to re-member the details of their journey better and to specify timeschedules more precisely. It also allowed them to have betterrecall of the way journeys were modified by the event (e.g.avoiding streets that were blocked by debris or cut off).
3.2 Spatial analysis of exposure
In this section, we present the spatial data created and com-piled (Sect. 3.2.1), the method for estimating the dimensionsof exposure areas (Sect. 3.2.2) and finally the creation of thespatial database (Sect. 3.2.3).
3.2.1 GIS data (journeys and damaged buildings)
Based on the 20 individual interviews, journeys made duringthe time window were digitalised. With the aim of identifying
Figure 2. Example of the itinerary map drawn during one of theinterviews. Base map: Lorca shopkeeper directory.
spatial consistency between individuals and hazards – andthus exposure – we merged two layers of information usingGIS software. We provide details here of the two layers andthe related information.
a. Individual journeys
This layer contains all the journeys performed by the 20 re-spondents. The digitalisation protocol described here was de-fined to standardise the layer.
All individuals walk in the same path: we supposed thatindividuals walking on the same road, in the same square orin the same open space were taking exactly the same path.This simplification offers greater data homogeneity from aspatial point of view.
Regarding entering or leaving a building, the minimumegress time from a building (initial position of evacuees)is considered 60 s. This was done so as not to exclude anyinside-to-outside journeys.
b. Characterising damaged buildings
The second layer consists of the altered environment charac-terising the dangers due to buildings weakened by the earth-quake and liable to collapse partially or totally during an af-tershock.
Following the second earthquake, several teams of archi-tects, engineers and volunteers undertook an emergency eval-uation of the state of the buildings in Lorca and the surround-ing area. The objective of this preliminary evaluation was toestimate buildings’ safety and habitability and to detect anyextremely dangerous buildings (González López, 2012).
Following each evaluation, a coloured mark was madeat the entrance of buildings to indicate the degree of dan-ger. This information was extremely valuable as it de-tailed the state of buildings immediately after the earth-quake. Data were provided by the Servicio de Urbanismo de
www.nat-hazards-earth-syst-sci.net/17/581/2017/ Nat. Hazards Earth Syst. Sci., 17, 581–594, 2017
586 M. B. Rojo et al.: A proposed methodology for determining exposure areas and evacuation mobility
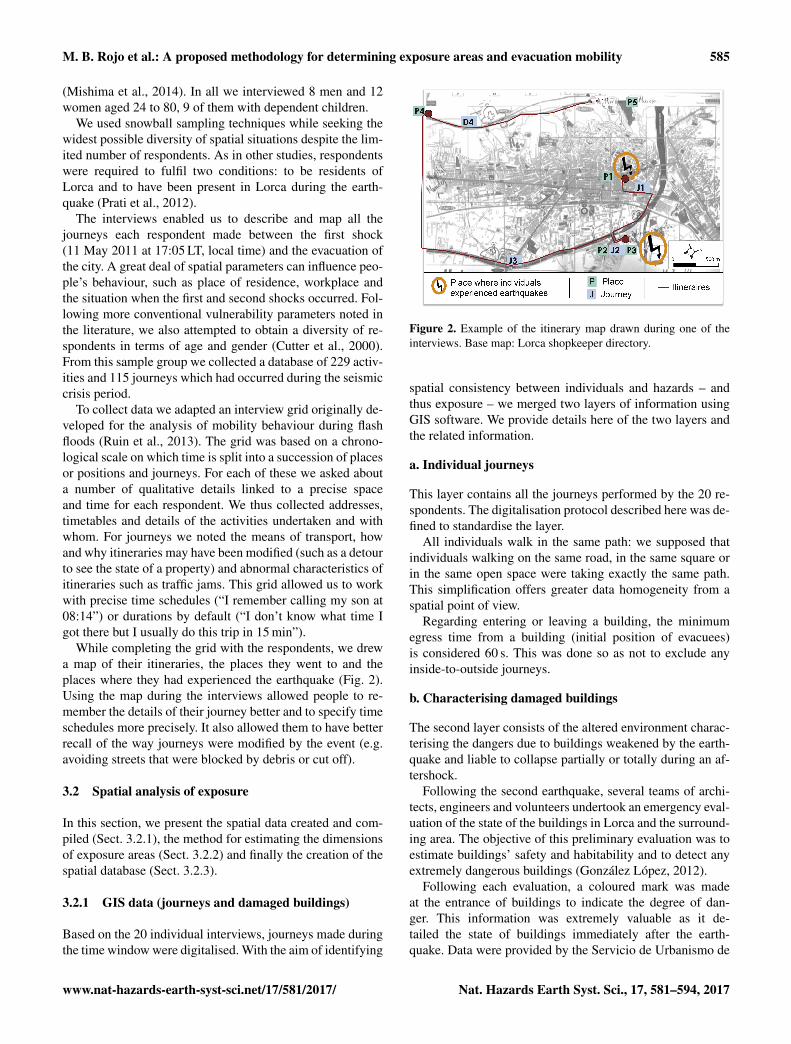
Figure 3. Sample of the selection from the maps of buildings clas-sified red or black (ruined). Map base: PNOA images from the In-stituto Geográfico Nacional. Evaluation of buildings: Servicio deUrbanismo de Planeamiento y Gestion. Production: Marc BertranRojo, 2014.
Planeamiento y Gestion de Lorca (SUP)1. A green colourindicated that residents could re-enter the building becauseit had not suffered significant structural damage. A yellowmark was used for buildings requiring repairs but whichcould possibly be occupied, the building structure showingno danger. Buildings in red were those with severe structuraland non-structural problems and could not be occupied. Fi-nally, buildings in black – also called ruined buildings – wereconsidered beyond repair and were the first to be demolished(González López, 2012). Public access to them was thereforetotally forbidden. In our analysis of individual exposure weretained buildings classified red or ruined, defined as “frag-ile” by the preliminary evaluation (Fig. 3). They were theones that constituted a serious danger for people approach-ing them.
3.2.2 Analysis of exposure areas
Here we consider how individual exposure can be increasedor decreased by people’s movements near weakened build-ings during the evacuation phase.
Human exposure is considered to be the spatial and tem-poral co-incidence between an individual and a possible haz-ard; we observed here how this spatio-temporal co-incidenceoccurred for the Lorca respondents.
An exposure situation supposes that the individuals con-cerned are in the vicinity of buildings that have become haz-ardous following the earthquake. This requires defining moreprecisely the distance at which people can be considered asexposed to the fall of façade elements into the street (actualcontact with the façade or when they are located one to 10 maway).
1Servicio de Urbanismo de Planeamiento y Gestion de Lorca:the agency in charge of developing and implementing urban plan-ning tools.
To do so, we studied the distances reached by the debrisof items having fallen from a building or resulting from acomplete building collapse after the earthquake.
We also studied images posted on the Internet in the daysfollowing the earthquake in order to calculate the debris areafor each building classified as fragile. The images used in-cluded both photographs (35 pictures) and videos (from TVnews and private sources).
The idea was to use the pictures to estimate the max-imum distance reached by debris falling from buildings.The distance was defined as the furthest point from thefaçade where debris approximately the size of a brick(110× 70× 230 mm) could be observed. This size was usedto set a limit and not include small pieces of debris possi-bly resulting from the fracturing of larger objects hitting theground. The point from which distances were calculated wasthe façade of the building from which the debris came. Twoexamples of how the maximum impact distance was studiedare given below.
Each had distinctive features but we endeavoured to col-lect as many reliable references as possible from whichwe could determine the approximate width of the impact.There was some uncertainty linked mainly to different pho-tographic perspectives, as has already been described in theliterature (Bernardini et al., 2016a). We preferred to under-estimate impact distances rather than overestimate them toavoid exaggerating situations when interpreting results.
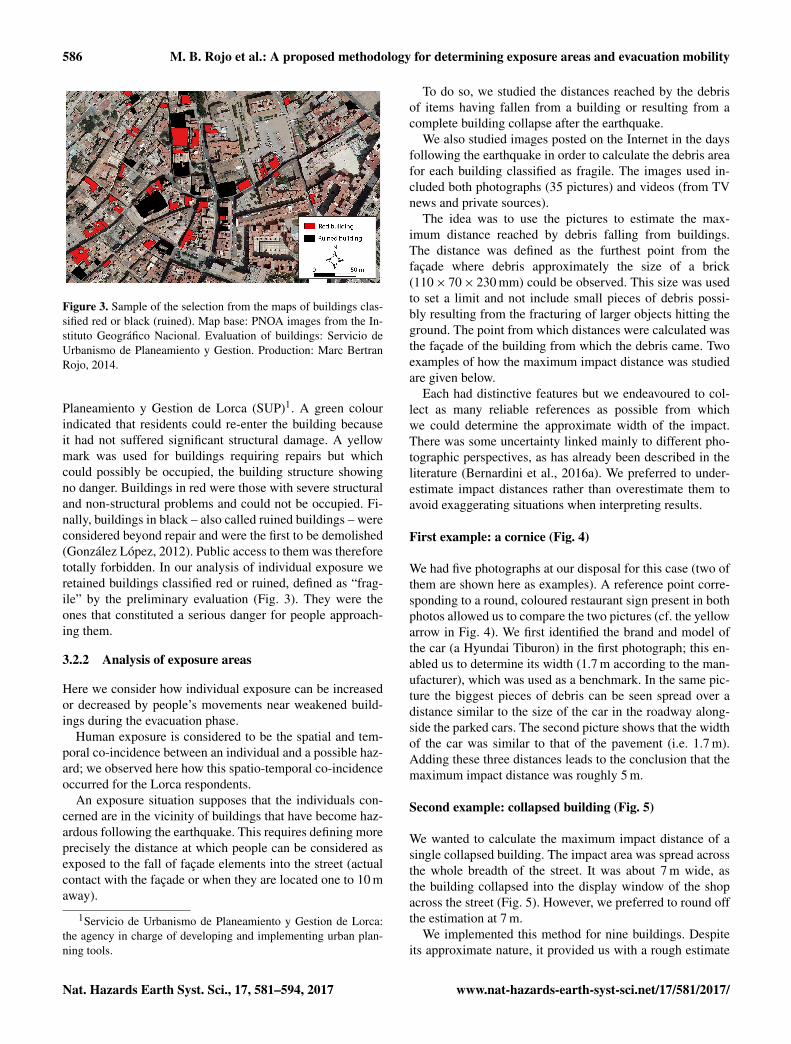
First example: a cornice (Fig. 4)
We had five photographs at our disposal for this case (two ofthem are shown here as examples). A reference point corre-sponding to a round, coloured restaurant sign present in bothphotos allowed us to compare the two pictures (cf. the yellowarrow in Fig. 4). We first identified the brand and model ofthe car (a Hyundai Tiburon) in the first photograph; this en-abled us to determine its width (1.7 m according to the man-ufacturer), which was used as a benchmark. In the same pic-ture the biggest pieces of debris can be seen spread over adistance similar to the size of the car in the roadway along-side the parked cars. The second picture shows that the widthof the car was similar to that of the pavement (i.e. 1.7 m).Adding these three distances leads to the conclusion that themaximum impact distance was roughly 5 m.
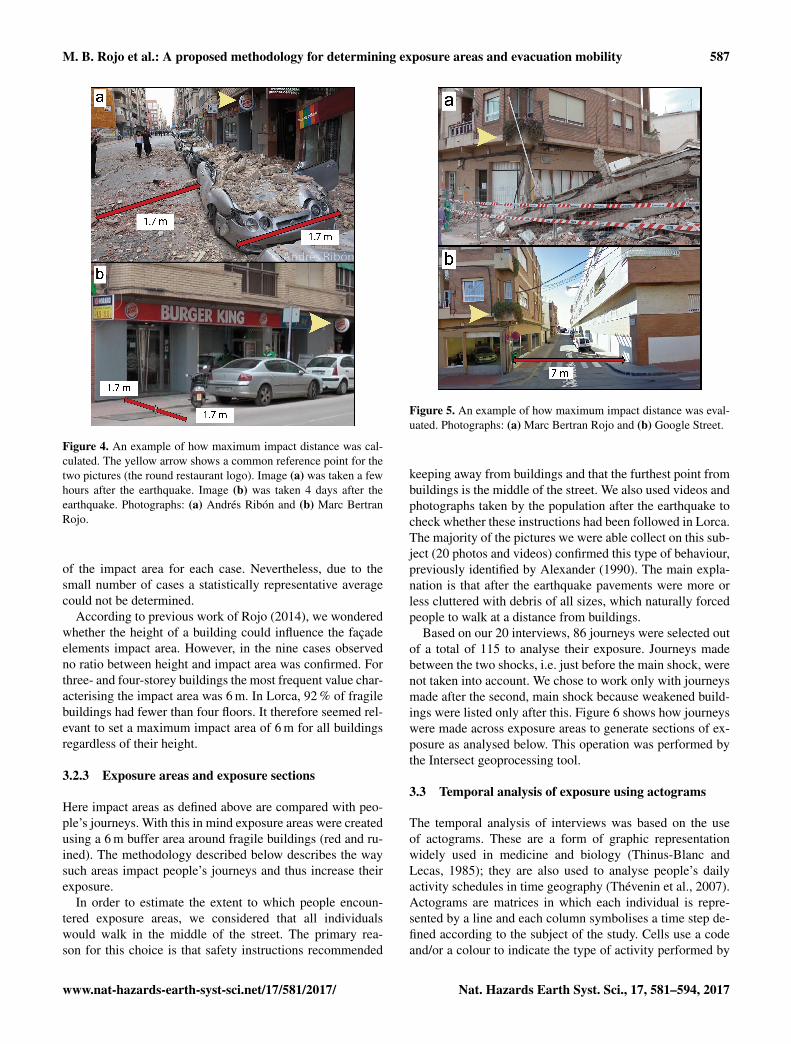
Second example: collapsed building (Fig. 5)
We wanted to calculate the maximum impact distance of asingle collapsed building. The impact area was spread acrossthe whole breadth of the street. It was about 7 m wide, asthe building collapsed into the display window of the shopacross the street (Fig. 5). However, we preferred to round offthe estimation at 7 m.
We implemented this method for nine buildings. Despiteits approximate nature, it provided us with a rough estimate
Nat. Hazards Earth Syst. Sci., 17, 581–594, 2017 www.nat-hazards-earth-syst-sci.net/17/581/2017/
M. B. Rojo et al.: A proposed methodology for determining exposure areas and evacuation mobility 587
Figure 4. An example of how maximum impact distance was cal-culated. The yellow arrow shows a common reference point for thetwo pictures (the round restaurant logo). Image (a) was taken a fewhours after the earthquake. Image (b) was taken 4 days after theearthquake. Photographs: (a) Andrés Ribón and (b) Marc BertranRojo.
of the impact area for each case. Nevertheless, due to thesmall number of cases a statistically representative averagecould not be determined.
According to previous work of Rojo (2014), we wonderedwhether the height of a building could influence the façadeelements impact area. However, in the nine cases observedno ratio between height and impact area was confirmed. Forthree- and four-storey buildings the most frequent value char-acterising the impact area was 6 m. In Lorca, 92 % of fragilebuildings had fewer than four floors. It therefore seemed rel-evant to set a maximum impact area of 6 m for all buildingsregardless of their height.
3.2.3 Exposure areas and exposure sections
Here impact areas as defined above are compared with peo-ple’s journeys. With this in mind exposure areas were createdusing a 6 m buffer area around fragile buildings (red and ru-ined). The methodology described below describes the waysuch areas impact people’s journeys and thus increase theirexposure.
In order to estimate the extent to which people encoun-tered exposure areas, we considered that all individualswould walk in the middle of the street. The primary rea-son for this choice is that safety instructions recommended
Figure 5. An example of how maximum impact distance was eval-uated. Photographs: (a) Marc Bertran Rojo and (b) Google Street.
keeping away from buildings and that the furthest point frombuildings is the middle of the street. We also used videos andphotographs taken by the population after the earthquake tocheck whether these instructions had been followed in Lorca.The majority of the pictures we were able collect on this sub-ject (20 photos and videos) confirmed this type of behaviour,previously identified by Alexander (1990). The main expla-nation is that after the earthquake pavements were more orless cluttered with debris of all sizes, which naturally forcedpeople to walk at a distance from buildings.
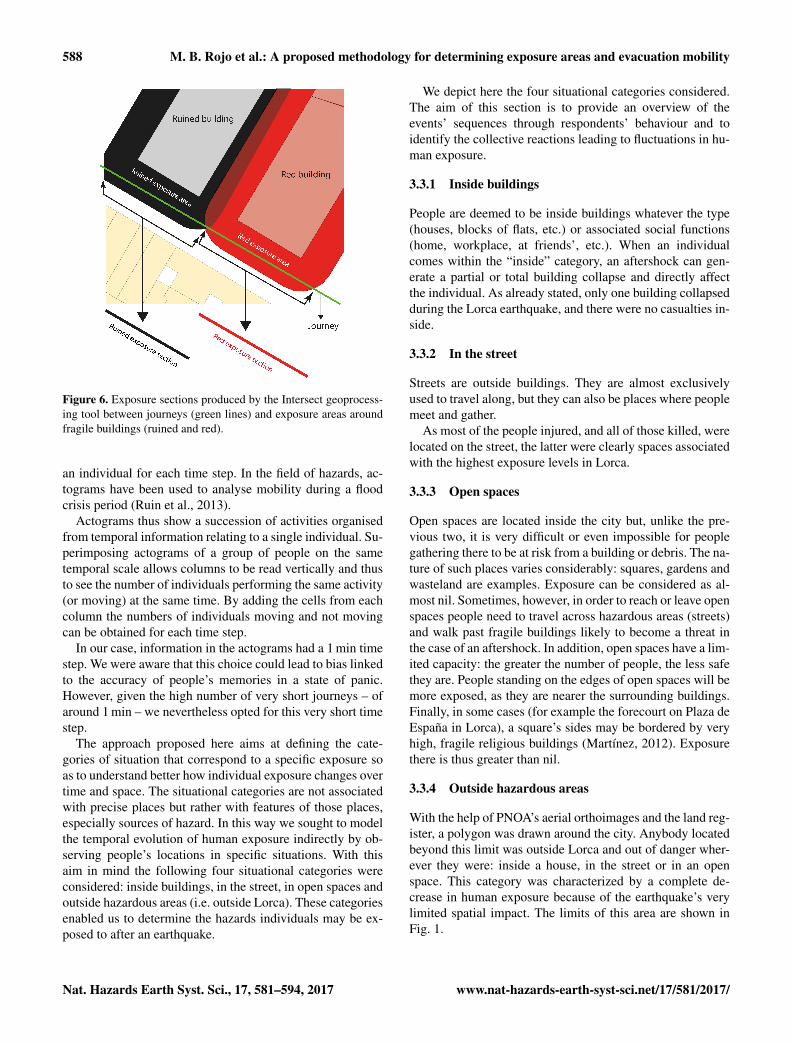
Based on our 20 interviews, 86 journeys were selected outof a total of 115 to analyse their exposure. Journeys madebetween the two shocks, i.e. just before the main shock, werenot taken into account. We chose to work only with journeysmade after the second, main shock because weakened build-ings were listed only after this. Figure 6 shows how journeyswere made across exposure areas to generate sections of ex-posure as analysed below. This operation was performed bythe Intersect geoprocessing tool.
3.3 Temporal analysis of exposure using actograms
The temporal analysis of interviews was based on the useof actograms. These are a form of graphic representationwidely used in medicine and biology (Thinus-Blanc andLecas, 1985); they are also used to analyse people’s dailyactivity schedules in time geography (Thévenin et al., 2007).Actograms are matrices in which each individual is repre-sented by a line and each column symbolises a time step de-fined according to the subject of the study. Cells use a codeand/or a colour to indicate the type of activity performed by
www.nat-hazards-earth-syst-sci.net/17/581/2017/ Nat. Hazards Earth Syst. Sci., 17, 581–594, 2017
588 M. B. Rojo et al.: A proposed methodology for determining exposure areas and evacuation mobility
Figure 6. Exposure sections produced by the Intersect geoprocess-ing tool between journeys (green lines) and exposure areas aroundfragile buildings (ruined and red).
an individual for each time step. In the field of hazards, ac-tograms have been used to analyse mobility during a floodcrisis period (Ruin et al., 2013).
Actograms thus show a succession of activities organisedfrom temporal information relating to a single individual. Su-perimposing actograms of a group of people on the sametemporal scale allows columns to be read vertically and thusto see the number of individuals performing the same activity(or moving) at the same time. By adding the cells from eachcolumn the numbers of individuals moving and not movingcan be obtained for each time step.
In our case, information in the actograms had a 1 min timestep. We were aware that this choice could lead to bias linkedto the accuracy of people’s memories in a state of panic.However, given the high number of very short journeys – ofaround 1 min – we nevertheless opted for this very short timestep.
The approach proposed here aims at defining the cate-gories of situation that correspond to a specific exposure soas to understand better how individual exposure changes overtime and space. The situational categories are not associatedwith precise places but rather with features of those places,especially sources of hazard. In this way we sought to modelthe temporal evolution of human exposure indirectly by ob-serving people’s locations in specific situations. With thisaim in mind the following four situational categories wereconsidered: inside buildings, in the street, in open spaces andoutside hazardous areas (i.e. outside Lorca). These categoriesenabled us to determine the hazards individuals may be ex-posed to after an earthquake.
We depict here the four situational categories considered.The aim of this section is to provide an overview of theevents’ sequences through respondents’ behaviour and toidentify the collective reactions leading to fluctuations in hu-man exposure.
3.3.1 Inside buildings
People are deemed to be inside buildings whatever the type(houses, blocks of flats, etc.) or associated social functions(home, workplace, at friends’, etc.). When an individualcomes within the “inside” category, an aftershock can gen-erate a partial or total building collapse and directly affectthe individual. As already stated, only one building collapsedduring the Lorca earthquake, and there were no casualties in-side.
3.3.2 In the street
Streets are outside buildings. They are almost exclusivelyused to travel along, but they can also be places where peoplemeet and gather.
As most of the people injured, and all of those killed, werelocated on the street, the latter were clearly spaces associatedwith the highest exposure levels in Lorca.
3.3.3 Open spaces
Open spaces are located inside the city but, unlike the pre-vious two, it is very difficult or even impossible for peoplegathering there to be at risk from a building or debris. The na-ture of such places varies considerably: squares, gardens andwasteland are examples. Exposure can be considered as al-most nil. Sometimes, however, in order to reach or leave openspaces people need to travel across hazardous areas (streets)and walk past fragile buildings likely to become a threat inthe case of an aftershock. In addition, open spaces have a lim-ited capacity: the greater the number of people, the less safethey are. People standing on the edges of open spaces will bemore exposed, as they are nearer the surrounding buildings.Finally, in some cases (for example the forecourt on Plaza deEspaña in Lorca), a square’s sides may be bordered by veryhigh, fragile religious buildings (Martínez, 2012). Exposurethere is thus greater than nil.
3.3.4 Outside hazardous areas
With the help of PNOA’s aerial orthoimages and the land reg-ister, a polygon was drawn around the city. Anybody locatedbeyond this limit was outside Lorca and out of danger wher-ever they were: inside a house, in the street or in an openspace. This category was characterized by a complete de-crease in human exposure because of the earthquake’s verylimited spatial impact. The limits of this area are shown inFig. 1.
Nat. Hazards Earth Syst. Sci., 17, 581–594, 2017 www.nat-hazards-earth-syst-sci.net/17/581/2017/
M. B. Rojo et al.: A proposed methodology for determining exposure areas and evacuation mobility 589
4 Results
Results are presented in two parts: the first deals with theexposure areas to consider for the evacuation phase in a post-earthquake altered environment (Sect. 4.1); the second fo-cuses on the classification of exposure situations to see howthe latter are distributed over time (Sect. 4.2).
4.1 Exposure in an urban environment after anearthquake
Our analysis of the spatial co-incidences of individual jour-neys and exposure areas (Sect. 3.2) gave the following re-sults: out of 86 journeys, 32 were made through “ruined” ar-eas and 39 through red-building-related areas at least once(any single journey is likely to have been made through sev-eral exposure areas).
Only three of the 20 respondents never travelled throughany exposure areas (in italic, Table 1). In most cases jour-neys were made through several such areas. Regardless ofthe number of journeys, it was the number of times individ-uals were exposed that was counted, as one individual canbecome exposed several times during a single journey. Over-all, 151 exposure sections were obtained, 49 of them ruined(black) exposure sections and 102 red exposure sections.
It was noticed that five people totalled almost 100 expo-sure sections between them and that one of them totalled29. The dimensions of exposure sections varied accordingto façade length. Out of a total of almost 100 km of journeysin the city after the earthquake, journeys inside exposure ar-eas covered 3.6 km (1.1 km in ruined-building exposure areasand 2.5 km in red exposure areas).
We wanted to examine whether there was a correlation be-tween the number of added exposure sections for each indi-vidual (column 3) and the total distance walked or the num-ber of journeys (columns 4 and 5). The aim was to define thebest exposure indicator. This is shown in Table 1.
The table is in descending order according to the numberof times people were exposed to fragile buildings (in this casered and ruined are not differentiated), so as to highlight themost critical situations. It shows the sections of exposure tobuildings classified red, ruined and the addition of both redand ruined (columns 2, 3 and 4). It also gives the total dis-tances for all journeys, the total number of journeys made byeach individual and the distance per journey (columns 5, 6and 7). The boldface indicates the five highest values in eachcolumn.
It can be seen that while individuals moving only a little donot usually travel through exposure areas, it is less clear thatthose who move the most are the most exposed. The numberof journeys made does not seem to determine exposure afteran earthquake. Individual (ID) 2 made only four journeys, forexample, but had the second highest exposure, while ID 13made twice as many journeys for a much lower total expo-sure. Distance also does not seem to be an explanatory vari-
able of exposure. For example, the individual who travelledthe furthest (ID 3) was 10 times less exposed than one whotravelled less than a third as far (ID 1). When exposure afteran earthquake is considered, it is also necessary to examineother factors. Due to our small sample, we did not extend ouranalysis to the influence of the location of buildings generat-ing the greatest exposure.
These results require validation with a bigger sample. Anin-depth analysis of activities and the reasons for journeys ina seismic crisis period also needs to be carried out in orderto understand the complexity of the factors contributing tohuman exposure.
4.2 Fluctuations of exposure over time
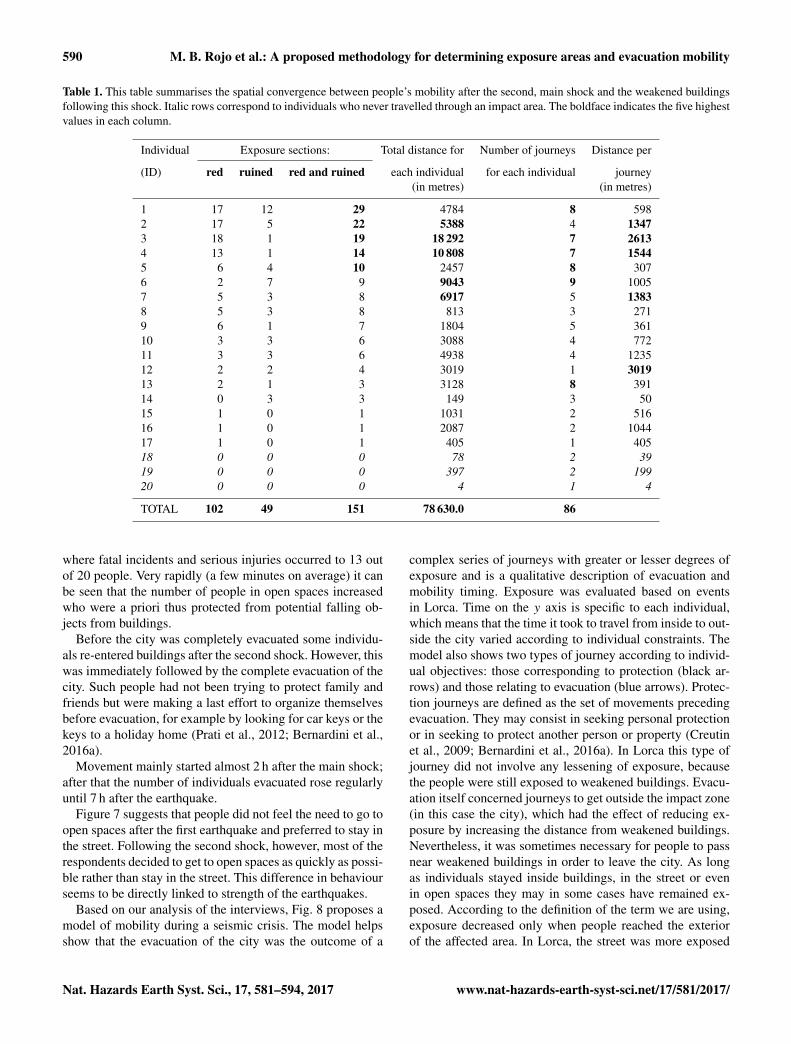
Using the methodology described above (Sect. 3.3), thegraph in Fig. 7 shows the location of the 20 respondents ac-cording to their exposure status as the crisis developed. Eachof the graph’s lines corresponds to the number of individu-als present in each spatial category counted by using the ac-tograms. The sum of the individuals present during each timeperiod always equals 20. The red arrows indicate the time ofthe first and second earthquakes. The “low” line (in yellow)shows a high number of short journeys largely correspondingto those made immediately after the earthquake. They weremade to enable people to leave buildings after the shock. Onthe same line there are several of the situations reported inthe interviews. A few minutes after the foreshock some indi-viduals went back into their homes because they thought theywere out of danger. This stage is well known to psychologistsand has been identified as a denial phase, in some cases af-fecting the perception of external reality. Such unconsciousmechanisms help some people put a relatively disturbing sit-uation into perspective and enable them to control their fearsor anxieties more effectively (Páez et al., 1995; Bernardiniet al., 2016a). Other individuals left buildings because of ru-mours of an aftershock or to see the damage done by theforeshock and even to discuss the event with people on thestreet.
In the second, main shock, the injuries and deaths hap-pened when people were leaving the buildings. It also madepeople who had remained inside buildings leave immediatelywhenever possible, or several minutes later if they had othersto look after (especially elderly people) or if they were panic-stricken. This phenomenon is clearly visible on the graphwith a substantial decrease in the number of people insidebuildings.
There is then the activity of assembling family membersto plan for evacuation. Sometimes this can increase expo-sure for one or several family members. The assembly phe-nomenon can be observed with the line corresponding tothe “inside” situation after the main earthquake. The peoplewho went back into buildings after the earthquakes did so tohelp their close family and friends evacuate. Within a minuteof the main shock a majority of people were in the streets
www.nat-hazards-earth-syst-sci.net/17/581/2017/ Nat. Hazards Earth Syst. Sci., 17, 581–594, 2017
590 M. B. Rojo et al.: A proposed methodology for determining exposure areas and evacuation mobility
Table 1. This table summarises the spatial convergence between people’s mobility after the second, main shock and the weakened buildingsfollowing this shock. Italic rows correspond to individuals who never travelled through an impact area. The boldface indicates the five highestvalues in each column.
Individual Exposure sections: Total distance for Number of journeys Distance per
(ID) red ruined red and ruined each individual for each individual journey(in metres) (in metres)
1 17 12 29 4784 8 5982 17 5 22 5388 4 13473 18 1 19 18 292 7 26134 13 1 14 10 808 7 15445 6 4 10 2457 8 3076 2 7 9 9043 9 10057 5 3 8 6917 5 13838 5 3 8 813 3 2719 6 1 7 1804 5 36110 3 3 6 3088 4 77211 3 3 6 4938 4 123512 2 2 4 3019 1 301913 2 1 3 3128 8 39114 0 3 3 149 3 5015 1 0 1 1031 2 51616 1 0 1 2087 2 104417 1 0 1 405 1 40518 0 0 0 78 2 3919 0 0 0 397 2 19920 0 0 0 4 1 4
TOTAL 102 49 151 78 630.0 86
where fatal incidents and serious injuries occurred to 13 outof 20 people. Very rapidly (a few minutes on average) it canbe seen that the number of people in open spaces increasedwho were a priori thus protected from potential falling ob-jects from buildings.
Before the city was completely evacuated some individu-als re-entered buildings after the second shock. However, thiswas immediately followed by the complete evacuation of thecity. Such people had not been trying to protect family andfriends but were making a last effort to organize themselvesbefore evacuation, for example by looking for car keys or thekeys to a holiday home (Prati et al., 2012; Bernardini et al.,2016a).
Movement mainly started almost 2 h after the main shock;after that the number of individuals evacuated rose regularlyuntil 7 h after the earthquake.
Figure 7 suggests that people did not feel the need to go toopen spaces after the first earthquake and preferred to stay inthe street. Following the second shock, however, most of therespondents decided to get to open spaces as quickly as possi-ble rather than stay in the street. This difference in behaviourseems to be directly linked to strength of the earthquakes.
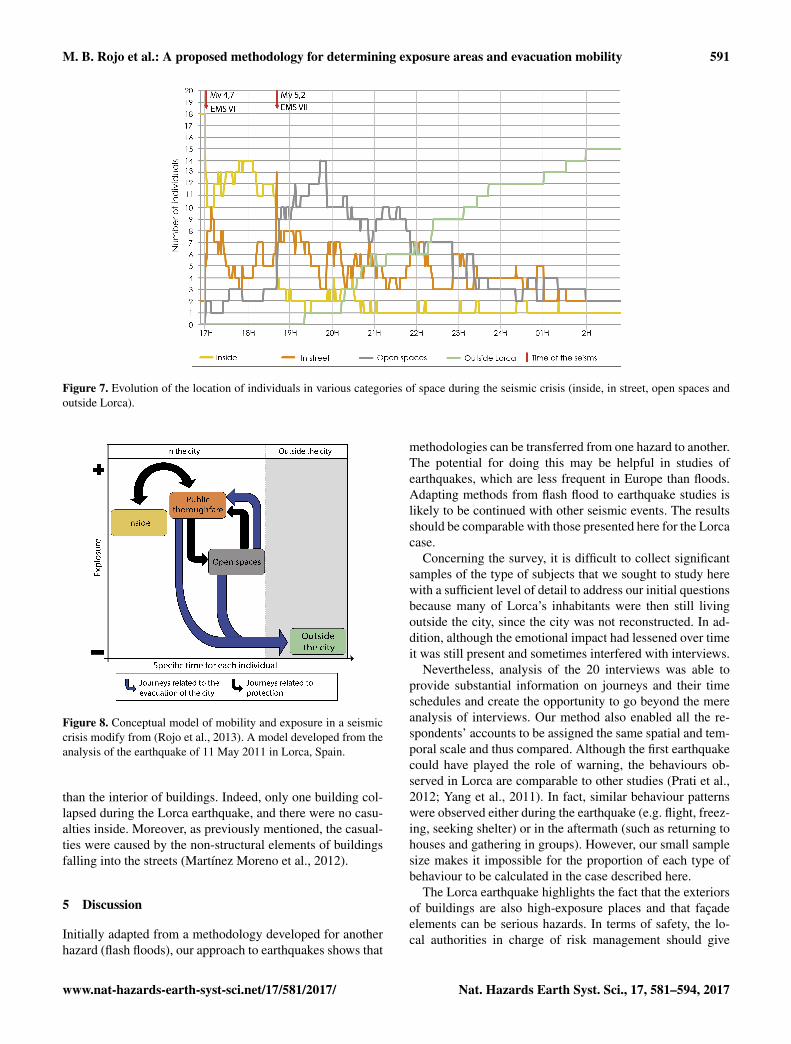
Based on our analysis of the interviews, Fig. 8 proposes amodel of mobility during a seismic crisis. The model helpsshow that the evacuation of the city was the outcome of a
complex series of journeys with greater or lesser degrees ofexposure and is a qualitative description of evacuation andmobility timing. Exposure was evaluated based on eventsin Lorca. Time on the y axis is specific to each individual,which means that the time it took to travel from inside to out-side the city varied according to individual constraints. Themodel also shows two types of journey according to individ-ual objectives: those corresponding to protection (black ar-rows) and those relating to evacuation (blue arrows). Protec-tion journeys are defined as the set of movements precedingevacuation. They may consist in seeking personal protectionor in seeking to protect another person or property (Creutinet al., 2009; Bernardini et al., 2016a). In Lorca this type ofjourney did not involve any lessening of exposure, becausethe people were still exposed to weakened buildings. Evacu-ation itself concerned journeys to get outside the impact zone(in this case the city), which had the effect of reducing ex-posure by increasing the distance from weakened buildings.Nevertheless, it was sometimes necessary for people to passnear weakened buildings in order to leave the city. As longas individuals stayed inside buildings, in the street or evenin open spaces they may in some cases have remained ex-posed. According to the definition of the term we are using,exposure decreased only when people reached the exteriorof the affected area. In Lorca, the street was more exposed
Nat. Hazards Earth Syst. Sci., 17, 581–594, 2017 www.nat-hazards-earth-syst-sci.net/17/581/2017/
M. B. Rojo et al.: A proposed methodology for determining exposure areas and evacuation mobility 591
Figure 7. Evolution of the location of individuals in various categories of space during the seismic crisis (inside, in street, open spaces andoutside Lorca).
Figure 8. Conceptual model of mobility and exposure in a seismiccrisis modify from (Rojo et al., 2013). A model developed from theanalysis of the earthquake of 11 May 2011 in Lorca, Spain.
than the interior of buildings. Indeed, only one building col-lapsed during the Lorca earthquake, and there were no casu-alties inside. Moreover, as previously mentioned, the casual-ties were caused by the non-structural elements of buildingsfalling into the streets (Martínez Moreno et al., 2012).
5 Discussion
Initially adapted from a methodology developed for anotherhazard (flash floods), our approach to earthquakes shows that
methodologies can be transferred from one hazard to another.The potential for doing this may be helpful in studies ofearthquakes, which are less frequent in Europe than floods.Adapting methods from flash flood to earthquake studies islikely to be continued with other seismic events. The resultsshould be comparable with those presented here for the Lorcacase.
Concerning the survey, it is difficult to collect significantsamples of the type of subjects that we sought to study herewith a sufficient level of detail to address our initial questionsbecause many of Lorca’s inhabitants were then still livingoutside the city, since the city was not reconstructed. In ad-dition, although the emotional impact had lessened over timeit was still present and sometimes interfered with interviews.
Nevertheless, analysis of the 20 interviews was able toprovide substantial information on journeys and their timeschedules and create the opportunity to go beyond the mereanalysis of interviews. Our method also enabled all the re-spondents’ accounts to be assigned the same spatial and tem-poral scale and thus compared. Although the first earthquakecould have played the role of warning, the behaviours ob-served in Lorca are comparable to other studies (Prati et al.,2012; Yang et al., 2011). In fact, similar behaviour patternswere observed either during the earthquake (e.g. flight, freez-ing, seeking shelter) or in the aftermath (such as returning tohouses and gathering in groups). However, our small samplesize makes it impossible for the proportion of each type ofbehaviour to be calculated in the case described here.
The Lorca earthquake highlights the fact that the exteriorsof buildings are also high-exposure places and that façadeelements can be serious hazards. In terms of safety, the lo-cal authorities in charge of risk management should give
www.nat-hazards-earth-syst-sci.net/17/581/2017/ Nat. Hazards Earth Syst. Sci., 17, 581–594, 2017
592 M. B. Rojo et al.: A proposed methodology for determining exposure areas and evacuation mobility
appropriate recommendations, in countries of low seismic-ity where the risk of building collapse remains limited. Forexample, it could be advisable to stress suitable behaviourpatterns people should adopt during and after an earthquake.Current information leaflets to improve population actionsgo no further than the moment a person reaches an openspace. However, analysis of the Lorca event shows that peo-ple should be informed not only about what to do when anearthquake strikes but also of the best decisions to make sothat the city can be evacuated while keeping potential indi-vidual exposure to a minimum. In this way, as it is alreadydeveloped for other hazards like tsunamis or volcanoes erup-tions, local authorities could also design preventive actions(leaflets, direction signs, evacuation routes, etc.) that wouldlimit journeys within the city and favour wide avenues overshortcuts. Alternative actions (smartphone applications orevacuation exercises) could also be proposed so that the pop-ulation would be aware before the event or informed in realtime of which road is the best to evacuate safely. Like otherrecent studies in the same field (Bernardini et al., 2016a),Lorca shows yet again that any analysis of exposure mustinclude the need to be able to leave urban centres safely. Itis thus essential for any pertinent view of evacuation afteran earthquake to take into account both individual behaviourand the status of buildings.
Earthquake-resistant building standards tend to be modi-fied following disasters (Aribert, 2002), while seismic riskzoning maps often expand at each review (Frechet, 1978;Martin et al., 2002; SISMORESISTENTS, 2003). Everstronger earthquakes are expected in a greater number of re-gions, whether in France, Italy or Spain. In the Lorca caseit appears that Spanish earthquake-resistant standards hadbeen properly implemented, since only one building col-lapsed. Typical Spanish building elements such as cornices,balconies and other façade elements at the top of buildingsproved to be fragile and hazardous, however. Several exam-ples of this have become topical issues for engineers and ar-chitects, while many papers have been published providingfurther evidence (Alfaro et al., 2011; Diez and Sanz Larrea,2011; Martínez, 2012; Tibaduiza et al., 2012). The presentstudy has shown that even if victims were struck at the mo-ment the seismic shocks occurred, several factors could haveconverged to increase the number of casualties. Stronger af-tershocks would certainly have caused a greater number ofunstable façade elements to fall, with the likelihood of injur-ing passersby in the streets. Our considered view is that it isessential to raise the awareness of the inhabitants of areas ex-posed to earthquakes with regard to the hazards that threatenthem during evacuation. It is also important to insure thatearthquake-resistant standards of moderate seismicity coun-tries take into account non-structural elements as they dofor structural elements, as the former could kill as much asthe latter. Moreover, reinforcement campaigns should be car-ried out to limit the potentially dangerous non-structural ele-ments.
Data availability. Due to the confidential nature of the interviews,information about data is available upon request to the authors.
Competing interests. The authors declare that they have no conflictof interest.
Acknowledgements. The authors thank the Rhône-Alpes region,research cluster no. 6, Environment (2011–2013), which fundedthis work. We also thank all the people we met during our fieldsurveys and who gave their time to answer our questions. Finallymany thanks to J.-L. Pinel who translated this document fromFrench into English, and P. Fletcher who revised the modifiedversion.
Edited by: O. KatzReviewed by: two anonymous referees
References
Alexander, D.: Behavior during Earthquakes: A Southern ItalianExample, International Journal of Mass Emergencies and Dis-asters, 8, 5–29, 1990.
Alexander, D. E.: Mortality and Morbidity Risk in the L’Aquila,Italy Earthquake of 6 April 2009 and Lessons to Be Learned,in: Human Casualties in Earthquakes, edited by: Spence, R., So,E., and Scawthorn, C., 29, 185–197, Advances in Natural andTechnological Hazards Research, Springer, Netherlands, 2011.
Alfaro, P., González, M., Brusi, D., López Martín, J. A., Martínez-Díaz, J. J., García Mayordomo, J., Benito, B., and Jódar, F: Lec-ciones Aprendidas Del Terremoto de Lorca de 2011, Enseñanzade Las Ciencias de La Tierra, 19, 245–260, 2011.
André-Poyaud, I., Bahoken, F., Chardonnel, S., Charleux, L.L., Depeau, S., Dureau, F., Giroud, M., Imbert, C., Ques-seveur, E., and Tabaka, K. K.: Représentations Graphiqueset Indicateurs Des Mobilités et Des Dynamiques de Peu-plement?: Contribution Bibliographique, October, available at:http://halshs.archives-ouvertes.fr/halshs-00470407 (last access:12 April 2013), 2009.
Aribert, J.-M.: Notions spécifiques pour un code de dimension-nement parasismique des constructions mixtes acier-béton, Con-struction métallique, 39, 5–17, 2002.
Armenian, H. K., Melkonian, A., Noji, E. K., and Hovanesian, A. P.:Deaths and Injuries due to the Earthquake in Armenia: A CohortApproach, Int. J. Epidemiol., 26, 806–813, 1997.
Bechtoula, H. and Ousalem, H.: The 21 May 2003 Zemmouri (Al-geria) Earthquake: Damages and Disaster Responses, J. Adv.Concr. Technol., 3, 161–174, doi:10.3151/jact.3.161, 2005.
Bernardini, G., D’Orazio, M., and Quagliarini, E.: Towards a “be-havioural design” approach for seismic risk reduction strategiesof buildings and their environment, Safety Sci., 86, 273–294,2016a.
Bernardini, G., Quagliarini, E., and D’Orazio, M.: Towards creat-ing a combined database for earthquake pedestrians’ evacuationmodels, Safety Sci., 82, 77–94, doi:10.1016/j.ssci.2015.09.001,2016b.
Nat. Hazards Earth Syst. Sci., 17, 581–594, 2017 www.nat-hazards-earth-syst-sci.net/17/581/2017/
M. B. Rojo et al.: A proposed methodology for determining exposure areas and evacuation mobility 593
Bolton, P. A.: The Loma Prieta, California, Earthquake of Octo-ber 17, 1989: Public Response, US Government Printing Office,1993.
Calianno, M., Ruin, I., and Gourley, J. J.: Supplementing FlashFlood Reports with Impact Classifications, J. Hydrol., 477, 1–16,doi:10.1016/j.jhydrol.2012.09.036, 2013.
Camelbeek, T., Barszez, A. M., and Plumier, A.: Le Risque Sis-mique et Sa Prévention En Région Wallonne, available at: http://orbi.ulg.ac.be/handle/2268/18333 (last access: 10 June 2014),2006.
Celep, Z., Erken, A., Taskin, B., and Ilki, A.: Failures of Masonryand Concrete Buildings during the March 8, 2010 Kovancılar andPalu (Elazıg) Earthquakes in Turkey, Eng. Fail. Anal., 18, 868–889, doi:10.1016/j.engfailanal.2010.11.001, 2011.
Chardonnel, S. and Stock, M.: Time-Geography, Echelles etTemporalités, available at: http://hal.univ-grenoble-alpes.fr/halshs-00085942/, 89–95, 2005.
Chou, Y.-J., Huang, N., Lee, C.-H., Tsai, S.-L., Chen, L.-S., andChang, H.-J.: Who Is at Risk of Death in an Earthquake?, Am. J.Epidemiol., 160, 688–695, doi:10.1093/aje/kwh270, 2004.
Coburn, A. W., Spence, R. J. S., and Pomonis, A.: FactorsDetermining Human Casualty Levels in Earthquakes: Mor-tality Prediction in Building Collapse, in: Proceedings ofthe Tenth World Conference on Earthquake Engineering,CRC Press, 10, 5989–5994, available at: http://books.google.fr/books?hl=fr&lr=&id=uHtDvBvWGREC&oi=fnd&pg=PA5989&dq=factors+determining+human+casualty&ots=KxZ3Dq2VfR&sig=t0-JDpnKHk-e3l_bOH8TPHaq4-c, 1992.
Créton-Cazanave, L. and Lutoff, C.: Stakeholders’ issues for ac-tion during the warning process and the interpretation of fore-casts’ uncertainties, Nat. Hazards Earth Syst. Sci., 13, 1469–1479, doi:10.5194/nhess-13-1469-2013, 2013.
Creutin, J. D., Borga, M., Lutoff, C., Scolobig, A., Ruin, I., andCréton-Cazanave, L.: Catchment Dynamics and Social Responseduring Flash Floods: The Potential of Radar Rainfall Monitoringfor Warning Procedures, Meteorol. Appl. 16, 115–125, 2009.
Cutter, S. L., Mitchell, J. T., and Scott, M. S.: Revealing the Vul-nerability of People and Places: A Case Study of GeorgetownCounty, South Carolina, Ann. Assoc. Am. Geogr., 90, 713–737,2000.
Debionne, S., Ruin, I., Shabou, S., Lutoff, C., and Creutin, J.-D.:Assessment of commuters’ daily exposure to flash flooding overthe roads of the Gard region, France, J. Hydrol., 541, 636–648,doi:10.1016/j.jhydrol.2016.01.064, 2016.
Dhakal, R. P.: Damage to non-structural components and contents in2010 Darfield earthquake, Bulletin of the New Zealand Societyfor Earthquake Engineering, 43, 404–411, 2010.
Díaz, J. J. J.: Lorca: el terremoto del 11 de mayo de 2011, En-señanza de las Ciencias de la Tierra, 19, 362–364, 2012.
Diez, A. A. and Sanz Larrea, C.: Why Was It so Damaging?,in: 2011 International Conference on Multimedia Technology(ICMT), 6670–6679, doi:10.1109/ICMT.2011.6002759, 2011.
Dogangün, A.: Performance of Reinforced Concrete Buildings dur-ing the May 1, 2003 Bingöl Earthquake in Turkey, Eng. Struct.,26, 841–856, doi:10.1016/j.engstruct.2004.02.005, 2004.
D’Orazio, M., Spalazzi, L., Quagliarini, E., and Bernardini,G.: Agent-Based Model for Earthquake Pedestrians, Evacua-tion in Urban Outdoor Scenarios: Behavioural Patterns Defini-
tion and Evacuation Paths Choice, Safety Sci., 62, 450–465,doi:10.1016/j.ssci.2013.09.014, 2014.
Ellidokuz, H., Ucku, R., Aydin, U. Y., and Ellidokuz, E.: Risk Fac-tors for Death and Injuries in Earthquake: Cross-Sectional Studyfrom Afyon, Turkey, Croat. Med. J., 46, 613–618, 2005.
Ferreira, T. M., Vicentea, R., and Varum, H.: Seismic Vulnerabil-ity Assessment of Masonry Facade Walls: Development, Appli-cation and Validation of a New Scoring Method, Struct. Eng.Mech., 50, 541–561, 2014.
Frechet, J.: Sismicité Du Sud-Est de La France et Une Nou-velle Méthode de Zonage Sismique, Université Scientifique etMédicale de Grenoble, available at: http://tel.archives-ouvertes.fr/tel-00635869 (last access: 20 July 2014), 1978.
Galindo-Zaldívar, J., Chalouan, A., Azzouz, O., Sanz de Galdeano,C., Anahnah, F., Ameza, L., Ruano, P., Pedrera, A., Ruiz-Constán, A., Marín-Lechado, C., Benmakhlouf, M., López-Garrido, A., Ahmamou, M., Saji, R., Roldán-García, F., Akil,M., and Chabli, A: Are the Seismological and Geological Ob-servations of the Al Hoceima (Morocco, Rif) 2004 Earth-quake (M = 6.3) Contradictory?, Tectonophysics, 475, 59–67,doi:10.1016/j.tecto.2008.11.018, 2009.
Goltz, J. D., Russell, L. A., and Bourque, L. B.: Initial BehavioralResponse to a Rapid Onset Disaster: A Case Study of the October1, 1987, Whittier Narrows Earthquake, International Journal ofMass Emergencies and Disasters, 10, 43–69, 1992.
González López, S.: Secuencia Sísmica de Lorca: Análisis de Con-secuencias Y Actuaciones de Emergencia Y Post-Emergencia,Alberca: Revista de La Asociación de Amigos Del Museo Ar-queológico de Lorca, 10, 9–37, 2012.
Guardiola-Víllora, A. and Basset-Salom, L.: Escenarios de RiesgoSísmico Del Distrito Del Eixample de La Ciudad de Valencia,Revista Internacional de Métodos Numéricos Para Cálculo YDiseño En Ingeniería, doi:10.1016/j.rimni.2014.01.002, 2015.
Leone, F.: Caractérisation des vulnérabilités aux catastrophes’naturelles: contribution à une évaluation géographique multi-risque (mouvements de terrain, séismes, tsunamis, éruptions vol-caniques, cyclones), Université Paul Valéry – Montpellier III,available at: http://tel.archives-ouvertes.fr/tel-00276636 (last ac-cess: 4 June 2014), 2007.
Martin, C. H., Combes, P. H., Secanell, R., Lignon, G., Car-bon, D., Fioravanti, A., and Grellet, B.: Révision Du ZonageSismique de La France. Etude Probabiliste, Rapport GEOTERGTR/MATE/0701, 21, 81–90, doi:10.1016/j.rimni.2014.01.002,2002.
Martínez, J. D. H.: Efectos Del Terremoto de Lorca Del 11 de Mayode 2011 Sobre El Patrimonio Religioso. Análisis de EmergenciaYs Enseñanzas Futuras, BOLETÍN GEOLÓGICO Y MINERO,123, 515–536, 2012.
Martínez Moreno, F., Salazar Ortuño, A., Martínez Díaz, J., LópezMartín, J. A., Terrer Miras, R., and Hernández Sapena, A.: Es-Lorca: Una Iniciativa Para La Educación Y Concienciación So-bre El Riesgo Sísmico, BOLETÍN GEOLÓGICO Y MINERO,123, 575–588, 2012.
Milani, G.: Lesson Learned after the Emilia-Romagna, Italy,20–29 May 2012 Earthquakes: A Limit Analysis Insight onThree Masonry Churches, Eng. Fail. Anal., 34, 761–778,doi:10.1016/j.engfailanal.2013.01.001, 2013.
Mishima, N., Miyamoto, N., Taguchi, Y., and Kitagawa, K.: Analy-sis of Current Two-Way Evacuation Routes Based on Residents,
www.nat-hazards-earth-syst-sci.net/17/581/2017/ Nat. Hazards Earth Syst. Sci., 17, 581–594, 2017
594 M. B. Rojo et al.: A proposed methodology for determining exposure areas and evacuation mobility
Perceptions in a Historic Preservation Area, International Journalof Disaster Risk Reduction, 8, 10–19, 2014.
Moreno González, R. and Bairán García, J. M.: Evaluación Sísmicade Los Edificios de Mampostería Típicos de Barcelona Apli-cando La Metodología Risk-UE, Revista Internacional de Méto-dos Numéricos Para Cálculo Y Diseño En Ingeniería, 28, 161–169, doi:10.1016/j.rimni.2012.03.007, 2012.
Oterino, B. B., Medina, A. R., Escribano, J. M. G., and Murphy, P.:El terremoto de Lorca (2011) en el contexto de la peligrosidady el riesgo sísmico en Murcia, Física de la Tierra, 24, 255–287,doi:10.5209/rev_FITE.2012.v24.40141, 2012.
Páez, D., Arroyo, E., and Fernández, I.: Catástrofes, Situaciones deRiesgo Y Factores Psicosociales, Mapfre Y Seguridad, 57, 43–45, 1995.
Prati, G., Catufi, V., and Pietrantoni, L.: Emotional and BehaviouralReactions to Tremors of the Umbria-Marche Earthquake, Disas-ters, 36, 439–451, doi:10.1111/j.1467-7717.2011.01264.x, 2012.
Quarantelli, E. L.: Sheltering and Housing after Major CommunityDisasters: Case Studies and General Observations, 1982.
Quagliarini, E., Bernardini, G., Wazinski, C., Spalazzi, L., andD’Orazio, M.: Urban Scenarios Modifications due to the Earth-quake: Ruins Formation Criteria and Interactions with Pedestri-ans Evacuation, B. Earthq. Eng., 14, 1071–1101, 2016.
Ramirez, M. and Peek-Asa, C.: Epidemiology of TraumaticInjuries from Earthquakes, Epidemiol. Rev., 27, 47–55,doi:10.1093/epirev/mxi005, 2005.
Reghezza, M.: Réflexions Autour de La Vulnérabilité Métropoli-taine: La Métropole Parisienne Face Au Risque de Crue Cen-tennale, Thèse de doctorat en géographie de l’université Paris X,soutenue le 5 décembre, 2006.
Rodríguez, L. C., Herrero, E. C., Álvarez, A. I., Solares, J. M. M.,Villar, R. C., Díaz, J. J. M., Benito, B., Escribano, J. G., Escrib-ano, A. G., Mayordomo, J. G., López, R. P., Pascua, R. P., andCorella, P. M: Informe del sismo de Lorca del 11 de mayo de2011, Informe Técnico, July, available at: http://digital.csic.es/handle/10261/62381 (last access: 19 April 2013), 2011.
Rojo, M. B.: Correr entre los escombros – Courir entre les débrisLa mobilité individuelle en période de crise sismique: facteurd’exposition humaine dans le cas du séisme de Lorca (Espagne2011), Grenoble: Université Joseph-Fourier-Grenoble I. Correrentre los escombros – Courir entre les débris La mobilité indi-viduelle en période de crise sismique: facteur d’exposition hu-maine dans le cas du séisme de Lorca (Espagne 2011), 2014.
Rojo, M. B., Beck, E., Lutoff, C., and Schoeneisch, P.: Expositionsociale face aux séismes?: la mobilité en question. Le cas deLorca (Espagne) – Mai 2011, PLUM, Georrisque, 2013.
Ruin, I.: Conduite À Contre-Courant. Les Pratiques de MobilitéDans Le Gard: Facteur de Vulnérabilité Aux Crues Rapides,2007.
Ruin, I. and Lutoff, C.: Vulnérabilité Face Aux Crues Rapideset Mobilités Des Populations En Temps de Crise, La HouilleBlanche, 6, 114–119, 2004.
Ruin, I., Creutin, J. D., Anquetin, S., and Lutoff, C.: Human Expo-sure to Flash Floods-Relation between Flood Parameters and Hu-man Vulnerability during a Storm of September 2002 in SouthernFrance, J. Hydrol., 361, 199–213, 2008.
Ruin, I., Lutoff, C., Boudevillain, B., Creutin, J. D., Anquetin, S.,Rojo, M. B., Boissier, L., Borga, M., Colbeau-Justin, L., Creton-Cazanave, L., Delrieu, G., Douvinet, J., Gaume, E., Gruntfest,E., Naulin, J. P., Payrastre, O., and Vannier, O.: Social and Hy-drological Responses to Extreme Precipitations: An Interdisci-plinary Strategy for Post-Flood Investigation, Weather, Climate,and Society, September, 6, 135–153, doi:10.1175/WCAS-D-13-00009.1, 2013.
SISMORESISTENTS: COMISSIÓ PERMANENT DE NORMES,Norma de Construcción Sismorresistente: Parte General Y Edifi-cación. NCSE-02, Edicions Multinormas, 2003.
Solares, J. M. M.: Sismicidad pre-instrumental. Los grandes ter-remotos históricos en España, Enseñanza de las Ciencias de laTierra, 19, 296–304, 2012.
Tapan, M., Comert, M., Demir, C., Sayan, Y., Orakcal, K.,and Ilki, A.: Failures of Structures during the October 23,2011 Tabanlı(Van) and November 9, 2011 Edremit (Van)Earthquakes in Turkey, Eng. Fail. Anal., 34, 606–628,doi:10.1016/j.engfailanal.2013.02.013, 2013.
Thévenin, T., Chardonnel, S., and Cochey, E.: Explorer Les Tem-poralités Urbaines de L’agglomération de Dijon. Une Anal-yse de l’Enquête-Ménage-Déplacement Par Les ProgrammesD’activités, Espace Populations Sociétés. Space Populations So-cieties, 2007/2–3, 179–190, 2007.
Thinus-Blanc, C. and Lecas, J. C.: Effects of Collicular Lesionsin the Hamster during Visual Discrimination. An Analysis fromComputer-Video Actograms, Q. J. Exp. Psychol. B, 37, 213–233,doi:10.1080/14640748508402097, 1985.
Tibaduiza, M. L. C., Zarzosa, N. L., Irizarry, J., Valcarcel, J. A.,Barbat, A. H., and Suriñach, X. G.: Comportamiento Sísmicode los Edificios de Lorca, Física de la Tierra, 24, 289–314,doi:10.5209/rev_FITE.2012.v24.40142, 2012.
Vallée, M. and Di Luccio, F.: Source Analysis of the 2002 Molise,Southern Italy, Twin Earthquakes (10/31 and 11/01), Geophys.Res. Lett., 32, L12309, doi:10.1029/2005GL022687, 2005.
Weiss, K., Girandola, F., and Colbeau-Justin, L.: Les Com-portements de Protection Face Au Risque Naturel: De LaRésistance À L’engagement, Pratiques Psychologiques, Psy-chologie sociale appliquee a l’environnement, 17, 251–262,doi:10.1016/j.prps.2010.02.002, 2011.
Yang, X., Wu, Z., and Li, Y.: Difference between Real-Life EscapePanic and Mimic Exercises in Simulated Situation with Implica-tions to the Statistical Physics Models of Emergency Evacuation:The 2008 Wenchuan Earthquake, Physica A: Statistical Mechan-ics and Its Applications, 390, 2375–2380, 2011.
Nat. Hazards Earth Syst. Sci., 17, 581–594, 2017 www.nat-hazards-earth-syst-sci.net/17/581/2017/