Embed Size (px)
Citation preview
February 16, 2016
TO: Robin Williams, Interim Director Department of Recreation & Youth Services
FROM: Meredith E. Weber, Business Manager Department of Recreation & Youth Services
SUBJECT: Convention Center Fund Report for December 2015 (revised) The following information represents a summary of the detailed information of the Budget Status Report (FZRBDSC) and Aging Analysis Report (TZRAGES).
C: S. Dickstein, S. Earley, B. LaBrier, J. Parlette, M. Cashman, V. Henderson
Dayton Convention Center December December December YTD YTD YTD
2015 2014 % Change 2015 2014 % Change
Hotel Lodging Tax 39,753 80,899 -51% 605,729 565,435 7%
Trans Center Parking 29,741 29,840 0% 392,156 439,185 -11%
Public Show 9,000 10,600 -15% 216,498 243,106 -11%
Other Revenue 142,110 72,889 95% 1,075,800 1,054,512 2%
TOTAL Revenue & Transfers 220,604 194,228 14% 2,290,182 2,302,238 -1%DCC 114,981 143,569 -20% 1,597,831 1,632,912 -2%
Trans Center 59,523 39,423 51% 484,833 509,794 -5%
DAEC 46,100 11,236 310% 207,519 159,532 30%
Personnel 73,636 62,383 18% 821,792 819,272 0%
Management Contracts 83,646 - NA 452,040 434,092 4%
Utilities 51,762 52,985 -2% 377,250 405,058 -7%
Other Expenditures 77,650 91,993 -16% 908,752 769,002 18%
Prior Year Encumbrances** - - - 188,362 96,292 96%
TOTAL Expenses 286,694 207,362 38% 2,748,195 2,523,716 9%DCC 185,140 196,156 -6% 1,941,696 1,921,929 1%
Trans Center 88,870 - NA 679,476 473,474 44%
DAEC 12,685 11,206 13% 127,024 128,312 -1%
NET (Revenue over Expenses) (66,090) (13,134) 403% (458,013) (221,478) -107%DCC (70,159) (52,586) 33% (343,865) (289,017) -19%
Trans Center (29,347) 39,423 174% (194,643) 36,320 -636%
DAEC 33,416 30 -111920% 80,495 31,220 158%
AR Aging ReportsOutstanding Invoices (0-30 days) FUND 11000 42,532 FUND 11003 14,100
Outstanding Invoices (31-60days) FUND 11000 761 FUND 11003 -
Outstanding Invoices (61-90 days) FUND 11000 - FUND 11003 -
Outstanding Invoices (91-120+ days) FUND 11000 7,760 FUND 11003 4,000
Total 51,052 18,100
FGRCASH 12/31/15 12/31/14Fund 11000 (690,341) (194,397) -255%
Fund 11003 94,748 40,647 133%
5401 W. Kennedy Boulevard ∙ Suite 755 ∙ Tampa, Florida 33609 ∙ Phone 813.281.1222 ∙ Fax 813.315.6040
Needs Assessment / Market Analysis Study
for the Dayton Convention Center
Presented to:
City of Dayton
Dayton/Montgomery County Convention & Visitors Bureau
Presented by:
Final Report – December 2015

5401 W. Kennedy Boulevard ∙ Suite 755 ∙ Tampa, Florida 33609 ∙ Phone 813.281.1222 ∙ Fax 813.315.6040
December 31, 2015 Ms. Jacquie Powell, President & CEO Dayton/Montgomery County Convention & Visitors Bureau 1 Chamber Plaza, Suite A Dayton, OH 45402-2400 Dear Ms. Powell: Crossroads Consulting Services LLC (Crossroads), in association with Convergence Design and the Bigelow Companies, Inc., has completed its needs assessment/market analysis study for the Dayton Convention Center. This report summarizes our research and analysis. The information contained in the report is based on estimates, assumptions, and information developed from market research; knowledge of the convention/meeting and sports industries; input from potential demand generators; as well as data provided by management at the Dayton Convention Center and the Dayton/Montgomery County Convention & Visitors Bureau. We have utilized sources that are deemed to be reliable but cannot guarantee their accuracy. All information provided to us by others was not audited or verified and was assumed to be correct. Moreover, estimates and analysis are based on trends and assumptions and, therefore, there will usually be differences between the projected and actual results because events and circumstances frequently do not occur as expected, and those differences may be material. We have no obligation, unless subsequently engaged, to update this report or revise the information contained therein to reflect events and transactions occurring after the date of this report. In accordance with the terms of our engagement letter, the accompanying report is restricted to internal use by the City of Dayton and Dayton/Montgomery County Convention & Visitors Bureau and may not be relied upon by any third party for any purpose including financing. Notwithstanding these limitations, it is understood that this document may be subject to public information laws and, as such, can be made available to the public upon request. Although you have authorized reports to be sent electronically for your convenience, only the final hard copy report should be viewed as our work product. We have enjoyed our relationship with the City of Dayton and Dayton/Montgomery County Convention & Visitors Bureau and look forward to providing you with continued services in the future. Sincerely, Crossroads Consulting Services LLC
Dayton Convention Center Needs Assessment / Market Analysis Study 1
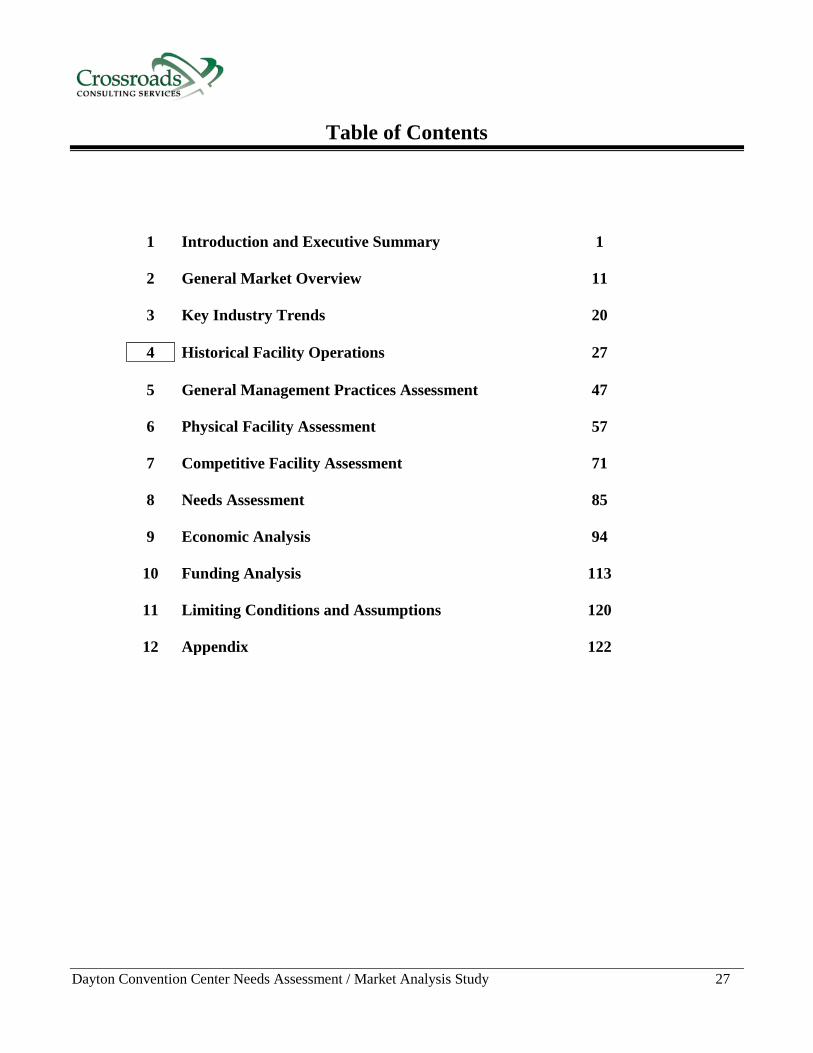
Table of Contents
1 Introduction and Executive Summary 1 2 General Market Overview 11 3 Key Industry Trends 20 4 Historical Facility Operations 27 5 General Management Practices Assessment 47 6 Physical Facility Assessment 57 7 Competitive Facility Assessment 71 8 Needs Assessment 85 9 Economic Analysis 94
10 Funding Analysis 113
11 Limiting Conditions and Assumptions 120
12 Appendix 122
Dayton Convention Center Needs Assessment / Market Analysis Study 2
Introduction
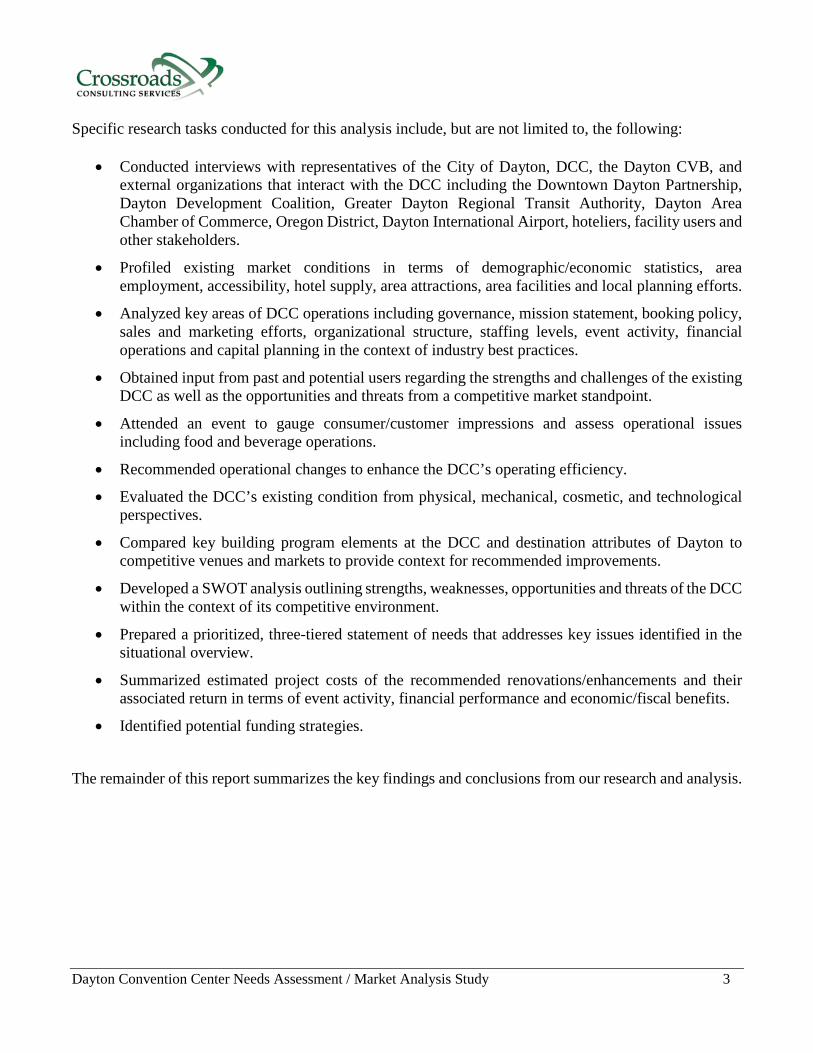
Opened in 1973, the Dayton Convention Center (DCC) is owned and operated by the City of Dayton. The facility currently offers 68,400 square feet of exhibit space; 20,000 square feet of ballroom space; 12,400 square feet of meeting space; and a 672-seat theater. The facility is located in downtown and connected to the Crowne Plaza hotel which offers 289 sleeping rooms as well as a 6,300 square-foot ballroom and 5,800 square feet of meeting space. Downtown Dayton’s Oregon District is a mixed-use urban center offering residential, entertainment, dining and shopping establishments within two blocks of the DCC. In July 2013, the DCC became a component of the City of Dayton Department of Recreation and Youth Services. Efforts are ongoing to revitalize downtown Dayton by attracting new residents and businesses. The bulk of development has occurred along the Great Miami River, the northern border of downtown. The Oregon District continues to experience revitalization. Meanwhile, the area immediately surrounding the DCC includes several vacant buildings and limited visitor amenities. Competitive destinations including Akron, Cincinnati, Columbus, Fort Wayne and Sharonville are continuing to invest in their convention facilities as well as supporting visitor infrastructure proximate to these venues. These improvements, along with newer facilities such as the Cleveland Convention Center and Kalahari Hotel & Conference Center in Sandusky have changed the competitive landscape for the DCC. Given this backdrop, the Dayton/Montgomery County Convention & Visitors Bureau (Dayton CVB), on behalf of the City of Dayton, retained the project team of Crossroads Consulting, Convergence Design, and The Bigelow Companies, Inc. to assess the strengths and challenges of the existing DCC from a physical and operational perspective. Based on this assessment, the CVB and the City of Dayton want to better understand the benefits, opportunities and challenges posed by the potential renovation/expansion of the DCC or construction of a new convention center. From a macro level, our work plan consisted of the following primary elements:
Situational Overview
•Market Overview
•Management Practices Assessment
•Physical Facility Assessment
•Competitive Facility Assessment
Recommended Action Steps/ Implementation Strategy
•Operational Recommendations
•Prioritized Physical Needs Assessment by Building Area, Relative Cost and Implementation Timeline
•Cost Estimate
Renovation/Enhancement Economic Analysis
•Impact to Event Activity
•Impact to Financial Operations
•Impact to Economic/Fiscal Benefits
•Potential Funding Strategies
Dayton Convention Center Needs Assessment / Market Analysis Study 3
Specific research tasks conducted for this analysis include, but are not limited to, the following:
• Conducted interviews with representatives of the City of Dayton, DCC, the Dayton CVB, and external organizations that interact with the DCC including the Downtown Dayton Partnership, Dayton Development Coalition, Greater Dayton Regional Transit Authority, Dayton Area Chamber of Commerce, Oregon District, Dayton International Airport, hoteliers, facility users and other stakeholders.
• Profiled existing market conditions in terms of demographic/economic statistics, area employment, accessibility, hotel supply, area attractions, area facilities and local planning efforts.
• Analyzed key areas of DCC operations including governance, mission statement, booking policy, sales and marketing efforts, organizational structure, staffing levels, event activity, financial operations and capital planning in the context of industry best practices.
• Obtained input from past and potential users regarding the strengths and challenges of the existing DCC as well as the opportunities and threats from a competitive market standpoint.
• Attended an event to gauge consumer/customer impressions and assess operational issues including food and beverage operations.
• Recommended operational changes to enhance the DCC’s operating efficiency.
• Evaluated the DCC’s existing condition from physical, mechanical, cosmetic, and technological perspectives.
• Compared key building program elements at the DCC and destination attributes of Dayton to competitive venues and markets to provide context for recommended improvements.
• Developed a SWOT analysis outlining strengths, weaknesses, opportunities and threats of the DCC within the context of its competitive environment.
• Prepared a prioritized, three-tiered statement of needs that addresses key issues identified in the situational overview.
• Summarized estimated project costs of the recommended renovations/enhancements and their associated return in terms of event activity, financial performance and economic/fiscal benefits.
• Identified potential funding strategies.
The remainder of this report summarizes the key findings and conclusions from our research and analysis.

Dayton Convention Center Needs Assessment / Market Analysis Study 4
Executive Summary
The project team of Crossroads Consulting, Convergence Design, and The Bigelow Companies, Inc. was retained to evaluate options for enhancements/renovations to the DCC in order to maximize its marketability, competitiveness and economic impact to the community. It is our understanding that the driving forces of any potential DCC enhancements/renovations are to maintain the financial investment and value of the existing asset, enhance downtown investments made by both the public and private sector, improve marketability that results in an increase of out-of-town group business, accommodate diverse community usage, minimize the financial operating subsidy, and maximize economic and fiscal impacts to the community.
Competitive Market Overview The DCC and the City of Dayton have a number of strengths relative to attracting convention/meeting business that draws attendees from outside the local area and creates economic benefits. The facility’s layout is functional for a variety of event types including conventions, tradeshows, consumer shows, competitive sporting events, banquets, and meetings. The DCC offers a competitive supply of exhibit and meeting space and is the only facility in the State that offers a theater which provides a competitive advantage for group business that requires an auditorium setting. The DCC’s largest ballroom is constrained by its size, configuration, dated finishes, and lack of modern amenities relative to its competitive set. The DCC’s biggest external constraint is the supply of convention quality hotel rooms within walking distance. Historically, professional and trade association meeting planners have considered Dayton one of the four primary convention/tradeshow destinations in Ohio. However, the competitive landscape has changed in the past decade resulting in a loss of economic generating event activity at the DCC. Other regional competitive markets including Akron, Cincinnati, Cleveland, Columbus, and Sharonville in Ohio as well as Covington, Kentucky and Fort Wayne, Indiana have and continue to invest in facility and destination improvements to enhance their convention centers’ marketability. While some of these cities such as Cincinnati, Cleveland and Columbus offer significantly larger convention centers than the DCC, they often compete for the same business given their facilities’ flexibility to accommodate multiple, smaller groups. In addition, the past decade saw significant growth in larger meeting hotels competing for group business. Properties such as the Kalahari Hotel/Conference Center in Sandusky have been developed with group business in mind. These types of properties offer competitive advantages including offering hotel rooms on-site, controlling all the potential revenue streams such as lodging, room rental, and food/beverage service as well as offering a one-stop shop to meeting planners. These and other changes to Dayton’s competitive environment, as well as the broader convention/meeting industry, have led to more of a buyers’ market. Groups now demand a seamless booking process, high levels of customer service, and value for their business. Although customers were generally positive regarding both the DCC and Dayton, facility and destination issues are taking a toll on the DCC’s ability to book long-time, repeat users as well as new business. Groups such as the Order of the Eastern Star have chosen to leave Dayton given the state of the current building and alternative venue options in the region.
Dayton Convention Center Needs Assessment / Market Analysis Study 5
As a point of our survey effort, meeting planners were asked if they would consider meeting at the DCC under three scenarios: remains the same, is renovated/upgraded, or is renovated/upgraded and expanded. Only 28% of meeting planners responded “Definitely Yes” or “Likely” with the existing facility whereas 78% responded favorably with renovations/upgrades and 89% responded favorably with renovations/upgrades and expansion. Inadequate hotel supply was the most common weakness and reason for groups responding “Not Likely” or “Definitely No” to hosting their event at the DCC. Other common weaknesses included the quality of DCC function space, insufficient amount of DCC function space and hotel location. Other operational challenges, such as the limited number of full-time staff and a lack of operating autonomy, also hinder the DCC’s ability to effectively compete for group business. Unlike many other public facilities such as parks and libraries, convention centers operate in a constantly evolving industry where customers have multiple options from which to choose. Remaining status quo will likely result in a continued decline in convention group business and resulting economic/fiscal benefits generated by DCC event activity. The changing competitive environment as well as direct input received from past and potential DCC users suggests market demand for a renovated/enhanced DCC that offers improved aesthetics, greater space functionality, and modern amenities. This desire to return to Dayton or book new group business is driven, in part, by its strengths including location/accessibility, access to membership base and price/value. Event organizers for sports-related competitions also consider Dayton to be a family-friendly environment. Research indicates that conventions/tradeshows and sports competitions are primary market niches that present future growth opportunities. These event types should be considered a booking priority since they have the ability to produce room nights that generate positive economic impact to the area which is consistent with DCC’s mission statement. From a short-term booking perspective (e.g., inside 12 months), facility management should strive to increase the number of banquets/food functions. While these events primarily attract local attendees, they have the ability to positively impact the facility’s financial operations as they tend to be profitable.
Summary of Recommendations A review of historical operations, attributes of competitive facilities and destinations, and industry best practices as well as a comprehensive review of the existing DCC yielded recommended changes to specific operating strategies, program elements and supporting infrastructure that can better meet the expectations of users which will be imperative to the facility’s long-term success. These recommended changes should result in better event functionality, enhanced revenue generation and operating efficiency, as well as additional economic/fiscal impacts for the area. Key Operational Recommendations Although the City of Dayton owns the DCC, Montgomery County also benefits financially from out-of-town visitor spending resulting from DCC operations. Relative to ownership and governance, one option for consideration is forming an authority that has representation from both the City of Dayton and Montgomery County in order to enhance involvement from both jurisdictions. Such a change would also align ownership with a broader set of potential funding sources for ongoing operations and capital improvements.
Dayton Convention Center Needs Assessment / Market Analysis Study 6
Competitive convention centers are owned and operated in a manner that provides them with greater operating autonomy than the current DCC structure as a City of Dayton department including the ability to more cost effectively service event activity. It is strongly recommended that the City of Dayton consider outsourcing management of the DCC to a third party, either a professional management company or the Dayton CVB, in order to provide greater operating autonomy and flexibility with regard to staffing, sales, contracting, and event management. Other operational recommendations include reviewing and modifying the DCC’s mission statement, operating objectives and booking policy to reflect the improved building, current competitive environment, and general industry trends. Booking parameters in terms of timing and responsibilities (e.g., facility management, Dayton CVB) should be clearly articulated along with desired outcomes. Improving marketing efforts and effectiveness with increased full-time staffing, providing incentives for DCC sales staff and enhancing joint efforts with the Dayton CVB, Crowne Plaza, and Marriott at the University of Dayton are also recommended. Recommendations related to food/beverage service include increasing DCC staff to generate short-term bookings and drive sales as well as establishing an annual capital plan to upgrade retail (concession) spaces and graphics and replacing older kitchen equipment. In order to safeguard the past and future investments in any physical improvements to the DCC, the City should develop a formal maintenance and capital improvement process/plan with a dedicated funding source. Key DCC Program Recommendations Based on factors including, but not limited to, the analysis of historical DCC operations, the competitive facility assessment and the existing facility assessment, a needs assessment was prepared. The identified facility needs were grouped into three categories, relating to their priority, difficulty to implement, and relative cost. The DCC is in overall good condition with issues that are primarily due to deferred maintenance and general dated aesthetics. Physical improvement recommendations outlined in the body of the report are prioritized as follows: Short-Term/Low Cost identifies facility deficiencies that are some of the easiest to address and require relatively minimal expenditures of capital funds. This set of needs encompasses items that should be addressed in the next one to two years in order to generally maintain the DCC’s existing level of business. Examples include improving/expanding restrooms, replacing skywalk carpet/ceiling, and upgrading elevators. Mid-Range/Moderate Cost represents a set of facility needs that, in total, will require a dedicated source of capital funding and would more likely occur over the next three to five years. These needs will address more significant issues with the facility and will also make a more impactful contribution to the long-term viability of the DCC as a convention/meeting facility. Examples include replacing telescopic seating, renovating the skywalk to the parking garage to create a positive arrival experience, adding a third passenger elevator, replacing north roof segments and skylight, and repurposing theater dressing rooms as locker rooms.
Dayton Convention Center Needs Assessment / Market Analysis Study 7
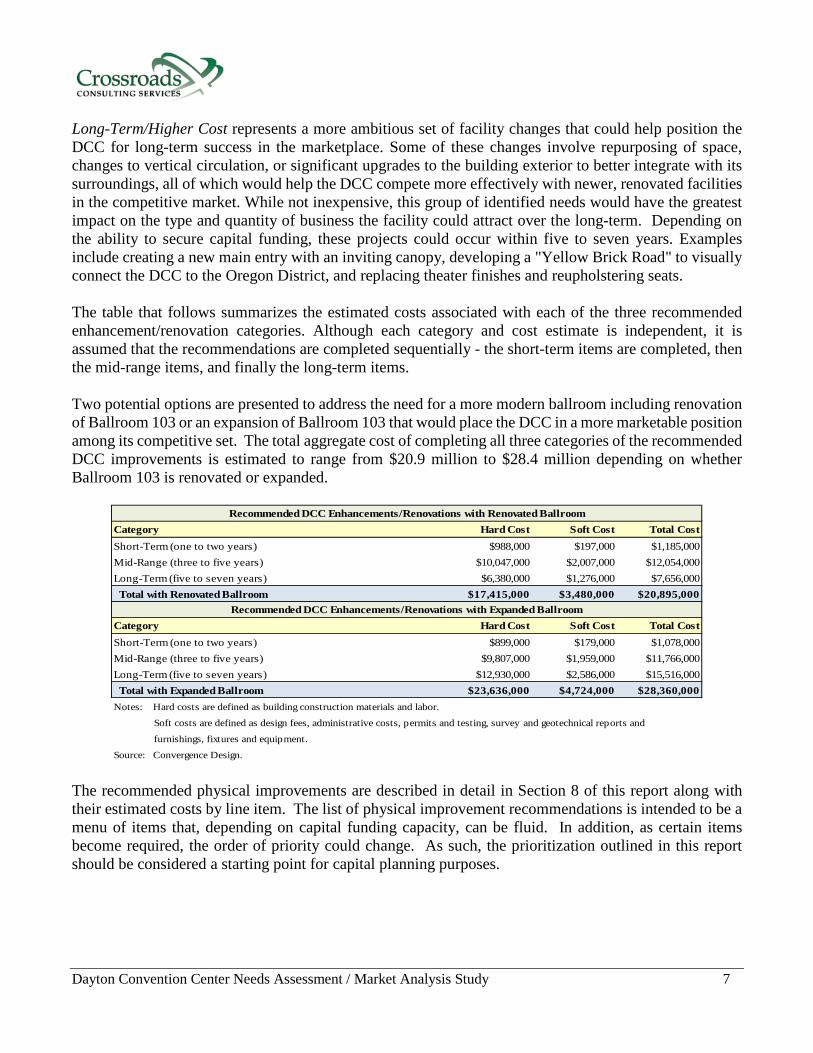
Long-Term/Higher Cost represents a more ambitious set of facility changes that could help position the DCC for long-term success in the marketplace. Some of these changes involve repurposing of space, changes to vertical circulation, or significant upgrades to the building exterior to better integrate with its surroundings, all of which would help the DCC compete more effectively with newer, renovated facilities in the competitive market. While not inexpensive, this group of identified needs would have the greatest impact on the type and quantity of business the facility could attract over the long-term. Depending on the ability to secure capital funding, these projects could occur within five to seven years. Examples include creating a new main entry with an inviting canopy, developing a "Yellow Brick Road" to visually connect the DCC to the Oregon District, and replacing theater finishes and reupholstering seats. The table that follows summarizes the estimated costs associated with each of the three recommended enhancement/renovation categories. Although each category and cost estimate is independent, it is assumed that the recommendations are completed sequentially - the short-term items are completed, then the mid-range items, and finally the long-term items. Two potential options are presented to address the need for a more modern ballroom including renovation of Ballroom 103 or an expansion of Ballroom 103 that would place the DCC in a more marketable position among its competitive set. The total aggregate cost of completing all three categories of the recommended DCC improvements is estimated to range from $20.9 million to $28.4 million depending on whether Ballroom 103 is renovated or expanded.
Category Hard Cost Soft Cost Total CostShort-Term (one to two years) $988,000 $197,000 $1,185,000Mid-Range (three to five years) $10,047,000 $2,007,000 $12,054,000Long-Term (five to seven years) $6,380,000 $1,276,000 $7,656,000 Total with Renovated Ballroom $17,415,000 $3,480,000 $20,895,000
Category Hard Cost Soft Cost Total CostShort-Term (one to two years) $899,000 $179,000 $1,078,000Mid-Range (three to five years) $9,807,000 $1,959,000 $11,766,000Long-Term (five to seven years) $12,930,000 $2,586,000 $15,516,000 Total with Expanded Ballroom $23,636,000 $4,724,000 $28,360,000Notes: Hard costs are defined as building construction materials and labor.
Soft costs are defined as design fees, administrative costs, permits and testing, survey and geotechnical reports and
furnishings, fixtures and equipment.
Source: Convergence Design.
Recommended DCC Enhancements/Renovations with Renovated Ballroom
Recommended DCC Enhancements/Renovations with Expanded Ballroom
The recommended physical improvements are described in detail in Section 8 of this report along with their estimated costs by line item. The list of physical improvement recommendations is intended to be a menu of items that, depending on capital funding capacity, can be fluid. In addition, as certain items become required, the order of priority could change. As such, the prioritization outlined in this report should be considered a starting point for capital planning purposes.
Dayton Convention Center Needs Assessment / Market Analysis Study 8
Key Supporting Infrastructure Recommendations As mentioned previously, competitive destinations including Cincinnati, Cleveland, Columbus and Sharonville have made, or are currently making, improvements to their visitor amenities surrounding their respective convention centers. These include new hotel developments, streetscape improvements, and the creation of a vibrant convention center district to capture visitor spending. It is recommended that the City of Dayton actively advocate, and possibly provide incentives, for private investment in the area surrounding the DCC including additional convention quality hotels, restaurants, and retail establishments. Efforts should also be made to enhance connectivity between the DCC and Oregon District that is more pedestrian friendly/inviting to attendees. While these external improvements may be outside the direct control of the City of Dayton, it should take an active role working with other stakeholders such as the Downtown Dayton Partnership, the Dayton Development Coalition, the Oregon District and the private sector to garner support for such developments.
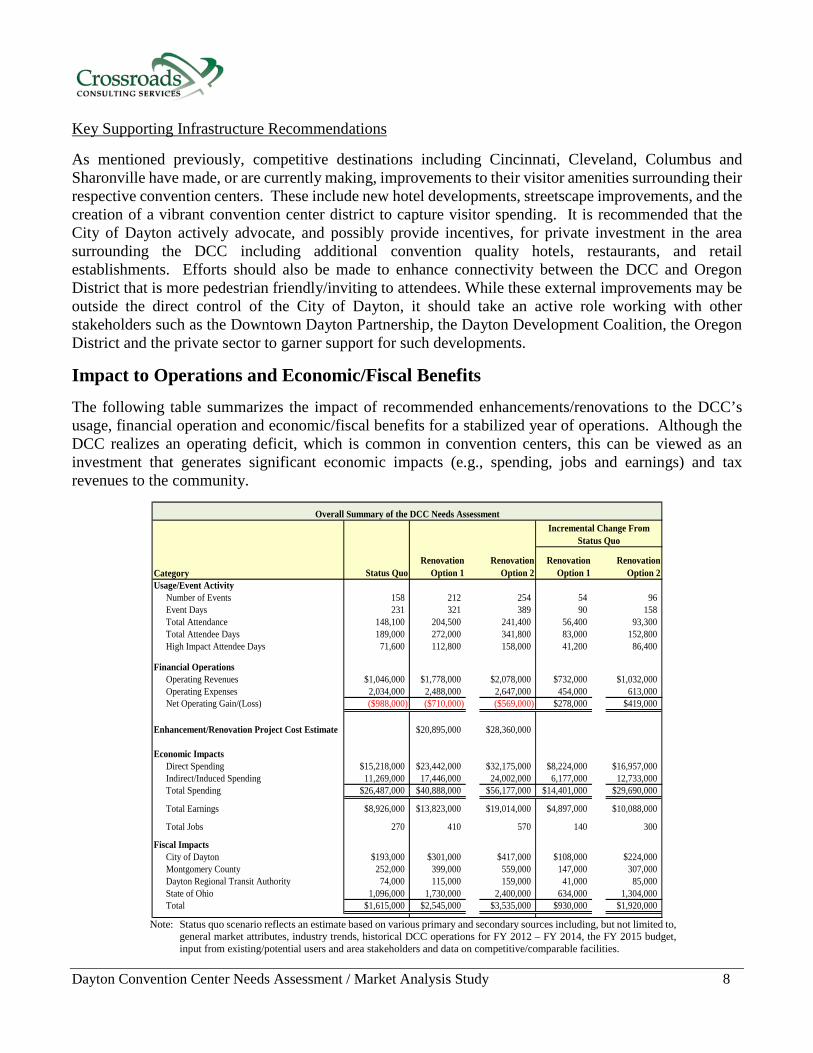
Impact to Operations and Economic/Fiscal Benefits The following table summarizes the impact of recommended enhancements/renovations to the DCC’s usage, financial operation and economic/fiscal benefits for a stabilized year of operations. Although the DCC realizes an operating deficit, which is common in convention centers, this can be viewed as an investment that generates significant economic impacts (e.g., spending, jobs and earnings) and tax revenues to the community.
Category Status QuoRenovation
Option 1Renovation
Option 2Renovation
Option 1Renovation
Option 2Usage/Event Activity
Number of Events 158 212 254 54 96Event Days 231 321 389 90 158Total Attendance 148,100 204,500 241,400 56,400 93,300Total Attendee Days 189,000 272,000 341,800 83,000 152,800High Impact Attendee Days 71,600 112,800 158,000 41,200 86,400
Financial OperationsOperating Revenues $1,046,000 $1,778,000 $2,078,000 $732,000 $1,032,000Operating Expenses 2,034,000 2,488,000 2,647,000 454,000 613,000Net Operating Gain/(Loss) ($988,000) ($710,000) ($569,000) $278,000 $419,000
Enhancement/Renovation Project Cost Estimate $20,895,000 $28,360,000
Economic Impacts Direct Spending $15,218,000 $23,442,000 $32,175,000 $8,224,000 $16,957,000Indirect/Induced Spending 11,269,000 17,446,000 24,002,000 6,177,000 12,733,000Total Spending $26,487,000 $40,888,000 $56,177,000 $14,401,000 $29,690,000
Total Earnings $8,926,000 $13,823,000 $19,014,000 $4,897,000 $10,088,000
Total Jobs 270 410 570 140 300
Fiscal Impacts City of Dayton $193,000 $301,000 $417,000 $108,000 $224,000Montgomery County 252,000 399,000 559,000 147,000 307,000Dayton Regional Transit Authority 74,000 115,000 159,000 41,000 85,000State of Ohio 1,096,000 1,730,000 2,400,000 634,000 1,304,000Total $1,615,000 $2,545,000 $3,535,000 $930,000 $1,920,000
Overall Summary of the DCC Needs AssessmentIncremental Change From
Status Quo
Note: Status quo scenario reflects an estimate based on various primary and secondary sources including, but not limited to,
general market attributes, industry trends, historical DCC operations for FY 2012 – FY 2014, the FY 2015 budget, input from existing/potential users and area stakeholders and data on competitive/comparable facilities.
Dayton Convention Center Needs Assessment / Market Analysis Study 9
Given the physical state of the DCC and its changing competitive market, remaining status quo in terms of capital improvements will likely result in a loss of business and an increased operating deficit. For purposes of this analysis, the status quo scenario assumes that no major capital improvements are made to the DCC and that the facility continues to be operated as a division within the City of Dayton’s Recreation and Youth Services Department. Renovation Option 1 assumes that all the recommended operational and physical improvements are made and that Ballroom 103 is renovated rather than expanded. Renovation Option 2 assumes all recommended operational and physical improvements are made and that Ballroom 103 is expanded. In addition, Renovation Option 2 assumes that additional proximate, convention quality hotels are developed that can service larger conventions. Pursuing the recommended enhancements/renovations outlined in this report will be necessary for the DCC to maintain/grow its business and continue to be a significant economic generator for the City of Dayton and Montgomery County.
Potential Funding Sources Improving the DCC from a physical perspective alone will not allow Dayton to effectively compete in the long-term for convention/meeting business that draws out-of-town visitors. Rather, a combined effort that addresses the building’s physical needs and operational challenges, modernizes its amenities, and enhances supporting elements of the surrounding location (i.e., streetscape improvements; additional hotel, restaurant, retail and entertainment establishments) will place Dayton in a more competitive position. In addition, a strategy that increases sales and marketing efforts will need to be implemented which will require more funding both at the DCC for short-term bookings and at the Dayton CVB for long-term bookings. Currently, there are virtually no dedicated marketing funds in the DCC’s operating budget and the Dayton CVB’s budget is among the smallest in its competitive set. These combined internal and external improvements will serve to retain existing DCC-related visitors, expand its target markets, and capture more spending and resulting economic and fiscal impacts generated by those visitors. Montgomery County used lodging tax revenues to fund the DCC’s debt service until 2013 when the debt was retired. Convention centers in Cincinnati, Cleveland, Columbus and Sharonville have been built, renovated, and/or expanded with the financial support of their respective counties. Each of these counties dedicate a portion of their hotel/motel tax collections to debt service and/or ongoing operations and capital improvements to the convention center located in their primary municipality recognizing the economic value of these investments. Based on input from City of Dayton and Montgomery County officials, one potential public funding source for future DCC improvements could be an increase in the County lodging tax. Based on annual collections over the past three years, a one-point increase could potentially generate approximately $900,000 annually. One benefit of increasing the lodging tax is that this cost is borne by visitors, not area residents, and the DCC should be considered an investment in Dayton’s economy. Also, an increased lodging tax rate should not negatively impact Dayton’s competitive position since, even with a modest increase, the City of Dayton would still have one of the lowest total tax rates on hotels among competitive destinations.
Dayton Convention Center Needs Assessment / Market Analysis Study 10
Other potential public funding sources include a Tax Increment Financing District and/or a Tourism Improvement District where funds generated within an established district can be dedicated to physical improvements as well as enhanced marketing efforts. The DCC is not currently in a defined taxing district but potential exists to create one and should be considered in the overall financing plan. Remaining status quo will have a detrimental impact on the City of Dayton as well as hoteliers, restaurateurs, and other area businesses if DCC event activity continues to decline. Any investment requires a substantial commitment but one that would result in a direct, long-term return. Significant public and private investments have been made in the DCC and downtown Dayton in the past. An ongoing effort to continue to invest in the DCC and to improve the area’s visitor amenities will better position the community to effectively compete for convention/meeting activity that can support its long-term objectives including revitalizing downtown, generating economic benefits, and providing space for local event activity. Potential Next Steps A facility assessment/economic analysis is an initial step in any planning process. Renovating/enhancing the DCC will require detailed proactive and strategic planning to maximize operational opportunities and mitigate potential physical programmatic issues. Potential next steps include: • Exploring potential changes to ownership and operating structure.
• Identifying potential financing strategy and related timeline.
• Securing funding to conduct more detailed site and architectural planning studies that could include, but not be limited to, developing a more detailed spatial program and further refining the preferred renovation option construction cost estimates.
• Addressing other renovation/enhancement related issues such minimizing disruption to the existing DCC and assessing the impact to future bookings.
• Developing a strategic plan for future land uses of surrounding parcels to accommodate long-term development of supporting amenities such as another convention quality hotel or potential expansion of the Crowne Plaza’s room supply.
Because the information presented in the executive summary is extracted from the more detailed report, it is important for the reader to review the report in its entirety in order to gain a better understanding of the research, methodology and assumptions used.

Dayton Convention Center Needs Assessment / Market Analysis Study 11
Table of Contents
1 Introduction and Executive Summary 1 2 General Market Overview 11 3 Key Industry Trends 20 4 Historical Facility Operations 27 5 General Management Practices Assessment 47 6 Physical Facility Assessment 57 7 Competitive Facility Assessment 71 8 Needs Assessment 85 9 Economic Analysis 94
10 Funding Analysis 113
11 Limiting Conditions and Assumptions 120
12 Appendix 122
Dayton Convention Center Needs Assessment / Market Analysis Study 12
General Market Overview
General market conditions such as demographic/economic attributes, the vibrancy of the area immediately surrounding a facility, and overall destination appeal to both event planners/promoters and attendees can all impact a facility’s overall competitiveness within the broader marketplace. This section profiles select market characteristics including demographic/economic statistics, area employment, accessibility, hotel market, attractions, local facilities, and planning efforts.
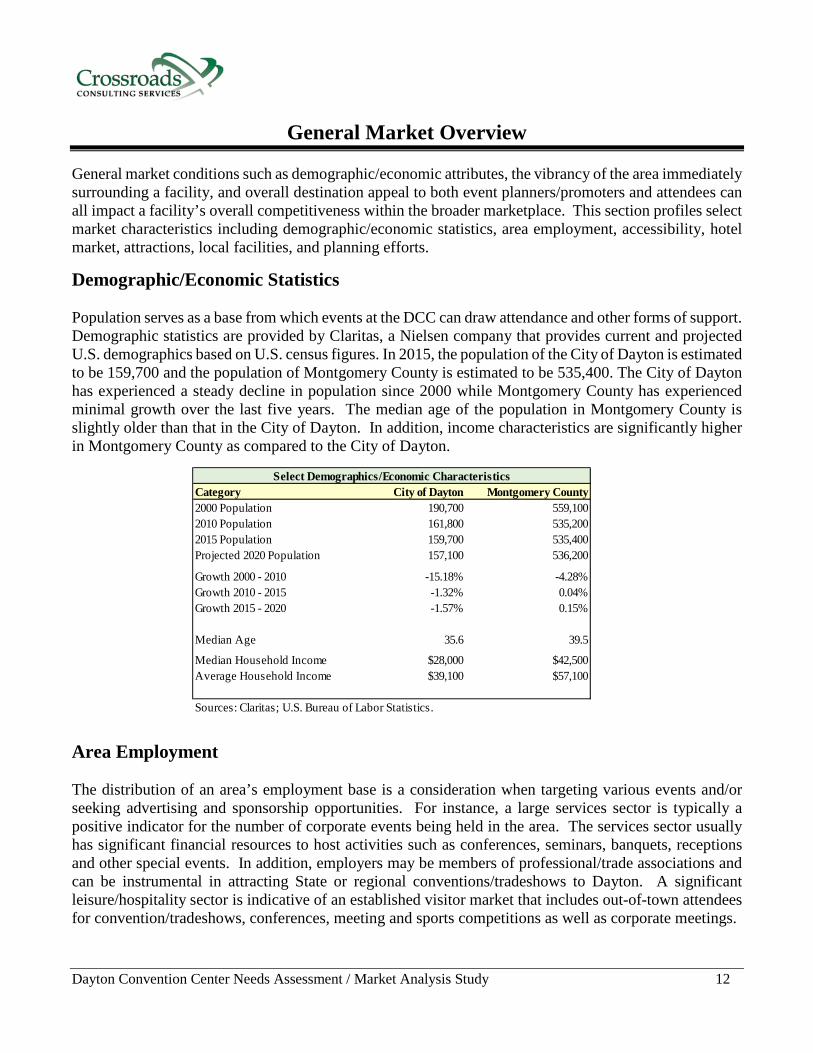
Demographic/Economic Statistics Population serves as a base from which events at the DCC can draw attendance and other forms of support. Demographic statistics are provided by Claritas, a Nielsen company that provides current and projected U.S. demographics based on U.S. census figures. In 2015, the population of the City of Dayton is estimated to be 159,700 and the population of Montgomery County is estimated to be 535,400. The City of Dayton has experienced a steady decline in population since 2000 while Montgomery County has experienced minimal growth over the last five years. The median age of the population in Montgomery County is slightly older than that in the City of Dayton. In addition, income characteristics are significantly higher in Montgomery County as compared to the City of Dayton.
Category City of Dayton Montgomery County2000 Population 190,700 559,1002010 Population 161,800 535,2002015 Population 159,700 535,400Projected 2020 Population 157,100 536,200
Growth 2000 - 2010 -15.18% -4.28%Growth 2010 - 2015 -1.32% 0.04%Growth 2015 - 2020 -1.57% 0.15%
Median Age 35.6 39.5
Median Household Income $28,000 $42,500Average Household Income $39,100 $57,100
Sources: Claritas; U.S. Bureau of Labor Statistics.
Select Demographics/Economic Characteristics
Area Employment The distribution of an area’s employment base is a consideration when targeting various events and/or seeking advertising and sponsorship opportunities. For instance, a large services sector is typically a positive indicator for the number of corporate events being held in the area. The services sector usually has significant financial resources to host activities such as conferences, seminars, banquets, receptions and other special events. In addition, employers may be members of professional/trade associations and can be instrumental in attracting State or regional conventions/tradeshows to Dayton. A significant leisure/hospitality sector is indicative of an established visitor market that includes out-of-town attendees for convention/tradeshows, conferences, meeting and sports competitions as well as corporate meetings.
Dayton Convention Center Needs Assessment / Market Analysis Study 13
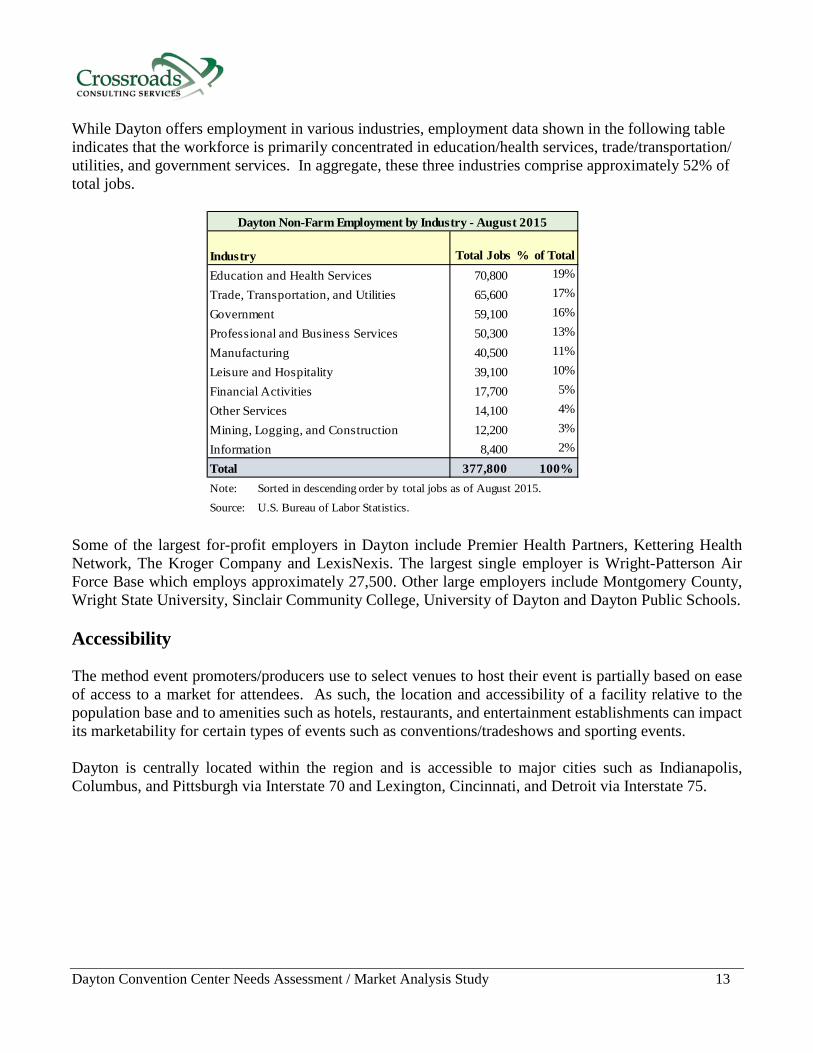
While Dayton offers employment in various industries, employment data shown in the following table indicates that the workforce is primarily concentrated in education/health services, trade/transportation/ utilities, and government services. In aggregate, these three industries comprise approximately 52% of total jobs.
Industry Total Jobs % of TotalEducation and Health Services 70,800 19%
Trade, Transportation, and Utilities 65,600 17%
Government 59,100 16%
Professional and Business Services 50,300 13%
Manufacturing 40,500 11%
Leisure and Hospitality 39,100 10%
Financial Activities 17,700 5%
Other Services 14,100 4%
Mining, Logging, and Construction 12,200 3%
Information 8,400 2%
Total 377,800 100%Note: Sorted in descending order by total jobs as of August 2015.
Source: U.S. Bureau of Labor Statistics.
Dayton Non-Farm Employment by Industry - August 2015
Some of the largest for-profit employers in Dayton include Premier Health Partners, Kettering Health Network, The Kroger Company and LexisNexis. The largest single employer is Wright-Patterson Air Force Base which employs approximately 27,500. Other large employers include Montgomery County, Wright State University, Sinclair Community College, University of Dayton and Dayton Public Schools. Accessibility The method event promoters/producers use to select venues to host their event is partially based on ease of access to a market for attendees. As such, the location and accessibility of a facility relative to the population base and to amenities such as hotels, restaurants, and entertainment establishments can impact its marketability for certain types of events such as conventions/tradeshows and sporting events. Dayton is centrally located within the region and is accessible to major cities such as Indianapolis, Columbus, and Pittsburgh via Interstate 70 and Lexington, Cincinnati, and Detroit via Interstate 75.
Dayton Convention Center Needs Assessment / Market Analysis Study 14
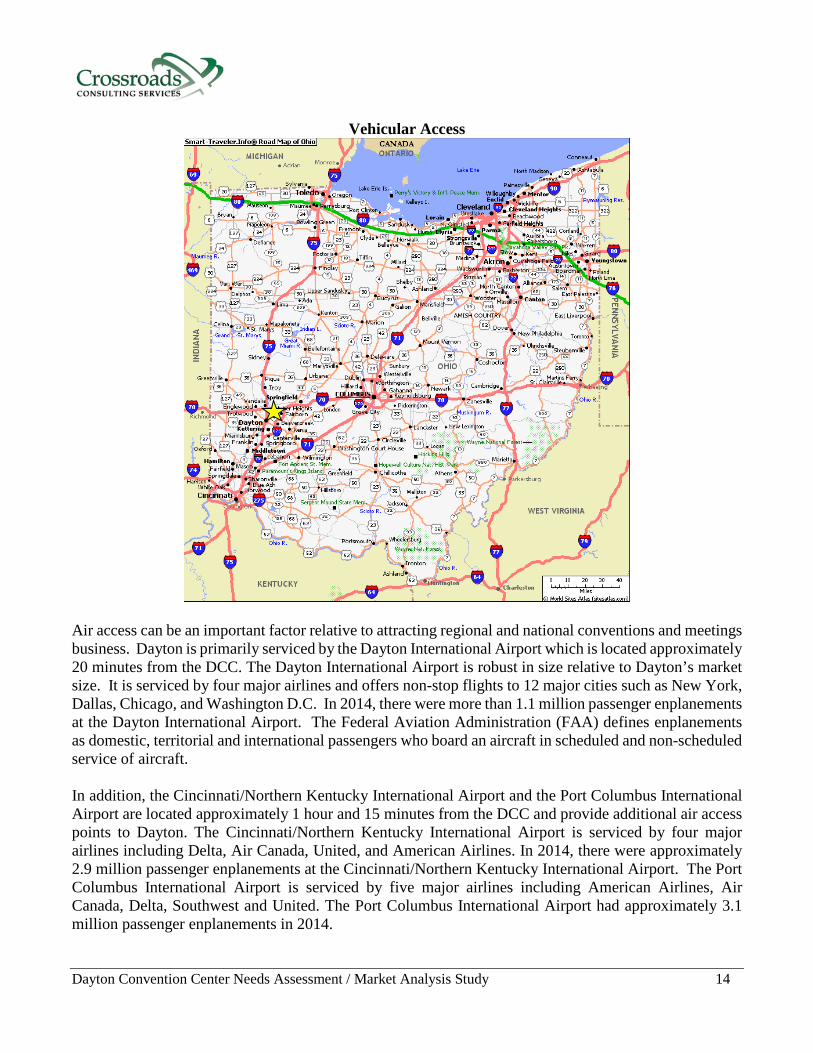
Vehicular Access
Air access can be an important factor relative to attracting regional and national conventions and meetings business. Dayton is primarily serviced by the Dayton International Airport which is located approximately 20 minutes from the DCC. The Dayton International Airport is robust in size relative to Dayton’s market size. It is serviced by four major airlines and offers non-stop flights to 12 major cities such as New York, Dallas, Chicago, and Washington D.C. In 2014, there were more than 1.1 million passenger enplanements at the Dayton International Airport. The Federal Aviation Administration (FAA) defines enplanements as domestic, territorial and international passengers who board an aircraft in scheduled and non-scheduled service of aircraft. In addition, the Cincinnati/Northern Kentucky International Airport and the Port Columbus International Airport are located approximately 1 hour and 15 minutes from the DCC and provide additional air access points to Dayton. The Cincinnati/Northern Kentucky International Airport is serviced by four major airlines including Delta, Air Canada, United, and American Airlines. In 2014, there were approximately 2.9 million passenger enplanements at the Cincinnati/Northern Kentucky International Airport. The Port Columbus International Airport is serviced by five major airlines including American Airlines, Air Canada, Delta, Southwest and United. The Port Columbus International Airport had approximately 3.1 million passenger enplanements in 2014.
Dayton Convention Center Needs Assessment / Market Analysis Study 15
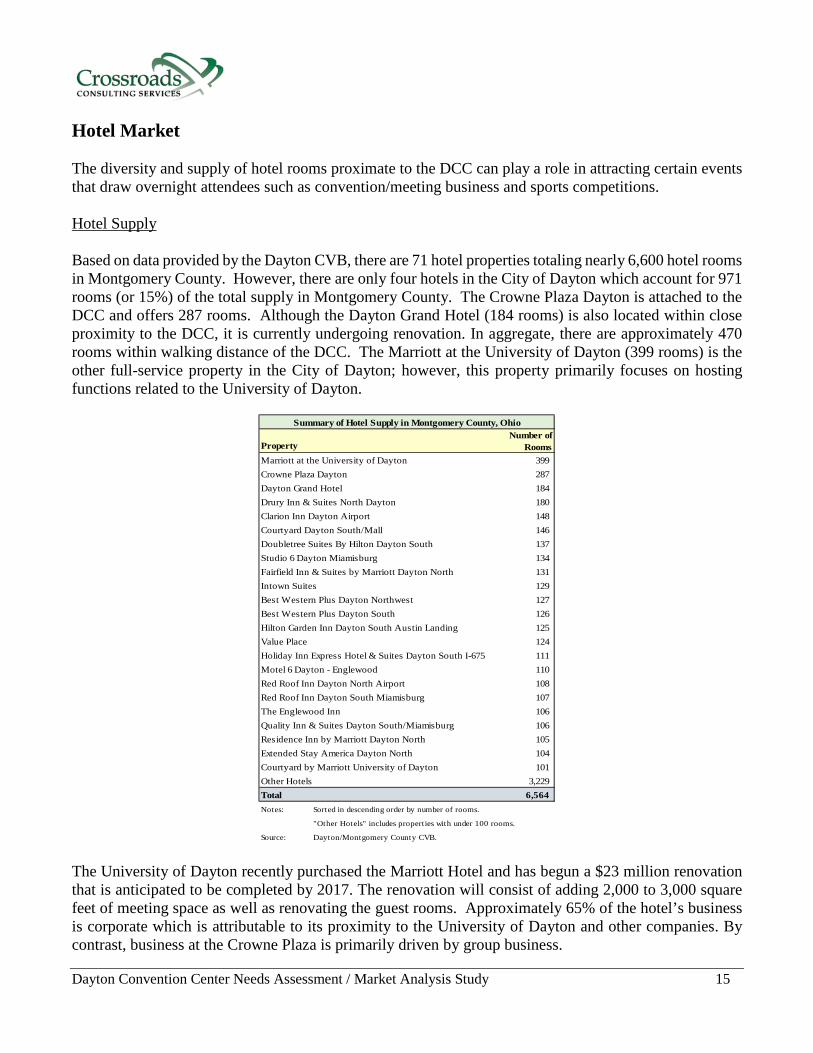
Hotel Market The diversity and supply of hotel rooms proximate to the DCC can play a role in attracting certain events that draw overnight attendees such as convention/meeting business and sports competitions. Hotel Supply Based on data provided by the Dayton CVB, there are 71 hotel properties totaling nearly 6,600 hotel rooms in Montgomery County. However, there are only four hotels in the City of Dayton which account for 971 rooms (or 15%) of the total supply in Montgomery County. The Crowne Plaza Dayton is attached to the DCC and offers 287 rooms. Although the Dayton Grand Hotel (184 rooms) is also located within close proximity to the DCC, it is currently undergoing renovation. In aggregate, there are approximately 470 rooms within walking distance of the DCC. The Marriott at the University of Dayton (399 rooms) is the other full-service property in the City of Dayton; however, this property primarily focuses on hosting functions related to the University of Dayton.
PropertyNumber of
RoomsMarriott at the University of Dayton 399 Crowne Plaza Dayton 287 Dayton Grand Hotel 184 Drury Inn & Suites North Dayton 180 Clarion Inn Dayton Airport 148 Courtyard Dayton South/Mall 146 Doubletree Suites By Hilton Dayton South 137 Studio 6 Dayton Miamisburg 134 Fairfield Inn & Suites by Marriott Dayton North 131 Intown Suites 129 Best Western Plus Dayton Northwest 127 Best Western Plus Dayton South 126 Hilton Garden Inn Dayton South Austin Landing 125 Value Place 124 Holiday Inn Express Hotel & Suites Dayton South I-675 111 Motel 6 Dayton - Englewood 110 Red Roof Inn Dayton North Airport 108 Red Roof Inn Dayton South Miamisburg 107 The Englewood Inn 106 Quality Inn & Suites Dayton South/Miamisburg 106 Residence Inn by Marriott Dayton North 105 Extended Stay America Dayton North 104 Courtyard by Marriott University of Dayton 101 Other Hotels 3,229 Total 6,564 Notes: Sorted in descending order by number of rooms.
"Other Hotels" includes properties with under 100 rooms.
Source: Dayton/Montgomery County CVB.
Summary of Hotel Supply in Montgomery County, Ohio
The University of Dayton recently purchased the Marriott Hotel and has begun a $23 million renovation that is anticipated to be completed by 2017. The renovation will consist of adding 2,000 to 3,000 square feet of meeting space as well as renovating the guest rooms. Approximately 65% of the hotel’s business is corporate which is attributable to its proximity to the University of Dayton and other companies. By contrast, business at the Crowne Plaza is primarily driven by group business.
Dayton Convention Center Needs Assessment / Market Analysis Study 16
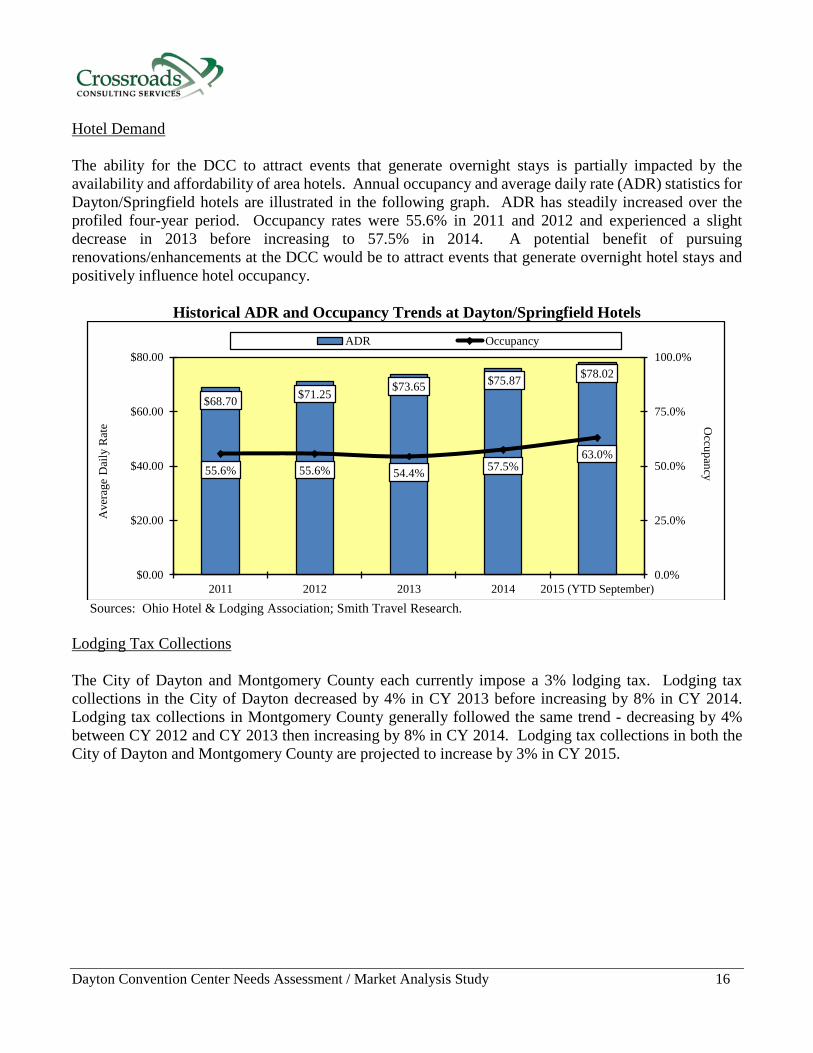
Hotel Demand The ability for the DCC to attract events that generate overnight stays is partially impacted by the availability and affordability of area hotels. Annual occupancy and average daily rate (ADR) statistics for Dayton/Springfield hotels are illustrated in the following graph. ADR has steadily increased over the profiled four-year period. Occupancy rates were 55.6% in 2011 and 2012 and experienced a slight decrease in 2013 before increasing to 57.5% in 2014. A potential benefit of pursuing renovations/enhancements at the DCC would be to attract events that generate overnight hotel stays and positively influence hotel occupancy.
Historical ADR and Occupancy Trends at Dayton/Springfield Hotels
Sources: Ohio Hotel & Lodging Association; Smith Travel Research.
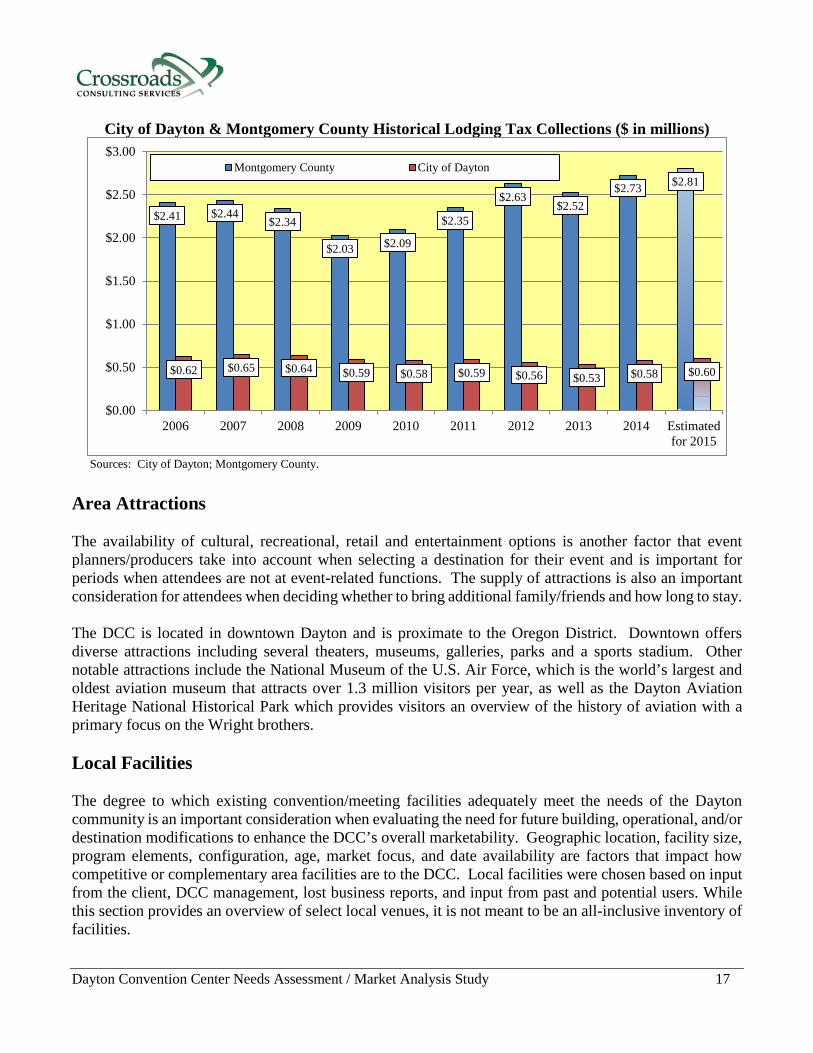
Lodging Tax Collections The City of Dayton and Montgomery County each currently impose a 3% lodging tax. Lodging tax collections in the City of Dayton decreased by 4% in CY 2013 before increasing by 8% in CY 2014. Lodging tax collections in Montgomery County generally followed the same trend - decreasing by 4% between CY 2012 and CY 2013 then increasing by 8% in CY 2014. Lodging tax collections in both the City of Dayton and Montgomery County are projected to increase by 3% in CY 2015.
$68.70 $71.25 $73.65 $75.87 $78.02
55.6% 55.6% 54.4% 57.5%63.0%
0.0%
25.0%
50.0%
75.0%
100.0%
$0.00
$20.00
$40.00
$60.00
$80.00
2011 2012 2013 2014 2015 (YTD September)
Occupancy
Ave
rage
Dai
ly R
ate
ADR Occupancy
Dayton Convention Center Needs Assessment / Market Analysis Study 17
City of Dayton & Montgomery County Historical Lodging Tax Collections ($ in millions)
Sources: City of Dayton; Montgomery County.
Area Attractions The availability of cultural, recreational, retail and entertainment options is another factor that event planners/producers take into account when selecting a destination for their event and is important for periods when attendees are not at event-related functions. The supply of attractions is also an important consideration for attendees when deciding whether to bring additional family/friends and how long to stay. The DCC is located in downtown Dayton and is proximate to the Oregon District. Downtown offers diverse attractions including several theaters, museums, galleries, parks and a sports stadium. Other notable attractions include the National Museum of the U.S. Air Force, which is the world’s largest and oldest aviation museum that attracts over 1.3 million visitors per year, as well as the Dayton Aviation Heritage National Historical Park which provides visitors an overview of the history of aviation with a primary focus on the Wright brothers. Local Facilities The degree to which existing convention/meeting facilities adequately meet the needs of the Dayton community is an important consideration when evaluating the need for future building, operational, and/or destination modifications to enhance the DCC’s overall marketability. Geographic location, facility size, program elements, configuration, age, market focus, and date availability are factors that impact how competitive or complementary area facilities are to the DCC. Local facilities were chosen based on input from the client, DCC management, lost business reports, and input from past and potential users. While this section provides an overview of select local venues, it is not meant to be an all-inclusive inventory of facilities.
$2.41 $2.44$2.34
$2.03 $2.09
$2.35
$2.63$2.52
$2.73 $2.81
$0.62 $0.65 $0.64 $0.59 $0.58 $0.59 $0.56 $0.53 $0.58 $0.60
$0.00
$0.50
$1.00
$1.50
$2.00
$2.50
$3.00
2006 2007 2008 2009 2010 2011 2012 2013 2014 Estimatedfor 2015
Montgomery County City of Dayton
Dayton Convention Center Needs Assessment / Market Analysis Study 18
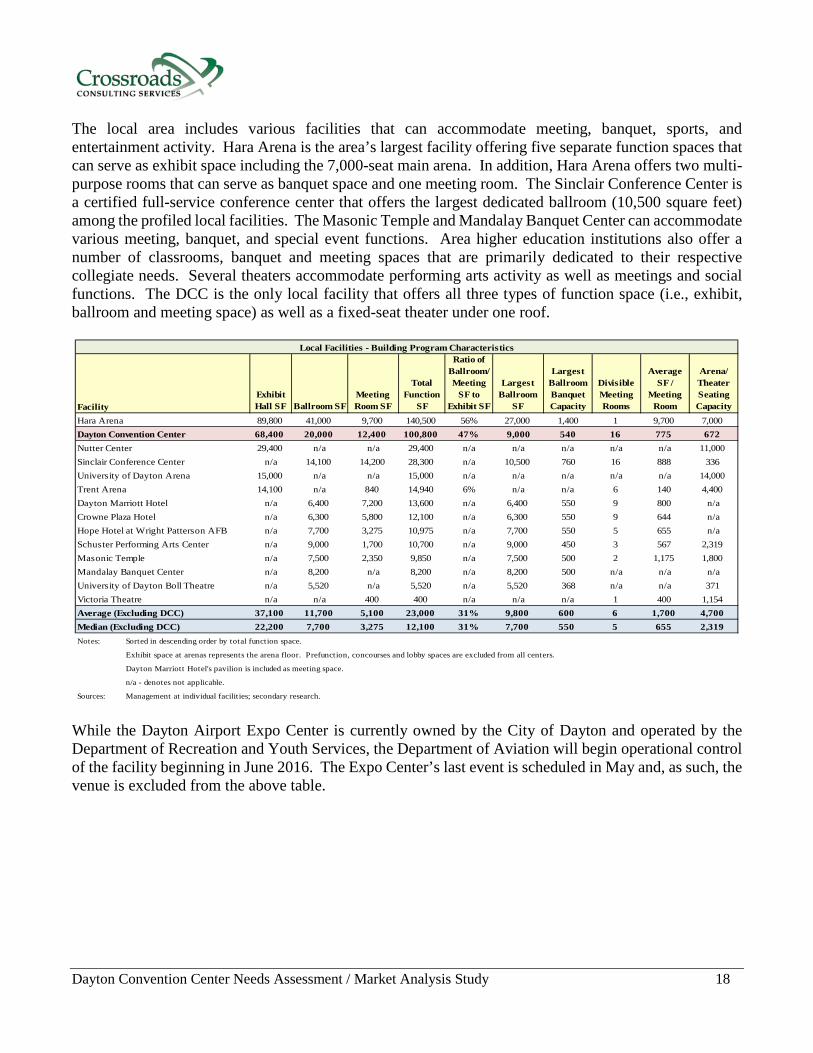
The local area includes various facilities that can accommodate meeting, banquet, sports, and entertainment activity. Hara Arena is the area’s largest facility offering five separate function spaces that can serve as exhibit space including the 7,000-seat main arena. In addition, Hara Arena offers two multi-purpose rooms that can serve as banquet space and one meeting room. The Sinclair Conference Center is a certified full-service conference center that offers the largest dedicated ballroom (10,500 square feet) among the profiled local facilities. The Masonic Temple and Mandalay Banquet Center can accommodate various meeting, banquet, and special event functions. Area higher education institutions also offer a number of classrooms, banquet and meeting spaces that are primarily dedicated to their respective collegiate needs. Several theaters accommodate performing arts activity as well as meetings and social functions. The DCC is the only local facility that offers all three types of function space (i.e., exhibit, ballroom and meeting space) as well as a fixed-seat theater under one roof.
FacilityExhibit Hall SF Ballroom SF
Meeting Room SF
Total Function
SF
Ratio of Ballroom/ Meeting
SF to Exhibit SF
Largest Ballroom
SF
Largest Ballroom Banquet Capacity
Divisible Meeting Rooms
Average SF /
Meeting Room
Arena/ Theater Seating Capacity
Hara Arena 89,800 41,000 9,700 140,500 56% 27,000 1,400 1 9,700 7,000Dayton Convention Center 68,400 20,000 12,400 100,800 47% 9,000 540 16 775 672Nutter Center 29,400 n/a n/a 29,400 n/a n/a n/a n/a n/a 11,000Sinclair Conference Center n/a 14,100 14,200 28,300 n/a 10,500 760 16 888 336University of Dayton Arena 15,000 n/a n/a 15,000 n/a n/a n/a n/a n/a 14,000Trent Arena 14,100 n/a 840 14,940 6% n/a n/a 6 140 4,400Dayton Marriott Hotel n/a 6,400 7,200 13,600 n/a 6,400 550 9 800 n/aCrowne Plaza Hotel n/a 6,300 5,800 12,100 n/a 6,300 550 9 644 n/aHope Hotel at Wright Patterson AFB n/a 7,700 3,275 10,975 n/a 7,700 550 5 655 n/aSchuster Performing Arts Center n/a 9,000 1,700 10,700 n/a 9,000 450 3 567 2,319Masonic Temple n/a 7,500 2,350 9,850 n/a 7,500 500 2 1,175 1,800Mandalay Banquet Center n/a 8,200 n/a 8,200 n/a 8,200 500 n/a n/a n/aUniversity of Dayton Boll Theatre n/a 5,520 n/a 5,520 n/a 5,520 368 n/a n/a 371Victoria Theatre n/a n/a 400 400 n/a n/a n/a 1 400 1,154Average (Excluding DCC) 37,100 11,700 5,100 23,000 31% 9,800 600 6 1,700 4,700Median (Excluding DCC) 22,200 7,700 3,275 12,100 31% 7,700 550 5 655 2,319Notes: Sorted in descending order by total function space.
Exhibit space at arenas represents the arena floor. Prefunction, concourses and lobby spaces are excluded from all centers.
Dayton Marriott Hotel's pavilion is included as meeting space.
n/a - denotes not applicable.
Sources: Management at individual facilit ies; secondary research.
Local Facilities - Building Program Characteristics
While the Dayton Airport Expo Center is currently owned by the City of Dayton and operated by the Department of Recreation and Youth Services, the Department of Aviation will begin operational control of the facility beginning in June 2016. The Expo Center’s last event is scheduled in May and, as such, the venue is excluded from the above table.
Dayton Convention Center Needs Assessment / Market Analysis Study 19
Planning Efforts Groups such as the Downtown Dayton Partnership are continually striving to position downtown Dayton as a vibrant, pedestrian-friendly, urban environment. Public and private developments can positively impact DCC operations in a variety of ways including, creating a more dynamic destination through enhanced visitor amenities as well as by establishing new or enhanced industry connections to the City Dayton. Several of the ongoing efforts occurring in the City of Dayton are summarized below. City of Dayton Greater Downtown Plan The City of Dayton Greater Downtown Plan aims to capitalize on downtown’s strength by utilizing the underutilized or not utilized spaces downtown; creating interconnectivity downtown through the development of a bus loop as well as a bike share transportation system; and continuing to encourage the development of small businesses by providing a network for small business owners. These plans are expected to increase the marketability of the City of Dayton as a community-friendly, unique, and vibrant urban environment. Oregon District One of the major developments in the Oregon District is the shuttle service. The free Oregon District Shuttle provides a convenient way to explore the various shops, restaurants, bars, and other businesses in the Oregon District. The shuttle runs on a hop on and off method with various stops throughout the Oregon District and operates Fridays and Saturdays from 5pm to 1am with shuttles arriving every 15 minutes. Miami Valley Regional Planning Commission Throughout 2015, the Miami Valley Regional Planning Commission is partnering with Montgomery County to implement their Open Space Planning. Open Space Planning is centered on improving outdoor spaces, entertainment, and personal well-being. The initiative also aims to provide environmental services such as flood control, providing natural habitats for wildlife, and improving overall water and air quality. Summary Market characteristics such as population base, accessibility and hotel supply as well as destination attributes such as attractions, restaurants and retail establishments impact a facility’s ability to attract non-local events and capture visitor spending that generates economic and fiscal impacts. The DCC’s downtown setting as well as Dayton’s central location, accessibility, attractions, and affordability offer a marketable destination for a variety of group business including conventions, competitive sports, banquets, meetings, and consumer shows.
Dayton Convention Center Needs Assessment / Market Analysis Study 20
Table of Contents
1 Introduction and Executive Summary 1 2 General Market Overview 11 3 Key Industry Trends 20 4 Historical Facility Operations 27 5 General Management Practices Assessment 47 6 Physical Facility Assessment 57 7 Competitive Facility Assessment 71 8 Needs Assessment 85 9 Economic Analysis 94
10 Funding Analysis 113
11 Limiting Conditions and Assumptions 120
12 Appendix 122
Dayton Convention Center Needs Assessment / Market Analysis Study 21
Key Industry Trends
Potential demand associated with any public assembly facility is somewhat dependent on the attributes of the industry(s) as a whole as well as specific target market segments. This analysis is based on information provided by secondary sources including, but not limited to, Center for Exhibition Industry Research (CEIR), Meeting Professionals International (MPI), Trade Show Executive, International Association of Conference Centers (IACC), Destination Marketing Association International (DMAI), Pollstar, IBISWorld, and the Sports and Fitness Industry Association. This section outlines key trends in the convention/meeting and competitive sports industries that may impact future operations of the DCC. Convention/Meetings Business The following summarizes key trends in the convention/meetings industry:
• The convention/meetings market has experienced tremendous growth in the supply of space over the past two decades.
• This growth coupled with an economic downturn created a gap in the supply of space and demand for space that led to a more competitive buyer’s market. – Numerous facilities can now accommodate meeting planners’ needs strictly in terms of the amount
of space required. – Hotels and larger convention centers are vying for more moderately sized group business.
• Hotels with exhibit and/or ballroom/meeting space can have an advantage over stand-alone meeting facilities because they control all major components of an event (i.e., function space, lodging and food/beverage) under one roof. Since the hotel is the primary beneficiary of all revenue streams, it can negotiate packages as it sees fit in any or all areas to attract business. – Some privately operated hotels offer entertainment (i.e., a headliner act for a banquet) as part of
their overall package to entice meeting planners. Some of these properties, such as those adjacent to casinos, are situated in suburban locations, remote from other businesses that might attract some of the attendee spending away from the hotel’s internal revenue generators.
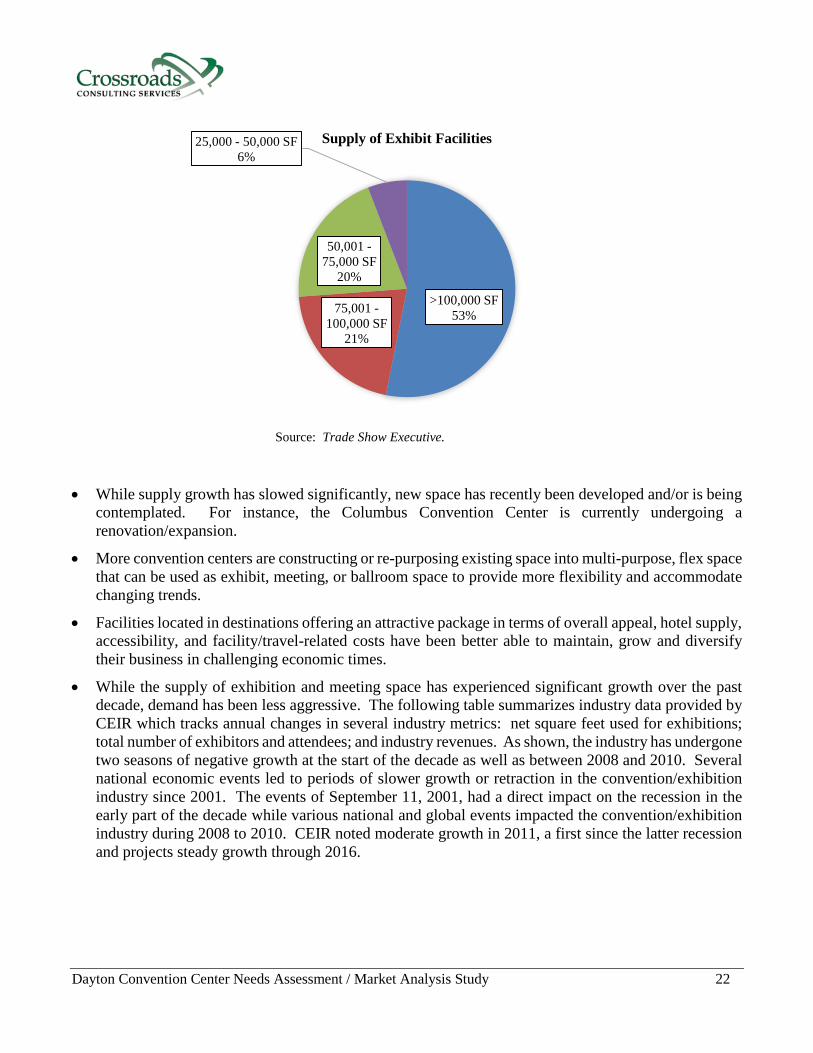
• The pie chart that follows represents the supply of exhibit facilities within the U.S. based on information from Trade Show Executive. Of the 250+ facilities located in the U.S., 53% offer greater than 100,000 square feet while only 6% offer between 25,000 and 50,000 square feet.
Dayton Convention Center Needs Assessment / Market Analysis Study 22
Source: Trade Show Executive. • While supply growth has slowed significantly, new space has recently been developed and/or is being
contemplated. For instance, the Columbus Convention Center is currently undergoing a renovation/expansion.
• More convention centers are constructing or re-purposing existing space into multi-purpose, flex space that can be used as exhibit, meeting, or ballroom space to provide more flexibility and accommodate changing trends.
• Facilities located in destinations offering an attractive package in terms of overall appeal, hotel supply, accessibility, and facility/travel-related costs have been better able to maintain, grow and diversify their business in challenging economic times.
• While the supply of exhibition and meeting space has experienced significant growth over the past decade, demand has been less aggressive. The following table summarizes industry data provided by CEIR which tracks annual changes in several industry metrics: net square feet used for exhibitions; total number of exhibitors and attendees; and industry revenues. As shown, the industry has undergone two seasons of negative growth at the start of the decade as well as between 2008 and 2010. Several national economic events led to periods of slower growth or retraction in the convention/exhibition industry since 2001. The events of September 11, 2001, had a direct impact on the recession in the early part of the decade while various national and global events impacted the convention/exhibition industry during 2008 to 2010. CEIR noted moderate growth in 2011, a first since the latter recession and projects steady growth through 2016.
>100,000 SF53%75,001 -
100,000 SF21%
50,001 -75,000 SF
20%
25,000 - 50,000 SF6%
Supply of Exhibit Facilities
Dayton Convention Center Needs Assessment / Market Analysis Study 23
Metric 2001 2002 2003 2004 2005 2006 2007 2008 2009 2010 2011 2012 2013 2014p 2015p 2016pCAGR,
2000-2013Net SF 1.2 -3.3 0.0 3.8 2.2 1.4 3.6 -1.4 -10.9 -1.7 1.9 1.0 0.8 1.9 2.9 2.6 -0.2Exhibitors -2.5 -3.2 2.0 2.6 2.2 -1.8 2.2 -2.0 -10.7 -1.1 2.4 0.5 0.5 1.6 2.5 3.0 -0.8Attendees -2.7 -4.2 3.0 2.4 -0.5 0.7 3.9 -3.2 -7.5 3.2 3.1 2.3 2.0 2.0 2.7 2.4 0.1Real Revenues1 3.8 -5.6 -2.1 3.9 5.7 0.6 4.8 -3.6 -9.6 -5.1 2.5 1.1 0.9 2.3 3.5 3.1 -0.3Total -0.1 -4.1 0.7 3.2 2.4 0.2 3.6 -2.6 -9.7 -1.2 2.5 1.2 1.0 2.0 2.9 2.7 -0.3Notes: 1Inflation adjusted revenues, adjusted for CPI for all urban consumers. p = projectedSource: CEIR 2014.
Year-On-Year Percent Change of the Metrics and CEIR Index
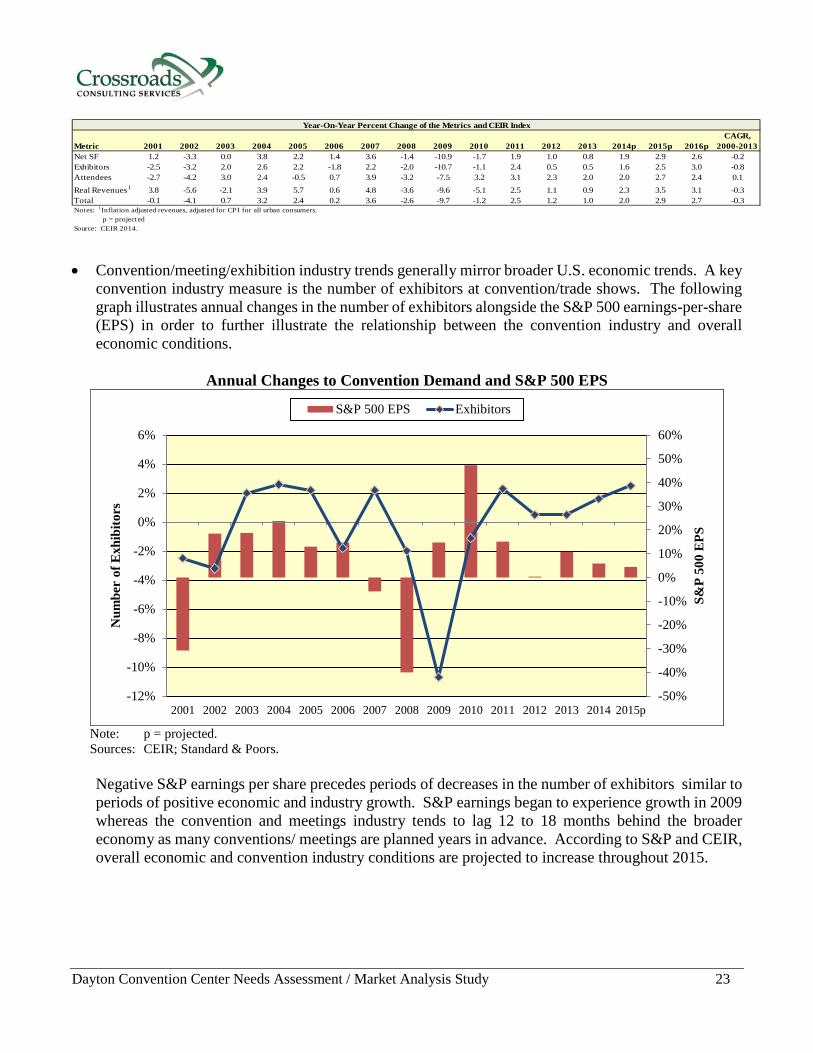
• Convention/meeting/exhibition industry trends generally mirror broader U.S. economic trends. A key
convention industry measure is the number of exhibitors at convention/trade shows. The following graph illustrates annual changes in the number of exhibitors alongside the S&P 500 earnings-per-share (EPS) in order to further illustrate the relationship between the convention industry and overall economic conditions.
Annual Changes to Convention Demand and S&P 500 EPS
Note: p = projected. Sources: CEIR; Standard & Poors.
Negative S&P earnings per share precedes periods of decreases in the number of exhibitors similar to periods of positive economic and industry growth. S&P earnings began to experience growth in 2009 whereas the convention and meetings industry tends to lag 12 to 18 months behind the broader economy as many conventions/ meetings are planned years in advance. According to S&P and CEIR, overall economic and convention industry conditions are projected to increase throughout 2015.
-50%
-40%
-30%
-20%
-10%
0%
10%
20%
30%
40%
50%
60%
-12%
-10%
-8%
-6%
-4%
-2%
0%
2%
4%
6%
2001 2002 2003 2004 2005 2006 2007 2008 2009 2010 2011 2012 2013 2014 2015pS&
P 50
0 E
PS
Num
ber
of E
xhib
itors
S&P 500 EPS Exhibitors
Dayton Convention Center Needs Assessment / Market Analysis Study 24
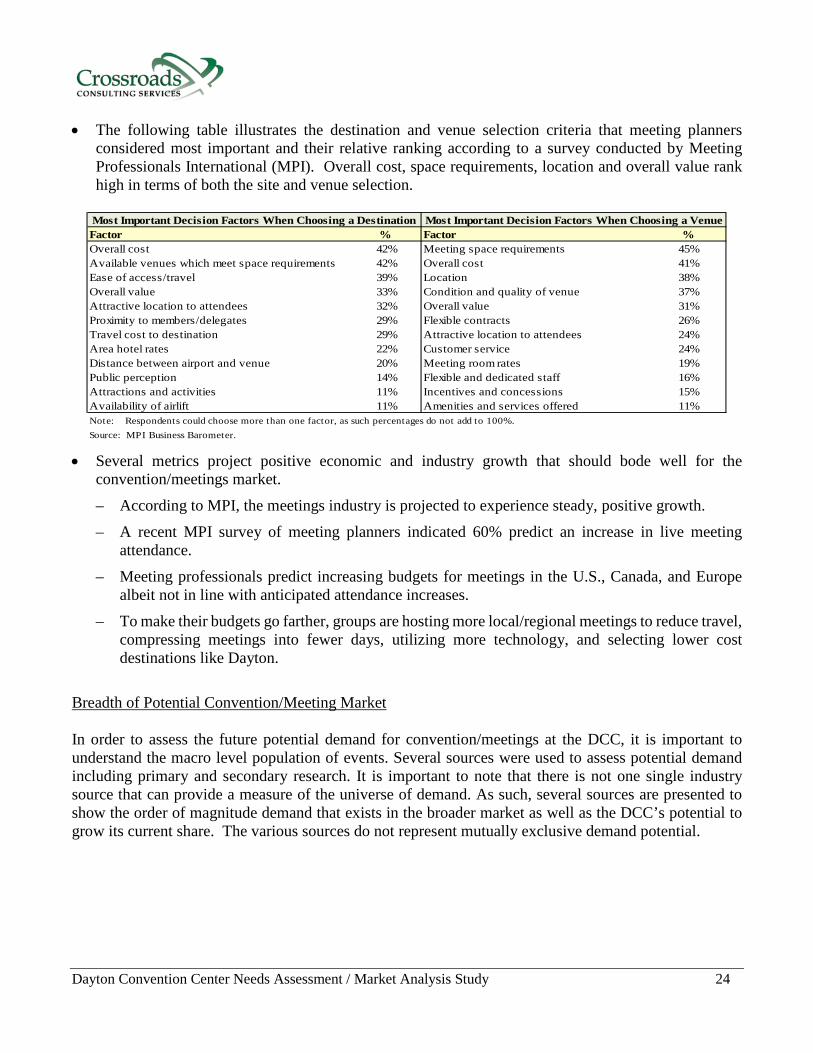
• The following table illustrates the destination and venue selection criteria that meeting planners considered most important and their relative ranking according to a survey conducted by Meeting Professionals International (MPI). Overall cost, space requirements, location and overall value rank high in terms of both the site and venue selection.
Factor % Factor %Overall cost 42% Meeting space requirements 45%Available venues which meet space requirements 42% Overall cost 41%Ease of access/travel 39% Location 38%Overall value 33% Condition and quality of venue 37%Attractive location to attendees 32% Overall value 31%Proximity to members/delegates 29% Flexible contracts 26%Travel cost to destination 29% Attractive location to attendees 24%Area hotel rates 22% Customer service 24%Distance between airport and venue 20% Meeting room rates 19%Public perception 14% Flexible and dedicated staff 16%Attractions and activities 11% Incentives and concessions 15%Availability of airlift 11% Amenities and services offered 11%Note: Respondents could choose more than one factor, as such percentages do not add to 100%.Source: MPI Business Barometer.
Most Important Decision Factors When Choosing a Destination Most Important Decision Factors When Choosing a Venue
• Several metrics project positive economic and industry growth that should bode well for the
convention/meetings market. – According to MPI, the meetings industry is projected to experience steady, positive growth. – A recent MPI survey of meeting planners indicated 60% predict an increase in live meeting
attendance. – Meeting professionals predict increasing budgets for meetings in the U.S., Canada, and Europe
albeit not in line with anticipated attendance increases. – To make their budgets go farther, groups are hosting more local/regional meetings to reduce travel,
compressing meetings into fewer days, utilizing more technology, and selecting lower cost destinations like Dayton.
Breadth of Potential Convention/Meeting Market In order to assess the future potential demand for convention/meetings at the DCC, it is important to understand the macro level population of events. Several sources were used to assess potential demand including primary and secondary research. It is important to note that there is not one single industry source that can provide a measure of the universe of demand. As such, several sources are presented to show the order of magnitude demand that exists in the broader market as well as the DCC’s potential to grow its current share. The various sources do not represent mutually exclusive demand potential.
Dayton Convention Center Needs Assessment / Market Analysis Study 25
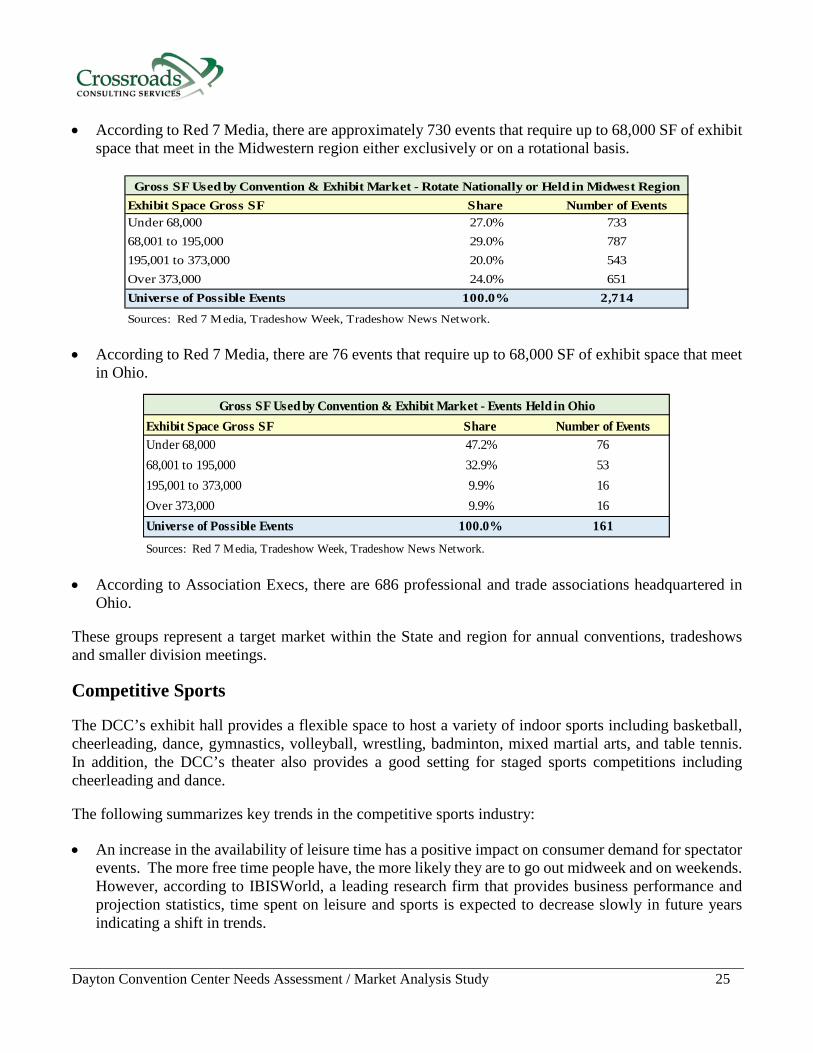
• According to Red 7 Media, there are approximately 730 events that require up to 68,000 SF of exhibit space that meet in the Midwestern region either exclusively or on a rotational basis.
Exhibit Space Gross SF Share Number of EventsUnder 68,000 27.0% 733 68,001 to 195,000 29.0% 787 195,001 to 373,000 20.0% 543 Over 373,000 24.0% 651 Universe of Possible Events 100.0% 2,714
Sources: Red 7 Media, Tradeshow Week, Tradeshow News Network.
Gross SF Used by Convention & Exhibit Market - Rotate Nationally or Held in Midwest Region
• According to Red 7 Media, there are 76 events that require up to 68,000 SF of exhibit space that meet
in Ohio.
Exhibit Space Gross SF Share Number of EventsUnder 68,000 47.2% 76 68,001 to 195,000 32.9% 53 195,001 to 373,000 9.9% 16 Over 373,000 9.9% 16 Universe of Possible Events 100.0% 161
Sources: Red 7 Media, Tradeshow Week, Tradeshow News Network.
Gross SF Used by Convention & Exhibit Market - Events Held in Ohio
• According to Association Execs, there are 686 professional and trade associations headquartered in Ohio.
These groups represent a target market within the State and region for annual conventions, tradeshows and smaller division meetings. Competitive Sports The DCC’s exhibit hall provides a flexible space to host a variety of indoor sports including basketball, cheerleading, dance, gymnastics, volleyball, wrestling, badminton, mixed martial arts, and table tennis. In addition, the DCC’s theater also provides a good setting for staged sports competitions including cheerleading and dance. The following summarizes key trends in the competitive sports industry:
• An increase in the availability of leisure time has a positive impact on consumer demand for spectator events. The more free time people have, the more likely they are to go out midweek and on weekends. However, according to IBISWorld, a leading research firm that provides business performance and projection statistics, time spent on leisure and sports is expected to decrease slowly in future years indicating a shift in trends.

Dayton Convention Center Needs Assessment / Market Analysis Study 26
• More communities are realizing the value of sports tourism as an economic generator.
• The competitive youth and adult amateur sports industry has continued to be a significant market opportunity with multiple sports/age groups/demand segments.
• Based on a survey of households conducted by the Sports and Fitness Industry Association in conjunction with the Physical Activity Council, there are an estimated 68.7 million indoor sport participants representing a significant demand segment for competitive level tournaments that could be held in the DCC.
• Demand is less impacted by economic fluctuations as participants and family/friends are willing to travel significant distances for their preferred sport.
• More communities are developing specialized indoor and/or outdoor complexes to accommodate multiple games/competitions due to their value as a tourism generator.
• It is important for destinations to have a strong volunteer base and elite level leagues to support and promote tournament activity that generates overnight stays.
Summary The convention/meetings market has experienced tremendous growth in the supply of space creating a gap in supply and demand which has led to a more competitive buyer’s market. Numerous facilities can accommodate meeting planners’ needs strictly in terms of the amount of space required including larger convention centers that are vying for more moderately sized events as well as hotels that are aggressively marketing their function space to small and mid-sized events. Smaller convention centers such as the DCC must compete on the overall package – price, value, quality customer service, and destination attributes. Facilities located in destinations offering an attractive package in terms of overall appeal, hotel supply, accessibility, and facility/travel-related costs have been better able to maintain, grow and diversify their business in challenging economic times. Communities are increasingly seeing the value of hosting competitive sporting events given their ability to attract overnight visitors and associated spending on lodging, transportation, restaurants, retail, and entertainment establishments. Convention centers are well-suited to host a variety of indoor sporting events given the flexibility of their exhibit halls. The DCC’s theater is a competitive advantage for sports competitions that require a stage. Destinations that offer good highway accessibility, a family-friendly environment and hotels at a variety of price points are preferred by sporting event organizers. Most event attendees are willing to drive between the host facility and their hotels within five to ten miles which makes Dayton appealing to these groups given the location of its hotel supply in relation to the DCC.
Dayton Convention Center Needs Assessment / Market Analysis Study 27
Table of Contents
1 Introduction and Executive Summary 1 2 General Market Overview 11 3 Key Industry Trends 20 4 Historical Facility Operations 27 5 General Management Practices Assessment 47 6 Physical Facility Assessment 57 7 Competitive Facility Assessment 71 8 Needs Assessment 85 9 Economic Analysis 94
10 Funding Analysis 113
11 Limiting Conditions and Assumptions 120
12 Appendix 122
Dayton Convention Center Needs Assessment / Market Analysis Study 28
Historical Facility Operations
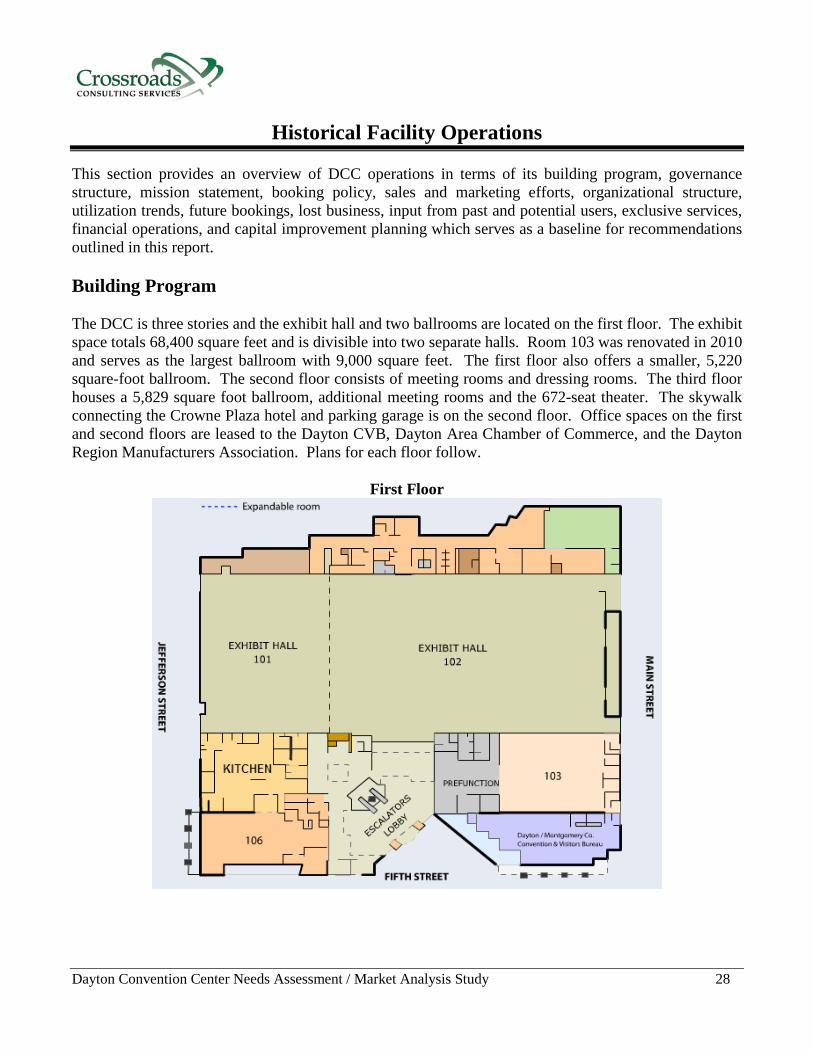
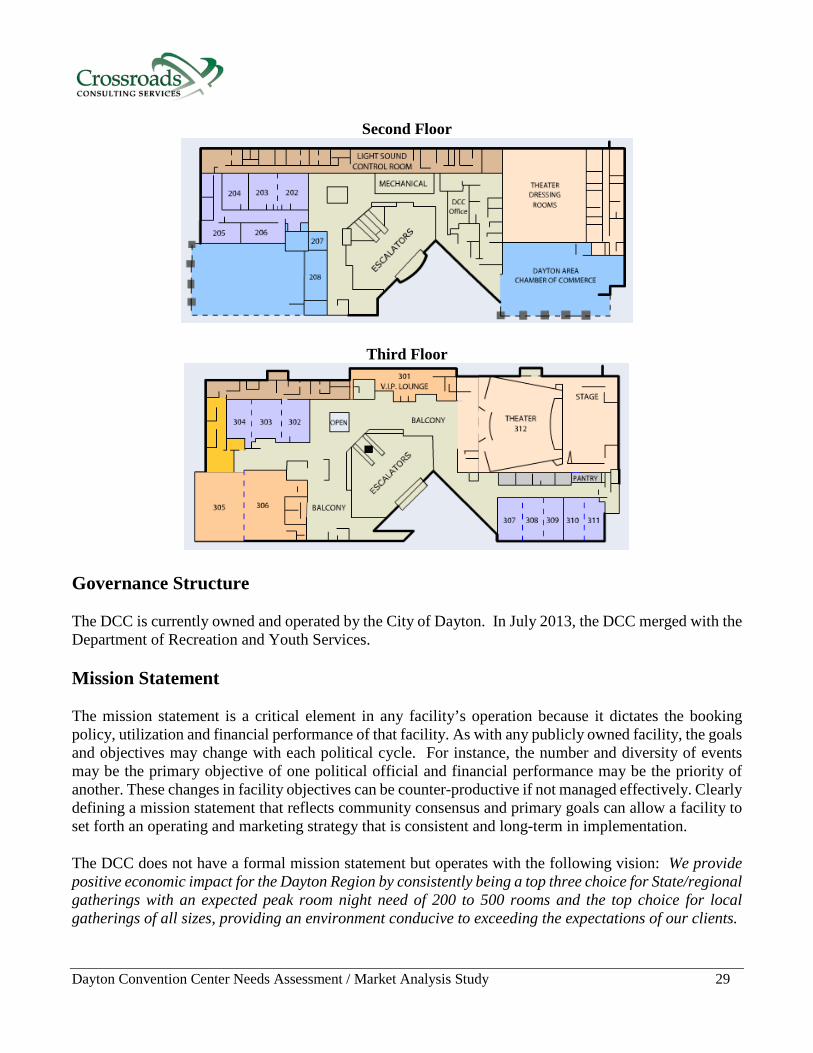
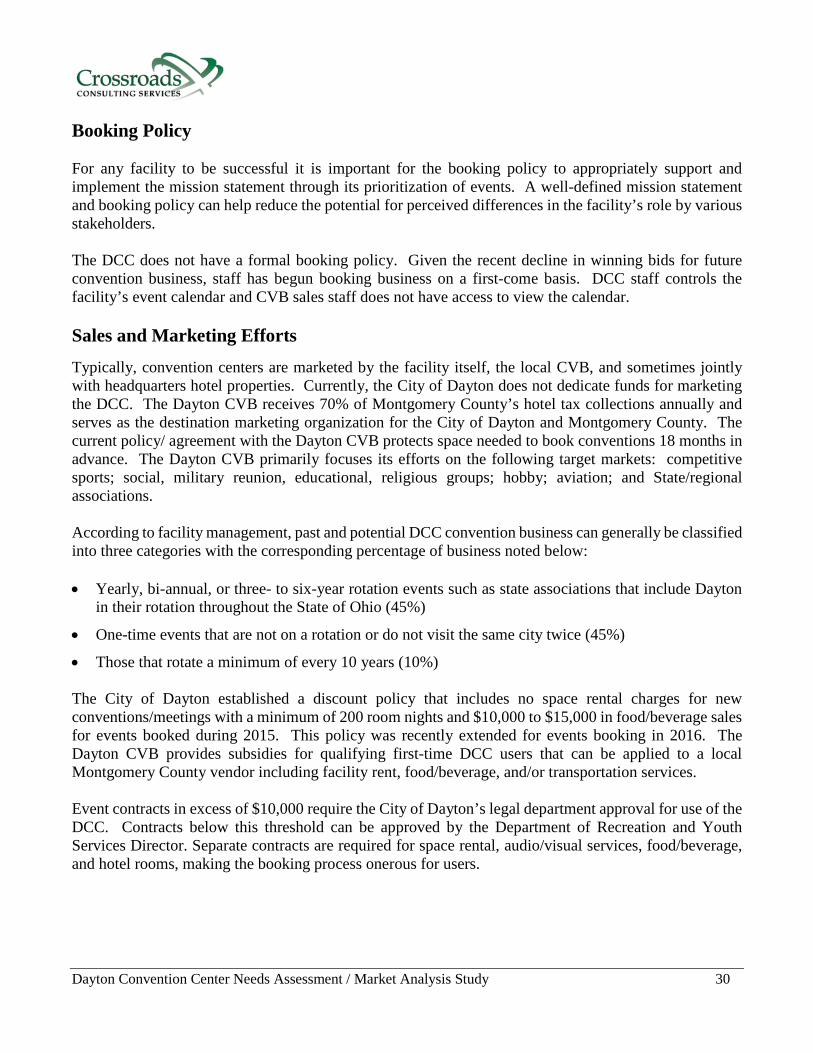
This section provides an overview of DCC operations in terms of its building program, governance structure, mission statement, booking policy, sales and marketing efforts, organizational structure, utilization trends, future bookings, lost business, input from past and potential users, exclusive services, financial operations, and capital improvement planning which serves as a baseline for recommendations outlined in this report. Building Program The DCC is three stories and the exhibit hall and two ballrooms are located on the first floor. The exhibit space totals 68,400 square feet and is divisible into two separate halls. Room 103 was renovated in 2010 and serves as the largest ballroom with 9,000 square feet. The first floor also offers a smaller, 5,220 square-foot ballroom. The second floor consists of meeting rooms and dressing rooms. The third floor houses a 5,829 square foot ballroom, additional meeting rooms and the 672-seat theater. The skywalk connecting the Crowne Plaza hotel and parking garage is on the second floor. Office spaces on the first and second floors are leased to the Dayton CVB, Dayton Area Chamber of Commerce, and the Dayton Region Manufacturers Association. Plans for each floor follow.
First Floor
Dayton Convention Center Needs Assessment / Market Analysis Study 29
Second Floor
Third Floor
Governance Structure The DCC is currently owned and operated by the City of Dayton. In July 2013, the DCC merged with the Department of Recreation and Youth Services. Mission Statement The mission statement is a critical element in any facility’s operation because it dictates the booking policy, utilization and financial performance of that facility. As with any publicly owned facility, the goals and objectives may change with each political cycle. For instance, the number and diversity of events may be the primary objective of one political official and financial performance may be the priority of another. These changes in facility objectives can be counter-productive if not managed effectively. Clearly defining a mission statement that reflects community consensus and primary goals can allow a facility to set forth an operating and marketing strategy that is consistent and long-term in implementation. The DCC does not have a formal mission statement but operates with the following vision: We provide positive economic impact for the Dayton Region by consistently being a top three choice for State/regional gatherings with an expected peak room night need of 200 to 500 rooms and the top choice for local gatherings of all sizes, providing an environment conducive to exceeding the expectations of our clients.
Dayton Convention Center Needs Assessment / Market Analysis Study 30
Booking Policy For any facility to be successful it is important for the booking policy to appropriately support and implement the mission statement through its prioritization of events. A well-defined mission statement and booking policy can help reduce the potential for perceived differences in the facility’s role by various stakeholders. The DCC does not have a formal booking policy. Given the recent decline in winning bids for future convention business, staff has begun booking business on a first-come basis. DCC staff controls the facility’s event calendar and CVB sales staff does not have access to view the calendar. Sales and Marketing Efforts Typically, convention centers are marketed by the facility itself, the local CVB, and sometimes jointly with headquarters hotel properties. Currently, the City of Dayton does not dedicate funds for marketing the DCC. The Dayton CVB receives 70% of Montgomery County’s hotel tax collections annually and serves as the destination marketing organization for the City of Dayton and Montgomery County. The current policy/ agreement with the Dayton CVB protects space needed to book conventions 18 months in advance. The Dayton CVB primarily focuses its efforts on the following target markets: competitive sports; social, military reunion, educational, religious groups; hobby; aviation; and State/regional associations. According to facility management, past and potential DCC convention business can generally be classified into three categories with the corresponding percentage of business noted below: • Yearly, bi-annual, or three- to six-year rotation events such as state associations that include Dayton
in their rotation throughout the State of Ohio (45%)
• One-time events that are not on a rotation or do not visit the same city twice (45%)
• Those that rotate a minimum of every 10 years (10%) The City of Dayton established a discount policy that includes no space rental charges for new conventions/meetings with a minimum of 200 room nights and $10,000 to $15,000 in food/beverage sales for events booked during 2015. This policy was recently extended for events booking in 2016. The Dayton CVB provides subsidies for qualifying first-time DCC users that can be applied to a local Montgomery County vendor including facility rent, food/beverage, and/or transportation services. Event contracts in excess of $10,000 require the City of Dayton’s legal department approval for use of the DCC. Contracts below this threshold can be approved by the Department of Recreation and Youth Services Director. Separate contracts are required for space rental, audio/visual services, food/beverage, and hotel rooms, making the booking process onerous for users.
Dayton Convention Center Needs Assessment / Market Analysis Study 31
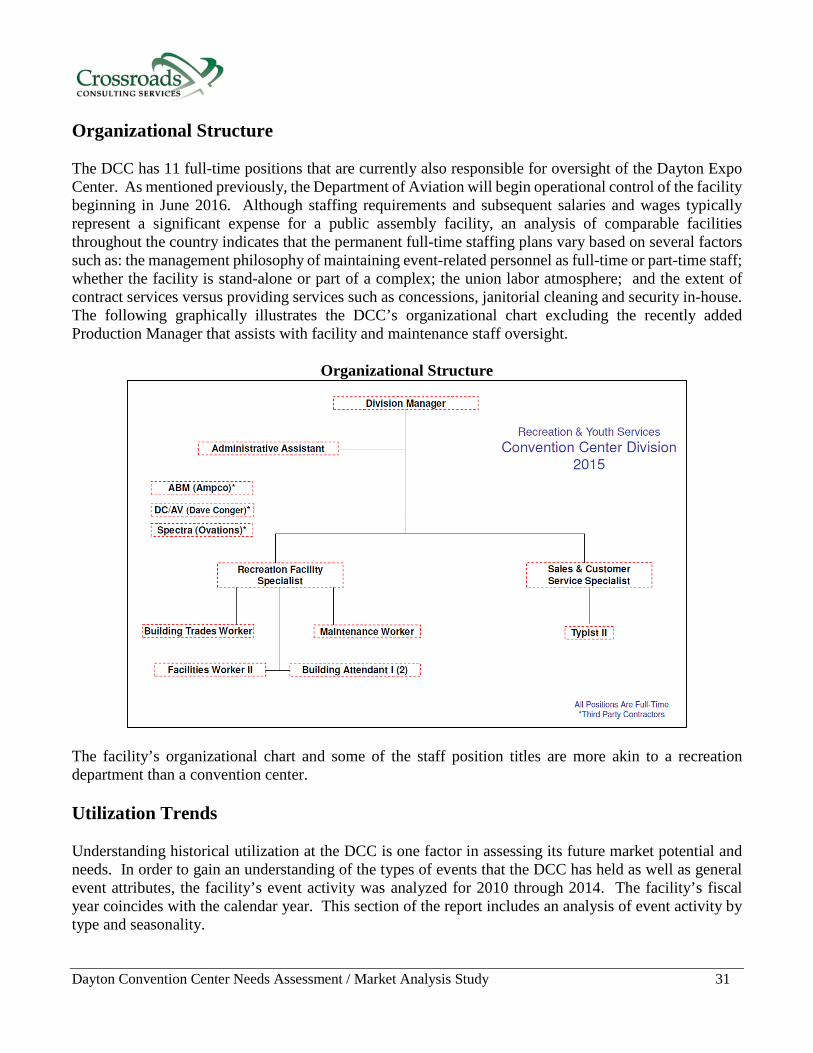
Organizational Structure The DCC has 11 full-time positions that are currently also responsible for oversight of the Dayton Expo Center. As mentioned previously, the Department of Aviation will begin operational control of the facility beginning in June 2016. Although staffing requirements and subsequent salaries and wages typically represent a significant expense for a public assembly facility, an analysis of comparable facilities throughout the country indicates that the permanent full-time staffing plans vary based on several factors such as: the management philosophy of maintaining event-related personnel as full-time or part-time staff; whether the facility is stand-alone or part of a complex; the union labor atmosphere; and the extent of contract services versus providing services such as concessions, janitorial cleaning and security in-house. The following graphically illustrates the DCC’s organizational chart excluding the recently added Production Manager that assists with facility and maintenance staff oversight.
Organizational Structure
The facility’s organizational chart and some of the staff position titles are more akin to a recreation department than a convention center. Utilization Trends Understanding historical utilization at the DCC is one factor in assessing its future market potential and needs. In order to gain an understanding of the types of events that the DCC has held as well as general event attributes, the facility’s event activity was analyzed for 2010 through 2014. The facility’s fiscal year coincides with the calendar year. This section of the report includes an analysis of event activity by type and seasonality.
Dayton Convention Center Needs Assessment / Market Analysis Study 32
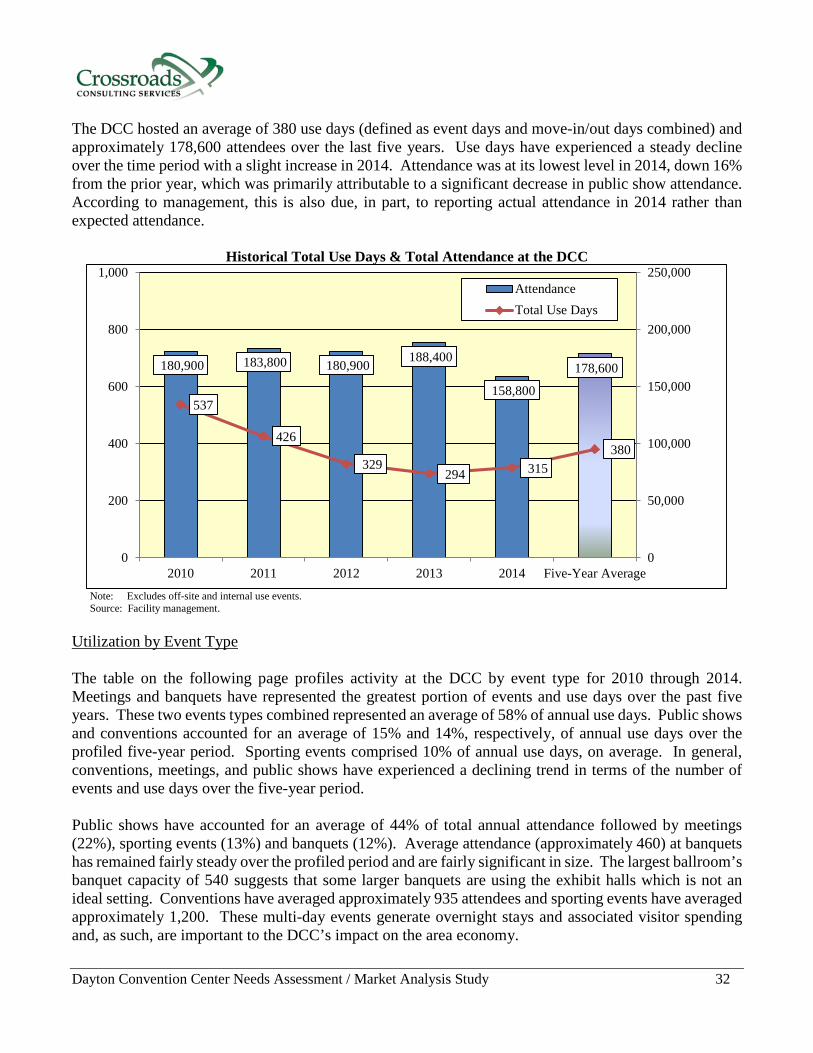
The DCC hosted an average of 380 use days (defined as event days and move-in/out days combined) and approximately 178,600 attendees over the last five years. Use days have experienced a steady decline over the time period with a slight increase in 2014. Attendance was at its lowest level in 2014, down 16% from the prior year, which was primarily attributable to a significant decrease in public show attendance. According to management, this is also due, in part, to reporting actual attendance in 2014 rather than expected attendance.
Historical Total Use Days & Total Attendance at the DCC
Note: Excludes off-site and internal use events. Source: Facility management.
Utilization by Event Type The table on the following page profiles activity at the DCC by event type for 2010 through 2014. Meetings and banquets have represented the greatest portion of events and use days over the past five years. These two events types combined represented an average of 58% of annual use days. Public shows and conventions accounted for an average of 15% and 14%, respectively, of annual use days over the profiled five-year period. Sporting events comprised 10% of annual use days, on average. In general, conventions, meetings, and public shows have experienced a declining trend in terms of the number of events and use days over the five-year period. Public shows have accounted for an average of 44% of total annual attendance followed by meetings (22%), sporting events (13%) and banquets (12%). Average attendance (approximately 460) at banquets has remained fairly steady over the profiled period and are fairly significant in size. The largest ballroom’s banquet capacity of 540 suggests that some larger banquets are using the exhibit halls which is not an ideal setting. Conventions have averaged approximately 935 attendees and sporting events have averaged approximately 1,200. These multi-day events generate overnight stays and associated visitor spending and, as such, are important to the DCC’s impact on the area economy.
180,900 183,800 180,900 188,400
158,800
178,600
537
426
329 294 315
380
0
50,000
100,000
150,000
200,000
250,000
0
200
400
600
800
1,000
2010 2011 2012 2013 2014 Five-Year Average
AttendanceTotal Use Days
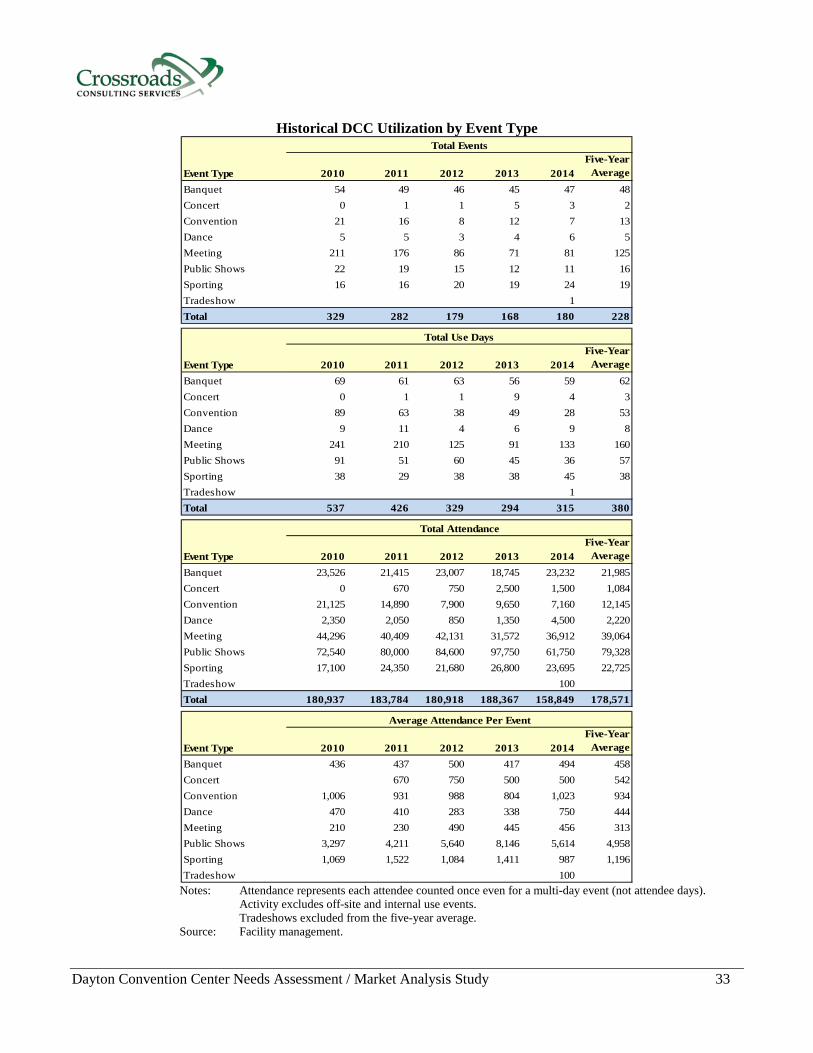
Dayton Convention Center Needs Assessment / Market Analysis Study 33
Historical DCC Utilization by Event Type
Event Type 2010 2011 2012 2013 2014Five-Year
AverageBanquet 54 49 46 45 47 48Concert 0 1 1 5 3 2Convention 21 16 8 12 7 13Dance 5 5 3 4 6 5Meeting 211 176 86 71 81 125Public Shows 22 19 15 12 11 16Sporting 16 16 20 19 24 19Tradeshow 1Total 329 282 179 168 180 228
Event Type 2010 2011 2012 2013 2014Five-Year
AverageBanquet 69 61 63 56 59 62Concert 0 1 1 9 4 3Convention 89 63 38 49 28 53Dance 9 11 4 6 9 8Meeting 241 210 125 91 133 160Public Shows 91 51 60 45 36 57Sporting 38 29 38 38 45 38Tradeshow 1Total 537 426 329 294 315 380
Event Type 2010 2011 2012 2013 2014Five-Year
AverageBanquet 23,526 21,415 23,007 18,745 23,232 21,985Concert 0 670 750 2,500 1,500 1,084Convention 21,125 14,890 7,900 9,650 7,160 12,145Dance 2,350 2,050 850 1,350 4,500 2,220Meeting 44,296 40,409 42,131 31,572 36,912 39,064Public Shows 72,540 80,000 84,600 97,750 61,750 79,328Sporting 17,100 24,350 21,680 26,800 23,695 22,725Tradeshow 100Total 180,937 183,784 180,918 188,367 158,849 178,571
Event Type 2010 2011 2012 2013 2014Five-Year
AverageBanquet 436 437 500 417 494 458Concert 670 750 500 500 542Convention 1,006 931 988 804 1,023 934Dance 470 410 283 338 750 444Meeting 210 230 490 445 456 313Public Shows 3,297 4,211 5,640 8,146 5,614 4,958Sporting 1,069 1,522 1,084 1,411 987 1,196Tradeshow 100
Total Events
Average Attendance Per Event
Total Use Days
Total Attendance
Notes: Attendance represents each attendee counted once even for a multi-day event (not attendee days). Activity excludes off-site and internal use events. Tradeshows excluded from the five-year average. Source: Facility management.
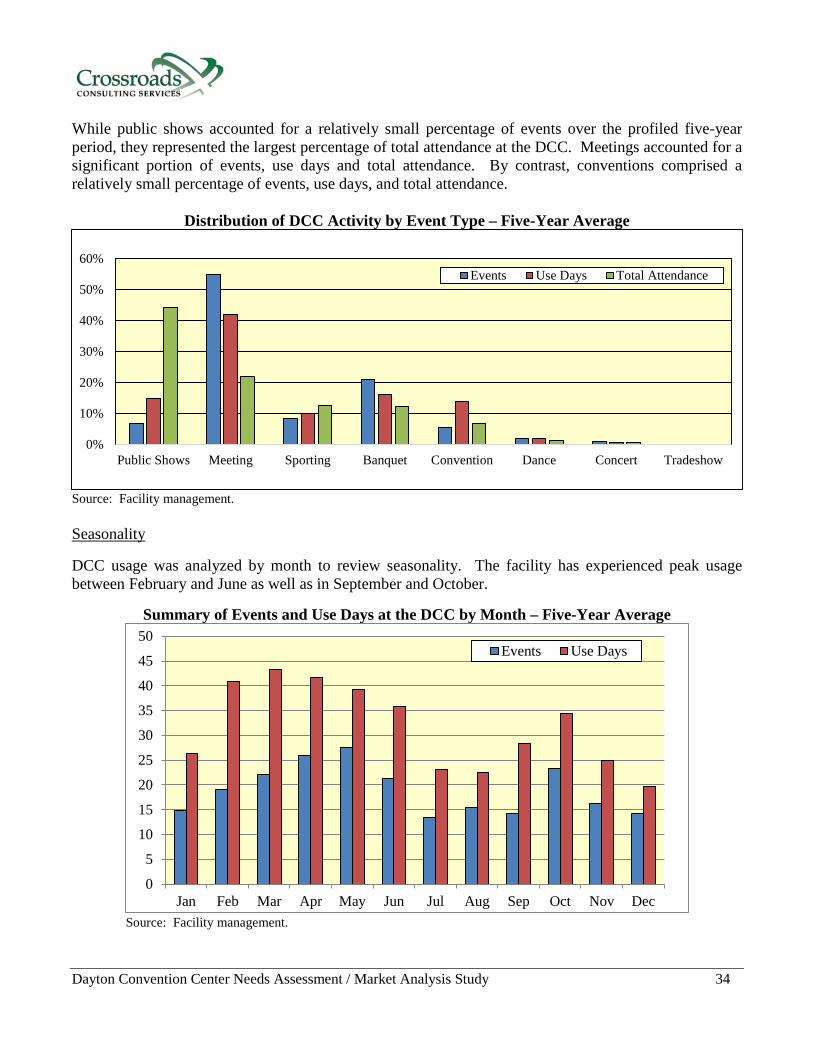
Dayton Convention Center Needs Assessment / Market Analysis Study 34
While public shows accounted for a relatively small percentage of events over the profiled five-year period, they represented the largest percentage of total attendance at the DCC. Meetings accounted for a significant portion of events, use days and total attendance. By contrast, conventions comprised a relatively small percentage of events, use days, and total attendance.
Distribution of DCC Activity by Event Type – Five-Year Average
Source: Facility management. Seasonality
DCC usage was analyzed by month to review seasonality. The facility has experienced peak usage between February and June as well as in September and October.
Summary of Events and Use Days at the DCC by Month – Five-Year Average
Source: Facility management.
0%
10%
20%
30%
40%
50%
60%
Public Shows Meeting Sporting Banquet Convention Dance Concert Tradeshow
Events Use Days Total Attendance
0
5
10
15
20
25
30
35
40
45
50
Jan Feb Mar Apr May Jun Jul Aug Sep Oct Nov Dec
Events Use Days
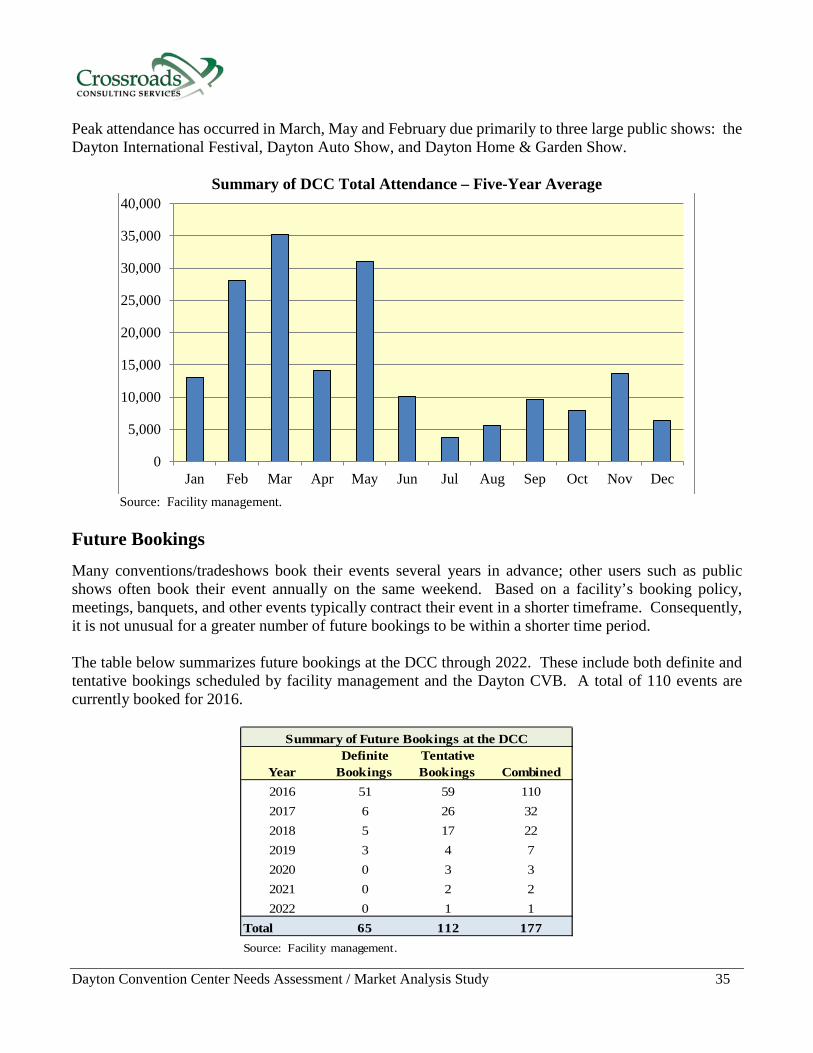
Dayton Convention Center Needs Assessment / Market Analysis Study 35
Peak attendance has occurred in March, May and February due primarily to three large public shows: the Dayton International Festival, Dayton Auto Show, and Dayton Home & Garden Show.
Summary of DCC Total Attendance – Five-Year Average
Source: Facility management.
Future Bookings Many conventions/tradeshows book their events several years in advance; other users such as public shows often book their event annually on the same weekend. Based on a facility’s booking policy, meetings, banquets, and other events typically contract their event in a shorter timeframe. Consequently, it is not unusual for a greater number of future bookings to be within a shorter time period. The table below summarizes future bookings at the DCC through 2022. These include both definite and tentative bookings scheduled by facility management and the Dayton CVB. A total of 110 events are currently booked for 2016.
YearDefinite
BookingsTentative Bookings Combined
2016 51 59 1102017 6 26 322018 5 17 222019 3 4 72020 0 3 32021 0 2 22022 0 1 1
Total 65 112 177Source: Facility management.
Summary of Future Bookings at the DCC
0
5,000
10,000
15,000
20,000
25,000
30,000
35,000
40,000
Jan Feb Mar Apr May Jun Jul Aug Sep Oct Nov Dec
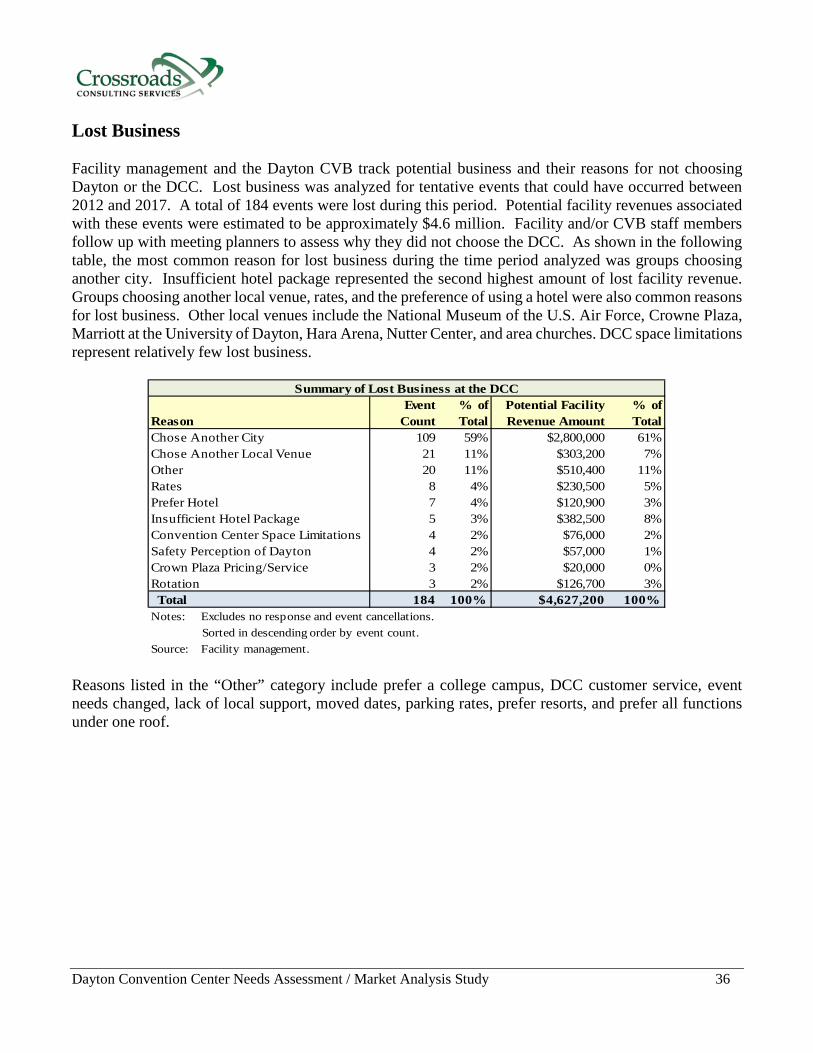
Dayton Convention Center Needs Assessment / Market Analysis Study 36
Lost Business Facility management and the Dayton CVB track potential business and their reasons for not choosing Dayton or the DCC. Lost business was analyzed for tentative events that could have occurred between 2012 and 2017. A total of 184 events were lost during this period. Potential facility revenues associated with these events were estimated to be approximately $4.6 million. Facility and/or CVB staff members follow up with meeting planners to assess why they did not choose the DCC. As shown in the following table, the most common reason for lost business during the time period analyzed was groups choosing another city. Insufficient hotel package represented the second highest amount of lost facility revenue. Groups choosing another local venue, rates, and the preference of using a hotel were also common reasons for lost business. Other local venues include the National Museum of the U.S. Air Force, Crowne Plaza, Marriott at the University of Dayton, Hara Arena, Nutter Center, and area churches. DCC space limitations represent relatively few lost business.
ReasonEvent
Count% of Total
Potential Facility Revenue Amount
% of Total
Chose Another City 109 59% $2,800,000 61%Chose Another Local Venue 21 11% $303,200 7%Other 20 11% $510,400 11%Rates 8 4% $230,500 5%Prefer Hotel 7 4% $120,900 3%Insufficient Hotel Package 5 3% $382,500 8%Convention Center Space Limitations 4 2% $76,000 2%Safety Perception of Dayton 4 2% $57,000 1%Crown Plaza Pricing/Service 3 2% $20,000 0%Rotation 3 2% $126,700 3% Total 184 100% $4,627,200 100%Notes: Excludes no response and event cancellations. Sorted in descending order by event count.Source: Facility management.
Summary of Lost Business at the DCC
Reasons listed in the “Other” category include prefer a college campus, DCC customer service, event needs changed, lack of local support, moved dates, parking rates, prefer resorts, and prefer all functions under one roof.
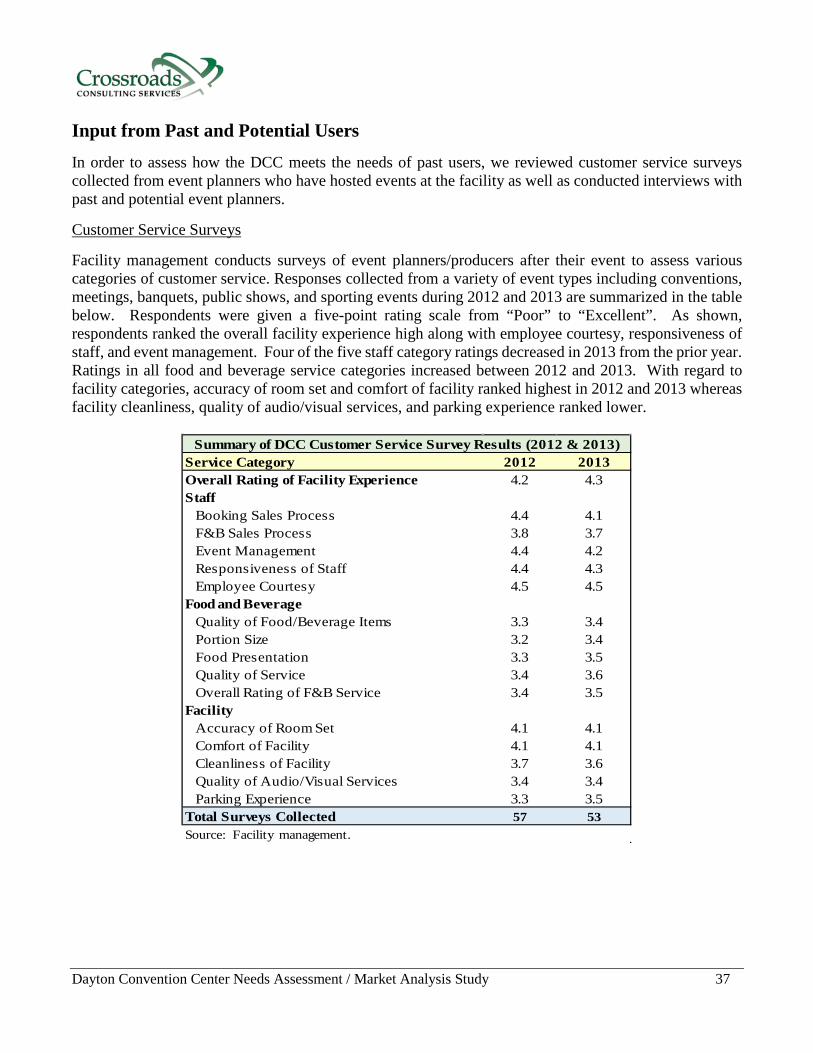
Dayton Convention Center Needs Assessment / Market Analysis Study 37
Input from Past and Potential Users In order to assess how the DCC meets the needs of past users, we reviewed customer service surveys collected from event planners who have hosted events at the facility as well as conducted interviews with past and potential event planners. Customer Service Surveys Facility management conducts surveys of event planners/producers after their event to assess various categories of customer service. Responses collected from a variety of event types including conventions, meetings, banquets, public shows, and sporting events during 2012 and 2013 are summarized in the table below. Respondents were given a five-point rating scale from “Poor” to “Excellent”. As shown, respondents ranked the overall facility experience high along with employee courtesy, responsiveness of staff, and event management. Four of the five staff category ratings decreased in 2013 from the prior year. Ratings in all food and beverage service categories increased between 2012 and 2013. With regard to facility categories, accuracy of room set and comfort of facility ranked highest in 2012 and 2013 whereas facility cleanliness, quality of audio/visual services, and parking experience ranked lower.
Service Category 2012 2013Overall Rating of Facility Experience 4.2 4.3Staff
Booking Sales Process 4.4 4.1F&B Sales Process 3.8 3.7Event Management 4.4 4.2Responsiveness of Staff 4.4 4.3Employee Courtesy 4.5 4.5
Food and BeverageQuality of Food/Beverage Items 3.3 3.4Portion Size 3.2 3.4Food Presentation 3.3 3.5Quality of Service 3.4 3.6Overall Rating of F&B Service 3.4 3.5
FacilityAccuracy of Room Set 4.1 4.1Comfort of Facility 4.1 4.1Cleanliness of Facility 3.7 3.6Quality of Audio/Visual Services 3.4 3.4Parking Experience 3.3 3.5
Total Surveys Collected 57 53Source: Facility management.
Summary of DCC Customer Service Survey Results (2012 & 2013)
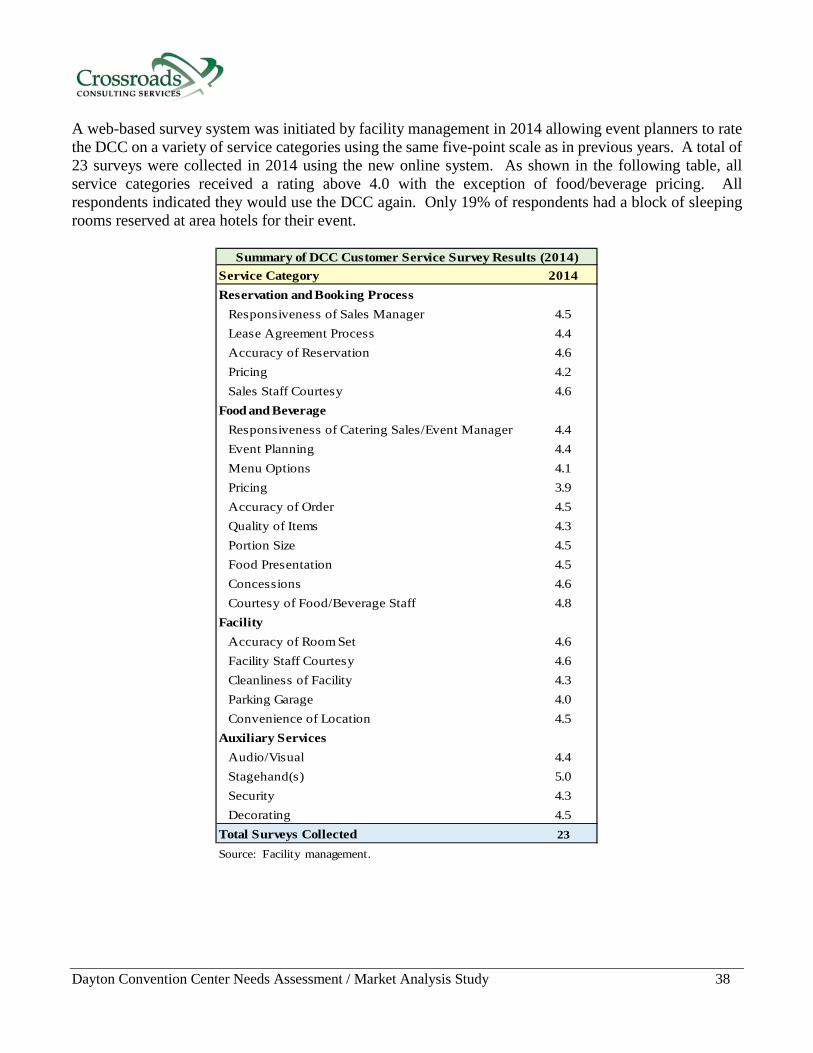
Dayton Convention Center Needs Assessment / Market Analysis Study 38
A web-based survey system was initiated by facility management in 2014 allowing event planners to rate the DCC on a variety of service categories using the same five-point scale as in previous years. A total of 23 surveys were collected in 2014 using the new online system. As shown in the following table, all service categories received a rating above 4.0 with the exception of food/beverage pricing. All respondents indicated they would use the DCC again. Only 19% of respondents had a block of sleeping rooms reserved at area hotels for their event.
Service Category 2014Reservation and Booking Process
Responsiveness of Sales Manager 4.5Lease Agreement Process 4.4Accuracy of Reservation 4.6Pricing 4.2Sales Staff Courtesy 4.6
Food and BeverageResponsiveness of Catering Sales/Event Manager 4.4Event Planning 4.4Menu Options 4.1Pricing 3.9Accuracy of Order 4.5Quality of Items 4.3Portion Size 4.5Food Presentation 4.5Concessions 4.6Courtesy of Food/Beverage Staff 4.8
FacilityAccuracy of Room Set 4.6Facility Staff Courtesy 4.6Cleanliness of Facility 4.3Parking Garage 4.0Convenience of Location 4.5
Auxiliary ServicesAudio/Visual 4.4Stagehand(s) 5.0Security 4.3Decorating 4.5
Total Surveys Collected 23
Source: Facility management.
Summary of DCC Customer Service Survey Results (2014)
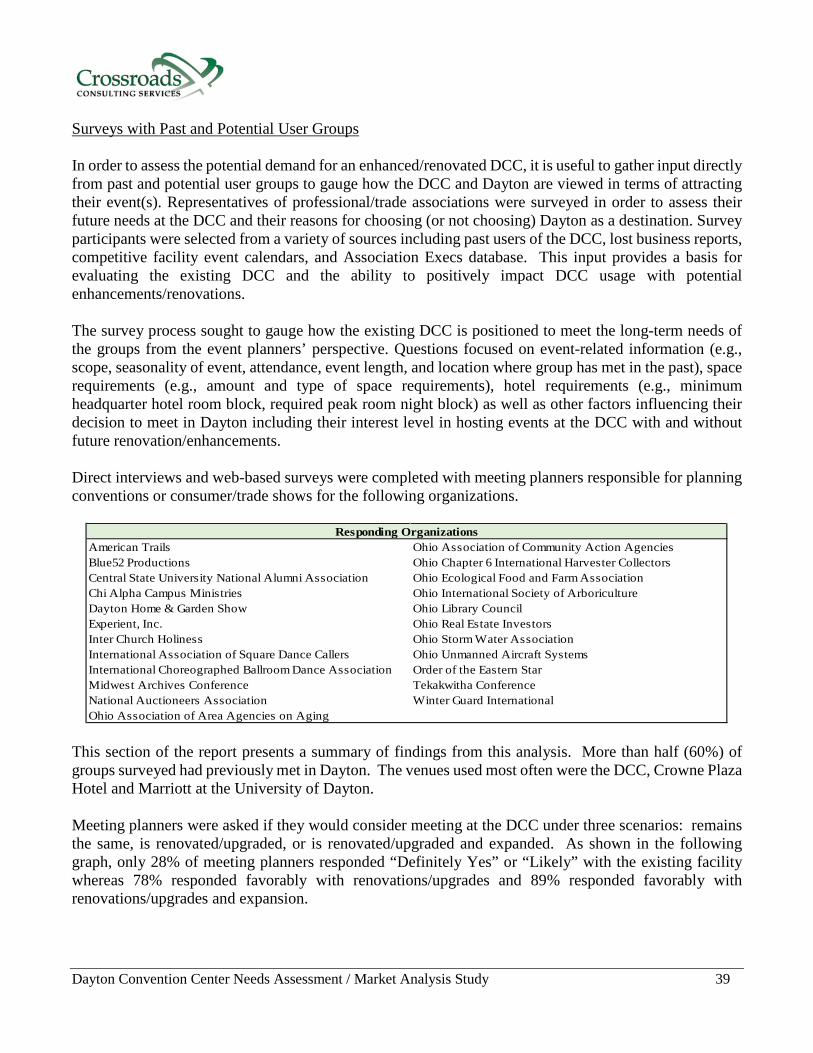
Dayton Convention Center Needs Assessment / Market Analysis Study 39
Surveys with Past and Potential User Groups In order to assess the potential demand for an enhanced/renovated DCC, it is useful to gather input directly from past and potential user groups to gauge how the DCC and Dayton are viewed in terms of attracting their event(s). Representatives of professional/trade associations were surveyed in order to assess their future needs at the DCC and their reasons for choosing (or not choosing) Dayton as a destination. Survey participants were selected from a variety of sources including past users of the DCC, lost business reports, competitive facility event calendars, and Association Execs database. This input provides a basis for evaluating the existing DCC and the ability to positively impact DCC usage with potential enhancements/renovations. The survey process sought to gauge how the existing DCC is positioned to meet the long-term needs of the groups from the event planners’ perspective. Questions focused on event-related information (e.g., scope, seasonality of event, attendance, event length, and location where group has met in the past), space requirements (e.g., amount and type of space requirements), hotel requirements (e.g., minimum headquarter hotel room block, required peak room night block) as well as other factors influencing their decision to meet in Dayton including their interest level in hosting events at the DCC with and without future renovation/enhancements. Direct interviews and web-based surveys were completed with meeting planners responsible for planning conventions or consumer/trade shows for the following organizations.
American Trails Ohio Association of Community Action AgenciesBlue52 Productions Ohio Chapter 6 International Harvester CollectorsCentral State University National Alumni Association Ohio Ecological Food and Farm AssociationChi Alpha Campus Ministries Ohio International Society of ArboricultureDayton Home & Garden Show Ohio Library CouncilExperient, Inc. Ohio Real Estate InvestorsInter Church Holiness Ohio Storm Water AssociationInternational Association of Square Dance Callers Ohio Unmanned Aircraft SystemsInternational Choreographed Ballroom Dance Association Order of the Eastern StarMidwest Archives Conference Tekakwitha ConferenceNational Auctioneers Association Winter Guard InternationalOhio Association of Area Agencies on Aging
Responding Organizations
This section of the report presents a summary of findings from this analysis. More than half (60%) of groups surveyed had previously met in Dayton. The venues used most often were the DCC, Crowne Plaza Hotel and Marriott at the University of Dayton. Meeting planners were asked if they would consider meeting at the DCC under three scenarios: remains the same, is renovated/upgraded, or is renovated/upgraded and expanded. As shown in the following graph, only 28% of meeting planners responded “Definitely Yes” or “Likely” with the existing facility whereas 78% responded favorably with renovations/upgrades and 89% responded favorably with renovations/upgrades and expansion.
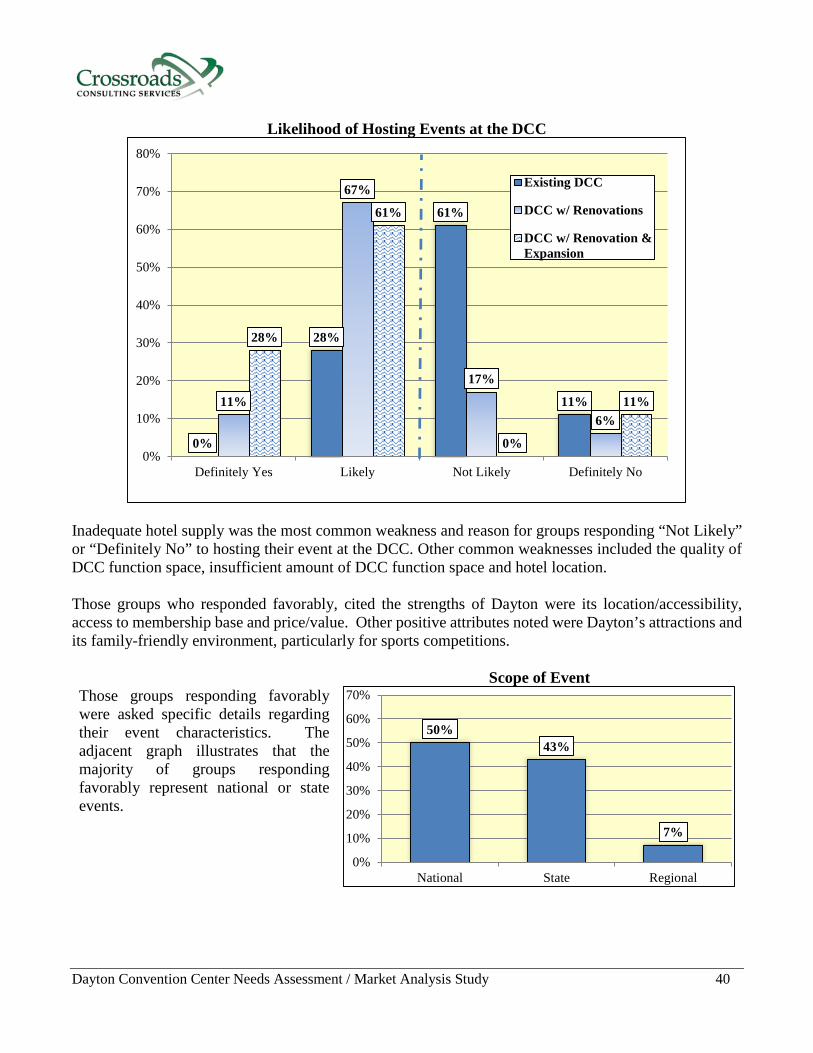
Dayton Convention Center Needs Assessment / Market Analysis Study 40
Likelihood of Hosting Events at the DCC
Inadequate hotel supply was the most common weakness and reason for groups responding “Not Likely” or “Definitely No” to hosting their event at the DCC. Other common weaknesses included the quality of DCC function space, insufficient amount of DCC function space and hotel location. Those groups who responded favorably, cited the strengths of Dayton were its location/accessibility, access to membership base and price/value. Other positive attributes noted were Dayton’s attractions and its family-friendly environment, particularly for sports competitions. Those groups responding favorably were asked specific details regarding their event characteristics. The adjacent graph illustrates that the majority of groups responding favorably represent national or state events.
Scope of Event
0%
28%
61%
11%11%
67%
17%
6%
28%
61%
0%
11%
0%
10%
20%
30%
40%
50%
60%
70%
80%
Definitely Yes Likely Not Likely Definitely No
Existing DCC
DCC w/ Renovations
DCC w/ Renovation &Expansion
50%43%
7%
0%
10%
20%
30%
40%
50%
60%
70%
National State Regional

Dayton Convention Center Needs Assessment / Market Analysis Study 41
On average, positive respondents estimated that their events attract approximately 600 delegates, 75 exhibitors, and 110 spouses/other travel party members. Respondents indicating an interest in meeting at the DCC were also asked the amount of gross exhibit space required. Overall, positive respondents require an average of 41,300 square feet and up to a maximum of 68,000 square feet of exhibit space. The average general session requires capacity for 540 which is beyond the practical capacity of the existing Ballroom 103 given its size and configuration. Average banquet square footage required is approximately 9,400, just over what the current DCC Ballroom 103 offers. According to stakeholder input, a larger ballroom would place the DCC in a better position to accommodate conventions with larger banquet needs. While many of the groups responding can be accommodated by the existing facility’s space, its age and general condition hinders some groups’ ability to bring their events to Dayton.
Space Requirements AverageExhibit Space (SF) 41,300General Session (largest capacity) 540Meeting Rooms (number) 9Meeting Space (SF) 6,700Banquet (largest capacity) 550Banquet (SF) 9,400Auditorium/Theater (largest capacity) 545Event Length Average Event Days 3.7 Move In/Out Days 1.6 Total Use Days 5.3
Summary of Event Attributes - Positive Respondents
Positive respondents average nearly four event days with an additional 1.6 move in/out days which is longer than conventions historically held at the DCC (average total use days of 4.2). April and June are the most common months for conventions from the sample. On average, respondents indicated that approximately 78% of attendees stay overnight with a minimum of 130 rooms in the headquarter hotel block and an average of 350 peak rooms citywide. Respondents estimate that overnight attendees would spend an average of $108 per night on lodging and that an average of 1.8 people would stay in each room. More than half (54%) of respondents indicated that the availability of a shuttle service to/from hotels would positively impact their decision to utilize the facility.
Hotel Requirements AveragePercent Overnight Attendees 78%Peak Citywide Rooms 350Minimum HQ Hotel(s) Block 130
Summary of Hotel Requirements - Positive Respondents
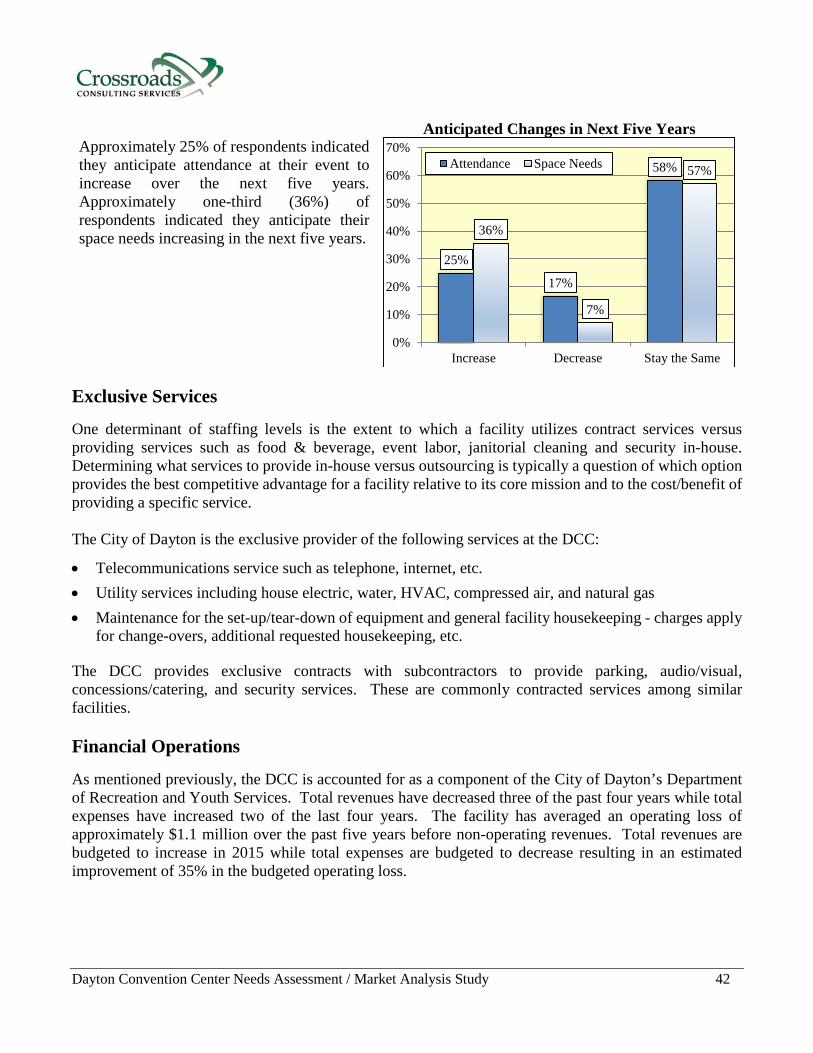
Dayton Convention Center Needs Assessment / Market Analysis Study 42
Approximately 25% of respondents indicated they anticipate attendance at their event to increase over the next five years. Approximately one-third (36%) of respondents indicated they anticipate their space needs increasing in the next five years.
Anticipated Changes in Next Five Years
Exclusive Services
One determinant of staffing levels is the extent to which a facility utilizes contract services versus providing services such as food & beverage, event labor, janitorial cleaning and security in-house. Determining what services to provide in-house versus outsourcing is typically a question of which option provides the best competitive advantage for a facility relative to its core mission and to the cost/benefit of providing a specific service. The City of Dayton is the exclusive provider of the following services at the DCC:
• Telecommunications service such as telephone, internet, etc. • Utility services including house electric, water, HVAC, compressed air, and natural gas • Maintenance for the set-up/tear-down of equipment and general facility housekeeping - charges apply
for change-overs, additional requested housekeeping, etc. The DCC provides exclusive contracts with subcontractors to provide parking, audio/visual, concessions/catering, and security services. These are commonly contracted services among similar facilities. Financial Operations
As mentioned previously, the DCC is accounted for as a component of the City of Dayton’s Department of Recreation and Youth Services. Total revenues have decreased three of the past four years while total expenses have increased two of the last four years. The facility has averaged an operating loss of approximately $1.1 million over the past five years before non-operating revenues. Total revenues are budgeted to increase in 2015 while total expenses are budgeted to decrease resulting in an estimated improvement of 35% in the budgeted operating loss.
25%
17%
58%
36%
7%
57%
0%
10%
20%
30%
40%
50%
60%
70%
Increase Decrease Stay the Same
Attendance Space Needs
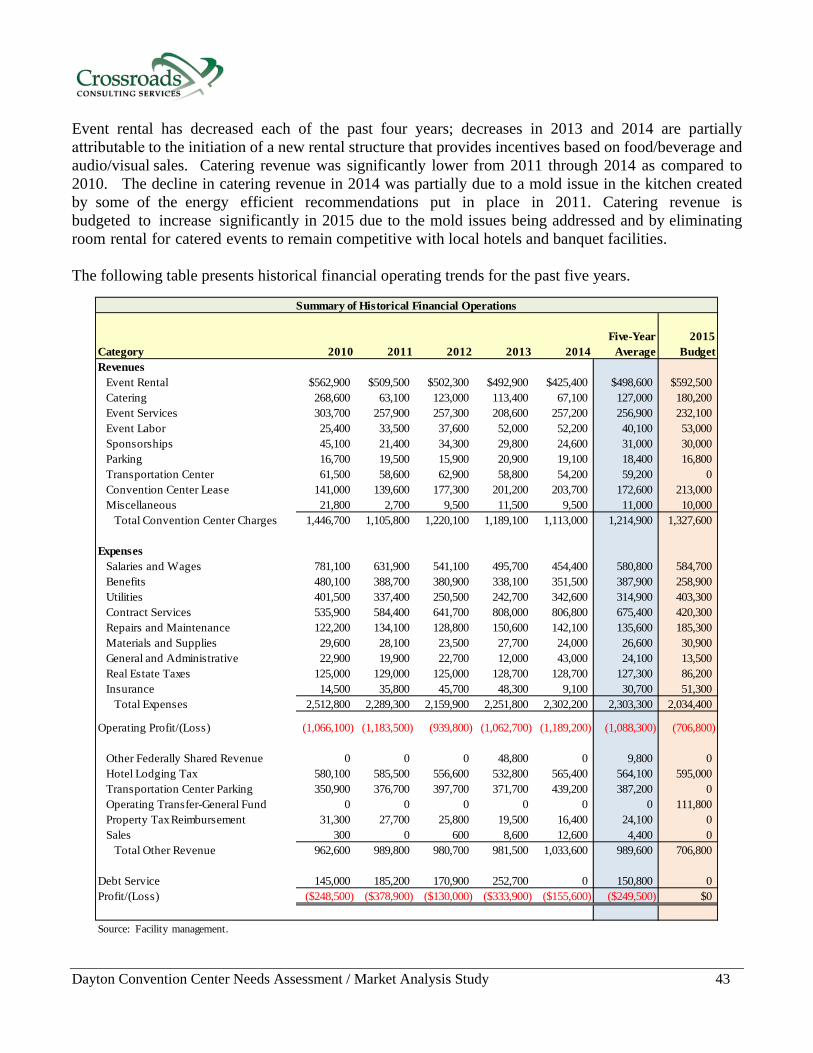
Dayton Convention Center Needs Assessment / Market Analysis Study 43
Event rental has decreased each of the past four years; decreases in 2013 and 2014 are partially attributable to the initiation of a new rental structure that provides incentives based on food/beverage and audio/visual sales. Catering revenue was significantly lower from 2011 through 2014 as compared to 2010. The decline in catering revenue in 2014 was partially due to a mold issue in the kitchen created by some of the energy efficient recommendations put in place in 2011. Catering revenue is budgeted to increase significantly in 2015 due to the mold issues being addressed and by eliminating room rental for catered events to remain competitive with local hotels and banquet facilities.
The following table presents historical financial operating trends for the past five years.
Category 2010 2011 2012 2013 2014Five-Year
Average2015
BudgetRevenues
Event Rental $562,900 $509,500 $502,300 $492,900 $425,400 $498,600 $592,500Catering 268,600 63,100 123,000 113,400 67,100 127,000 180,200Event Services 303,700 257,900 257,300 208,600 257,200 256,900 232,100Event Labor 25,400 33,500 37,600 52,000 52,200 40,100 53,000Sponsorships 45,100 21,400 34,300 29,800 24,600 31,000 30,000Parking 16,700 19,500 15,900 20,900 19,100 18,400 16,800Transportation Center 61,500 58,600 62,900 58,800 54,200 59,200 0Convention Center Lease 141,000 139,600 177,300 201,200 203,700 172,600 213,000Miscellaneous 21,800 2,700 9,500 11,500 9,500 11,000 10,000
Total Convention Center Charges 1,446,700 1,105,800 1,220,100 1,189,100 1,113,000 1,214,900 1,327,600
ExpensesSalaries and Wages 781,100 631,900 541,100 495,700 454,400 580,800 584,700Benefits 480,100 388,700 380,900 338,100 351,500 387,900 258,900Utilities 401,500 337,400 250,500 242,700 342,600 314,900 403,300Contract Services 535,900 584,400 641,700 808,000 806,800 675,400 420,300Repairs and Maintenance 122,200 134,100 128,800 150,600 142,100 135,600 185,300Materials and Supplies 29,600 28,100 23,500 27,700 24,000 26,600 30,900General and Administrative 22,900 19,900 22,700 12,000 43,000 24,100 13,500Real Estate Taxes 125,000 129,000 125,000 128,700 128,700 127,300 86,200Insurance 14,500 35,800 45,700 48,300 9,100 30,700 51,300
Total Expenses 2,512,800 2,289,300 2,159,900 2,251,800 2,302,200 2,303,300 2,034,400
Operating Profit/(Loss) (1,066,100) (1,183,500) (939,800) (1,062,700) (1,189,200) (1,088,300) (706,800)
Other Federally Shared Revenue 0 0 0 48,800 0 9,800 0Hotel Lodging Tax 580,100 585,500 556,600 532,800 565,400 564,100 595,000Transportation Center Parking 350,900 376,700 397,700 371,700 439,200 387,200 0Operating Transfer-General Fund 0 0 0 0 0 0 111,800Property Tax Reimbursement 31,300 27,700 25,800 19,500 16,400 24,100 0Sales 300 0 600 8,600 12,600 4,400 0
Total Other Revenue 962,600 989,800 980,700 981,500 1,033,600 989,600 706,800
Debt Service 145,000 185,200 170,900 252,700 0 150,800 0Profit/(Loss) ($248,500) ($378,900) ($130,000) ($333,900) ($155,600) ($249,500) $0
Source: Facility management.
Summary of Historical Financial Operations
Dayton Convention Center Needs Assessment / Market Analysis Study 44
Convention center leases include office space inside the facility leased to the Dayton CVB and the Dayton Area Chamber of Commerce, as well as tenant leases in five other buildings across the street. Property taxes for those buildings are shown as an expense of the DCC and, when spaces are leased, passed through to the tenants. Salaries and wages are budgeted to increase 29% in 2015 due to the addition of a full-time Production Manager position. Utilities expenses increased 41% in 2014 due to electric and gas rate increases and weather conditions. Utilities expenses are budgeted to increase by 18% in 2015. Contracted services are budgeted to decrease significantly due to the parking contract and resulting transportation center parking revenue being reported in a separate fund beginning in 2015. Historically, the DCC’s operating deficit has primarily been funded by the City of Dayton’s lodging tax collections as well as transportation center parking funds which have averaged $387,000 over the past five years. Beginning in 2015, transportation center parking funds will no longer be dedicated to DCC operations. As such, the City of Dayton has budgeted an operating transfer of $112,000 from its General Fund for 2015 to offset the anticipated deficit. Debt associated with the facility was retired in 2013.
Capital Improvement Planning Ongoing preventive maintenance and capital upkeep of convention centers are imperative for their long-term marketability and financial efficiency. As such, we reviewed the existing capital improvement planning process and budget. The City of Dayton does not provide any dedicated funding for capital improvements and, as such, there is no formal process for long-term capital improvement planning. Facility management has made some recent improvements that include the installation of new escalators, updating lighting to more energy-efficient lightbulbs, and painting of meeting rooms and prefunction areas. This study should serve as a guide to prioritizing short and long-term capital needs as well as potential funding sources for ongoing capital improvements. Summary The DCC’s structure as a component of the City of Dayton’s Department of Recreation and Youth Services is not common in the convention center industry. Recent changes in dedicated funding for ongoing operations and capital improvements have led to operating challenges including a lean staff, less timely responsiveness, and growing maintenance/capital needs. These issues are having an impact on customer service and retention of business. The vision statement does not appear to be in line with perceived success factors and performance measures (economic impact vs break-even financial operations). The lack of a clear mission statement and formal booking policy makes it difficult for staff and stakeholders to have a unified objective for the prioritization of bookings, sales/marketing efforts, and the measurement of performance. As a result, sales/marketing efforts are not as efficient or seamless to the end user.

Dayton Convention Center Needs Assessment / Market Analysis Study 45
The DCC’s layout makes it functional for hosting a wide variety of events from intimate meetings to conventions, banquets, large general assemblies and sports competitions. Meetings and banquets have represented a significant share of annual events and use days at the DCC over the last five years. Public shows, meetings, sporting events and banquets have historically accounted for a significant portion of annual attendance. While the facility is well configured, it is dated in its overall aesthetics and lacks modern technological, audio/visual, and lighting amenities required by most group business. Stabilizing staffing in key positions including the Department Director and Food/Beverage provider’s General Manager are important for long-term planning and customer service. The number of facility staff is lacking in sales, event services, and operations. Staffing levels hinder proactive internal marketing efforts. Adding staff experienced in the convention/meetings industry will be important for the facility to effectively service group business in its increasingly competitive environment. Union regulations also limit flexibility in terms of work schedules and potentially increase cost to the customer. This requirement is not conducive to the operation of a convention center that has events occurring seven days a week for extended hours. Customer service feedback is generally positive, particularly with regard to the overall facility experience, employee courtesy, responsiveness of staff, and event management. Facility and food/beverage pricing, parking garage, menu options, quality of food items, facility cleanliness and security were ranked lowest by customers in the most recent year. Several survey groups responding favorably to hosting their events a renovated/upgraded DCC require more ballroom space than currently offered by the DCC and, as such, would have to host their banquet functions in one of the exhibit halls. Expanding dedicated ballroom space could serve to open the exhibit hall for additional simultaneous events. Groups interested in hosting their events in Dayton would use the facility for more days, on average, than those previously held at the DCC which could serve to create incremental new convention-related room nights. Past customers report that they like holding their events at the DCC because facility and CVB staff make them feel important. In contrast, some of these events are relatively small for the larger Ohio convention destinations (i.e., Cincinnati, Cleveland and Columbus) and, as such, meeting planners commented they appreciate being valued in Dayton. The most common reason for lost business is that groups are choosing another destination. A survey of meeting planners indicated that inadequate hotel supply was the most common weakness and reason for groups responding “Not Likely” or “Definitely No” to hosting their event at the DCC. Other common weaknesses cited by meeting planners included the quality of DCC function space, insufficient amount of DCC function space and hotel location. As such, improving the infrastructure surrounding the DCC will be critical for competing effectively with other State/regional destinations who are continually improving their facilities and visitor amenities. Joint marketing and sales efforts with meeting hotels, the Dayton CVB and DCC staff could be improved and made more seamless to the end user. The event contracting process is cumbersome and does not provide efficient, one-stop shopping for the customer. It is recommended that the Dayton CVB have real-time access to the DCC’s calendar for viewing available dates in order to increase response time to potential customers.
Dayton Convention Center Needs Assessment / Market Analysis Study 46
The DCC has realized an operating loss each of the last five years and is budgeted to decrease its operating loss by 35% in 2015 compared to the five-year average. The DCC’s age coupled with the lack of dedicated funding for capital improvements will become increasingly problematic over time as systems reach the end of their useful lives. Establishing a long-term financial sustainability plan for ongoing operational and/or capital improvement needs will be important particularly given competitors’ plans to continually improve their facilities. In addition, the local community does not appear to fully grasp the value of the DCC from an economic perspective.

Dayton Convention Center Needs Assessment / Market Analysis Study 47
Table of Contents
1 Introduction and Executive Summary 1 2 General Market Overview 11 3 Key Industry Trends 20 4 Historical Facility Operations 27 5 General Management Practices Assessment 47 6 Physical Facility Assessment 57 7 Competitive Facility Assessment 71 8 Needs Assessment 85 9 Economic Analysis 94
10 Funding Analysis 113
11 Limiting Conditions and Assumptions 120
12 Appendix 122

Dayton Convention Center Needs Assessment / Market Analysis Study 48
General Management Practices Assessment As mentioned previously, one of the objectives of this study is to evaluate the DCC’s management practices. This assessment is based on an evaluation of current practices within the context of well-established organizational and management concepts and industry practices. Our assessment is based on an analysis of current DCC management practices as well as data from competitive and comparable facilities to help formulate recommendations. The management practices assessment considered a number of operating factors including the following:
• Ownership/operating structure
• Organizational structure and staffing levels
• Marketing efforts
• Food and beverage service operations Ownership/Operating Structure
The ownership/operating structure of a convention center can impact its ability to operate efficiently and effectively in a competitive marketplace. There are several different management options used at convention centers. While the governance structure should play a significant role in oversight, establishing and administering policy as well as maintaining accountability for the facility, the management team should be responsible for overseeing the day-to-day operations of the center including implementing the mission statement and operating policies. Consequently, the management approach is important because it typically impacts all aspects of operations including marketing, utilization, financial operations and overall efficiency of a complex. For instance, management’s ability to effectively negotiate rental rates and/or have flexibility in terms of staffing can directly impact utilization, financial performance and/or economic impact generated from the facility. In some instances, publicly run facilities are limited in their capability to act as quickly as other management approaches.
As such, some elected bodies choose to delegate the management of convention center operations to some form of third party that provides industry knowledge and representation. Management through a third party can also offer stability and insulation from political influence which can be desired attributes by customers, vendors, facility management and staff who typically prefer a continuity of purpose and ability to function within a business environment that is not affected by each political election.
Examples of existing management options at convention centers include, but are not limited to, the following:
• Operating through a traditional governmental management structure • Operating as an independent public authority
• Contracting with a destination marketing organization • Contracting with a third party that specializes in managing similar facilities

Dayton Convention Center Needs Assessment / Market Analysis Study 49
Traditional Governmental Management Historically, convention centers are one of the few public assets that operate in a semi-business atmosphere requiring contractual agreements, frequent short term lease/use of facilities by customers, management of part-time and temporary staff resources for numerous events and partnership with third party vendors and tenants. These operating conditions are unique within the public services provided by government whose natural inclination is to apply one set of guidelines to all municipal departments. Unlike many municipal services where citizens do not have a choice, event promoters/producers have a variety of facilities to choose from when deciding where to host their event. In addition, attendees have a multiple options where they can spend their discretionary income. Given the competitiveness among venues, convention centers need to operate in a manner that is consistent with well-established industry practices. As with any governmentally run facility, the goals and objectives may change with each political cycle. For instance, the number and diversity of events may be the primary objective of one official and fiscal performance may be the priority of another. These changes in a facility’s objectives can be counter-productive if not managed effectively. Clearly defining a mission statement that reflects community consensus and operating objectives (e.g., generating economic impact) can allow a facility to set forth an operating and marketing strategy that is consistent and long-term in implementation. This approach can also provide a more stable environment for event promoters/producers when considering a convention center for future use. In general, governmentally operated facilities are more successful when management has the ability and the authority needed to aggressively operate and book the facility without incurring onerous procedures. In many instances, publicly operated facilities are overseen by a municipal department. Advantages of this method include shared human and financial resources among the jurisdiction’s various facilities as well as economies of scale in terms of utilities, insurance, and maintenance expenses. However, disadvantages include balancing civic/non-profit usage needs with those of events that generate overnight visitors which can be politically challenging, requirements associated with staff work hours, and limited staff connections in the broader industry. As mentioned previously, the DCC is owned and operated by the City of Dayton as part of its Department of Recreation and Youth Services. While operating as a municipal department is not uncommon in the convention center industry, there are means to mitigate some of the challenges associated with this management approach. For instance, the Sharonville Convention Center is operated as a City enterprise fund which provides more operating autonomy and often dedicated funding for operations and/or capital improvements. An enterprise fund establishes a separate accounting and financial reporting mechanism for municipal services for which a fee is charged in exchange for goods or services such as a convention center. By their nature, enterprise funds are used for assets that operate more like a business than a typical municipal service. The establishment of an enterprise fund can include by-laws empowering management to set rental rates, promote event activity, enter into contracts, and/or have greater flexibility in staffing that better meet the operating needs inherent in the convention center industry.
Dayton Convention Center Needs Assessment / Market Analysis Study 50
Independent Public Authority In many states, an authority is a political subdivision of one or more governmental entities (e.g., City, County and/or State) that is allowed by an act of local or state legislature. Authorities, sometimes referred to as districts, are usually governed by a Board of Directors that provides oversight and accountability. Board members are typically representatives of the involved government entities as well as related industry professionals (e.g., hoteliers, CVB executives, etc.). An authority can be multi-jurisdictional and can have a quasi-State organization funded by both the City and County. Authorities can be helpful in terms of garnering regional support for the development and/or operation of convention centers because multiple jurisdictions can be involved in overseeing the implementation of stated objectives. This form of management structure is typically pursued when a fiscal resource is created or allocated by a unit(s) of government and when an inter-local agreement is pledged to the authority for specific purposes. In many cases, the authority is tasked with the planning, design, financing, construction, operations and improvement to a designated project(s). An example is the Dayton Regional Transit Authority which imposes a 0.5% local sales/use tax that is dedicated to providing public transit services to residents of Montgomery County and western Greene County. One primary objective of creating an authority can be to obtain a funding source that can allow for the independent operations of a convention center. This approach is particularly valuable if there is a political consensus and will to identify a revenue stream from existing or new fiscal sources that can help stabilize the operations of a public assembly facility and provide for its long-term improvement and maintenance. While authorities often provide autonomy and independence, they are usually most effective when they control a revenue source that is dedicated to funding operations and/or retiring debt service. Authorities can also be beneficial when multiple jurisdictions and/or entities (e.g., facility and convention/visitors bureau) are involved in the funding and/or operations of convention centers. The Columbus Convention Center and Grand Wayne Convention Center are examples of facilities that are owned by an authority. The Grand Wayne Convention Center is also operated by the authority (sometimes referred to as a capital improvement board). In both communities, dedicated funding is collected by the authority for convention center operations and ongoing capital improvements. Destination Marketing Organization Destination marketing organizations (DMOs) are an important partner for convention centers in most communities given their efforts to promote the destination to a variety of visitors including conventions/ meetings, sports competitions, and leisure travelers. Similar to Dayton, the DMO is typically responsible for marketing the convention center for longer-term bookings (e.g., 18 months and out). Given this partnership, some communities have chosen to have their DMO operate their convention center. Benefits of this operating structure include a seamless sales and event service process and the control of one entity over the entire convention center booking calendar. In addition, a DMO’s mission is to attract overnight visitors which is consistent with most convention center missions to generate economic activity.
Dayton Convention Center Needs Assessment / Market Analysis Study 51
Challenges include establishing buy-in from the local hotel community who may view the DMO as competing with their own sales efforts. As such, maintaining good working relationships with local stakeholders and having hotel representation on the DMO Board of Directors is important to mitigate this challenge. Examples of this form of management include the John S. Knight Center which was developed jointly by the City of Akron, the Akron/Summit CVB and the University of Akron. The Center is owned by the City of Akron and leased to the Akron/Summit CVB, a not-for-profit entity, for $1 annually. The current lease agreement expires in 2019. The agreement outlines that the City of Akron is responsible for the Center’s roof maintenance whereas the Akron/Summit CVB is responsible for all other maintenance and capital improvements. The Akron/Summit CVB is funded by a dedicated annual amount from the City of Akron lodging tax as well as a dedicated percentage of the Summit County lodging tax. The Akron/Summit CVB funding offsets the John S. Knight Center’s operating deficit. As a point of reference, the Statehouse Convention Center in Little Rock is managed by the DMO. Third Party Professional Management There are several professional management companies that operate municipally-owned convention centers. Professional management companies can address a variety of needs and issues confronted by public assembly facilities that, in many cases, result in a more effective and efficient means of operations as compared to municipally run venues. Although some facilities realize an operating deficit, they may have been developed because of the broader community objectives they can achieve. Consequently, these facilities typically aim to attract new activity that can draw patrons from outside the immediate market area who spend money on hotels, restaurants, and other similar services. Given these unique economics and the financial constraints for some municipalities, there is sometimes a conflict for the management team at convention centers which struggles to balance hosting events that operate at a profit and positively impact the facility’s financial performance and hosting events that do not necessarily contribute positive cash flow but generate significant economic impact to a community. As such, professional management may be a more effective approach under certain conditions which may include, but not be limited to, the following: • Civil service constraints may limit a municipality’s ability to retain and hire qualified personnel that
are experienced in the industry and compensated for their skill set relative to other similar positions in the industry.
• Efficient operations may be hampered by strong political influence and operating autonomy is desired.
• Municipal constraints make it difficult for facility management to effectively negotiate rates and other concessions and, consequently, the facility may be less competitive with other facilities.
• Contract approval requirements may be onerous and time consuming in a municipal setting.
• Municipalities have limited funds for significant maintenance requirements and/or capital improvements to facilities and a professional management company agrees to provide funding as part of its management agreement.
Dayton Convention Center Needs Assessment / Market Analysis Study 52
Typically the management company charges a base fee in addition to a performance or incentive fee. The performance or incentive fee can be capped and is usually tied to producing measurable operating results such as increasing the number of events and/or attendance and/or improving the financial operations as compared to a baseline benchmark target. Private management contracts have become more prevalent and, as such, facility owners are expecting more from them. Some municipalities require the management company to commit capital funds for a development/enhancement project to help ensure they have a vested interest in its operational success. Sources of such commitments may include naming rights, sponsorships and advertising contracts. Private management contracts tend to include an increasingly higher portion of the fee based on performance. Various regulations restrict management contracts for facilities financed by tax exempt bonds which include, but are not limited to, the following: • Limiting performance or incentive fees to the negotiated base fee
• Limiting the term of the agreement
• Excluding distribution of profits to the management company One common apprehension for municipalities considering third party management is losing control of the asset. However, third party management is an agent of the municipality charged with managing and promoting the asset. As such, the municipality can manage the amount and type of control that it retains through the terms of its management agreement. For instance, in most professional management agreements, municipalities still: retain ownership; approve the operating and capital budgets; provide input and direction regarding policy; receive regular financial and management reports; and have the ability to terminate the management company. Typically, municipalities are actively involved in the hiring and/or approval of the convention center’s general manager and have a designated contract administrator that oversees the terms of the contract and serves as liaison between the governmental entity and the management company. Potential disadvantages associated with third party management include, but are not limited to, the following: • The municipality does not control all aspects of its asset including hiring of personnel, determining
the event mix, ensuring quality service and overseeing ongoing repairs and maintenance of the facility.
• Third party management could potentially be less sensitive to users, especially those that are locally based and do not generate significant revenues to the bottom-line and/or economic impact.
• Depending on the facility’s proposed size, the overall cost of third party management (e.g., base and performance incentive fees, capital improvements) may be greater than the estimated operating deficit.
Convention centers in Cincinnati, Cleveland, Columbus and Toledo utilize this operating structure. Three of these centers are operated by the same management company which provides the opportunity to efficiently market to events that can route through multiple Ohio destinations.
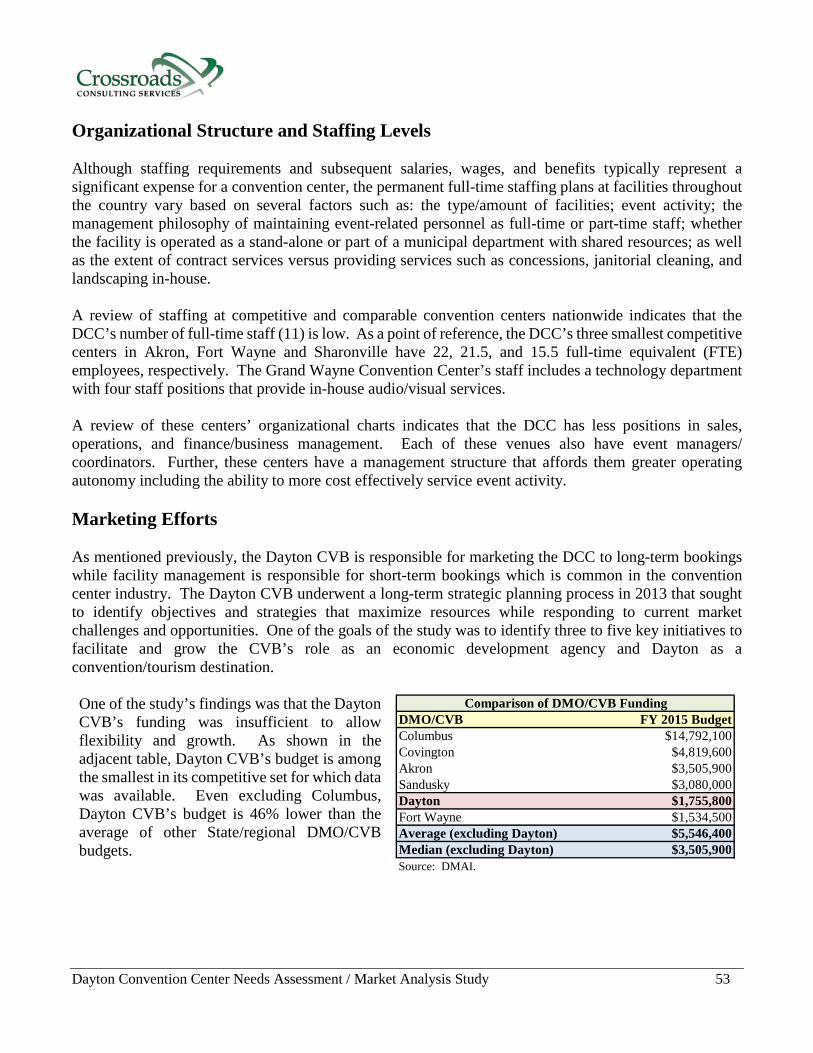
Dayton Convention Center Needs Assessment / Market Analysis Study 53
Organizational Structure and Staffing Levels Although staffing requirements and subsequent salaries, wages, and benefits typically represent a significant expense for a convention center, the permanent full-time staffing plans at facilities throughout the country vary based on several factors such as: the type/amount of facilities; event activity; the management philosophy of maintaining event-related personnel as full-time or part-time staff; whether the facility is operated as a stand-alone or part of a municipal department with shared resources; as well as the extent of contract services versus providing services such as concessions, janitorial cleaning, and landscaping in-house. A review of staffing at competitive and comparable convention centers nationwide indicates that the DCC’s number of full-time staff (11) is low. As a point of reference, the DCC’s three smallest competitive centers in Akron, Fort Wayne and Sharonville have 22, 21.5, and 15.5 full-time equivalent (FTE) employees, respectively. The Grand Wayne Convention Center’s staff includes a technology department with four staff positions that provide in-house audio/visual services. A review of these centers’ organizational charts indicates that the DCC has less positions in sales, operations, and finance/business management. Each of these venues also have event managers/ coordinators. Further, these centers have a management structure that affords them greater operating autonomy including the ability to more cost effectively service event activity. Marketing Efforts As mentioned previously, the Dayton CVB is responsible for marketing the DCC to long-term bookings while facility management is responsible for short-term bookings which is common in the convention center industry. The Dayton CVB underwent a long-term strategic planning process in 2013 that sought to identify objectives and strategies that maximize resources while responding to current market challenges and opportunities. One of the goals of the study was to identify three to five key initiatives to facilitate and grow the CVB’s role as an economic development agency and Dayton as a convention/tourism destination. One of the study’s findings was that the Dayton CVB’s funding was insufficient to allow flexibility and growth. As shown in the adjacent table, Dayton CVB’s budget is among the smallest in its competitive set for which data was available. Even excluding Columbus, Dayton CVB’s budget is 46% lower than the average of other State/regional DMO/CVB budgets.
DMO/CVB FY 2015 BudgetColumbus $14,792,100Covington $4,819,600Akron $3,505,900Sandusky $3,080,000Dayton $1,755,800Fort Wayne $1,534,500Average (excluding Dayton) $5,546,400Median (excluding Dayton) $3,505,900Source: DMAI.
Comparison of DMO/CVB Funding
Dayton Convention Center Needs Assessment / Market Analysis Study 54
Another challenge outlined in the study included a lack of advocacy for the City of Dayton and Dayton visitor assets such as the DCC. Recommendations included strategies to address these challenges such as advocating for significant destination development to foster greater visitation and visitor amenity development. Top priorities included renovating the DCC and creating a more vibrant downtown area. The Dayton CVB’s involvement in the DCC needs assessment study is an important step in addressing these challenges. Other initiatives include participation in the development of a visitor-oriented master transportation and connectivity plan which can serve to enhance the experience of DCC attendees. With respect to direct marketing and sales of the DCC, the Dayton CVB has six sales staff aligned by target market segment that include: youth/amateur sports, social/military/educational/religious/fraternal, sports/hobbies, aviation/Federal government, corporate, military reunions, national/state association, civic and multi-cultural. This is a common structure related to group business sales. The Dayton CVB sales staff does not have “read-only” access to the DCC booking calendar and, as such, responses to prospective clients are not always timely. The DCC currently has one sales manager who is responsible for short-term bookings. These event types typically include public shows, banquets, meetings, and other community events that often comprise the bulk of a convention center’s annual events. While these events may not always generate a significant number of overnight visitors, they can contribute significantly to a facility’s bottom-line and also create local awareness of the facility’s role in the community. Current staffing levels, make it challenging to proactively market the DCC to local corporations, civic organizations, etc. As such, DCC sales staff is in more of a reactive state, addressing the Dayton CVB’s requests for long-term booking dates and answering calls from interested short-term bookings.
Food and Beverage Service Operations
The Bigelow Companies, Inc. was retained to assess food/beverage service operations at the DCC. Staff from Bigelow Companies reviewed the current food/beverage service contract, interviewed staff, and toured the facility including food/beverage service areas. Bigelow Companies staff also attended the Ohio Art Educators conference and observed three food functions as a secret shopper to assess overall food service operations. The City of Dayton contracts with Spectra (formerly known as Ovations Food Service) to provide food/beverage service as well as event coordination. Key findings include the following: • Spectra’s contract included estimated annual food/beverage revenue significantly higher than achieved
in 2014. • Spectra is responsible for developing the event order, including all floor layouts and coordinating with
third party service providers (e.g., stagehands, audio visual services, decorators, etc.) which is uncommon in the convention center industry.
• Customers are billed separately by each service provider. • Spectra’s contract requires one sales manager per $1.0 million in catering sales, but Spectra is
employing two sales managers with sales under this target. • Outside proactive sales for local food/beverage functions are not being handled by Spectra, rather their
staff react to customer bookings made through DCC staff. • A standardized process is not in place that allows for the customer to have one, streamlined bill, one
point of contact, and overall event coordination.
Dayton Convention Center Needs Assessment / Market Analysis Study 55
• City staffing regulations/limitations often impede staff’s ability to meet customer requirements for event changeovers, cleaning, etc. in a timely manner.
• Customers commented positively about the food and service. • Overall, Spectra has a very responsive staff and is serving the DCC well.
The full report prepared by the Bigelow Companies can be found in the Appendix.
Other Services
In addition to larger and/or more modern building program elements, many convention centers offer better amenities than the DCC such as high-quality audio/visual and lighting capabilities throughout their meeting and ballroom space. Meeting planners have come to expect these features as part of the facility’s overall package. Although Wi-Fi service is complimentary at many convention centers, some charge fees based on required capacity in terms of dedicated lines and/or upgraded speeds. Growing expectations from users have resulted in some facilities providing significant broadband capacities free of charge. Facility management representatives indicated that purchasing and maintaining these services are costly and they are constantly seeking ways to recoup costs for this service which requires creativity in order to remain competitive. Wi-Fi service must be high quality and dependable in order to justify charges. Summary of Recommendations The findings from the analysis presented herein serve as the basis for the recommendations for modifications to the DCC’s program, operations, and destination characteristics that can serve to enhance the DCC’s long-term marketability. These recommended changes should also result in better event functionality, enhance revenue generation and operating efficiency, as well as generate additional economic impacts for the area. Although the DCC hosts a variety of event activity, it operates at a higher deficit relative to other comparable facilities. Despite its limited number of full-time staff and other operating challenges, customer feedback has been positive and input from users indicates they are generally pleased with management as well as the overall layout/functionality of the center. Most of the internal challenges noted by users relate to the venue’s age, cleanliness, and overall condition. Changes in the competitive market along with challenges associated with the facility’s ownership/operating structure have hindered its marketability in recent years. As such, implementing operational changes that can improve operating efficiency as well as better meet the expectations of users is imperative to the DCC’s long-term success. Although the City of Dayton owns the DCC, Montgomery County is the primary beneficiary of out-of-town visitor spending resulting from DCC operations given the current tax structure. Relative to ownership and governance, one option for consideration is forming an authority that has representation from both the City of Dayton and Montgomery County in order to enhance involvement from both jurisdictions. Such a change would also align ownership with a broader set of potential funding sources for ongoing operations and capital improvements. Authority Board members should represent both jurisdictions as well as hospitality professionals who have a vested interest in the DCC’s mission and overall success.
Dayton Convention Center Needs Assessment / Market Analysis Study 56
It is strongly recommended that the City of Dayton consider outsourcing management of the DCC to a third party, either a professional management company or the Dayton CVB, in order to provide greater operating autonomy and flexibility with regard to staffing, sales, contracting, and event management. Irrespective of the future ownership, governance and management structure, the following operational improvements should be implemented:
• Securing dedicated funding for ongoing DCC operations and capital reserves critical to its long-term success.
• Developing a formal mission statement and modifying operating objectives, as necessary, to reflect the improved building, current competitive environment, and general industry trends.
• Establishing a formal booking policy with priorities that support the mission statement and operating objectives.
• Executing a formal marketing agreement and associated performance measures with the Dayton CVB. • Developing marketing strategies involving DCC and Dayton CVB management to include jointly
selling to professional/trade associations having connections to local corporations, the aviation industry, and local University department heads. Likewise, joint sales efforts with DCC and Dayton CVB management as well as area elite level indoor sports organizations and scholastic athletics leaders should be instituted to increase competitive sporting event bookings.
• Increasing sales efforts and related funding necessary to drive short-term bookings and resulting food/beverage sales.
• Continuing to improve joint marketing efforts with staff at the DCC, Dayton CVB, Crowne Plaza, and the Marriott at the University of Dayton.
• Providing incentives for DCC sales staff for achieving stated performance goals that support the mission statement.
• Streamlining the event contract and billing processes to be more in line with industry best practices and seamless to end users.
• Continuing to offer discount pricing/packages for market segments that promote the DCC’s mission such as conventions/tradeshows and sports competitions that generate economic and fiscal benefits.
• Increasing full-time staffing levels particularly in sales, event management, operations and maintenance.
• Increasing the experience level of staff from the hospitality/convention industry. • Enhancing security and fostering improved perception by attendees regarding safety. • Enhancing connectivity between the DCC and Oregon District that is more pedestrian friendly/inviting
to attendees. • Advocating, and possibly providing incentives, for private investment in the area surrounding the DCC
including additional convention quality hotels, restaurants, and retail establishments. • Creating a formal maintenance and capital improvement process/plan. The next section of the report focuses on the physical facility assessment.
Dayton Convention Center Needs Assessment / Market Analysis Study 57
Table of Contents
1 Introduction and Executive Summary 1 2 General Market Overview 11 3 Key Industry Trends 20 4 Historical Facility Operations 27 5 General Management Practices Assessment 47 6 Physical Facility Assessment 57 7 Competitive Facility Assessment 71 8 Needs Assessment 85 9 Economic Analysis 94
10 Funding Analysis 113
11 Limiting Conditions and Assumptions 120
12 Appendix 122
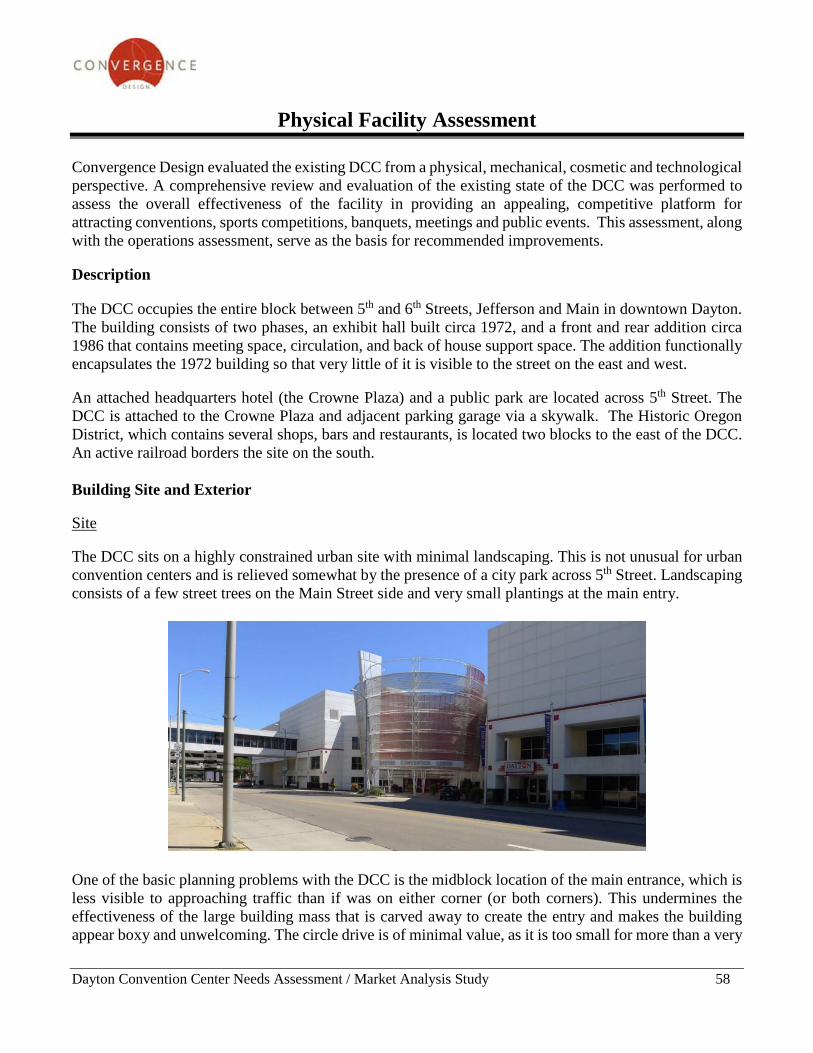
Dayton Convention Center Needs Assessment / Market Analysis Study 58
Physical Facility Assessment
Convergence Design evaluated the existing DCC from a physical, mechanical, cosmetic and technological perspective. A comprehensive review and evaluation of the existing state of the DCC was performed to assess the overall effectiveness of the facility in providing an appealing, competitive platform for attracting conventions, sports competitions, banquets, meetings and public events. This assessment, along with the operations assessment, serve as the basis for recommended improvements. Description The DCC occupies the entire block between 5th and 6th Streets, Jefferson and Main in downtown Dayton. The building consists of two phases, an exhibit hall built circa 1972, and a front and rear addition circa 1986 that contains meeting space, circulation, and back of house support space. The addition functionally encapsulates the 1972 building so that very little of it is visible to the street on the east and west. An attached headquarters hotel (the Crowne Plaza) and a public park are located across 5th Street. The DCC is attached to the Crowne Plaza and adjacent parking garage via a skywalk. The Historic Oregon District, which contains several shops, bars and restaurants, is located two blocks to the east of the DCC. An active railroad borders the site on the south. Building Site and Exterior Site The DCC sits on a highly constrained urban site with minimal landscaping. This is not unusual for urban convention centers and is relieved somewhat by the presence of a city park across 5th Street. Landscaping consists of a few street trees on the Main Street side and very small plantings at the main entry.
One of the basic planning problems with the DCC is the midblock location of the main entrance, which is less visible to approaching traffic than if was on either corner (or both corners). This undermines the effectiveness of the large building mass that is carved away to create the entry and makes the building appear boxy and unwelcoming. The circle drive is of minimal value, as it is too small for more than a very
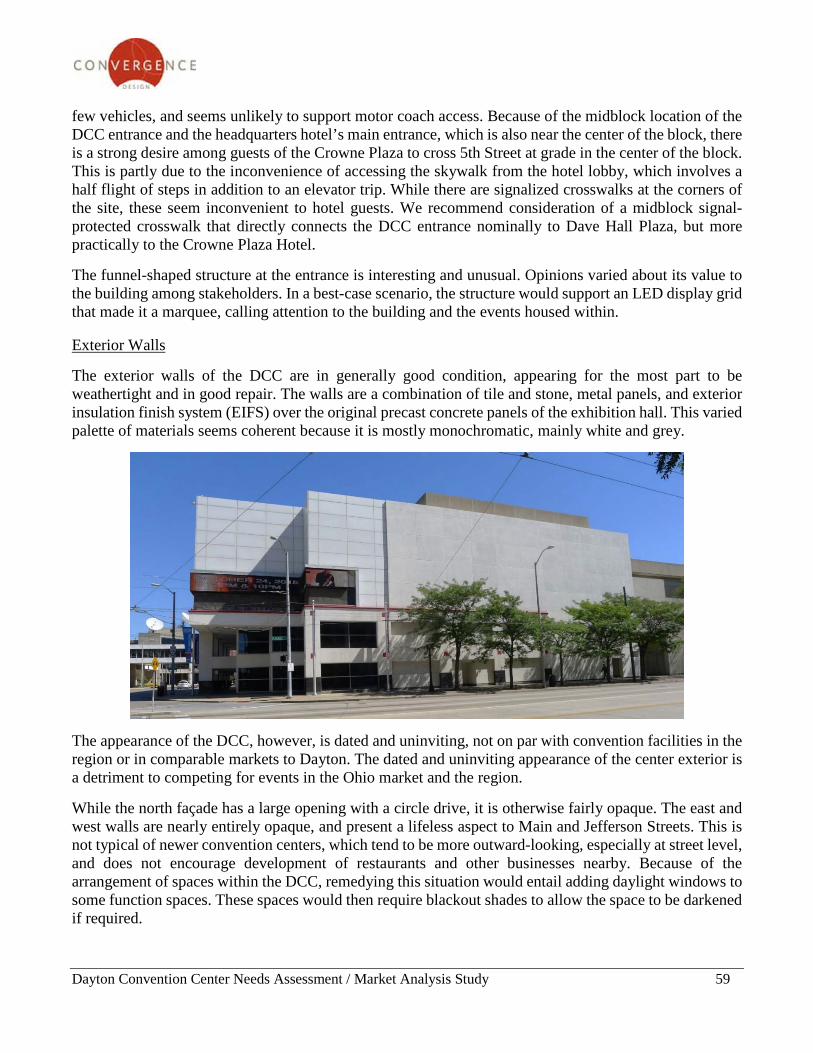
Dayton Convention Center Needs Assessment / Market Analysis Study 59
few vehicles, and seems unlikely to support motor coach access. Because of the midblock location of the DCC entrance and the headquarters hotel’s main entrance, which is also near the center of the block, there is a strong desire among guests of the Crowne Plaza to cross 5th Street at grade in the center of the block. This is partly due to the inconvenience of accessing the skywalk from the hotel lobby, which involves a half flight of steps in addition to an elevator trip. While there are signalized crosswalks at the corners of the site, these seem inconvenient to hotel guests. We recommend consideration of a midblock signal-protected crosswalk that directly connects the DCC entrance nominally to Dave Hall Plaza, but more practically to the Crowne Plaza Hotel.
The funnel-shaped structure at the entrance is interesting and unusual. Opinions varied about its value to the building among stakeholders. In a best-case scenario, the structure would support an LED display grid that made it a marquee, calling attention to the building and the events housed within.
Exterior Walls The exterior walls of the DCC are in generally good condition, appearing for the most part to be weathertight and in good repair. The walls are a combination of tile and stone, metal panels, and exterior insulation finish system (EIFS) over the original precast concrete panels of the exhibition hall. This varied palette of materials seems coherent because it is mostly monochromatic, mainly white and grey.
The appearance of the DCC, however, is dated and uninviting, not on par with convention facilities in the region or in comparable markets to Dayton. The dated and uninviting appearance of the center exterior is a detriment to competing for events in the Ohio market and the region. While the north façade has a large opening with a circle drive, it is otherwise fairly opaque. The east and west walls are nearly entirely opaque, and present a lifeless aspect to Main and Jefferson Streets. This is not typical of newer convention centers, which tend to be more outward-looking, especially at street level, and does not encourage development of restaurants and other businesses nearby. Because of the arrangement of spaces within the DCC, remedying this situation would entail adding daylight windows to some function spaces. These spaces would then require blackout shades to allow the space to be darkened if required.
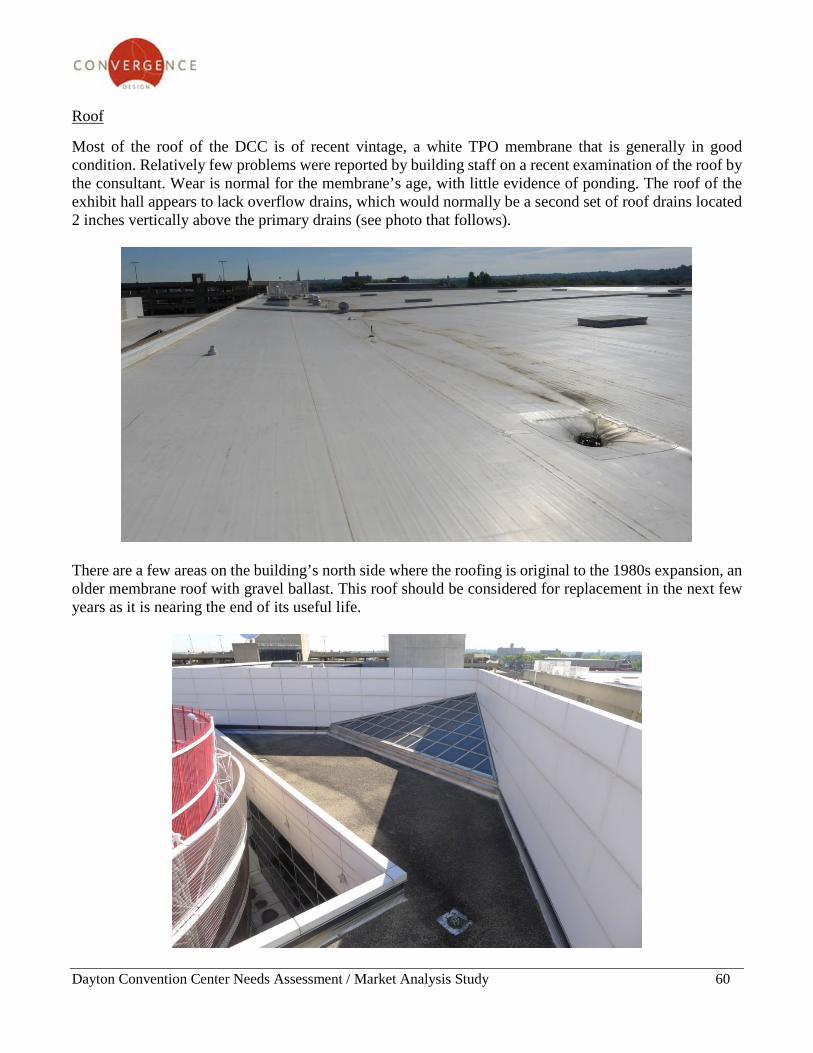
Dayton Convention Center Needs Assessment / Market Analysis Study 60
Roof Most of the roof of the DCC is of recent vintage, a white TPO membrane that is generally in good condition. Relatively few problems were reported by building staff on a recent examination of the roof by the consultant. Wear is normal for the membrane’s age, with little evidence of ponding. The roof of the exhibit hall appears to lack overflow drains, which would normally be a second set of roof drains located 2 inches vertically above the primary drains (see photo that follows).
There are a few areas on the building’s north side where the roofing is original to the 1980s expansion, an older membrane roof with gravel ballast. This roof should be considered for replacement in the next few years as it is nearing the end of its useful life.
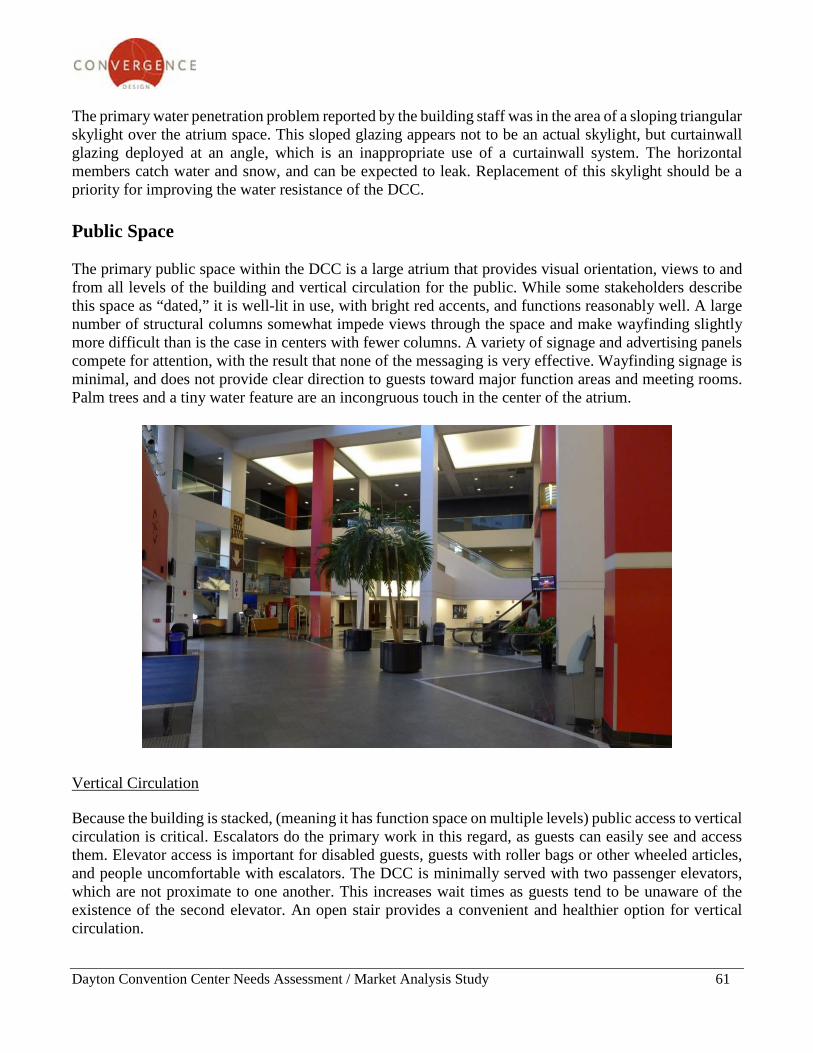
Dayton Convention Center Needs Assessment / Market Analysis Study 61
The primary water penetration problem reported by the building staff was in the area of a sloping triangular skylight over the atrium space. This sloped glazing appears not to be an actual skylight, but curtainwall glazing deployed at an angle, which is an inappropriate use of a curtainwall system. The horizontal members catch water and snow, and can be expected to leak. Replacement of this skylight should be a priority for improving the water resistance of the DCC. Public Space The primary public space within the DCC is a large atrium that provides visual orientation, views to and from all levels of the building and vertical circulation for the public. While some stakeholders describe this space as “dated,” it is well-lit in use, with bright red accents, and functions reasonably well. A large number of structural columns somewhat impede views through the space and make wayfinding slightly more difficult than is the case in centers with fewer columns. A variety of signage and advertising panels compete for attention, with the result that none of the messaging is very effective. Wayfinding signage is minimal, and does not provide clear direction to guests toward major function areas and meeting rooms. Palm trees and a tiny water feature are an incongruous touch in the center of the atrium.
Vertical Circulation Because the building is stacked, (meaning it has function space on multiple levels) public access to vertical circulation is critical. Escalators do the primary work in this regard, as guests can easily see and access them. Elevator access is important for disabled guests, guests with roller bags or other wheeled articles, and people uncomfortable with escalators. The DCC is minimally served with two passenger elevators, which are not proximate to one another. This increases wait times as guests tend to be unaware of the existence of the second elevator. An open stair provides a convenient and healthier option for vertical circulation.
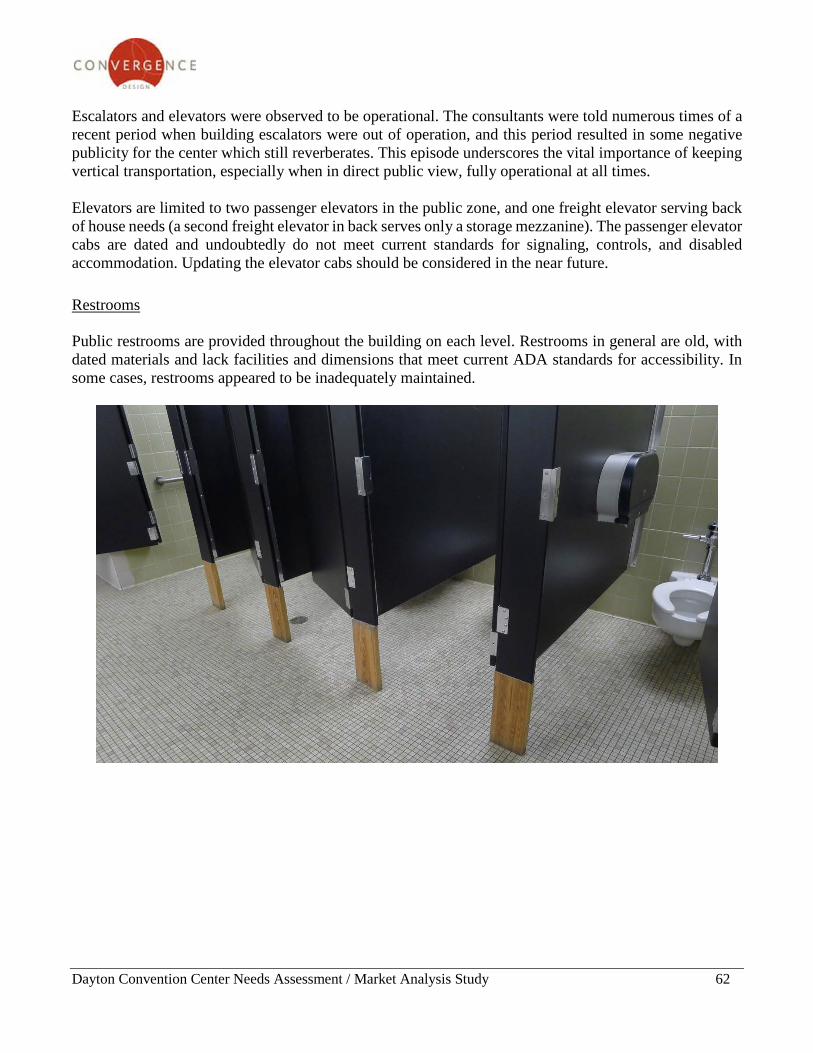
Dayton Convention Center Needs Assessment / Market Analysis Study 62
Escalators and elevators were observed to be operational. The consultants were told numerous times of a recent period when building escalators were out of operation, and this period resulted in some negative publicity for the center which still reverberates. This episode underscores the vital importance of keeping vertical transportation, especially when in direct public view, fully operational at all times. Elevators are limited to two passenger elevators in the public zone, and one freight elevator serving back of house needs (a second freight elevator in back serves only a storage mezzanine). The passenger elevator cabs are dated and undoubtedly do not meet current standards for signaling, controls, and disabled accommodation. Updating the elevator cabs should be considered in the near future. Restrooms Public restrooms are provided throughout the building on each level. Restrooms in general are old, with dated materials and lack facilities and dimensions that meet current ADA standards for accessibility. In some cases, restrooms appeared to be inadequately maintained.
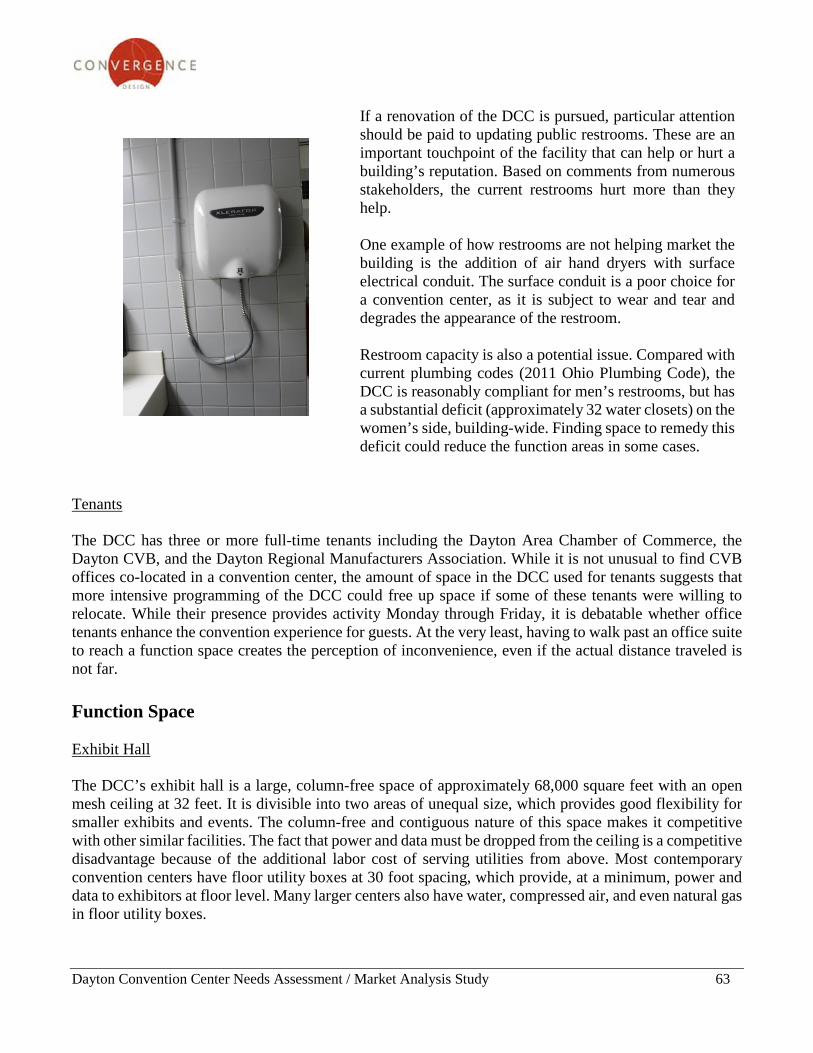
Dayton Convention Center Needs Assessment / Market Analysis Study 63
If a renovation of the DCC is pursued, particular attention should be paid to updating public restrooms. These are an important touchpoint of the facility that can help or hurt a building’s reputation. Based on comments from numerous stakeholders, the current restrooms hurt more than they help. One example of how restrooms are not helping market the building is the addition of air hand dryers with surface electrical conduit. The surface conduit is a poor choice for a convention center, as it is subject to wear and tear and degrades the appearance of the restroom. Restroom capacity is also a potential issue. Compared with current plumbing codes (2011 Ohio Plumbing Code), the DCC is reasonably compliant for men’s restrooms, but has a substantial deficit (approximately 32 water closets) on the women’s side, building-wide. Finding space to remedy this deficit could reduce the function areas in some cases.
Tenants The DCC has three or more full-time tenants including the Dayton Area Chamber of Commerce, the Dayton CVB, and the Dayton Regional Manufacturers Association. While it is not unusual to find CVB offices co-located in a convention center, the amount of space in the DCC used for tenants suggests that more intensive programming of the DCC could free up space if some of these tenants were willing to relocate. While their presence provides activity Monday through Friday, it is debatable whether office tenants enhance the convention experience for guests. At the very least, having to walk past an office suite to reach a function space creates the perception of inconvenience, even if the actual distance traveled is not far. Function Space Exhibit Hall The DCC’s exhibit hall is a large, column-free space of approximately 68,000 square feet with an open mesh ceiling at 32 feet. It is divisible into two areas of unequal size, which provides good flexibility for smaller exhibits and events. The column-free and contiguous nature of this space makes it competitive with other similar facilities. The fact that power and data must be dropped from the ceiling is a competitive disadvantage because of the additional labor cost of serving utilities from above. Most contemporary convention centers have floor utility boxes at 30 foot spacing, which provide, at a minimum, power and data to exhibitors at floor level. Many larger centers also have water, compressed air, and even natural gas in floor utility boxes.
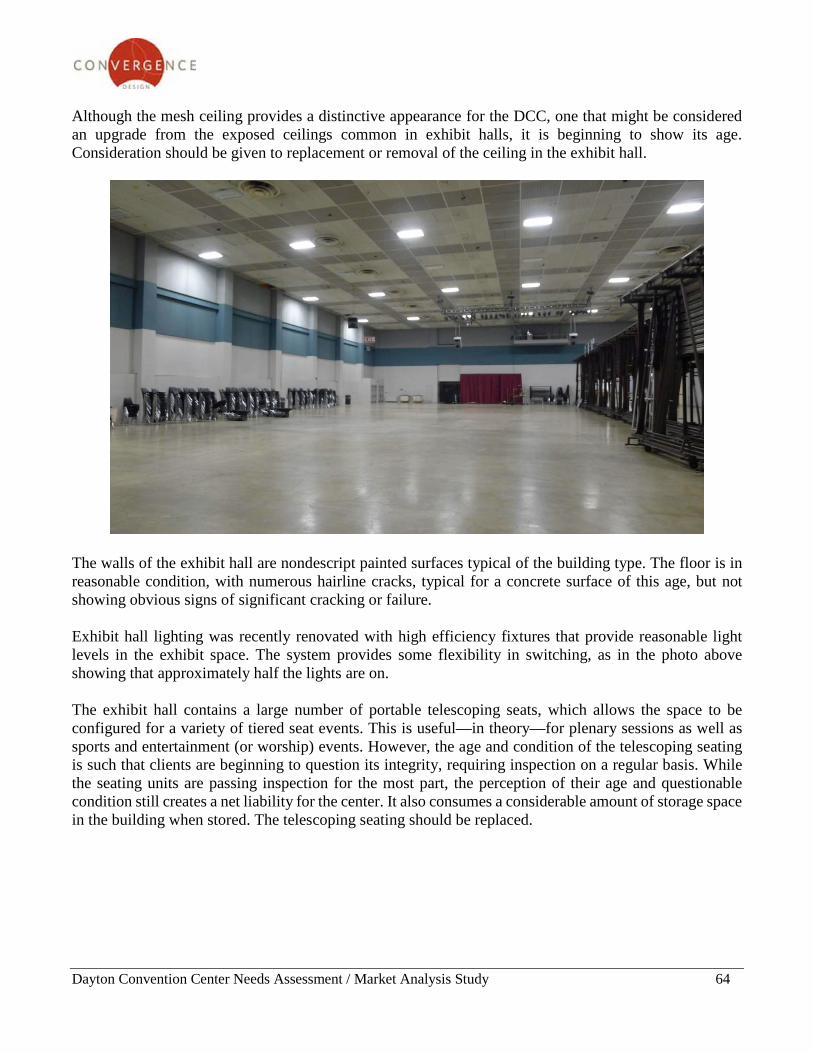
Dayton Convention Center Needs Assessment / Market Analysis Study 64
Although the mesh ceiling provides a distinctive appearance for the DCC, one that might be considered an upgrade from the exposed ceilings common in exhibit halls, it is beginning to show its age. Consideration should be given to replacement or removal of the ceiling in the exhibit hall.
The walls of the exhibit hall are nondescript painted surfaces typical of the building type. The floor is in reasonable condition, with numerous hairline cracks, typical for a concrete surface of this age, but not showing obvious signs of significant cracking or failure. Exhibit hall lighting was recently renovated with high efficiency fixtures that provide reasonable light levels in the exhibit space. The system provides some flexibility in switching, as in the photo above showing that approximately half the lights are on. The exhibit hall contains a large number of portable telescoping seats, which allows the space to be configured for a variety of tiered seat events. This is useful—in theory—for plenary sessions as well as sports and entertainment (or worship) events. However, the age and condition of the telescoping seating is such that clients are beginning to question its integrity, requiring inspection on a regular basis. While the seating units are passing inspection for the most part, the perception of their age and questionable condition still creates a net liability for the center. It also consumes a considerable amount of storage space in the building when stored. The telescoping seating should be replaced.
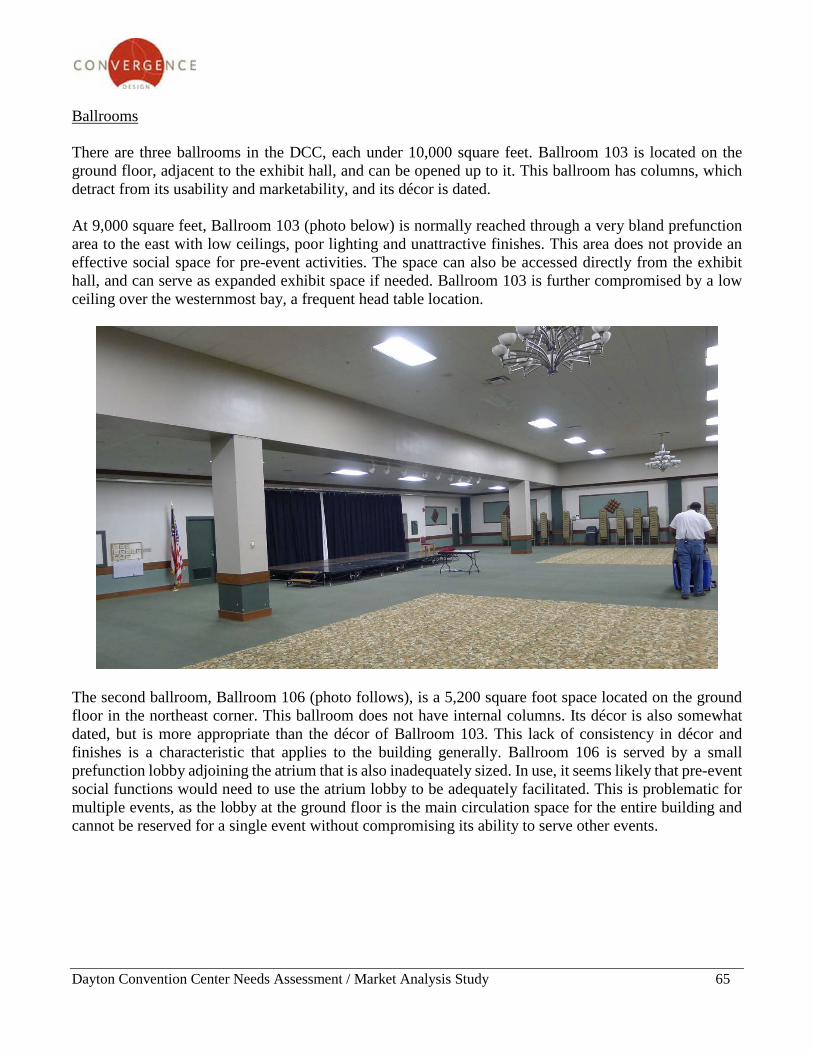
Dayton Convention Center Needs Assessment / Market Analysis Study 65
Ballrooms There are three ballrooms in the DCC, each under 10,000 square feet. Ballroom 103 is located on the ground floor, adjacent to the exhibit hall, and can be opened up to it. This ballroom has columns, which detract from its usability and marketability, and its décor is dated. At 9,000 square feet, Ballroom 103 (photo below) is normally reached through a very bland prefunction area to the east with low ceilings, poor lighting and unattractive finishes. This area does not provide an effective social space for pre-event activities. The space can also be accessed directly from the exhibit hall, and can serve as expanded exhibit space if needed. Ballroom 103 is further compromised by a low ceiling over the westernmost bay, a frequent head table location.
The second ballroom, Ballroom 106 (photo follows), is a 5,200 square foot space located on the ground floor in the northeast corner. This ballroom does not have internal columns. Its décor is also somewhat dated, but is more appropriate than the décor of Ballroom 103. This lack of consistency in décor and finishes is a characteristic that applies to the building generally. Ballroom 106 is served by a small prefunction lobby adjoining the atrium that is also inadequately sized. In use, it seems likely that pre-event social functions would need to use the atrium lobby to be adequately facilitated. This is problematic for multiple events, as the lobby at the ground floor is the main circulation space for the entire building and cannot be reserved for a single event without compromising its ability to serve other events.
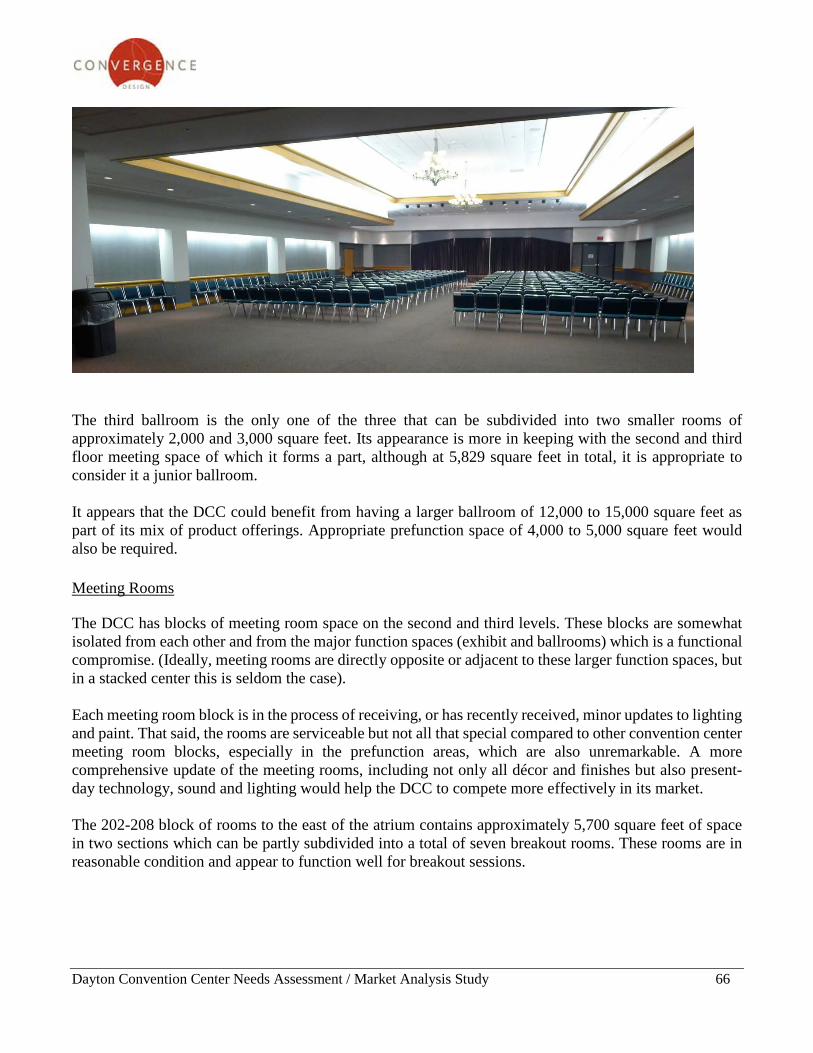
Dayton Convention Center Needs Assessment / Market Analysis Study 66
The third ballroom is the only one of the three that can be subdivided into two smaller rooms of approximately 2,000 and 3,000 square feet. Its appearance is more in keeping with the second and third floor meeting space of which it forms a part, although at 5,829 square feet in total, it is appropriate to consider it a junior ballroom. It appears that the DCC could benefit from having a larger ballroom of 12,000 to 15,000 square feet as part of its mix of product offerings. Appropriate prefunction space of 4,000 to 5,000 square feet would also be required.
Meeting Rooms The DCC has blocks of meeting room space on the second and third levels. These blocks are somewhat isolated from each other and from the major function spaces (exhibit and ballrooms) which is a functional compromise. (Ideally, meeting rooms are directly opposite or adjacent to these larger function spaces, but in a stacked center this is seldom the case). Each meeting room block is in the process of receiving, or has recently received, minor updates to lighting and paint. That said, the rooms are serviceable but not all that special compared to other convention center meeting room blocks, especially in the prefunction areas, which are also unremarkable. A more comprehensive update of the meeting rooms, including not only all décor and finishes but also present-day technology, sound and lighting would help the DCC to compete more effectively in its market. The 202-208 block of rooms to the east of the atrium contains approximately 5,700 square feet of space in two sections which can be partly subdivided into a total of seven breakout rooms. These rooms are in reasonable condition and appear to function well for breakout sessions.
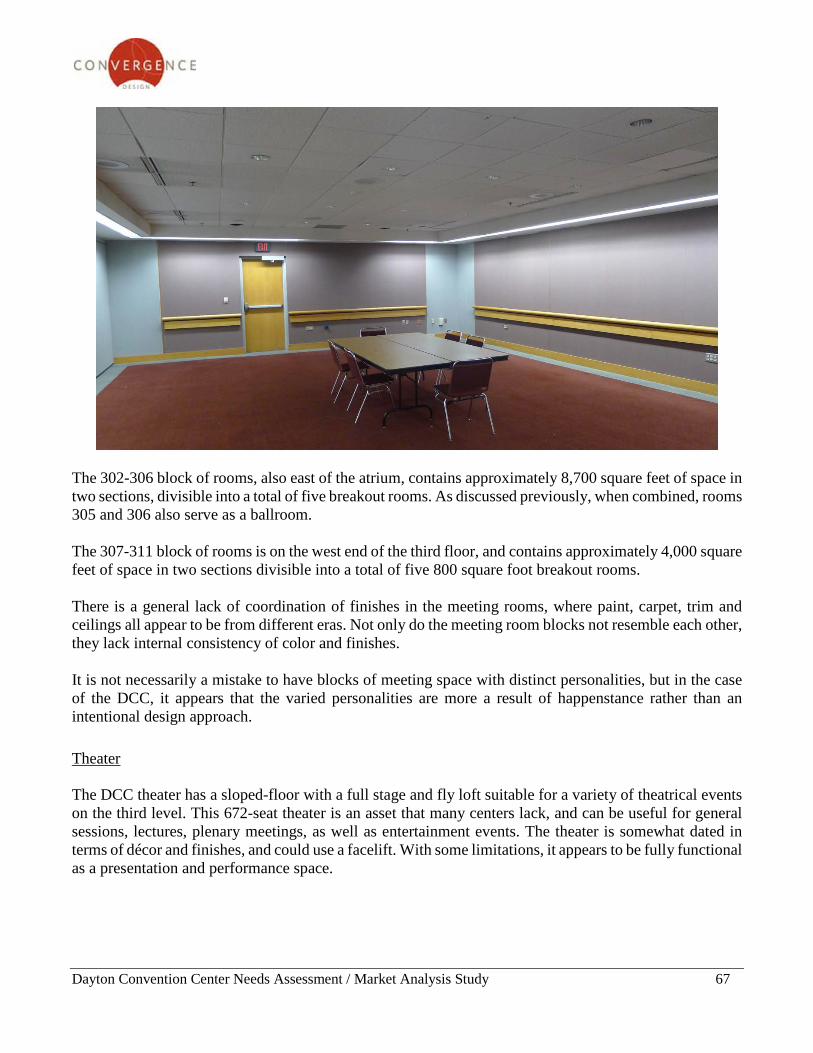
Dayton Convention Center Needs Assessment / Market Analysis Study 67
The 302-306 block of rooms, also east of the atrium, contains approximately 8,700 square feet of space in two sections, divisible into a total of five breakout rooms. As discussed previously, when combined, rooms 305 and 306 also serve as a ballroom. The 307-311 block of rooms is on the west end of the third floor, and contains approximately 4,000 square feet of space in two sections divisible into a total of five 800 square foot breakout rooms. There is a general lack of coordination of finishes in the meeting rooms, where paint, carpet, trim and ceilings all appear to be from different eras. Not only do the meeting room blocks not resemble each other, they lack internal consistency of color and finishes. It is not necessarily a mistake to have blocks of meeting space with distinct personalities, but in the case of the DCC, it appears that the varied personalities are more a result of happenstance rather than an intentional design approach. Theater The DCC theater has a sloped-floor with a full stage and fly loft suitable for a variety of theatrical events on the third level. This 672-seat theater is an asset that many centers lack, and can be useful for general sessions, lectures, plenary meetings, as well as entertainment events. The theater is somewhat dated in terms of décor and finishes, and could use a facelift. With some limitations, it appears to be fully functional as a presentation and performance space.
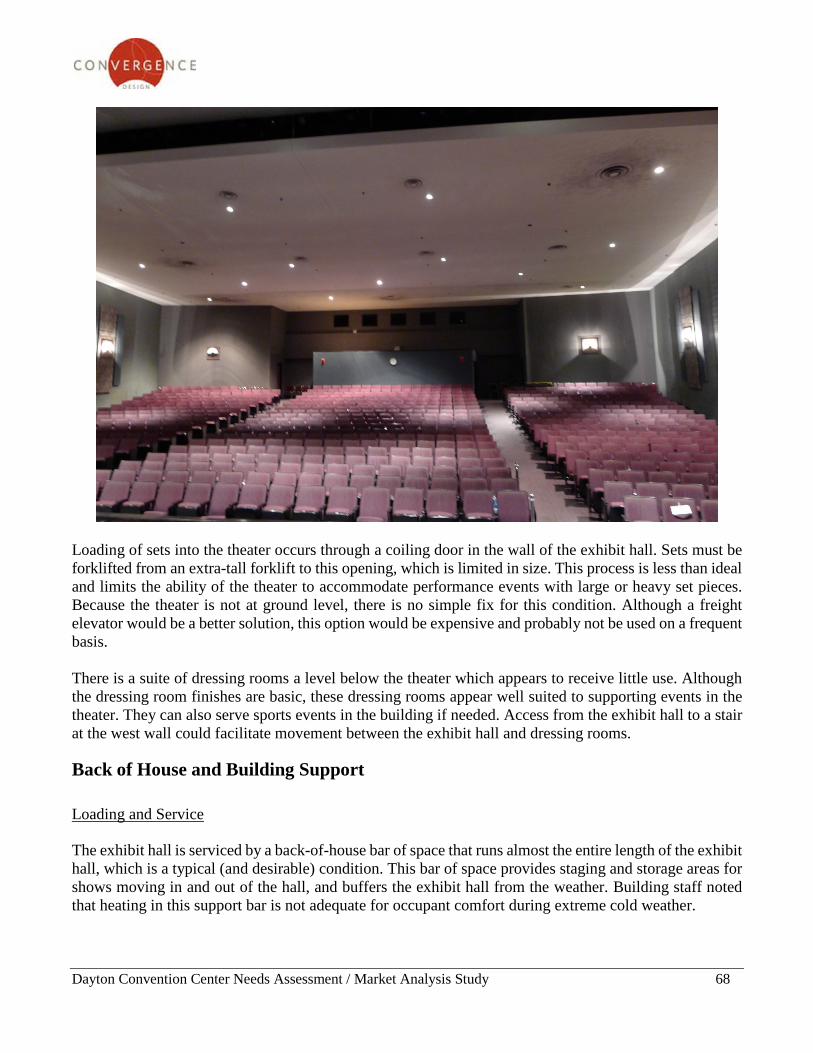
Dayton Convention Center Needs Assessment / Market Analysis Study 68
Loading of sets into the theater occurs through a coiling door in the wall of the exhibit hall. Sets must be forklifted from an extra-tall forklift to this opening, which is limited in size. This process is less than ideal and limits the ability of the theater to accommodate performance events with large or heavy set pieces. Because the theater is not at ground level, there is no simple fix for this condition. Although a freight elevator would be a better solution, this option would be expensive and probably not be used on a frequent basis. There is a suite of dressing rooms a level below the theater which appears to receive little use. Although the dressing room finishes are basic, these dressing rooms appear well suited to supporting events in the theater. They can also serve sports events in the building if needed. Access from the exhibit hall to a stair at the west wall could facilitate movement between the exhibit hall and dressing rooms.
Back of House and Building Support Loading and Service The exhibit hall is serviced by a back-of-house bar of space that runs almost the entire length of the exhibit hall, which is a typical (and desirable) condition. This bar of space provides staging and storage areas for shows moving in and out of the hall, and buffers the exhibit hall from the weather. Building staff noted that heating in this support bar is not adequate for occupant comfort during extreme cold weather.
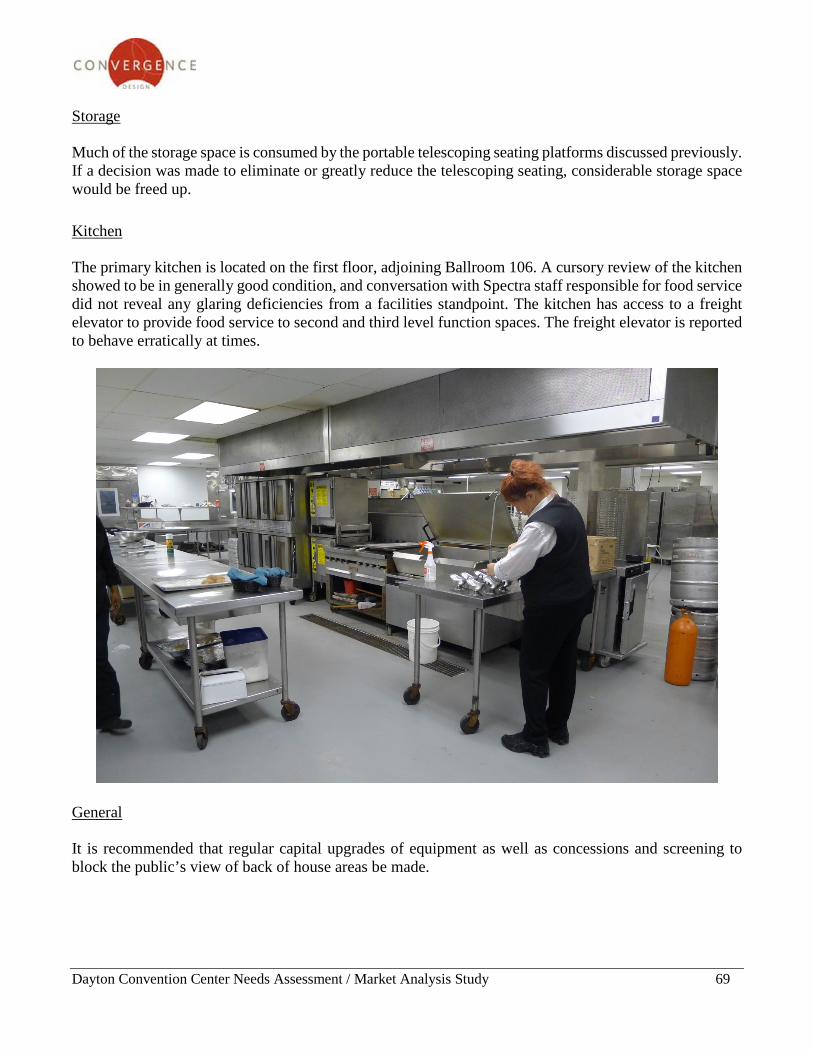
Dayton Convention Center Needs Assessment / Market Analysis Study 69
Storage Much of the storage space is consumed by the portable telescoping seating platforms discussed previously. If a decision was made to eliminate or greatly reduce the telescoping seating, considerable storage space would be freed up. Kitchen The primary kitchen is located on the first floor, adjoining Ballroom 106. A cursory review of the kitchen showed to be in generally good condition, and conversation with Spectra staff responsible for food service did not reveal any glaring deficiencies from a facilities standpoint. The kitchen has access to a freight elevator to provide food service to second and third level function spaces. The freight elevator is reported to behave erratically at times.
General It is recommended that regular capital upgrades of equipment as well as concessions and screening to block the public’s view of back of house areas be made.
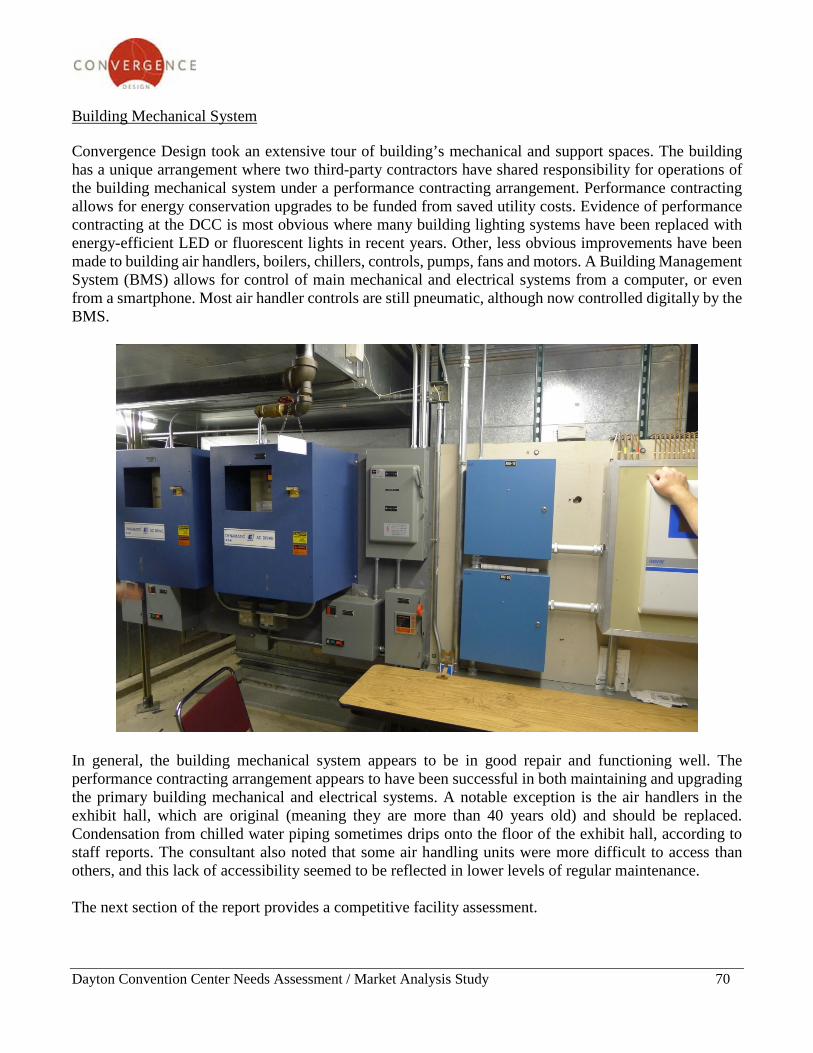
Dayton Convention Center Needs Assessment / Market Analysis Study 70
Building Mechanical System Convergence Design took an extensive tour of building’s mechanical and support spaces. The building has a unique arrangement where two third-party contractors have shared responsibility for operations of the building mechanical system under a performance contracting arrangement. Performance contracting allows for energy conservation upgrades to be funded from saved utility costs. Evidence of performance contracting at the DCC is most obvious where many building lighting systems have been replaced with energy-efficient LED or fluorescent lights in recent years. Other, less obvious improvements have been made to building air handlers, boilers, chillers, controls, pumps, fans and motors. A Building Management System (BMS) allows for control of main mechanical and electrical systems from a computer, or even from a smartphone. Most air handler controls are still pneumatic, although now controlled digitally by the BMS.
In general, the building mechanical system appears to be in good repair and functioning well. The performance contracting arrangement appears to have been successful in both maintaining and upgrading the primary building mechanical and electrical systems. A notable exception is the air handlers in the exhibit hall, which are original (meaning they are more than 40 years old) and should be replaced. Condensation from chilled water piping sometimes drips onto the floor of the exhibit hall, according to staff reports. The consultant also noted that some air handling units were more difficult to access than others, and this lack of accessibility seemed to be reflected in lower levels of regular maintenance. The next section of the report provides a competitive facility assessment.

Dayton Convention Center Needs Assessment / Market Analysis Study 71
Table of Contents
1 Introduction and Executive Summary 1 2 General Market Overview 11 3 Key Industry Trends 20 4 Historical Facility Operations 27 5 General Management Practices Assessment 47 6 Physical Facility Assessment 57 7 Competitive Facility Assessment 71 8 Needs Assessment 85 9 Economic Analysis 94
10 Funding Analysis 113
11 Limiting Conditions and Assumptions 120
12 Appendix 122
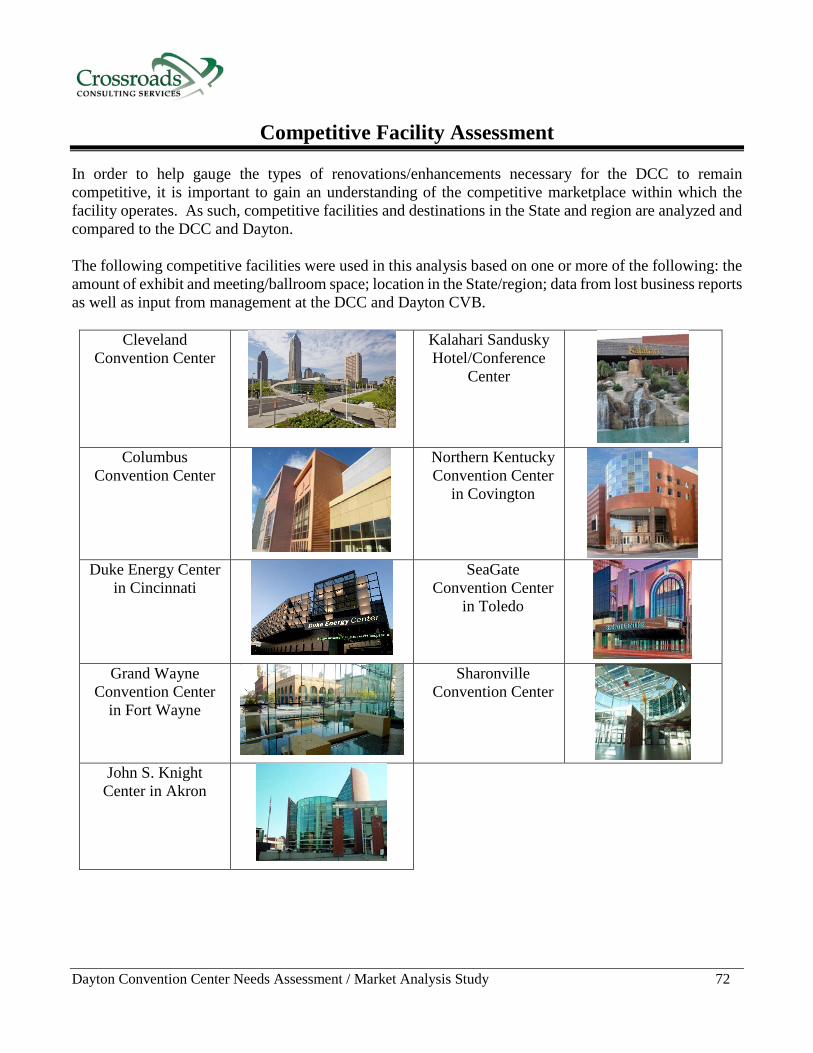
Dayton Convention Center Needs Assessment / Market Analysis Study 72
Competitive Facility Assessment
In order to help gauge the types of renovations/enhancements necessary for the DCC to remain competitive, it is important to gain an understanding of the competitive marketplace within which the facility operates. As such, competitive facilities and destinations in the State and region are analyzed and compared to the DCC and Dayton. The following competitive facilities were used in this analysis based on one or more of the following: the amount of exhibit and meeting/ballroom space; location in the State/region; data from lost business reports as well as input from management at the DCC and Dayton CVB.
Cleveland Convention Center
Kalahari Sandusky Hotel/Conference
Center
Columbus Convention Center
Northern Kentucky Convention Center
in Covington
Duke Energy Center
in Cincinnati
SeaGate Convention Center
in Toledo
Grand Wayne
Convention Center in Fort Wayne
Sharonville Convention Center
John S. Knight
Center in Akron
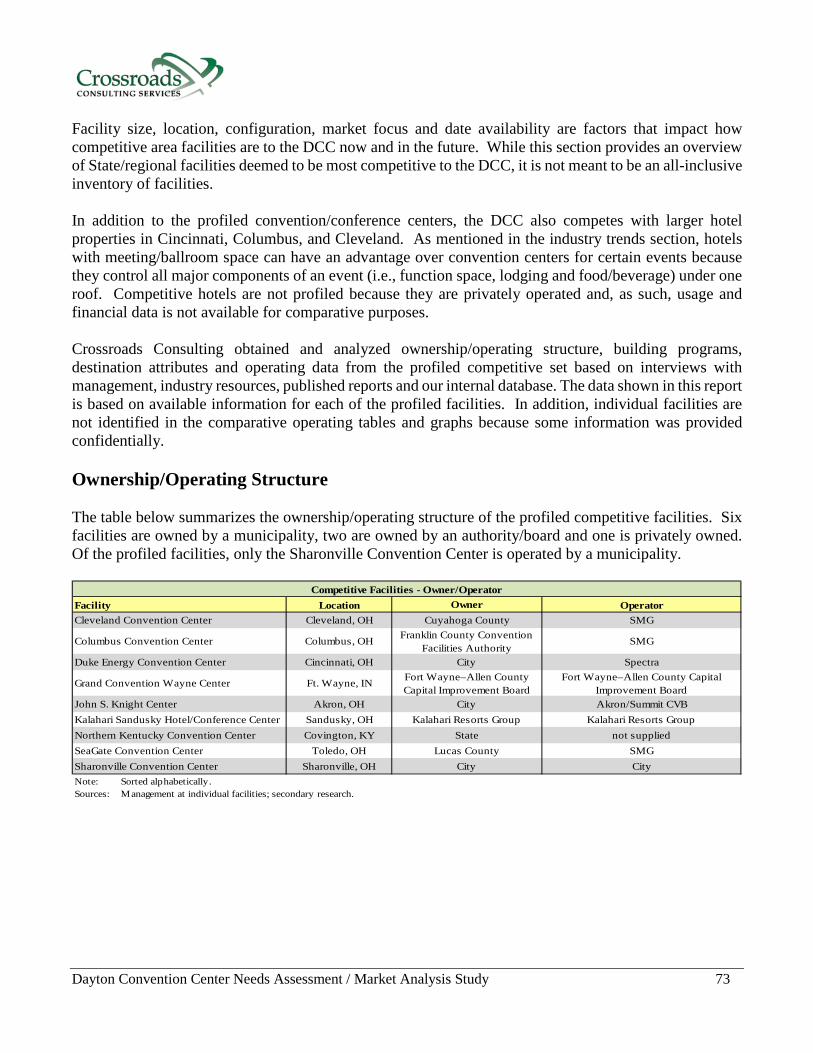
Dayton Convention Center Needs Assessment / Market Analysis Study 73
Facility size, location, configuration, market focus and date availability are factors that impact how competitive area facilities are to the DCC now and in the future. While this section provides an overview of State/regional facilities deemed to be most competitive to the DCC, it is not meant to be an all-inclusive inventory of facilities. In addition to the profiled convention/conference centers, the DCC also competes with larger hotel properties in Cincinnati, Columbus, and Cleveland. As mentioned in the industry trends section, hotels with meeting/ballroom space can have an advantage over convention centers for certain events because they control all major components of an event (i.e., function space, lodging and food/beverage) under one roof. Competitive hotels are not profiled because they are privately operated and, as such, usage and financial data is not available for comparative purposes. Crossroads Consulting obtained and analyzed ownership/operating structure, building programs, destination attributes and operating data from the profiled competitive set based on interviews with management, industry resources, published reports and our internal database. The data shown in this report is based on available information for each of the profiled facilities. In addition, individual facilities are not identified in the comparative operating tables and graphs because some information was provided confidentially. Ownership/Operating Structure The table below summarizes the ownership/operating structure of the profiled competitive facilities. Six facilities are owned by a municipality, two are owned by an authority/board and one is privately owned. Of the profiled facilities, only the Sharonville Convention Center is operated by a municipality.
Facility Location Owner OperatorCleveland Convention Center Cleveland, OH Cuyahoga County SMG
Columbus Convention Center Columbus, OH Franklin County Convention Facilities Authority
SMG
Duke Energy Convention Center Cincinnati, OH City Spectra
Grand Convention Wayne Center Ft. Wayne, IN Fort Wayne–Allen County Capital Improvement Board
Fort Wayne–Allen County Capital Improvement Board
John S. Knight Center Akron, OH City Akron/Summit CVBKalahari Sandusky Hotel/Conference Center Sandusky, OH Kalahari Resorts Group Kalahari Resorts GroupNorthern Kentucky Convention Center Covington, KY State not suppliedSeaGate Convention Center Toledo, OH Lucas County SMGSharonville Convention Center Sharonville, OH City CityNote: Sorted alphabetically.Sources: Management at individual facilities; secondary research.
Competitive Facilities - Owner/Operator
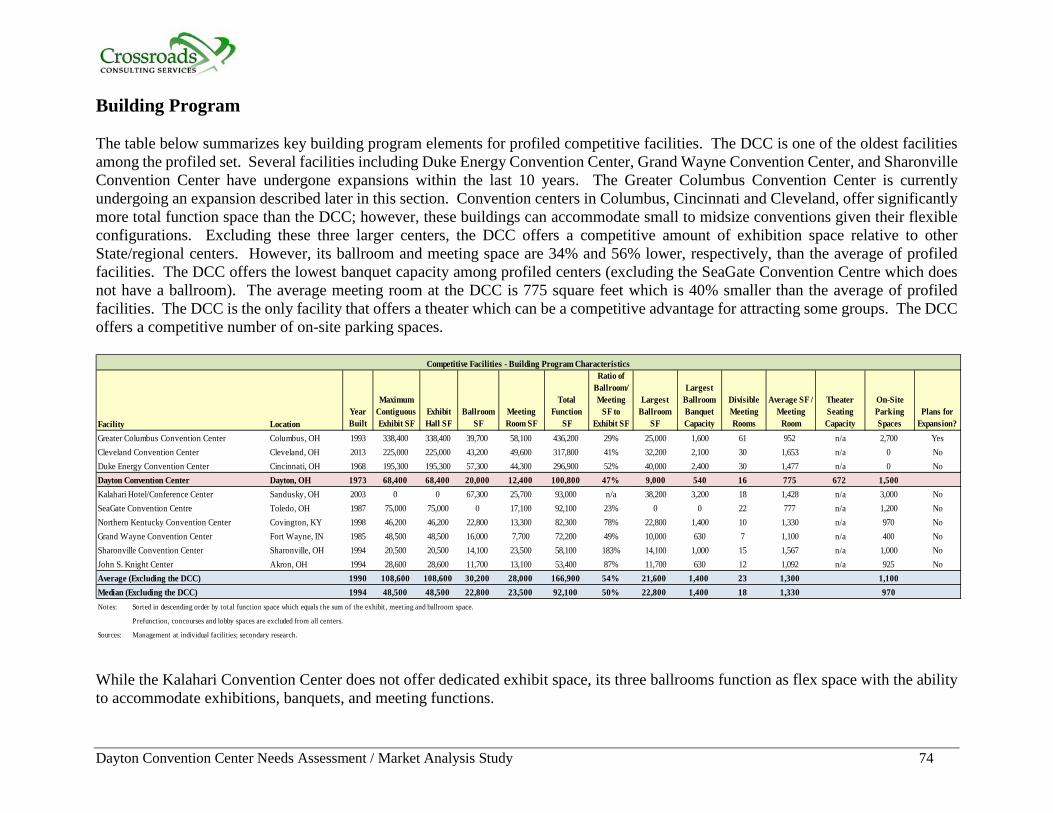
Dayton Convention Center Needs Assessment / Market Analysis Study 74
Building Program The table below summarizes key building program elements for profiled competitive facilities. The DCC is one of the oldest facilities among the profiled set. Several facilities including Duke Energy Convention Center, Grand Wayne Convention Center, and Sharonville Convention Center have undergone expansions within the last 10 years. The Greater Columbus Convention Center is currently undergoing an expansion described later in this section. Convention centers in Columbus, Cincinnati and Cleveland, offer significantly more total function space than the DCC; however, these buildings can accommodate small to midsize conventions given their flexible configurations. Excluding these three larger centers, the DCC offers a competitive amount of exhibition space relative to other State/regional centers. However, its ballroom and meeting space are 34% and 56% lower, respectively, than the average of profiled facilities. The DCC offers the lowest banquet capacity among profiled centers (excluding the SeaGate Convention Centre which does not have a ballroom). The average meeting room at the DCC is 775 square feet which is 40% smaller than the average of profiled facilities. The DCC is the only facility that offers a theater which can be a competitive advantage for attracting some groups. The DCC offers a competitive number of on-site parking spaces.
Facility LocationYear Built
Maximum Contiguous Exhibit SF
Exhibit Hall SF
Ballroom SF
Meeting Room SF
Total Function
SF
Ratio of Ballroom/ Meeting
SF to Exhibit SF
Largest Ballroom
SF
Largest Ballroom Banquet Capacity
Divisible Meeting Rooms
Average SF / Meeting
Room
Theater Seating Capacity
On-Site Parking Spaces
Plans for Expansion?
Greater Columbus Convention Center Columbus, OH 1993 338,400 338,400 39,700 58,100 436,200 29% 25,000 1,600 61 952 n/a 2,700 YesCleveland Convention Center Cleveland, OH 2013 225,000 225,000 43,200 49,600 317,800 41% 32,200 2,100 30 1,653 n/a 0 NoDuke Energy Convention Center Cincinnati, OH 1968 195,300 195,300 57,300 44,300 296,900 52% 40,000 2,400 30 1,477 n/a 0 NoDayton Convention Center Dayton, OH 1973 68,400 68,400 20,000 12,400 100,800 47% 9,000 540 16 775 672 1,500Kalahari Hotel/Conference Center Sandusky, OH 2003 0 0 67,300 25,700 93,000 n/a 38,200 3,200 18 1,428 n/a 3,000 NoSeaGate Convention Centre Toledo, OH 1987 75,000 75,000 0 17,100 92,100 23% 0 0 22 777 n/a 1,200 NoNorthern Kentucky Convention Center Covington, KY 1998 46,200 46,200 22,800 13,300 82,300 78% 22,800 1,400 10 1,330 n/a 970 NoGrand Wayne Convention Center Fort Wayne, IN 1985 48,500 48,500 16,000 7,700 72,200 49% 10,000 630 7 1,100 n/a 400 NoSharonville Convention Center Sharonville, OH 1994 20,500 20,500 14,100 23,500 58,100 183% 14,100 1,000 15 1,567 n/a 1,000 NoJohn S. Knight Center Akron, OH 1994 28,600 28,600 11,700 13,100 53,400 87% 11,700 630 12 1,092 n/a 925 NoAverage (Excluding the DCC) 1990 108,600 108,600 30,200 28,000 166,900 54% 21,600 1,400 23 1,300 1,100Median (Excluding the DCC) 1994 48,500 48,500 22,800 23,500 92,100 50% 22,800 1,400 18 1,330 970Notes: Sorted in descending order by total function space which equals the sum of the exhibit , meeting and ballroom space.
Prefunction, concourses and lobby spaces are excluded from all centers.
Sources: Management at individual facilit ies; secondary research.
Competitive Facilities - Building Program Characteristics
While the Kalahari Convention Center does not offer dedicated exhibit space, its three ballrooms function as flex space with the ability to accommodate exhibitions, banquets, and meeting functions.
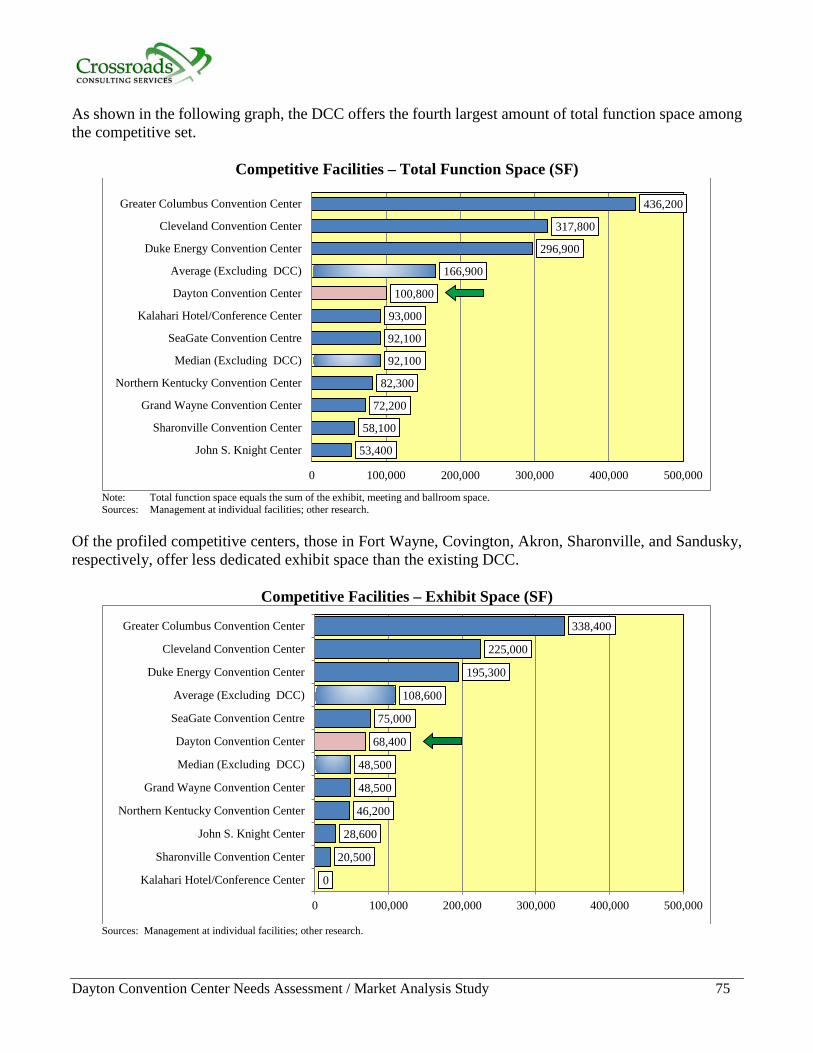
Dayton Convention Center Needs Assessment / Market Analysis Study 75
As shown in the following graph, the DCC offers the fourth largest amount of total function space among the competitive set.
Competitive Facilities – Total Function Space (SF)
Note: Total function space equals the sum of the exhibit, meeting and ballroom space. Sources: Management at individual facilities; other research.
Of the profiled competitive centers, those in Fort Wayne, Covington, Akron, Sharonville, and Sandusky, respectively, offer less dedicated exhibit space than the existing DCC.
Competitive Facilities – Exhibit Space (SF)
Sources: Management at individual facilities; other research.
53,400
58,100
72,200
82,300
92,100
92,100
93,000
100,800
166,900
296,900
317,800
436,200
0 100,000 200,000 300,000 400,000 500,000
John S. Knight Center
Sharonville Convention Center
Grand Wayne Convention Center
Northern Kentucky Convention Center
Median (Excluding DCC)
SeaGate Convention Centre
Kalahari Hotel/Conference Center
Dayton Convention Center
Average (Excluding DCC)
Duke Energy Convention Center
Cleveland Convention Center
Greater Columbus Convention Center
0
20,500
28,600
46,200
48,500
48,500
68,400
75,000
108,600
195,300
225,000
338,400
0 100,000 200,000 300,000 400,000 500,000
Kalahari Hotel/Conference Center
Sharonville Convention Center
John S. Knight Center
Northern Kentucky Convention Center
Grand Wayne Convention Center
Median (Excluding DCC)
Dayton Convention Center
SeaGate Convention Centre
Average (Excluding DCC)
Duke Energy Convention Center
Cleveland Convention Center
Greater Columbus Convention Center
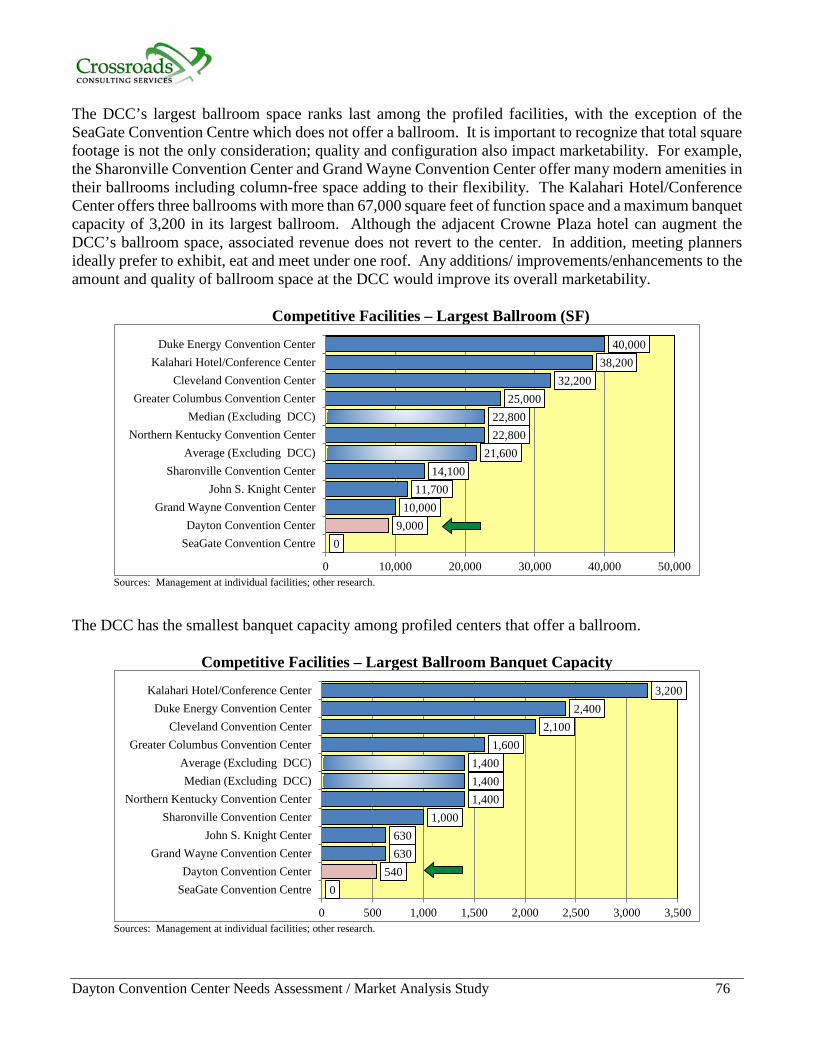
Dayton Convention Center Needs Assessment / Market Analysis Study 76
The DCC’s largest ballroom space ranks last among the profiled facilities, with the exception of the SeaGate Convention Centre which does not offer a ballroom. It is important to recognize that total square footage is not the only consideration; quality and configuration also impact marketability. For example, the Sharonville Convention Center and Grand Wayne Convention Center offer many modern amenities in their ballrooms including column-free space adding to their flexibility. The Kalahari Hotel/Conference Center offers three ballrooms with more than 67,000 square feet of function space and a maximum banquet capacity of 3,200 in its largest ballroom. Although the adjacent Crowne Plaza hotel can augment the DCC’s ballroom space, associated revenue does not revert to the center. In addition, meeting planners ideally prefer to exhibit, eat and meet under one roof. Any additions/ improvements/enhancements to the amount and quality of ballroom space at the DCC would improve its overall marketability.
Competitive Facilities – Largest Ballroom (SF)
Sources: Management at individual facilities; other research.
The DCC has the smallest banquet capacity among profiled centers that offer a ballroom.
Competitive Facilities – Largest Ballroom Banquet Capacity
Sources: Management at individual facilities; other research.
09,000
10,00011,700
14,10021,600
22,80022,800
25,00032,200
38,20040,000
0 10,000 20,000 30,000 40,000 50,000
SeaGate Convention CentreDayton Convention Center
Grand Wayne Convention CenterJohn S. Knight Center
Sharonville Convention CenterAverage (Excluding DCC)
Northern Kentucky Convention CenterMedian (Excluding DCC)
Greater Columbus Convention CenterCleveland Convention Center
Kalahari Hotel/Conference CenterDuke Energy Convention Center
0540
630630
1,0001,4001,4001,400
1,6002,100
2,4003,200
0 500 1,000 1,500 2,000 2,500 3,000 3,500
SeaGate Convention CentreDayton Convention Center
Grand Wayne Convention CenterJohn S. Knight Center
Sharonville Convention CenterNorthern Kentucky Convention Center
Median (Excluding DCC)Average (Excluding DCC)
Greater Columbus Convention CenterCleveland Convention Center
Duke Energy Convention CenterKalahari Hotel/Conference Center
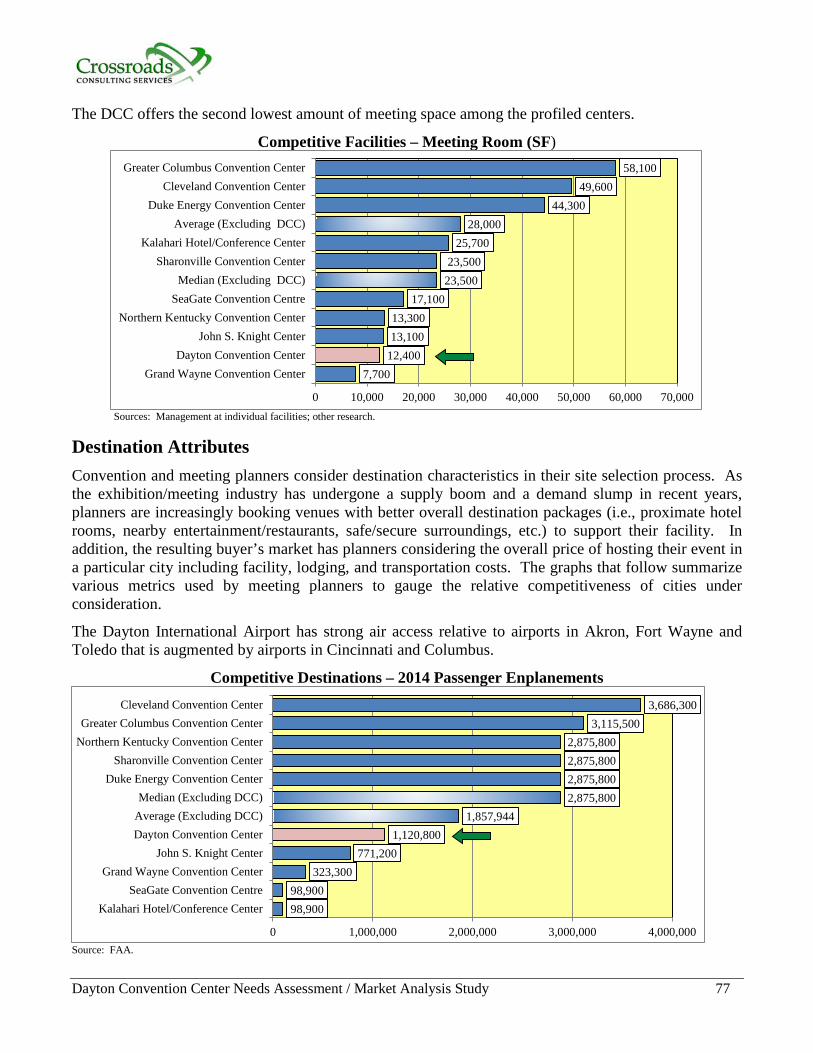
Dayton Convention Center Needs Assessment / Market Analysis Study 77
The DCC offers the second lowest amount of meeting space among the profiled centers.
Competitive Facilities – Meeting Room (SF)
Sources: Management at individual facilities; other research.
Destination Attributes
Convention and meeting planners consider destination characteristics in their site selection process. As the exhibition/meeting industry has undergone a supply boom and a demand slump in recent years, planners are increasingly booking venues with better overall destination packages (i.e., proximate hotel rooms, nearby entertainment/restaurants, safe/secure surroundings, etc.) to support their facility. In addition, the resulting buyer’s market has planners considering the overall price of hosting their event in a particular city including facility, lodging, and transportation costs. The graphs that follow summarize various metrics used by meeting planners to gauge the relative competitiveness of cities under consideration.
The Dayton International Airport has strong air access relative to airports in Akron, Fort Wayne and Toledo that is augmented by airports in Cincinnati and Columbus.
Competitive Destinations – 2014 Passenger Enplanements
Source: FAA.
7,700 12,400 13,100 13,300
17,100 23,500 23,500
25,700 28,000
44,300 49,600
58,100
0 10,000 20,000 30,000 40,000 50,000 60,000 70,000
Grand Wayne Convention CenterDayton Convention Center
John S. Knight CenterNorthern Kentucky Convention Center
SeaGate Convention CentreMedian (Excluding DCC)
Sharonville Convention CenterKalahari Hotel/Conference Center
Average (Excluding DCC)Duke Energy Convention Center
Cleveland Convention CenterGreater Columbus Convention Center
98,90098,900
323,300771,200
1,120,8001,857,944
2,875,8002,875,8002,875,8002,875,800
3,115,5003,686,300
0 1,000,000 2,000,000 3,000,000 4,000,000
Kalahari Hotel/Conference CenterSeaGate Convention Centre
Grand Wayne Convention CenterJohn S. Knight Center
Dayton Convention CenterAverage (Excluding DCC)Median (Excluding DCC)
Duke Energy Convention CenterSharonville Convention Center
Northern Kentucky Convention CenterGreater Columbus Convention Center
Cleveland Convention Center
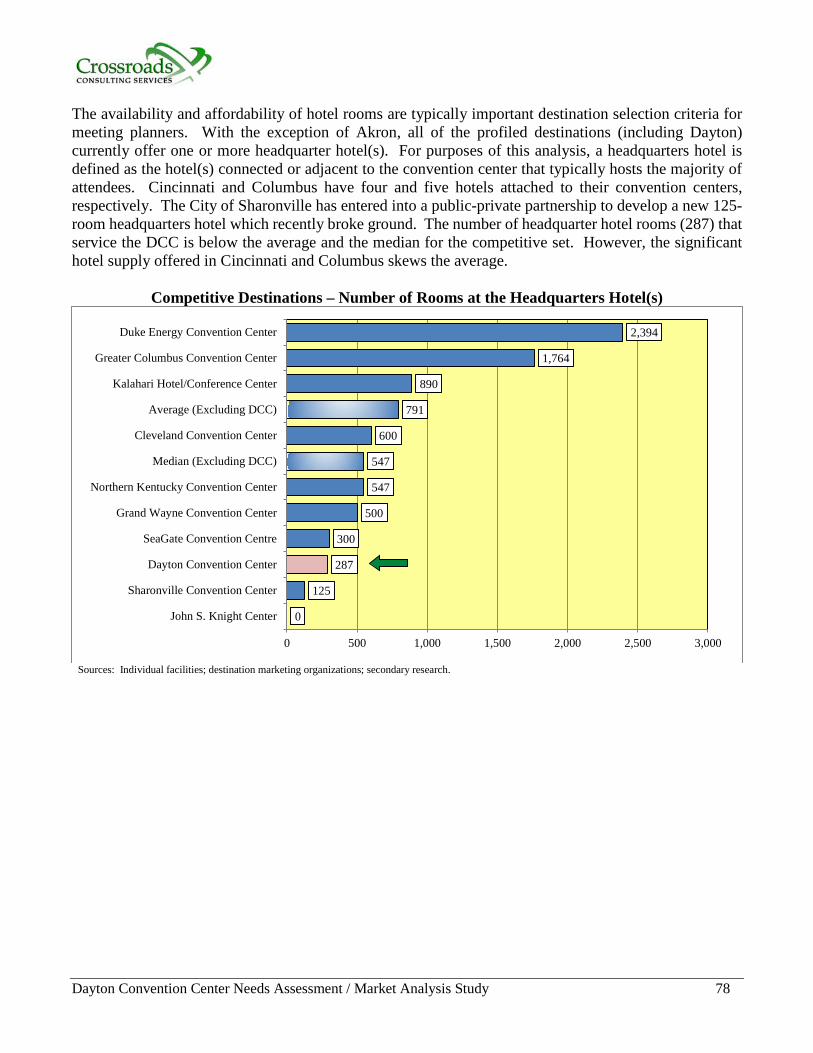
Dayton Convention Center Needs Assessment / Market Analysis Study 78
The availability and affordability of hotel rooms are typically important destination selection criteria for meeting planners. With the exception of Akron, all of the profiled destinations (including Dayton) currently offer one or more headquarter hotel(s). For purposes of this analysis, a headquarters hotel is defined as the hotel(s) connected or adjacent to the convention center that typically hosts the majority of attendees. Cincinnati and Columbus have four and five hotels attached to their convention centers, respectively. The City of Sharonville has entered into a public-private partnership to develop a new 125-room headquarters hotel which recently broke ground. The number of headquarter hotel rooms (287) that service the DCC is below the average and the median for the competitive set. However, the significant hotel supply offered in Cincinnati and Columbus skews the average.
Competitive Destinations – Number of Rooms at the Headquarters Hotel(s)
Sources: Individual facilities; destination marketing organizations; secondary research.
0
125
287
300
500
547
547
600
791
890
1,764
2,394
0 500 1,000 1,500 2,000 2,500 3,000
John S. Knight Center
Sharonville Convention Center
Dayton Convention Center
SeaGate Convention Centre
Grand Wayne Convention Center
Northern Kentucky Convention Center
Median (Excluding DCC)
Cleveland Convention Center
Average (Excluding DCC)
Kalahari Hotel/Conference Center
Greater Columbus Convention Center
Duke Energy Convention Center
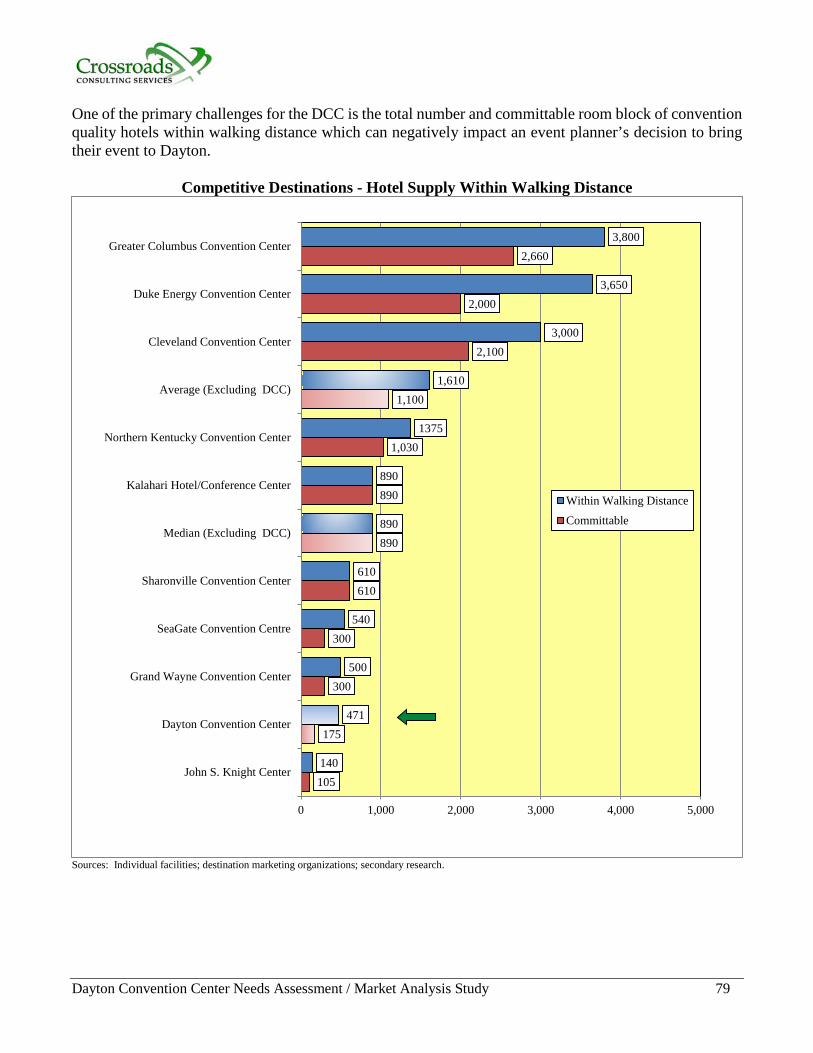
Dayton Convention Center Needs Assessment / Market Analysis Study 79
One of the primary challenges for the DCC is the total number and committable room block of convention quality hotels within walking distance which can negatively impact an event planner’s decision to bring their event to Dayton.
Competitive Destinations - Hotel Supply Within Walking Distance
Sources: Individual facilities; destination marketing organizations; secondary research.
105
175
300
300
610
890
890
1,030
1,100
2,100
2,000
2,660
140
471
500
540
610
890
890
1375
1,610
3,000
3,650
3,800
0 1,000 2,000 3,000 4,000 5,000
John S. Knight Center
Dayton Convention Center
Grand Wayne Convention Center
SeaGate Convention Centre
Sharonville Convention Center
Median (Excluding DCC)
Kalahari Hotel/Conference Center
Northern Kentucky Convention Center
Average (Excluding DCC)
Cleveland Convention Center
Duke Energy Convention Center
Greater Columbus Convention Center
Within Walking DistanceCommittable
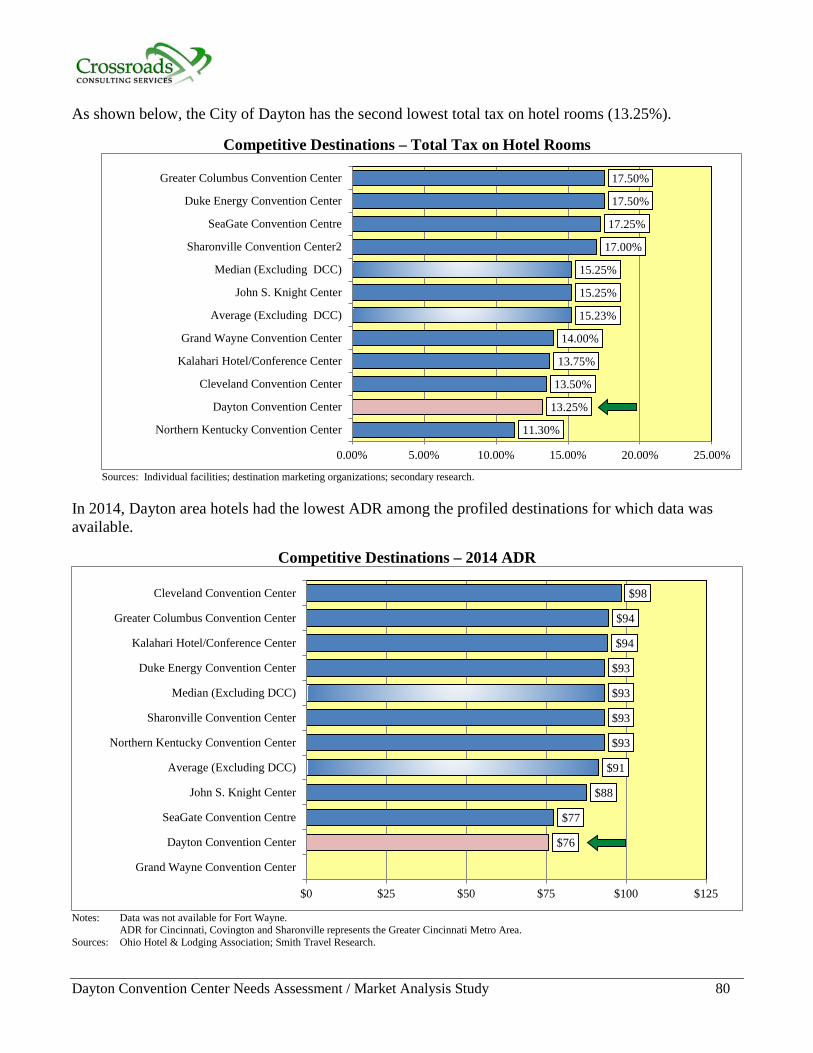
Dayton Convention Center Needs Assessment / Market Analysis Study 80
As shown below, the City of Dayton has the second lowest total tax on hotel rooms (13.25%).
Competitive Destinations – Total Tax on Hotel Rooms
Sources: Individual facilities; destination marketing organizations; secondary research.
In 2014, Dayton area hotels had the lowest ADR among the profiled destinations for which data was available.
Competitive Destinations – 2014 ADR
Notes: Data was not available for Fort Wayne. ADR for Cincinnati, Covington and Sharonville represents the Greater Cincinnati Metro Area. Sources: Ohio Hotel & Lodging Association; Smith Travel Research.
11.30%
13.25%
13.50%
13.75%
14.00%
15.23%
15.25%
15.25%
17.00%
17.25%
17.50%
17.50%
0.00% 5.00% 10.00% 15.00% 20.00% 25.00%
Northern Kentucky Convention Center
Dayton Convention Center
Cleveland Convention Center
Kalahari Hotel/Conference Center
Grand Wayne Convention Center
Average (Excluding DCC)
John S. Knight Center
Median (Excluding DCC)
Sharonville Convention Center2
SeaGate Convention Centre
Duke Energy Convention Center
Greater Columbus Convention Center
$76
$77
$88
$91
$93
$93
$93
$93
$94
$94
$98
$0 $25 $50 $75 $100 $125
Grand Wayne Convention Center
Dayton Convention Center
SeaGate Convention Centre
John S. Knight Center
Average (Excluding DCC)
Northern Kentucky Convention Center
Sharonville Convention Center
Median (Excluding DCC)
Duke Energy Convention Center
Kalahari Hotel/Conference Center
Greater Columbus Convention Center
Cleveland Convention Center
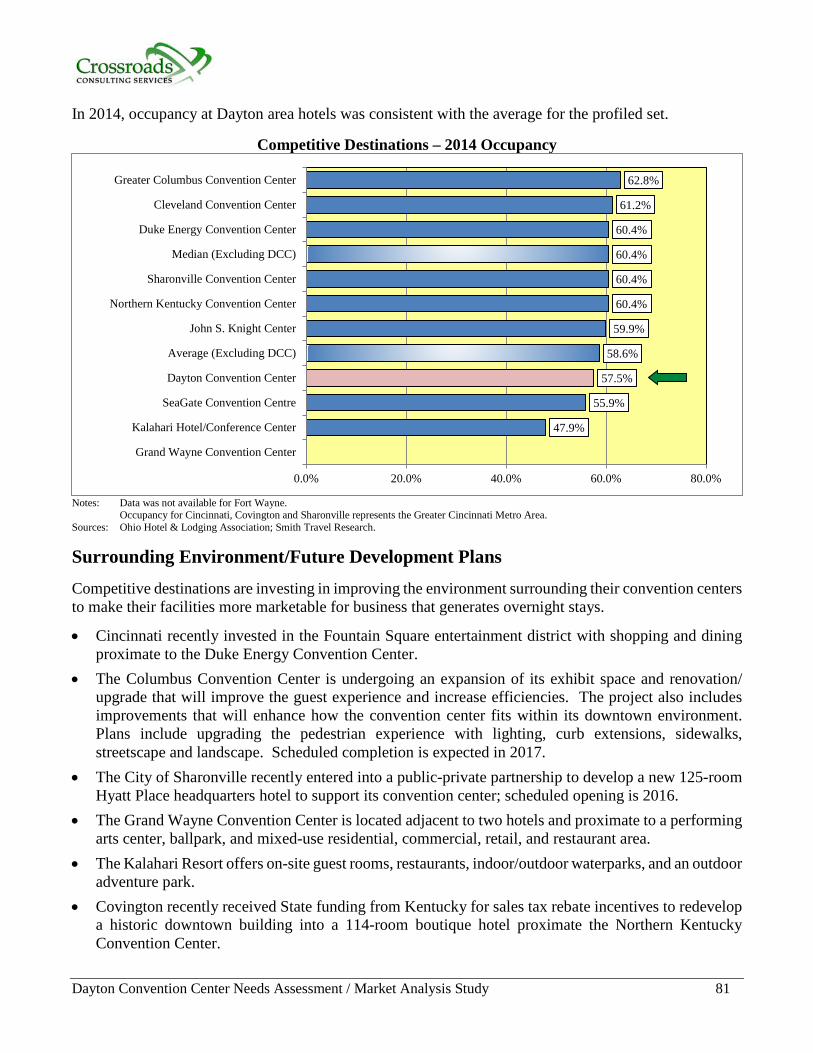
Dayton Convention Center Needs Assessment / Market Analysis Study 81
In 2014, occupancy at Dayton area hotels was consistent with the average for the profiled set.
Competitive Destinations – 2014 Occupancy
Notes: Data was not available for Fort Wayne. Occupancy for Cincinnati, Covington and Sharonville represents the Greater Cincinnati Metro Area. Sources: Ohio Hotel & Lodging Association; Smith Travel Research.
Surrounding Environment/Future Development Plans Competitive destinations are investing in improving the environment surrounding their convention centers to make their facilities more marketable for business that generates overnight stays.
• Cincinnati recently invested in the Fountain Square entertainment district with shopping and dining proximate to the Duke Energy Convention Center.
• The Columbus Convention Center is undergoing an expansion of its exhibit space and renovation/ upgrade that will improve the guest experience and increase efficiencies. The project also includes improvements that will enhance how the convention center fits within its downtown environment. Plans include upgrading the pedestrian experience with lighting, curb extensions, sidewalks, streetscape and landscape. Scheduled completion is expected in 2017.
• The City of Sharonville recently entered into a public-private partnership to develop a new 125-room Hyatt Place headquarters hotel to support its convention center; scheduled opening is 2016.
• The Grand Wayne Convention Center is located adjacent to two hotels and proximate to a performing arts center, ballpark, and mixed-use residential, commercial, retail, and restaurant area.
• The Kalahari Resort offers on-site guest rooms, restaurants, indoor/outdoor waterparks, and an outdoor adventure park.
• Covington recently received State funding from Kentucky for sales tax rebate incentives to redevelop a historic downtown building into a 114-room boutique hotel proximate the Northern Kentucky Convention Center.
47.9%
55.9%
57.5%
58.6%
59.9%
60.4%
60.4%
60.4%
60.4%
61.2%
62.8%
0.0% 20.0% 40.0% 60.0% 80.0%
Grand Wayne Convention Center
Kalahari Hotel/Conference Center
SeaGate Convention Centre
Dayton Convention Center
Average (Excluding DCC)
John S. Knight Center
Northern Kentucky Convention Center
Sharonville Convention Center
Median (Excluding DCC)
Duke Energy Convention Center
Cleveland Convention Center
Greater Columbus Convention Center
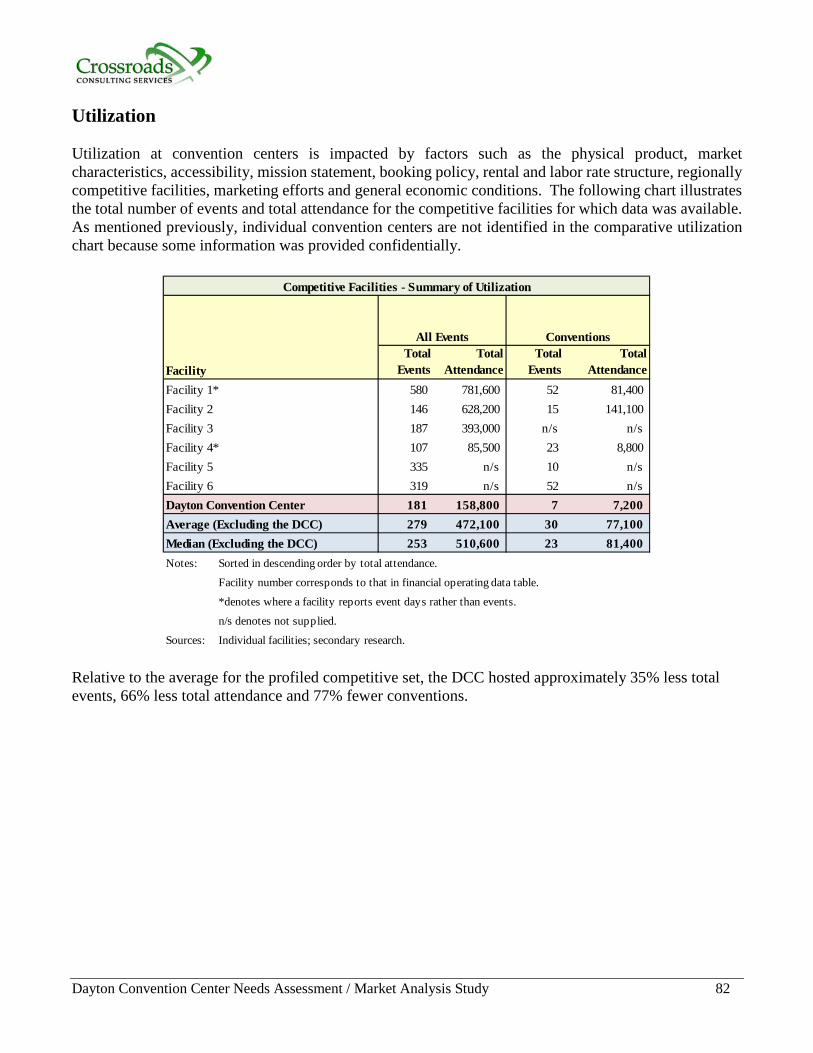
Dayton Convention Center Needs Assessment / Market Analysis Study 82
Utilization Utilization at convention centers is impacted by factors such as the physical product, market characteristics, accessibility, mission statement, booking policy, rental and labor rate structure, regionally competitive facilities, marketing efforts and general economic conditions. The following chart illustrates the total number of events and total attendance for the competitive facilities for which data was available. As mentioned previously, individual convention centers are not identified in the comparative utilization chart because some information was provided confidentially.
FacilityTotal
Events Total
AttendanceTotal
Events Total
AttendanceFacility 1* 580 781,600 52 81,400 Facility 2 146 628,200 15 141,100 Facility 3 187 393,000 n/s n/sFacility 4* 107 85,500 23 8,800 Facility 5 335 n/s 10 n/sFacility 6 319 n/s 52 n/sDayton Convention Center 181 158,800 7 7,200 Average (Excluding the DCC) 279 472,100 30 77,100 Median (Excluding the DCC) 253 510,600 23 81,400 Notes: Sorted in descending order by total attendance.
Facility number corresponds to that in financial operating data table.
*denotes where a facility reports event days rather than events.
n/s denotes not supplied.
Sources: Individual facilities; secondary research.
Competitive Facilities - Summary of Utilization
All Events Conventions
Relative to the average for the profiled competitive set, the DCC hosted approximately 35% less total events, 66% less total attendance and 77% fewer conventions.
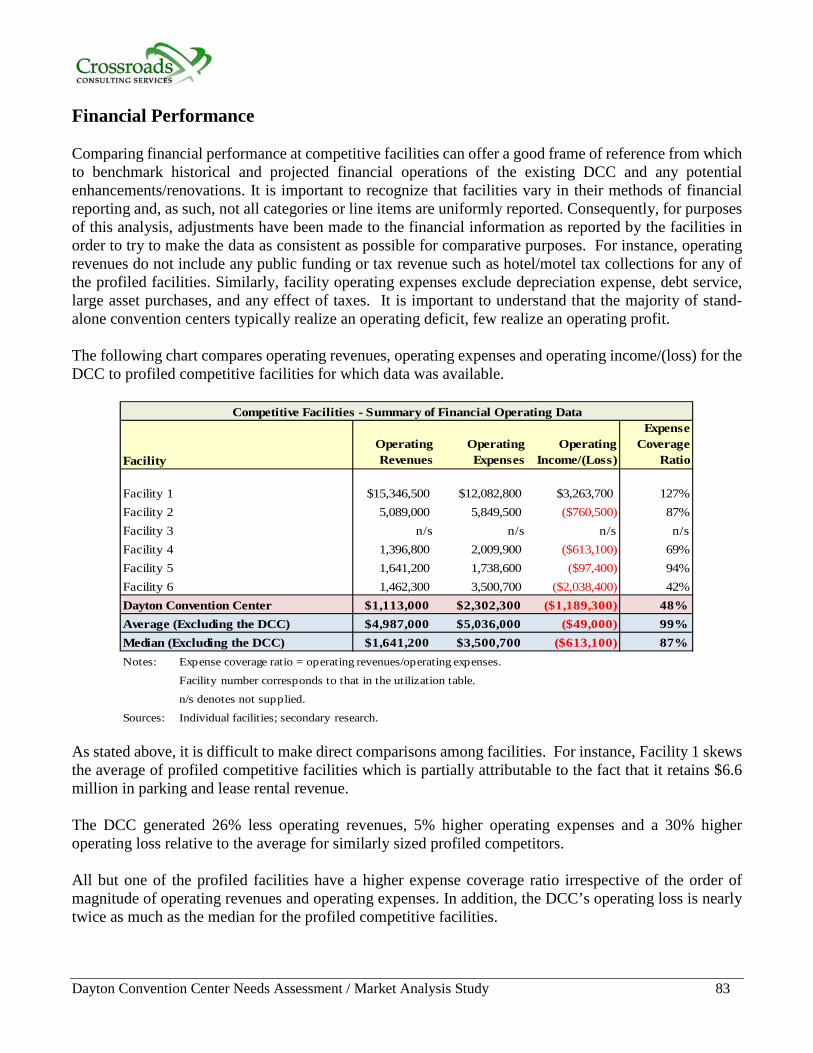
Dayton Convention Center Needs Assessment / Market Analysis Study 83
Financial Performance Comparing financial performance at competitive facilities can offer a good frame of reference from which to benchmark historical and projected financial operations of the existing DCC and any potential enhancements/renovations. It is important to recognize that facilities vary in their methods of financial reporting and, as such, not all categories or line items are uniformly reported. Consequently, for purposes of this analysis, adjustments have been made to the financial information as reported by the facilities in order to try to make the data as consistent as possible for comparative purposes. For instance, operating revenues do not include any public funding or tax revenue such as hotel/motel tax collections for any of the profiled facilities. Similarly, facility operating expenses exclude depreciation expense, debt service, large asset purchases, and any effect of taxes. It is important to understand that the majority of stand-alone convention centers typically realize an operating deficit, few realize an operating profit. The following chart compares operating revenues, operating expenses and operating income/(loss) for the DCC to profiled competitive facilities for which data was available.
FacilityOperating Revenues
Operating Expenses
Operating Income/(Loss)
Expense Coverage
Ratio
Facility 1 $15,346,500 $12,082,800 $3,263,700 127%Facility 2 5,089,000 5,849,500 ($760,500) 87%Facility 3 n/s n/s n/s n/sFacility 4 1,396,800 2,009,900 ($613,100) 69%Facility 5 1,641,200 1,738,600 ($97,400) 94%Facility 6 1,462,300 3,500,700 ($2,038,400) 42%Dayton Convention Center $1,113,000 $2,302,300 ($1,189,300) 48%Average (Excluding the DCC) $4,987,000 $5,036,000 ($49,000) 99%Median (Excluding the DCC) $1,641,200 $3,500,700 ($613,100) 87%Notes: Expense coverage ratio = operating revenues/operating expenses.
Facility number corresponds to that in the utilization table. n/s denotes not supplied.
Sources: Individual facilities; secondary research.
Competitive Facilities - Summary of Financial Operating Data
As stated above, it is difficult to make direct comparisons among facilities. For instance, Facility 1 skews the average of profiled competitive facilities which is partially attributable to the fact that it retains $6.6 million in parking and lease rental revenue. The DCC generated 26% less operating revenues, 5% higher operating expenses and a 30% higher operating loss relative to the average for similarly sized profiled competitors. All but one of the profiled facilities have a higher expense coverage ratio irrespective of the order of magnitude of operating revenues and operating expenses. In addition, the DCC’s operating loss is nearly twice as much as the median for the profiled competitive facilities.
Dayton Convention Center Needs Assessment / Market Analysis Study 84
Summary Six of the profiled facilities are owned by a municipality, two are owned by an authority/board and one is privately owned. Only the Sharonville Convention Center is operated by a municipality. The DCC’s competitive set includes three larger convention centers that compete for mid-size group business as well as a private resort hotel/conference center. The DCC is one of the oldest facilities among the profiled set. The DCC offers a competitive amount of total function space relative to the profiled set. Excluding the convention centers in Columbus, Cleveland and Cincinnati, the DCC offers a competitive amount of exhibition space relative to other profiled State/regional centers. However, the DCC’s ballroom and meeting space are 34% and 56% lower, respectively, than the average of profiled facilities. The DCC offers the lowest banquet capacity among profiled centers (excluding the SeaGate Convention Centre which does not have a ballroom). The DCC is the only facility that offers a theater which can be a competitive advantage for attracting some groups. Several competitive facilities have undergone expansion and the Columbus Convention Center is currently undergoing expansion/renovation. The DCC also competes with larger hotel properties that offer group business the ability to meet, eat, and sleep under one roof. Creating a more seamless contracting process for event planners will be important for the DCC to more effectively compete for convention/meeting business. Perceived safety of downtown Dayton was cited more frequently by area residents than from out-of-town attendees. The City of Dayton offers the second lowest total tax on hotel rooms among competitive destinations but fewer headquarter hotel rooms and hotel rooms within walking distance than the profiled set. In general, Dayton offers a competitive package to meeting planners/event producers in terms of accessibility, parking, and affordability. Several competitors offer more modern buildings and vibrant areas surrounding their centers and, as such, Dayton and the DCC will need to provide exceptional value and service to effectively compete for convention business. Improving the infrastructure surrounding the DCC will be critical for effectively competing with other State/regional destinations that are continually improving their facilities and visitor amenities. Relative to the average for the profiled competitive set, the DCC hosted approximately 35% less total events, 66% less total attendance and 77% fewer conventions. In addition, the DCC generated 26% less operating revenues, 5% higher operating expenses and a 30% higher operating loss relative to the average for similarly sized profiled competitors. These metrics and other related market research suggest that there is potential for the DCC to improve its usage and financial performance by improving its physical product and refining various operating strategies. However, it will be necessary to increase the number of convention quality hotel rooms in downtown Dayton and, ideally, within walking distance of the DCC. The next section of the report summarizes the needs assessment.

Dayton Convention Center Needs Assessment / Market Analysis Study 85
Table of Contents
1 Introduction and Executive Summary 1 2 General Market Overview 11 3 Key Industry Trends 20 4 Historical Facility Operations 27 5 General Management Practices Assessment 47 6 Physical Facility Assessment 57 7 Competitive Facility Assessment 71 8 Needs Assessment 85 9 Economic Analysis 94
10 Funding Analysis 113
11 Limiting Conditions and Assumptions 120
12 Appendix 122
Dayton Convention Center Needs Assessment / Market Analysis Study 86
Needs Assessment
Regardless of the operating business model chosen, the following common factors enhance the success of convention centers. Although some of these factors are external and outside the control of DCC ownership/management, others can be positively impacted by internal changes. • The ownership/operating structure allows for the ability to foster financial support from a variety of
public and private parties.
• The mission statement outlines distinct goals/objectives of the facility.
• The mission statement and objectives of the facility are understood and supported by elected officials, business community, local residents, local user groups, and event promoters.
• The booking policy prioritizes market segments supporting the mission statement.
• There is a full-time, dedicated staff of experienced professionals that manage and market the facility as well as understand the unique needs of users.
• The management team has strong relationships with State, regional and national personnel representing target market industries.
• Management has latitude in staffing, compensation, and contract negotiation with user groups.
• Strategic partnerships are formed with local area marketing agencies, and key private sector sponsors.
• Key performance indicators are implemented based on facility benchmarks and industry best practices.
• The operator is a financially sustainable entity that has a vested interest in the facility’s success through an initial capital contribution and/or an ongoing financial commitment and associated risk with respect to operations and capital improvements.
• There is sufficient strategic and financial oversight in addition to a clear reporting and accountability structure.
• Maintaining high-quality event space and supporting infrastructure at the facility is an operating priority.
The previous sections discussed various supply and demand factors that may influence the type of future physical, operating, and/or destination changes that would place the DCC in a better long-term strategic position. The market in which the DCC operates contributes to the facility’s marketability to conventions and sports competitions that draw overnight visitors as well as events that are primarily attended by local residents. Factors such as demographic/economic conditions, the vibrancy of the area immediately surrounding the center, and overall destination appeal to both event planners and attendees can all impact a convention center’s overall competitiveness within the broader marketplace.
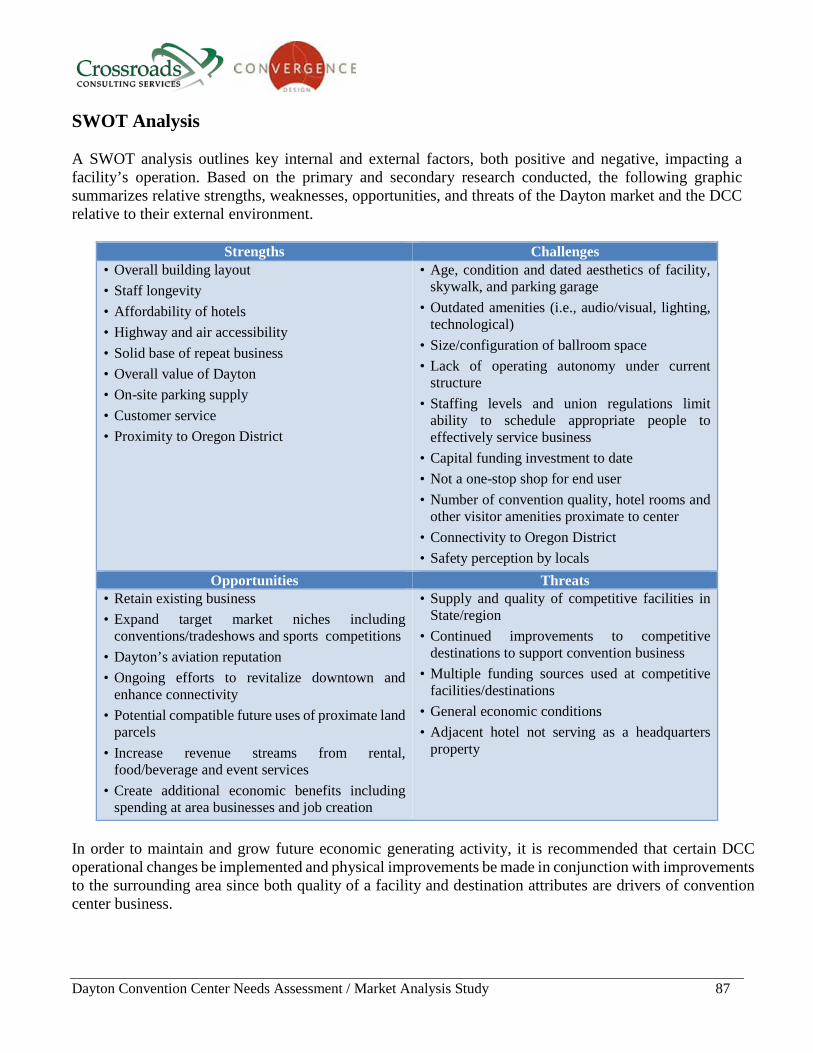
Dayton Convention Center Needs Assessment / Market Analysis Study 87
SWOT Analysis A SWOT analysis outlines key internal and external factors, both positive and negative, impacting a facility’s operation. Based on the primary and secondary research conducted, the following graphic summarizes relative strengths, weaknesses, opportunities, and threats of the Dayton market and the DCC relative to their external environment.
Strengths Challenges • Overall building layout • Staff longevity • Affordability of hotels • Highway and air accessibility • Solid base of repeat business • Overall value of Dayton • On-site parking supply • Customer service • Proximity to Oregon District
• Age, condition and dated aesthetics of facility, skywalk, and parking garage
• Outdated amenities (i.e., audio/visual, lighting, technological)
• Size/configuration of ballroom space • Lack of operating autonomy under current
structure • Staffing levels and union regulations limit
ability to schedule appropriate people to effectively service business
• Capital funding investment to date • Not a one-stop shop for end user • Number of convention quality, hotel rooms and
other visitor amenities proximate to center • Connectivity to Oregon District • Safety perception by locals
Opportunities Threats • Retain existing business • Expand target market niches including
conventions/tradeshows and sports competitions • Dayton’s aviation reputation • Ongoing efforts to revitalize downtown and
enhance connectivity • Potential compatible future uses of proximate land
parcels • Increase revenue streams from rental,
food/beverage and event services • Create additional economic benefits including
spending at area businesses and job creation
• Supply and quality of competitive facilities in State/region
• Continued improvements to competitive destinations to support convention business
• Multiple funding sources used at competitive facilities/destinations
• General economic conditions • Adjacent hotel not serving as a headquarters
property
In order to maintain and grow future economic generating activity, it is recommended that certain DCC operational changes be implemented and physical improvements be made in conjunction with improvements to the surrounding area since both quality of a facility and destination attributes are drivers of convention center business.
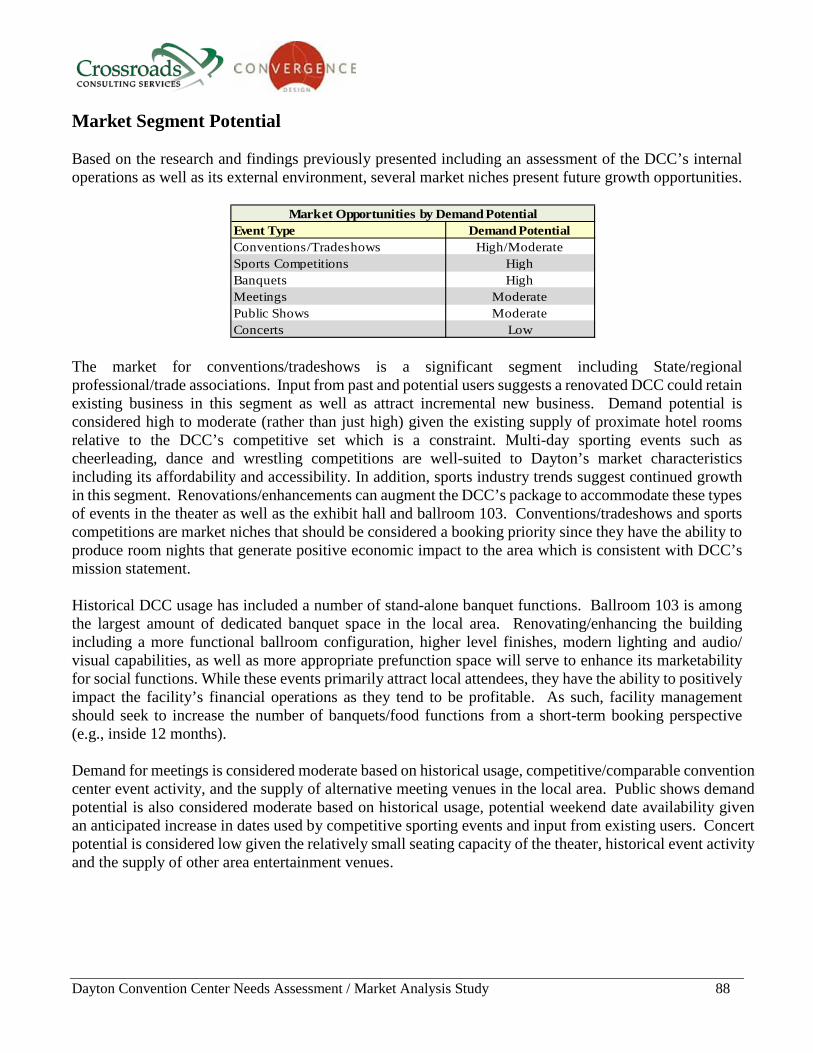
Dayton Convention Center Needs Assessment / Market Analysis Study 88
Market Segment Potential Based on the research and findings previously presented including an assessment of the DCC’s internal operations as well as its external environment, several market niches present future growth opportunities.
Event Type Demand Potential Conventions/Tradeshows High/ModerateSports Competitions HighBanquets HighMeetings Moderate Public Shows Moderate Concerts Low
Market Opportunities by Demand Potential
The market for conventions/tradeshows is a significant segment including State/regional professional/trade associations. Input from past and potential users suggests a renovated DCC could retain existing business in this segment as well as attract incremental new business. Demand potential is considered high to moderate (rather than just high) given the existing supply of proximate hotel rooms relative to the DCC’s competitive set which is a constraint. Multi-day sporting events such as cheerleading, dance and wrestling competitions are well-suited to Dayton’s market characteristics including its affordability and accessibility. In addition, sports industry trends suggest continued growth in this segment. Renovations/enhancements can augment the DCC’s package to accommodate these types of events in the theater as well as the exhibit hall and ballroom 103. Conventions/tradeshows and sports competitions are market niches that should be considered a booking priority since they have the ability to produce room nights that generate positive economic impact to the area which is consistent with DCC’s mission statement. Historical DCC usage has included a number of stand-alone banquet functions. Ballroom 103 is among the largest amount of dedicated banquet space in the local area. Renovating/enhancing the building including a more functional ballroom configuration, higher level finishes, modern lighting and audio/ visual capabilities, as well as more appropriate prefunction space will serve to enhance its marketability for social functions. While these events primarily attract local attendees, they have the ability to positively impact the facility’s financial operations as they tend to be profitable. As such, facility management should seek to increase the number of banquets/food functions from a short-term booking perspective (e.g., inside 12 months). Demand for meetings is considered moderate based on historical usage, competitive/comparable convention center event activity, and the supply of alternative meeting venues in the local area. Public shows demand potential is also considered moderate based on historical usage, potential weekend date availability given an anticipated increase in dates used by competitive sporting events and input from existing users. Concert potential is considered low given the relatively small seating capacity of the theater, historical event activity and the supply of other area entertainment venues.
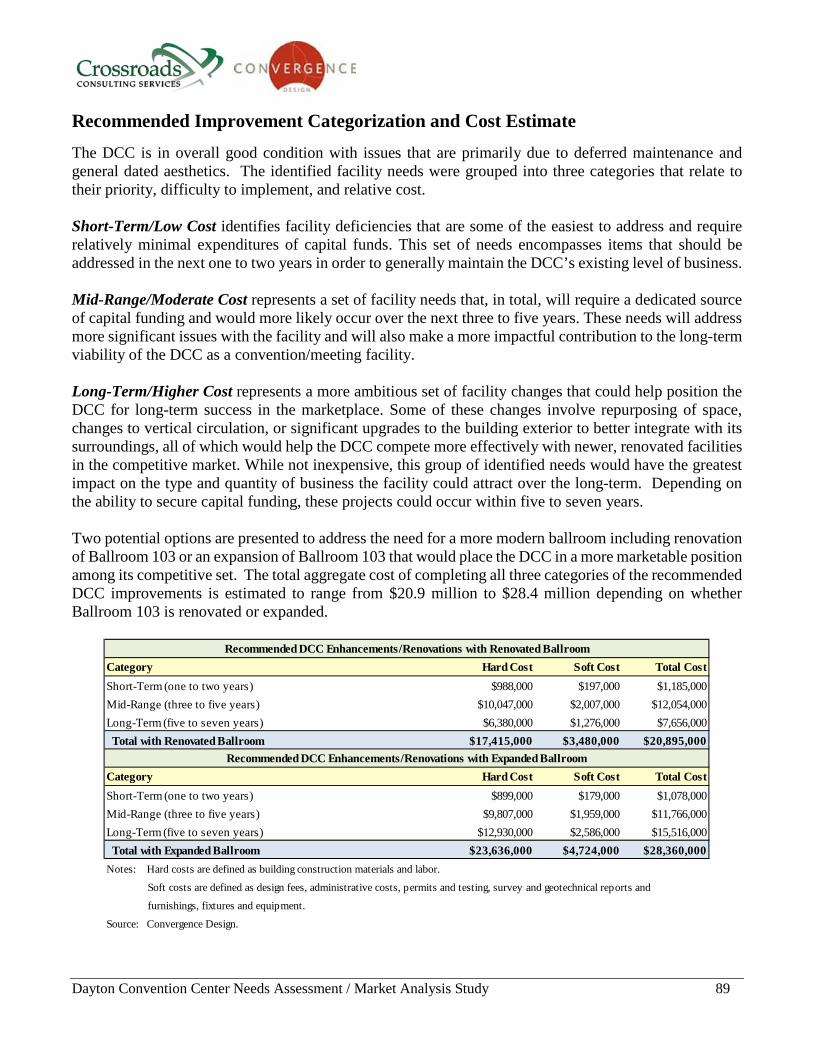
Dayton Convention Center Needs Assessment / Market Analysis Study 89
Recommended Improvement Categorization and Cost Estimate The DCC is in overall good condition with issues that are primarily due to deferred maintenance and general dated aesthetics. The identified facility needs were grouped into three categories that relate to their priority, difficulty to implement, and relative cost. Short-Term/Low Cost identifies facility deficiencies that are some of the easiest to address and require relatively minimal expenditures of capital funds. This set of needs encompasses items that should be addressed in the next one to two years in order to generally maintain the DCC’s existing level of business. Mid-Range/Moderate Cost represents a set of facility needs that, in total, will require a dedicated source of capital funding and would more likely occur over the next three to five years. These needs will address more significant issues with the facility and will also make a more impactful contribution to the long-term viability of the DCC as a convention/meeting facility. Long-Term/Higher Cost represents a more ambitious set of facility changes that could help position the DCC for long-term success in the marketplace. Some of these changes involve repurposing of space, changes to vertical circulation, or significant upgrades to the building exterior to better integrate with its surroundings, all of which would help the DCC compete more effectively with newer, renovated facilities in the competitive market. While not inexpensive, this group of identified needs would have the greatest impact on the type and quantity of business the facility could attract over the long-term. Depending on the ability to secure capital funding, these projects could occur within five to seven years. Two potential options are presented to address the need for a more modern ballroom including renovation of Ballroom 103 or an expansion of Ballroom 103 that would place the DCC in a more marketable position among its competitive set. The total aggregate cost of completing all three categories of the recommended DCC improvements is estimated to range from $20.9 million to $28.4 million depending on whether Ballroom 103 is renovated or expanded.
Category Hard Cost Soft Cost Total CostShort-Term (one to two years) $988,000 $197,000 $1,185,000Mid-Range (three to five years) $10,047,000 $2,007,000 $12,054,000Long-Term (five to seven years) $6,380,000 $1,276,000 $7,656,000 Total with Renovated Ballroom $17,415,000 $3,480,000 $20,895,000
Category Hard Cost Soft Cost Total CostShort-Term (one to two years) $899,000 $179,000 $1,078,000Mid-Range (three to five years) $9,807,000 $1,959,000 $11,766,000Long-Term (five to seven years) $12,930,000 $2,586,000 $15,516,000 Total with Expanded Ballroom $23,636,000 $4,724,000 $28,360,000Notes: Hard costs are defined as building construction materials and labor.
Soft costs are defined as design fees, administrative costs, permits and testing, survey and geotechnical reports and
furnishings, fixtures and equipment.
Source: Convergence Design.
Recommended DCC Enhancements/Renovations with Renovated Ballroom
Recommended DCC Enhancements/Renovations with Expanded Ballroom
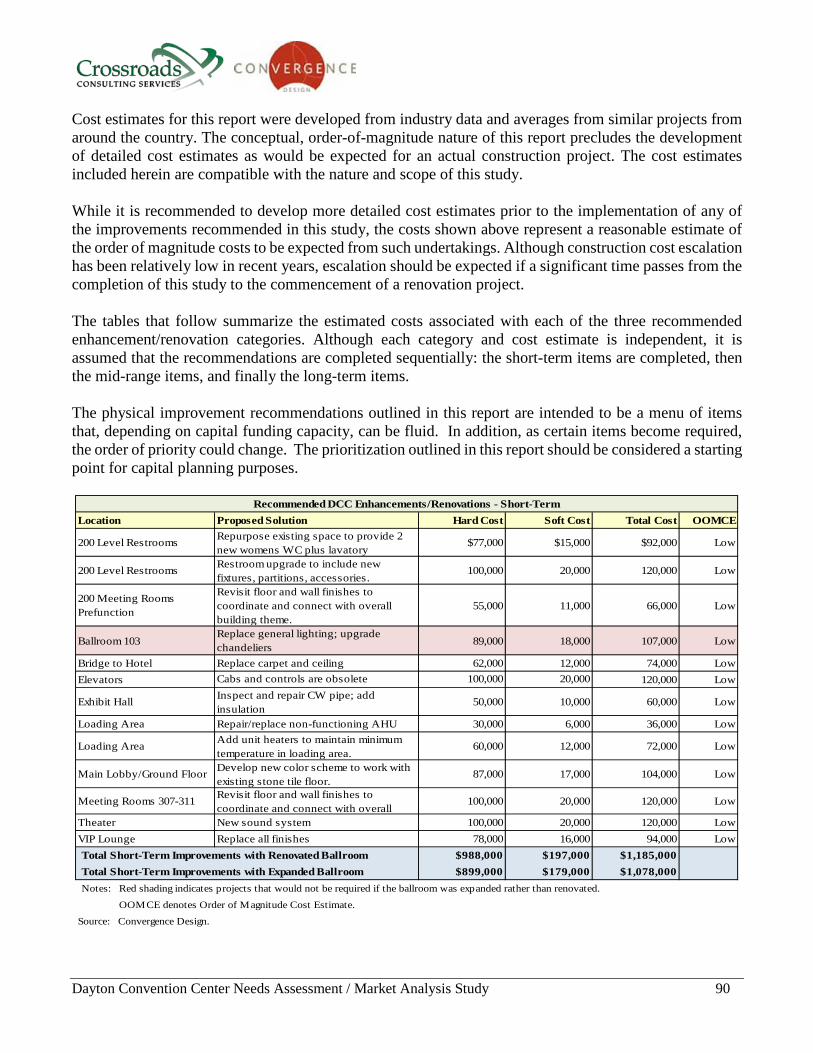
Dayton Convention Center Needs Assessment / Market Analysis Study 90
Cost estimates for this report were developed from industry data and averages from similar projects from around the country. The conceptual, order-of-magnitude nature of this report precludes the development of detailed cost estimates as would be expected for an actual construction project. The cost estimates included herein are compatible with the nature and scope of this study. While it is recommended to develop more detailed cost estimates prior to the implementation of any of the improvements recommended in this study, the costs shown above represent a reasonable estimate of the order of magnitude costs to be expected from such undertakings. Although construction cost escalation has been relatively low in recent years, escalation should be expected if a significant time passes from the completion of this study to the commencement of a renovation project. The tables that follow summarize the estimated costs associated with each of the three recommended enhancement/renovation categories. Although each category and cost estimate is independent, it is assumed that the recommendations are completed sequentially: the short-term items are completed, then the mid-range items, and finally the long-term items. The physical improvement recommendations outlined in this report are intended to be a menu of items that, depending on capital funding capacity, can be fluid. In addition, as certain items become required, the order of priority could change. The prioritization outlined in this report should be considered a starting point for capital planning purposes.
Location Proposed Solution Hard Cost Soft Cost Total Cost OOMCE
200 Level Restrooms Repurpose existing space to provide 2 new womens WC plus lavatory
$77,000 $15,000 $92,000 Low
200 Level Restrooms Restroom upgrade to include new fixtures, partitions, accessories.
100,000 20,000 120,000 Low
200 Meeting Rooms Prefunction
Revisit floor and wall finishes to coordinate and connect with overall building theme.
55,000 11,000 66,000 Low
Ballroom 103Replace general lighting; upgrade chandeliers 89,000 18,000 107,000 Low
Bridge to Hotel Replace carpet and ceiling 62,000 12,000 74,000 LowElevators Cabs and controls are obsolete 100,000 20,000 120,000 Low
Exhibit Hall Inspect and repair CW pipe; add insulation
50,000 10,000 60,000 Low
Loading Area Repair/replace non-functioning AHU 30,000 6,000 36,000 Low
Loading Area Add unit heaters to maintain minimum temperature in loading area.
60,000 12,000 72,000 Low
Main Lobby/Ground Floor Develop new color scheme to work with existing stone tile floor.
87,000 17,000 104,000 Low
Meeting Rooms 307-311 Revisit floor and wall finishes to coordinate and connect with overall
100,000 20,000 120,000 Low
Theater New sound system 100,000 20,000 120,000 LowVIP Lounge Replace all finishes 78,000 16,000 94,000 LowTotal Short-Term Improvements with Renovated Ballroom $988,000 $197,000 $1,185,000Total Short-Term Improvements with Expanded Ballroom $899,000 $179,000 $1,078,000Notes: Red shading indicates projects that would not be required if the ballroom was expanded rather than renovated.
OOMCE denotes Order of Magnitude Cost Estimate.
Source: Convergence Design.
Recommended DCC Enhancements/Renovations - Short-Term

Dayton Convention Center Needs Assessment / Market Analysis Study 91
Location Proposed Solution Cost Soft Cost Total Cost OOMCE
100 Level Restrooms Restroom upgrade to include new fixtures, partitions, accessories.
$258,000 $51,600 $309,600 Moderate
100 Level Restrooms Repurpose existing space to add 18 women’s WC plus required lavatories.
656,000 131,000 787,000 Moderate
300 Level Restrooms Restroom upgrade to include new fixtures, partitions, accessories.
167,000 33,000 200,000 Moderate
300 Level RestroomsRepurpose existing space to provide 12 additional women’s WC plus lavatories; 3 men’s WC/urinal plus lavatory.
547,000 109,000 656,000 Moderate
300 Meeting Rooms Prefunction
Revisit floor and wall finishes to coordinate and connect with overall building theme.
307,000 61,000 368,000 Moderate
Ballroom 103 PrefunctionRenovate as dedicated ballroom prefunction space 240,000 48,000 288,000 Moderate
Ballroom 106 Coordinate new finishes with approach to Ballroom 103
229,000 46,000 275,000 Moderate
Ballroom 106 Prefunction Renovate as dedicated ballroom prefunction space
240,000 48,000 288,000 Moderate
Bridge to Transportation Center
Renovate garage connection to bridge to create an arrival experience
536,000 107,000 643,000 Moderate
East & West Façade Add glazing at appropriate locations on east and west facades
345,000 69,000 414,000 Moderate
Elevators Add third passenger elevator where shown on 1986 building plans.
250,000 50,000 300,000 Moderate
Façade: General Add ceramic tile below red line per original design.
176,000 35,000 211,000 Moderate
Façade: General Recoat with high-performance coating system or replace with new.
197,000 39,000 236,000 Moderate
LED Message Board Replace LED board with larger, higher resolution display
336,000 67,000 403,000 Moderate
Main Lobby/Ground Floor New wayfinding graphics. 125,000 25,000 150,000 Moderate
Main Lobby/Ground Floor Remove 4 columns; replace with new beam at roof
240,000 48,000 288,000 Moderate
Meeting Rooms 202-208Revisit floor and wall finishes to coordinate and connect with overall building theme.
147,000 29,000 176,000 Moderate
Meeting Rooms 302-306Revisit floor and wall finishes to coordinate and connect with overall building theme.
214,000 43,000 257,000 Moderate
Public SidewalksAdd pavers, tree grates and decorative pedestrian lighting on 5th, Main and Jefferson frontages
524,000 105,000 629,000 Moderate
Roof Replace roofing on northern segments with TPO membrane
571,000 114,000 685,000 Moderate
Skylight Replace skylight 109,000 22,000 131,000 Moderate
TechnologyContinue to invest in Wi-Fi capability, fiber optic infrastructure to meet growing bandwidth demands.
250,000 50,000 300,000 Moderate
Telescoping Seating
Replace with new telescoping seating system. Carefully evaluate total seating need for facility to reduce storage required
2,040,000 408,000 2,448,000 High
Theater New freight elevator[?] 350,000 70,000 420,000 ModerateTheater New dimmer system/lighting 350,000 70,000 420,000 Moderate
Theater Dressing RoomsRepurpose as locker rooms for sports events; still usable as dressing rooms when needed
291,000 58,000 349,000 Moderate
Third Floor BalconyCreate dedicated theater lobby/ticketed environment with restrooms, concession 352,000 70,000 422,000 Moderate
Total Mid-Range Improvements with Renovated Ballroom $10,047,000 $2,007,000 $12,054,000Total Mid-Range Improvements with Expanded Ballroom $9,807,000 $1,959,000 $11,766,000Notes: Red shading indicates projects that would not be required if the ballroom was expanded rather than renovated.
OOMCE denotes Order of Magnitude Cost Estimate.Source: Convergence Design.
Recommended DCC Enhancements/Renovations - Mid-Range
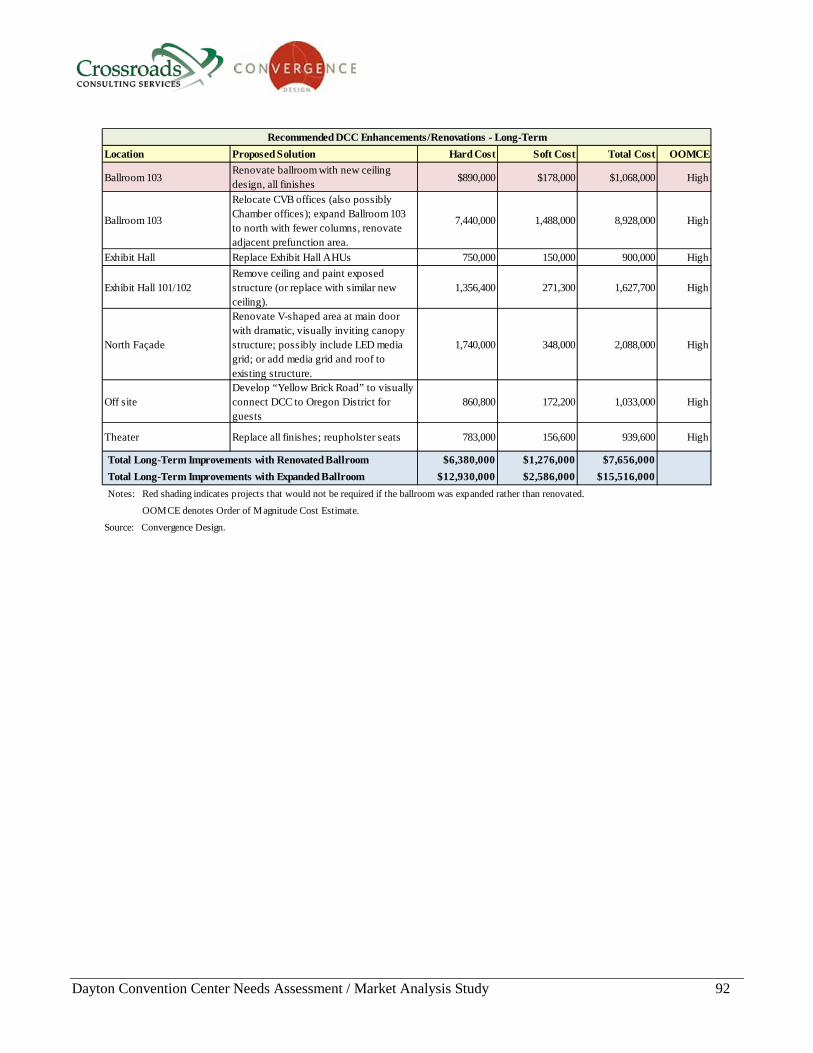
Dayton Convention Center Needs Assessment / Market Analysis Study 92
Location Proposed Solution Hard Cost Soft Cost Total Cost OOMCE
Ballroom 103Renovate ballroom with new ceiling design, all finishes $890,000 $178,000 $1,068,000 High
Ballroom 103
Relocate CVB offices (also possibly Chamber offices); expand Ballroom 103 to north with fewer columns, renovate adjacent prefunction area.
7,440,000 1,488,000 8,928,000 High
Exhibit Hall Replace Exhibit Hall AHUs 750,000 150,000 900,000 High
Exhibit Hall 101/102Remove ceiling and paint exposed structure (or replace with similar new ceiling).
1,356,400 271,300 1,627,700 High
North Façade
Renovate V-shaped area at main door with dramatic, visually inviting canopy structure; possibly include LED media grid; or add media grid and roof to existing structure.
1,740,000 348,000 2,088,000 High
Off siteDevelop “Yellow Brick Road” to visually connect DCC to Oregon District for guests
860,800 172,200 1,033,000 High
Theater Replace all finishes; reupholster seats 783,000 156,600 939,600 High
Total Long-Term Improvements with Renovated Ballroom $6,380,000 $1,276,000 $7,656,000Total Long-Term Improvements with Expanded Ballroom $12,930,000 $2,586,000 $15,516,000Notes: Red shading indicates projects that would not be required if the ballroom was expanded rather than renovated.
OOMCE denotes Order of Magnitude Cost Estimate.
Source: Convergence Design.
Recommended DCC Enhancements/Renovations - Long-Term
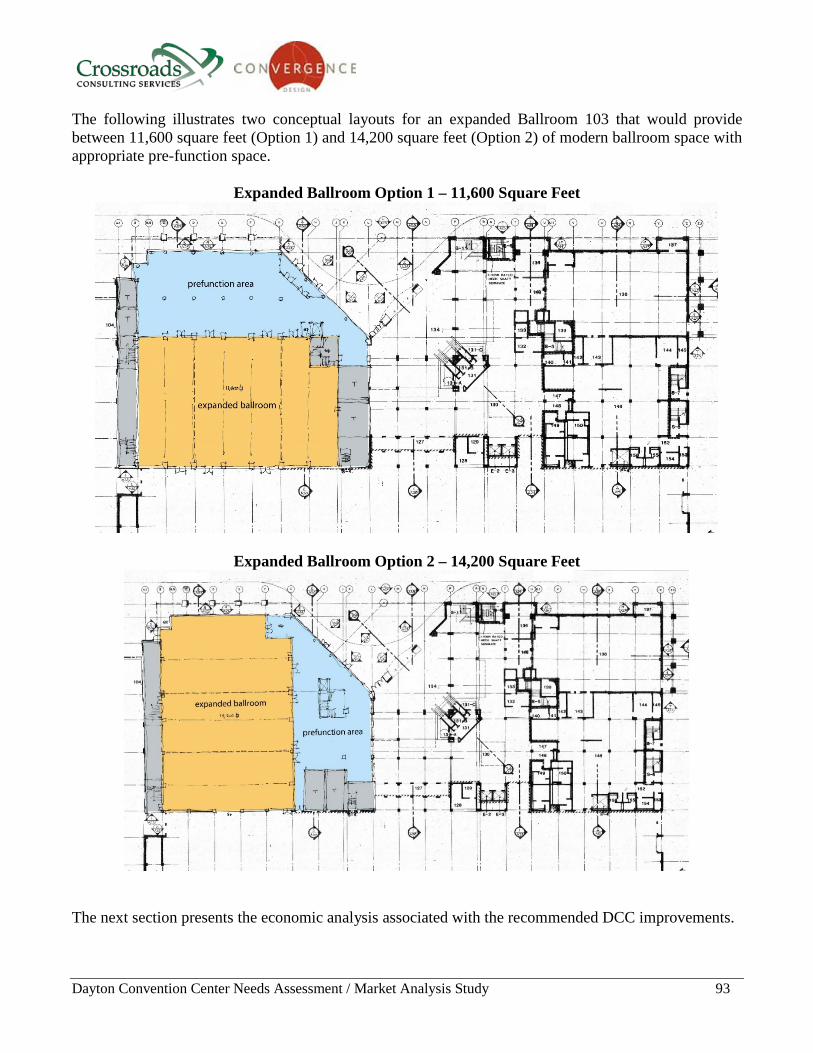
Dayton Convention Center Needs Assessment / Market Analysis Study 93
The following illustrates two conceptual layouts for an expanded Ballroom 103 that would provide between 11,600 square feet (Option 1) and 14,200 square feet (Option 2) of modern ballroom space with appropriate pre-function space.
Expanded Ballroom Option 1 – 11,600 Square Feet
Expanded Ballroom Option 2 – 14,200 Square Feet
The next section presents the economic analysis associated with the recommended DCC improvements.
Dayton Convention Center Needs Assessment / Market Analysis Study 94
Table of Contents
1 Introduction and Executive Summary 1 2 General Market Overview 11 3 Key Industry Trends 20 4 Historical Facility Operations 27 5 General Management Practices Assessment 47 6 Physical Facility Assessment 57 7 Competitive Facility Assessment 71 8 Needs Assessment 85 9 Economic Analysis 94
10 Funding Analysis 113
11 Limiting Conditions and Assumptions 120
12 Appendix 122

Dayton Convention Center Needs Assessment / Market Analysis Study 95
Economic Analysis A convention center’s physical state relative to that of its competitive supply has an impact on its marketability, resulting financial performance and return on investment. This section provides a comparison of DCC event activity, financial operations and economic/fiscal impacts under a status quo scenario and an estimate for two improvement options assuming DCC renovations/enhancements and operational changes outlined in the needs assessment are made. The status quo scenario assumes that no major capital improvements are made to the DCC and that the facility continues to be operated as a division within the City of Dayton’s Recreation and Youth Services Department. Given its age and condition, this will likely result in an increasing repairs and maintenance budget. Renovation Option 1 assumes that all the recommended operational and physical improvements are made and that Ballroom 103 is renovated rather than expanded. Renovation Option 2 assumes all recommended operational and physical improvements are made and that Ballroom 103 is expanded. In addition, Renovation Option 2 assumes that additional proximate, convention quality hotels are developed that can service larger conventions. With respect to financial performance, it is important to understand that one reason facilities are initially developed and ultimately enhanced is because of the economic activity that they can generate in terms of spending, employment, earnings and tax revenues to local and state governments. Convention centers can attract events that draw patrons from outside of the immediate market area who spend money on hotels, restaurants and other related services. In many instances, these net new benefits can outweigh any potential operating costs. Consequently, when evaluating the merits of renovation/enhancement projects, it is important to consider all aspects of the costs and benefits including operating requirements, renovation/construction/project costs and economic/fiscal benefits. Crossroads Consulting developed a hypothetical, order-of-magnitude estimate of the impact to operating revenues and operating expenses before taxes, depreciation and debt service for the recommended DCC renovations/enhancements for a stabilized year of operations. The financial estimate and related assumptions are based on information from primary and secondary sources including, but not limited to, general market attributes, industry trends, historical DCC operations and the FY 2015 budget, input from existing/potential users and area stakeholders as well as data on competitive/comparable facilities. This analysis is also based on certain hypothetical assumptions pertaining to operations of the DCC, attendance levels and other related financial assumptions provided by and agreed to by DCC management. The accompanying analysis was prepared for internal use by the City of Dayton for its planning efforts related to future operations of the DCC and should not be used or relied upon for any other purpose including financing of the project.
Dayton Convention Center Needs Assessment / Market Analysis Study 96
The analysis performed was limited in nature and, as such, Crossroads Consulting does not express an opinion or any other form of assurance on the information presented in this report. As with all estimates of this type, we cannot guarantee the results nor is any warranty intended that they can be achieved. The estimates of operating revenues and operating expenses are based on the anticipated size, quality and efficiency of the renovated/enhanced facility. Since these estimates and assumptions are based on circumstances that have not yet transpired, they are subject to variation. Further, there will usually be differences between estimated and actual results because events and circumstances frequently do not occur as expected, and those differences may be material. General Assumptions General assumptions used in this analysis include, but are not limited to, the following: • All of the recommended physical renovations/enhancements and operational changes outlined
earlier. • The facility is operated privately by a professional management company, the Dayton CVB, or
another entity with operating autonomy. • The facility is aggressively marketed by facility management and established tourism agencies
including the Dayton CVB. • The Dayton Grand Hotel is fully functional under both renovation options. • New proximate convention quality hotels are developed under Renovation Option 2. • A high level of quality customer service is maintained. • No other similar, competitive facilities are built in the region. • Amounts are presented in current dollars and reflect a stabilized year of operations. Impact to Usage/Event Activity The financial and economic/fiscal impact analyses are based on several factors including an estimate of utilization for the recommended renovations/enhancements that was developed from the research previously referenced. Many of the events will likely occur over multiple days and include event days (when an event occurs at the facility) as well as move-in/move-out days. Likewise, attendees often attend each event day. An attendee day is defined as total attendance multiplied by the event length. For example, a three-day convention with 200 attendees equates to 600 attendee days which reflects that the same attendees return to the event each of the three days. Subsequent to renovation, event activity typically experiences a “ramp up” period to a stabilized level of activity which occurs for several reasons. For instance, some groups that book their event years in advance may not want to risk that a facility’s construction is delayed and not completed in time for their event. In addition, some groups may choose to let management “fine tune” its operations before hosting an event at a renovated/enhanced facility. However, it is important to recognize that the overall utilization at any
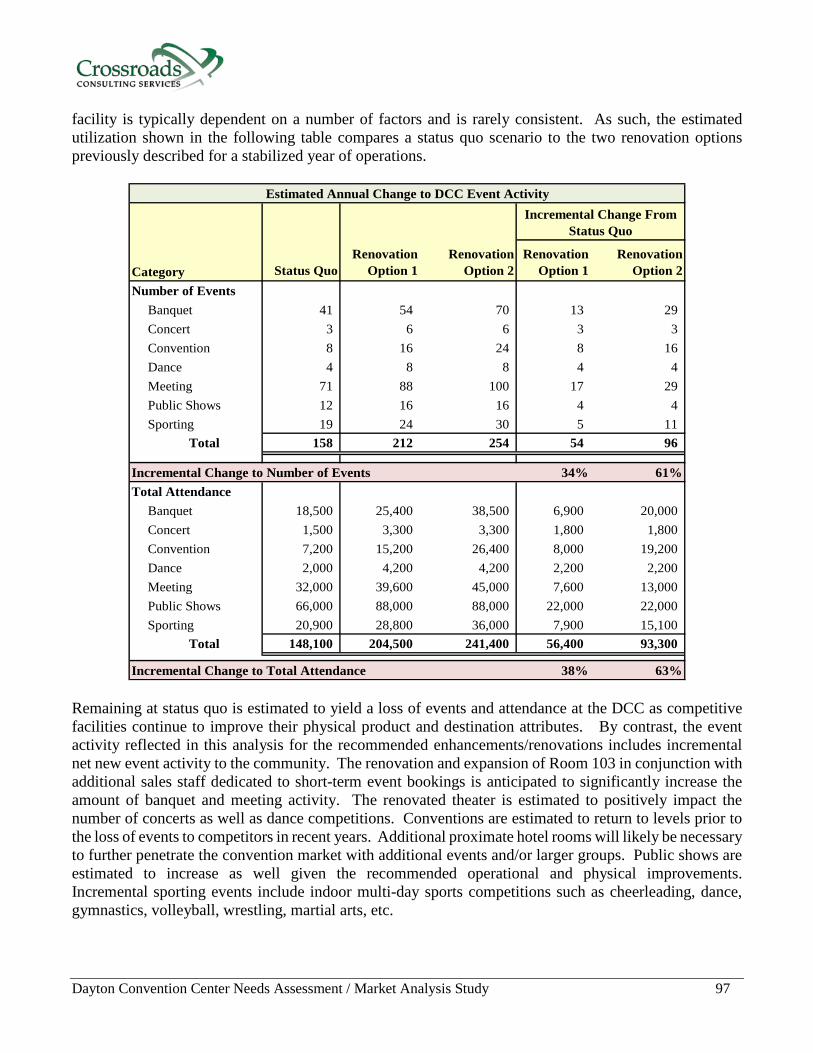
Dayton Convention Center Needs Assessment / Market Analysis Study 97
facility is typically dependent on a number of factors and is rarely consistent. As such, the estimated utilization shown in the following table compares a status quo scenario to the two renovation options previously described for a stabilized year of operations.
Category Status QuoRenovation
Option 1Renovation
Option 2Renovation
Option 1Renovation
Option 2Number of Events
Banquet 41 54 70 13 29Concert 3 6 6 3 3Convention 8 16 24 8 16Dance 4 8 8 4 4Meeting 71 88 100 17 29Public Shows 12 16 16 4 4Sporting 19 24 30 5 11
Total 158 212 254 54 96
Incremental Change to Number of Events 34% 61%Total Attendance
Banquet 18,500 25,400 38,500 6,900 20,000Concert 1,500 3,300 3,300 1,800 1,800Convention 7,200 15,200 26,400 8,000 19,200Dance 2,000 4,200 4,200 2,200 2,200Meeting 32,000 39,600 45,000 7,600 13,000Public Shows 66,000 88,000 88,000 22,000 22,000Sporting 20,900 28,800 36,000 7,900 15,100
Total 148,100 204,500 241,400 56,400 93,300
Incremental Change to Total Attendance 38% 63%
Estimated Annual Change to DCC Event ActivityIncremental Change From
Status Quo
Remaining at status quo is estimated to yield a loss of events and attendance at the DCC as competitive facilities continue to improve their physical product and destination attributes. By contrast, the event activity reflected in this analysis for the recommended enhancements/renovations includes incremental net new event activity to the community. The renovation and expansion of Room 103 in conjunction with additional sales staff dedicated to short-term event bookings is anticipated to significantly increase the amount of banquet and meeting activity. The renovated theater is estimated to positively impact the number of concerts as well as dance competitions. Conventions are estimated to return to levels prior to the loss of events to competitors in recent years. Additional proximate hotel rooms will likely be necessary to further penetrate the convention market with additional events and/or larger groups. Public shows are estimated to increase as well given the recommended operational and physical improvements. Incremental sporting events include indoor multi-day sports competitions such as cheerleading, dance, gymnastics, volleyball, wrestling, martial arts, etc.
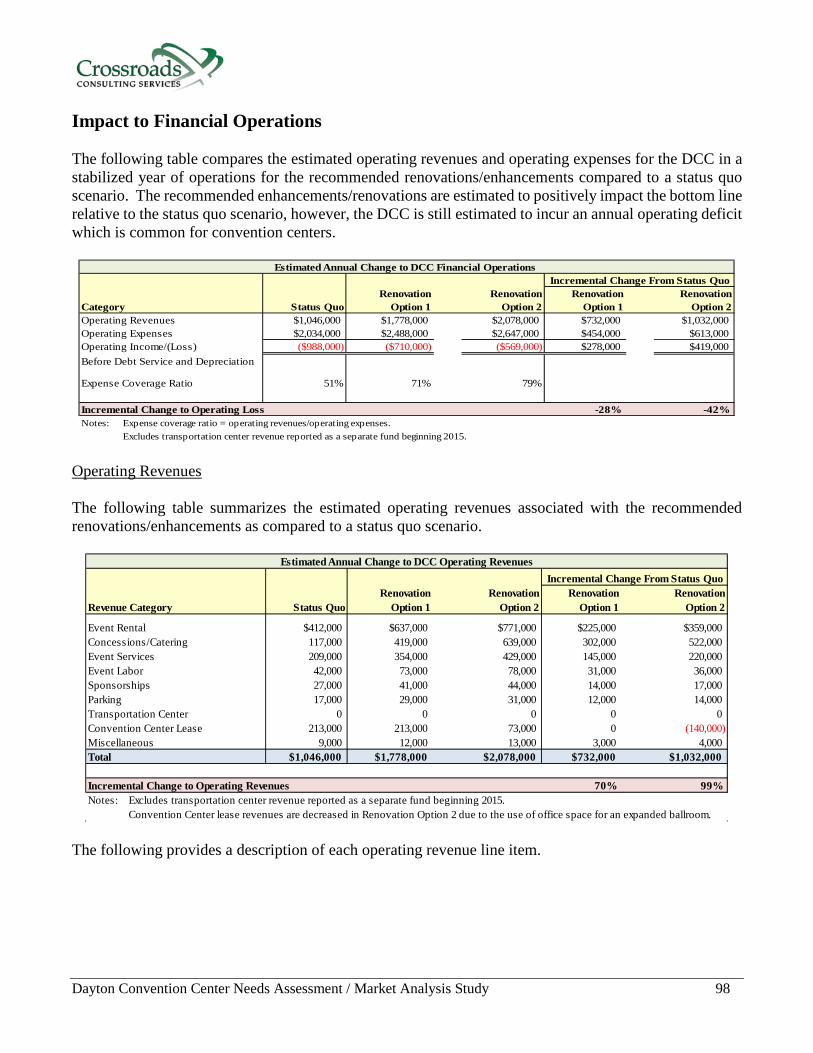
Dayton Convention Center Needs Assessment / Market Analysis Study 98
Impact to Financial Operations The following table compares the estimated operating revenues and operating expenses for the DCC in a stabilized year of operations for the recommended renovations/enhancements compared to a status quo scenario. The recommended enhancements/renovations are estimated to positively impact the bottom line relative to the status quo scenario, however, the DCC is still estimated to incur an annual operating deficit which is common for convention centers.
Category Status Quo Renovation
Option 1Renovation
Option 2Renovation
Option 1Renovation
Option 2Operating Revenues $1,046,000 $1,778,000 $2,078,000 $732,000 $1,032,000Operating Expenses $2,034,000 $2,488,000 $2,647,000 $454,000 $613,000Operating Income/(Loss) ($988,000) ($710,000) ($569,000) $278,000 $419,000Before Debt Service and Depreciation
Expense Coverage Ratio 51% 71% 79%
Incremental Change to Operating Loss -28% -42%Notes: Expense coverage ratio = operating revenues/operating expenses.
Excludes transportation center revenue reported as a separate fund beginning 2015.
Estimated Annual Change to DCC Financial Operations Incremental Change From Status Quo
Operating Revenues The following table summarizes the estimated operating revenues associated with the recommended renovations/enhancements as compared to a status quo scenario.
Revenue Category Status Quo Renovation
Option 1Renovation
Option 2Renovation
Option 1Renovation
Option 2
Event Rental $412,000 $637,000 $771,000 $225,000 $359,000Concessions/Catering 117,000 419,000 639,000 302,000 522,000Event Services 209,000 354,000 429,000 145,000 220,000Event Labor 42,000 73,000 78,000 31,000 36,000Sponsorships 27,000 41,000 44,000 14,000 17,000Parking 17,000 29,000 31,000 12,000 14,000Transportation Center 0 0 0 0 0Convention Center Lease 213,000 213,000 73,000 0 (140,000)Miscellaneous 9,000 12,000 13,000 3,000 4,000Total $1,046,000 $1,778,000 $2,078,000 $732,000 $1,032,000
Incremental Change to Operating Revenues 70% 99%Notes: Excludes transportation center revenue reported as a separate fund beginning 2015.
Convention Center lease revenues are decreased in Renovation Option 2 due to the use of office space for an expanded ballroom.
Estimated Annual Change to DCC Operating RevenuesIncremental Change From Status Quo
The following provides a description of each operating revenue line item.
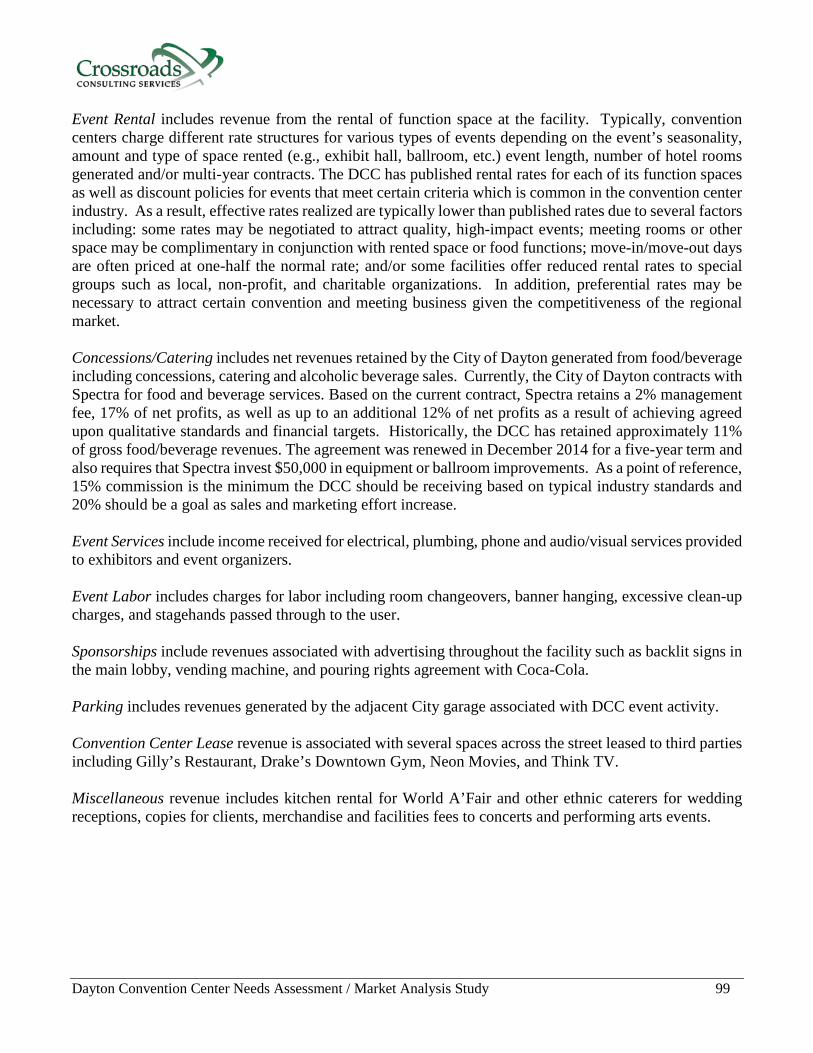
Dayton Convention Center Needs Assessment / Market Analysis Study 99
Event Rental includes revenue from the rental of function space at the facility. Typically, convention centers charge different rate structures for various types of events depending on the event’s seasonality, amount and type of space rented (e.g., exhibit hall, ballroom, etc.) event length, number of hotel rooms generated and/or multi-year contracts. The DCC has published rental rates for each of its function spaces as well as discount policies for events that meet certain criteria which is common in the convention center industry. As a result, effective rates realized are typically lower than published rates due to several factors including: some rates may be negotiated to attract quality, high-impact events; meeting rooms or other space may be complimentary in conjunction with rented space or food functions; move-in/move-out days are often priced at one-half the normal rate; and/or some facilities offer reduced rental rates to special groups such as local, non-profit, and charitable organizations. In addition, preferential rates may be necessary to attract certain convention and meeting business given the competitiveness of the regional market. Concessions/Catering includes net revenues retained by the City of Dayton generated from food/beverage including concessions, catering and alcoholic beverage sales. Currently, the City of Dayton contracts with Spectra for food and beverage services. Based on the current contract, Spectra retains a 2% management fee, 17% of net profits, as well as up to an additional 12% of net profits as a result of achieving agreed upon qualitative standards and financial targets. Historically, the DCC has retained approximately 11% of gross food/beverage revenues. The agreement was renewed in December 2014 for a five-year term and also requires that Spectra invest $50,000 in equipment or ballroom improvements. As a point of reference, 15% commission is the minimum the DCC should be receiving based on typical industry standards and 20% should be a goal as sales and marketing effort increase. Event Services include income received for electrical, plumbing, phone and audio/visual services provided to exhibitors and event organizers. Event Labor includes charges for labor including room changeovers, banner hanging, excessive clean-up charges, and stagehands passed through to the user. Sponsorships include revenues associated with advertising throughout the facility such as backlit signs in the main lobby, vending machine, and pouring rights agreement with Coca-Cola. Parking includes revenues generated by the adjacent City garage associated with DCC event activity. Convention Center Lease revenue is associated with several spaces across the street leased to third parties including Gilly’s Restaurant, Drake’s Downtown Gym, Neon Movies, and Think TV. Miscellaneous revenue includes kitchen rental for World A’Fair and other ethnic caterers for wedding receptions, copies for clients, merchandise and facilities fees to concerts and performing arts events.
Dayton Convention Center Needs Assessment / Market Analysis Study 100
Operating Expenses The following table summarizes the estimated operating expenses associated with the recommended renovations/enhancements as compared to a status quo scenario which is defined at the FY 2015 operating budget amounts.
Expense Category Status Quo Renovation
Option 1Renovation
Option 2Renovation
Option 1Renovation
Option 2Salaries and Wages $585,000 $860,000 $913,000 $275,000 $328,000Benefits 259,000 344,000 365,000 85,000 106,000Utilities 403,000 405,000 432,000 2,000 29,000Contract Services 420,000 474,000 509,000 54,000 89,000Repairs and Maintenance 185,000 155,000 169,000 (30,000) (16,000)Materials and Supplies 31,000 33,000 35,000 2,000 4,000General, Marketing and Administrative 14,000 40,000 43,000 26,000 29,000Real Estate Taxes 86,000 128,000 128,000 42,000 42,000Insurance 51,000 49,000 53,000 (2,000) 2,000Total $2,034,000 $2,488,000 $2,647,000 $454,000 $613,000
Incremental Change to Operating Expenses 22% 30%Notes: Excludes transportation center revenue reported as a separate fund beginning 2015.
In order to provide a conservative approach, the Real Estate Taxes line item is estimated to be consistent with historical amounts, which is higher than the budgeted amount for 2015.
Estimated Annual Change to DCC Operating ExpensesIncremental Change From Status Quo
The following provides a description of each operating expense line item. Salaries and Wages typically represent a significant expense and vary based on permanent full-time staffing plans and other factors. One factor relates to the management philosophy of maintaining event-related personnel as full-time or part-time staff. Another factor relates to the management and physical relationship the facility might have to other facilities. For example, the staffing plan for a stand-alone facility is different than for an entire complex that can share administrative costs among several venues. In addition, the extent that contracted services are used also impacts staffing at a facility. The DCC currently has 11 full-time positions, one of which is vacant. Based on this staffing plan, the recommended improvements and its estimated impact to utilization, as well as staffing at competitive/comparable facilities, it is assumed that an expanded facility would require five to six additional FTEs for a total staffing plan of 16 to 17. These positions should include a Finance Manager; one additional Sales Manager, Facilities Worker, and Building Trades Worker; as well as one to two Maintenance Workers. Benefits include costs associated with personnel including health and retirement benefits, City pension costs, as well as worker’s compensation. Historically, benefits have averaged 72% of salaries/wages expenses which is impacted by staff longevity and the allocation of City pension costs to DCC operations. This benefits percentage is significantly higher than is common in most convention centers (30% to 35%). It is assumed that a lower percentage of benefits to salaries/wages expenses is incurred in the renovation options based on the assumption that the facility will be managed by another entity with greater flexibility in staffing.
Dayton Convention Center Needs Assessment / Market Analysis Study 101
Utilities include electric, fuel and water costs and generally represent one of the highest expense items for convention centers and can be variable depending upon the level of utilization, the type of facilities and climate. In many facilities, these costs are handled as an expense that is fully or partially reimbursed by the event or, for civic uses, a utilities charge is assessed. The utility cost shown in this analysis represents the total non-reimbursable costs. Utilities expense increased by 41% in 2014 and was budgeted to increase an additional 18% in 2015 driven primarily by electric and gas expenses. It should be noted that utility expenses are impacted by facility design and decisions concerning physical design/layout, energy systems and management. Contract Services include items such as building and event security, audio/visual and other contracted services. Repairs and Maintenance includes various expenses incurred related to building and equipment maintenance and generally varies based on utilization. Expense allocations for repairs and maintenance are also highly dependent upon the owner/management philosophy relative to upkeep of the facility. Materials and Supplies include costs associated with rentals, leases, office and janitorial supplies, hardware, software and other similar items necessary for the day-to-day operation of the facility. General, Marketing and Administrative includes general expenses such as travel, communications, technology, postage, marketing, and membership dues. Real Estate Taxes are associated with the leased property across the street from the DCC. In order to provide a conservative approach, the Real Estate Taxes line item is estimated to be consistent with historical amounts, which is higher than the budgeted amount for 2015. Insurance includes both property and liability insurance allocated to the DCC by the City of Dayton’s blanket policy. Debt Service and Depreciation expenses are not included in this analysis.
Dayton Convention Center Needs Assessment / Market Analysis Study 102
Impact to Economic and Fiscal Benefits One of the primary objectives of this study is to estimate the economic and fiscal impacts associated with enhancement/renovation of the DCC to the area economy. The City of Dayton, Montgomery County and State of Ohio would continue to benefit from the DCC’s enhanced operations in a number of ways, including such tangible and intangible benefits as: • Enhancing the area’s image as a business and meetings destination • Receiving increased State and regional exposure through destination marketing and visitation • Providing a first-class venue for area residents and out-of-town visitors • Increasing the overall quality of life and livability of the area • Providing a catalyst for further downtown development initiatives including private sector investment • Broadening the area’s economic base • Maintaining and generating additional economic activity • Maintaining and generating additional fiscal revenues for local and State governments
Each of these benefits is important in assessing the overall impact of an enhanced/renovated DCC to the City of Dayton and Montgomery County. While the value of most of these benefits is difficult to measure, the estimated economic activity generated can be quantified. This analysis quantifies the direct, indirect and induced benefits associated with operations of an enhanced/renovated DCC including the associated tax revenues. Although some of the estimated event activity is occurring at the existing DCC, an enhanced/renovated facility will retain business that is leaving for competitive destinations as well as attract new events that cannot currently be accommodated. General Methodology Overview An assessment of the economic benefits that occur in the local economy as a result of the operations of an enhanced/renovated DCC can be approached in several ways. There are several different methodologies that are used throughout the industry. The approach used in this analysis considers expenditures generated from facility operations such as salaries/wages, benefits, utilities, contract services, repairs/maintenance, materials/supplies, general/administrative, real estate taxes, and insurance, as well as spending by attendees, exhibitors, and event organizers outside the facility on items such as lodging, restaurants, retail, entertainment and transportation as an initial measure of economic activity in the marketplace. Once the amount for direct spending is estimated, a calculated multiplier is applied to generate the indirect and induced effects. The sum of direct, indirect and induced effects equals total economic impact which is expressed in terms of spending (output), employment (jobs), and personal earnings. This analysis also estimates the fiscal impacts generated from ongoing operations of an enhanced/renovated DCC. The governmental entities considered in this fiscal analysis are the City of Dayton, Montgomery County, Dayton Regional Transit Authority and the State of Ohio. Although other taxes, such as property taxes, may also be positively impacted by ongoing operations of an
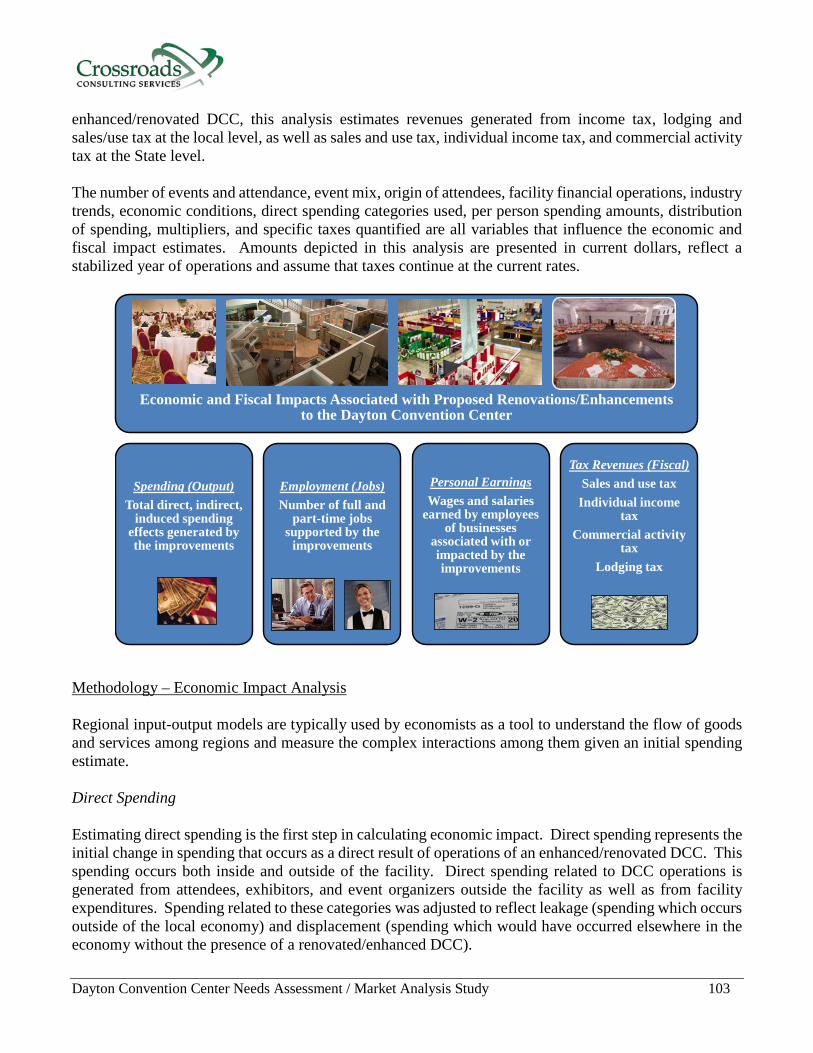
Dayton Convention Center Needs Assessment / Market Analysis Study 103
enhanced/renovated DCC, this analysis estimates revenues generated from income tax, lodging and sales/use tax at the local level, as well as sales and use tax, individual income tax, and commercial activity tax at the State level. The number of events and attendance, event mix, origin of attendees, facility financial operations, industry trends, economic conditions, direct spending categories used, per person spending amounts, distribution of spending, multipliers, and specific taxes quantified are all variables that influence the economic and fiscal impact estimates. Amounts depicted in this analysis are presented in current dollars, reflect a stabilized year of operations and assume that taxes continue at the current rates.
Methodology – Economic Impact Analysis Regional input-output models are typically used by economists as a tool to understand the flow of goods and services among regions and measure the complex interactions among them given an initial spending estimate. Direct Spending Estimating direct spending is the first step in calculating economic impact. Direct spending represents the initial change in spending that occurs as a direct result of operations of an enhanced/renovated DCC. This spending occurs both inside and outside of the facility. Direct spending related to DCC operations is generated from attendees, exhibitors, and event organizers outside the facility as well as from facility expenditures. Spending related to these categories was adjusted to reflect leakage (spending which occurs outside of the local economy) and displacement (spending which would have occurred elsewhere in the economy without the presence of a renovated/enhanced DCC).
Economic and Fiscal Impacts Associated with Proposed Renovations/Enhancementsto the Dayton Convention Center
Spending (Output)Total direct, indirect,
induced spending effects generated by the improvements
Employment (Jobs)Number of full and
part-time jobs supported by the
improvements
Personal EarningsWages and salaries
earned by employees of businesses
associated with or impacted by the improvements
Tax Revenues (Fiscal)Sales and use taxIndividual income
taxCommercial activity
taxLodging tax
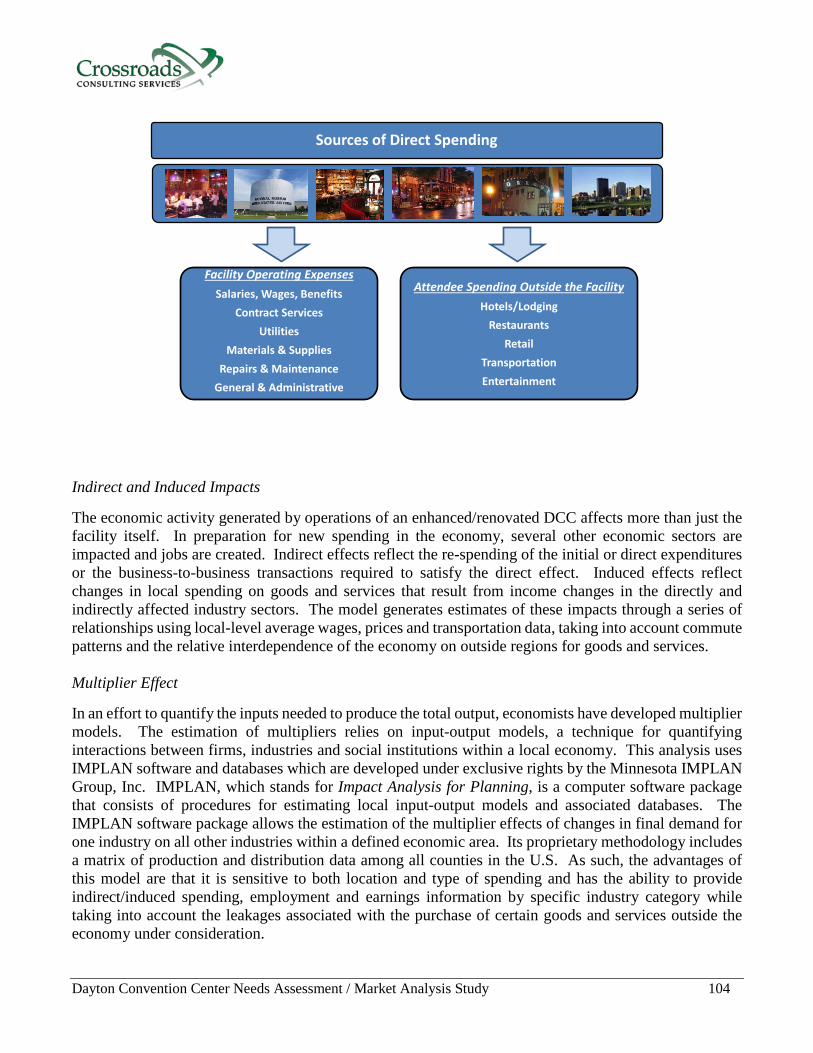
Dayton Convention Center Needs Assessment / Market Analysis Study 104
Indirect and Induced Impacts The economic activity generated by operations of an enhanced/renovated DCC affects more than just the facility itself. In preparation for new spending in the economy, several other economic sectors are impacted and jobs are created. Indirect effects reflect the re-spending of the initial or direct expenditures or the business-to-business transactions required to satisfy the direct effect. Induced effects reflect changes in local spending on goods and services that result from income changes in the directly and indirectly affected industry sectors. The model generates estimates of these impacts through a series of relationships using local-level average wages, prices and transportation data, taking into account commute patterns and the relative interdependence of the economy on outside regions for goods and services. Multiplier Effect In an effort to quantify the inputs needed to produce the total output, economists have developed multiplier models. The estimation of multipliers relies on input-output models, a technique for quantifying interactions between firms, industries and social institutions within a local economy. This analysis uses IMPLAN software and databases which are developed under exclusive rights by the Minnesota IMPLAN Group, Inc. IMPLAN, which stands for Impact Analysis for Planning, is a computer software package that consists of procedures for estimating local input-output models and associated databases. The IMPLAN software package allows the estimation of the multiplier effects of changes in final demand for one industry on all other industries within a defined economic area. Its proprietary methodology includes a matrix of production and distribution data among all counties in the U.S. As such, the advantages of this model are that it is sensitive to both location and type of spending and has the ability to provide indirect/induced spending, employment and earnings information by specific industry category while taking into account the leakages associated with the purchase of certain goods and services outside the economy under consideration.
Sources of Direct Spending
Facility Operating ExpensesSalaries, Wages, Benefits
Contract ServicesUtilities
Materials & SuppliesRepairs & Maintenance
General & Administrative
Attendee Spending Outside the FacilityHotels/Lodging
RestaurantsRetail
TransportationEntertainment
Dayton Convention Center Needs Assessment / Market Analysis Study 105
Once the direct spending amounts are assigned to a logical category, the IMPLAN model estimates the economic multiplier effects for each type of direct new spending attracted to or retained in the local area resulting from operations of an enhanced/renovated DCC. For purposes of this analysis, the following industry multipliers were used:
Category Spending Employment* EarningsHotels 1.6599 16.2 0.5225Eating & Drinking Places 1.6357 23.7 0.5629Retail Trade 1.7491 21.3 0.6650Entertainment/Recreation 1.8244 23.3 0.5151Transportation 1.8658 14.4 0.6823Utilities 1.3122 2.5 0.2318Business Services 1.8118 12.4 0.6484Note: *indicated the number of jobs per $1 million in spending.Source: IMPLAN.
Montgomery County Multipliers
These multipliers reflect IMPLAN’s latest available economic data reflecting 2014 transactions and the complex interactions among regions. Total Economic Impact The calculated multiplier effect is then added to the direct impact to quantify the total economic impact in terms of spending, employment and earnings which are defined as follows: • Spending (output) represents the total direct, indirect and induced spending effects generated by an
enhanced DCC. This calculation measures the total dollar change in spending (output) that occurs in the local economy for each dollar of output delivered to final demand.
• Employment (jobs) represents the number of full and part-time jobs supported by an enhanced DCC. The employment multiplier measures the total change in the number of jobs supported in the local economy for each additional $1.0 million of output delivered to final demand.
• Personal Earnings represent the wages and salaries earned by employees of businesses associated with or impacted by an enhanced DCC. In other words, the multiplier measures the total dollar change in earnings of households employed by the affected industries for each additional dollar of output delivered to final demand.
The following illustrates the multiplier effects for calculating total economic impact.
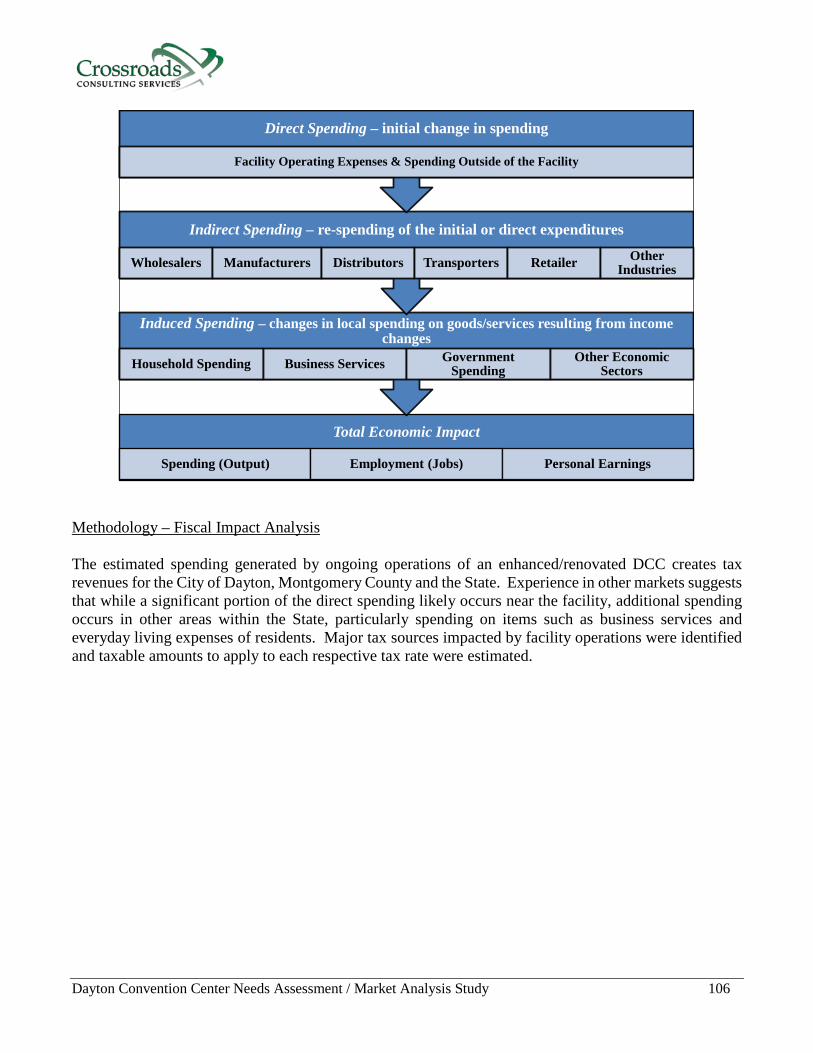
Dayton Convention Center Needs Assessment / Market Analysis Study 106
Methodology – Fiscal Impact Analysis The estimated spending generated by ongoing operations of an enhanced/renovated DCC creates tax revenues for the City of Dayton, Montgomery County and the State. Experience in other markets suggests that while a significant portion of the direct spending likely occurs near the facility, additional spending occurs in other areas within the State, particularly spending on items such as business services and everyday living expenses of residents. Major tax sources impacted by facility operations were identified and taxable amounts to apply to each respective tax rate were estimated.
Total Economic Impact
Spending (Output) Employment (Jobs) Personal Earnings
Induced Spending – changes in local spending on goods/services resulting from income changes
Household Spending Business Services Government Spending
Other Economic Sectors
Indirect Spending – re-spending of the initial or direct expenditures
Wholesalers Manufacturers Distributors Transporters Retailer Other Industries
Direct Spending – initial change in spending
Facility Operating Expenses & Spending Outside of the Facility

Dayton Convention Center Needs Assessment / Market Analysis Study 107
Summary of Estimated Annual Change to Economic Benefits The following table compares the estimated economic benefits from ongoing activities at an enhanced/renovated DCC as measured by spending, jobs and earnings to a status quo scenario.
Category Status QuoRenovation
Option 1Renovation
Option 2Renovation
Option 1Renovation
Option 2
Spending
Direct Spending $15,218,000 $23,442,000 $32,175,000 $8,224,000 $16,957,000Indirect/Induced Spending $11,269,000 $17,446,000 $24,002,000 $6,177,000 $12,733,000Total Spending $26,487,000 $40,888,000 $56,177,000 $14,401,000 $29,690,000
Total Jobs 270 410 570 140 300
Total Earnings $8,926,000 $13,823,000 $19,014,000 $4,897,000 $10,088,000
Estimated Annual Change to Economic Benefits Incremental Change From Status Quo
The following section provides a detailed description of the assumptions used in this analysis. Incremental New Direct Spending As mentioned previously, the first step in calculating economic impact is estimating the direct spending. The benefits generated at the local level as a result of direct spending both by attendees and activities that support events held at an enhanced/renovated DCC. The primary types of spending quantified in this analysis include attendee spending outside the facility and budgetary spending by the DCC. The spending amounts for each of these categories were based on data provided by several secondary sources including DCC management, the Dayton CVB, Tourism Economics, as well as other industry resources such as Destination Marketing Association International (DMAI). Attendee Spending Outside the Facility Estimated utilization at an enhanced/renovated DCC was used to calculate attendee spending. Daily spending amounts were assigned to high impact attendees who stay overnight in a hotel and low impact attendees who likely originate from the area or only travel for the day. Sponsoring Organization/Event Producer & Exhibitor Spending Outside the Facility
Sponsoring organizations/event producers have substantial investments in the events that they host. These organizations purchase goods and services from either the DCC or from outside sources. In addition, exhibitors often spend money outside of the facility to entertain existing and potential clients. Items such as exhibit space and equipment rental are typically provided by the facility, which are reflected as revenues for the provider. Since this spending is reflected in the budgetary spending by an enhanced DCC, these amounts are excluded from sponsoring organization/event producer and exhibitor spending to avoid double-counting. For purposes of this analysis and based on data from secondary sources such as DMAI, an average spending amount was applied to attendees at appropriate event types to reflect sponsoring organization/event producer spending and exhibitor spending.
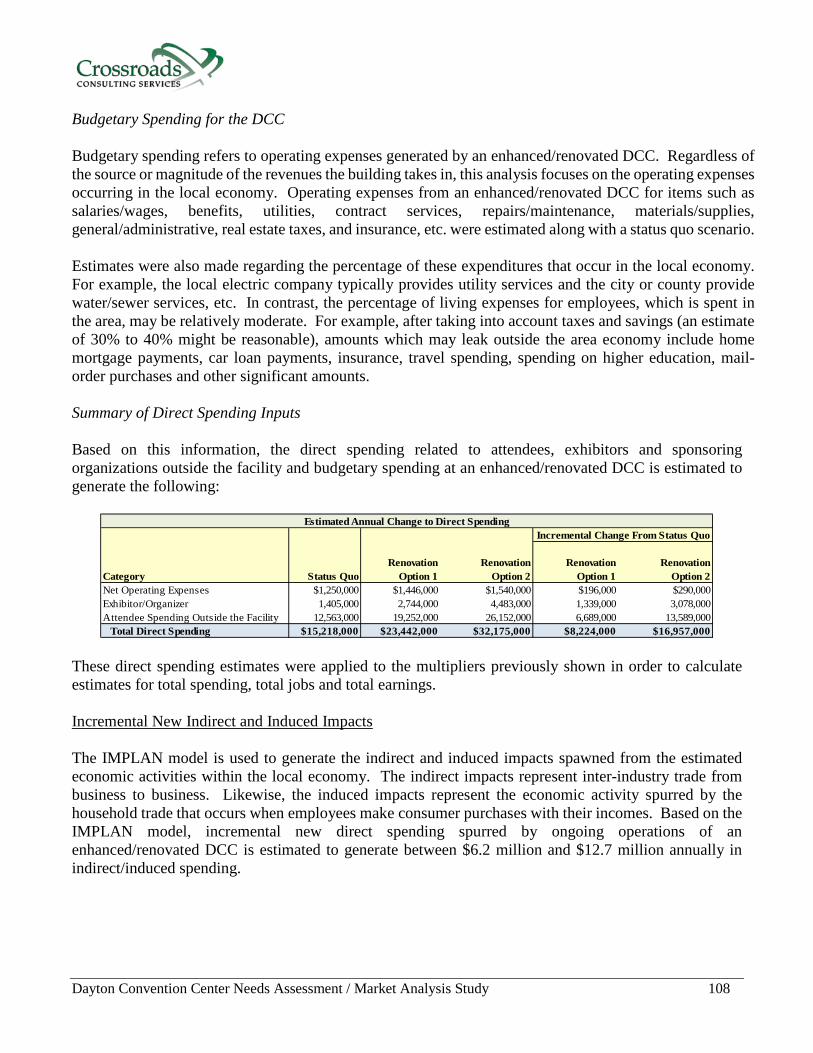
Dayton Convention Center Needs Assessment / Market Analysis Study 108
Budgetary Spending for the DCC Budgetary spending refers to operating expenses generated by an enhanced/renovated DCC. Regardless of the source or magnitude of the revenues the building takes in, this analysis focuses on the operating expenses occurring in the local economy. Operating expenses from an enhanced/renovated DCC for items such as salaries/wages, benefits, utilities, contract services, repairs/maintenance, materials/supplies, general/administrative, real estate taxes, and insurance, etc. were estimated along with a status quo scenario. Estimates were also made regarding the percentage of these expenditures that occur in the local economy. For example, the local electric company typically provides utility services and the city or county provide water/sewer services, etc. In contrast, the percentage of living expenses for employees, which is spent in the area, may be relatively moderate. For example, after taking into account taxes and savings (an estimate of 30% to 40% might be reasonable), amounts which may leak outside the area economy include home mortgage payments, car loan payments, insurance, travel spending, spending on higher education, mail-order purchases and other significant amounts. Summary of Direct Spending Inputs Based on this information, the direct spending related to attendees, exhibitors and sponsoring organizations outside the facility and budgetary spending at an enhanced/renovated DCC is estimated to generate the following:
Category Status QuoRenovation
Option 1Renovation
Option 2Renovation
Option 1Renovation
Option 2Net Operating Expenses $1,250,000 $1,446,000 $1,540,000 $196,000 $290,000Exhibitor/Organizer 1,405,000 2,744,000 4,483,000 1,339,000 3,078,000Attendee Spending Outside the Facility 12,563,000 19,252,000 26,152,000 6,689,000 13,589,000
Total Direct Spending $15,218,000 $23,442,000 $32,175,000 $8,224,000 $16,957,000
Estimated Annual Change to Direct SpendingIncremental Change From Status Quo
These direct spending estimates were applied to the multipliers previously shown in order to calculate estimates for total spending, total jobs and total earnings. Incremental New Indirect and Induced Impacts The IMPLAN model is used to generate the indirect and induced impacts spawned from the estimated economic activities within the local economy. The indirect impacts represent inter-industry trade from business to business. Likewise, the induced impacts represent the economic activity spurred by the household trade that occurs when employees make consumer purchases with their incomes. Based on the IMPLAN model, incremental new direct spending spurred by ongoing operations of an enhanced/renovated DCC is estimated to generate between $6.2 million and $12.7 million annually in indirect/induced spending.
Dayton Convention Center Needs Assessment / Market Analysis Study 109
Incremental New Total Spending Outputs from the IMPLAN model indicate that total (i.e., direct, indirect and induced) incremental new spending from activity at an enhanced/renovated DCC is estimated to range from $14.4 million to $29.7 million annually. Incremental New Total Jobs Based on the IMPLAN model, which calculates the number of jobs per $1.0 million in direct spending, the economic activity associated with the ongoing operations of an enhanced/renovated DCC is estimated to generate a total of between 140 to 300 incremental new jobs annually. These jobs are created in many sectors of the economy, which both directly and indirectly support the increased level of business activity in the area on an annual basis. Incremental New Total Earnings Outputs from the IMPLAN model indicate that incremental new earnings generated from an enhanced/renovated DCC are estimated to range from $4.9 million to $10.1 million annually.
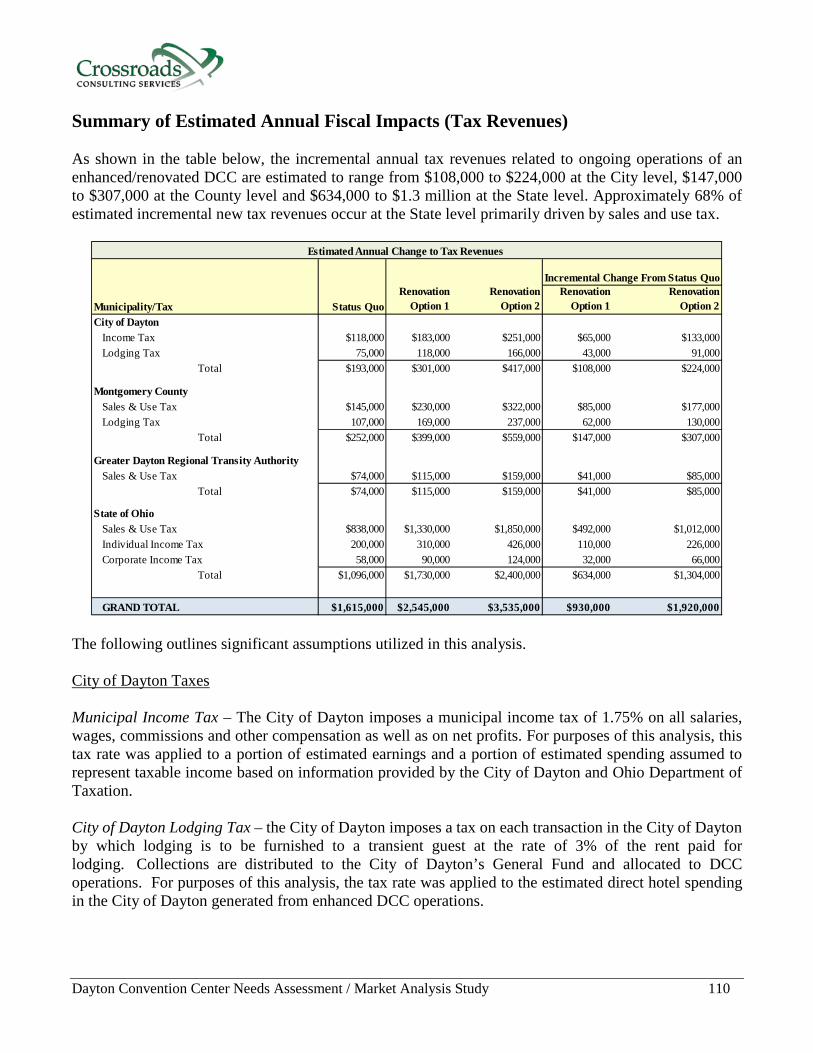
Dayton Convention Center Needs Assessment / Market Analysis Study 110
Summary of Estimated Annual Fiscal Impacts (Tax Revenues) As shown in the table below, the incremental annual tax revenues related to ongoing operations of an enhanced/renovated DCC are estimated to range from $108,000 to $224,000 at the City level, $147,000 to $307,000 at the County level and $634,000 to $1.3 million at the State level. Approximately 68% of estimated incremental new tax revenues occur at the State level primarily driven by sales and use tax.
Municipality/Tax Status QuoRenovation
Option 1Renovation
Option 2Renovation
Option 1Renovation
Option 2City of Dayton
Income Tax $118,000 $183,000 $251,000 $65,000 $133,000Lodging Tax 75,000 118,000 166,000 43,000 91,000
Total $193,000 $301,000 $417,000 $108,000 $224,000
Montgomery CountySales & Use Tax $145,000 $230,000 $322,000 $85,000 $177,000Lodging Tax 107,000 169,000 237,000 62,000 130,000
Total $252,000 $399,000 $559,000 $147,000 $307,000
Greater Dayton Regional Transity AuthoritySales & Use Tax $74,000 $115,000 $159,000 $41,000 $85,000
Total $74,000 $115,000 $159,000 $41,000 $85,000
State of OhioSales & Use Tax $838,000 $1,330,000 $1,850,000 $492,000 $1,012,000Individual Income Tax 200,000 310,000 426,000 110,000 226,000Corporate Income Tax 58,000 90,000 124,000 32,000 66,000
Total $1,096,000 $1,730,000 $2,400,000 $634,000 $1,304,000
GRAND TOTAL $1,615,000 $2,545,000 $3,535,000 $930,000 $1,920,000
Estimated Annual Change to Tax Revenues
Incremental Change From Status Quo
The following outlines significant assumptions utilized in this analysis. City of Dayton Taxes Municipal Income Tax – The City of Dayton imposes a municipal income tax of 1.75% on all salaries, wages, commissions and other compensation as well as on net profits. For purposes of this analysis, this tax rate was applied to a portion of estimated earnings and a portion of estimated spending assumed to represent taxable income based on information provided by the City of Dayton and Ohio Department of Taxation. City of Dayton Lodging Tax – the City of Dayton imposes a tax on each transaction in the City of Dayton by which lodging is to be furnished to a transient guest at the rate of 3% of the rent paid for lodging. Collections are distributed to the City of Dayton’s General Fund and allocated to DCC operations. For purposes of this analysis, the tax rate was applied to the estimated direct hotel spending in the City of Dayton generated from enhanced DCC operations.
Dayton Convention Center Needs Assessment / Market Analysis Study 111
Montgomery County Taxes Montgomery County Sales/Use Tax – Montgomery County imposes a 1% local sales/use tax applicable under the State sales tax rules. Revenues generated from this tax are allocated to the County’s General Fund. For purposes of this analysis, the tax rate was applied to estimated taxable direct and indirect/induced spending generated from enhanced DCC operations. Montgomery County Lodging Tax – Montgomery County imposes a tax on each transaction in Montgomery County by which lodging is to be furnished to a transient guest at the rate of 3% of the rent paid for lodging. Collections are distributed to the Dayton CVB (70%) and the County (30%). The County’s portion is allocated to a Special Revenue Fund dedicated to building operations of Memorial Hall, Courthouse Square and the Historic Courthouse. For purposes of this analysis, the tax rate was applied to the estimated direct hotel spending in Montgomery County generated from enhanced DCC operations. Greater Dayton Regional Transit Authority Taxes Dayton Regional Transit Authority Sales/Use Tax – The Dayton Regional Transit Authority imposes a 0.5% local sales/use tax applicable under the State sales tax rules. Revenues generated from this tax are allocated to the Dayton Regional Transit Authority which is dedicated to providing public transit services to residents of Montgomery County and western Greene County. For purposes of this analysis, the tax rate was applied to estimated taxable direct and indirect/induced spending generated from enhanced DCC operations. State of Ohio Taxes Ohio Sales/Use Tax – Ohio imposes a retail sales and use tax on the sale, lease, or rental of tangible personal property as well as taxable services. The general sales tax rate is 5.75%. For purposes of this analysis, the tax rate was applied to estimated taxable direct and indirect/induced spending generated from enhanced DCC operations. Individual Income Tax – Ohio imposes an individual income tax assessed against personal income earned in the State. The State income tax is a graduated scale of nine brackets including a fixed amount plus a percentage in excess of each respective income bracket. For purposes of this analysis and based on information provided by the Ohio Department of Taxation, an effective tax rate of 2.24% was calculated based on the federal adjusted gross income and the total personal income tax paid to the State in 2012 (the most recent year for which data was available). This effective tax rate was applied to total earnings estimated to be generated from enhanced DCC operations. Commercial Activity Tax – The commercial activity tax (CAT) is an annual tax imposed on the privilege of doing business in Ohio, measured by gross receipts from business activities in the State. Businesses with Ohio taxable gross receipts of $150,000 or more per calendar year are subject to the CAT. For purposes of this analysis and based on information provided by the Ohio Department of Taxation, an effective tax rate of 0.22% was calculated based on the taxable gross receipts and the total tax paid to the State in FY 2014. This effective tax rate was applied to total spending estimated to be generated from enhanced DCC operations.
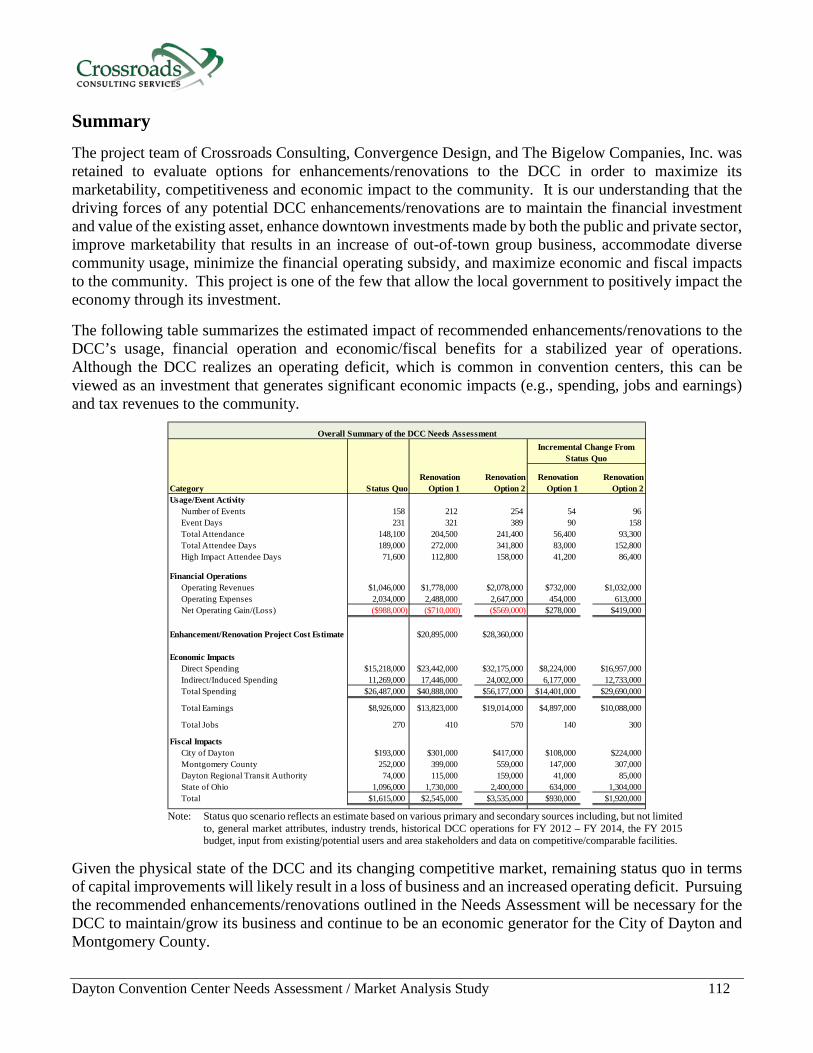
Dayton Convention Center Needs Assessment / Market Analysis Study 112
Summary The project team of Crossroads Consulting, Convergence Design, and The Bigelow Companies, Inc. was retained to evaluate options for enhancements/renovations to the DCC in order to maximize its marketability, competitiveness and economic impact to the community. It is our understanding that the driving forces of any potential DCC enhancements/renovations are to maintain the financial investment and value of the existing asset, enhance downtown investments made by both the public and private sector, improve marketability that results in an increase of out-of-town group business, accommodate diverse community usage, minimize the financial operating subsidy, and maximize economic and fiscal impacts to the community. This project is one of the few that allow the local government to positively impact the economy through its investment. The following table summarizes the estimated impact of recommended enhancements/renovations to the DCC’s usage, financial operation and economic/fiscal benefits for a stabilized year of operations. Although the DCC realizes an operating deficit, which is common in convention centers, this can be viewed as an investment that generates significant economic impacts (e.g., spending, jobs and earnings) and tax revenues to the community.
Category Status QuoRenovation
Option 1Renovation
Option 2Renovation
Option 1Renovation
Option 2Usage/Event Activity
Number of Events 158 212 254 54 96Event Days 231 321 389 90 158Total Attendance 148,100 204,500 241,400 56,400 93,300Total Attendee Days 189,000 272,000 341,800 83,000 152,800High Impact Attendee Days 71,600 112,800 158,000 41,200 86,400
Financial OperationsOperating Revenues $1,046,000 $1,778,000 $2,078,000 $732,000 $1,032,000Operating Expenses 2,034,000 2,488,000 2,647,000 454,000 613,000Net Operating Gain/(Loss) ($988,000) ($710,000) ($569,000) $278,000 $419,000
Enhancement/Renovation Project Cost Estimate $20,895,000 $28,360,000
Economic Impacts Direct Spending $15,218,000 $23,442,000 $32,175,000 $8,224,000 $16,957,000Indirect/Induced Spending 11,269,000 17,446,000 24,002,000 6,177,000 12,733,000Total Spending $26,487,000 $40,888,000 $56,177,000 $14,401,000 $29,690,000
Total Earnings $8,926,000 $13,823,000 $19,014,000 $4,897,000 $10,088,000
Total Jobs 270 410 570 140 300
Fiscal Impacts City of Dayton $193,000 $301,000 $417,000 $108,000 $224,000Montgomery County 252,000 399,000 559,000 147,000 307,000Dayton Regional Transit Authority 74,000 115,000 159,000 41,000 85,000State of Ohio 1,096,000 1,730,000 2,400,000 634,000 1,304,000Total $1,615,000 $2,545,000 $3,535,000 $930,000 $1,920,000
Overall Summary of the DCC Needs AssessmentIncremental Change From
Status Quo
Note: Status quo scenario reflects an estimate based on various primary and secondary sources including, but not limited
to, general market attributes, industry trends, historical DCC operations for FY 2012 – FY 2014, the FY 2015 budget, input from existing/potential users and area stakeholders and data on competitive/comparable facilities.
Given the physical state of the DCC and its changing competitive market, remaining status quo in terms of capital improvements will likely result in a loss of business and an increased operating deficit. Pursuing the recommended enhancements/renovations outlined in the Needs Assessment will be necessary for the DCC to maintain/grow its business and continue to be an economic generator for the City of Dayton and Montgomery County.

Dayton Convention Center Needs Assessment / Market Analysis Study 113
Table of Contents
1 Introduction and Executive Summary 1 2 General Market Overview 11 3 Key Industry Trends 20 4 Historical Facility Operations 27 5 General Management Practices Assessment 47 6 Physical Facility Assessment 57 7 Competitive Facility Assessment 71 8 Needs Assessment 85 9 Economic Analysis 94
10 Funding Analysis 113
11 Limiting Conditions and Assumptions 120
12 Appendix 122
Dayton Convention Center Needs Assessment / Market Analysis Study 114
Funding Analysis Research was conducted regarding the sources of funding that have been used for similar facilities. The purpose of the analysis is not to produce a financing plan, but rather to discuss certain financing vehicles as well as public and private funding sources that could potentially be utilized to fund any future renovation/upgrade/expansion of the DCC. The examples presented herein are meant to serve as a planning tool for the City of Dayton in its ongoing decisions associated with future improvements to the DCC. Potential Financing Techniques and Vehicles Throughout the U.S., convention centers and other public assembly facilities have used a variety of financing techniques and sources of funding to construct or improve their venues. This section of the report presents a description of traditional financing instruments and funding sources used to fund convention centers. Each of these financing options impact the owner and/or local government partners differently, as each will have its own cost structure, tax implications and cash flow considerations. Although the various alternatives presented in this section represent the most commonly used forms of financing, not all of them may be appropriate for the City of Dayton and the DCC long-term plan improvements. Local and State laws, fiscal sources and debt issuance capacity of governmental entities for bonding purposes all influence the ability to use any one of these financing methods or funding sources. Public assembly facilities such as convention centers have been traditionally financed with a variety of public and private funds. However, in many instances, the primary source of underwriting for debt service on construction is still derived from public sources. Financing Instruments This section summarizes traditional financing instruments. These financing instruments may or may not be applicable to financing the proposed DCC improvements. General Obligation Bonds - Historically, many convention centers have been financed by general obligation bonds issued by city, county or state governments. General obligation bonds are backed by a pledge of ad valorem taxes of the issuer. Since the tax base and taxing authority of the government are pledged to the repayment of the bonds, these bonds typically have the lowest interest of all forms of bond financing. Interest rates vary depending on the existing bond indebtedness and credit rating of the public sector entity. One disadvantage of using general obligation bonds is that the overall bond capacity for the issuing municipality is reduced. General obligation bonds issued by city, county or some state governments have to be coordinated with other government financing plans and typically require voter approval through a public referendum.
Revenue Bonds - Revenue bonds are special obligations secured by one or more defined revenue sources. Most public assembly revenue bonds are based on a pledge of a dedicated revenue source such as facility revenues, lodging tax, admissions tax, food and beverage tax, sales tax or other special assessments. The use of special purpose tax levies represents a means by which capital costs may be linked with recurring benefits and is typically directed at those sectors of the local economy which directly benefit from the proposed new/improved facility(s) such as hotel room night stays, ticket sales, food, and/or alcohol sales.
Dayton Convention Center Needs Assessment / Market Analysis Study 115
One of the primary advantages of revenue bonds is that the issue need only pledge specific revenues and not the full faith and credit of the issuer. However, because of this, revenue bonds require a higher interest rate than general obligation debt. The new Cleveland Convention Center, estimated to cost $276 million, was funded via revenue bonds backed by a quarter-cent County sales taxed imposed in 2007 plus a supplementary 1% County lodging tax added in 2010. The new Cleveland Convention Center and Global Center for Health Innovation opened in 2013 and are envisioned to showcase healthcare innovations, lure medical professionals to see state-of-the-art technology, and take continuing-education classes. The Global Center has several private anchor tenants including the Healthcare Information and Management Systems Society, Philips Healthcare, GE Healthcare, the Cleveland Clinic, and University Hospitals. Columbus Convention Center’s phased $125 million expansion/renovation project is also funded by County revenue bonds backed by collections from the local 10% lodging tax. Franklin County established the Convention Facilities Authority in 1988 and authorized it to levy lodging taxes to pay for construction, operation and maintenance, and expansion of the Columbus Convention Center. The first excise tax the Authority levied was a 4% countywide bed tax. In 1989, with approval from the City of Columbus, the Authority levied a second tax of 0.9% on hotel rooms within the City. The total proceeds from the Countywide 4.9% lodging tax is dedicated to the Convention Facilities Authority for expansion/renovation and capital improvements to the Columbus Convention Center. In addition, the Columbus Convention Center receives approximately $5.7 million annually in parking revenue from adjacent garages. Hamilton County issued revenue bonds for the Duke Energy Convention Center expansion that was completed in 2006 as well as the $25 million Sharonville Convention Center renovation/expansion that opened in 2012. Both projects were backed by County lodging taxes. The Duke Energy Center renovation/expansion was also partially funded by the County via a Hamilton County Convention Facilities Authority revenue bond issue. The Convention Facilities Authority was created in 2002 for the purpose of financing the Duke Energy Center project. The Sharonville Convention Center’s major renovation/expansion project was financed by a cooperative agreement with the Hamilton County Convention Facilities Authority, Hamilton County, and the City of Sharonville. The City of Sharonville issued approximately $28 million in general obligation bonds and revenue bonds backed by a City lodging tax which is dedicated to some of the debt service and capital improvements. In addition, Hamilton County committed up to $1.3 million in County lodging tax revenues for debt service. Hamilton County also provides a set amount of $50,000 annually for Sharonville Convention Center operations/capital improvements. The City of Sharonville recently entered into a franchise agreement with a hotel developer to build a headquarters hotel connected to the convention center. The City of Sharonville is currently undertaking $6.0 million in infrastructure improvements surrounding the City-owned hotel site. The Grand Wayne Convention Center development and subsequent renovation/expansion in 2005 was funded via the Allen County supplemental food/beverage tax. Proceeds from the tax are allocated to the Allen County/Fort Wayne Capital Improvement Board that uses funds to facilitate capital projects. In addition, the facility receives a portion of the local lodging tax that amounts to approximately $3.0 million annually, $225,000 of which is dedicated to capital improvements.
Dayton Convention Center Needs Assessment / Market Analysis Study 116
Tax Increment Funding – Tax increment or tax allocation bonds are secured by a pledge of net increases in property or sales tax or both resulting from the development of an area within a defined development district. The success of this type of financing is dependent upon a development district being established and a strong market driven development atmosphere that would provide a constant source of new privately owned and financed projects within the district. This technique can be particularly useful in addressing infrastructure improvements needed for the construction of facilities or surrounding infrastructure improvements. Often these “tax increment financing districts” are created in “blighted” areas. According to the Ohio Development Services Agency: TIF is an economic development mechanism available to local governments in Ohio as of 2005 to finance public infrastructure improvements and, in certain circumstances, residential rehabilitation. TIFs are implemented at the local level and may be created by a township, municipality or county. Payments derived from the increased assessed value of any improvement to real property beyond that amount are directed towards a separate fund to finance the construction of public infrastructure defined within the TIF legislation. Local jurisdictions seeking to establish a TIF project must enact legislation that (a) designates the parcel(s) to be exempted from taxation, (b) declares improvements to private property within the specified area as serving a public purpose, (c) delineates the public infrastructure improvements to be made that will directly benefit the parcel and (d) specifies the equivalent funds to be created for those redirected monies. Only those public infrastructure improvements directly serving the increased demand arising from the real property improvements to the parcel(s) or an Incentive District are eligible for TIF financing. A TIF-funded project can be completed in conjunction with a private development if the TIF-funded project serves an eligible public purpose. A local political jurisdiction may exempt the value of private improvements from real property taxes up to 75 percent for a term of up to 10 years. Similar to the Ohio Enterprise Zone (EZ) program, the TIF program enables counties, municipalities, and townships to exempt from real property taxation the new value added to a parcel or group of parcels as a result of new property investment. This, however, is the extent of the similarities between the EZ program and TIF. Unlike the EZ program, TIF can be used with residential development. Another difference involves the exemption associated with a TIF. The EZ program abates taxes, whereas TIF does not change the taxpayer’s tax liability or the valuation of the taxpayer’s property. Instead, TIF enables the taxpayer to make payments to a special fund in an amount equal to the property tax liability. These payments in lieu of taxes are used by the local government to retire debt incurred for the infrastructure improvements needed to support the new real property investment. In Ohio, municipalities can issue the debt backed by TIF payments in lieu of taxes or, alternatively, require the private developer to issue the debt and be reimbursed by the municipality over time with the TIF generated funds. According to the Ohio Revised Code, public infrastructure is considered: • Public roads and highways • Water and sewer lines • Environmental remediation • Land acquisition • Demolition (including demolition on private property deemed necessary for economic development)
Dayton Convention Center Needs Assessment / Market Analysis Study 117
• Storm water and flood remediation (including storm water and flood remediation on private property deemed necessary for public health, safety, and welfare)
• Gas, electric, and telecommunication services • Public waterway development
Certificates of Participation – Another funding alternative is the use of Certificates of Participation (COPs). Unlike general obligation or revenue bonds, this financing method does not legally pledge government money to pay the annual debt service. Under this method, COP holders are repaid through an annual lease appropriation by the sponsoring government agency. Because this agency does not legally commit taxpayers over a long-term period, funds can be obtained without voter approval. Further, COPs are not subject to many other statutory requirements applicable to bonds, including interest rate limitations, election requirements, competitive sales requirements, semi-annual or fixed-rate interest payment requirements. Consequently, a government agency can react quickly to favorable financial market conditions and structure a deal in a timely manner. On the other hand, because no funds are legally pledged beyond annual appropriations, COPs typically have a higher cost of debt in comparison to traditional bond issuances. A COP holder's primary recourse upon default is the value of the asset (i.e., the facility). Taxable Versus Non-Taxable Debt – While it is premature to ascertain whether the debt issuance will be taxable or non-taxable in nature, it is important to recognize that the structuring of certain contractual agreements with vendors, management and/or users can impact its tax status.
Funding Sources Funding sources can usually be defined as one of two types: one-time and recurring. The most common one-time source of funding is a grant or cash contribution. However, the majority of funding sources are recurring in nature and include, but are not limited to, the following: • Surplus revenue or designated operating revenues • Ad valorem tax • Lodging tax • Sales tax • Food and beverage tax • State and local appropriations • Special taxes (e.g., admissions or ticket tax) • Governmental grants • Community development tax • Tax increment revenues
These sources of funds represent common means of funding sources for construction of convention center. Traditionally, these sources are paid into a fund account or are in some way dedicated or committed to the retirement of annual debt incurred through a particular financing medium.
A portion of the sources outlined above represent fiscal sources under the control of local and/or state
government. Typically, joint financing plans that have local and state government involvement result in a facility owned and operated by the local governmental entity. Most facilities developed by local and/or state governments rely on fiscal sources such as sales tax, lodging tax, food and beverage tax, or various redevelopment rebates. Increasingly, local governments have been able to capitalize on special funding that may require approval at the state level (e.g., changes in taxes imposed, rebates for collections within local jurisdictions or amounts on existing taxes) to assist in their project. In some instances, this may require approval of the State Legislature.
Dayton Convention Center Needs Assessment / Market Analysis Study 118
State and/or Federal grants also represent a potential funding source for both planning and project execution/implementation of the recommended DCC improvements. Many grants require matching funds which would allow the City of Dayton to maximize its committed investment as well as any capital obtained from the private sector.
For projects that have components that could support energy efficiency, use renewable energy, and/or sustainable technologies practices, the following agencies have various grant programs that should be considered:
• U.S. Department of Energy
• Partnership for Sustainable Communities (a partnership of Department of Transportation, Environmental Protection Agency, and Housing and Urban Development)
• U.S. Department of Commerce, Economic Development Administration In general, infrastructure improvements at the DCC such as energy efficient pumps, using low-flow appliances/equipment, solar on the buildings, LED lighting where appropriate, and recycling facilities, etc. may qualify for grants. Potential Public Funding Sources
Based on input from City of Dayton and Montgomery County officials, potential public funding alternatives for future DCC improvements may include, but not be limited to, the following:
• Lodging Tax – increase in current County tax rate. Based on annual collections over the past three years, a one point increase could generate approximately $900,000 annually. One benefit of increasing the lodging tax is that this cost is borne by visitors, not area residents, and the DCC should be considered an investment in Dayton’s economy. Also, an increased lodging tax rate should not negatively impact Dayton’s competitive position since, even with a modest increase, the City of Dayton would still have one of the lowest total tax rates on hotels among competitive destinations.
• Tax Increment Financing District – create a TIF district surrounding the DCC to foster private investment and increased property taxes that could be dedicated to some improvements.
• Tourism Improvement District – increasingly popular means of funding destination marketing organizations such as the Dayton CVB. TIDs are hotel assessment districts that raise funds for destination marketing, tourism promotion, sales, and events. Ohio statutes allow for Special Improvement Districts which authorize counties to create assessment districts. Law modifications may be required to specify hotel assessments and destination marketing. Should the City of Dayton choose to form a TID, it should ensure that appropriate funds are dedicated to support ongoing DCC operations and capital improvements as well as additional sales and marketing efforts that will be required of the Dayton CVB.
Potential Private Funding Sources
Based on the project costs and estimated incremental event activity associated with the DCC long-term improvements, a financing plan predicated on the use of incremental operating revenues will not be sufficient. As such, effort should be made to maximize private sector investment to minimize the public risk, where possible. There are several potential opportunities that may assist in mitigating the construction costs from non-governmental sources including the following:

Dayton Convention Center Needs Assessment / Market Analysis Study 119
• Naming rights - where one or more parties can be solicited for up-front or annually recurring commitments. Naming rights could be associated with specific program elements (e.g., exhibit hall, ballroom, etc.) or the entire building.
• Long-term sponsorships – include the sale of advertising for particular “zones” within or outside the facility such as a lobby or private area to gather prior to and after events, or an entry drop-off named for a sponsor.
It should be recognized that each of these options are highly market-driven and their viability at the DCC would need to be tested through an extensive pre-development marketing initiative. Given the preliminary nature of the recommended enhancements/renovations, potential revenues from these sources are not estimated as part of this analysis. To the extent that certain specific revenues such as those noted above can be identified, they can be considered a supplemental revenue stream to the core finance plan which will still likely need to be based on traditional public financing with the use of governmental tax sources. Many other communities contemplating similar development projects have noted the importance of harnessing multiple, regional partners, leveraging Federal/State monies and private capital to create a funding plan that is viable for construction, necessary infrastructure, ongoing operations and maintenance. As mentioned previously, several City/County partnerships exist in Ohio to fund the development, ongoing operations, and capital improvements of convention centers. As the long-term development and funding plan progresses, it will be important to consider both the advantages and potential restrictions of any funding partnerships. Potential Next Steps A facility assessment/economic analysis is an initial step in any planning process. Renovating/enhancing the DCC will require detailed proactive and strategic planning to maximize operational opportunities and mitigate potential physical programmatic issues. Potential next steps include: • Exploring potential changes to ownership and operating structure.
• Identifying potential financing strategy and related timeline.
• Securing funding to conduct more detailed site and architectural planning studies that could include, but not be limited to, developing a more detailed spatial program and further refining the preferred renovation option construction cost estimates.
• Addressing other renovation/enhancement related issues such minimizing disruption to the existing DCC and assessing the impact to future bookings.
• Developing a strategic plan for future land uses of surrounding parcels to accommodate long-term development of supporting amenities such as another convention quality hotel or potential expansion of the Crowne Plaza’s room supply.
Dayton Convention Center Needs Assessment / Market Analysis Study 120
Table of Contents
1 Introduction and Executive Summary 1 2 General Market Overview 11 3 Key Industry Trends 20 4 Historical Facility Operations 27 5 General Management Practices Assessment 47 6 Physical Facility Assessment 57 7 Competitive Facility Assessment 71 8 Needs Assessment 85 9 Economic Analysis 94
10 Funding Analysis 107
11 Limiting Conditions and Assumptions 120
12 Appendix 122
Dayton Convention Center Needs Assessment / Market Analysis Study 121
Limiting Conditions and Assumptions This analysis is subject to our contractual terms, as well as the following limiting conditions and assumptions: • This analysis has been prepared for the City of Dayton and the Dayton/Montgomery County CVB (Client) for
its internal decision-making purposes associated with future operations of the Dayton Convention Center and should not be used for any other purposes without the prior written consent of Crossroads Consulting Services LLC.
• The findings and assumptions contained in the report reflect analysis of primary and secondary sources. We have utilized sources that are deemed to be accurate but cannot guarantee their accuracy. No information provided to us by others was audited or verified and was assumed to be correct.
• Although the analysis includes findings and recommendations, all decisions in connection with the implementation of such findings and recommendations shall be the Client’s responsibility.
• Estimates and analysis regarding future operations of the Dayton Convention Center are based on trends and assumptions and, therefore, there will usually be differences between the projected and actual results because events and circumstances frequently do not occur as expected, and those differences may be material.
• This analysis does not constitute an audit, a projection of financial performance, or an opinion of value or appraisal in accordance with generally accepted audit standards. As such, we do not express an opinion or any other form of assurance. Any estimates or ranges of value were prepared to illustrate current and potential future market conditions.
• Although this analysis utilizes various mathematical calculations, the final estimates are subjective and may be influenced by our experience and other factors not specifically set forth in this report.
• We have no obligation, unless subsequently engaged, to update this report or revise this analysis as presented due to events or circumstances occurring after the date of this report.
• The quality of ownership and management of the Dayton Convention Center has a direct impact on its economic performance. This analysis assumes responsible and competent ownership and management. Any departure from this assumption may have a significant impact on the findings in this report.
• Current and anticipated market conditions are influenced by a large number of external factors. We have not knowingly withheld any pertinent facts, but we do not guarantee that we have knowledge of all factors which might influence future operations of the Dayton Convention Center. Due to quick changes in the external factors, the actual results may vary significantly from estimates presented in this report.
• The analysis performed was limited in nature and, as such, Crossroads Consulting Services LLC does not express an opinion or any other form of assurance on the information presented in this report. As with all estimates of this type, we cannot guarantee the results nor is any warranty intended that they can be achieved.
• The analysis is intended to be read and used in whole and not in part. Separation of any section or page from the main body of the report is expressly forbidden and invalidates the analysis.
• In accordance with the terms of our engagement letter, the accompanying report is restricted to internal use by the Client and may not be relied upon by any third party for any purpose including any matter pertaining to financing.
• Possession of the report does not carry with it the right of publication. It should be used for its intended purpose only and by the parties to whom it is addressed.
Dayton Convention Center Needs Assessment / Market Analysis Study 122
Table of Contents
1 Introduction and Executive Summary 1 2 General Market Overview 11 3 Key Industry Trends 20 4 Historical Facility Operations 27 5 General Management Practices Assessment 47 6 Physical Facility Assessment 57 7 Competitive Facility Assessment 71 8 Needs Assessment 85 9 Economic Analysis 94
10 Funding Analysis 113
11 Limiting Conditions and Assumptions 120
12 Appendix 122
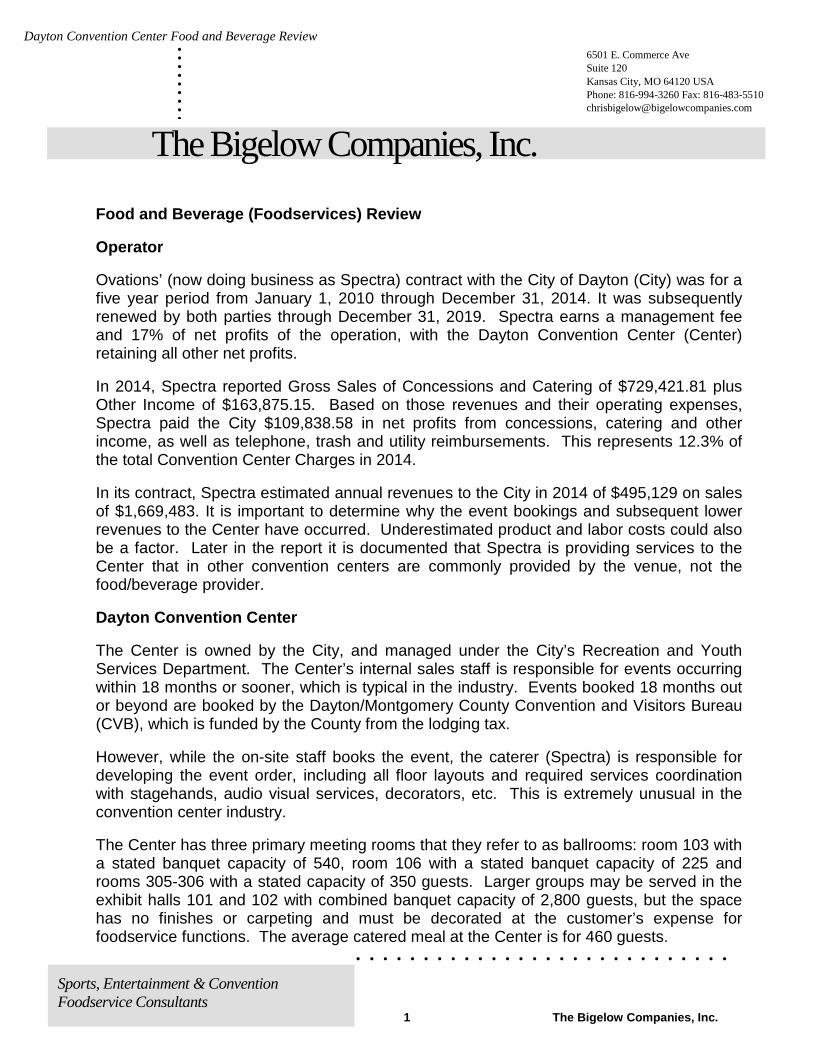
Dayton Convention Center Food and Beverage Review
1 The Bigelow Companies, Inc.
. . . . . . . . . . . . . . . . . . . . . . . . . . . .
Sports, Entertainment & Convention Foodservice Consultants
. . . . . . . . .
The Bigelow Companies, Inc.
Food and Beverage (Foodservices) Review
Operator
Ovations’ (now doing business as Spectra) contract with the City of Dayton (City) was for a five year period from January 1, 2010 through December 31, 2014. It was subsequently renewed by both parties through December 31, 2019. Spectra earns a management fee and 17% of net profits of the operation, with the Dayton Convention Center (Center) retaining all other net profits.
In 2014, Spectra reported Gross Sales of Concessions and Catering of $729,421.81 plus Other Income of $163,875.15. Based on those revenues and their operating expenses, Spectra paid the City $109,838.58 in net profits from concessions, catering and other income, as well as telephone, trash and utility reimbursements. This represents 12.3% of the total Convention Center Charges in 2014.
In its contract, Spectra estimated annual revenues to the City in 2014 of $495,129 on sales of $1,669,483. It is important to determine why the event bookings and subsequent lower revenues to the Center have occurred. Underestimated product and labor costs could also be a factor. Later in the report it is documented that Spectra is providing services to the Center that in other convention centers are commonly provided by the venue, not the food/beverage provider.
Dayton Convention Center
The Center is owned by the City, and managed under the City’s Recreation and Youth Services Department. The Center’s internal sales staff is responsible for events occurring within 18 months or sooner, which is typical in the industry. Events booked 18 months out or beyond are booked by the Dayton/Montgomery County Convention and Visitors Bureau (CVB), which is funded by the County from the lodging tax.
However, while the on-site staff books the event, the caterer (Spectra) is responsible for developing the event order, including all floor layouts and required services coordination with stagehands, audio visual services, decorators, etc. This is extremely unusual in the convention center industry.
The Center has three primary meeting rooms that they refer to as ballrooms: room 103 with a stated banquet capacity of 540, room 106 with a stated banquet capacity of 225 and rooms 305-306 with a stated capacity of 350 guests. Larger groups may be served in the exhibit halls 101 and 102 with combined banquet capacity of 2,800 guests, but the space has no finishes or carpeting and must be decorated at the customer’s expense for foodservice functions. The average catered meal at the Center is for 460 guests.
6501 E. Commerce Ave Suite 120 Kansas City, MO 64120 USA Phone: 816-994-3260 Fax: 816-483-5510 [email protected]
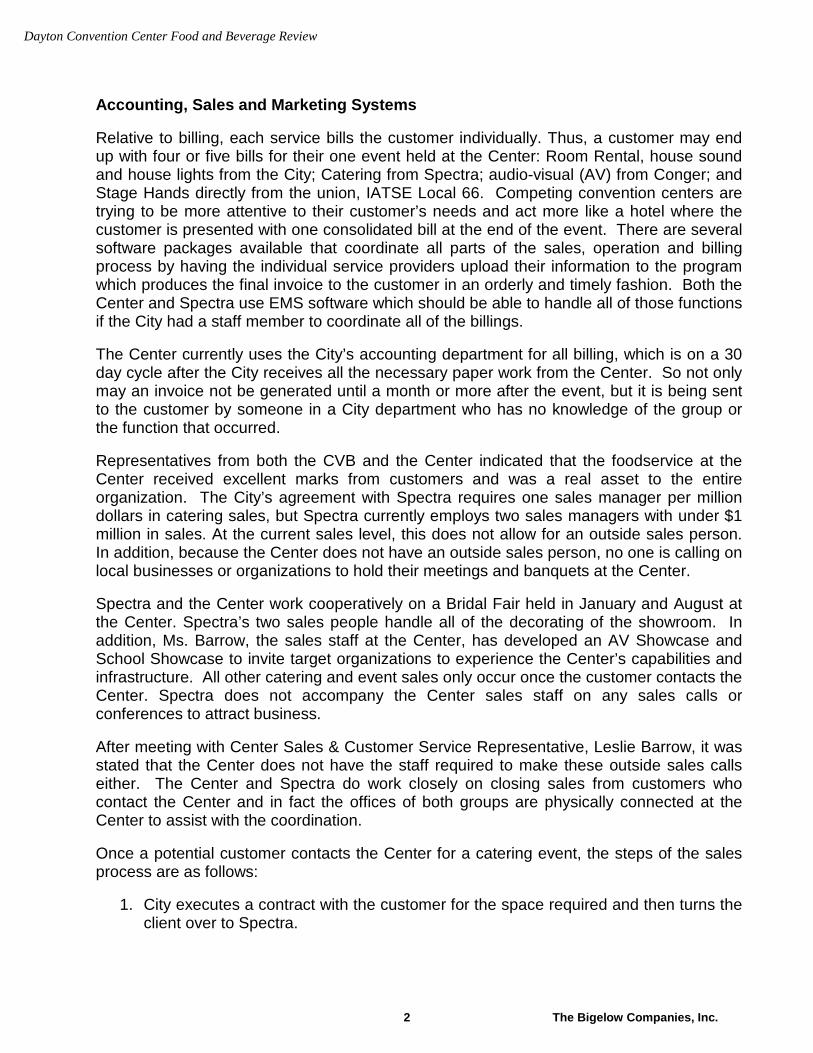
Dayton Convention Center Food and Beverage Review
2 The Bigelow Companies, Inc.
Accounting, Sales and Marketing Systems
Relative to billing, each service bills the customer individually. Thus, a customer may end up with four or five bills for their one event held at the Center: Room Rental, house sound and house lights from the City; Catering from Spectra; audio-visual (AV) from Conger; and Stage Hands directly from the union, IATSE Local 66. Competing convention centers are trying to be more attentive to their customer’s needs and act more like a hotel where the customer is presented with one consolidated bill at the end of the event. There are several software packages available that coordinate all parts of the sales, operation and billing process by having the individual service providers upload their information to the program which produces the final invoice to the customer in an orderly and timely fashion. Both the Center and Spectra use EMS software which should be able to handle all of those functions if the City had a staff member to coordinate all of the billings.
The Center currently uses the City’s accounting department for all billing, which is on a 30 day cycle after the City receives all the necessary paper work from the Center. So not only may an invoice not be generated until a month or more after the event, but it is being sent to the customer by someone in a City department who has no knowledge of the group or the function that occurred.
Representatives from both the CVB and the Center indicated that the foodservice at the Center received excellent marks from customers and was a real asset to the entire organization. The City’s agreement with Spectra requires one sales manager per million dollars in catering sales, but Spectra currently employs two sales managers with under $1 million in sales. At the current sales level, this does not allow for an outside sales person. In addition, because the Center does not have an outside sales person, no one is calling on local businesses or organizations to hold their meetings and banquets at the Center.
Spectra and the Center work cooperatively on a Bridal Fair held in January and August at the Center. Spectra’s two sales people handle all of the decorating of the showroom. In addition, Ms. Barrow, the sales staff at the Center, has developed an AV Showcase and School Showcase to invite target organizations to experience the Center’s capabilities and infrastructure. All other catering and event sales only occur once the customer contacts the Center. Spectra does not accompany the Center sales staff on any sales calls or conferences to attract business.
After meeting with Center Sales & Customer Service Representative, Leslie Barrow, it was stated that the Center does not have the staff required to make these outside sales calls either. The Center and Spectra do work closely on closing sales from customers who contact the Center and in fact the offices of both groups are physically connected at the Center to assist with the coordination.
Once a potential customer contacts the Center for a catering event, the steps of the sales process are as follows:
1. City executes a contract with the customer for the space required and then turns the client over to Spectra.
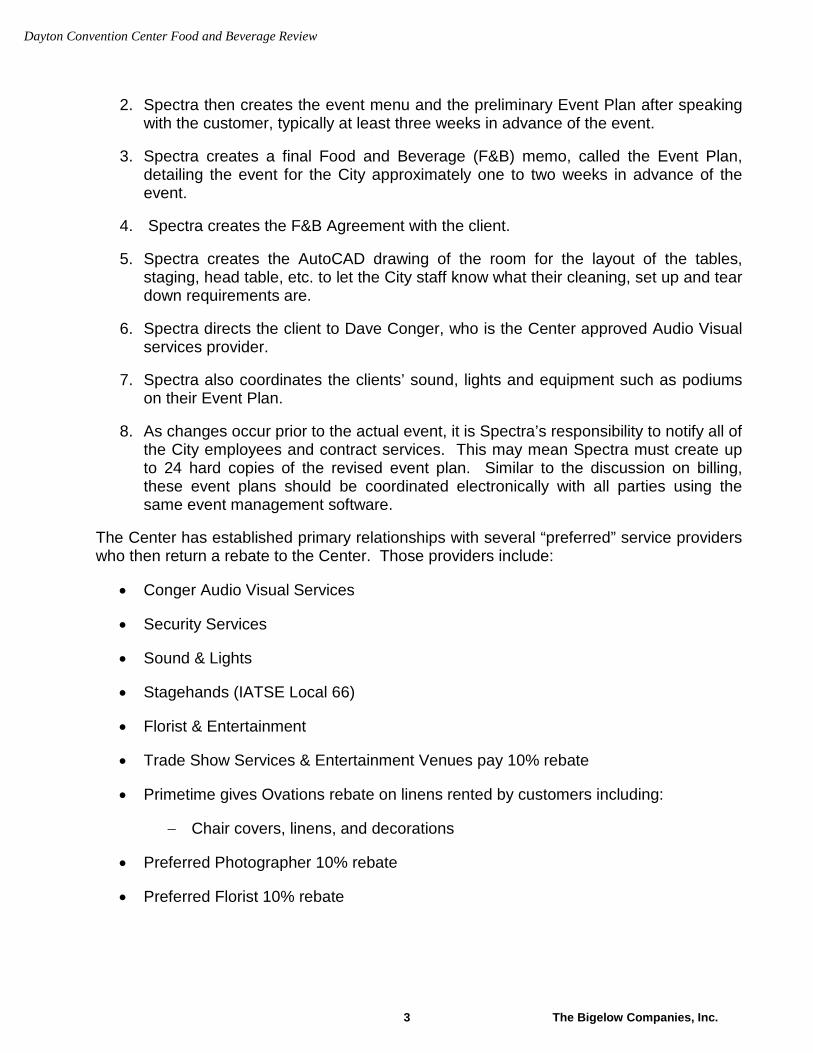
Dayton Convention Center Food and Beverage Review
3 The Bigelow Companies, Inc.
2. Spectra then creates the event menu and the preliminary Event Plan after speaking with the customer, typically at least three weeks in advance of the event.
3. Spectra creates a final Food and Beverage (F&B) memo, called the Event Plan, detailing the event for the City approximately one to two weeks in advance of the event.
4. Spectra creates the F&B Agreement with the client.
5. Spectra creates the AutoCAD drawing of the room for the layout of the tables, staging, head table, etc. to let the City staff know what their cleaning, set up and tear down requirements are.
6. Spectra directs the client to Dave Conger, who is the Center approved Audio Visual services provider.
7. Spectra also coordinates the clients’ sound, lights and equipment such as podiums on their Event Plan.
8. As changes occur prior to the actual event, it is Spectra’s responsibility to notify all of the City employees and contract services. This may mean Spectra must create up to 24 hard copies of the revised event plan. Similar to the discussion on billing, these event plans should be coordinated electronically with all parties using the same event management software.
The Center has established primary relationships with several “preferred” service providers who then return a rebate to the Center. Those providers include:
• Conger Audio Visual Services
• Security Services
• Sound & Lights
• Stagehands (IATSE Local 66)
• Florist & Entertainment
• Trade Show Services & Entertainment Venues pay 10% rebate
• Primetime gives Ovations rebate on linens rented by customers including:
− Chair covers, linens, and decorations
• Preferred Photographer 10% rebate
• Preferred Florist 10% rebate
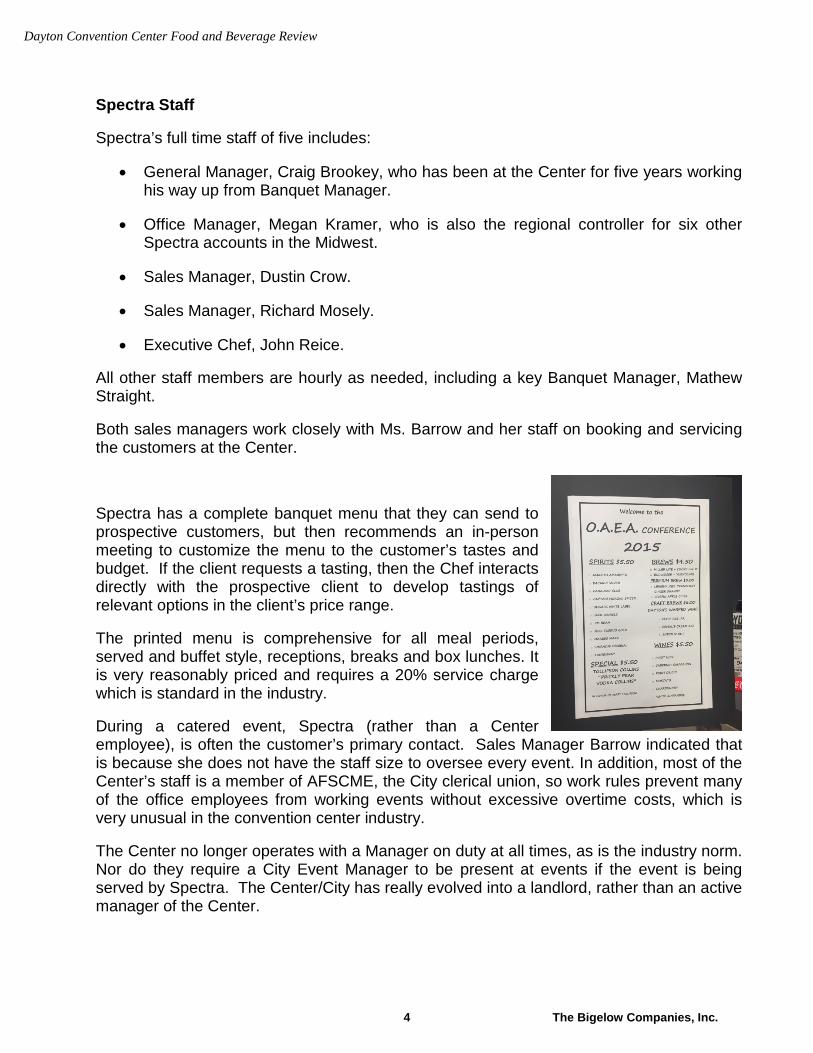
Dayton Convention Center Food and Beverage Review
4 The Bigelow Companies, Inc.
Spectra Staff
Spectra’s full time staff of five includes:
• General Manager, Craig Brookey, who has been at the Center for five years working his way up from Banquet Manager.
• Office Manager, Megan Kramer, who is also the regional controller for six other Spectra accounts in the Midwest.
• Sales Manager, Dustin Crow.
• Sales Manager, Richard Mosely.
• Executive Chef, John Reice.
All other staff members are hourly as needed, including a key Banquet Manager, Mathew Straight.
Both sales managers work closely with Ms. Barrow and her staff on booking and servicing the customers at the Center.
Spectra has a complete banquet menu that they can send to prospective customers, but then recommends an in-person meeting to customize the menu to the customer’s tastes and budget. If the client requests a tasting, then the Chef interacts directly with the prospective client to develop tastings of relevant options in the client’s price range.
The printed menu is comprehensive for all meal periods, served and buffet style, receptions, breaks and box lunches. It is very reasonably priced and requires a 20% service charge which is standard in the industry.
During a catered event, Spectra (rather than a Center employee), is often the customer’s primary contact. Sales Manager Barrow indicated that is because she does not have the staff size to oversee every event. In addition, most of the Center’s staff is a member of AFSCME, the City clerical union, so work rules prevent many of the office employees from working events without excessive overtime costs, which is very unusual in the convention center industry.
The Center no longer operates with a Manager on duty at all times, as is the industry norm. Nor do they require a City Event Manager to be present at events if the event is being served by Spectra. The Center/City has really evolved into a landlord, rather than an active manager of the Center.

Dayton Convention Center Food and Beverage Review
5 The Bigelow Companies, Inc.
The Center does send out an exit survey to each customer covering foodservice along with other services at the Center. In 2013, the most recent year we were provided, 42 customers responded to surveys ranking items as poor, fair, good, very good or excellent. Foodservice categories received the following combined Excellent and Very Good ranking; 66.6% Quality of Foodservice, 71.4% Portion Size, 78.6% Presentation, 85.4% Quality and 76% for Overall Foodservice. Those are very positive ratings and the Center, along with Spectra, should track the subsequent years and monitor the progress to even more positive ratings.
The largest event the Center caters is their annual community Thanksgiving dinner for 8,500 guests all served in three hours by 500 volunteers. Much of the food is donated. It is all prepared on-site and served from 12 buffet lines, which are constantly replenished over the course of the three hours.
It appears that the Center is under-utilized which is partially attributable to the lack of adjacent hotels (there is only one) within walking distance to the Center. A second reason is the limited staff, time and resources of Spectra and the City. City representatives claim they cannot hire additional sales people (the Center was formerly staffed with up to 45 people, which is currently down to 11) and Spectra’s two sales people are performing roles, such as developing room set up and event management, normally performed by Center personnel. This staffing situation leaves no one to proactively call on potential catering customers. In addition, neither the Spectra nor the Center sales force is incentivized with commissions to grow their business. Catering sales personnel in most hotels and convention centers are commissioned employees and we would recommend that for Dayton as well.
The Center has established some sales programs to grow business including waiving room rentals when food and beverage reach certain minimums, 50% discount for rentals lasting less than four hours and lower rental rates during non-peak seasons. All of these programs are good and should continue to be monitored.
Ms. Barrow also shared these statistics with us:
• Incoming phone calls are their biggest source of sales.
• Without a headquarters hotel with committable rooms and comparable adjacent rooms, the City or CVB need to subsidize transportation to make the Center viable to groups that have to house their attendees throughout the County.
Ms. Barrow is the only Center representative that travels outside of the venue to recruit business. She wanted to attend the Religious Conference Management Association convention which is a parent organization for many religious conferences, a prime market for the Center, but indicated her budget would not allow that. She has made contacts with the Ohio State Association of Association Executives and Rejuvenate (another religious meeting company).
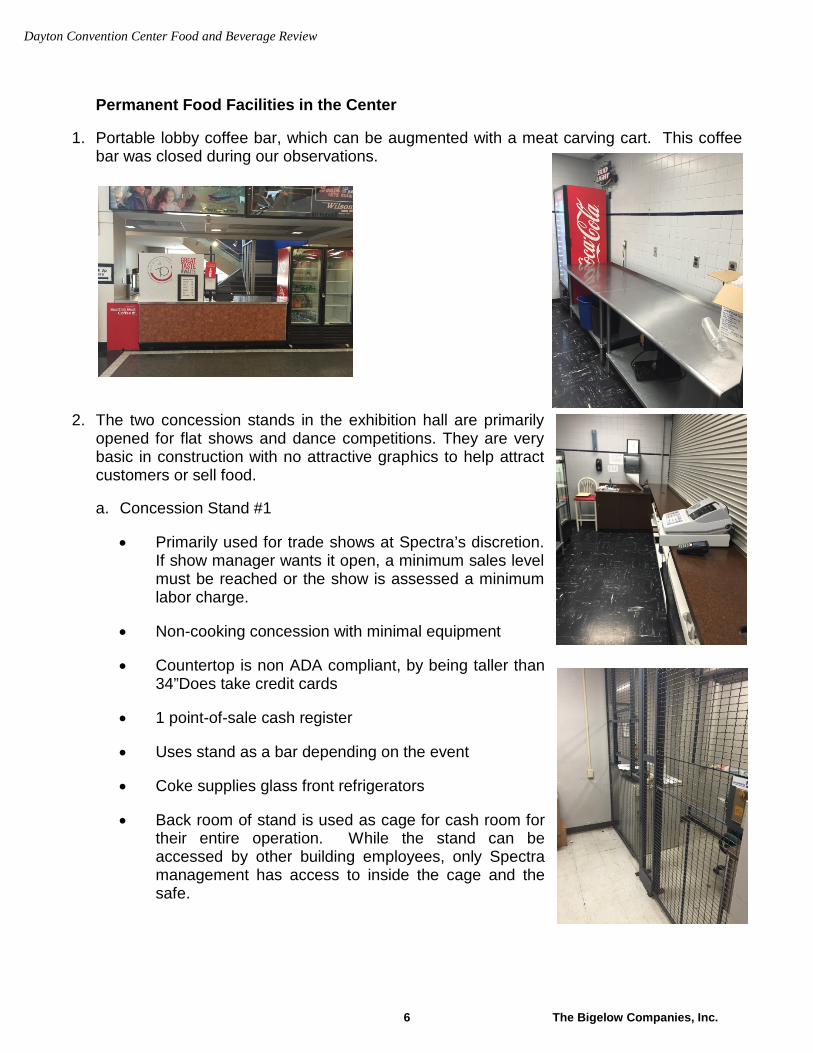
Dayton Convention Center Food and Beverage Review
6 The Bigelow Companies, Inc.
Permanent Food Facilities in the Center
1. Portable lobby coffee bar, which can be augmented with a meat carving cart. This coffee bar was closed during our observations.
2. The two concession stands in the exhibition hall are primarily opened for flat shows and dance competitions. They are very basic in construction with no attractive graphics to help attract customers or sell food.
a. Concession Stand #1
• Primarily used for trade shows at Spectra’s discretion. If show manager wants it open, a minimum sales level must be reached or the show is assessed a minimum labor charge.
• Non-cooking concession with minimal equipment
• Countertop is non ADA compliant, by being taller than 34”Does take credit cards
• 1 point-of-sale cash register
• Uses stand as a bar depending on the event
• Coke supplies glass front refrigerators
• Back room of stand is used as cage for cash room for their entire operation. While the stand can be accessed by other building employees, only Spectra management has access to inside the cage and the safe.
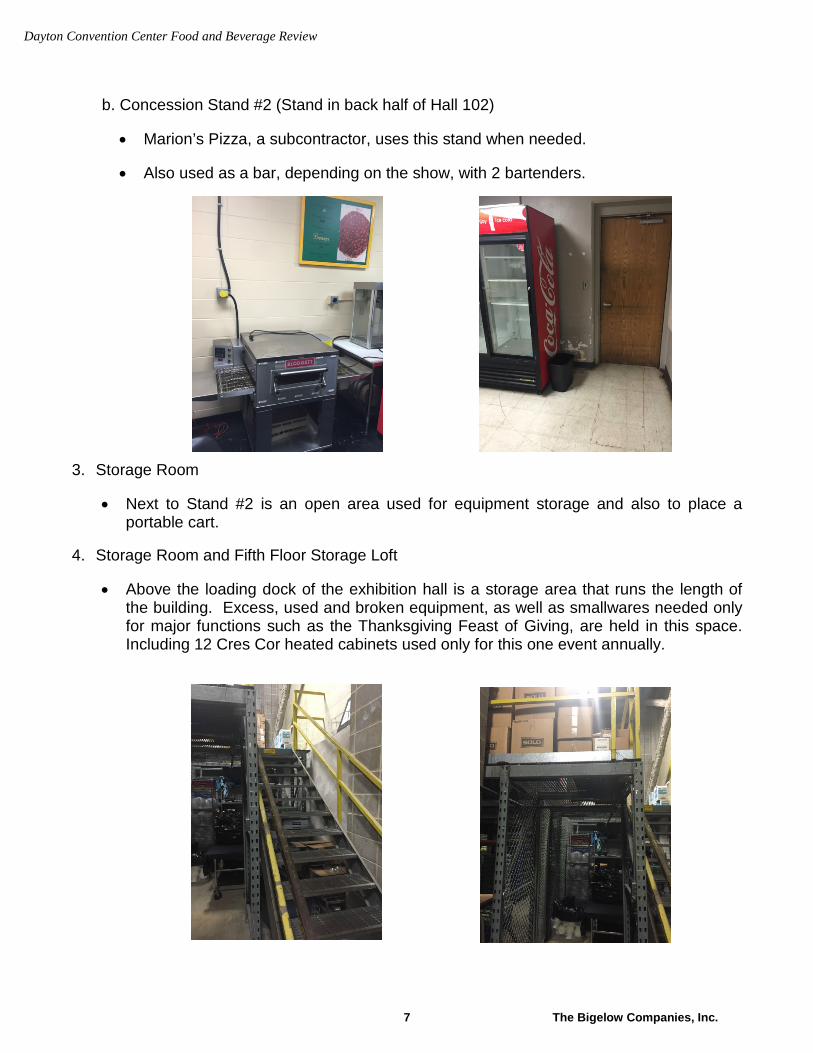
Dayton Convention Center Food and Beverage Review
7 The Bigelow Companies, Inc.
b. Concession Stand #2 (Stand in back half of Hall 102)
• Marion’s Pizza, a subcontractor, uses this stand when needed.
• Also used as a bar, depending on the show, with 2 bartenders.
3. Storage Room
• Next to Stand #2 is an open area used for equipment storage and also to place a portable cart.
4. Storage Room and Fifth Floor Storage Loft
• Above the loading dock of the exhibition hall is a storage area that runs the length of the building. Excess, used and broken equipment, as well as smallwares needed only for major functions such as the Thanksgiving Feast of Giving, are held in this space. Including 12 Cres Cor heated cabinets used only for this one event annually.
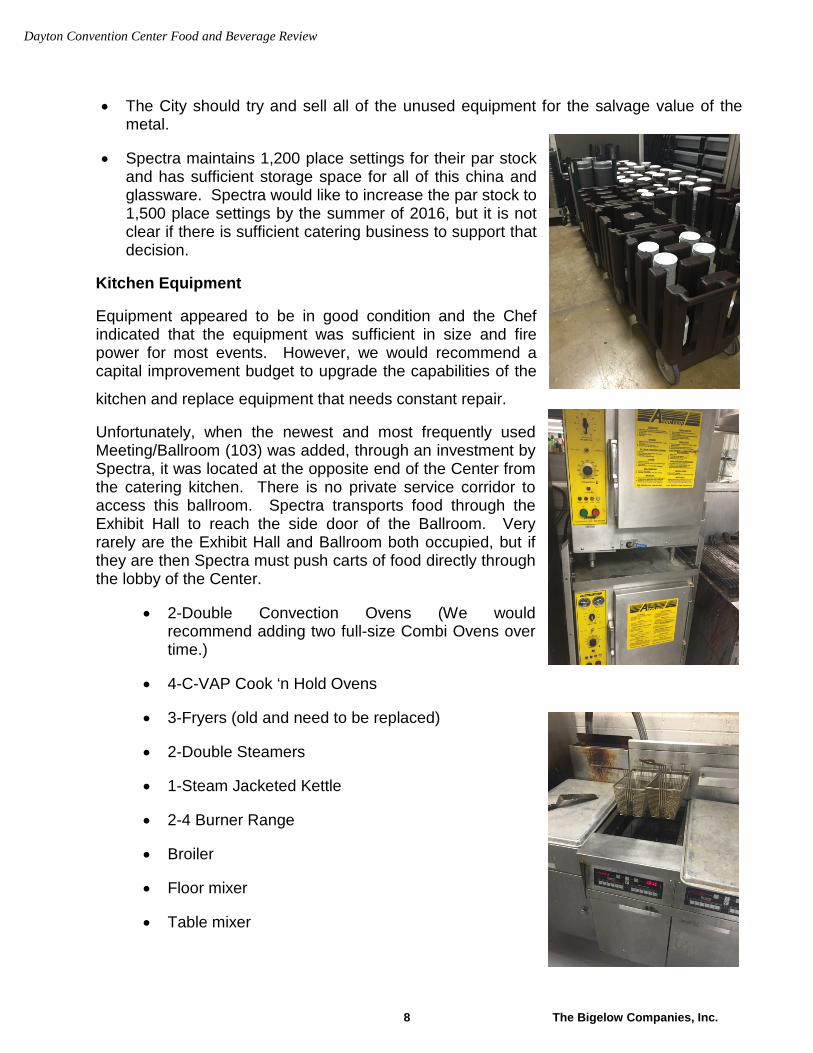
Dayton Convention Center Food and Beverage Review
8 The Bigelow Companies, Inc.
• The City should try and sell all of the unused equipment for the salvage value of the metal.
• Spectra maintains 1,200 place settings for their par stock and has sufficient storage space for all of this china and glassware. Spectra would like to increase the par stock to 1,500 place settings by the summer of 2016, but it is not clear if there is sufficient catering business to support that decision.
Kitchen Equipment
Equipment appeared to be in good condition and the Chef indicated that the equipment was sufficient in size and fire power for most events. However, we would recommend a capital improvement budget to upgrade the capabilities of the
kitchen and replace equipment that needs constant repair.
Unfortunately, when the newest and most frequently used Meeting/Ballroom (103) was added, through an investment by Spectra, it was located at the opposite end of the Center from the catering kitchen. There is no private service corridor to access this ballroom. Spectra transports food through the Exhibit Hall to reach the side door of the Ballroom. Very rarely are the Exhibit Hall and Ballroom both occupied, but if they are then Spectra must push carts of food directly through the lobby of the Center.
• 2-Double Convection Ovens (We would recommend adding two full-size Combi Ovens over time.)
• 4-C-VAP Cook ‘n Hold Ovens
• 3-Fryers (old and need to be replaced)
• 2-Double Steamers
• 1-Steam Jacketed Kettle
• 2-4 Burner Range
• Broiler
• Floor mixer
• Table mixer
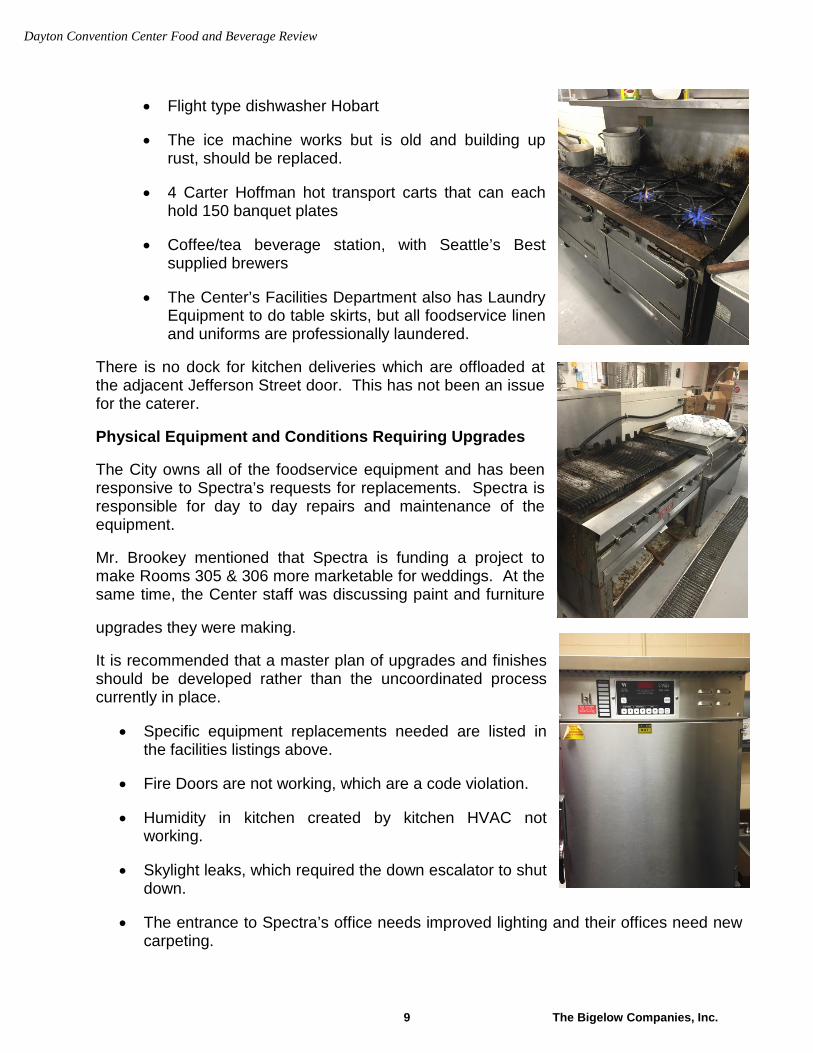
Dayton Convention Center Food and Beverage Review
9 The Bigelow Companies, Inc.
• Flight type dishwasher Hobart
• The ice machine works but is old and building up rust, should be replaced.
• 4 Carter Hoffman hot transport carts that can each hold 150 banquet plates
• Coffee/tea beverage station, with Seattle’s Best supplied brewers
• The Center’s Facilities Department also has Laundry Equipment to do table skirts, but all foodservice linen and uniforms are professionally laundered.
There is no dock for kitchen deliveries which are offloaded at the adjacent Jefferson Street door. This has not been an issue for the caterer.
Physical Equipment and Conditions Requiring Upgrades
The City owns all of the foodservice equipment and has been responsive to Spectra’s requests for replacements. Spectra is responsible for day to day repairs and maintenance of the equipment.
Mr. Brookey mentioned that Spectra is funding a project to make Rooms 305 & 306 more marketable for weddings. At the same time, the Center staff was discussing paint and furniture
upgrades they were making.
It is recommended that a master plan of upgrades and finishes should be developed rather than the uncoordinated process currently in place.
• Specific equipment replacements needed are listed in the facilities listings above.
• Fire Doors are not working, which are a code violation.
• Humidity in kitchen created by kitchen HVAC not working.
• Skylight leaks, which required the down escalator to shut down.
• The entrance to Spectra’s office needs improved lighting and their offices need new carpeting.

Dayton Convention Center Food and Beverage Review
10 The Bigelow Companies, Inc.
• More permanent screening should be developed to close off equipment and vacant spaces from the customer’s sight during events.
Secret Shopper Services
During the Art Educators convention Chris Bigelow attended two of the catered functions and observed one of the luncheons with box lunches. His shopping observations follow.
Thursday November 5, 2015 Ohio Art Educators Box Lunches, Main Foyer
• Boxes were displayed around the atrium railing, separated by menu type
• Spectra employees were present to assist the guest with their choices and questions
• Guests requested Gluten Free meals and these requests were promptly handled by the attendants at the food tables.
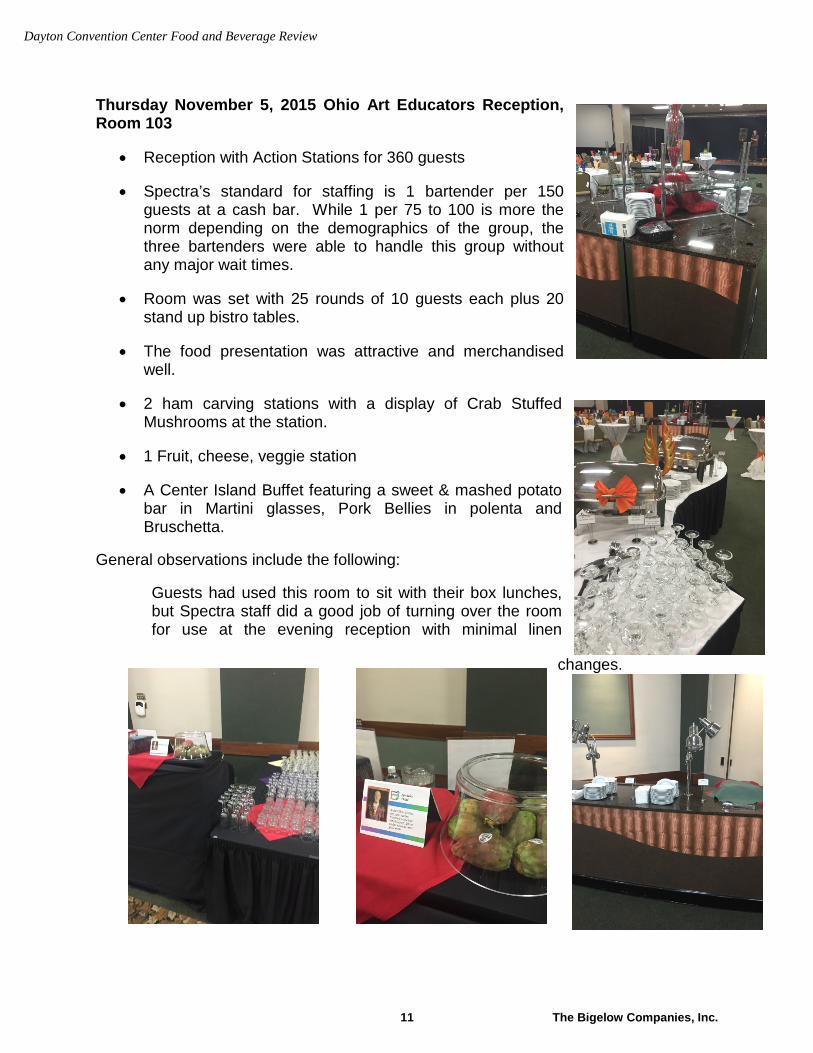
Dayton Convention Center Food and Beverage Review
11 The Bigelow Companies, Inc.
Thursday November 5, 2015 Ohio Art Educators Reception, Room 103
• Reception with Action Stations for 360 guests
• Spectra’s standard for staffing is 1 bartender per 150 guests at a cash bar. While 1 per 75 to 100 is more the norm depending on the demographics of the group, the three bartenders were able to handle this group without any major wait times.
• Room was set with 25 rounds of 10 guests each plus 20 stand up bistro tables.
• The food presentation was attractive and merchandised well.
• 2 ham carving stations with a display of Crab Stuffed Mushrooms at the station.
• 1 Fruit, cheese, veggie station
• A Center Island Buffet featuring a sweet & mashed potato bar in Martini glasses, Pork Bellies in polenta and Bruschetta.
General observations include the following:
Guests had used this room to sit with their box lunches, but Spectra staff did a good job of turning over the room for use at the evening reception with minimal linen
changes.
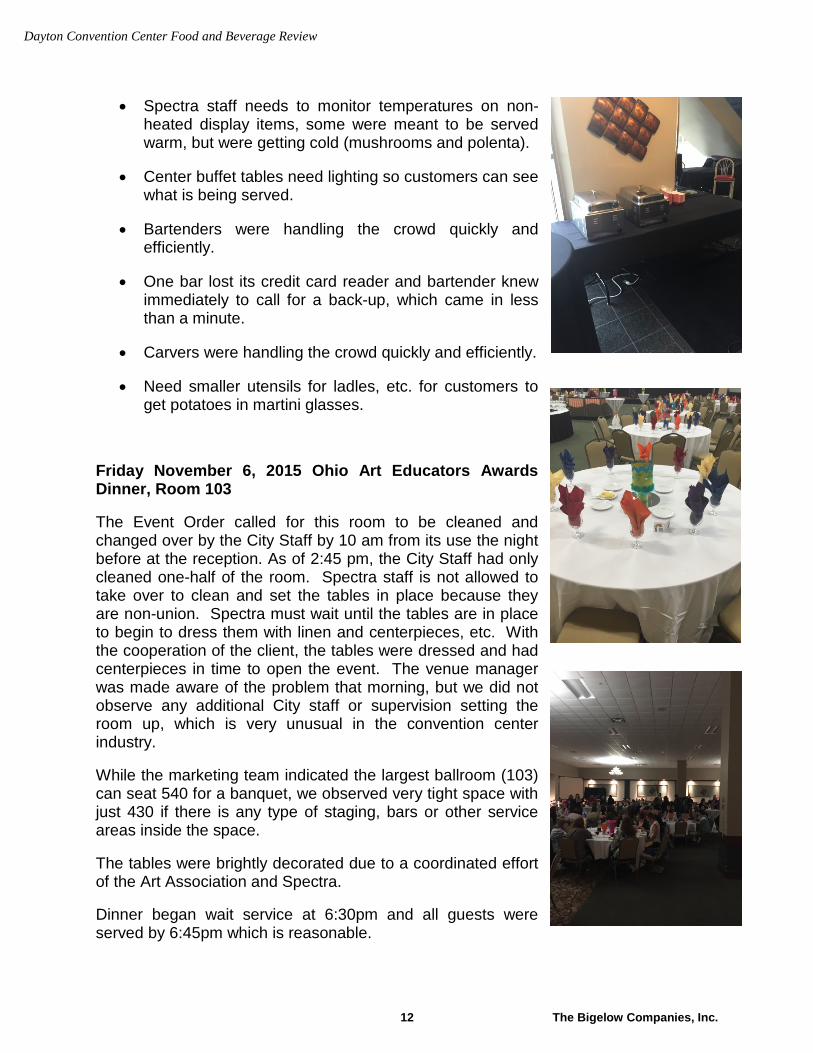
Dayton Convention Center Food and Beverage Review
12 The Bigelow Companies, Inc.
• Spectra staff needs to monitor temperatures on non-heated display items, some were meant to be served warm, but were getting cold (mushrooms and polenta).
• Center buffet tables need lighting so customers can see what is being served.
• Bartenders were handling the crowd quickly and efficiently.
• One bar lost its credit card reader and bartender knew immediately to call for a back-up, which came in less than a minute.
• Carvers were handling the crowd quickly and efficiently.
• Need smaller utensils for ladles, etc. for customers to get potatoes in martini glasses.
Friday November 6, 2015 Ohio Art Educators Awards Dinner, Room 103
The Event Order called for this room to be cleaned and changed over by the City Staff by 10 am from its use the night before at the reception. As of 2:45 pm, the City Staff had only cleaned one-half of the room. Spectra staff is not allowed to take over to clean and set the tables in place because they are non-union. Spectra must wait until the tables are in place to begin to dress them with linen and centerpieces, etc. With the cooperation of the client, the tables were dressed and had centerpieces in time to open the event. The venue manager was made aware of the problem that morning, but we did not observe any additional City staff or supervision setting the room up, which is very unusual in the convention center industry.
While the marketing team indicated the largest ballroom (103) can seat 540 for a banquet, we observed very tight space with just 430 if there is any type of staging, bars or other service areas inside the space.
The tables were brightly decorated due to a coordinated effort of the Art Association and Spectra.
Dinner began wait service at 6:30pm and all guests were served by 6:45pm which is reasonable.
Dayton Convention Center Food and Beverage Review
13 The Bigelow Companies, Inc.
Guests at my table all had positive comments about the food (which was a $23.95 Grilled Chicken or Portabella Mushroom w/salad & dressing, vegetable and dessert) and service.
Overall Summary of Conclusions
The major issues we observed and detailed in the report include:
1. Greater sales effort is required by the Center to drive additional business.
2. While Spectra is willing to increase their sales efforts, they will need to reduce their other operating costs by having the Center assume their normal sales, contracting and event supervision activities.
3. Spectra has a very responsive staff that is serving the Center well and producing a very good product.
4. A coordinated effort for room enhancements, décor and equipment is needed between both parties, so as not to conflict with a major remodel.
5. An annual capital plan is needed to upgrade retail (concession) spaces and graphics and replace older kitchen equipment.