Embed Size (px)
Citation preview
2 0 1 5 R e s u l t s
N e w s R e l e a s e
Page 1 of 15
Strong growth in revenue and earnings
Essilor focused on its 2018 objectives
Like-for-like revenue up 4.6%
Powerful momentum in the Lenses & Optical Instruments division, driven by innovation and
consumer marketing
Faster growth in Sunwear sales and ramp-up of the Online business
19 new acquisitions and partnerships
Further growth in contribution from operations1, to 18.8% of revenue
Charenton-le-Pont, France (February 19, 2016 – 6:30 am) – The Board of Directors of Essilor International
met yesterday to approve the financial statements for the year ended December 31, 2015. The financial
statements have been audited and the auditors are currently in the process of issuing their report.
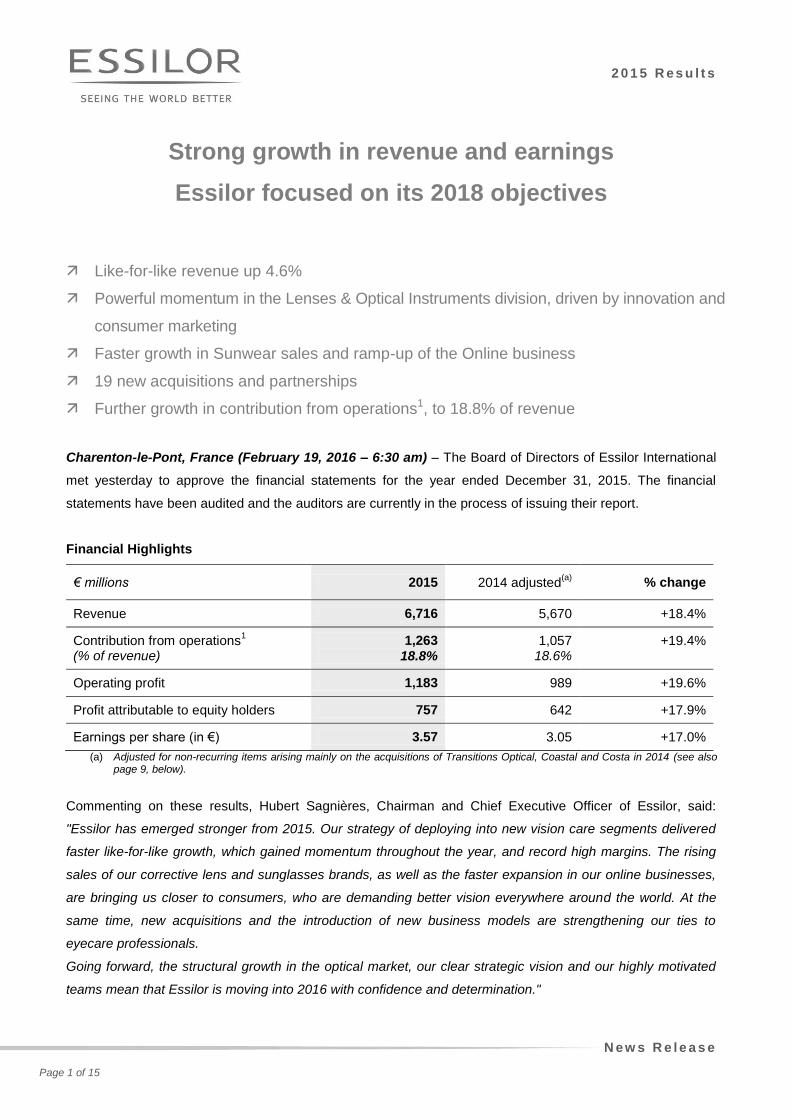
Financial Highlights
€ millions 2015 2014 adjusted(a)
% change
Revenue 6,716 5,670 +18.4%
Contribution from operations1
(% of revenue) 1,263
18.8% 1,057
18.6% +19.4%
Operating profit 1,183 989 +19.6%
Profit attributable to equity holders 757 642 +17.9%
Earnings per share (in €) 3.57 3.05 +17.0%
(a) Adjusted for non-recurring items arising mainly on the acquisitions of Transitions Optical, Coastal and Costa in 2014 (see also page 9, below).
Commenting on these results, Hubert Sagnières, Chairman and Chief Executive Officer of Essilor, said:
"Essilor has emerged stronger from 2015. Our strategy of deploying into new vision care segments delivered
faster like-for-like growth, which gained momentum throughout the year, and record high margins. The rising
sales of our corrective lens and sunglasses brands, as well as the faster expansion in our online businesses,
are bringing us closer to consumers, who are demanding better vision everywhere around the world. At the
same time, new acquisitions and the introduction of new business models are strengthening our ties to
eyecare professionals.
Going forward, the structural growth in the optical market, our clear strategic vision and our highly motivated
teams mean that Essilor is moving into 2016 with confidence and determination."
2 0 1 5 R e s u l t s
N e w s R e l e a s e
Page 2 of 15
In 2015, the optical market continued to be driven by demand from the world's ageing populations and unmet
vision needs. During the year, Essilor pursued the strategy of broadening its playing field initiated in 2014,
while continuing to implement a dynamic innovation policy and its unique partnership model.
These initiatives further expanded its presence in the global corrective lens market, with sales improvement
evenly distributed between developed and fast-growing countries.
In addition, the Company continued to expand its online business through existing websites, which are
enjoying strong growth overall, and by rolling out solutions in new countries, such as China and Brazil. The
sunwear strategy was also pursued during the year, with two new acquisitions and the rapid development of
Costa® sunglasses in the United States and the Bolon™ brand in China.
The 2015 results were also shaped by the following factors:
An acceleration in like-for-like revenue growth, to 4.6%, led by a robust Lenses & Optical Instruments
division (up 4.8%) and a record performance by the Sunglasses & Readers division (up 7.3%).
The success of the value-added lenses in the Crizal®, Varilux
®, Transitions
® and Xperio
® lines,
supported by the aggregate investment of around €203 million in more extensive consumer marketing
campaigns across the business base.
The completion of 19 new acquisitions representing total full-year revenue of around €214 million.
A historically high contribution from operations1, at 18.8% of revenue, illustrating Essilor's ability to
leverage its operating performance and the synergies from acquired companies to finance its
additional marketing expenditure and to offset the dilution stemming from organic acquisitions2.
Strong free cash flow, which has risen by an average 13% a year over the last three years, to
€867 million in 2015.
Dividend
In light of its confidence in the Company's outlook, the Board of Directors recommends that shareholders at
the Annual Meeting on May 11, 2016 approve the payment of a dividend of €1.11 per share, an increase of
8.8% compared with the 2014 dividend. Shareholders will be offered the option of receiving their dividend in
cash or in shares. The dividend will be paid – or the shares issued – as from June 8, 2016.
Outlook
In 2016, Essilor intends to step up its deployment in the field of vision care by developing new lens products
and services, continuing to invest in consumer marketing and driving faster growth in the Sunwear and Online
segments.
The Company expects full-year revenue growth, at constant exchange rates, to exceed 8%, including a like-
for-like gain of around 5%. Excluding any new strategic acquisitions, it is targeting a contribution from
operations1 of at least 18.8% of revenue.
--------------------------- 1 Contribution from operations corresponds to revenue less cost of sales and operating expenses (research and development costs,
selling and distribution costs and other operating expenses). 2 Local acquisitions or partnerships.
2 0 1 5 R e s u l t s
N e w s R e l e a s e
Page 3 of 15
Going forward towards Essilor's medium-term 2018 objectives, the broadening of the playing field and
increasing proximity with consumers should continue to drive faster like-for-like revenue growth (in excess of
6% in 2018) and boost profitability.
Practical information
A meeting with analysts will be held in Paris today, February 19, at 10:00 am CET.
The meeting webcast may be viewed live or as a recording at:
http://hosting.3sens.com/Essilor/20160219-C97B6D80/en/
The presentation may be viewed at:
http://www.essilor.com/en/Investors/Pages/PublicationsDownloads.aspx
Forthcoming investor events
April 21, 2016: First-quarter 2016 revenue
May 11, 2016: Annual Shareholders' Meeting, at 10:30 am at Maison de la Mutualité in Paris, France
About Essilor
The world's leading ophthalmic optics company, Essilor designs, manufactures and markets a wide range of lenses to
improve and protect eyesight. Its mission is to improve lives by improving sight. To support this mission, Essilor allocates
more than €200 million to research and innovation every year, in a commitment to continuously bring new, more effective
products to market. Its flagship brands are Varilux®, Crizal
®, Transitions
®, Eyezen
TM, Xperio
®, Foster Grant
®, Bolon
TM and
Costa®. It also develops and markets equipment, instruments and services for eyecare professionals.
Essilor reported consolidated revenue of more than €6.7 billion in 2015 and employs 61,000 people worldwide. It markets
its products in more than 100 countries and has 32 plants, 490 prescription laboratories and edging facilities, as well as 5
research and development centers around the world. For more information, please visit www.essilor.com.
The Essilor share trades on the Euronext Paris market and is included in the Euro Stoxx 50 and CAC 40 indices.
Codes and symbols: ISIN: FR0000121667; Reuters: ESSI.PA; Bloomberg: EI:FP.
CONTACTS
Investor Relations
Véronique Gillet – Sébastien Leroy
Ariel Bauer
Tel.: +33 (0)1 49 77 42 16
Corporate Communications
Lucia Dumas
Tel.: +33 (0)1 49 77 45 02
Media Relations
Maïlis Thiercelin
Tel.: +33 (0)1 49 77 45 02
2 0 1 5 R e s u l t s
N e w s R e l e a s e
Page 4 of 15
EXCERPTS FROM THE MANAGEMENT REPORT
BY THE BOARD OF DIRECTORS – FEBRUARY 18, 2016
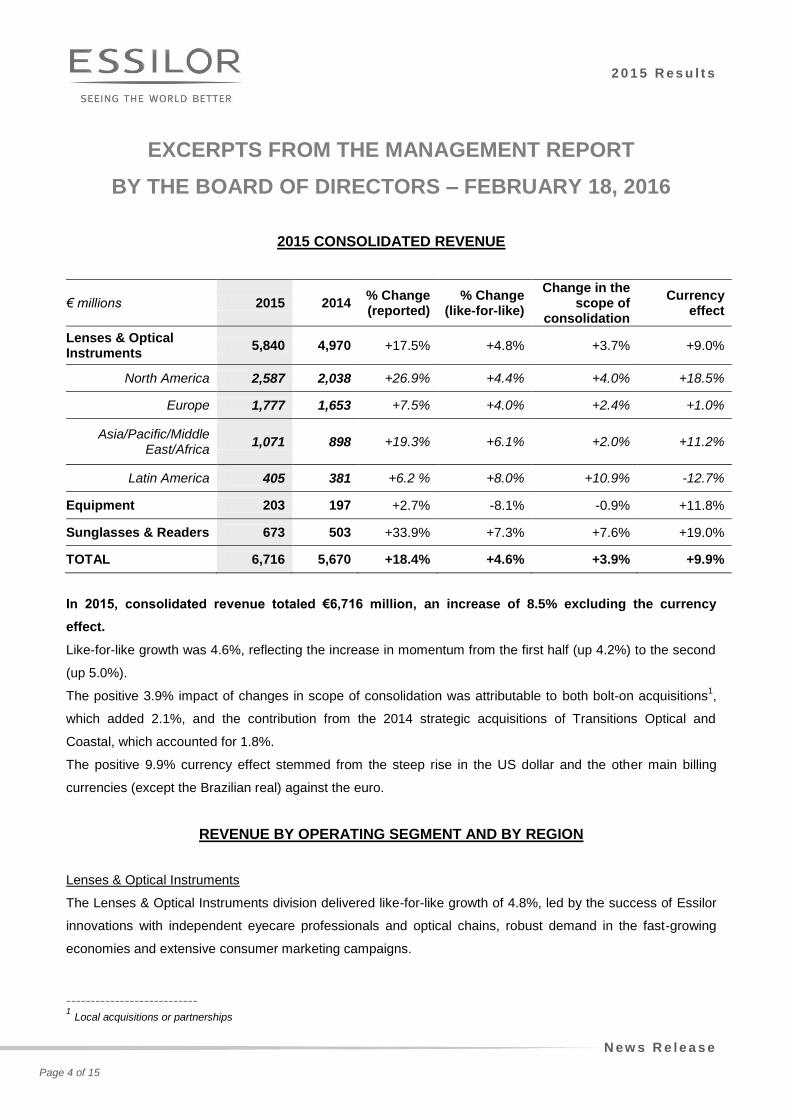
2015 CONSOLIDATED REVENUE
€ millions 2015 2014 % Change (reported)
% Change (like-for-like)
Change in the scope of
consolidation
Currency effect
Lenses & Optical Instruments
5,840 4,970 +17.5% +4.8% +3.7% +9.0%
North America 2,587 2,038 +26.9% +4.4% +4.0% +18.5%
Europe 1,777 1,653 +7.5% +4.0% +2.4% +1.0%
Asia/Pacific/Middle East/Africa
1,071 898 +19.3% +6.1% +2.0% +11.2%
Latin America 405 381 +6.2 % +8.0% +10.9% -12.7%
Equipment 203 197 +2.7% -8.1% -0.9% +11.8%
Sunglasses & Readers 673 503 +33.9% +7.3% +7.6% +19.0%
TOTAL 6,716 5,670 +18.4% +4.6% +3.9% +9.9%
In 2015, consolidated revenue totaled €6,716 million, an increase of 8.5% excluding the currency
effect.
Like-for-like growth was 4.6%, reflecting the increase in momentum from the first half (up 4.2%) to the second
(up 5.0%).
The positive 3.9% impact of changes in scope of consolidation was attributable to both bolt-on acquisitions1,
which added 2.1%, and the contribution from the 2014 strategic acquisitions of Transitions Optical and
Coastal, which accounted for 1.8%.
The positive 9.9% currency effect stemmed from the steep rise in the US dollar and the other main billing
currencies (except the Brazilian real) against the euro.
REVENUE BY OPERATING SEGMENT AND BY REGION
Lenses & Optical Instruments
The Lenses & Optical Instruments division delivered like-for-like growth of 4.8%, led by the success of Essilor
innovations with independent eyecare professionals and optical chains, robust demand in the fast-growing
economies and extensive consumer marketing campaigns.
--------------------------- 1 Local acquisitions or partnerships
2 0 1 5 R e s u l t s
N e w s R e l e a s e
Page 5 of 15
North America
Like-for-like growth was 4.4% in North America with sustained demand in the United States and Canada.
In the still expanding US market, lens volumes rose sharply as the steady roll-out of consumer advertising
campaigns spurred strong unit sales of high value-added Crizal®, Transitions
®, Varilux
® and Xperio
® lenses.
This momentum, plus the partnerships formed with two leading platforms for delivering services to
independent optometrists, helped to broaden the Company’s presence in this fast growing optical products
retailing segment.
The year also saw continued growth in demand from managed care organizations, in sales to independent
labs and in the contact lens distribution business. On the other hand, the performance with the large optical
chains was dampened by high prior-year comparatives.
Operations in Canada turned in solid results, led by product innovation and marketing campaigns, particularly
for Varilux® lenses.
Lastly, online sales climbed steeply overall, with very robust growth at EyeBuyDirect™ and Frames Direct™
and a steady upswing in sales via the Coastal™ websites (Clearly™ in Canada, Coastal™ in the United
States and Lensway™ in Europe) that steadily gained momentum as the months went by.
Europe
Operations in Europe enjoyed a markedly better year in 2015, with a 4.0% like-for-like gain on account of three
main factors.
First, the product mix improved as consumer marketing campaigns for the Crizal®, Varilux
® and Transitions
®
brands drove a noticeable increase in their unit sales. These investments helped drive Essilor's growth in the
United Kingdom, Russia and Eastern European countries, improve its positioning in the independent eyecare
market in Germany and defend its positions in France.
Second, business with key accounts continued to expand during the year as Essilor successfully leveraged
contracts to supply products and services to several optical chains, particularly in the United Kingdom and
Spain.
Lastly, the multi-network strategy demonstrated its effectiveness once again, with especially strong
momentum for Novacel in France, Nika in Germany, Omega in the Czech Republic and Nikon in the United
Kingdom.
Asia/Pacific/Middle East/Africa
Revenue from the Asia/Pacific/Middle East/Africa region rose by 6.1% like-for-like, as solid gains in the fast-
growing countries offset a more mixed performance in the mature markets. Operations in India had an
excellent year, led by the increase in nationwide coverage and the strong momentum for partner labs acquired
in recent years. Positions were broadened across the market thanks to the shift from glass to plastic lenses in
the entry range, the successful Kodak® media campaigns in the mid-tier and the high consumer awareness of
the Crizal®, Varilux
® and Transitions
® brands in the premium segment. Business in China continued to expand
in the domestic market, led by a solid performance in the premium end. Sales of Crizal® anti-reflective and
2 0 1 5 R e s u l t s
N e w s R e l e a s e
Page 6 of 15
Kodak® mid-range lenses were boosted by the media campaigns, while the photochromic lines enjoyed brisk
growth in a fast-expanding segment. Export sales turned upwards in the second half. Business was also good
in South Korea, supported by Varilux® progressive lenses, the Nikon
® brand and the Perfect UV solutions
from Chemi, Essilor's primary partner in the country. Southeast Asia posted double-digit revenue growth over
the year. Africa and the Middle East continued to offer strong potential, with major gains in Saudi Arabia,
Morocco and Turkey. In the region's developed markets, business was flat in Australia and New Zealand for
the year as a whole as the Australian economy cooled in the second half. Full-year sales in Japan came out
on a par with one year earlier following an uptick in performance in the second half of the year.
Latin America
Demand in Latin America gained momentum in every country except Brazil, driving an 8.0% like-for-like
increase in revenue for the year. In Brazil, overall growth was impacted by the ongoing recession and slowed
down especially in the second-half of the year. However, the Crizal® and Kodak
® brands bucked the trend with
excellent results thanks to successful media campaigns. The year's performance also showcased Essilor's
ability to capitalize on local output to strengthen positions in an otherwise depressed economy. Further gains
were made on the web with the launch of the glasses4you™ e-commerce platform and the fourth-quarter
acquisition of two leading online optical product retailers, e-lens and eÓtica.
Colombia saw an upsurge in sales driven by the consistent performance of the partnership with the
ServiOptica laboratory, and the launch of the Crizal® and Varilux
® marketing programs.
After a lackluster first half, operations in Mexico delivered much faster gains in the second half on the back of
economic recovery and promotional activity.
Business in Chile continued to benefit from the deployment of an integrated supply chain contract with a
leading regional optical chain.
In Costa Rica and Nicaragua, the partnership formed early in the year with integrated laboratory and
distributor Grupo Vision has widened access to Central America and brought Essilor closer to the end
customer.
Instruments
The Instruments division, which develops solutions and technology for optometrists and opticians, is included
in the operating regions of the Lenses and Optical Instruments division. It had a good year in 2015, with
revenue rising 5.2% like-for-like on gains in both the developed and fast-growing countries.
The performance reflected i) the robust market for refraction, screening and other optometry systems, where
the Company strengthened its presence, and ii) the strong sales of Neksia®, the leading mid-range edging
system.
Despite key account acclaim for the M’Eyefit® measuring tablet, business was more mixed in the sales support
segment. Lastly, sales of consumables and small devices rose slightly over the year.
2 0 1 5 R e s u l t s
N e w s R e l e a s e
Page 7 of 15
Equipment
The Equipment division ended the year down 8.1% like-for-like, but performance varied by region.
Demand trended upwards in the developed markets, as key accounts continued to purchase vacuum
treatment and surfacing machines. This is a segment where Satisloh's Duo-FLEX polisher is being gradually
replaced by its new generation Multi-FLEX model offering improved productivity and throughput. Sales were
also lifted by the sustained roll-out of the new ART™ alloy-free blocking technology.
The situation was more challenging in the fast growing economies, especially in Latin America, where the fall-
off in Brazilian orders offset the new business won in neighboring markets like Colombia, Argentina and Peru.
Lastly, as a result of Essilor’s dynamic acquisition policy, a significant portion of Equipment division revenue is
classified as intragroup sales. As these items are eliminated on consolidation, this has an adverse impact on
the division’s like-for-like and reported growth.
Sunglasses & Readers
Sunglasses & Readers sales gained momentum quarter-after-quarter in 2015, culminating in double-digit
growth in the second half and a 7.3% like-for-like increase for the year as a whole.
The annual performance reflects the positive shift in the sunglasses brand portfolio following the acquisition of
the Costa® brand in the United States and the Bolon™ brand in China. Heightening the awareness of these
brands during the year enabled Essilor to reach a larger number of consumers. Costa® has gradually
extended its line-up and is now positioned as the go-to sunglasses brand for all water-based activity
enthusiasts. While continuing to expand in China, Bolon™ is becoming an increasingly global brand, with its
first shelf space gained in leading duty-free chains in major Asian airports and on cruise ships. Online sales
and an increasing array of prescription sunlens solutions are also helping to drive faster growth at both brands.
Revenue also steadily picked up speed over the year at FGX, impelled by shelf space gains for its non-
prescription readers at two key accounts in the United States. For both chains, the company developed new
displays that considerably enhance the customer experience and increase purchase rates. Abroad, FGX also
had a more robust second half, particularly in Southern Europe.
2 0 1 5 R e s u l t s
N e w s R e l e a s e
Page 8 of 15
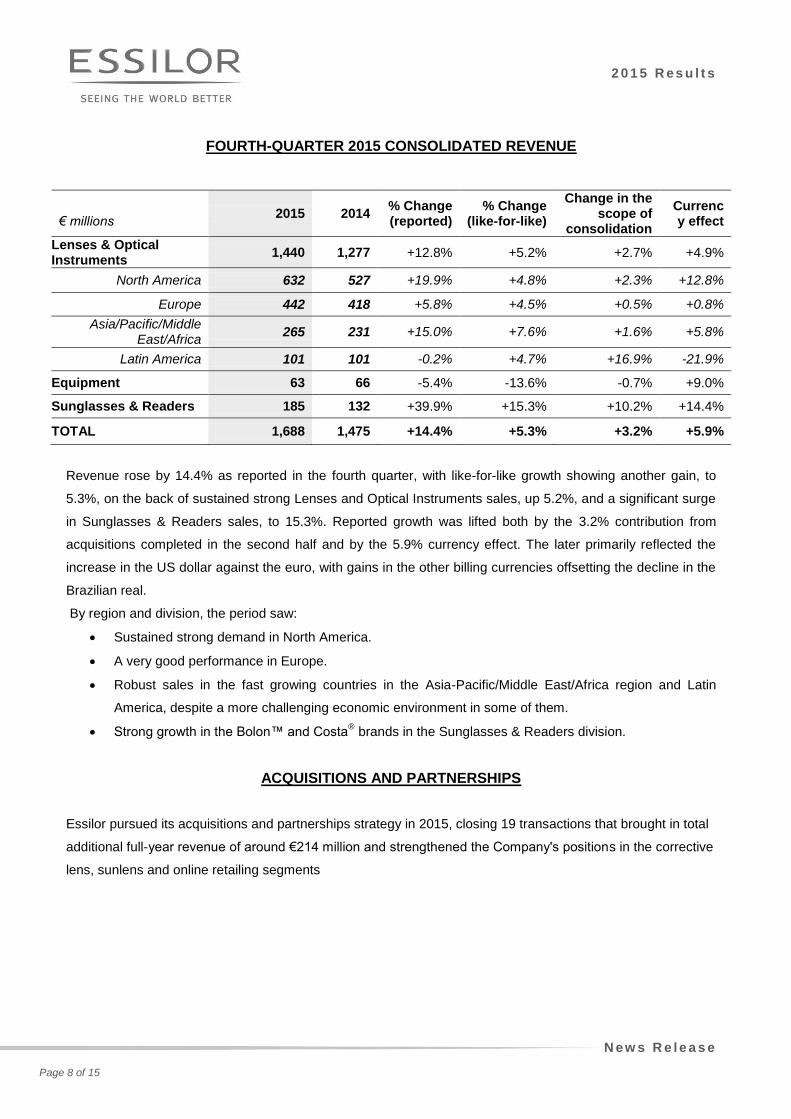
FOURTH-QUARTER 2015 CONSOLIDATED REVENUE
€ millions
2015 2014 % Change (reported)
% Change (like-for-like)
Change in the scope of
consolidation
Currency effect
Lenses & Optical Instruments
1,440 1,277 +12.8% +5.2% +2.7% +4.9%
North America 632 527 +19.9% +4.8% +2.3% +12.8%
Europe 442 418 +5.8% +4.5% +0.5% +0.8%
Asia/Pacific/Middle East/Africa
265 231 +15.0% +7.6% +1.6% +5.8%
Latin America 101 101 -0.2% +4.7% +16.9% -21.9%
Equipment 63 66 -5.4% -13.6% -0.7% +9.0%
Sunglasses & Readers 185 132 +39.9% +15.3% +10.2% +14.4%
TOTAL 1,688 1,475 +14.4% +5.3% +3.2% +5.9%
Revenue rose by 14.4% as reported in the fourth quarter, with like-for-like growth showing another gain, to
5.3%, on the back of sustained strong Lenses and Optical Instruments sales, up 5.2%, and a significant surge
in Sunglasses & Readers sales, to 15.3%. Reported growth was lifted both by the 3.2% contribution from
acquisitions completed in the second half and by the 5.9% currency effect. The later primarily reflected the
increase in the US dollar against the euro, with gains in the other billing currencies offsetting the decline in the
Brazilian real.
By region and division, the period saw:
Sustained strong demand in North America.
A very good performance in Europe.
Robust sales in the fast growing countries in the Asia-Pacific/Middle East/Africa region and Latin
America, despite a more challenging economic environment in some of them.
Strong growth in the Bolon™ and Costa® brands in the Sunglasses & Readers division.
ACQUISITIONS AND PARTNERSHIPS
Essilor pursued its acquisitions and partnerships strategy in 2015, closing 19 transactions that brought in total
additional full-year revenue of around €214 million and strengthened the Company's positions in the corrective
lens, sunlens and online retailing segments
2 0 1 5 R e s u l t s
N e w s R e l e a s e
Page 9 of 15
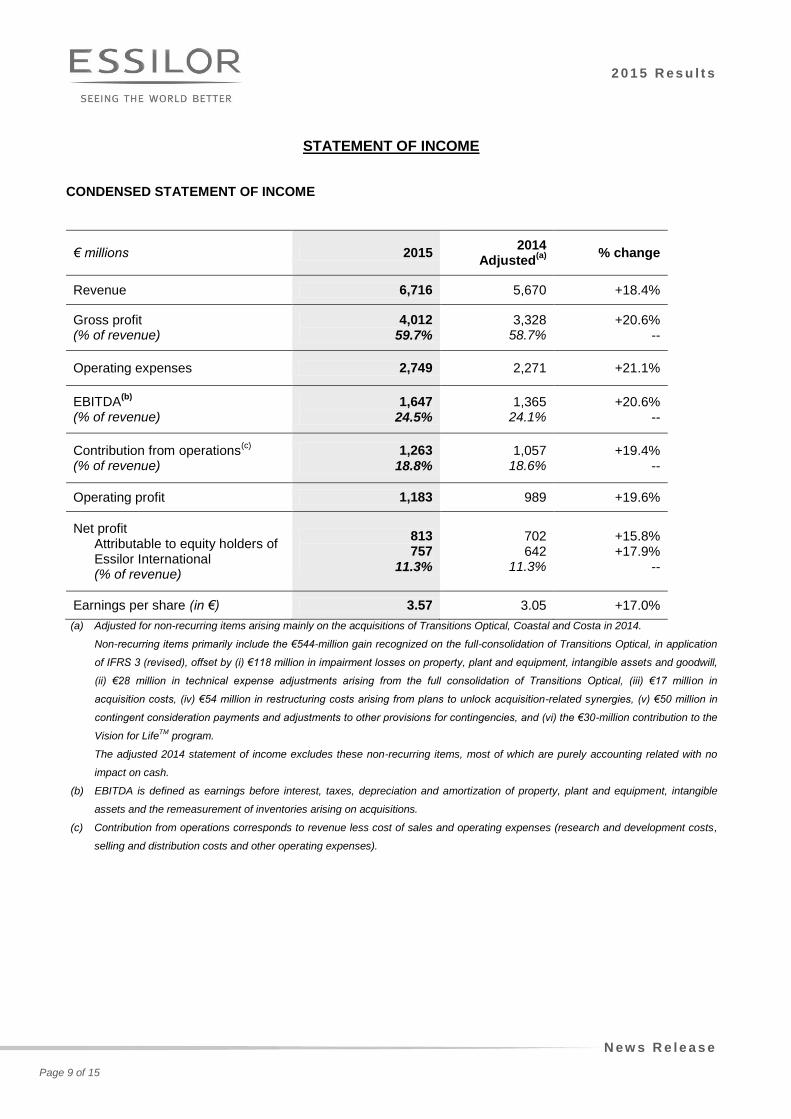
STATEMENT OF INCOME
CONDENSED STATEMENT OF INCOME
€ millions 2015 2014
Adjusted(a)
% change
Revenue 6,716 5,670 +18.4%
Gross profit (% of revenue)
4,012 59.7%
3,328 58.7%
+20.6% --
Operating expenses 2,749 2,271 +21.1%
EBITDA(b)
(% of revenue) 1,647
24.5% 1,365
24.1% +20.6%
--
Contribution from operations(c)
(% of revenue)
1,263 18.8%
1,057 18.6%
+19.4% --
Operating profit 1,183 989 +19.6%
Net profit Attributable to equity holders of Essilor International (% of revenue)
813 757
11.3%
702 642
11.3%
+15.8% +17.9%
--
Earnings per share (in €) 3.57 3.05 +17.0%
(a) Adjusted for non-recurring items arising mainly on the acquisitions of Transitions Optical, Coastal and Costa in 2014.
Non-recurring items primarily include the €544-million gain recognized on the full-consolidation of Transitions Optical, in application
of IFRS 3 (revised), offset by (i) €118 million in impairment losses on property, plant and equipment, intangible assets and goodwill,
(ii) €28 million in technical expense adjustments arising from the full consolidation of Transitions Optical, (iii) €17 million in
acquisition costs, (iv) €54 million in restructuring costs arising from plans to unlock acquisition-related synergies, (v) €50 million in
contingent consideration payments and adjustments to other provisions for contingencies, and (vi) the €30-million contribution to the
Vision for LifeTM
program.
The adjusted 2014 statement of income excludes these non-recurring items, most of which are purely accounting related with no
impact on cash.
(b) EBITDA is defined as earnings before interest, taxes, depreciation and amortization of property, plant and equipment, intangible
assets and the remeasurement of inventories arising on acquisitions.
(c) Contribution from operations corresponds to revenue less cost of sales and operating expenses (research and development costs,
selling and distribution costs and other operating expenses).
2 0 1 5 R e s u l t s
N e w s R e l e a s e
Page 10 of 15
CONTRIBUTION FROM OPERATIONS1: 18.8% OF REVENUE
20.6% increase in gross profit, to 59.7% of revenue
Gross profit (revenue less cost of sales) stood at €4,012 million for the year, representing 59.7% of revenue,
versus 58.7% in 2014 (adjusted). The strong improvement was led primarily by the contribution from
Transitions Optical, as well as by gains in operating efficiency and the product mix.
Operating expenses: up 11.7% at constant exchange rates
At current exchange rates, operating expenses amounted to 40.9% of revenue, versus 40.0% in 2014
(adjusted).
They included:
€214 million in R&D and engineering costs, versus €188 million in 2014 (adjusted).
€1,678 million in selling and distribution costs, up from €1,367 million in 2014 (adjusted). The sharp
increase reflected the strategic commitment to raising consumer marketing spend in order to increase
awareness of the Varilux®, Crizal
®, and Transitions
® brands in their leading markets, promote the
sunglasses brands and grow the online business.
Record high contribution from operations1
Contribution from operations1 surged 19.4% to €1,263 million while the margin widened by 20 basis points to
18.8% of revenue, reflecting the net impact of:
the significant contribution from Transitions Optical, including the synergy gains arising on the company's
integration;
the slight dilution from the consolidation of bolt-on acquisitions2 and Coastal;
the steep increase in consumer marketing expenses in 2015.
Contribution from operations1 includes €86 million in costs relating to purchase price allocation within the
scope of business combinations (€64 million in 2014 on an adjusted basis), reflecting Essilor's acquisition
momentum over recent years as well as the full-year impact of the strategic prior-year acquisitions of Coastal
and Transitions. Adjusted for this amortization expense, contribution from operations1 came out 20.3% higher
year-on-year at €1,349 million, and represented 20.1% of revenue (versus 19.8% in 2014 on an adjusted
basis). EBITDA3 advanced 20.6%, with the margin widening by 40 basis points to 24.5% of revenue.
--------------------------- 1 Contribution from operations corresponds to revenue less cost of sales and operating expenses (research and development costs,
selling and distribution costs and other operating expenses). 2 Local acquisitions or partnerships.
3 EBITDA is defined as earnings before interest, taxes, depreciation and amortization of property, plant and equipment, intangible assets
and the remeasurement of inventories arising on acquisitions.

2 0 1 5 R e s u l t s
N e w s R e l e a s e
Page 11 of 15
Operating profit: up 19.6% to €1,183 million or 17.6% of revenue
"Other income and expenses from operations" and "Gains and losses on asset disposals" together
represented a net expense of €80 million versus a net expense of €68 million in 2014 (adjusted). These
outlays covered:
Compensation costs for shared-based payments (in particular performance share plans), totaling €49
million.
Charges to restructuring provisions in a total amount of €22 million, mainly related to the streamlining of
the prescription laboratory network in Europe.
Other expenses in an amount of €9 million.
Finance costs and other financial income and expenses, net
This item came to a net expense of €63 million, compared with €44 million in 2014 (adjusted) and chiefly
includes interest expense as well as exchange gains and losses.
Profit attributable to equity holders: up 17.9% to €757 million
Profit attributable to equity holders is stated after:
€308 million in income tax expense, representing an effective tax rate of 27.5% compared with 26% in
2014 (adjusted). Most of the increase resulted from changes in the scope of consolidation and growth in
North America.
€56 million in non-controlling interests, down slightly from €60 million in 2014 (adjusted), primarily due to
the impact of (i) cooling demand in Japan on Nikon-Essilor's profit performance and (ii) slower growth in
export sales from China on our Chinese partners.
Earnings per share rose 17 % to €3.57 for the year. Excluding the €0.27 per share impact of the negative
currency effect, the increase was 8.4%, in line with the growth in revenue at constant exchange rates.
2 0 1 5 R e s u l t s
N e w s R e l e a s e
Page 12 of 15
BALANCE SHEET AND CASH FLOW STATEMENT
OPERATING CASH FLOW1: UP 21.8% TO €1,245 MILLION
At 21.8%, growth in operating cash flow1 (which represented €1,245 million) tracked the increase in
contribution from operations.
Capital expenditure and investments
Purchases of property, plant and equipment and intangible assets totaled €327 million for the year. This
amount includes, on one hand, capital expenditure to drive growth and, on the other hand, buy-backs in
connection with FGX International's renewal of a key account contract in the Sunglasses & Readers division.
Financial investments, in an amount of €805 million, concerned the acquisitions carried out during the year –
primarily two national optometrist services networks in the United States, Vision Source and PERC/IVA – as
well as the payment of contingent consideration in respect to prior-year transactions.
Working capital requirement
Working capital requirement rose by €51 million over the year, reflecting disciplined management that kept
inventory from rising as fast as underlying revenue growth.
Free cash flow2
In all, the robust revenue performance helped to drive an 8.4% increase year-on-year in free cash flow to a
record €867 million, representing an annual average increase of 13% since 2012. Consolidated net debt
ended 2015 at €2,089 million or 1.3 times consolidated EBITDA, unchanged from December 31, 2014.
--------------------------- 1 Net cash from operating activities before working capital requirement.
2 Net cash from operating activities less purchases of property, plant and equipment and intangible assets, according to the IFRS
consolidated cash flow statement.
2 0 1 5 R e s u l t s
N e w s R e l e a s e
Page 13 of 15
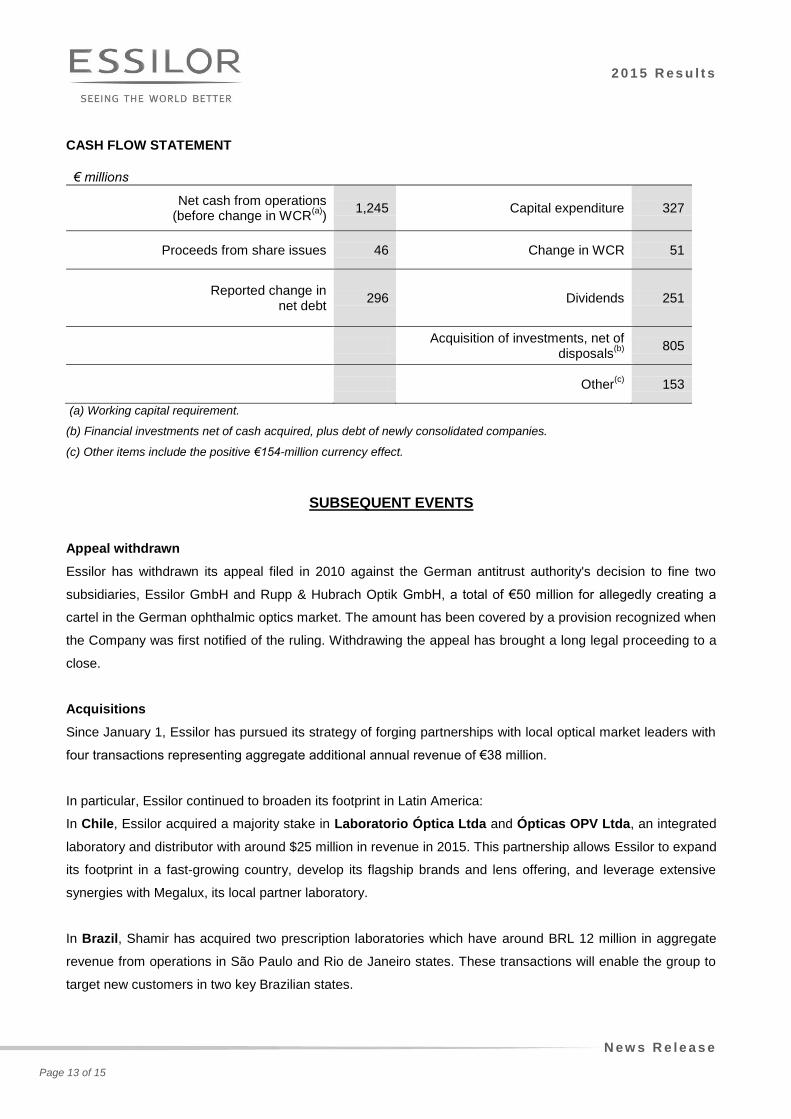
CASH FLOW STATEMENT
€ millions
Net cash from operations (before change in WCR
(a))
1,245 Capital expenditure 327
Proceeds from share issues 46 Change in WCR 51
Reported change in net debt
296 Dividends 251
Acquisition of investments, net of
disposals(b)
805
Other(c)
153
(a) Working capital requirement.
(b) Financial investments net of cash acquired, plus debt of newly consolidated companies.
(c) Other items include the positive €154-million currency effect.
SUBSEQUENT EVENTS
Appeal withdrawn
Essilor has withdrawn its appeal filed in 2010 against the German antitrust authority's decision to fine two
subsidiaries, Essilor GmbH and Rupp & Hubrach Optik GmbH, a total of €50 million for allegedly creating a
cartel in the German ophthalmic optics market. The amount has been covered by a provision recognized when
the Company was first notified of the ruling. Withdrawing the appeal has brought a long legal proceeding to a
close.
Acquisitions
Since January 1, Essilor has pursued its strategy of forging partnerships with local optical market leaders with
four transactions representing aggregate additional annual revenue of €38 million.
In particular, Essilor continued to broaden its footprint in Latin America:
In Chile, Essilor acquired a majority stake in Laboratorio Óptica Ltda and Ópticas OPV Ltda, an integrated
laboratory and distributor with around $25 million in revenue in 2015. This partnership allows Essilor to expand
its footprint in a fast-growing country, develop its flagship brands and lens offering, and leverage extensive
synergies with Megalux, its local partner laboratory.
In Brazil, Shamir has acquired two prescription laboratories which have around BRL 12 million in aggregate
revenue from operations in São Paulo and Rio de Janeiro states. These transactions will enable the group to
target new customers in two key Brazilian states.
2 0 1 5 R e s u l t s
N e w s R e l e a s e
Page 14 of 15
In the United States, Essilor of America has further broadened and deepened its local roots with the
acquisition of a majority interest in ICare Industries, Inc., a Florida-based laboratory with around $14 million
in annual revenue.
2 0 1 5 R e s u l t s
N e w s R e l e a s e
Page 15 of 15
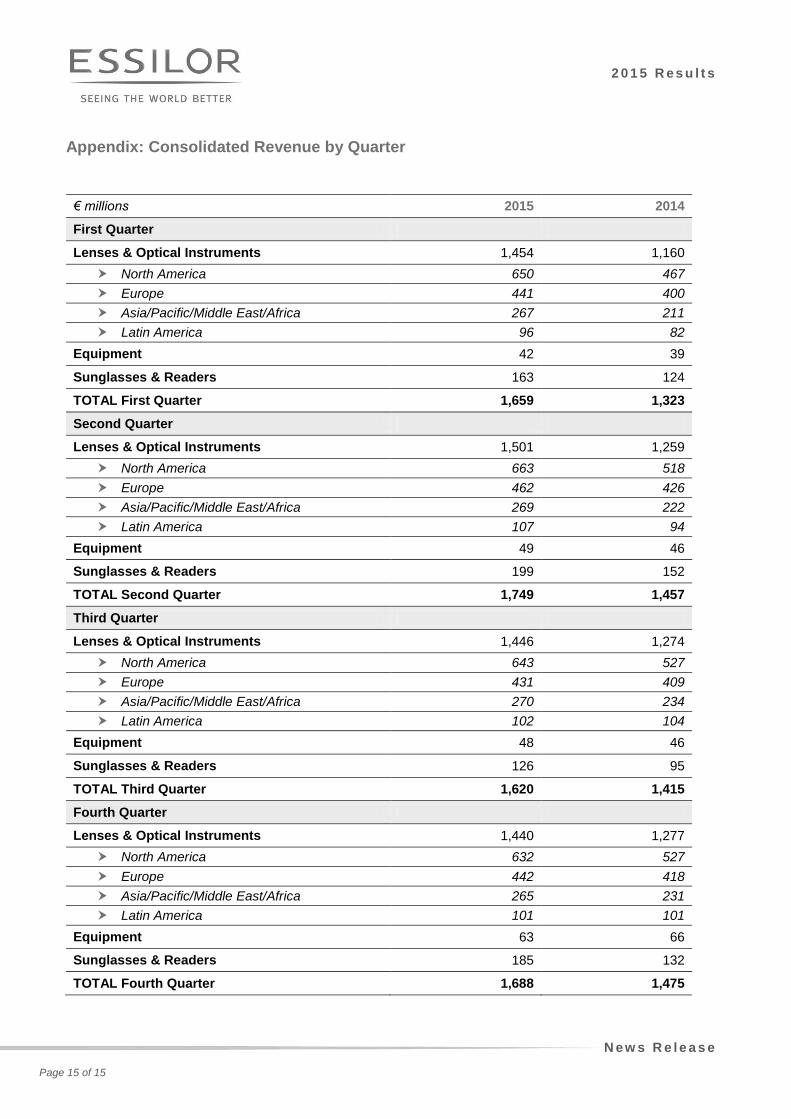
Appendix: Consolidated Revenue by Quarter
€ millions 2015 2014
First Quarter
Lenses & Optical Instruments 1,454 1,160
North America 650 467
Europe 441 400
Asia/Pacific/Middle East/Africa 267 211
Latin America 96 82
Equipment 42 39
Sunglasses & Readers 163 124
TOTAL First Quarter 1,659 1,323
Second Quarter
Lenses & Optical Instruments 1,501 1,259
North America 663 518
Europe 462 426
Asia/Pacific/Middle East/Africa 269 222
Latin America 107 94
Equipment 49 46
Sunglasses & Readers 199 152
TOTAL Second Quarter 1,749 1,457
Third Quarter
Lenses & Optical Instruments 1,446 1,274
North America 643 527
Europe 431 409
Asia/Pacific/Middle East/Africa 270 234
Latin America 102 104
Equipment 48 46
Sunglasses & Readers 126 95
TOTAL Third Quarter 1,620 1,415
Fourth Quarter
Lenses & Optical Instruments 1,440 1,277
North America 632 527
Europe 442 418
Asia/Pacific/Middle East/Africa 265 231
Latin America 101 101
Equipment 63 66
Sunglasses & Readers 185 132
TOTAL Fourth Quarter 1,688 1,475

2 0 1 5 R e s u l t s
2 0 1 5 C o n s o l i d a t e d F i n a n c i a l S t a t e m e n t s
Page 1 of 5
2015 CONSOLIDATED FINANCIAL
STATEMENTS
2 0 1 5 R e s u l t s
2 0 1 5 C o n s o l i d a t e d F i n a n c i a l S t a t e m e n t s
Page 2 of 5
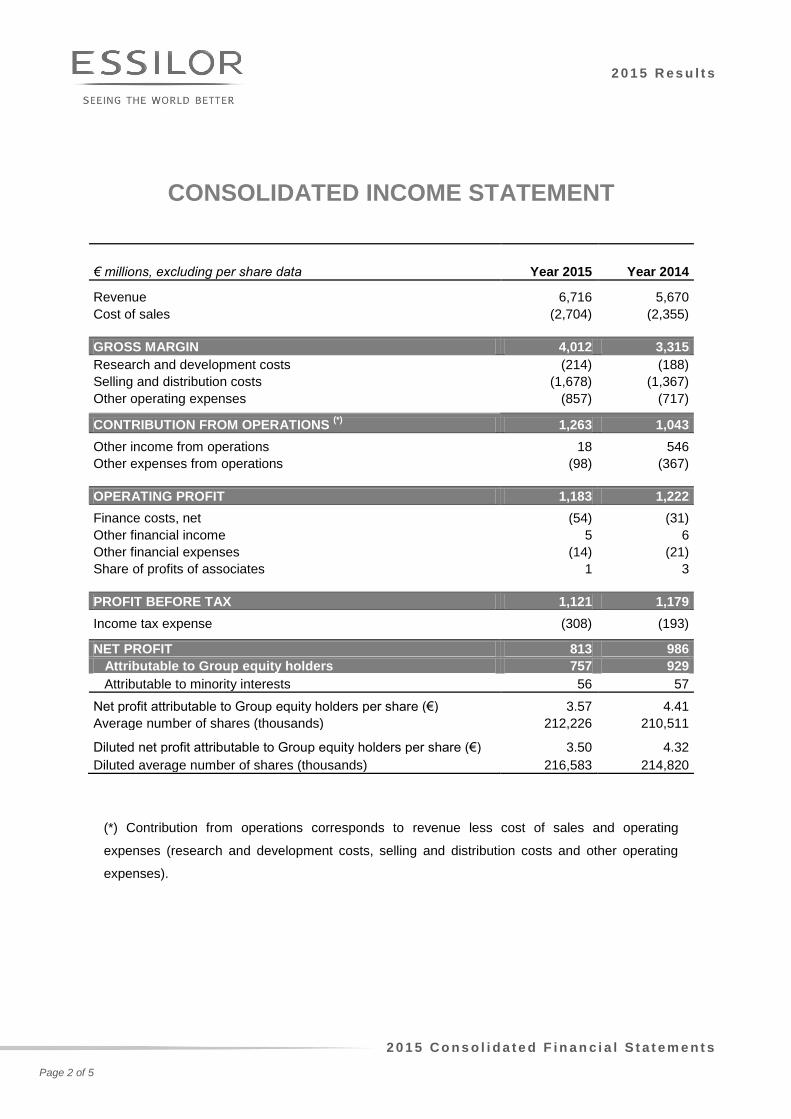
CONSOLIDATED INCOME STATEMENT
€ millions, excluding per share data Year 2015 Year 2014
Revenue 6,716 5,670
Cost of sales (2,704) (2,355)
GROSS MARGIN 4,012 3,315
Research and development costs (214) (188)
Selling and distribution costs (1,678) (1,367)
Other operating expenses (857) (717)
CONTRIBUTION FROM OPERATIONS (*)
1,263 1,043
Other income from operations 18 546
Other expenses from operations (98) (367)
OPERATING PROFIT 1,183 1,222
Finance costs, net (54) (31)
Other financial income 5 6
Other financial expenses (14) (21)
Share of profits of associates 1 3
PROFIT BEFORE TAX 1,121 1,179
Income tax expense (308) (193)
NET PROFIT 813 986
Attributable to Group equity holders 757 929
Attributable to minority interests 56 57
Net profit attributable to Group equity holders per share (€) 3.57 4.41
Average number of shares (thousands) 212,226 210,511
Diluted net profit attributable to Group equity holders per share (€) 3.50 4.32
Diluted average number of shares (thousands) 216,583 214,820
(*) Contribution from operations corresponds to revenue less cost of sales and operating
expenses (research and development costs, selling and distribution costs and other operating
expenses).
2 0 1 5 R e s u l t s
2 0 1 5 C o n s o l i d a t e d F i n a n c i a l S t a t e m e n t s
Page 3 of 5
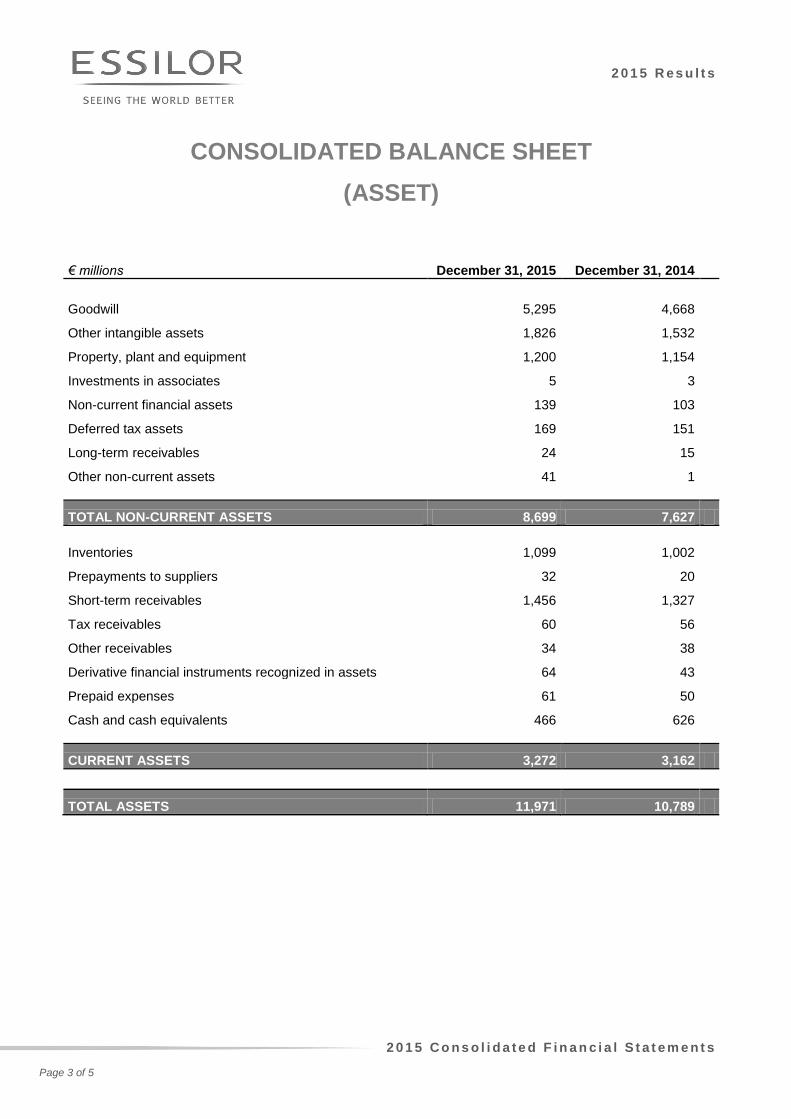
CONSOLIDATED BALANCE SHEET
(ASSET)
€ millions December 31, 2015 December 31, 2014
Goodwill 5,295 4,668
Other intangible assets 1,826 1,532
Property, plant and equipment 1,200 1,154
Investments in associates 5 3
Non-current financial assets 139 103
Deferred tax assets 169 151
Long-term receivables 24 15
Other non-current assets 41 1
TOTAL NON-CURRENT ASSETS 8,699 7,627
Inventories 1,099 1,002
Prepayments to suppliers 32 20
Short-term receivables 1,456 1,327
Tax receivables 60 56
Other receivables 34 38
Derivative financial instruments recognized in assets 64 43
Prepaid expenses 61 50
Cash and cash equivalents 466 626
CURRENT ASSETS 3,272 3,162
TOTAL ASSETS 11,971 10,789
2 0 1 5 R e s u l t s
2 0 1 5 C o n s o l i d a t e d F i n a n c i a l S t a t e m e n t s
Page 4 of 5
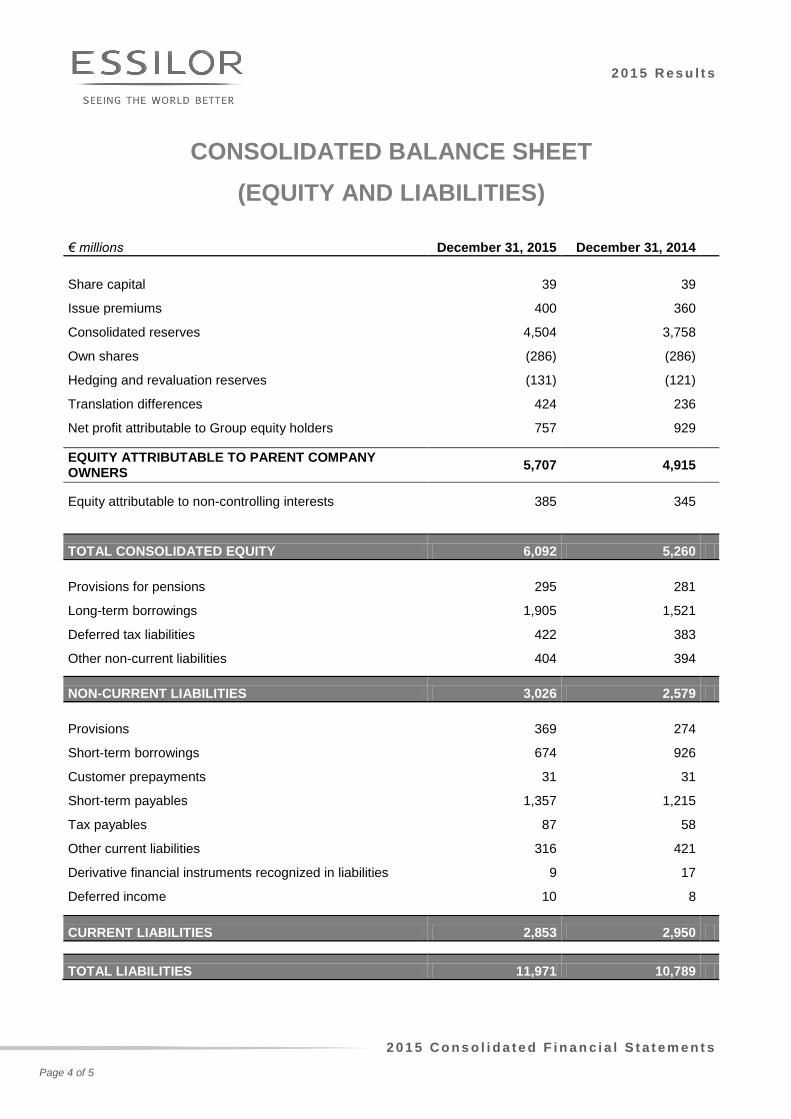
CONSOLIDATED BALANCE SHEET
(EQUITY AND LIABILITIES)
€ millions December 31, 2015 December 31, 2014
Share capital 39 39
Issue premiums 400 360
Consolidated reserves 4,504 3,758
Own shares (286) (286)
Hedging and revaluation reserves (131) (121)
Translation differences 424 236
Net profit attributable to Group equity holders 757 929
EQUITY ATTRIBUTABLE TO PARENT COMPANY OWNERS
5,707 4,915
Equity attributable to non-controlling interests 385 345
TOTAL CONSOLIDATED EQUITY 6,092 5,260
Provisions for pensions 295 281
Long-term borrowings 1,905 1,521
Deferred tax liabilities 422 383
Other non-current liabilities 404 394
NON-CURRENT LIABILITIES 3,026 2,579
Provisions 369 274
Short-term borrowings 674 926
Customer prepayments 31 31
Short-term payables 1,357 1,215
Tax payables 87 58
Other current liabilities 316 421
Derivative financial instruments recognized in liabilities 9 17
Deferred income 10 8
CURRENT LIABILITIES 2,853 2,950
TOTAL LIABILITIES 11,971 10,789
2 0 1 5 R e s u l t s
2 0 1 5 C o n s o l i d a t e d F i n a n c i a l S t a t e m e n t s
Page 5 of 5
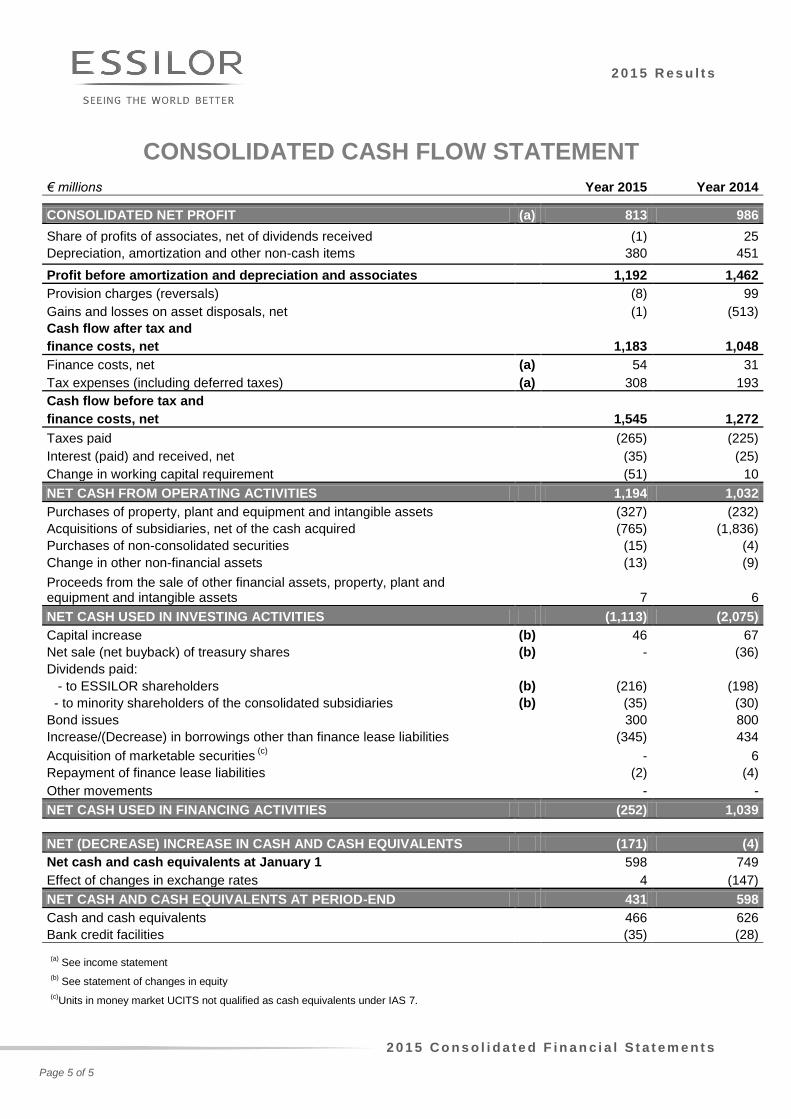
CONSOLIDATED CASH FLOW STATEMENT
€ millions Year 2015 Year 2014
CONSOLIDATED NET PROFIT (a) 813 986
Share of profits of associates, net of dividends received
(1) 25
Depreciation, amortization and other non-cash items
380 451
Profit before amortization and depreciation and associates 1,192 1,462
Provision charges (reversals)
(8) 99
Gains and losses on asset disposals, net
(1) (513)
Cash flow after tax and
finance costs, net 1,183 1,048
Finance costs, net (a) 54 31
Tax expenses (including deferred taxes) (a) 308 193
Cash flow before tax and
finance costs, net 1,545 1,272
Taxes paid
(265) (225)
Interest (paid) and received, net
(35) (25)
Change in working capital requirement
(51) 10
NET CASH FROM OPERATING ACTIVITIES 1,194 1,032
Purchases of property, plant and equipment and intangible assets
(327) (232)
Acquisitions of subsidiaries, net of the cash acquired
(765) (1,836)
Purchases of non-consolidated securities
(15) (4)
Change in other non-financial assets
(13) (9)
Proceeds from the sale of other financial assets, property, plant and equipment and intangible assets
7 6
NET CASH USED IN INVESTING ACTIVITIES (1,113) (2,075)
Capital increase (b) 46 67
Net sale (net buyback) of treasury shares (b) - (36)
Dividends paid: - to ESSILOR shareholders (b) (216) (198)
- to minority shareholders of the consolidated subsidiaries (b) (35) (30)
Bond issues
300 800
Increase/(Decrease) in borrowings other than finance lease liabilities
(345) 434
Acquisition of marketable securities (c)
- 6
Repayment of finance lease liabilities
(2) (4)
Other movements
- -
NET CASH USED IN FINANCING ACTIVITIES (252) 1,039
NET (DECREASE) INCREASE IN CASH AND CASH EQUIVALENTS (171) (4)
Net cash and cash equivalents at January 1
598 749
Effect of changes in exchange rates
4 (147)
NET CASH AND CASH EQUIVALENTS AT PERIOD-END 431 598
Cash and cash equivalents
466 626
Bank credit facilities
(35) (28)
(a) See income statement
(b) See statement of changes in equity
(c)Units in money market UCITS not qualified as cash equivalents under IAS 7.