Embed Size (px)
Citation preview
ESSILOR INTERNATIONAL
Compagnie Générale d’Optique
147, rue de Paris
94220 Charenton-le-Pont
France
Phone: +33 (0) 1 49 77 42 24 - Fax: +33 (0) 1 49 77 44 20
www.essilor.com
A French corporation with fully paid-up capital of €36,158,669.05
Registred under the number 712 049 618 in Créteil, France.
2004REFERENCE DOCUMENT
2004
REF
EREN
CE
DO
CU
MEN
T ES
SILO
R
1
Checklist of Information Provided in Compliance with Autorité des Marchés Financiers Regulations
STATEMENTS BY THE PERSONS RESPONSIBLE FOR THEREFERENCE DOCUMENT AND THE AUDIT OF THE ACCOUNTS
• Statement by the persons responsible for the Reference Document ........................................... 125
• Statement by the Auditors................................................ 126• Information policy ............................................................... 6
GENERAL INFORMATION
Issuer• Applicable regulations (foreign companies)..................... N/A
Capital• Particular characteristics (voting restrictions, etc.) ................ 8• Authorized, unissued capital ......................................... 9, 10• Potential shares ................................................................. 10• Changes in capital over the past five years ........................ 13
The Market for the Company’s Securities• Share price and trading volumes over the past 18 months.. 16, 17• Dividends.......................................................................... 18
CAPITAL AND VOTING RIGHTS• Current ownership structure ......................................... 14, 32• Changes in ownership structure ........................................ 15• Shareholder pacts.............................................................. 15
THE GROUP’S BUSINESS• Group organization (relations between
the parent company and subsidiaries, information about subsidiaries) ............................. 24, 73 to 77
• Consolidated key figures ................................. 25, 26, 36, 44• Segment information (by business,
by geographic area and/or country)............................. 27, 53• Markets and competitive position................................... 20, 25• Investment policy ........................................................ 30, 31• Performance indicators (value creation, etc.) ..................... 32
ANALYSIS OF GROUP RISKS• Risk factors
– Market risks (liquidity, interest rate, currency, equity risks) .............................................. 39, 40
– Business risks (dependence on suppliers, customers, sub-contractors, major contracts, manufacturing processes, etc.) ....................................... 36
– Legal risks (specific regulations, concessions, patents, licenses, material claims and litigation, exceptional events) ....................................................... 41
– Industrial and environmental risks............................ 41, 42• Insurance and risk coverage .............................................. 43
ASSETS, FINANCIAL POSITION AND RESULTS• Consolidated financial statements and notes........... 44 to 77• Off-balance sheet commitments.............................. 67 to 71• Fees paid to the Auditors
and members of their networks ...................................... 108• Pro forma financial information ..................................... N/A• Regulatory ratios (banks, insurance companies, brokers. N/A• Parent company financial statements and notes .... 82 to 105• Interim consolidated financial statements....................... N/A
CORPORATE GOVERNANCE• Board of Directors................................................ 109 to 112• Committees of the Boards ....................................... 113, 114• Executive directors
(compensation and benefits, stock options) .......... 114 to 116• Ten employees other than directors who received
and exercised the greatest number of options.................. 117• Regulated agreements ..................................................... 107
RECENT DEVELOPMENTS AND OUTLOOK• Recent developments ........................................................ 35• Outlook............................................................................. 35
N/A: Not Applicable
The French version of this Reference Document was filed
with the Autorité des Marchés Financiers on April 19, 2005,
in accordance with articles 211-1 to 211-42 of the General
Regulations of the Autorité des Marchés Financiers. It may
not be used in connection with a financial transaction unless
it is accompanied by an information memorandum
approved by the Autorité des Marchés Financiers.
2
Section I - Persons Responsible for the Reference Document and the Audit of the Accounts1.1. Name and Function of the Person Responsible for the Reference Document ..................................................... 41.2. Statement by the Person Responsible for the Reference Document ..................................................... 41.3. Auditors .............................................................................. 41.3.1. Statutory Auditors............................................................. 41.3.2. Statement by the Auditors ................................................ 51.4. Information Policy .............................................................. 61.4.1. Person responsible for information ................................... 61.4.2. Investor information ......................................................... 61.4.3. 2005 financial calendar ................................................... 6
Section II – Information Concerning the Transaction
Section III – General Information about the Company and its Capital3.1. General Information about the Company........................... 73.1.1. Company name and headquarters.................................... 73.1.2. Legal form........................................................................ 73.1.3. Governing law ................................................................. 73.1.4. Date of incorporation and term........................................ 73.1.5. Corporate purpose (Article 2 of the Bylaws) ..................... 73.1.6. Registration number and APE business identifier Code..... 73.1.7. Consultation of legal documents ...................................... 73.1.8. Accounting period............................................................ 73.1.9. Appropriation of income (Article 28 of the Bylaws).......... 73.1.10. General Shareholders’ Meetings..................................... 83.2. General Information about the Company’s Capital Stock... 93.2.1. Capital increases .............................................................. 93.2.2. Capital stock .................................................................... 93.2.3. Authorized, unissued capital ............................................ 93.2.4. Securities not carrying the right to a stake in equity ....... 103.2.5. Potential shares .............................................................. 103.2.6. Changes in capital stock over the last five years............. 133.3. Current Ownership Structure ........................................... 143.3.1. Ownership structure at December 31, 2004 .................. 143.3.2. Changes in ownership structure over the last three years.... 153.3.3. Shareholder pacts........................................................... 153.4. The Market for the Company’s Securities ......................... 163.4.1. Common stock............................................................... 163.4.2. Bonds convertible into or exchangeable for new
or existing shares of common stock (Oceane) ................ 17
3.5. Dividends.......................................................................... 183.5.1. Dividend history ............................................................ 183.5.2. Payout ............................................................................ 183.5.3. Timeframe for claiming dividend.................................... 18
Section IV – Information about the Company's Business4.1. General Presentation ........................................................ 194.1.1. Group history................................................................. 194.1.2. The Company's main businesses .................................... 204.1.3. Management review....................................................... 254.2. Dependence on Patents, Supply Contracts and Key Customers .......................................................................... 364.3. Employees ......................................................................... 364.3.1. Average number of employees ....................................... 364.3.2. Analysis of employees .................................................... 364.3.3. Social Data Report ......................................................... 364.3.4. Social policy .................................................................. 364.4. Risks.................................................................................. 394.4.1. Market risks.................................................................... 394.4.2. Legal risks ...................................................................... 414.4.3. Industrial and environmental risks.................................. 414.4.4. Insurance ....................................................................... 43
Section V – Assets and Liabilities – Financial Position – Results5.1. Consolidated Financial Statements ................................... 445.1.1. Key financial data, year ended December 31, 2004....... 445.1.2. Consolidated income statement ..................................... 445.1.3. Consolidated statement of cash flows............................. 455.1.4. Consolidated balance sheet............................................ 465.1.5. Notes to the Consolidated Financial Statements............ 485.1.6. Statutory Auditors' Report ............................................. 785.1.7. Main effects of the transition to IAS/IFRS....................... 795.2. Company Accounts ........................................................... 825.2.1. Key financial data, year ended December 31, 2004....... 825.2.2. Income statement........................................................... 825.2.3. Statement of cash flows.................................................. 835.2.4. Balance sheet................................................................. 845.2.5. Notes to the Parent Company Financial Statements........ 865.2.6 Statutory Auditors' Report on the Financial Statements .... 1065.2.7. Statutory Auditors' Special Report ................................ 1075.3. Fees Paid to the Auditors and the Members of their Networks ...................................... 108
CONTENTS
Document de référence ESSILOR 2004
Section VI – Corporate Governance6.1. Membership and Procedures of the Board of Directors, the Commitees of the Board and the Executive Committee... 1096.1.1. Board of Directors........................................................ 1096.1.2. Commitees of the Board............................................... 1136.1.3. Executive Committee.................................................... 1146.2. Directors' Interests ......................................................... 1146.2.1. Remuneration of corporate officers .............................. 1146.2.2. Stock option plans........................................................ 1166.2.3. Transactions with members
of the Board of Directors and coporate officers ............ 1166.3. Employee Incentive Plans ............................................... 1176.3.1. Incentive bonus and profit-sharing plans...................... 1176.3.2. Employees stock options .............................................. 1176.4. Chairman’s Report on Internal Control ......................... 1206.4.1. Preparation and organization of meetings
of the Board of Directors.............................................. 1206.4.2. Report on Essilor International S.A. internal
control procedures ....................................................... 1216.4.3. Powers of the Chief Executive Officer .......................... 1256.4.4. Statutory Auditors' Report
on the Chaiman’s Special Report.................................. 126
Unless otherwise indicated, information in this report concerningmarket shares and positions is based on volumes sold. All referencesto Essilor's market share or market position are based on internalestimates, which may have been made using data from external market surveys.Varilux®, Airwear®, Crizal®, Stylis®, Fusio™ and Xelios™ are registeredtrademarks of Essilor International.Transitions® is a registered trademark of Transitions Optical Inc.Nikon® is a registered trademark of Nikon Corporation.
The English language version of this Reference Document is a freetranslation from the original, which was prepared in French. All possible care has been taken to ensure that the translation is anaccurate representation of the original. However in all matters ofinterpretation of information, views or opinion expressed therein theoriginal language version of the document in French takes precedence over the translation.
3
4
1.1. NAME AND FUNCTION OF THE PERSONRESPONSIBLE FOR THE REFERENCEDOCUMENT
Xavier Fontanet, Chairman and Chief Executive Officer
1.2. STATEMENT BY THE PERSON RESPONSIBLEFOR THE REFERENCE DOCUMENT
To the best of my knowledge, the information about Essilor containedin the Reference Document is correct and includes all theinformation required by investors to form an opinion on the assets,business, financial position, results and outlook of the group. Noinformation has been omitted that would be likely to alter aninvestor's opinion.
Charenton, April 19, 2005Xavier Fontanet
1.3. AUDITORS
1.3.1. Statutory Auditors
• PricewaterhouseCoopers AuditTour AIG - 34, place des Corolles92908 PARIS LA DÉFENSE 2 CEDEX
First appointed: June 14, 1983 (Befec, Mulquin et associés, mergedwith Price Waterhouse and renamed Befec-Pricewaterhouse in 1995,and subsequently merged with Coopers & Lybrand to becomePricewaterhouseCoopers Audit in 2002).
Re-appointed on May 3, 2001 for six years.
• Cabinet Dauge & Associés22, avenue de la Grande Armée75017 PARIS
Appointed on May 3, 2001 for six years.
SECTION I
Persons Responsible for the Reference Document and the Audit of the Accounts
Document de référence ESSILOR 2004

1.3.2. Statement by the Auditors
This is a free translation into English of the Statutory Auditors’ statement issued in the French language and is provided solely for the convenienceof English speaking readers. This statement should be read in conjunction with, and construed in accordance with, French law and professionalauditing standards applicable in France.
To the Shareholders,
In our capacity as Statutory Auditors of Essilor International and as required by Article 211-5-2 of the General Regulations issued by the Autoritédes Marchés Financiers, we have examined in accordance with French professional standards the information about the financial position andthe historical accounts included in the Document de référence. The Document de référence is the responsibility of the Chairman of the Board of Directors. Our responsibility is to express an opinion on thefairness of the information about the financial position and the accounts contained therein.Our procedures, which were performed in accordance with the professional standards applicable in France, consisted in assessing the fairnessof the information about the financial position and the accounts and verifying that this information agrees with the audited financial statements,reading the other information contained in the Document de référence in order to identify any material inconsistencies with the informationabout the financial position and the accounts, and reporting any manifestly incorrect information that came to our attention, based on ouroverall knowledge of the Company, as acquired during our audit. The Document de référence does not contain any forward-looking informationdetermined according to a structured process.
We audited the financial statements of the Company and the group for the year ended December 31, 2002, as approved by the Board ofDirectors. Our reports on these financial statements were free of qualifications or observations.We also audited financial statements of the Company and the group for the year ended December 31, 2003, as approved by the Board ofDirectors. Our reports on these financial statements were free of qualifications, but included the following observations:• Our report on the financial statements of the Company included an observation concerning a change of method related to employee
benefits, described in note 1.10 to the financial statements.• Our report on the consolidated financial statements included an observation concerning a change in the presentation of the income
statement, described in note 1.1 to the consolidated financial statements.We audited the financial statements of the Company and the group for the year ended December 31, 2004, as approved by the Board ofDirectors. Our audits were performed in accordance with auditing standards generally accepted in France. Our reports on these financial statements were free of qualifications or observations.Based on the procedures described above, we have nothing to report with respect to the fairness of the information about the financial positionand the accounts contained in the Document de référence.
Paris, April 19, 2005
The Statutory AuditorsPricewaterhouseCoopers Audit Cabinet Dauge et Associés
Jacques Denizeau Gérard Dauge
The Document de référence also includes:• The Auditors' reports on the financial statements of the Company and the group for the year ended December 31, 2004 (see pages 106 and 78),
which include a justification of their assessments as required by Article L.225-235 of the Commercial Code.
• The Auditors' report prepared in accordance with Article L.225-235 (final paragraph) of the Commercial Code on the Chairman's report onthe internal control procedures used for the preparation and processing of accounting and financial information (see page 126).
PERSONS RESPONSIBLE FOR THE REFERENCE DOCUMENT AND THE AUDIT OF THE ACCOUNTS
5
PERSONS RESPONSIBLE FOR THE REFERENCE DOCUMENT AND THE AUDIT OF THE ACCOUNTS
6
1.4. INFORMATION POLICY
1.4.1. Person responsible for informationVéronique GilletEssilor International147, rue de Paris94227 Charenton CedexPhone: 33 (0)1 49 77 42 16 - Fax: 33 (0)1 49 77 43 [email protected]
1.4.2. Investor informationInvestors are kept regularly informed of the group’s performance andnews through a variety of publications, including the Annual Reportand the Reference Document filed with the Autorité des MarchésFinanciers, financial announcements in the press when widespreadpublication of reliable information is considered appropriate, and pressreleases distributed to news media that track the group’s performance.
All of these documents are available on request and may be downloaded from the website at www.essilor.com.
1.4.3. 2005 financial calendar
1st quarter 2005 sales: April 21(1)
Annual Shareholders' Meeting: May 13 – 10:30 a.m.1st half 2005 sales: July 21(1)
1st half 2005 results: September 8(1)
3rd quarter 2005 sales: October 20(1)
(1) All announcements are made before start of trading on the Euronext Paris SA market.
SECTION II
Information Concerning the TransactionNot applicable
SECTION III
General Information about the Company and its Capital
7
3.1. GENERAL INFORMATION ABOUT THE COMPANY
3.1.1. Company name and headquartersThe Company name is Essilor International (Compagnie Généraled’Optique) (hereinafter referred to as “Essilor International”).Headquarters: 147, rue de Paris - 94220 Charenton-le-Pont, France.
3.1.2. Legal formEssilor International is a French joint stock company (société anonyme)with a Board of Directors.
3.1.3. Governing lawEssilor International is governed by French law, including theCommercial Code (Code de commerce, livre II) and Decreeno.67-236 of March 23, 1967.
3.1.4. Date of incorporation and termEssilor International was incorporated on October 6, 1971 for a 99-yearterm expiring on October 6, 2070.
3.1.5. Corporate purpose (Article 2 of the Bylaws)Essilor International's corporate purpose, in any and all countries, is to:• Design, manufacture, purchase, sell and trade in any and all
eyewear and optical products, including to manufacture, purchase and sell frames, sunglasses, protective glasses and otherprotective equipment, and eyeglass and contact lenses.
• Design and/or manufacture, purchase, sell and/or market any andall ophthalmic optical instruments and materials as well as anyand all material and equipment for the screening, detection, diagnosis, measurement or correction of physiological disabilities,for professional or private use.
• Design and/or develop, purchase and/or sell computer software,programs and related services.
• Conduct research, clinical trials, tests, training, technical assistanceand engineering services in relation to the above activities.
• Provide any and all services and assistance related to the aboveactivities, including consulting, accounting, audit, logistics andcash management services.
More generally, the Company may perform any financial, commercialor industrial transactions or any transactions involving either realestate or securities directly or indirectly related to the above-mentionedpurposes or any similar or related purposes, or that would facilitatetheir extension or development or make them more profitable. Itmay perform such transactions for itself, on behalf of third parties orthrough any and all forms of participation, including creating newcompanies, acquiring shares in existing companies, formingpartnerships, merging companies, advancing funds, purchasing orselling securities and voting rights, selling or leasing out of all or partof its real estate, securities or related rights, or otherwise.
3.1.6. Registration number and APE businessidentifier CodeEssilor International is registered with the Créteil Trade and CompaniesRegistry under no. 712 049 618.The APE business identifier Codes are 334 A (Essilor International)and 741 J (Headquarters).
3.1.7. Consultation of legal documentsLegal documents concerning the Company are available forconsultation at the Company’s headquarters.
3.1.8. Accounting periodThe Company’s tax year runs from January 1 to December 31.
3.1.9. Appropriation of income (Article 28 of the Bylaws)At least 5% of net income for the year, less any losses carriedforward from prior years, must be credited to the legal reserve, untilsuch time as the legal reserve represents one-tenth of the Company’scapital stock. In the case of any increase in capital, similar creditsmust be made until the legal reserve represents one-tenth of the newcapital.
Income available for appropriation corresponds to net income forthe year, less any losses carried forward from prior years and anyamounts credited to the legal reserve, plus any income carriedforward from prior years.
This amount may be appropriated as follows:• All or part of income available for appropriation may be carried
forward as retained earnings or appropriated to any extraordinary,special-purpose or other reserves.
• The amount remaining, if any, is used to pay a non-cumulative firstdividend on common shares, equal to 6% of the paid-up par valueof the shares.
Any balance remaining after the above appropriations and distributionis shared among all the shareholders.The Annual Shareholders’ Meeting may offer shareholders theoption of reinvesting all or part of the dividend in new shares, subject to compliance with applicable laws and regulations.
The Annual Shareholders’ Meeting may also decide to distributefunds deducted from distributable reserves. In this case, the relatedresolution should specify the reserve account from which the fundsare to be deducted.
GENERAL INFORMATION ABOUT THE COMPANY AND ITS CAPITAL
8
3.1.10. General Shareholders’ Meetings
3.1.10.1. Notice of meetingsGeneral Shareholders’ Meetings are called and conduct business inaccordance with applicable laws and regulations. All holders of commonshares are entitled to participate in General Shareholders’ Meetings,however many shares they own, provided such shares have beenpaid up to the extent called.
3.1.10.2. Participation in meetingsTo participate in a General Shareholders’ Meeting in person or byproxy: • Holders of registered shares must be listed as the shareholder of
record in the Company’s share register.• Holders of bearer shares must obtain a certificate from their bank
or broker stating that their shares have been placed in a blockedaccount up to the date of the Meeting. The certificate must be filedat the address specified in the notice of Meeting.
These formalities must be completed at least two days prior to thedate of the Meeting.
Shareholders may only give a proxy to their spouse or to anothershareholder. Each shareholder present or represented at the Meetinghas a number of votes equal to the number of shares represented,directly or by proxy, without limit.
Shareholders who have lodged postal or proxy votes with theCompany having filed a certificate from their bank or broker statingthat their shares have been placed in a blocked account may howeversell or transfer all or some of the shares to which said vote or proxyrelates, provided the shareholder gives the Company’s registrar thenecessary information at the latest by the day before the Meeting inorder to ensure that the vote or proxy concerned is cancelled or thenumber of shares and votes recorded in the shareholder’s name isadjusted.
3.1.10.3. Voting rightsAs from June 22, 1974, double voting rights were attributed to all fullypaid-up shares registered in the name of the same holder for at leasttwo years.
The holding period was raised to five years at the ExtraordinaryShareholders’ Meeting of June 11, 1983 and reduced to two years atthe Extraordinary Shareholders’ Meeting of March 3, 1997.
In the case of a bonus share issue paid up by capitalizing reserves,income or additional paid-in capital, the registered bonus sharesallotted in respect of shares carrying double voting rights will alsocarry double voting rights.
If the Company is merged, double voting rights will be exercisableat Shareholders’ Meetings of the surviving company, provided thatits bylaws include double voting right provisions.
If any registered shares are converted to bearer shares or transferredto another shareholder, the double voting right on those shares willbe forfeited. However, double voting rights will not be forfeited ifregistered shares are transferred by way of succession, or theliquidation of the marital estate, or a gift between spouses or to arelative in the direct line of succession, and the change of ownershipwill not be taken into account in determining the two-year minimumholding period referred to above.
In accordance with the law, double voting rights may not be abolishedby an Extraordinary Shareholders’ Meeting unless this decision is firstapproved by a special meeting of holders of shares with double votingrights.
3.1.10.4. Disclosure thresholdsIn addition to the disclosures required by law, the Company’s bylawsstate that any acquisition of 1.5% of the voting rights or any increasein an interest to 1.5% of the voting rights must be disclosed to theCompany within fifteen days, by registered letter sent to theCompany’s registered office with return receipt requested. The sameformalities are required when a shareholder acquires or raises aninterest to 3.5% of voting rights.
Disclosure is also required, within the same maximum period, ofany reduction in the percentage of voting rights held to below eitherof the above thresholds.
3.1.10.5. Shareholder identificationFully paid-up shares may be held in either registered or bearer form,at the shareholder’s discretion.
The Company may, at any time, subject to compliance withapplicable laws and regulations, request information from theclearing organization about the identity of holders of shares andsecurities convertible, redeemable, exchangeable or otherwiseexercisable for shares carrying rights to vote at GeneralShareholders’ Meetings, as well as details of the number of securitiesheld.
3.1.10.6. Sales of shares (Article 11 of the Bylaws)Shares are freely negotiable and are indivisible vis a vis the Company.
3.1.10.7. Voting restrictionsThe Company’s bylaws do not contain any restrictions on the exerciseof voting rights.
3.1.10.8. Paying agentEuro Emetteur Finance
GENERAL INFORMATION ABOUT THE COMPANY AND ITS CAPITAL
9
3.2. GENERAL INFORMATION ABOUT THE COMPANY’S CAPITAL STOCK
3.2.1. Capital increasesThe Company’s bylaws do not contain any restrictions over and abovethe applicable legal provisions in relation to capital increases.
3.2.2. Capital stock
Amount of capital stockAt December 31, 2004, the Company's capital stock amounted to€36,158,669.05 represented by 103,310,483 fully paid-up shares ofcommon stock each with a par value of €0.35.Taking into account (i) the double voting rights on shares registeredin the name of the same holder for two years and (ii) the impact oftreasury shares which are stripped of voting rights, the total numberof voting rights attached to the Company’s shares at December 31, 2004amounted to 110,251,805.
Share buyback programsSubject to the limits and conditions set down by law, the Board ofDirectors is authorized to acquire Essilor International shares on themarket. Buyback programs are carried out by the Company in orderto cancel shares to offset the dilutive impact of stock options grantedto management and employees of the Company. The shares may bepurchased, sold or transferred and paid for by any appropriatemethod, on an organized or over-the-counter market (includingthrough straight purchases, or the use of financial instruments orderivatives or the implementation of options strategies). The entireshare buyback program may be carried out through a single blockpurchase.In the ninth resolution of the Annual Shareholders’ Meeting on May14, 2004, the shareholders renewed for an eighteen-month periodthe authorization granted to the Board of Directors in the eleventhresolution of the Annual Shareholders’ Meeting of May 16, 2003 tobuy back Essilor International shares representing up to 10% of theCompany's capital stock on the date of purchase, in accordancewith the laws applicable at the buyback date. The shares may not bebought back at a price in excess of €70 per share and may not beresold at a price of less than €30 per share, adjusted if necessary totake into account the effects of any corporate actions. At its meetingon May 14, 2004, the Board decided to use this authorization tolaunch a share buyback program; the program was described in aninformation memorandum approved by the Autorité des MarchésFinanciers on July 8, 2004 under number 04-661.
During 2004, the Board of Directors used the authorizations grantedby the Annual Shareholders’ Meetings of May 16, 2003 and May14, 2004, to buy back 986,277 Essilor shares between January 1and December 31, 2004, at an average net price of €49 per share.No Essilor International shares were sold by the Company duringthe year.
The shares were purchased for subsequent cancellation in order tooffset the dilutive impact of stock options and were financed throughavailable cash.
At the Annual Shareholders’ Meeting to be held on May 13, 2005,the Board of Directors will invite shareholders to renew thisauthorization to buy back the Company’s shares for a further periodof eighteen months.
On November 18, 2004, the Company entered into a liquiditycontract with Rothschild & Cie Banque, which complies with theCode of ethics issued by the AFEI (French Association of InvestmentFirms) approved on April 10, 2001 by the Commission desOpérations de Bourse, the predecessor of the Autorité des MarchésFinanciers. Transactions carried out under this contract comply withthe principles set out in COB regulation 90-04 as amended by COBregulations 98-02 and 2000-06, and do not prevent the properfunctioning of the market or mislead any market players orstakeholders. 10,000 shares were held under this contract atDecember 31, 2004.
Share cancellations and capital reductionsAt the Extraordinary Shareholders’ Meeting of May 16, 2003, theshareholders authorized the Board of Directors to reduce capitalstock by canceling all or some of the shares held by the Company,provided the aggregate number of shares canceled in any giventwenty-four month period does not exceed 10% of the issuedcapital. At its July 7, 2004 meeting, the Board of Directors decidedto use this authorization to cancel 800,000 shares – the samenumber as in 2003. The cancellation of these shares led to a€280,000 capital reduction.
Essilor International shares held by the Company (see para. 4.1.3.3. below)
3.2.3. Authorized, unissued capitalAt the Extraordinary Shareholders’ Meeting of May 3, 2001, theBoard of Directors was authorized to issue shares to employeesparticipating in a stock ownership plan. Under the terms of the five-year authorization, the total number of new shares offered toemployees may not exceed 3% of issued capital as of the date ofissue.
The Extraordinary Shareholders’ Meeting of May 16, 2003 gave theBoard of Directors the following authorizations:• To grant, on one or several occasions, to employees or officers of
the Company or of related companies within the meaning of articleL.225-180 of the Commercial Code, options to purchase newcommon stock of the Company, to be issued for this purpose. Under the terms of this three-year authorization, the total numberof new shares to be purchased on exercise of these options maynot exceed 3% of issued capital as of the date of grant.
• To issue shares and share equivalents, with pre-emptive subscriptionrights, for a maximum of:– €15 million for share issues,– €600 million or the equivalent in foreign currency for debt
securities (total issued amount).
Date Type of authorization Duration Expiry date Utilization in 2004
GENERAL INFORMATION ABOUT THE COMPANY AND ITS CAPITAL
10
• To issue shares and share equivalents, without pre-emptivesubscription rights but with a priority subscription period forissues carried out in France, with the same limits as above.
• To issue bonus shares paid up by capitalizing reserves, for amaximum of €80 million.
Each of the three authorizations was given for a period of 26 months.
Shareholders will be invited to renew all of these authorizations atthe Extraordinary Shareholders’ Meeting to be held on May 13, 2005.
3.2.4. Securities not carrying the right to a stakein equityNot applicable
3.2.5. Potential sharesThe exercise of all stock options exercisable for new shares that wereoutstanding at December 31, 2004 would result in the issuance of2,819,826 new shares.
Conversion into new shares of all the bonds which are convertibleinto or exchangeable for new or existing shares of common stock(Oceane), that were outstanding at December 31, 2004 would resultin the issuance of 6,039,754 new shares. However, when the bondsare presented for conversion, Essilor has the option of exchanging allor some of them for existing shares of common stock, instead ofconverting them into new shares.
Under the third authorization described above, granted by theExtraordinary Shareholders’ Meeting of May 16, 2003, the Board ofDirectors decided on June 11, 2003 to issue 5,252,359 convertibleor exchangeable bonds at a price based on a Essilor Internationalreference share price of €36.0216, without pre-emptive subscriptionrights but with a priority subscription period for issues carried out inFrance. After exercise of the 15% greenshoe option, a total of6,040,212 convertible or exchangeable bonds were issued, eachwith a nominal value of €51.15, for a total nominal amount of€308,956,843.80 representing a 42% premium to the referenceEssilor International share price on the date the final terms were set.The bonds will be redeemed in full on July 2, 2010 (or the next businessday) at a price of €53.54 each, representing around a 4.7% premiumto par. The bonds are convertible into or exchangeable for shares –at Essilor's discretion – on the basis of one Essilor International shareof common stock per bond. There were 6,039,754 bonds outstandingat December 31, 2004.
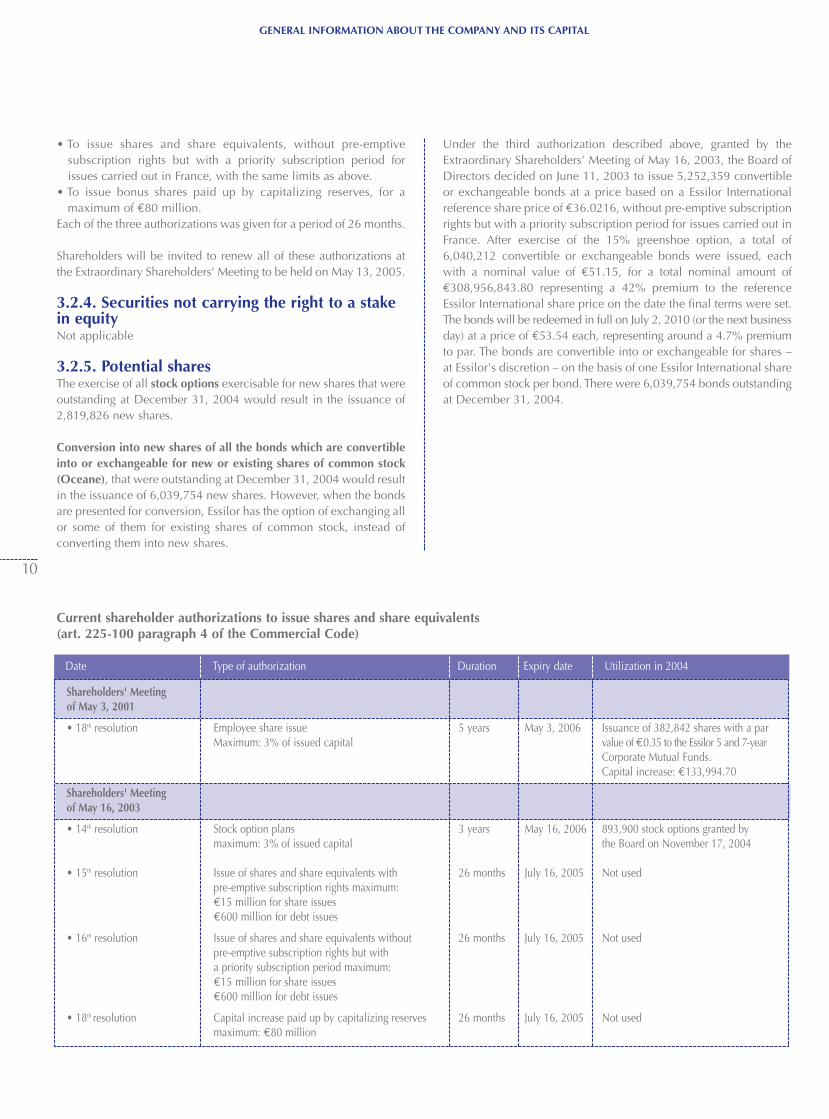
Current shareholder authorizations to issue shares and share equivalents (art. 225-100 paragraph 4 of the Commercial Code)
Shareholders' Meeting of May 3, 2001
• 18th resolution Employee share issue 5 years May 3, 2006 Issuance of 382,842 shares with a parMaximum: 3% of issued capital value of €0.35 to the Essilor 5 and 7-year
Corporate Mutual Funds. Capital increase: €133,994.70
Shareholders' Meetingof May 16, 2003
• 14th resolution Stock option plans 3 years May 16, 2006 893,900 stock options granted by maximum: 3% of issued capital the Board on November 17, 2004
• 15th resolution Issue of shares and share equivalents with 26 months July 16, 2005 Not usedpre-emptive subscription rights maximum: €15 million for share issues€600 million for debt issues
• 16th resolution Issue of shares and share equivalents without 26 months July 16, 2005 Not usedpre-emptive subscription rights but with a priority subscription period maximum:€15 million for share issues€600 million for debt issues
• 18th resolution Capital increase paid up by capitalizing reserves 26 months July 16, 2005 Not usedmaximum: €80 million
GENERAL INFORMATION ABOUT THE COMPANY AND ITS CAPITAL
11
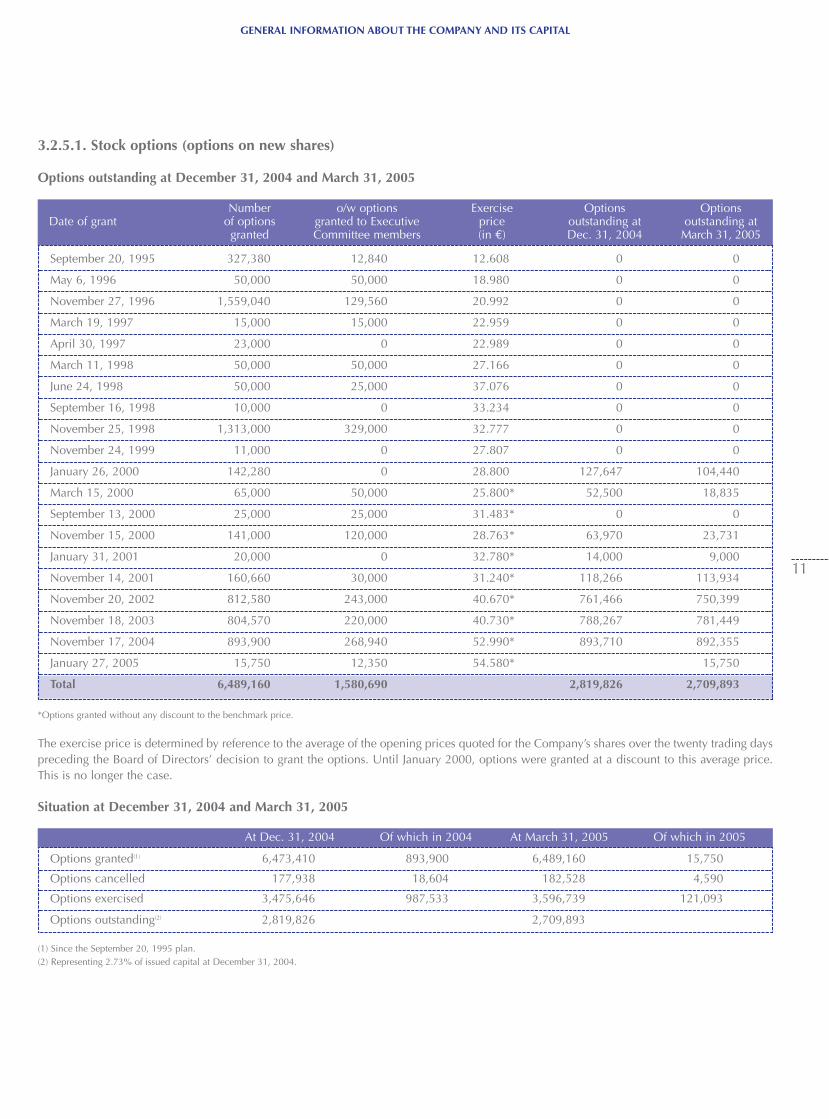
3.2.5.1. Stock options (options on new shares)
Options outstanding at December 31, 2004 and March 31, 2005
*Options granted without any discount to the benchmark price.
The exercise price is determined by reference to the average of the opening prices quoted for the Company’s shares over the twenty trading dayspreceding the Board of Directors’ decision to grant the options. Until January 2000, options were granted at a discount to this average price.This is no longer the case.
Situation at December 31, 2004 and March 31, 2005
(1) Since the September 20, 1995 plan. (2) Representing 2.73% of issued capital at December 31, 2004.
At Dec. 31, 2004 Of which in 2004 At March 31, 2005 Of which in 2005
Number o/w options Exercise Options OptionsDate of grant of options granted to Executive price outstanding at outstanding at
granted Committee members (in €) Dec. 31, 2004 March 31, 2005
September 20, 1995 327,380 12,840 12.608 0 0
May 6, 1996 50,000 50,000 18.980 0 0
November 27, 1996 1,559,040 129,560 20.992 0 0
March 19, 1997 15,000 15,000 22.959 0 0
April 30, 1997 23,000 0 22.989 0 0
March 11, 1998 50,000 50,000 27.166 0 0
June 24, 1998 50,000 25,000 37.076 0 0
September 16, 1998 10,000 0 33.234 0 0
November 25, 1998 1,313,000 329,000 32.777 0 0
November 24, 1999 11,000 0 27.807 0 0
January 26, 2000 142,280 0 28.800 127,647 104,440
March 15, 2000 65,000 50,000 25.800* 52,500 18,835
September 13, 2000 25,000 25,000 31.483* 0 0
November 15, 2000 141,000 120,000 28.763* 63,970 23,731
January 31, 2001 20,000 0 32.780* 14,000 9,000
November 14, 2001 160,660 30,000 31.240* 118,266 113,934
November 20, 2002 812,580 243,000 40.670* 761,466 750,399
November 18, 2003 804,570 220,000 40.730* 788,267 781,449
November 17, 2004 893,900 268,940 52.990* 893,710 892,355
January 27, 2005 15,750 12,350 54.580* 15,750
Total 6,489,160 1,580,690 2,819,826 2,709,893
Options granted(1) 6,473,410 893,900 6,489,160 15,750
Options cancelled 177,938 18,604 182,528 4,590
Options exercised 3,475,646 987,533 3,596,739 121,093
Options outstanding(2) 2,819,826 2,709,893
GENERAL INFORMATION ABOUT THE COMPANY AND ITS CAPITAL
12
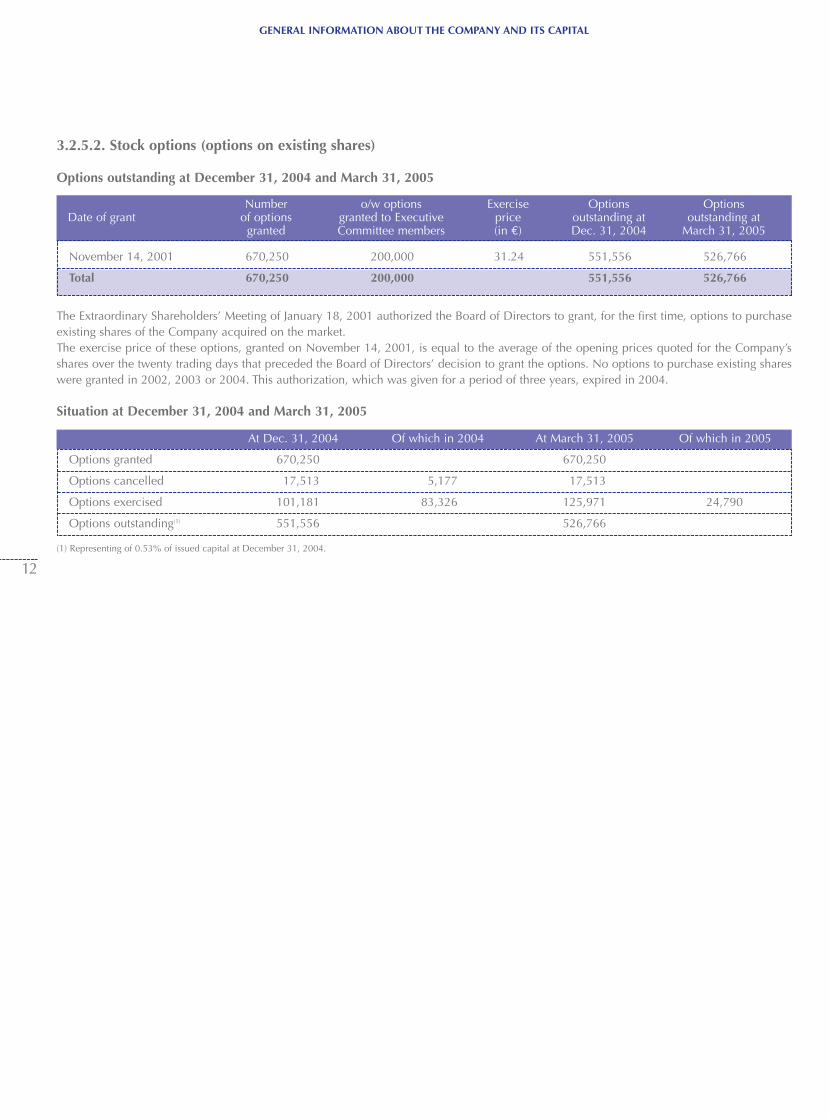
3.2.5.2. Stock options (options on existing shares)
Options outstanding at December 31, 2004 and March 31, 2005
The Extraordinary Shareholders’ Meeting of January 18, 2001 authorized the Board of Directors to grant, for the first time, options to purchaseexisting shares of the Company acquired on the market. The exercise price of these options, granted on November 14, 2001, is equal to the average of the opening prices quoted for the Company’sshares over the twenty trading days that preceded the Board of Directors’ decision to grant the options. No options to purchase existing shareswere granted in 2002, 2003 or 2004. This authorization, which was given for a period of three years, expired in 2004.
Situation at December 31, 2004 and March 31, 20050
(1) Representing of 0.53% of issued capital at December 31, 2004.
Number o/w options Exercise Options OptionsDate of grant of options granted to Executive price outstanding at outstanding at
granted Committee members (in €) Dec. 31, 2004 March 31, 2005
At Dec. 31, 2004 Of which in 2004 At March 31, 2005 Of which in 2005
November 14, 2001 670,250 200,000 31.24 551,556 526,766
Total 670,250 200,000 551,556 526,766
Options granted 670,250 670,250
Options cancelled 17,513 5,177 17,513
Options exercised 101,181 83,326 125,971 24,790
Options outstanding(1) 551,556 526,766
GENERAL INFORMATION ABOUT THE COMPANY AND ITS CAPITAL
13
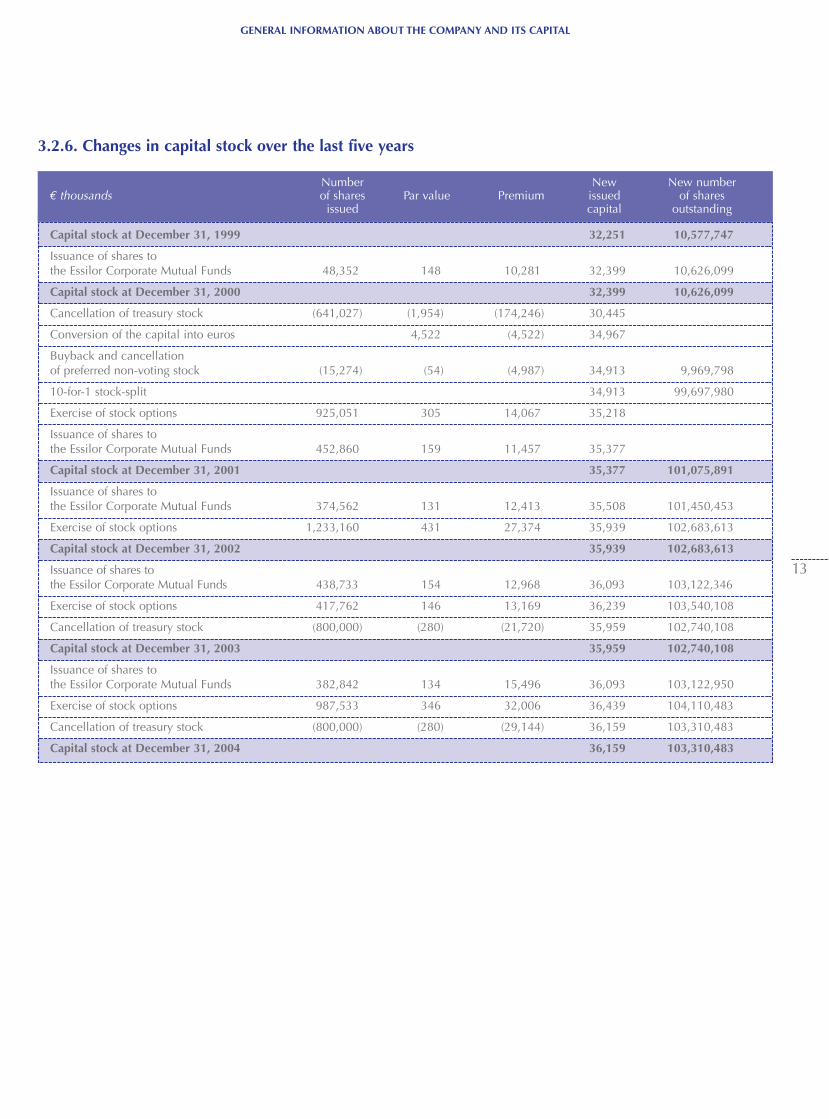
3.2.6. Changes in capital stock over the last five years
Number New New number € thousands of shares Par value Premium issued of shares
issued capital outstanding
Capital stock at December 31, 1999 32,251 10,577,747
Issuance of shares to the Essilor Corporate Mutual Funds 48,352 148 10,281 32,399 10,626,099
Capital stock at December 31, 2000 32,399 10,626,099
Cancellation of treasury stock (641,027) (1,954) (174,246) 30,445
Conversion of the capital into euros 4,522 (4,522) 34,967
Buyback and cancellation of preferred non-voting stock (15,274) (54) (4,987) 34,913 9,969,798
10-for-1 stock-split 34,913 99,697,980
Exercise of stock options 925,051 305 14,067 35,218
Issuance of shares to the Essilor Corporate Mutual Funds 452,860 159 11,457 35,377
Capital stock at December 31, 2001 35,377 101,075,891
Issuance of shares to the Essilor Corporate Mutual Funds 374,562 131 12,413 35,508 101,450,453
Exercise of stock options 1,233,160 431 27,374 35,939 102,683,613
Capital stock at December 31, 2002 35,939 102,683,613
Issuance of shares to the Essilor Corporate Mutual Funds 438,733 154 12,968 36,093 103,122,346
Exercise of stock options 417,762 146 13,169 36,239 103,540,108
Cancellation of treasury stock (800,000) (280) (21,720) 35,959 102,740,108
Capital stock at December 31, 2003 35,959 102,740,108
Issuance of shares to the Essilor Corporate Mutual Funds 382,842 134 15,496 36,093 103,122,950
Exercise of stock options 987,533 346 32,006 36,439 104,110,483
Cancellation of treasury stock (800,000) (280) (29,144) 36,159 103,310,483
Capital stock at December 31, 2004 36,159 103,310,483
GENERAL INFORMATION ABOUT THE COMPANY AND ITS CAPITAL
14
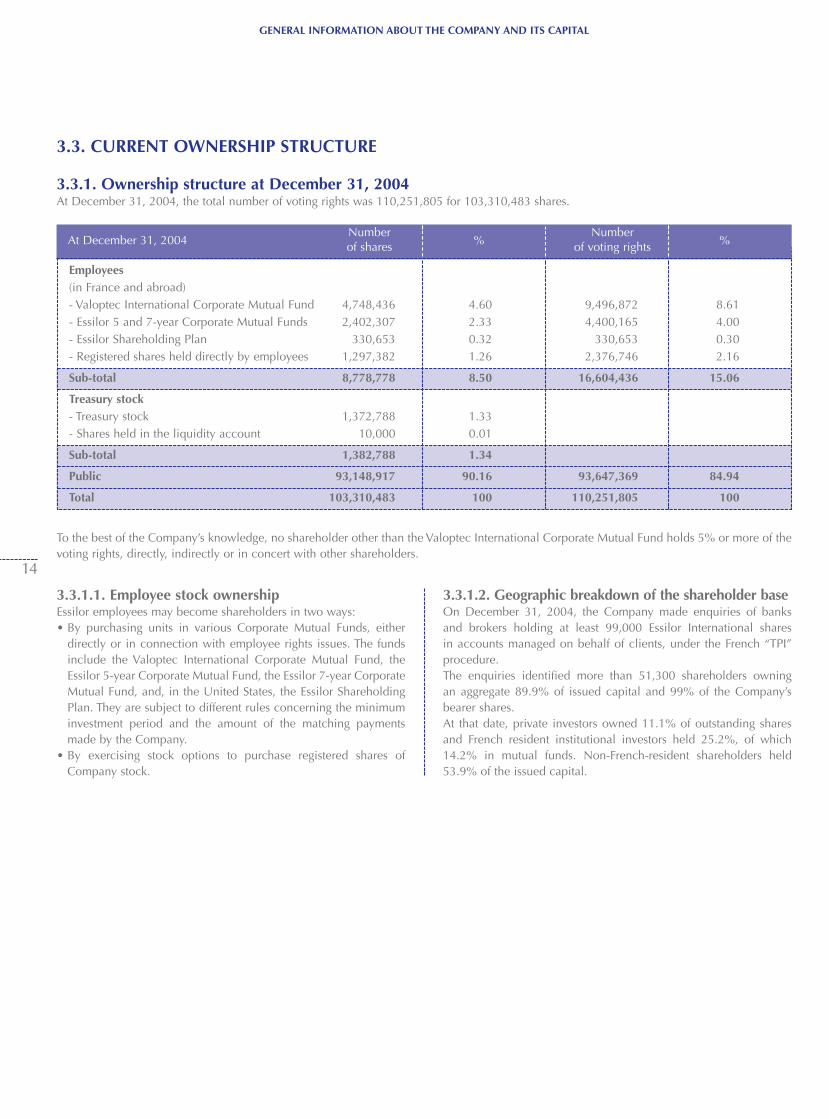
3.3. CURRENT OWNERSHIP STRUCTURE
3.3.1. Ownership structure at December 31, 2004At December 31, 2004, the total number of voting rights was 110,251,805 for 103,310,483 shares.
Employees (in France and abroad)- Valoptec International Corporate Mutual Fund 4,748,436 4.60 9,496,872 8.61- Essilor 5 and 7-year Corporate Mutual Funds 2,402,307 2.33 4,400,165 4.00- Essilor Shareholding Plan 330,653 0.32 330,653 0.30- Registered shares held directly by employees 1,297,382 1.26 2,376,746 2.16
Sub-total 8,778,778 8.50 16,604,436 15.06
Treasury stock- Treasury stock 1,372,788 1.33- Shares held in the liquidity account 10,000 0.01
Sub-total 1,382,788 1.34
Public 93,148,917 90.16 93,647,369 84.94
Total 103,310,483 100 110,251,805 100
3.3.1.1. Employee stock ownershipEssilor employees may become shareholders in two ways:• By purchasing units in various Corporate Mutual Funds, either
directly or in connection with employee rights issues. The fundsinclude the Valoptec International Corporate Mutual Fund, theEssilor 5-year Corporate Mutual Fund, the Essilor 7-year CorporateMutual Fund, and, in the United States, the Essilor ShareholdingPlan. They are subject to different rules concerning the minimuminvestment period and the amount of the matching paymentsmade by the Company.
• By exercising stock options to purchase registered shares ofCompany stock.
3.3.1.2. Geographic breakdown of the shareholder baseOn December 31, 2004, the Company made enquiries of banks and brokers holding at least 99,000 Essilor International shares in accounts managed on behalf of clients, under the French “TPI”procedure. The enquiries identified more than 51,300 shareholders owning an aggregate 89.9% of issued capital and 99% of the Company’sbearer shares.At that date, private investors owned 11.1% of outstanding sharesand French resident institutional investors held 25.2%, of which14.2% in mutual funds. Non-French-resident shareholders held53.9% of the issued capital.
At December 31, 2004Number
%Number
%of shares of voting rights
To the best of the Company’s knowledge, no shareholder other than the Valoptec International Corporate Mutual Fund holds 5% or more of thevoting rights, directly, indirectly or in concert with other shareholders.
At December 31, 2002Number
%Number
%of shares of voting rights
At December 31, 2003Number
%Number
%of shares of voting rights
At December 31, 2004Number
%Number
%of shares of voting rights
GENERAL INFORMATION ABOUT THE COMPANY AND ITS CAPITAL
15
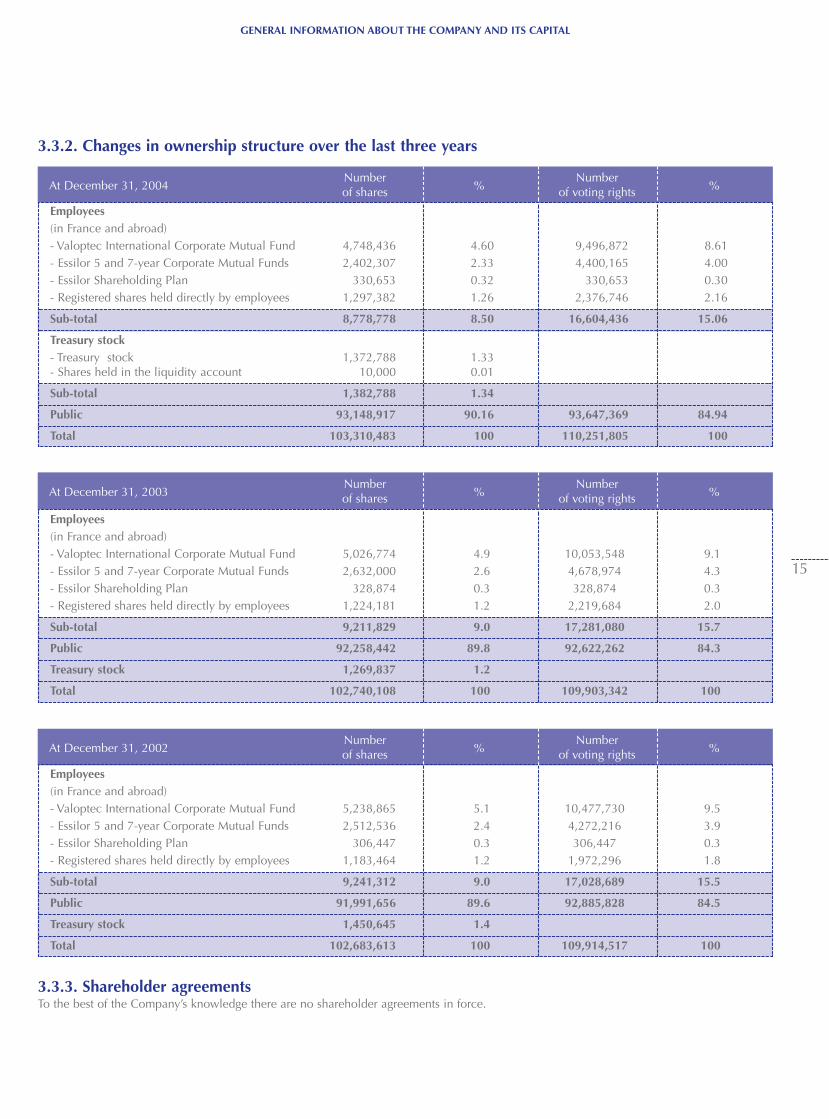
3.3.2. Changes in ownership structure over the last three years
3.3.3. Shareholder agreementsTo the best of the Company’s knowledge there are no shareholder agreements in force.
Employees (in France and abroad)- Valoptec International Corporate Mutual Fund 4,748,436 4.60 9,496,872 8.61- Essilor 5 and 7-year Corporate Mutual Funds 2,402,307 2.33 4,400,165 4.00- Essilor Shareholding Plan 330,653 0.32 330,653 0.30- Registered shares held directly by employees 1,297,382 1.26 2,376,746 2.16
Sub-total 8,778,778 8.50 16,604,436 15.06
Treasury stock- Treasury stock 1,372,788 1.33- Shares held in the liquidity account 10,000 0.01
Sub-total 1,382,788 1.34
Public 93,148,917 90.16 93,647,369 84.94
Total 103,310,483 100 110,251,805 100
Employees(in France and abroad)- Valoptec International Corporate Mutual Fund 5,026,774 4.9 10,053,548 9.1 - Essilor 5 and 7-year Corporate Mutual Funds 2,632,000 2.6 4,678,974 4.3 - Essilor Shareholding Plan 328,874 0.3 328,874 0.3 - Registered shares held directly by employees 1,224,181 1.2 2,219,684 2.0
Sub-total 9,211,829 9.0 17,281,080 15.7
Public 92,258,442 89.8 92,622,262 84.3
Treasury stock 1,269,837 1.2
Total 102,740,108 100 109,903,342 100
Employees(in France and abroad)- Valoptec International Corporate Mutual Fund 5,238,865 5.1 10,477,730 9.5- Essilor 5 and 7-year Corporate Mutual Funds 2,512,536 2.4 4,272,216 3.9- Essilor Shareholding Plan 306,447 0.3 306,447 0.3- Registered shares held directly by employees 1,183,464 1.2 1,972,296 1.8
Sub-total 9,241,312 9.0 17,028,689 15.5
Public 91,991,656 89.6 92,885,828 84.5
Treasury stock 1,450,645 1.4
Total 102,683,613 100 109,914,517 100
Trading volume by Trading volume by High and low number of shares amount (€ millions) share prices (in €)
High Low
GENERAL INFORMATION ABOUT THE COMPANY AND ITS CAPITAL
16
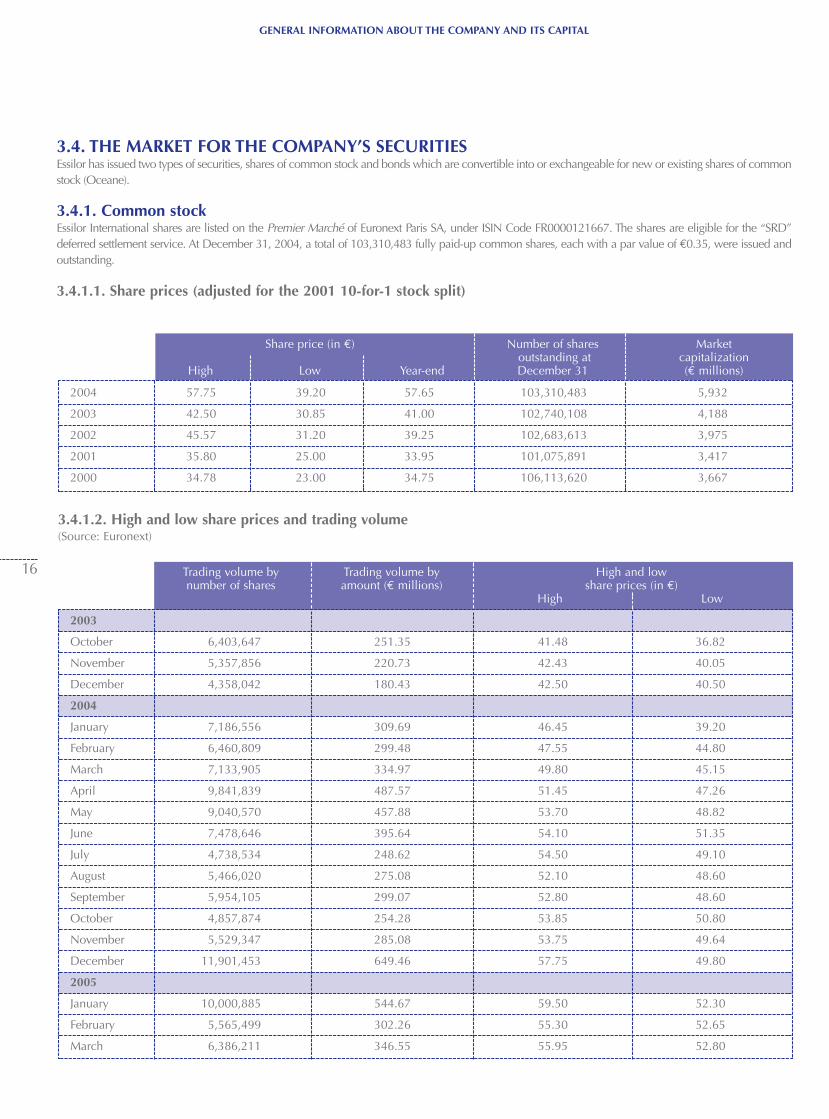
3.4. THE MARKET FOR THE COMPANY’S SECURITIESEssilor has issued two types of securities, shares of common stock and bonds which are convertible into or exchangeable for new or existing shares of commonstock (Oceane).
3.4.1. Common stockEssilor International shares are listed on the Premier Marché of Euronext Paris SA, under ISIN Code FR0000121667. The shares are eligible for the “SRD”deferred settlement service. At December 31, 2004, a total of 103,310,483 fully paid-up common shares, each with a par value of €0.35, were issued andoutstanding.
3.4.1.1. Share prices (adjusted for the 2001 10-for-1 stock split)
Share price (in €) Number of shares Market outstanding at capitalization
High Low Year-end December 31 (€ millions)
2004 57.75 39.20 57.65 103,310,483 5,932
2003 42.50 30.85 41.00 102,740,108 4,188
2002 45.57 31.20 39.25 102,683,613 3,975
2001 35.80 25.00 33.95 101,075,891 3,417
2000 34.78 23.00 34.75 106,113,620 3,667
3.4.1.2. High and low share prices and trading volume(Source: Euronext)
2003
October 6,403,647 251.35 41.48 36.82
November 5,357,856 220.73 42.43 40.05
December 4,358,042 180.43 42.50 40.50
2004
January 7,186,556 309.69 46.45 39.20
February 6,460,809 299.48 47.55 44.80
March 7,133,905 334.97 49.80 45.15
April 9,841,839 487.57 51.45 47.26
May 9,040,570 457.88 53.70 48.82
June 7,478,646 395.64 54.10 51.35
July 4,738,534 248.62 54.50 49.10
August 5,466,020 275.08 52.10 48.60
September 5,954,105 299.07 52.80 48.60
October 4,857,874 254.28 53.85 50.80
November 5,529,347 285.08 53.75 49.64
December 11,901,453 649.46 57.75 49.80
2005
January 10,000,885 544.67 59.50 52.30
February 5,565,499 302.26 55.30 52.65
March 6,386,211 346.55 55.95 52.80
Price (in €) oceanes outstanding High Low Year-end at December 31
Trading volume by Trading volume by High and low number of bonds amount (€ millions) prices (in €)
High Low
GENERAL INFORMATION ABOUT THE COMPANY AND ITS CAPITAL
17
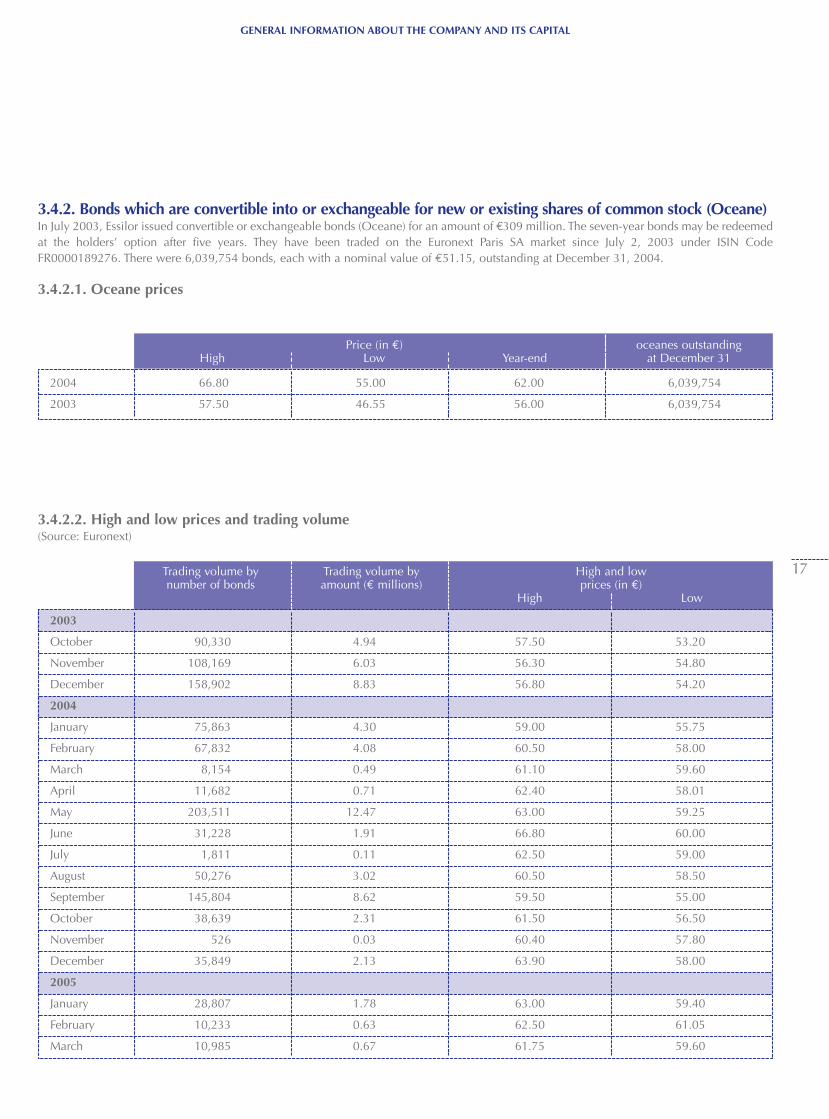
3.4.2. Bonds which are convertible into or exchangeable for new or existing shares of common stock (Oceane)In July 2003, Essilor issued convertible or exchangeable bonds (Oceane) for an amount of €309 million. The seven-year bonds may be redeemedat the holders’ option after five years. They have been traded on the Euronext Paris SA market since July 2, 2003 under ISIN CodeFR0000189276. There were 6,039,754 bonds, each with a nominal value of €51.15, outstanding at December 31, 2004.
3.4.2.1. Oceane prices
2004 66.80 55.00 62.00 6,039,754
2003 57.50 46.55 56.00 6,039,754
2003
October 90,330 4.94 57.50 53.20
November 108,169 6.03 56.30 54.80
December 158,902 8.83 56.80 54.20
2004
January 75,863 4.30 59.00 55.75
February 67,832 4.08 60.50 58.00
March 8,154 0.49 61.10 59.60
April 11,682 0.71 62.40 58.01
May 203,511 12.47 63.00 59.25
June 31,228 1.91 66.80 60.00
July 1,811 0.11 62.50 59.00
August 50,276 3.02 60.50 58.50
September 145,804 8.62 59.50 55.00
October 38,639 2.31 61.50 56.50
November 526 0.03 60.40 57.80
December 35,849 2.13 63.90 58.00
2005
January 28,807 1.78 63.00 59.40
February 10,233 0.63 62.50 61.05
March 10,985 0.67 61.75 59.60
3.4.2.2. High and low prices and trading volume(Source: Euronext)
(€ millions) Net income Total payout Payout ratio
Dividend (in €)*Net dividend Avoir fiscal tax credit Total revenue Paid on
GENERAL INFORMATION ABOUT THE COMPANY AND ITS CAPITAL
18
*Adjusted for the 2001 10-for-1 stock-split.
3.5.2. PayoutTotal dividend payouts for the last five years were as follows:
3.5.3. Timeframe for claiming dividendsDividends not claimed within five years are time-barred, in accordance with the law.
2004 227 77 34%
2003 200 57 28%
2002 182 51 28%
2001 143 41 29%
2000 135 39 29%
3.5. DIVIDENDS
3.5.1. Dividend historyDividends for the last five years were as follows:
2004 0.76 Abolished in 2004 May 18, 2005
2003 0.56 0.28 0.84 May 18, 2004
2002 0.50 0.25 0.75 May 20, 2003
2001 0.41 0.20 0.61 May 28, 2002
2000 0.39 0.19 0.58 May 21, 2001
SECTION IV
Information about the Company's Business
19
Unless otherwise indicated, the information concerning marketshares and positions is based on volumes sold. All references toEssilor’s market share or positioning are based on internal estimates,which may have been made using data from external marketsurveys.
4.1. GENERAL PRESENTATION
4.1.1. Group history
Essilor was created by the 1971 merger of two companies: Sociétédes Lunetiers (Essel), an eyewear manufacturer that traced its originsto the Association Fraternelle des Ouvriers Lunetiers, a workers’cooperative, and Société Industrielle de Lunetterie et d’OptiqueRationnelle (Silor). Essel invented the Varilux® progressive lens,which it patented in 1953 and introduced in 1959, while the founderof Silor, Georges Lissac, developed the Orma® plastic lens in 1954.
In the 1970s, Essilor served global markets primarily throughexports, as a distribution network was gradually set up, first inEurope and the United States, then in Asia.
In the 1980s, Essilor began developing an international presence bytransferring part of its stock lens production to emerging markets. In1979, for example, the first plastic lens plant was opened in thePhilippines. This growth in the global industrial base was supportedby a similar expansion of local distribution capabilities, througheither the acquisition of the local distributor, as in Australia and theNetherlands, or the creation of new subsidiaries, as in Japan andCanada.
Over the past twenty-five years, the Company's geographic reachhas been steadily extended. In the early 1990s, the ophthalmic optical market was reshaped by a wave of mergers and acquisitions,leading to heightened competition. Essilor, which by then hadbecome the worldwide market leader, focused on strengthening itspositions through a global strategy. The commitment to locatingmanufacturing operations in low production cost countries wasextended to higher value-added lenses as well.
In 1995, Essilor acquired Gentex Optics, one of the leading U.S.manufacturers of polycarbonate lenses. At the same time, theCompany developed its prescription lens business, particularly inthe United States where several independent laboratories wereacquired, including Omega in 1996. The 1990s also saw the establishment of two key partnerships. Thefirst, in 1990 with U.S.-based PPG Industries Inc., for the productionof Transitions® variable-tint lenses, while the second, in 1999 withJapan’s Nikon Corp., led to the formation of Nikon Essilor Co Ltd.
This new joint venture combined Essilor’s business interests in Japan,including Japanese marketing rights for the Varilux® brand, with allof Nikon’s ophthalmic optical assets, including worldwide marketingrights for Nikon®-brand products in this segment.
The contact lens business was divested in 2001, completing the strategic refocusing on corrective lenses. The Company then went onto strengthen its presence in the United Kingdom by acquiring theDollond & Aitchison optical chain’s prescription lens laboratories.
In 2002, the Essilor Korea Ltd. joint venture was formed withSamyung Trading Co. Ltd., making Essilor a leading supplier of ophthalmic lenses in South Korea, Asia’s second largest market interms of value.International expansion was also driven by the acquisition of threelaboratories in the United States from CSC Group and of AriesOptical Ltd. in Canada. A subsidiary was created in Mexico following the purchase of a local laboratory. Essilor Instrumentsexpanded its vision testing business with the acquisition of StereoOptical Inc., a US screening equipment manufacturer. In Europe, Essilor opened its first laboratory in Poland and acquireda majority interest in Jacques Denis, a French lens mounting company.
Essilor continued its expansion in 2003 with numerous acquisitions.In the United States, Nassau Lens Company, Omni Optical Lab andOptical Suppliers Inc. were integrated into the Company. Five laboratories were acquired in Canada – Morrison Optical, CustomSurface, Optique de l'Estrie, OPSG and Metro Optical Ltd. – andVision Express’s Indian operations joined the Company. In Germany,Essilor’s subsidiary, BBGR, acquired its local distributor, Rupp undHubrach. The Company strengthened its sunlens business by acquiring BNL in France and Specialty Lens Corp in the United States.
Employee share ownership, a founding principleEssilor has a long tradition of employee share ownership, datingback to the creation of Société Civile Valoptec, a non-trading company set up at the same time as Essilor to hold the 50% of outstanding shares owned by the managers of the new company.Employee participation was further expanded in 1979, when anemployee stock ownership plan was created for employees of companies in France, in the early eighties, when employees outsideFrance were allowed to invest in Valoptec, and in 1997, when theEssilor Shareholding Plan was set up for employees in the United States. Today, Valoptec is an association made up of all employee shareholders who want to actively participate in Essilor’s growthmomentum. Their shares, acquired via employee savings plans withmatching Company payments or through stock option plans, areheld in Corporate Mutual Funds or in the form of registered shares.
INFORMATION ABOUT THE COMPANY'S BUSINESS
20
Valoptec Association is administered by an international Board ofDirectors made up of regional representatives from France, the restof Europe, Asia and the Americas and representatives of the variousemployee categories. Association members – who numbered 2,569at end-2004 – meet twice a year in General Meeting, making anactive contribution to the Company's business, decisions and long-term strategic vision. The Association takes part in corporate decisions through its threeseats on the Essilor Board of Directors.
The Association helps to cement Essilor’s corporate culture, which is based on human values and supported by each employee’sentrepreneurial spirit. At the same time, the Company's participative operating style enables every member of the corporate communityto feel comfortable in his or her role as both employee and investor.
4.1.2. The Company's main businessesEssilor, the world’s leading ophthalmic optical company, designs,manufactures and customizes corrective lenses adapted to each person’s unique vision requirements. Through its broad range of lenses, it provides solutions for correcting myopia, hypermetropia,astigmatism and presbyopia to enable people to regain perfectvision.
The Company's leading brands include:• Varilux® progressive lenses.• Airwear® polycarbonate lenses.• Crizal® anti-reflective treatment.• Transitions® variable-tint lenses.
Essilor serves more than 22% of the global market in volume and 25%in value.
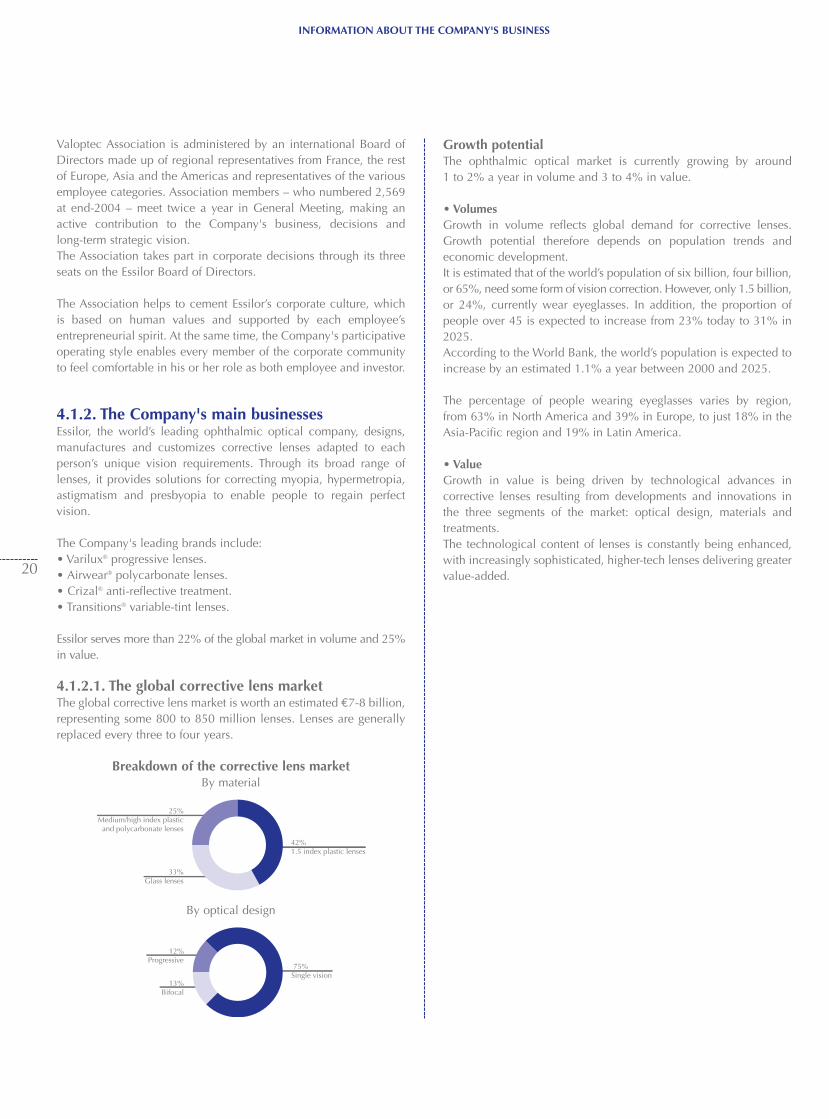
4.1.2.1. The global corrective lens marketThe global corrective lens market is worth an estimated €7-8 billion,representing some 800 to 850 million lenses. Lenses are generallyreplaced every three to four years.
Breakdown of the corrective lens marketBy material
By optical design
Growth potentialThe ophthalmic optical market is currently growing by around 1 to 2% a year in volume and 3 to 4% in value.
• VolumesGrowth in volume reflects global demand for corrective lenses.Growth potential therefore depends on population trends and economic development. It is estimated that of the world’s population of six billion, four billion,or 65%, need some form of vision correction. However, only 1.5 billion,or 24%, currently wear eyeglasses. In addition, the proportion ofpeople over 45 is expected to increase from 23% today to 31% in2025.According to the World Bank, the world’s population is expected toincrease by an estimated 1.1% a year between 2000 and 2025.
The percentage of people wearing eyeglasses varies by region, from 63% in North America and 39% in Europe, to just 18% in the Asia-Pacific region and 19% in Latin America.
• ValueGrowth in value is being driven by technological advances in corrective lenses resulting from developments and innovations inthe three segments of the market: optical design, materials and treatments. The technological content of lenses is constantly being enhanced,with increasingly sophisticated, higher-tech lenses delivering greatervalue-added.
75%Single vision
13%Bifocal
12%Progressive
42%1.5 index plastic lenses
33%Glass lenses
25%Medium/high index plasticand polycarbonate lenses
Material Refraction index(1)
INFORMATION ABOUT THE COMPANY'S BUSINESS
21
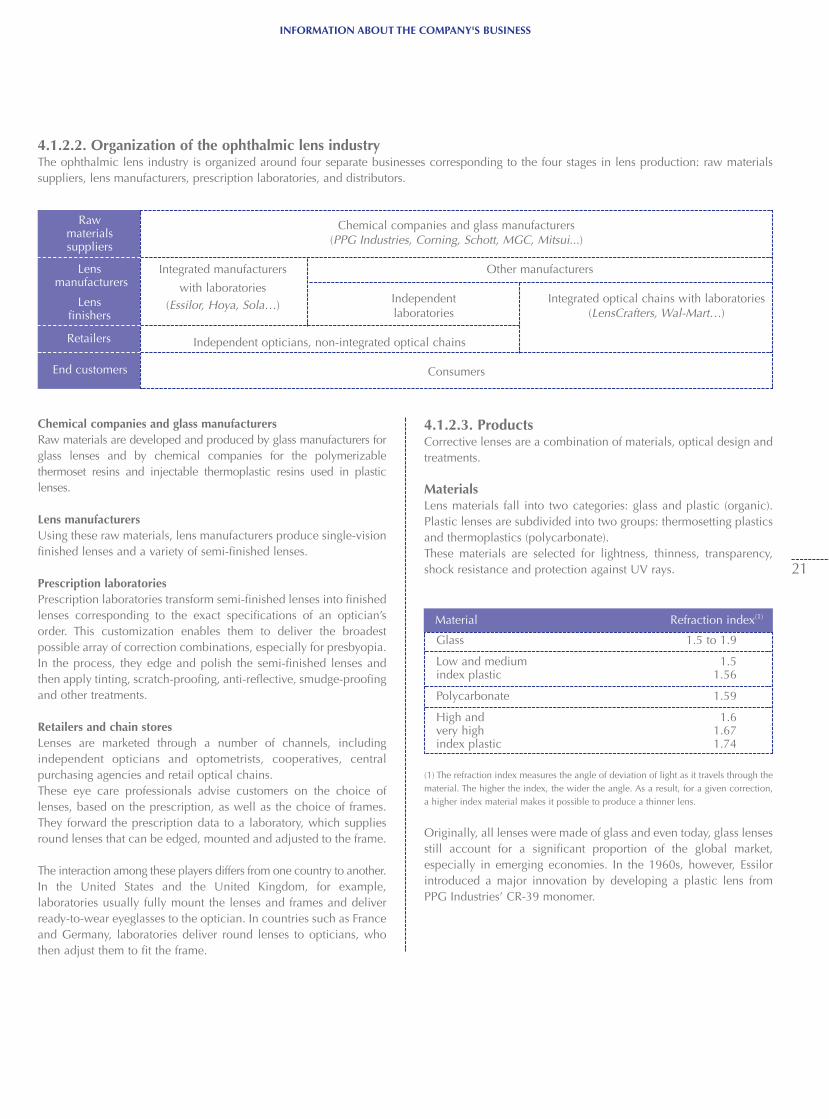
4.1.2.2. Organization of the ophthalmic lens industryThe ophthalmic lens industry is organized around four separate businesses corresponding to the four stages in lens production: raw materialssuppliers, lens manufacturers, prescription laboratories, and distributors.
Retailers
Chemical companies and glass manufacturers(PPG Industries, Corning, Schott, MGC, Mitsui...)
Integrated manufacturers Other manufacturers
with laboratories(Essilor, Hoya, Sola…) Independent Integrated optical chains with laboratories
laboratories (LensCrafters, Wal-Mart…)
Independent opticians, non-integrated optical chains
Consumers
Chemical companies and glass manufacturersRaw materials are developed and produced by glass manufacturers forglass lenses and by chemical companies for the polymerizablethermoset resins and injectable thermoplastic resins used in plasticlenses.
Lens manufacturersUsing these raw materials, lens manufacturers produce single-visionfinished lenses and a variety of semi-finished lenses.
Prescription laboratoriesPrescription laboratories transform semi-finished lenses into finishedlenses corresponding to the exact specifications of an optician’sorder. This customization enables them to deliver the broadest possible array of correction combinations, especially for presbyopia.In the process, they edge and polish the semi-finished lenses andthen apply tinting, scratch-proofing, anti-reflective, smudge-proofingand other treatments.
Retailers and chain storesLenses are marketed through a number of channels, including independent opticians and optometrists, cooperatives, central purchasing agencies and retail optical chains.These eye care professionals advise customers on the choice of lenses, based on the prescription, as well as the choice of frames.They forward the prescription data to a laboratory, which suppliesround lenses that can be edged, mounted and adjusted to the frame.
The interaction among these players differs from one country to another.In the United States and the United Kingdom, for example, laboratories usually fully mount the lenses and frames and deliver ready-to-wear eyeglasses to the optician. In countries such as Franceand Germany, laboratories deliver round lenses to opticians, whothen adjust them to fit the frame.
4.1.2.3. ProductsCorrective lenses are a combination of materials, optical design andtreatments.
MaterialsLens materials fall into two categories: glass and plastic (organic).Plastic lenses are subdivided into two groups: thermosetting plasticsand thermoplastics (polycarbonate).These materials are selected for lightness, thinness, transparency,shock resistance and protection against UV rays.
(1) The refraction index measures the angle of deviation of light as it travels through thematerial. The higher the index, the wider the angle. As a result, for a given correction,a higher index material makes it possible to produce a thinner lens.
Originally, all lenses were made of glass and even today, glass lensesstill account for a significant proportion of the global market,especially in emerging economies. In the 1960s, however, Essilorintroduced a major innovation by developing a plastic lens fromPPG Industries’ CR-39 monomer.
Glass 1.5 to 1.9
Low and medium 1.5index plastic 1.56
Polycarbonate 1.59
High and 1.6very high 1.67index plastic 1.74
Raw materials suppliers
Lensmanufacturers
Lens finishers
End customers
INFORMATION ABOUT THE COMPANY'S BUSINESS
22
Plastic lenses have now become extremely popular in the industrializedworld and are dominant in most developed countries, accounting for90% of all lens sales in the U.S. and Japan, for example. The emergenceof higher-index materials in recent years has led to the developmentof even thinner and lighter lenses.Because they have a naturally high index and are unbreakable, polycarbonate lenses have gained market share around the world,especially since Essilor developed a hardening varnish that hasmade them scratch resistant. Polycarbonate lenses already account
for over 30% of the North American market, and they are enjoyinggrowth of over 10% a year. Essilor has a strong position in polycarbonate lenses in North America and in Europe, thanks toAirwear®, which offers the market’s best combination of thinness,light weight, sturdiness and scratch resistance.
In 2001, the Company introduced Stylis®, the 1.67 ultra-high indexlens, followed in 2004 by Fusio™, the world’s thinnest lens, with anindex of 1.74.
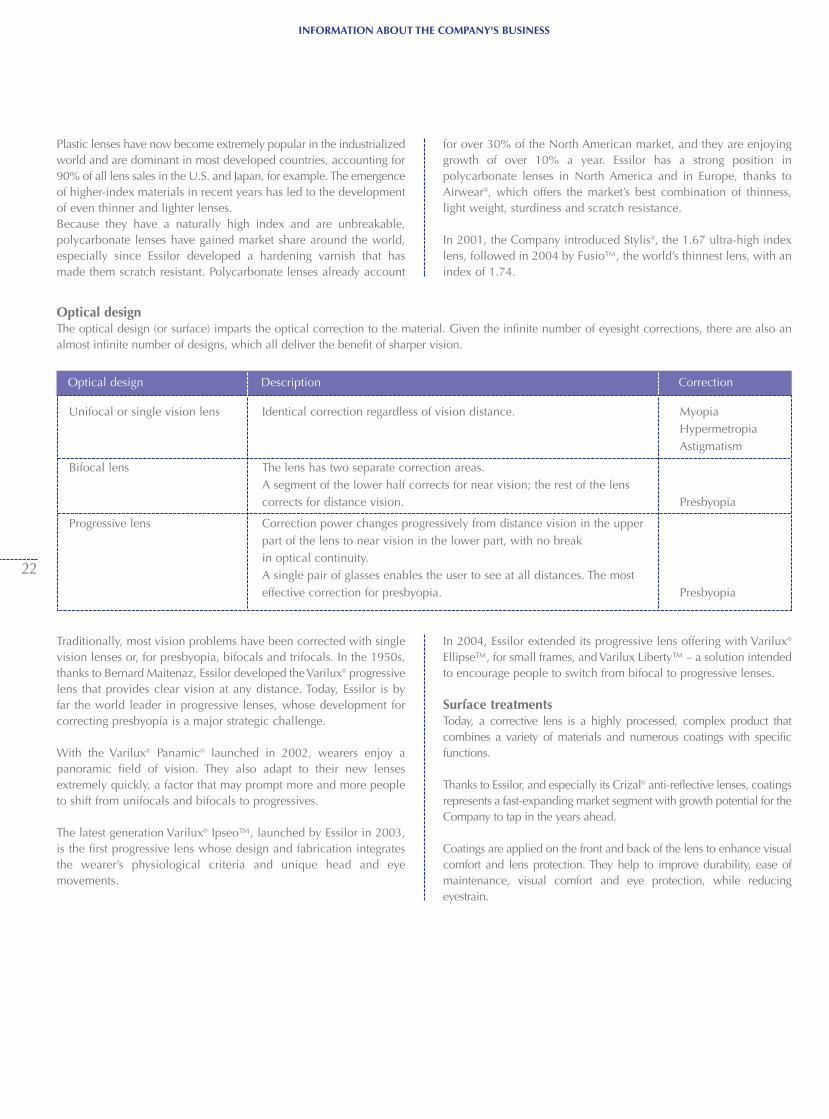
Optical designThe optical design (or surface) imparts the optical correction to the material. Given the infinite number of eyesight corrections, there are also analmost infinite number of designs, which all deliver the benefit of sharper vision.
Optical design Description Correction
Unifocal or single vision lens Identical correction regardless of vision distance. MyopiaHypermetropiaAstigmatism
Bifocal lens The lens has two separate correction areas. A segment of the lower half corrects for near vision; the rest of the lenscorrects for distance vision. Presbyopia
Progressive lens Correction power changes progressively from distance vision in the upperpart of the lens to near vision in the lower part, with no breakin optical continuity.A single pair of glasses enables the user to see at all distances. The mosteffective correction for presbyopia. Presbyopia
Traditionally, most vision problems have been corrected with singlevision lenses or, for presbyopia, bifocals and trifocals. In the 1950s,thanks to Bernard Maitenaz, Essilor developed the Varilux® progressivelens that provides clear vision at any distance. Today, Essilor is by far the world leader in progressive lenses, whose development forcorrecting presbyopia is a major strategic challenge.
With the Varilux® Panamic® launched in 2002, wearers enjoy apanoramic field of vision. They also adapt to their new lenses extremely quickly, a factor that may prompt more and more peopleto shift from unifocals and bifocals to progressives.
The latest generation Varilux® Ipseo™, launched by Essilor in 2003,is the first progressive lens whose design and fabrication integratesthe wearer’s physiological criteria and unique head and eye movements.
In 2004, Essilor extended its progressive lens offering with Varilux®
Ellipse™, for small frames, and Varilux Liberty™ – a solution intendedto encourage people to switch from bifocal to progressive lenses.
Surface treatmentsToday, a corrective lens is a highly processed, complex product that combines a variety of materials and numerous coatings with specificfunctions.
Thanks to Essilor, and especially its Crizal® anti-reflective lenses, coatingsrepresents a fast-expanding market segment with growth potential for theCompany to tap in the years ahead.
Coatings are applied on the front and back of the lens to enhance visualcomfort and lens protection. They help to improve durability, ease ofmaintenance, visual comfort and eye protection, while reducing eyestrain.
INFORMATION ABOUT THE COMPANY'S BUSINESS
23
Anti-reflective lensesIn 2003, the Crizal® Alizé™ antireflective coating was introduced. Its smudge-proof coating, using a nanotechnology-based process,responds to a key customer demand by eliminating cleaning problems. In 2004, Crizal® Alizé™ was successfully rolled out in the majorityof the Company's geographic markets.
Transitions® variable-tint lensesA lens that changes colour depending on the light is called a photochromic lens. While the process may look easy, it relies onextremely complex technology. To be effective, a variable-tint lensmust react quickly to changing light conditions, both indoors andoutdoors, while providing maximum comfort for the wearer in allcircumstances.
Essilor and PPG Industries, one of the world’s leading chemical companies, developed a particularly sophisticated technology forthe Transitions® lens. The latest generation of these lenses,Transitions® V, launched in early 2005, benefits from the most recentinnovations in photochromic pigments that offer both faster changesin color and full protection against UVA and UVB rays. These lensesare positioned in the high index lens market and are available inpolycarbonate and 1.67 index versions.
SunlensesIntroduced in 2003, Essilor’s new lines of prescription sunlenses aremeeting strong demand for lenses that effectively protect the eyeswhile correcting vision. Essilor extended its sunlens offer in 2004 with the launch of a newumbrella brand, Xelios™, which encompasses the Company's fullrange of corrective sunlenses including Physiotints® polarized lenses,Varilux® OpenView™ for wraparound frames and Silver Shadowmirrored lenses.
4.1.2.4. Manufacturing processes
Plastic lensesThe most common process for making plastic lenses consists of pouringthermoset resin between two glass molds, polished to match the convexand concave curves of the lens. A joint or adhesive tape is used to sealthe mold.
The polymerization phase consists of heating the lens at a specific temperature and for a specific period, according to the type of resin andthe mass of the lens.
Polycarbonate lensesPolycarbonate is a thermoplastic organic material. The basic material is in the form of granules that are heated to soften them andthen injected into molds that are the same shape as the lens. Thistechnology can be used to produce lenses of all shapes and sizes,simply by using different molds. The lenses may be finished or semi-finished and ready to be surfaced using similar techniques asthose applied to other materials.
4.1.2.5. A global organizationTo manufacture and customize corrective lenses, Essilor has set upa global network of production plants and prescription laboratories,whose organization is tailored to local market demand.
Production plantsIn 2004, Essilor’s 17 manufacturing plants around the globe produced180 million finished and semi-finished lenses, corresponding to240,000 different references. The role of the plants is to guaranteeconstant supplies of finished and semi-finished lenses to subsidiariesand direct customers, in accordance with customer specifications, withthe best service level and at the lowest cost.
Treatment Description
Anti-reflective Thin integrated layer that eliminates light reflections on lenses. Improves appearance as well as sharpness of vision (night vision) and contrast sensitivity.
Scratch-proofing Hardening coat that protects lens against scratches.
Smudge-proofing Water-repellent topcoat that prevents dirt deposits on the lens and makes it easier to clean.
Photochromic In-depth treatment that enables lens to darken in brighter light and becomes clear in shade.
UV protection Treatment that provides greater eye protection from UVA and UVB rays, which are harmful for the crystalline lens, retina, and other parts of the eye.
Polarization Lens that incorporates a filter that removes glare and dazzle caused by light reflectionson flat surfaces (water, roads, snow).
Tinting Tinted lens for enhanced appearance and to reduce sun glare.
North and South America Europe Asia-Pacific
Plant locations and date established (data as of December 31, 2004)
INFORMATION ABOUT THE COMPANY'S BUSINESS
24
Prescription laboratoriesPrescription laboratories transform semi-finished stock lenses intofinished lenses, responding to the myriad of possible correctioncombinations and delivering lenses corresponding exactly to orderspecifications. They surface the back of the lens, add tinting and ananti-reflective treatment and/or edge the lens to fit the frame. Theymust constantly keep pace with the technological developmentsrequired to expand the Group’s product catalogue.
As of the end of 2004, the network of laboratories operated byEssilor and the Nikon-Essilor joint venture comprised 183 unitscovering virtually all of the world’s ophthalmic lens markets, as follows:
United States Canada Europe Asia-Pacific Latin America
87 29 32 32 3
Many independent laboratories also distribute Essilor products,extending the network to provide local service for eyecare professionals worldwide.
Logistics centersLogistics centers take delivery of finished and semi-finished lenses andship them to the distribution subsidiaries and prescription laboratories.There are 12 centers worldwide: 6 in Asia, 2 in Europe, 2 in NorthAmerica and 2 in South America.
4.1.2.6. Research and developmentIn 2004, the equivalent of nearly 5% of consolidated sales was budgeted to the Research and Development Department. Of thisamount, the equivalent of around 4% of sales was allocated toresearch and development activities and the balance to engineeringand technical support.
The 500-strong research team is spread among four R&D centers,with 330 people working at the Saint-Maur center in France, 90 inFlorida in the United States, around 40 at the Nikon-Essilor center inJapan and approximately 15 at the new center in Singapore, whichwas inaugurated in 2004. This newly-created Singapore center hasbeen set up to foster local scientific talent with the ultimate aim ofintegrating the specific needs of the Asian market into theCompany's offerings.Around 20 more people work in the R&D departments of the manufacturing plants and prescription laboratories.
Research and development activities concern both optical propertiesand materials (substrates and surface treatments), with support provided by the Quality Department. The R&D Department is alsoin charge of cross-functionally managing new product developmentthrough its integrated New Products Department.
Another role of the R&D Department is to establish partnershipswith outside research organizations and universities to conductresearch into new technologies. In late 2004 a joint laboratory wasset up with France's National Center for Scientific Research (CNRS)and the University of Toulouse with the aim of developing new surface treatment technologies.
Essilor technologies have also been successfully combined withtechnologies developed by its partners PPG Industries in variable-tintlenses and Nikon Corp. in materials and surface treatments.
As of end-2004, the Company had more than 2,300 patents andpatents pending in France and abroad for 300 different productfamilies. The number of patent applications has increased sharply inrecent years and in 2003 and 2004 filings were made for over 100new inventions. The portfolio does not include patents held by theTransitions and Nikon-Essilor joint ventures.
As of December 31, 2004, the Company had a total of 17 plants worldwide. The Mouy facility (France) included in the above table was closedon February 28, 2005. The table does not include:• The two plants in China and South Korea held by Chemiglas, which is a subsidiary of Essilor Korea, a 50/50 joint venture set up between
Essilor and Samyung Trading Co.Ltd,• The production units of BNL in France and Specialty Lens Corp in the United States, which were both acquired in 2003.
United States• Carbondale, Pennsylvanie – 1995• Dudley, Massachusetts - 1995Mexico• Chihuahua - 1985Puerto Rico• Ponce - 1986Brazil• Manaus - 1989
Ireland• Ennis - 1991• Limerick - 1974France• Dijon - 1972• Ligny en Barrois (Les Battants) - 1959• Mouy - 1972• Sézanne - 1974
Philippines• Mariveles - 1980• Laguna - 1999Thailand• Bangkok - 1990China• Shanghai - 1997India• Bangalore - 1998Japan• Nikon Essilor plant – Nasu – 2000
€ millions 2004 (3) 2003 (3) 2002 (1)
€ millions 2004 2003 Change
INFORMATION ABOUT THE COMPANY'S BUSINESS
25
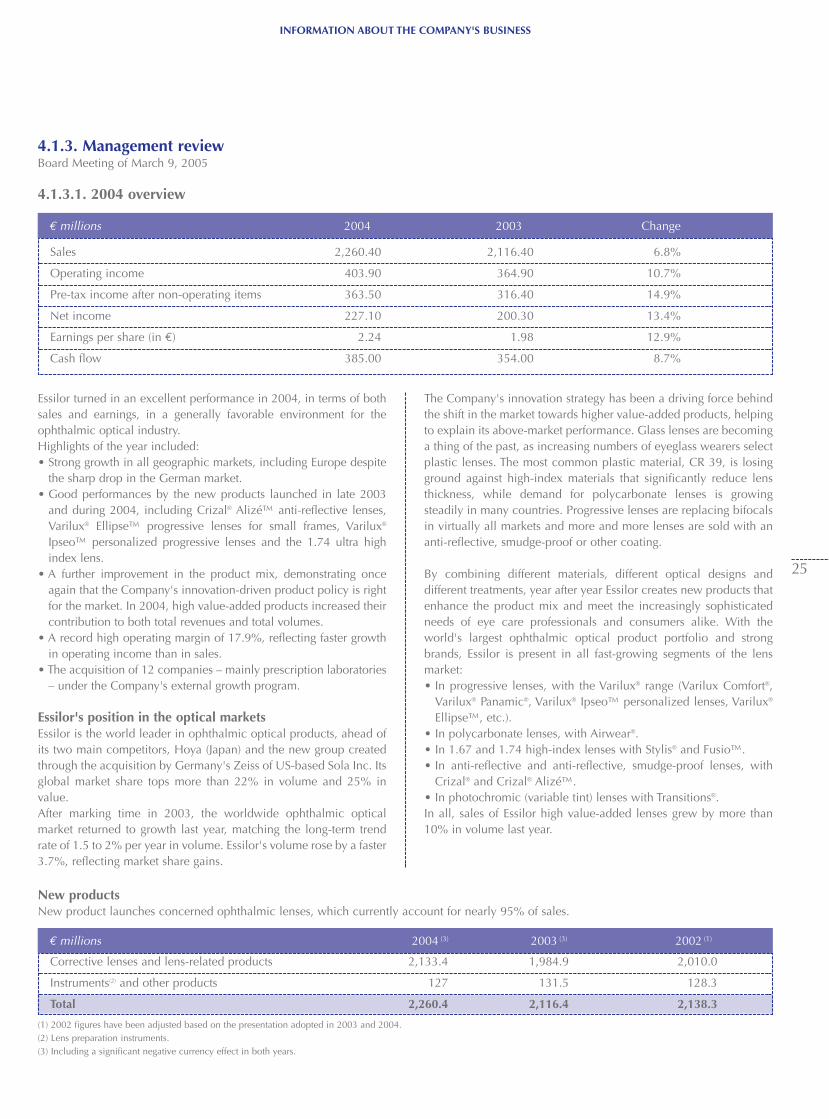
Sales 2,260.40 2,116.40 6.8%
Operating income 403.90 364.90 10.7%
Pre-tax income after non-operating items 363.50 316.40 14.9%
Net income 227.10 200.30 13.4%
Earnings per share (in €) 2.24 1.98 12.9%
Cash flow 385.00 354.00 8.7%
Essilor turned in an excellent performance in 2004, in terms of bothsales and earnings, in a generally favorable environment for theophthalmic optical industry.Highlights of the year included:• Strong growth in all geographic markets, including Europe despite
the sharp drop in the German market.• Good performances by the new products launched in late 2003
and during 2004, including Crizal® Alizé™ anti-reflective lenses,Varilux® Ellipse™ progressive lenses for small frames, Varilux®
Ipseo™ personalized progressive lenses and the 1.74 ultra highindex lens.
• A further improvement in the product mix, demonstrating onceagain that the Company's innovation-driven product policy is rightfor the market. In 2004, high value-added products increased theircontribution to both total revenues and total volumes.
• A record high operating margin of 17.9%, reflecting faster growthin operating income than in sales.
• The acquisition of 12 companies – mainly prescription laboratories– under the Company's external growth program.
Essilor's position in the optical marketsEssilor is the world leader in ophthalmic optical products, ahead ofits two main competitors, Hoya (Japan) and the new group createdthrough the acquisition by Germany's Zeiss of US-based Sola Inc. Itsglobal market share tops more than 22% in volume and 25% invalue.After marking time in 2003, the worldwide ophthalmic opticalmarket returned to growth last year, matching the long-term trendrate of 1.5 to 2% per year in volume. Essilor's volume rose by a faster3.7%, reflecting market share gains.
The Company's innovation strategy has been a driving force behindthe shift in the market towards higher value-added products, helpingto explain its above-market performance. Glass lenses are becominga thing of the past, as increasing numbers of eyeglass wearers selectplastic lenses. The most common plastic material, CR 39, is losingground against high-index materials that significantly reduce lensthickness, while demand for polycarbonate lenses is growingsteadily in many countries. Progressive lenses are replacing bifocalsin virtually all markets and more and more lenses are sold with ananti-reflective, smudge-proof or other coating.
By combining different materials, different optical designs anddifferent treatments, year after year Essilor creates new products thatenhance the product mix and meet the increasingly sophisticatedneeds of eye care professionals and consumers alike. With theworld's largest ophthalmic optical product portfolio and strongbrands, Essilor is present in all fast-growing segments of the lensmarket: • In progressive lenses, with the Varilux® range (Varilux Comfort®,
Varilux® Panamic®, Varilux® Ipseo™ personalized lenses, Varilux®
Ellipse™, etc.).• In polycarbonate lenses, with Airwear®.• In 1.67 and 1.74 high-index lenses with Stylis® and Fusio™.• In anti-reflective and anti-reflective, smudge-proof lenses, with
Crizal® and Crizal® Alizé™.• In photochromic (variable tint) lenses with Transitions®.In all, sales of Essilor high value-added lenses grew by more than10% in volume last year.
4.1.3. Management reviewBoard Meeting of March 9, 2005
4.1.3.1. 2004 overview
New productsNew product launches concerned ophthalmic lenses, which currently account for nearly 95% of sales.
Corrective lenses and lens-related products 2,133.4 1,984.9 2,010.0
Instruments(2) and other products 127 131.5 128.3
Total 2,260.4 2,116.4 2,138.3
(1) 2002 figures have been adjusted based on the presentation adopted in 2003 and 2004.(2) Lens preparation instruments.(3) Including a significant negative currency effect in both years.
Change in 2004 sales Reported Like-for-like Acquisitions Currency effect
INFORMATION ABOUT THE COMPANY'S BUSINESS
26
The forty new products launched in 2003 and 2004 represented asignificant growth driver. Key among these was Varilux® Ellipse™, aprogressive lens specially designed for the small frames that are currently the height of fashion. Launched in almost all regions in2004, Varilux® Ellipse™ was an instant success and sales took offvery rapidly. The range of materials offered will be extended in 2005.A new all-purpose progressive lens, Varilux Liberty™, was introducedin a certain number of European countries and in North America,targeting bifocals wearers.
The rollout of Varilux® Ipseo™ continued as planned. This product isnow on sale in most markets in Europe and Asia, as well as inCanada. Sales ramp up is slightly slower because opticians have toinstall equipment to measure head and eye movements. It is beingintroduced in the United States in 2005.
Crizal® Alizé™ has proved extremely popular among opticians andconsumers alike since its launch at the end of 2003. The lens'shighly effective anti-smudge coating successfully addresses the maincomplaint of anti-reflective lens users, by reducing dirt build-up andmaking the lens much easier to clean. In addition, for opticians theCrizal® Alizé™ patented technology gives the lenses a unique advantage over competing products with regard to edging operations.The new lens's performance and properties have helped to drivegrowth in the anti-reflective market in many countries, enablingEssilor to further increase its market share.All these successes have been largely innovation-driven, amplyconfirming the quality of the strategy followed by Essilor for a number of years now. This strategy has enabled the Company toextend its leadership in growing, high value-added segments, settingit even further apart from the other players in the ophthalmic opticalmarket.
SunlensesIn 2003, the Company decided to step up its activities in the correctivesunlens market, which is growing at the rate of around 12% per year.In 2004, Essilor outperformed the market.
A full range of corrective sunlenses has been developed under theblanket Xelios™ brand for both traditional and wraparound frames.The range comprises both progressive and unifocal lenses and offersa broad choice of materials and surface treatments.
Several techniques are used to make these lenses. In particular,Essilor has developed tinting techniques which ensure that naturalcolors are not distorted whatever the lens color or the mirror effect.Demand has been growing for polarized lenses, which prevent dazzle and cut down reflected light from smooth surfaces such aswater, snow or highways. The 2003 acquisition of US-basedSpecialty Lens Corp. has extended Essilor's expertise in this area,and in 2004 polarized lens production began at the Mexico plant. A range of polarized polycarbonate corrective lenses has been onsale in North America since the second half of 2004 and in Europesince the beginning of 2005.
Essilor has also started offering its expertise to sunglass framemanufacturers and agreements have already been signed withseveral companies, including Silhouette and Oakley. These framesoften have complex shapes – for example curved or wraparound –making it difficult to design corrective lenses to fit them. TheCompany is also manufacturing non-corrective sunlenses, leveragingthe additional capacity provided by the 2003 acquisition of BNL, aFrench specialist in high-end polarized and polycarbonatesunlenses.
€ millions 144.0 123.6 96.5 (76.1)
% 6.8% 5.8% 4.6% (3.6)%
Group sales
Consolidated sales rose 6.8% in 2004 to €2,260.4 million. Excluding the currency effect, the growth rate was 10.4%, which was more than thetarget announced at the beginning of the year.
Like-for-like sales grew by 5.8%, a very satisfactory performance considering the sharp drop in Germany. Excluding Germany, like-for-like saleswere up 8.6%, a rate significantly above the Company's trend rate.Changes in the scope of consolidation boosted sales by 4.6%, with the companies acquired in 2003 and 2004 adding €96.5 million to the total.A total of 12 companies were acquired in 2004 (see “Acquisitions”).The negative currency effect, which was mainly due to the fall in the US dollar, was limited to 3.6%.
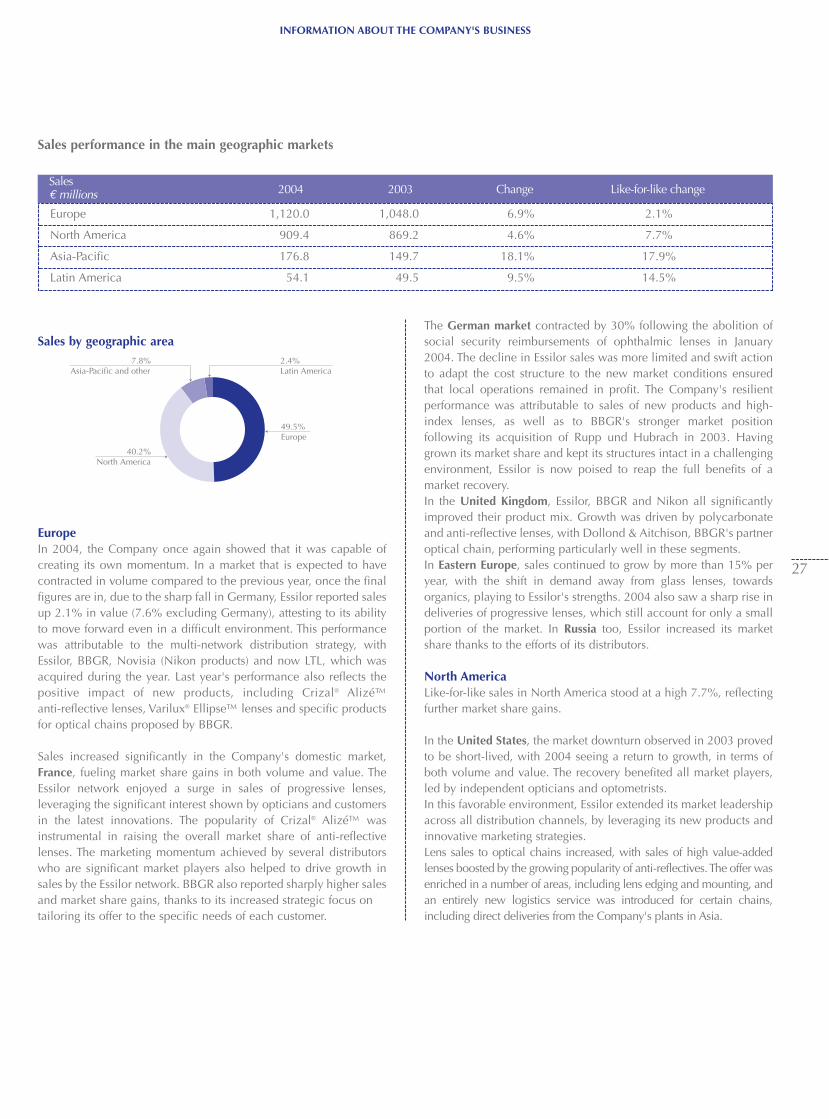
Sales € millions 2004 2003 Change Like-for-like change
Europe 1,120.0 1,048.0 6.9% 2.1%
North America 909.4 869.2 4.6% 7.7%
Asia-Pacific 176.8 149.7 18.1% 17.9%
Latin America 54.1 49.5 9.5% 14.5%
INFORMATION ABOUT THE COMPANY'S BUSINESS
27
Sales performance in the main geographic markets
Sales by geographic area
EuropeIn 2004, the Company once again showed that it was capable ofcreating its own momentum. In a market that is expected to havecontracted in volume compared to the previous year, once the finalfigures are in, due to the sharp fall in Germany, Essilor reported salesup 2.1% in value (7.6% excluding Germany), attesting to its abilityto move forward even in a difficult environment. This performancewas attributable to the multi-network distribution strategy, withEssilor, BBGR, Novisia (Nikon products) and now LTL, which wasacquired during the year. Last year's performance also reflects thepositive impact of new products, including Crizal® Alizé™ anti-reflective lenses, Varilux® Ellipse™ lenses and specific productsfor optical chains proposed by BBGR.
Sales increased significantly in the Company's domestic market,France, fueling market share gains in both volume and value. TheEssilor network enjoyed a surge in sales of progressive lenses, leveraging the significant interest shown by opticians and customersin the latest innovations. The popularity of Crizal® Alizé™ was instrumental in raising the overall market share of anti-reflective lenses. The marketing momentum achieved by several distributorswho are significant market players also helped to drive growth insales by the Essilor network. BBGR also reported sharply higher salesand market share gains, thanks to its increased strategic focus on tailoring its offer to the specific needs of each customer.
The German market contracted by 30% following the abolition ofsocial security reimbursements of ophthalmic lenses in January2004. The decline in Essilor sales was more limited and swift actionto adapt the cost structure to the new market conditions ensured that local operations remained in profit. The Company's resilientperformance was attributable to sales of new products and high-index lenses, as well as to BBGR's stronger market position following its acquisition of Rupp und Hubrach in 2003. Havinggrown its market share and kept its structures intact in a challengingenvironment, Essilor is now poised to reap the full benefits of a market recovery.In the United Kingdom, Essilor, BBGR and Nikon all significantlyimproved their product mix. Growth was driven by polycarbonateand anti-reflective lenses, with Dollond & Aitchison, BBGR's partneroptical chain, performing particularly well in these segments.In Eastern Europe, sales continued to grow by more than 15% peryear, with the shift in demand away from glass lenses, towards organics, playing to Essilor's strengths. 2004 also saw a sharp rise indeliveries of progressive lenses, which still account for only a smallportion of the market. In Russia too, Essilor increased its marketshare thanks to the efforts of its distributors.
North AmericaLike-for-like sales in North America stood at a high 7.7%, reflectingfurther market share gains.
In the United States, the market downturn observed in 2003 provedto be short-lived, with 2004 seeing a return to growth, in terms ofboth volume and value. The recovery benefited all market players,led by independent opticians and optometrists.In this favorable environment, Essilor extended its market leadershipacross all distribution channels, by leveraging its new products andinnovative marketing strategies.Lens sales to optical chains increased, with sales of high value-addedlenses boosted by the growing popularity of anti-reflectives. The offer wasenriched in a number of areas, including lens edging and mounting, andan entirely new logistics service was introduced for certain chains,including direct deliveries from the Company's plants in Asia.
49.5%Europe
40.2%North America
7.8%Asia-Pacific and other
2.4%Latin America
INFORMATION ABOUT THE COMPANY'S BUSINESS
28
Essilor also strengthened its position in the independent optician andoptometrist markets, with a highly innovative product offer comprisingCrizal® Alizé™, Varilux® Ellipse™ and Varilux Liberty™, which wereall launched in 2004. These three products were enthusiasticallywelcomed by eyecare professionals and rapidly acquired significantmarket shares. Crizal® Alizé™ is already the biggest-selling anti-reflective lens and has been a powerful engine for growth in thismarket in the United States, where more than one-in-five lenses soldin 2004 had an anti-reflective coating. Essilor leveraged this successby continuing to deploy its proprietary anti-reflective technologies,not only in its own laboratories but also with independent laboratoriesunder partnership agreements.Nassau, the US market's leading distributor of stock lenses, was successfully integrated following its acquisition by Essilor in 2003.The independent laboratories acquired in 2003 were integrated inthe US network, which is organized on a regional basis in order togive each region the autonomy needed to offer customers a betterservice. Additional laboratories were acquired in 2004 (see“Acquisitions”).VisionWeb, the Internet platform set up to serve the entire opticalindustry went from strength to strength. A growing number ofprescription lenses are ordered on line by opticians andoptometrists, prescription laboratories and optical chains, whoappreciate the efficiency of a system that eliminates errors andenables optometrists to track the entire process from manufacture tofinishing. During the year, VisionWeb also continued to extend itsservice capability in the area of insurance claim and reimbursementmanagement for opticians and optometrists.
In Canada, where the market picked up after two years in the doldrums,Essilor's sales rose 7.2% like-for-like. New products acted as significantgrowth drivers. The service offer for optical practitioners was extended,including with the introduction of deliveries to major chains fromdedicated plants. The virtual prescription lens laboratory, allowingopticians and optometrists to order an exclusive range of productson line for delivery within 24 to 48 hours, enjoyed growing success.
Asia-PacificAsia-Pacific was Essilor's fastest-growing geographic market, withlike-for-like sales up 17.9%. 2004 was an excellent year throughoutthe region, characterized by more than 20% growth in many countries and market share gains. Sales were higher in all countries,without exception, and the adverse effects of the SARS epidemic on2003 performance were more than offset, with fourth quarter salesconsiderably above those for the year-earlier period which wereboosted by the post-SARS catch-up.
Essilor is represented in Japan by Nikon-Essilor, which is jointlyowned on a 50/50 basis by the two companies. After several difficultyears, the market revived in 2004, especially in the second half.Nikon-Essilor significantly outperformed the market, increasing itspenetration rate. The Nikon brand premium products are very popular among opticians, helping to drive growth in sales to opticalchains.
Presio W, a new progressive lens produced using digital surfacingtechnology, was launched during the year and sales of 1.74 highindex lenses continued to grow. Outside Japan, Nikon-Essilor's two subsidiaries in Canada and theUnited Kingdom had an excellent year, helping to further increasethe jointly-owned subsidiary's total contribution to Essilor's earnings.In China, the rapid shift in demand away from glass lenses towardsorganics fueled a sharp increase in sales. A major optician trainingprogram boosted sales by the Essilor network of high value-addedlenses such as polycarbonates, prescription lenses and Varilux®
progressive lenses. Korea-based Chemiglas, owned by Essilor Korea,also reported significantly higher sales in China, particularly involume, leading the company to double capacity at its Chinesehigh-index lens plant. These results confirm the value of Essilor'smulti-channel strategy in China. 2004 was also a very good year in Korea.In India, the creation of a network of Varilux® consultants and the existence of well-trained opticians led to a sharp rise in sales bythe local marketing subsidiary powered by the rapid take-off of progressive lenses. Essilor also benefited from the shift in demandtowards plastic lenses, although glass lenses continue to dominatethe market, and from significant sales of prescription lenses. Duringthe year, the Company launched its first press and billboard advertising campaign directed at the general public. In the rest of Asia, sales increased very significantly in Hong Kong,Indonesia and the Philippines.Australia and New Zealand repeated the good performances achieved in previous years, helped by robust sales of anti-reflectiveand variable-tint lenses.
Latin AmericaAfter several difficult years and the 2000-2001 currency devaluations, the Latin American economy recovered some of its vigor. Essilorexpanded rapidly across almost the entire region, and the Varilux® rangeincreased its market share. In all, the Company's sales in the regionincreased 14.5% like-for-like.In Brazil, sales grew at a satisfactory rate in volume and, above all, invalue. Progressive lenses went from strength to strength, led by Varilux®,leading to significant market share gains. Anti-reflectives also performedwell, thanks mainly to the success of Crizal®.Sales also increased in Mexico, driven by progressive and polycarbonatelenses. A reorganization plan was implemented, to match structures to the size of the business. The market offers good growth potential, with high-value added products still accounting for only a smallproportion of total sales. Argentina is recovering quickly from the 2002 economic crisis. Plastic lens sales are growing as glass lenses fall out of favor, and progressive lenses are steadily increasing their market share, enhancingthe product mix.Sales were encouraging in the other countries of the region, such as Colombia, Peru, Venezuela, Ecuador, Guatemala and the Caribbean,where Essilor is present through distributors. The sales force was strengthened and marketing efforts were focused on progressive lenses, leading to a healthy increase in sales.
INFORMATION ABOUT THE COMPANY'S BUSINESS
29
InstrumentsEssilor is also the world leader in lens edging instruments for opticians and prescription laboratories, and in vision screening instruments for schools and other institutions responsible for performing medical check-ups. In 2004, Essilor Instruments' sales contracted by 6.9%, due in partto the fall in the dollar and the crisis in the German market whichaffected the lens edging market as much as the lens market.Excluding Germany, sales in Europe were up slightly compared with2003. In the United States, lens edging instrument sales declined inrelation to a very high basis of comparison in 2003, when an exceptionally large delivery was made to an optical chain. EssilorInstruments chalked up outstanding performances in China and therest of Asia, in Latin America and in Canada. In the United States,the integration of Stereo Optical acquired in 2002 boosted the visionscreening business, which enjoyed a very strong second half thanksto the success of its new range. Like the other businesses, the Instruments division invests heavily in research and development to create new products and servicesthat respond every more closely to the needs of an increasingly segmented market.
Research and developmentProductivity in the area of new product development increases yearafter year, with nearly 40 new products brought to market in 2004compared with 30 in 2003 and 22 in 2002.In 2004, €107.2 million was spent on research and development.Combined spending on pure R&D and engineering represented justunder 5% of sales. Essilor is unusual in that its research effort is directed primarilytowards increasing the comfort of eyeglass wearers. The analysis ofhead and eye movements that led to the development of Varilux®
Ipseo™ personalized lenses is the result of 20 years' research into eyeglass wearer behavior. The development of digital surfacing techniques created the opportunity to put the knowledge acquiredinto practice. Varilux® Ipseo™ shows what can be achieved by bringing together two different areas of research, digital technologyand behavioral studies. The Toulouse research center set up jointly with the CNRS (French National Center for Scientific Research) is now up and running, providing a textbook example of successful cooperation between a company, a research institute and a university. The researchinto nanotechnologies conducted at the center represents a long-termproject that should lead to applications in several areas, including thetreatments and materials of the future.A growing number of projects are carried out jointly with Nikon teamsat the Nikon-Essilor research center in Japan, which focuses on meeting the specific needs of the local market, particularly for highindex lenses and related varnishes. The activities of this center areincreasingly integrated in Essilor's medium to long-term vision andinnovation strategy. In Asia, another research center has been opened in Singapore tomonitor technological advances outside Japan and develop new prescription lens production processes.
Production and capital expenditureIn 2004, overall growth in lens production was driven by highervolumes of high index, polycarbonate, variable-tint and anti-reflectiveorganic lenses, which more than offset the continued steady declinein production of glass lenses and low index organics. By region, production volumes increased in Asia and Latin America,remained flat in Europe and contracted in North America, mainlydue to the discontinuation of production at the Park Street plant inthe United States, which has now been closed. Improved polycarbonate lens production processes led to enhancedquality at a sharply lower cost. At the same time, higher productionvolumes for 1.67 index lenses fuelled significant productivity gains. The main capital expenditure projects concerned increases in production capacity for 1.6 and 1.67 index lenses, polycarbonatesand anti-reflectives. Lastly, in 2004 a plan was initiated for the closure – effectiveFebruary 2005 – of the Mouy mold plant in France. The closure wasnecessary because mold needs have declined significantly in recentyears due to productivity gains. A program of measures was drawnup to help the 40 employees of the Mouy plant to find alternativeemployment within or outside the Company.
Prescription lens laboratoriesAs of end-2004, the Company owned 183 prescription lens laboratoriesof varying sizes. During the year, these laboratories surfaced, edgedand applied surface treatments to some 40 million lenses. 2004 saw the deployment of digital surfacing technology for Varilux®
Ipseo™ lenses to several laboratories, as well as a marked shifttowards higher value-added lenses driven by the one-third increasein US anti-reflectives production.Further advances were made in the program to interconnectEuropean laboratories, in order to achieve a better match betweenmarket demand and installed capacity.In the United States, Crizal® Alizé™ technology continued to be rolled out to Essilor laboratories and to the independent laboratoriesthat distribute Varilux® lenses. In Asia, the Company opened a surfacingand anti-reflective treatment unit in the Philippines and another inIndia.In addition, a major program was launched to reconfigure the globalprescription lens production and finishing organization. The laboratoriesare called on to perform increasingly complex operations, using awide range of advanced techniques to produce ever more sophisticatedlenses. For example, today's lenses may undergo as many as 23 surfacetreatments. At the same time, the market is becoming increasinglysegmented, with significant differences in demand from one countryand even from one customer to another.To reduce the time required to bring new products and techniquesto market and remain competitive in terms of cost, quality and service, the engineering department has been strengthened in orderto become the drive belt between the R&D units and the downstreamplants and laboratories that use the same technologies. Technicalplatforms will be set up in each region to develop technologies thatrespond to the specific needs of the region's customers.
INFORMATION ABOUT THE COMPANY'S BUSINESS
30
This reorganization will strengthen the emphasis on innovation andlead to increased efficiency, by helping the Company to respondmore swiftly to changing market demand and reducing the time-to-market of new products.
LogisticsThe Logistics function is responsible for guaranteeing supply chainefficiency from the Essilor plants to the central warehouses,marketing subsidiaries and prescription lens laboratories and fromthere to the end customer. It is tasked with ensuring that the rightproduct is delivered to the right customer at the right time, whileholding down supply chain costs and inventory levels. Logistics is amission-critical function, considering Essilor's global presence –with plants in each region called on to supply markets in otherregions – and the very broad product offer. Essilor has the world'slargest ophthalmic optical product portfolio, with some 240,000different references currently held in inventory.In recent years, supply chain operations and inventory managementhave been optimized by raising skill levels and making increasinguse of information technology, without losing sight of the core aim of maintaining the highest standards of service quality. In 2004, a 5-year action plan was launched to keep pace with the faster rateof product development and the resulting increase in the volume offlows and references to be managed.
AcquisitionsEssilor continued to implement its acquisition policy in 2004,expanding its positions in the prescription lens laboratory andfinished lens distribution sectors. In all, the companies acquiredduring the year represent annual sales of €78 million.
Two acquisitions were made in Europe: • LTL, which has strengthened Essilor's position in finished lens
distribution and contributed to its multiple network strategy in Italyand Europe. LTL, which started life as a glass lens manufacturer,began selling plastic lenses directly to laboratories and wholesalersin 1990 and its customer base now spans Italy, the rest of Europe,the Middle East and South Africa. It also has its own prescriptionlens laboratory. With 140 employees, LTL reported sales of €32million in 2003.
• Delamare-Sovra, a French producer of lens surfacing consumableswith annual sales of €3 million.
In the United States, Essilor acquired controlling interests of 80% or100% in six prescription lens laboratories:• 21st Century Optics, based in Long Island City, Queens (New York
City). 21st Century Optics has 120 employees and annual sales of$15.5 million. It distributes the Varilux® and Crizal® brands.
• Tri Supreme, a long-standing partner of Essilor based inFarmingdale, Long Island, close to New York, has annual sales of$14 million and 95 employees.
• Select Optical, one of the leading independent laboratories in thestate of Ohio, with annual sales of $9.8 million and 80 employees.
• Opal-Lite, a Varilux® distributor based in El Monte, a suburb of LosAngeles in California, with annual sales of $4.6 million and 44employees.
• Dunlaw Optical Laboratories Inc., based in Lawton, Oklahoma,with annual sales of $2 million.
• Spectrum Optical Inc., based in Sauk Rapids, Minnesota, withannual sales of $4.1 million and 30 employees.
In Canada, Essilor acquired Optic Lison and Nikon-Essilor Canadaacquired 50% of Tech Cite. These two prescription lens laboratoriesrepresent combined annual sales of €3 million.
In Australia, the Company acquired 50% of City Optical, based in Reversby, a suburb of Sydney. City Optical is one of Australia's leading independent laboratories, with annual sales of AUD 6 million(around €3.6 million) and 23 employees. In India, Essilor strengthened its position in the Mumbai (Bombay)region, by acquiring a controlling interest in Vijay Vision PrivateLimited, a prescription lens laboratory, and its subsidiary BeautyGlass, representing annual sales of €1 million.
4.1.3.2. 2004 financial review
Projects undertaken in 2004In the area of finance and accounting, 2004 was devoted to preparingthe transition to IFRS. Working with the external auditors, the IFRSproject team identified and measured the main effects of the IFRSadjustments to the 2004 pro forma consolidated financial statements.These effects are described in section 5. The first reported IFRS datawill concern first-quarter 2005 sales, followed by first-half 2005sales and results.The internal audit team was strengthened in 2004 and “Loi de SécuritéFinancière” (LSF) compliance work was continued, with the rollout ofan internal control self-assessment system to the subsidiaries.
€ millions 2004 2003 2002
2004 increase in operating income Reported Like-for-like Acquisitions Currency
INFORMATION ABOUT THE COMPANY'S BUSINESS
31
Results
Cost of sales – operating expenses Gross margin – corresponding to sales less cost of sales – dipped to 60.3% of sales from 60.6% in 2003. The overall product mix improved in 2004, but the effect was cancelled by the inclusion of newly-acquired companies whose product mix and margins generally fall short of the Company average. At the same time, however, acquisitions fuelled a 0.9-point improvement in the operating expense ratio (operating expenses expressed as a percentage of sales), because of their leaner structure and resulting lower overheads.
€ millions 39.1 49.2 7.1 (17.2)
In % 10.7% 13.5% 1.9% (4.7)%
Operating income increased 10.7% to €403.9 million, while operatingmargin rose 0.7 points to 17.9%, reflecting:• Satisfactory margins and sound cost discipline.• Improved profitability in the United States and all other regions,
except in Germany.• Improved results at Transitions.
Net interest expenseNet interest expense rose 1.8% to €34.1 million. Interest charges netof investment income declined but cash discounts awarded to customers increased, as a result of higher sales, and write-downs ofinvestments in non-consolidated companies were also up comparedwith 2003.
Non-operating expensesNon-operating expenses amounted to €6.3 million versus €14.9million. Costs for 2004 mainly concerned the closure of the ParkStreet plant in the United States (€1.5 million) and measures to assistemployees affected by the closure of the Mouy plant in France (€4.1million).
Pre-tax income after non-operating itemsPre-tax income after non-operating items came to €363.5 million, an increase of 14.9%.
Corporate income taxThe effective tax rate paid by the Company stood at 28% versus28.5% in 2003. The decrease was attributable to the improvedperformance of several subsidiaries, enabling deferred tax assets tobe recognized for their tax loss carryforwards.
Net income of companies accounted for by the equity methodThe main companies accounted for by the equity method are44.95%-owned VisionWeb and 15.13%-owned Bacou-Dalloz.In 2004, this item represented a negative €8.1 million, comparedwith a negative €2.9 million the previous year, reflectingexceptional losses incurred by Bacou-Dalloz.
Amortization of goodwillAmortization of goodwill increased to €25.9 million from €22.5million, reflecting the large number of acquisitions made in 2003and 2004.
Net income and earnings per shareNet income before minority interests rose 13.2% to €227.8 million,representing 10.1% of sales versus 9.5% in 2003. Net income cameto €227.1 million, an increase of 13.4%. Earnings per share were up12.9% at €2.24.
Capital expenditure net of the proceeds from asset sales 154.9 139.9 140
Depreciation and amortization (excluding amortization of goodwill) 118.4 122.8 127.4
Financial investments 115.4 150.2 37.2
Cash flow 385.0 354.0 335.4
Operating income and operating margin
Balance sheet
Inventories and working capitalInventories rose 3.1% to €319.1 million at December 31, 2004 from €309.6 million at end-2003. On a like-for-like basis, the increase was3.5%, representing less than the growth in sales.
Capital expenditure and financial investments
€ millions
INFORMATION ABOUT THE COMPANY'S BUSINESS
32
Capital expenditure net of the proceeds from asset sales amounted to €155 million in 2004, representing 6.9% of sales. The Companyincreased its spending on mass production capacity, to keep pace with higher sales volumes, and also extended the prescription lenslaboratories' anti-reflective treatment capacity.Financial investments totaled €115.4 million. Of the total, €69.7 million was spent on acquisitions (see "Acquisitions") and €45.7 millionmainly on share buybacks. Debt
The Company's improved profitability, robust performance and flat working capital led to a €131.3 million positive swing from net debt to anet cash position of €34 million, representing 3% of shareholders' equity. This was achieved despite the increase in the dividend and the majorinvestment program.
Ratios• Return on equity (ROE)
Return on equity – corresponding to the ratio of net income to shareholders' equity – climbed to 17% in 2004 from 16.6% the previous year.The ratio has risen steadily in recent years, reflecting the Company's improved profitability and steps taken to limit growth in the number ofshares outstanding.
• Return on assets (ROA)Return on assets – corresponding to the ratio of Ebit (earnings before interest and tax) to net assets – increased in each of the last five years,thanks to tight control over working capital which offset the effects of sustained capital expenditure. The ratio stood at 26.8% in 2004 versus24.1% the previous year.
Operating cash flow 383.4 Capital expenditure net of the proceeds from asset sales (1) 154.9
Proceeds from employee share issue 48.0 Change in working capital, currency effect and provisions (31.6)
Dividends 61.9
Financial investments net of the proceeds from disposals (1) 114.0
Reduction in net debt 131.3
(1) In all, the proceeds from disposals of property, plant and equipment and investments totaled €5.6 million in 2004.
4.1.3.3. Capital stock
Changes in capital stock in 2004Changes in capital stock in 2004 were as follows:• €280,000 reduction, through the cancellation of 800,000 shares held in treasury.• €345,636.55 increase, excluding premiums, corresponding to the issue of 987,533 new shares on exercise of stock options.• €133,994.70 increase, excluding premiums, corresponding to the issue of 382,842 new shares to the Essilor 5 and 7-year employee stock
ownership plans (FCPE Groupe Essilor).
Ownership structure at December 31, 2004At December 31, 2004, the Company's share capital was €36,158,669.05, made up of 103,310,483 shares of common stock, each with a par value of €0.35 and all fully paid.
Employees (in France and abroad)- Valoptec International Corporate Mutual Fund 4,748,436 4.60 9,496,872 8.61- Essilor 5 and 7-year Corporate Mutual Funds 2,402,307 2.33 4,400,165 4.00- Essilor Shareholding Plan 330,653 0.32 330,653 0.30- Registered shares held directly by employees 1,297,382 1.26 2,376,746 2.16
Sub-total 8,778,778 8.50 16,604,436 15.06
Treasury stock- Treasury stock 1,372,788 1.33- Liquidity account 10,000 0.01
Sub-total 1,382,788 1.34
Public 93,148,917 90.16 93,647,369 84.94
Total 103,310,483 100 110,251,805 100
At December 31, 2004 Number of shares % Number of voting rights %
INFORMATION ABOUT THE COMPANY'S BUSINESS
33
To the best of the Company's knowledge, no shareholder other thanthe FCPE Valoptec International corporate mutual fund holds morethan 5% of the voting rights.
Stock options (options on new shares)
At December 31, 2004 o/w in 2004
Options granted (1) 6,473,410 893,900
Options cancelled 177,938 18,604
Options exercised 3,475,646 987,533
Options outstanding (2) 2,819,826
(1) Since the September 20, 1995 plan.(2) Representing the equivalent of 2.73% of common stock outstanding at December
31, 2004.
Stock options (options on existing shares)
At December 31, 2004 o/w in 2004
Options granted 670,250
Options cancelled 17,513 5,177
Options exercised 101,181 83,326
Options outstanding (1) 551,556
(1) Representing the equivalent of 0.53% of common stock outstanding at December 31, 2004.
The exercise price of both categories of options is equal to the averageof the opening prices quoted for the Company's shares over thetwenty trading days that precede the Board meeting at which theoption grants are decided, without any discount.
Treasury stockAt December 31, 2003, Essilor held 1,269,837 shares in treasury.During 2004, 986,277 shares were bought back at an average priceof €49, for the purpose of being cancelled, 10,000 shares were purchased under the liquidity contract, 800,000 shares were cancelledand 83,326 shares were sold on exercise of stock options at a priceof €31.24. Following these movements, at December 31, 2004,Essilor held 1,382,788 shares in treasury, representing 1.34% ofcapital stock.
4.1.3.4. Parent company accounts and appropriationof 2004 incomeKey figures from the parent company's 2004 accounts are as follows:
€ millions 2004 Change
Sales 658 1.2%
Operating income 63 2.5%
Operating margin 9.6%
Income before non-operating items and tax 179 14.5%
Net income 164 13.8%
Essilor International sales rose 1.2%. Lens sales in the French marketincreased significantly, while instrument sales were slightly higher.Logistics center revenues from deliveries to subsidiaries wereadversely affected by the drop in German lens sales in a difficultmarket. Sales by the Puerto Rican branch continued to decline, dueto lower 1.5-index lens sales in North America.
Operating income rose slightly. The buoyant French market andincreased revenues from subsidiaries – including royalties for theuse of production processes owned by Essilor International and feesfor the use of computer applications developed by the Company forthe entire group – helped to offset the increase in research anddevelopment and engineering expenditure, as well as the rise inpayroll and real estate costs.
Net interest income rose sharply, reflecting an improvement in theCompany's cash position and higher dividend income fromsubsidiaries, including the special dividend paid by Transitions at theend of the year.
The income tax charge, which reflects the structure of theCompany's income statement, was slightly higher than in 2003.
Net income came to €164 million, an increase of 13.8%.
The Board of Directors is recommending an increase in the netdividend to €0.76 per share from €0.56 for 2003. The recommendeddividend represents a payout rate of nearly 34% of consolidated netincome, which is in line with the average among quoted companies.The 35.7% increase in the dividend per share reflects the Company'sgood performance in 2004 and the abolition of the précomptedividend equalization tax.
The dividend will be paid as from May 18, 2005, in cash only.
In € 2003 2002 2001 2000 1999
In €
INFORMATION ABOUT THE COMPANY'S BUSINESS
34
2004 income appropriation
Net income for the year 163,638,162.10
Retained earnings brought forward from prior year 6,785,707.81
Appropriation to the legal reserve (19,963.13)
Transfer from the long-term capital gains reserve
Income available for distribution 170,403,906.79
Transfer to the long-term capital gains reserve
First dividend 2,169,520.14
Additional dividend 75,295,528.06
Total dividend 77,465,048.20 77,465,048.20
Précompte dividend equalization tax
Transfer to other reserves 88,000,000.00
Unappropriated retained earnings 4,938,858.59
Total 170,403,906.79
Common shares
Net dividend 0.56 0.50 0.41(1) 3.90 3.40
Tax paid in advance 0.28 0.25 0.20(1) 1.95 1.70
Total revenue 0.84 0.75 0.61(1) 5.85 5.10
Preferred non-voting shares
Net dividend 4.02 3.52
Tax paid in advance 2.01 1.76
Total revenue 6.03 5.28
Dividends paid in the last five years were as follows:
4.1.3.5. Financial authorizations
Renewal of the authorization to buy back Company's shares
In May 2004, the Annual Shareholders' Meeting authorized the Board of Directors to buy back Essilor International sharesrepresenting up to 10% of the Company's capital stock on the date ofpurchase, as allowed under Articles L.225-209 et seq. of theCommercial Code. The authorization was given for a period of 18 months expiring on November 14, 2005.The Board of Directors successively used the authorizations given atthe Annual Shareholders' Meetings of May 16, 2003 and May 14,2004, to purchase 986,277 shares in the period between January 1and December 31, 2004, at an average price of €49 per share. No shares were sold during the period. At December 31, 2004, theCompany held 1,382,788 shares in treasury, representing 1.34% of
capital stock at that date. This information is disclosed in accordancewith Article L.225-211 of the Commercial Code. At this year's AnnualShareholders' Meeting, to be held on May 13, 2005, the Board ofDirectors will ask shareholders to roll over this authorization on thefollowing terms:• In accordance with the Market Abuse directive 2003/6/EC dated January 28, 2003 addressing insider dealing and market manipulation, which came into effect on October 12, 2004 and isincorporated in the regulations of the Autorité des Marchés Financiers,the shares may be bought back solely for the following purposes:
- for cancellation; - for allocation on exercise of stock options and other stock grants,
including stock grants without consideration governed by ArticleL.225-197-1 of the Commercial Code, made to Companyemployees and management;
- for allocation on conversion or exchange of debt securities
(1) after 10-for-1 stock-split carried out in 2001
INFORMATION ABOUT THE COMPANY'S BUSINESS
35
convertible or exchangeable for shares of the Company;- to ensure the liquidity of the Company's shares under a liquidity
contract that complies with a Code of ethics recognized by theAutorité des Marchés Financiers;
- for delivery or exchange in connection with future external growthtransactions.
• The shares may not be bought back at a price in excess of €75 andmay not be resold at a price of less than €35, as adjusted ifnecessary to take into account the effects of any corporate actions.
• The shares may be purchased, sold or transferred and paid for byany appropriate method, on an organized or over-the-countermarket (including through straight purchases, or the use of financial instruments or derivatives or the implementation of optionsstrategies). The entire share buyback program may be implementedthrough a single block purchase.The authorization is being sought for a period of eighteen months.
Financial authorizations to be voted in Extraordinary Shareholders'Meeting
The Board of Directors is seeking a 24-month authorization to cancel shares held in treasury, representing the equivalent of up to10% of issued shares. The purpose of the cancellations would be toreduce the dilutive effect of employee stock options.
The Board is also seeking a 38-month authorization to grant stockoptions equivalent to up to 3% of the Company’s share capital, andto grant shares representing up to 1% of capital (corresponding toeither shares held in treasury or newly-issued shares) to employeesand officers of the Company and/or of any companies that are atleast 10%-owned by the Company, directly or indirectly, withoutconsideration. The ceilings of 3% and 1% are not cumulative.
Finally, the Board is asking shareholders to renew authorizationsgiven at earlier meetings. However, in accordance with the newsecurities legislation (government order no. 2004-604 dated June24, 2004, ratified and amended by Act no. 20041343 datedDecember 9, 2004 and Decree no. 2005-112 dated February 10,2005 amending and adding to Decree no. 67-236 dated March 23,1967), the related resolutions concern:• 26-month authorization to issue shares and securities which are
convertible, redeemable, exchangeable or otherwise exercisablefor shares, with pre-emptive subscription rights (share issues arecapped at €25 million, debt issues are capped at €800 million).
• 26-month authorization to issue shares and securities which areconvertible, redeemable, exchangeable or otherwise exercisablefor shares, without pre-emptive subscription rights but with a priority subscription right at the Board's discretion (share issuesare capped at €7 million, debt issues are capped at €800 million).Issues carried out under this authorization would be deductedfrom the maximum amount available under the authorization toissue shares and securities with pre-emptive subscription rights.
• 26-month authorization to increase the Company’s share capitalby up to €300 million, by capitalizing retained earnings, income,additional paid-in capital or other capitalizable amounts.
• 26-month authorization to issue new shares for cash and to grantnewly-issued shares or share equivalents without consideration tomembers of an Employee Share Ownership Plan, in accordancewith the law including Articles L.225-129, L.225-129-6 andL.225-138 of the Commercial Code and Article L.443-5 of theLabor Code. These issues and grants would be made to membersof an Employee Share Ownership Plan set up by EssilorInternational or a related company, within the meaning of ArticleL.225-180 of the Commercial Code. Shares issued under thisauthorization would not exceed the equivalent of 3% of the shares outstanding at the issue date.
4.1.3.6. Annual Shareholders' MeetingThis year's combined Annual and Extraordinary Shareholders'Meeting will be called for the first time on May 4, 2004 and will beheld on second call on:
Friday, May 13, 2005at 10:30 a.m.
at Palais de la BoursePlace de la Bourse - 75002 Paris
4.1.3.7. 2005 outlookIn 2005, Essilor will continue to implement its strategy of launchinginnovative products and making targeted acquisitions in the ophthalmic lens sector.The year began with the launch of the fifth generation Transitions®
polycarbonate lenses and 1.67 very high-index lenses. The worldwiderollout of Varilux® Ipseo™, Crizal® Alizé™ and Varilux® Ellipse™will continue, along with the marketing of 1.74 ultra-high indexlenses throughout the networks.Two more prescription lens laboratories have recently been acquiredin the United States, Vision-Craft Inc. based in Detroit, Michigan,and Midland Optical, based in Saint Louis, Missouri.
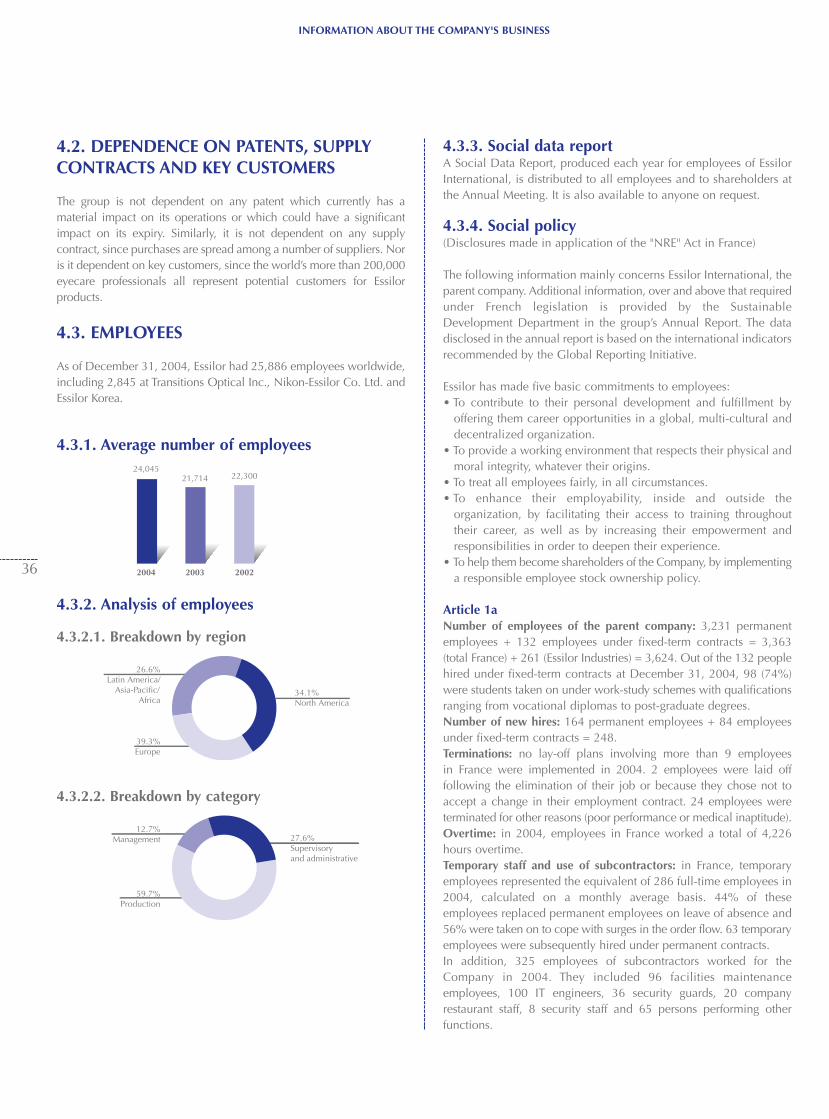
INFORMATION ABOUT THE COMPANY'S BUSINESS
36
4.2. DEPENDENCE ON PATENTS, SUPPLYCONTRACTS AND KEY CUSTOMERS
The group is not dependent on any patent which currently has amaterial impact on its operations or which could have a significantimpact on its expiry. Similarly, it is not dependent on any supplycontract, since purchases are spread among a number of suppliers. Noris it dependent on key customers, since the world’s more than 200,000eyecare professionals all represent potential customers for Essilorproducts.
4.3. EMPLOYEES
As of December 31, 2004, Essilor had 25,886 employees worldwide,including 2,845 at Transitions Optical Inc., Nikon-Essilor Co. Ltd. andEssilor Korea.
4.3.1. Average number of employees
4.3.2. Analysis of employees
4.3.2.1. Breakdown by region
4.3.2.2. Breakdown by category
4.3.3. Social data reportA Social Data Report, produced each year for employees of EssilorInternational, is distributed to all employees and to shareholders atthe Annual Meeting. It is also available to anyone on request.
4.3.4. Social policy(Disclosures made in application of the "NRE" Act in France)
The following information mainly concerns Essilor International, theparent company. Additional information, over and above that requiredunder French legislation is provided by the SustainableDevelopment Department in the group’s Annual Report. The datadisclosed in the annual report is based on the international indicatorsrecommended by the Global Reporting Initiative.
Essilor has made five basic commitments to employees: • To contribute to their personal development and fulfillment by
offering them career opportunities in a global, multi-cultural anddecentralized organization.
• To provide a working environment that respects their physical andmoral integrity, whatever their origins.
• To treat all employees fairly, in all circumstances.• To enhance their employability, inside and outside the
organization, by facilitating their access to training throughouttheir career, as well as by increasing their empowerment andresponsibilities in order to deepen their experience.
• To help them become shareholders of the Company, by implementinga responsible employee stock ownership policy.
Article 1aNumber of employees of the parent company: 3,231 permanentemployees + 132 employees under fixed-term contracts = 3,363(total France) + 261 (Essilor Industries) = 3,624. Out of the 132 peoplehired under fixed-term contracts at December 31, 2004, 98 (74%)were students taken on under work-study schemes with qualificationsranging from vocational diplomas to post-graduate degrees.Number of new hires: 164 permanent employees + 84 employeesunder fixed-term contracts = 248.Terminations: no lay-off plans involving more than 9 employees in France were implemented in 2004. 2 employees were laid off following the elimination of their job or because they chose not toaccept a change in their employment contract. 24 employees wereterminated for other reasons (poor performance or medical inaptitude).Overtime: in 2004, employees in France worked a total of 4,226hours overtime.Temporary staff and use of subcontractors: in France, temporaryemployees represented the equivalent of 286 full-time employees in2004, calculated on a monthly average basis. 44% of theseemployees replaced permanent employees on leave of absence and56% were taken on to cope with surges in the order flow. 63 temporaryemployees were subsequently hired under permanent contracts.In addition, 325 employees of subcontractors worked for theCompany in 2004. They included 96 facilities maintenanceemployees, 100 IT engineers, 36 security guards, 20 companyrestaurant staff, 8 security staff and 65 persons performing otherfunctions.
59.7%Production
12.7%Management 27.6%
Supervisory and administrative
34.1%North America
39.3%Europe
26.6%Latin America/
Asia-Pacific/Africa
2004 2003 2002
24,04521,714 22,300
INFORMATION ABOUT THE COMPANY'S BUSINESS
37
Article 1bInformation about lay-off plans and measures to protect jobs, transfer employees to other positions, take back staff previouslylaid off and support employees who are being terminated: no lay-off plans involving more than 9 employees were carried out inFrance in 2004. However, a plan to close the Mouy plant in the Oiseregion of France was presented to representatives of the plant's 40employees in October and November 2004. Closure was scheduledfor February 28, 2005. The results of the redeployment measuresimplemented in relation to this plant closure will be provided in thissection of the group’s 2005 reference document.
Article 2Organization of working hours: the "35-hour week" agreement ofMarch 30, 2000, which came into effect on September 1, 2000,defines the organization of working hours at Essilor.Working hours: the 1,388 monthly-paid employees work a 36-hourweek, the 889 shift-workers work a 33.5-hour week and the 218hourly-paid employees work a 38.5-hour week (in all cases notincluding rest periods). Employees in all three categories are alsoentitled to 6 "RTT" days off per year and their average working week,determined on an annual basis, is therefore 35 hours, 32.5 hoursand 37.5 hours respectively. The 724 employees whose workingtime is determined on the basis of days rather than hours work 216days per year and are entitled to between 9 and 13 "RTT" days off,depending on the year. Senior executives and sales representatives –representing 144 people in total – are not covered by working hourslegislation but are entitled to 10 days off per year in addition to theirpaid vacation. Lastly, 146 employees work part time.Absenteeism: in 2004, the absenteeism rate was 5.8%. The causes,in declining order of importance, were sick-leave of less than 6 months (78.9%); maternity leave (10.9%), authorized leaves of absence (5.2%), workplace accidents (2.3%), leaves of absencefor personal reasons (2%), accidents on the way to or from work (0.5 %), and absences for non-work-related obligations (0.2%).
Article 3Compensation: the total payroll in 2004 amounted to €123,702,000.Payroll taxes (other than on profit-related incentive bonuses):€58,252,000.Compensation increases: average compensation increases – allemployee categories combined – stood at 3.9% in 2003 and 2004.Employee incentive plans: a profit-related incentive bonus plan(plan d’intéressement des salaries aux résultats de l’entreprise) andemployee stock ownership plans (plans d’épargne entreprise) havebeen set up in France in accordance with the requirements of Titre IV, Livre IV of the Labor Code. Equal treatment of men and women: each year, a report on equaltreatment of men and women is prepared by each facility andsubmitted to the facility's employee representatives (comitéd'établissement) at the same time as the social data report (bilansocial). In 2004, in accordance with the applicable legislation, areport comparing the situations of men and women was drawn upand presented to employee representatives.
Essilor is fortunate in having a large number of committed employeeshareholders, represented by the Valoptec Association, which iscompletely independent from the Company. Essilor activelyencourages employee stock ownership, with a total of some 6,000employees worldwide currently holding Essilor shares.
Article 4Labor relations: in France, the following five trade unions are represented at Essilor: C.F.D.T., C.F.E.-C.G.C., C.F.T.C., C.G.T. andC.G.T.-F.O.Corporate agreements: the following were signed in 2004:• An addendum to the employee stock ownership plan
The signatories of the December 29, 2003 agreement relating tothe Company's employee stock ownership plan decided to amendthe agreement in order to enable employees to have access totheir savings under the plan in the exceptional circumstances setout in Act no. 2004-804 of August 9, 2004 which contains a seriesof measures to encourage consumer spending and investment.
• An end-of-career management agreementThe Pension Reform Act of August 21, 2003 extended theminimum contribution period for employees to be eligible for afull-rate retirement pension. This reform was intended toencourage people to work longer, leading to an increase in thenumber of older workers. Under the terms of the Act, people whobegan their careers before the age of 16 may retire before theirsixtieth birthday, provided they have paid enough social securitycontributions to be eligible for a full-rate pension.The signatories of Essilor’s end-of-career management agreementtherefore decided to review its terms and conditions in order toreflect the new legal framework and the fact that the number ofemployees retiring from the Company is expected to increase infuture years.
• A profit-related incentive bonus plan agreement for 2004, 2005and 2006This concerned the renewal of the previous incentive bonus planagreement that was due to expire.
Article 5Workplace health and safety: in 2004, Essilor restated itscommitment to health and safety at its sites. The group alsocontinued to develop, implement and regularly improve workplacehealth and safety management systems at all production facilities inFrance and worldwide, with the aim of obtaining OHSAS 18001certification. A further site in France was OHSAS 18001-certifiedduring the year (see Article 9 “Objectives set for foreign subsidiaries”of the Environment Policy section below for further details ofOHSAS 18001 certification).Workplace accidents: in 2004, 37 lost-time accidents and 25 accidentswithout lost time were reported involving Essilor employees inFrance, together with 4 lost-time accidents and 6 accidents withoutlost time involving temporary staff. Occupational illnesses: 11 cases of occupational illnesses werereported in France in 2004, all corresponding to musculoskeletal illness ("Table 57" illnesses).
INFORMATION ABOUT THE COMPANY'S BUSINESS
38
Article 6Training: Essilor’s commitment to continually honing the skills of itsemployees has been reflected for many years now in the amount ofresources allocated to training, which has remained stable at around4% of total payroll. This level was reached once again in 2004, despite strict cost containment measures.The Company's general training policy focuses on providing bothgroup and individual training sessions to increase employees' skillsets and their employability. The areas covered range from job-relatedtechniques and technology, through corporate methodology such asproject management methods, to management and communicationskills – which are an indispensable component of the group’s matrix-based structure – as well as cross-functional knowledge of Essilor’sfields of expertise.Change management is another key training topic. This encompassesmanaging change from both an individual perspective (career mobility)and on a group level, such as coming to grips with new technologyand organization methods. The 2004 training budget for all French units represented 4.0% of thetotal payroll. 1,780 Essilor employees in France (53% of the total)participated in at least one training session during the year. Over3,000 training sessions were organized, representing around 46,000hours' training.The main training topics were Environmental Protection/Quality/Workplace Health and Safety (11% of training hours, 21% oftrainees), Job-Related Technology and Techniques (16% of traininghours, 18% of trainees), Communication/Management Skills (19% oftraining hours, 16% of trainees), Language Skills (13% of traininghours, 15% of trainees), Administration/Sales/Management (13% oftraining hours, 13% of trainees), and Information Technology andOffice Systems (10% of training hours, 12% of trainees).Thirty employees attended work-study courses and obtained qualifications (14% of training hours).As well as its commitment to training employees, for more thantwelve years Essilor has run apprenticeship programs. Each year ittakes on 40 new apprentices, approximately a quarter of whom ultimately join the company. In 2004, Essilor managed 146apprenticeship contracts.
Article 7Disabled workers: in 2004, Essilor had 131 disabled employees inFrance, including 85 administrative and production workers, 15supervisors and 31 managers.
Article 8Employee welfare programs: in France in 2004, Essilor paid€4,554,330 to employee benefit plans (health insurance,death/disability insurance) and €2,586,297 to supplementarypension plans.The Company's statutory contribution to employee travel costsamounted to €2,030,112 and the cost of meal vouchers issued toemployees was €962,856.The total budget awarded to the various Work Councils to financeemployee leisure activities was €1,280,434, representing 1.15% ofthe total payroll, and a further €221,002 were paid to cover theWork Councils' administrative costs.
Match-funding payments to the Vacation Vouchers plan covering709 employees amounted to €474,014. The 0.45% government housing levy came to €453,827. The cost ofemployee medical check-ups was €252,156.Essilor also supplies optical equipment to employees, according tospecific rules, and pays the cost of long-service awards and opticalindustry long-service awards, adding a further bonus determinedaccording to a set scale. Lastly, the Company pays days off granted tofathers or mothers to take care of a sick child, according to specificrules.
Article 9Impact on regional employment and development, use of subcontractors, compliance by subsidiaries with the fundamentalconventions of the International Labor Organization (ILO): in2003, Essilor pledged support for the Global Compact initiativelaunched by the UN Secretary General after the JohannesburgSummit in 2002, confirming its long-standing commitment to theCompact's underlying principles. In 2004, Essilor participated in thepreparatory work which culminated in the addition of a tenth principle to the Global Compact relating to the promotion and adoptionof initiatives to counter all forms of corruption. This principle, whichEssilor respects, is based on the United Nations Convention againstCorruption.As a responsible employer, Essilor participates in the development of the regions where its facilities and laboratories are located, contributing directly to enhancing the skills and quality of life of the men and women employed by the group and indirectly to thoseof their families. More generally, Essilor also contributes to theadvancement of the people working and living in its host communities.In 2004, payments to sub-contractors represented 12% of purchases.The fundamental conventions of the International LaborOrganization (ILO) have not all been ratified in all of the countriesin which Essilor operates. However, the group promotes compliancewith these principles thanks to its international coordination ofhuman resources and its regional and business-level managementstructure, as well as through various specific measures such as theprogressive implementation of a reporting system for sustainabledevelopment indicators. This new reporting system will enable thegroup to include indicators specifically applicable to Essilor's businesses in its sustainable development report, including HR4,HR5, HR6 and HR7 of the Global Reporting Initiative (GRI) whichcorrespond to the four ILO fundamental conventions.Essilor also has a European Dialogue and Information Committee(EEDIC) which includes representatives from each subsidiary in the European Union countries where the Company conducts directoperations. The subjects dealt with at its meeting of May 28, 2004held in Warsaw included shared service centers, a Europeanemployee stock ownership plan and training within Europe. In addition, the Committee was given a presentation concerning theeconomic situation in the European markets, including 2003 resultsand the outlook for 2004, and it discussed a proposed addendum tothe EEDIC agreement of October 2000. The final version of thisaddendum was approved in 2004.Lastly, all production facilities manage human resources informationaccording to the same structure as the social data report (bilansocial) in France.
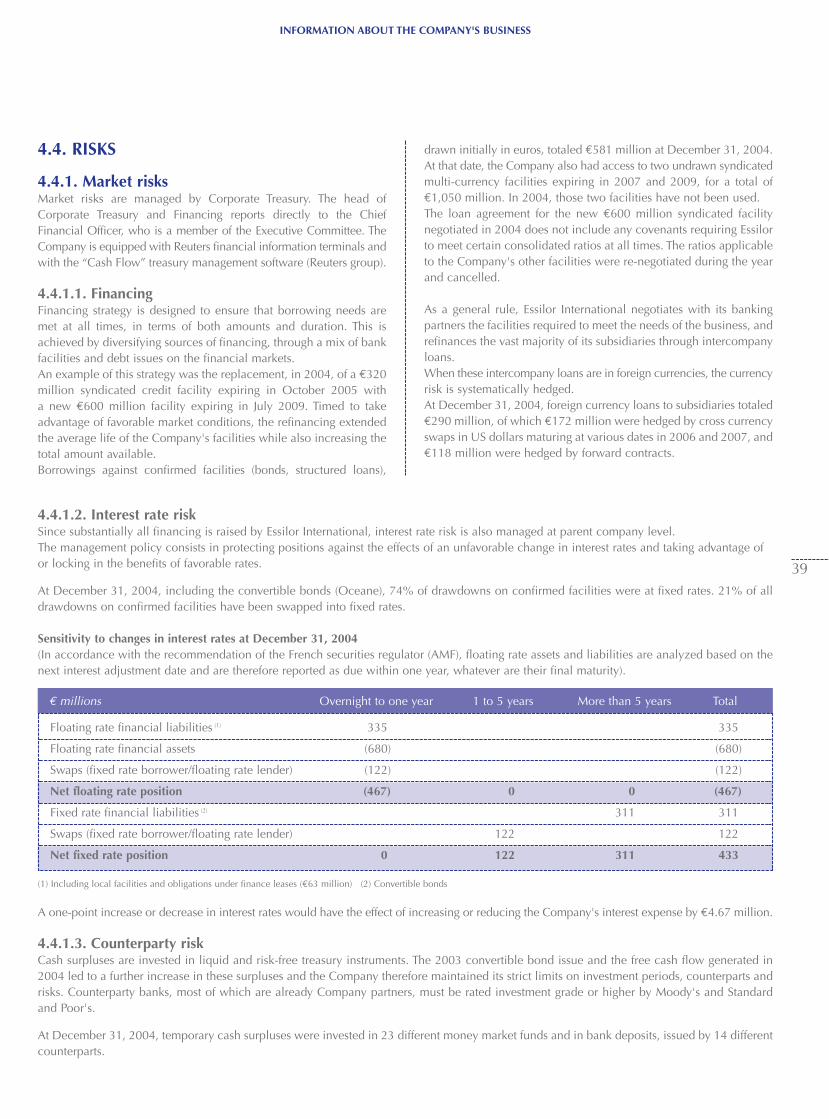
€ millions Overnight to one year 1 to 5 years More than 5 years Total
INFORMATION ABOUT THE COMPANY'S BUSINESS
39
4.4. RISKS
4.4.1. Market risksMarket risks are managed by Corporate Treasury. The head ofCorporate Treasury and Financing reports directly to the ChiefFinancial Officer, who is a member of the Executive Committee. TheCompany is equipped with Reuters financial information terminals andwith the “Cash Flow” treasury management software (Reuters group).
4.4.1.1. FinancingFinancing strategy is designed to ensure that borrowing needs aremet at all times, in terms of both amounts and duration. This isachieved by diversifying sources of financing, through a mix of bankfacilities and debt issues on the financial markets.An example of this strategy was the replacement, in 2004, of a €320million syndicated credit facility expiring in October 2005 with a new €600 million facility expiring in July 2009. Timed to takeadvantage of favorable market conditions, the refinancing extendedthe average life of the Company's facilities while also increasing thetotal amount available.Borrowings against confirmed facilities (bonds, structured loans),
drawn initially in euros, totaled €581 million at December 31, 2004.At that date, the Company also had access to two undrawn syndicatedmulti-currency facilities expiring in 2007 and 2009, for a total of€1,050 million. In 2004, those two facilities have not been used.The loan agreement for the new €600 million syndicated facilitynegotiated in 2004 does not include any covenants requiring Essilorto meet certain consolidated ratios at all times. The ratios applicableto the Company's other facilities were re-negotiated during the yearand cancelled.
As a general rule, Essilor International negotiates with its bankingpartners the facilities required to meet the needs of the business, andrefinances the vast majority of its subsidiaries through intercompanyloans. When these intercompany loans are in foreign currencies, the currencyrisk is systematically hedged.At December 31, 2004, foreign currency loans to subsidiaries totaled€290 million, of which €172 million were hedged by cross currencyswaps in US dollars maturing at various dates in 2006 and 2007, and€118 million were hedged by forward contracts.
4.4.1.2. Interest rate riskSince substantially all financing is raised by Essilor International, interest rate risk is also managed at parent company level. The management policy consists in protecting positions against the effects of an unfavorable change in interest rates and taking advantage of or locking in the benefits of favorable rates.
At December 31, 2004, including the convertible bonds (Oceane), 74% of drawdowns on confirmed facilities were at fixed rates. 21% of alldrawdowns on confirmed facilities have been swapped into fixed rates.
Sensitivity to changes in interest rates at December 31, 2004 (In accordance with the recommendation of the French securities regulator (AMF), floating rate assets and liabilities are analyzed based on thenext interest adjustment date and are therefore reported as due within one year, whatever are their final maturity).
Floating rate financial liabilities (1) 335 335
Floating rate financial assets (680) (680)
Swaps (fixed rate borrower/floating rate lender) (122) (122)
Net floating rate position (467) 0 0 (467)
Fixed rate financial liabilities (2) 311 311
Swaps (fixed rate borrower/floating rate lender) 122 122
Net fixed rate position 0 122 311 433
(1) Including local facilities and obligations under finance leases (€63 million) (2) Convertible bonds
A one-point increase or decrease in interest rates would have the effect of increasing or reducing the Company's interest expense by €4.67 million.
4.4.1.3. Counterparty riskCash surpluses are invested in liquid and risk-free treasury instruments. The 2003 convertible bond issue and the free cash flow generated in2004 led to a further increase in these surpluses and the Company therefore maintained its strict limits on investment periods, counterparts andrisks. Counterparty banks, most of which are already Company partners, must be rated investment grade or higher by Moody's and Standardand Poor's.
At December 31, 2004, temporary cash surpluses were invested in 23 different money market funds and in bank deposits, issued by 14 differentcounterparts.
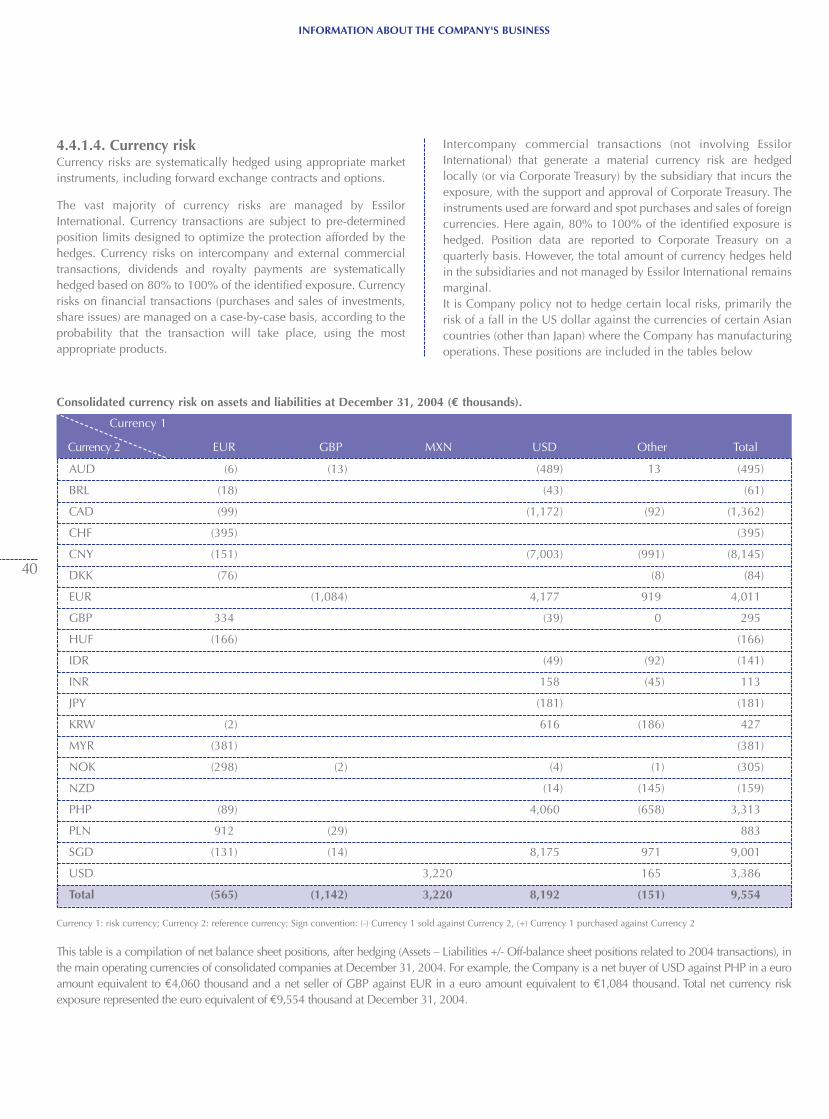
Currency 1
Currency 2 EUR GBP MXN USD Other Total
INFORMATION ABOUT THE COMPANY'S BUSINESS
40
4.4.1.4. Currency riskCurrency risks are systematically hedged using appropriate marketinstruments, including forward exchange contracts and options.
The vast majority of currency risks are managed by EssilorInternational. Currency transactions are subject to pre-determinedposition limits designed to optimize the protection afforded by thehedges. Currency risks on intercompany and external commercialtransactions, dividends and royalty payments are systematically hedged based on 80% to 100% of the identified exposure. Currencyrisks on financial transactions (purchases and sales of investments,share issues) are managed on a case-by-case basis, according to theprobability that the transaction will take place, using the mostappropriate products.
Intercompany commercial transactions (not involving EssilorInternational) that generate a material currency risk are hedgedlocally (or via Corporate Treasury) by the subsidiary that incurs theexposure, with the support and approval of Corporate Treasury. Theinstruments used are forward and spot purchases and sales of foreigncurrencies. Here again, 80% to 100% of the identified exposure ishedged. Position data are reported to Corporate Treasury on a quarterly basis. However, the total amount of currency hedges heldin the subsidiaries and not managed by Essilor International remainsmarginal.It is Company policy not to hedge certain local risks, primarily therisk of a fall in the US dollar against the currencies of certain Asiancountries (other than Japan) where the Company has manufacturingoperations. These positions are included in the tables below
AUD (6) (13) (489) 13 (495)
BRL (18) (43) (61)
CAD (99) (1,172) (92) (1,362)
CHF (395) (395)
CNY (151) (7,003) (991) (8,145)
DKK (76) (8) (84)
EUR (1,084) 4,177 919 4,011
GBP 334 (39) 0 295
HUF (166) (166)
IDR (49) (92) (141)
INR 158 (45) 113
JPY (181) (181)
KRW (2) 616 (186) 427
MYR (381) (381)
NOK (298) (2) (4) (1) (305)
NZD (14) (145) (159)
PHP (89) 4,060 (658) 3,313
PLN 912 (29) 883
SGD (131) (14) 8,175 971 9,001
USD 3,220 165 3,386
Total (565) (1,142) 3,220 8,192 (151) 9,554
Currency 1: risk currency; Currency 2: reference currency; Sign convention: (-) Currency 1 sold against Currency 2, (+) Currency 1 purchased against Currency 2
This table is a compilation of net balance sheet positions, after hedging (Assets – Liabilities +/- Off-balance sheet positions related to 2004 transactions), inthe main operating currencies of consolidated companies at December 31, 2004. For example, the Company is a net buyer of USD against PHP in a euroamount equivalent to €4,060 thousand and a net seller of GBP against EUR in a euro amount equivalent to €1,084 thousand. Total net currency riskexposure represented the euro equivalent of €9,554 thousand at December 31, 2004.
Consolidated currency risk on assets and liabilities at December 31, 2004 (€ thousands).

INFORMATION ABOUT THE COMPANY'S BUSINESS
41
4.4.2. Legal risks
To the best of the Company’s knowledge, it is not currently involvedand has not recently been involved in any claims, litigation or arbitrationproceedings that would be likely to have a material adverse effect on its financial position, results of operations, business or assets andliabilities.
4.4.3. Industrial and environmental risks
As a responsible enterprise, Essilor is committed to:• Participating in sustainable development initiatives by helping to
protect the environment and promoting recyclable products.• Complying fully with all applicable environmental regulations in
all host countries throughout the world (Source: EssilorInternational profile).
By its very nature, Essilor’s business has only a limited impact on theenvironment. Nevertheless, a voluntary process has long been inplace to accurately determine the environmental impact, howeverslight, of our activities, based on ISO 14000 standards.
4.4.3.1. Industrial risksOne of our priorities is to raise employees' awareness of industrialrisks and give them adequate training in identifying and preventingthese risks. We manufacture a vast number of different productswhich must all be totally dust free, and keeping production areasperfectly clean and tidy has become second nature. However, wemust also ensure that we do not overlook or under-estimate the risksinherent in any industrial activity, while at the same time avoidingany lowering of our standards of cleanliness and tidiness.
As of December 31, 2004, thirteen plants had ISO 14001-certifiedenvironmental management systems, five more than at end-2003.The other two plants with ISO 14001 programs are in the process ofearning certification. We are ahead of schedule with theseprograms, with an 87% environmental management systemcertification rate for our plants.
During 2004, we also continued the program launched in 2003to set up OHSAS (Occupational Health and Safety AssessmentSeries) workplace health and safety management systems. As ofthe year-end, seven plants had OHSAS 18001-certified systems,two more than at end-2003. The other plants are in the processof earning certification. We are on schedule with this program,with a 47% workplace health and safety managementcertification rate for our plants.
4.4.3.2. Environmental policy (Loi sur les Nouvelles Réglementations Économiques)
The information provided below mainly concerns Essilor International.
As a responsible enterprise, Essilor is committed to participating insustainable development initiatives by helping to protect theenvironment and promoting recyclable products, and to complyingfully with all applicable environmental regulations in all hostcountries throughout the world.
Article 1Consumption of natural resources, waste, discharges and disamenities:Water: 325,240 cubic meters (302,589 cubic meters based on the2003 scope.
Raw materials: the main raw materials used by Essilor in France in2004 were CR39 monomers, including 670 metric tons for standard-index ophthalmic lenses and 190 metric tons for other index lenses.The Company also used 465 metric tons of polycarbonate pellets forlight, recyclable ophthalmic lenses with high mechanical resistance.
Energy: 79.6 GWh. (Electricity: 57.6 GWh, Gas: 21.5 GWh, Fuel oil:0.5 GWh ) (62.2 GWh based on the 2003 scope).
Selective waste disposal: 90% of Essilor's facilities in France haveselective waste disposal systems, in addition to compulsory systemsto separate ordinary industrial waste from potentially harmful waste.
Waste water treatment: all the plants in France treat waste waterbefore it is released into the environment. Treatment processes rangefrom simple neutralization, decantation, de-oiling, or a combinationof these processes, to complete purification stations.
Toxic matter retention: all chemicals are stored in a manner toprevent polluting products from leaking into the soil or the aquaticenvironment in case of an accident
Noise: a person living alongside the Essilor plant in Dijon made averbal complaint about the noise from the warning signal emitted byforklift trucks when they are being reversed.
Odors: no complaints concerning odors were received in France in2004.
Article 2Biological balance, natural environment, and protected species:Essilor's environmental management systems include measures toavoid upsetting the biological balance, or harming the naturalenvironment or protected animal and plant species.
INFORMATION ABOUT THE COMPANY'S BUSINESS
42
Article 3Certifications: the three plants in France are ISO 14001-certified(See other ISO 14001 certifications below, under "Article 9").
Article 4Compliance: Essilor's environmental management systems includemeasures to guarantee compliance with all applicableenvironmental laws and regulations.
Article 5Environmental expenditure: Expenditure made in 2004 to preventany damage to the environment totaled €1,199,100. This amountconcerns the four plants, the research and development center andthree prescription lens units, representing a total of eight facilities inFrance. The sharp rise compared with 2003 was due to a majorproject to extend the purification station at one site, to keep pacewith significantly higher production volumes. This project, whichalso included upgrading measures, accounted for nearly threequarters of total environmental expenditure for the year.
Article 6Environmental organization and management systems: Thecorporate health, safety and environment department providesassistance to the network of local correspondents by telephone, faxand via its intranet site. The department is staffed with experts in theenvironment, health, safety and ergonomics. With English as itsworking language, it provides support, assistance and coordinationservices to all Essilor entities on health, safety and environmentalissues.
In line with the Company's decentralized management policy,which focuses on empowering front-line managers, the individualentities have their own health, safety and environment experts. In2004, they were all invited to attend an international Environmental,Health and Safety Institute congress, providing an opportunity toshare information about their respective experiences, best practicesand projects. Annual target-based action plans are drawn up to helpprevent and reduce environmental risks. Lastly, despite the very lowrisk, each site has set up a structure to deal with pollution incidentsthat could have consequences – however small – on theenvironment beyond the site perimeter.
The ISO 14001 program provides for the introduction of anenvironmental policy at each site. One of the recurring aims of thispolicy is to improve internal communication and education onenvironmental issues. In 2004, for example, we prepared adocument entitled "Seeing the world better – Our contribution tosustainable development", which was widely distributed (with 6,000copies printed in English and 4,000 in French). Representing our firstsustainable development report, its purpose was to informemployees and raise their awareness of environmental issues, whilealso communicating transparent and consistent non-financialinformation within and outside the organization.
Article 7Provisions and guarantees: Essilor was not required to record anyprovisions for environmental risks in 2004 or to set up any relatedguarantees. These risks are self-insured.
Article 8Indemnities: Essilor has not been required to pay any court-orderedindemnities for environmental damage and is not required toconduct any rehabilitation work.
Article 9Objectives set for foreign subsidiaries: The main objective forforeign subsidiaries is to comply fully with the applicableregulations. Based on this fundamental principle, Essilor has begunsetting up environmental management systems at 15 of itsproduction facilities outside France. The plants in Brazil (1), China(1), the United States (1), Ireland (2), Mexico (1), the Philippines (2),Thailand (1) and Puerto Rico (1) are ISO 14001-certified(representing ten sites outside France and thirteen in total). The tworemaining plants are on course to be ISO 14001-certified in 2005.As of December 31, 2004, compared with end-2003 on a samescope basis, 5 more plants worldwide had obtained ISO 14001certification of their environmental management systems. TheCompany is ahead of schedule with these programs, with an 87%certification rate for its worldwide plants (13 out of 15).
Essilor is also setting up workplace health and safety managementsystems at its fifteen plants. Its plants in Brazil, China, thePhilippines and Thailand are all OHSAS 18001-certified,representing five sites outside France and seven in total. Most of theother eight sites are expected to be OHSAS 18001-certified in 2005and the remainder in 2006. As of December 31, 2004, comparedwith end-2003 on a same scope basis, two more plants worldwidehad obtained OHSAS 18001 certification of their workplace healthand safety management systems. The Company is on schedule withthis program, with a 47% certification rate for its plants (7 out of 15).Workplace health and safety management systems are a fairly recentdevelopment and the number of companies with OHSAS 18001certification programs is still relatively limited.
INFORMATION ABOUT THE COMPANY'S BUSINESS
43
4.4.4. Insurance
Essilor has a long-standing risk prevention and protection policy,which is regularly updated. The factories are audited by theCompany’s insurers who issue reports detailing the levels ofinsurance cover required at each site and, where applicable,recommending measures to reduce insurance risks.
The Company’s insurers’ engineering departments are consulted onall construction projects and other major work, concerning bothdesign and protection aspects.
The projects are reviewed and adjusted to take into account of boththe business needs and the prevention targets set jointly with theinsurers. Physical assets are regularly valued by independentexperts. The growing geographical diversification of the operationshelps to limit the potential impact on the Company's financialposition of a major loss at a given site.
Most insurable risks are covered by global insurance programscomprising a master policy written in France and local policies thatprovide consistent coverage levels for the operational risks of allentities worldwide.
All cover is taken out with leading international insurers.The programs cover property and casualty risks (fire, explosion,machine damage, natural disasters), business interruption (loss ofgross margin caused by the halting of production due to anaccident), liability claims (operating, post-delivery, professional,environmental) and transportation risks (covering all movements ofgoods).
Under the laws of certain countries, insurance cover must be takenout with local insurers, in which case the guarantees may bedifferent from those provided under the global insurance programs.The global master policy covers any excess loss not covered by alocal policy.
Essilor does not have captive insurance company.
Entities not controlled by Essilor manage their own insuranceprograms.
The Company is not exposed to any specific business or geographicrisks. No major claims were made in 2004 and the Company is notinvolved in any significant litigation.
In 2004, Essilor estimated the extent of its exposure to major risks,after taking account of the mitigating effects of internal controls andpreventive measures as well as its existing insurance cover. Based onthe results of this analysis, the maximum insurance cover was keptat €150 million for property, casualty risks and businessinterruption, and at €1.524 million for transportation risks. The totalcost of the worldwide insurance programs in 2004 was €3.4 million.
Local insurance policies are taken out by subsidiaries to add to thecover provided by the global programs and comply with localinsurance requirements.
The aim of the insurance policies is to protect the Company's assetsand, thus, its shareholders’ interests, as well as to defend theinterests of employees and customers.
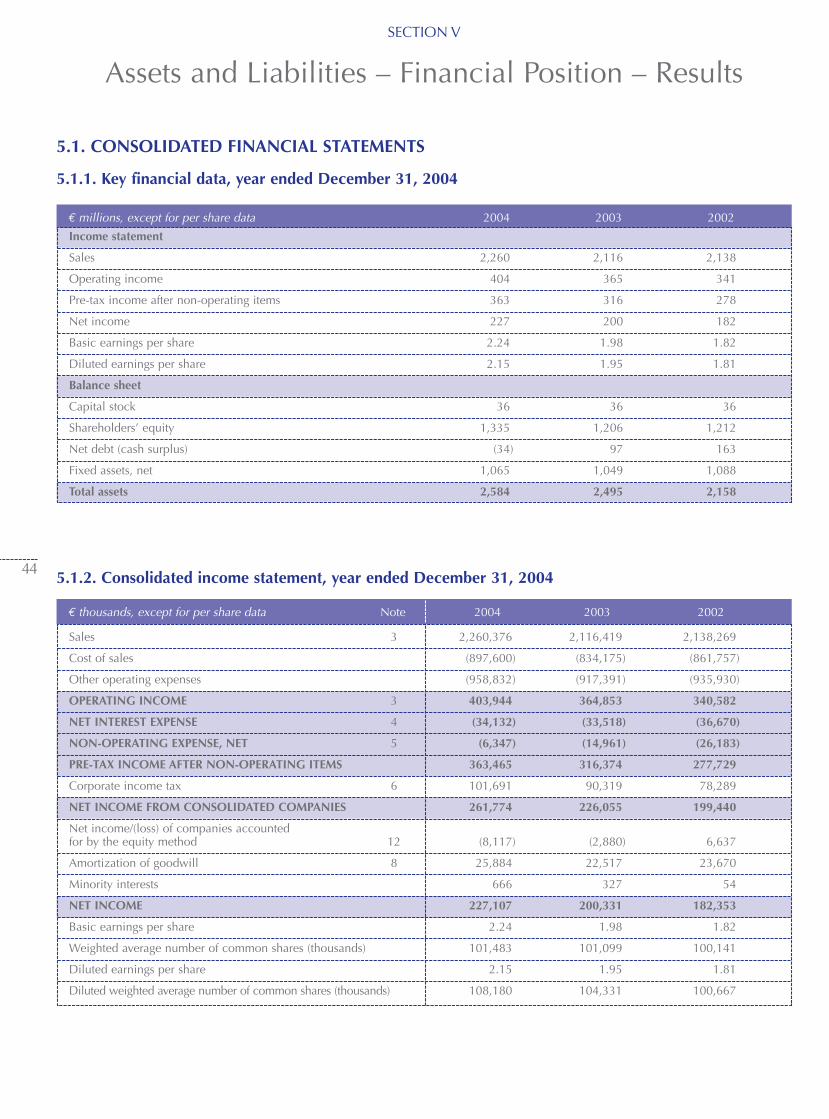
€ thousands, except for per share data Note 2004 2003 2002
€ millions, except for per share data 2004 2003 2002
SECTION V
Assets and Liabilities – Financial Position – Results
44
5.1. CONSOLIDATED FINANCIAL STATEMENTS
5.1.1. Key financial data, year ended December 31, 2004
Income statement
Sales 2,260 2,116 2,138
Operating income 404 365 341
Pre-tax income after non-operating items 363 316 278
Net income 227 200 182
Basic earnings per share 2.24 1.98 1.82
Diluted earnings per share 2.15 1.95 1.81
Balance sheet
Capital stock 36 36 36
Shareholders’ equity 1,335 1,206 1,212
Net debt (cash surplus) (34) 97 163
Fixed assets, net 1,065 1,049 1,088
Total assets 2,584 2,495 2,158
Sales 3 2,260,376 2,116,419 2,138,269
Cost of sales (897,600) (834,175) (861,757)
Other operating expenses (958,832) (917,391) (935,930)
OPERATING INCOME 3 403,944 364,853 340,582
NET INTEREST EXPENSE 4 (34,132) (33,518) (36,670)
NON-OPERATING EXPENSE, NET 5 (6,347) (14,961) (26,183)
PRE-TAX INCOME AFTER NON-OPERATING ITEMS 363,465 316,374 277,729
Corporate income tax 6 101,691 90,319 78,289
NET INCOME FROM CONSOLIDATED COMPANIES 261,774 226,055 199,440
Net income/(loss) of companies accounted for by the equity method 12 (8,117) (2,880) 6,637
Amortization of goodwill 8 25,884 22,517 23,670
Minority interests 666 327 54
NET INCOME 227,107 200,331 182,353
Basic earnings per share 2.24 1.98 1.82
Weighted average number of common shares (thousands) 101,483 101,099 100,141
Diluted earnings per share 2.15 1.95 1.81
Diluted weighted average number of common shares (thousands) 108,180 104,331 100,667
5.1.2. Consolidated income statement, year ended December 31, 2004
€ thousands 2004 2003 2002
ASSETS AND LIABILITIES – FINANCIAL POSITION – RESULTSCONSOLIDATED FINANCIAL STATEMENTS
45
5.1.3. Consolidated statement of cash flows, year ended December 31, 2004
NET INCOME 227,773 200,658 182,406
Income from companies accounted for by the equity method, 8,694 4,034 (6,637)net of dividends received
Depreciation, amortization and provisions 148,505 149,319 159,596
CASH FLOW 384,972 354,011 335,365
Change in provisions for contingencies and charges 6,786 10,381 14,739
Gains and losses on asset disposals 2,715 (1,478) (1,892)
Investment grants written back to income (17) 26 (117)
Change in deferred taxes (7,092) 3,111 11,378
Decrease (increase) in inventories (9,556) 15,670 23,147
Decrease (increase) in receivables and deferred charges 11,312 (38,362) 3,741
Increase (decrease) in payables and deferred income 15,843 47,358 (8,801)
Increase (decrease) in accrued interest (1,064) 1,451 (1,184)
NET CASH PROVIDED BY OPERATIONS 403,899 392,168 376,376
Capital expenditure (159,068) (150,211) (144,817)
Disposals of assets 6,043 10,344 4,802
Acquisitions of shareholdings and new loans extended (115,638) (150,286) (37,214)
Repayments of loans - - -
NET CASH USED BY INVESTMENT ACTIVITIES (268,663) (290,153) (177,229)
Issuance of shares 47,982 26,437 40,350
Dividends paid to:
- Essilor shareholders (61,841) (58,838) (46,198)
- Minority shareholders in subsidiaries (129) (304)
New borrowings raised/(repayment of borrowings) (67,858) 309,346 (5,062)
Impact of changes in scope of consolidation 10,600 21,103 6,085
NET CASH (USED)/PROVIDED BY FINANCING ACTIVITIES (71,246) 297,744 (4,825)
CHANGE IN CASH AND CASH EQUIVALENTS 63,990 399,759 194,322
Cash and cash equivalents at beginning of year 580,548 207,765 56,467
Impact of exchange rate changes on cash and cash equivalents 3,576 (26,976) (43,024)
CASH AND CASH EQUIVALENTS AT END OF YEAR 648,114 580,548 207,765
Marketable securities 572,654 516,622 189,483
Cash 107,281 94,999 62,978
Short-term bank loans and overdrafts (31,822) (31,073) (44,696)
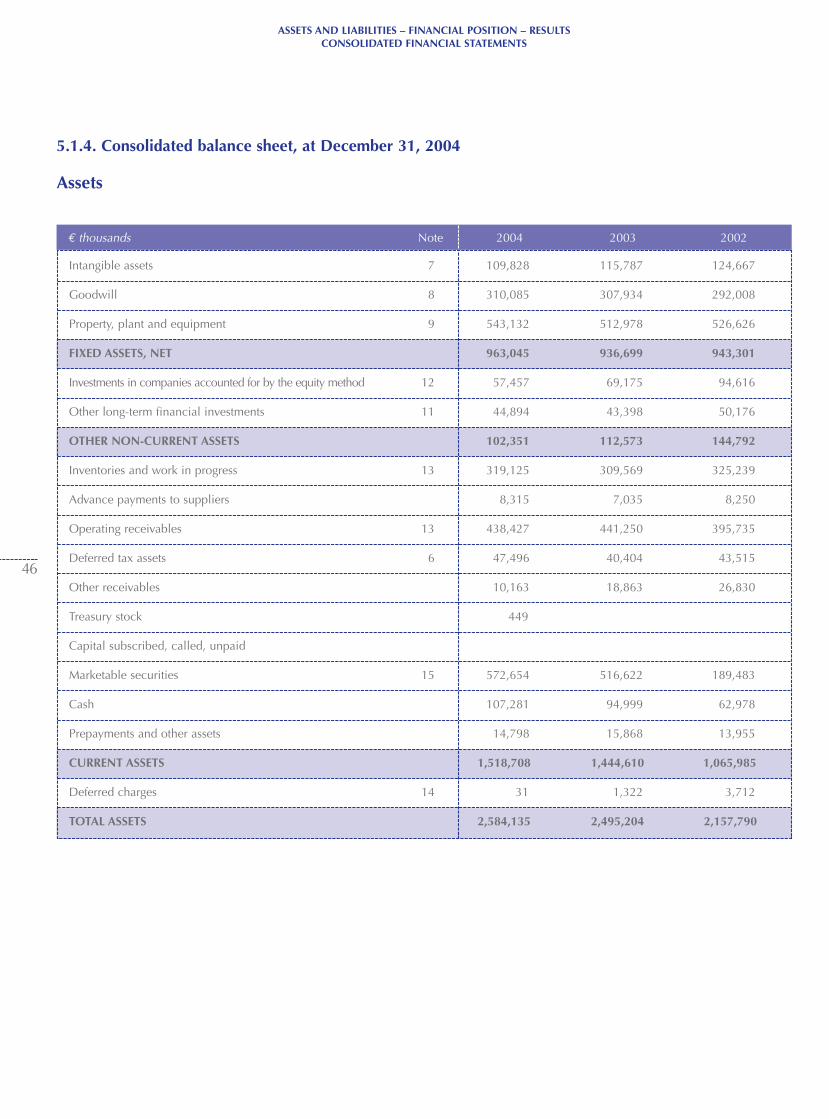
€ thousands Note 2004 2003 2002
ASSETS AND LIABILITIES – FINANCIAL POSITION – RESULTSCONSOLIDATED FINANCIAL STATEMENTS
46
5.1.4. Consolidated balance sheet, at December 31, 2004
Assets
Intangible assets 7 109,828 115,787 124,667
Goodwill 8 310,085 307,934 292,008
Property, plant and equipment 9 543,132 512,978 526,626
FIXED ASSETS, NET 963,045 936,699 943,301
Investments in companies accounted for by the equity method 12 57,457 69,175 94,616
Other long-term financial investments 11 44,894 43,398 50,176
OTHER NON-CURRENT ASSETS 102,351 112,573 144,792
Inventories and work in progress 13 319,125 309,569 325,239
Advance payments to suppliers 8,315 7,035 8,250
Operating receivables 13 438,427 441,250 395,735
Deferred tax assets 6 47,496 40,404 43,515
Other receivables 10,163 18,863 26,830
Treasury stock 449
Capital subscribed, called, unpaid
Marketable securities 15 572,654 516,622 189,483
Cash 107,281 94,999 62,978
Prepayments and other assets 14,798 15,868 13,955
CURRENT ASSETS 1,518,708 1,444,610 1,065,985
Deferred charges 14 31 1,322 3,712
TOTAL ASSETS 2,584,135 2,495,204 2,157,790
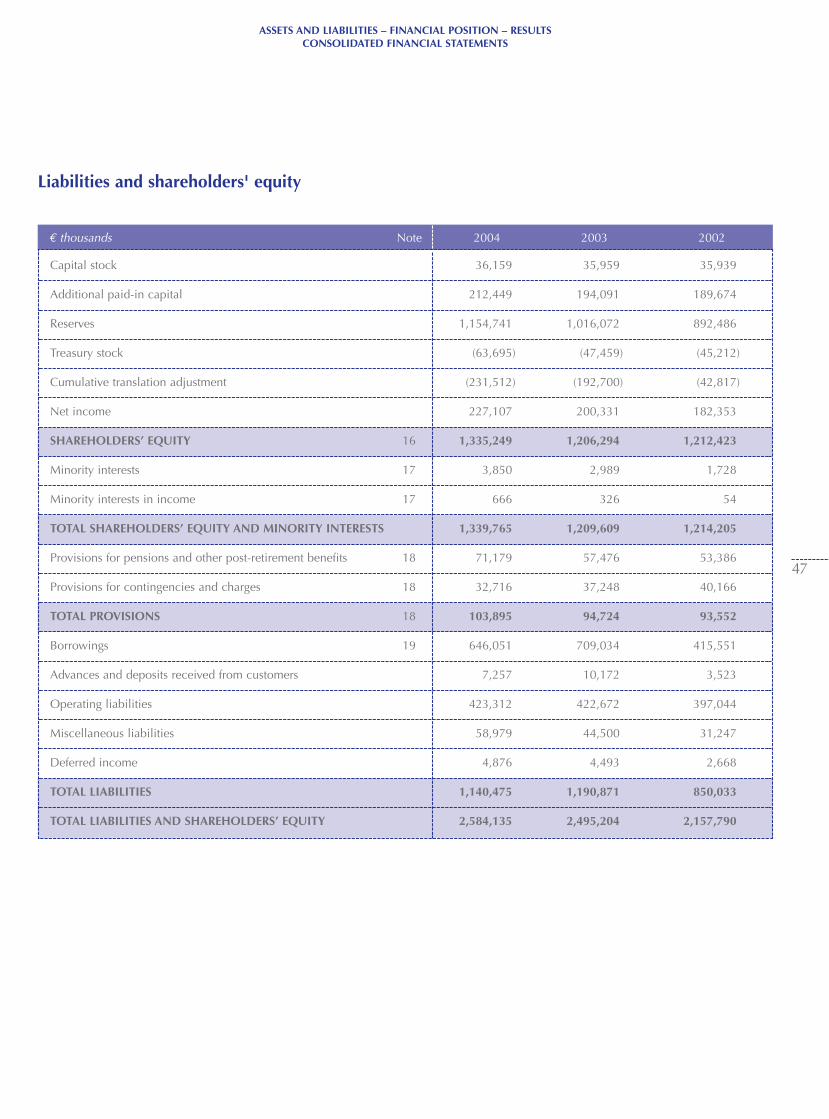
€ thousands Note 2004 2003 2002
ASSETS AND LIABILITIES – FINANCIAL POSITION – RESULTSCONSOLIDATED FINANCIAL STATEMENTS
47
Liabilities and shareholders' equity
Capital stock 36,159 35,959 35,939
Additional paid-in capital 212,449 194,091 189,674
Reserves 1,154,741 1,016,072 892,486
Treasury stock (63,695) (47,459) (45,212)
Cumulative translation adjustment (231,512) (192,700) (42,817)
Net income 227,107 200,331 182,353
SHAREHOLDERS’ EQUITY 16 1,335,249 1,206,294 1,212,423
Minority interests 17 3,850 2,989 1,728
Minority interests in income 17 666 326 54
TOTAL SHAREHOLDERS’ EQUITY AND MINORITY INTERESTS 1,339,765 1,209,609 1,214,205
Provisions for pensions and other post-retirement benefits 18 71,179 57,476 53,386
Provisions for contingencies and charges 18 32,716 37,248 40,166
TOTAL PROVISIONS 18 103,895 94,724 93,552
Borrowings 19 646,051 709,034 415,551
Advances and deposits received from customers 7,257 10,172 3,523
Operating liabilities 423,312 422,672 397,044
Miscellaneous liabilities 58,979 44,500 31,247
Deferred income 4,876 4,493 2,668
TOTAL LIABILITIES 1,140,475 1,190,871 850,033
TOTAL LIABILITIES AND SHAREHOLDERS’ EQUITY 2,584,135 2,495,204 2,157,790
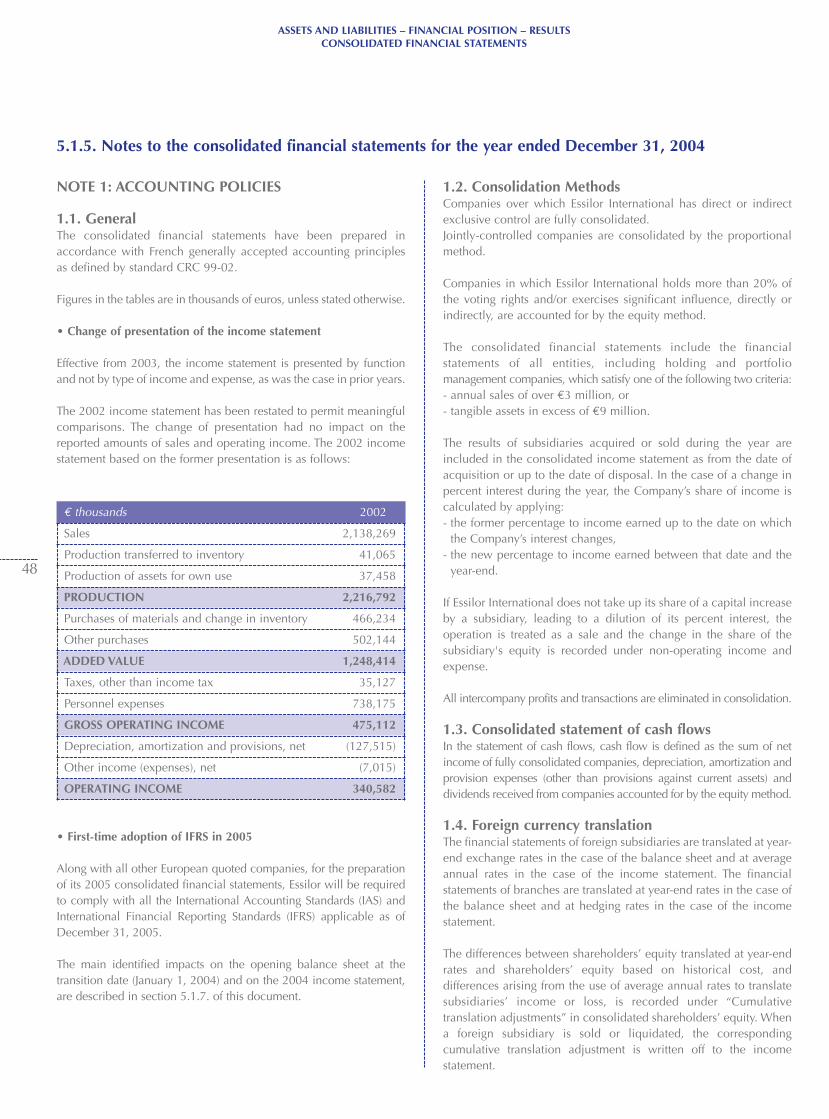
ASSETS AND LIABILITIES – FINANCIAL POSITION – RESULTSCONSOLIDATED FINANCIAL STATEMENTS
48
NOTE 1: ACCOUNTING POLICIES
1.1. GeneralThe consolidated financial statements have been prepared in accordance with French generally accepted accounting principlesas defined by standard CRC 99-02.
Figures in the tables are in thousands of euros, unless stated otherwise.
• Change of presentation of the income statement
Effective from 2003, the income statement is presented by functionand not by type of income and expense, as was the case in prior years.
The 2002 income statement has been restated to permit meaningfulcomparisons. The change of presentation had no impact on thereported amounts of sales and operating income. The 2002 incomestatement based on the former presentation is as follows:
€ thousands 2002
Sales 2,138,269
Production transferred to inventory 41,065
Production of assets for own use 37,458
PRODUCTION 2,216,792
Purchases of materials and change in inventory 466,234
Other purchases 502,144
ADDED VALUE 1,248,414
Taxes, other than income tax 35,127
Personnel expenses 738,175
GROSS OPERATING INCOME 475,112
Depreciation, amortization and provisions, net (127,515)
Other income (expenses), net (7,015)
OPERATING INCOME 340,582
• First-time adoption of IFRS in 2005
Along with all other European quoted companies, for the preparationof its 2005 consolidated financial statements, Essilor will be requiredto comply with all the International Accounting Standards (IAS) andInternational Financial Reporting Standards (IFRS) applicable as ofDecember 31, 2005.
The main identified impacts on the opening balance sheet at thetransition date (January 1, 2004) and on the 2004 income statement,are described in section 5.1.7. of this document.
1.2. Consolidation MethodsCompanies over which Essilor International has direct or indirectexclusive control are fully consolidated.Jointly-controlled companies are consolidated by the proportionalmethod.
Companies in which Essilor International holds more than 20% ofthe voting rights and/or exercises significant influence, directly orindirectly, are accounted for by the equity method.
The consolidated financial statements include the financial statements of all entities, including holding and portfolio management companies, which satisfy one of the following two criteria:- annual sales of over €3 million, or- tangible assets in excess of €9 million.
The results of subsidiaries acquired or sold during the year are included in the consolidated income statement as from the date ofacquisition or up to the date of disposal. In the case of a change inpercent interest during the year, the Company’s share of income iscalculated by applying:- the former percentage to income earned up to the date on which
the Company’s interest changes,- the new percentage to income earned between that date and the
year-end.
If Essilor International does not take up its share of a capital increaseby a subsidiary, leading to a dilution of its percent interest, the operation is treated as a sale and the change in the share of the subsidiary's equity is recorded under non-operating income andexpense.
All intercompany profits and transactions are eliminated in consolidation.
1.3. Consolidated statement of cash flowsIn the statement of cash flows, cash flow is defined as the sum of netincome of fully consolidated companies, depreciation, amortization andprovision expenses (other than provisions against current assets) anddividends received from companies accounted for by the equity method.
1.4. Foreign currency translationThe financial statements of foreign subsidiaries are translated at year-end exchange rates in the case of the balance sheet and at averageannual rates in the case of the income statement. The financialstatements of branches are translated at year-end rates in the case ofthe balance sheet and at hedging rates in the case of the incomestatement.
The differences between shareholders’ equity translated at year-endrates and shareholders’ equity based on historical cost, anddifferences arising from the use of average annual rates to translatesubsidiaries’ income or loss, is recorded under “Cumulativetranslation adjustments” in consolidated shareholders’ equity. Whena foreign subsidiary is sold or liquidated, the correspondingcumulative translation adjustment is written off to the incomestatement.
5.1.5. Notes to the consolidated financial statements for the year ended December 31, 2004
ASSETS AND LIABILITIES – FINANCIAL POSITION – RESULTSCONSOLIDATED FINANCIAL STATEMENTS
49
In the case of companies doing business in highly inflationary economies (inflation rate above 100% over 3 years), non-monetaryassets are translated at historical rates of exchange and monetaryassets at year-end exchange rates. Income or loss are translated atthe average annual exchange rate, except for non-monetary itemswhich are translated at the historical rate. The resulting translationdifference is recorded in the income statement.
1.5. GoodwillGoodwill corresponds to the excess of the cost of acquisition ofinvestments in consolidated companies over Essilor International'sshare in the fair value of net assets at the date of acquisition.
As allowed under generally accepted accounting principles, fairvalue adjustments to the net assets acquired are finalized during theyear following the date of acquisition.
Goodwill is amortized or written back to income over a period thatreflects, as reasonably as possible, the development prospects at thetime of the acquisition, not to exceed 20 years. Amortization periodstake into account the characteristics of the underlying business, thepossible existence of specific legal or regulatory restrictions and theobjectives set at the time of acquisition.
Goodwill is tested for impairment at each year-end, using the discounted cash flows method.
1.6. Negative equityIf a consolidated company has negative equity at the end of the year,minority interests are treated as being attributable to EssilorInternational unless the minority shareholders are liable for theirshare of the losses.
1.7. Revenue recognitionSales correspond to revenues derived from the sale of products andservices, net of customer discounts.
1.8. Other operating expensesOther operating expenses consist mainly of:• distribution expenses,• selling expenses,• research, development and engineering expenses,• general and administrative expenses.
In 2004, selling expenses – corresponding to marketing costs, thecost of the sales force and sales administration expenses – amountedto €384 million (2003: €367 million).
Research costs are expensed as incurred. Development costs arealso expensed in cases where they do not fulfill all of the criteria forrecognition in the balance sheet.In 2004, research and development costs, including engineeringcosts, totaled €107 million (2003: €104 million; 2002: €87 million).
1.9. Net interest expenseInterest income and expense are recognized in the period in whichthey are earned or incurred.
1.10. Foreign currency receivables and payablesForeign currency receivables and payables are converted at year-endexchange rates or hedging rates. Conversion gains and losses areincluded in the income statement, except where the currency riskhas been hedged.
1.11. Derivative financial instruments Derivative financial instruments are used only to hedge risks oncommercial transactions and identified foreign currency receivablesand payables. They include forward sales of foreign currencies (orforward purchases of euros by foreign subsidiaries) and currencyoptions. The Company also uses interest-rate options, interest-rateswaps, and cross-currency swaps in certain circumstances. Gains and losses on derivatives used as hedges are determined andaccounted for on a symmetrical basis with the loss or gain on thehedged item.
1.12. Deferred taxesIn accordance with IAS 12, deferred taxes are recorded by theliability method on temporary differences between the book value ofassets and liabilities and their tax basis.Deferred tax assets are recognized only if their recovery isconsidered probable.Deferred taxes are computed at the latest enacted tax rate. ForFrench companies, the rate applied was 34.93% for 2004 and35.44% for 2003 and 2002.
1.13. Property, plant and equipmentProperty, plant and equipment are stated at cost.
Assets acquired under finance leases resulting in a transfer of therisks and rewards of ownership of the leased asset are recorded inassets and depreciated by the method described below. A debt in thesame amount is recorded as a liability.
DepreciationProperty, plant and equipment are depreciated by the straight-linemethod over their estimated useful lives.
The main useful lives are as follows:
Buildings 20 to 33 years
Building improvements 7 to 10 years
Industrial machinery, equipment and tools 3 to 10 years
Other plant and equipment 3 to 10 years
ASSETS AND LIABILITIES – FINANCIAL POSITION – RESULTSCONSOLIDATED FINANCIAL STATEMENTS
50
1.14. Intangible assetsIntangible assets correspond primarily to market shares,trademarks, concessions, patents and licenses.Market shares and trademarks correspond to part of the excess ofthe cost of acquisition of investments over the Company’s share inthe net assets acquired. They are not amortized. Other intangible assets are stated at cost and are amortized by the straight-line method over 3 to 5 years.Intangible assets are tested for impairment at each year-end, usingthe discounted cash flows method.
1.15. Inventories and work in progressInventories are stated at weighted average cost.Provisions are recorded against inventories, taking into accountmarket prices, sales prospects and the risk of obsolescence.
1.16. ReceivablesReceivables are stated at their nominal value. Specific provisions arebooked for all doubtful accounts, corresponding primarily to tradereceivables. In addition, provisions are recorded for receivables not paid afterdue date to reflect the risk of non-recovery.
1.17. Bond issuesBonds are recognized in an amount corresponding to the proceedsreceived, net of issue cost. Any premium or discount, correspondingto the difference between the issue proceeds – net of issue costs –and the redemption price, is amortized over the life of the bonds bythe effective interest method.
1.18. Pensions and other post-retirement benefitsEssilor subsidiaries may have obligations for the payment ofpensions, early-retirement benefits, retirement indemnities or otherpost-retirement benefits, based on regulations and practices in thecountries where they operate. Where these benefits are payableunder defined contribution plans, the contributions are expensed asincurred. In the case of defined benefit plans, provisions are bookedto cover the unfunded projected benefit obligation.
• The projected benefit obligation, corresponding to the vestedrights of active and retired employees, is determined by theprojected unit credit method, based on estimated end-of-careersalary levels. The actuarial assumptions used differ depending onthe country (discount rate, inflation rate) and the company (staffturnover rates, rate of future salary increases).
• The discount rate corresponds to the prime interest rate in thecountry concerned. Discounting adjustments are recognized inoperating expense.
• In cases where all or part of the obligation is funded under anexternal plan, a provision is recorded for the difference betweenthe projected benefit obligation and the fair value of the planassets.
• Actuarial gains and losses are recognized by the corridor method,which consists of amortizing over the expected average remainingservice lives of plan participants only the portion of netcumulative actuarial gains and losses that exceeds the greater of10% of either the projected benefit obligation or the fair value ofthe plan assets.
• When a company introduces a defined benefit plan or changes thebenefit formula under an existing defined benefit plan, in certaincases the related change in the company’s obligation isrecognized as an expense on a straight-line basis over theexpected average remaining service lives of the plan participants.
1.19. AccrualsAccruals include prepayments and deferred charges.
1.20. Earnings per shareEarnings per share corresponds to net income divided by the averagenumber of shares outstanding during the year (excluding treasurystock).Diluted earnings per share are calculated taking into account allpotential shares:• The dilutive effect of stock options is calculated by the treasury
stock method. This method consists of adding to averageoutstanding shares the number of shares that could have beenpurchased if all outstanding options had been exercised at theyear-end and the proceeds used to purchase shares on the market.
• For convertible bonds, net income is adjusted by adding back theinterest paid on the bonds in the period, net of taxes, and thenumber of shares to be issued on conversion is added to theaverage number of shares outstanding.
Closing rate as of December 31 Average rate2004 2003 2002 2004 2003 2002
Company Country Consolidated Consolidation % %from method interest in 2004 consolidated
ASSETS AND LIABILITIES – FINANCIAL POSITION – RESULTSCONSOLIDATED FINANCIAL STATEMENTS
Document de référence ESSILOR 2004
51
NOTE 2: CHANGES IN EXCHANGE RATES AND SCOPE OF CONSOLIDATION
2.1. Exchange rates of main currencies used
Canadian dollar 1.64 1.62 1.65 1.62 1.59 1.49
Pound sterling 0.71 0.70 0.65 0.68 0.69 0.63
Yen 139.65 135.05 124.39 133.91 131.76 118.08
U.S. dollar 1.36 1.26 1.05 1.25 1.14 0.95
(for €1)
City Optical Australia July 1, 2004 Full 50.00 100.00
Metro Optical (1) Canada January 1, 2004 Full 100.00 100.00
Optique Lison Canada February 1, 2004 Full 100.00 100.00
BBGR Iberia (1) Spain January 1, 2004 Full 100.00 100.00
Dunlaw Optical Lab. United States January 1, 2004 Full 80.00 100.00
Spectrum Optical United States April 1, 2004 Full 100.00 100.00
Tri Supreme United States June 1, 2004 Full 80.00 100.00
Opal-Lite United States June 30, 2004 Full 80.00 100.00
Select Optical United States June 30, 2004 Full 80.00 100.00
21st Century United States December 1, 2004 Full 80.00 100.00
Essilor SSC UK (1) United Kingdom January 1, 2004 Full 100.00 100.00
LTL Group Italy July 1, 2004 Full 100.00 100.00
2.2. Changes in scope of consolidation
• Newly-consolidated companies
(1) Companies acquired in prior years, consolidated for the first time in 2004.
Growth Impact of Impact of changes Growth (published) exchange rates in scope of consolidation (like-for-like)
Company Country Consolidated Consolidation % %from method interest in 2004 consolidated
ASSETS AND LIABILITIES – FINANCIAL POSITION – RESULTSCONSOLIDATED FINANCIAL STATEMENTS
52
• Other changes
In 2004:- The Company reduced its interest in VisionWeb from 45.57% in
2003 to 44.95%.- The Company's stakes in Shanghai Essilor Optical Co. Ltd. (China)
and Essilor SRF Optics Ltd.. (India) were raised to 100%, from97.88% and 88.18% respectively in 2003.
In 2003:- Following the acquisition of additional shares in December 2003,
the Company's percentage interest in Optikot (Brazil) increased to100% at year-end 2003 from 50.36% one year earlier.
- Essilor's interest in VisionWeb was diluted to 45.57% from49.97%, as a result of not taking up share issues. Consequently,VisionWeb, which was proportionally consolidated in 2002, hasbeen accounted for by the equity method since January 1, 2003. In2002, VisionWeb's contribution consisted solely of non-operatingexpenses in the amount of €6.1 million.
In 2002:- The Bacou-Dalloz group carried out a share issue not taken up by
Essilor, which had the effect of reducing the Company's interest to15.15% at December 31, 2002 from 18.61% at December 31,2001.
The 2004 income statement also includes the impact of full-year contributions from the following companies that were consolidated for the firsttime in 2003:
Rupp und Hubrach Group Germany October 1, 2003 Full 100.00 100.00
BNL Group France October 1, 2003 Full 100.00 100.00
Morrison Optical Canada February 1, 2003 Full 100.00 100.00
Custom Surface Canada April 1, 2003 Full 100.00 100.00
OPSG Ltd. Canada August 1, 2003 Full 100.00 100.00
Optique de l’Estrie Canada September 1, 2003 Full 100.00 100.00
Chemilens China February 1, 2003 Proportional 43.47 50.00
Essilor Korea S. Korea February 1, 2003 Proportional 50.00 50.00
Chemiglas S. Korea February 1, 2003 Proportional 42.74 50.00
Nassau Lens Optical United States July 1, 2003 Full 100.00 100.00
OMNI United States September 1, 2003 Full 100.00 100.00
Optical Suppliers Inc. (Hawaii) United States July 1, 2003 Full 80.00 100.00
Specialty Lens Corp United States March 1, 2003 Full 100.00 100.00
Plasticplus Pte Singapore May 1, 2003 Full 91.67 100.00
Sales 6.8% (3.6)% 4.6% 5.8%
Operating income 10.7% (4.7)% 1.9% 13.5%
Exchange-rate effects were mainly due to the fall in value of the U.S. dollar.
2.3. Impact of changes in scope of consolidation and exchange rates
In 2004, changes in scope of consolidation and exchange rates had the following impact on sales and operating income:
ASSETS AND LIABILITIES – FINANCIAL POSITION – RESULTSCONSOLIDATED FINANCIAL STATEMENTS
53
NOTE 3: SEGMENT INFORMATION
Sales
€ millions 2004 2003 2002
By geographic area
Europe 1,120 1,048 973
North America 909 869 971
Rest of world 231 199 194
Total 2,260 2,116 2,138
By business
Corrective lenses(1) 2,133 1,985 2,010
Other(1) 127 131 128
Total 2,260 2,116 2,138
Contribution to net income
€ millions 2004 2003 2002
By geographic area
Europe 121 132 118
North America 63 47 37
Rest of world 43 22 27
Total 227 201 182
Acquisitions of intangible assets and property, plant and equipment
€ millions 2004 2003 2002
By geographic area
Europe 75 67 59
North America 51 42 52
Rest of world 33 40 35
Total 159 149 146
Accumulated amortization and depreciation of intangible assetsand property, plant and equipment
€ millions 2004 2003 2002
By geographic area
Europe 576 533 476
North America 261 263 275
Rest of world 136 128 117
Total 972 924 868
Fixed assets and total assets
€ millions 2004 2003 2002
Fixed assets(1) Total assets Fixed assets(1) Total assets Fixed assets(1) Total assets
By geographic area
Europe 335 1,500 298 1,432 242 1,016
North America 473 730 484 744 552 841
Rest of world 155 354 155 320 149 301
Total 963 2,584 937 2,495 943 2,158
Provisions for contingencies and charges and current liabilities
€ millions 2004 2003 2002
Provisions Borrowings Provisions Borrowings Provisions Borrowingsfor contingencies and operating for contingencies and operating for contingencies and operating
and charges liabilities and charges liabilities and charges liabilities
By geographic area
Europe 81 953 70 1,030 66 661
North America 19 117 22 99 25 121
Rest of world 3 71 3 62 3 68
Total 104 1,141 95 1,191 94 850
(1) Excluding financial investments
(1) 2002 data have been restated to permit meaningful comparisons.
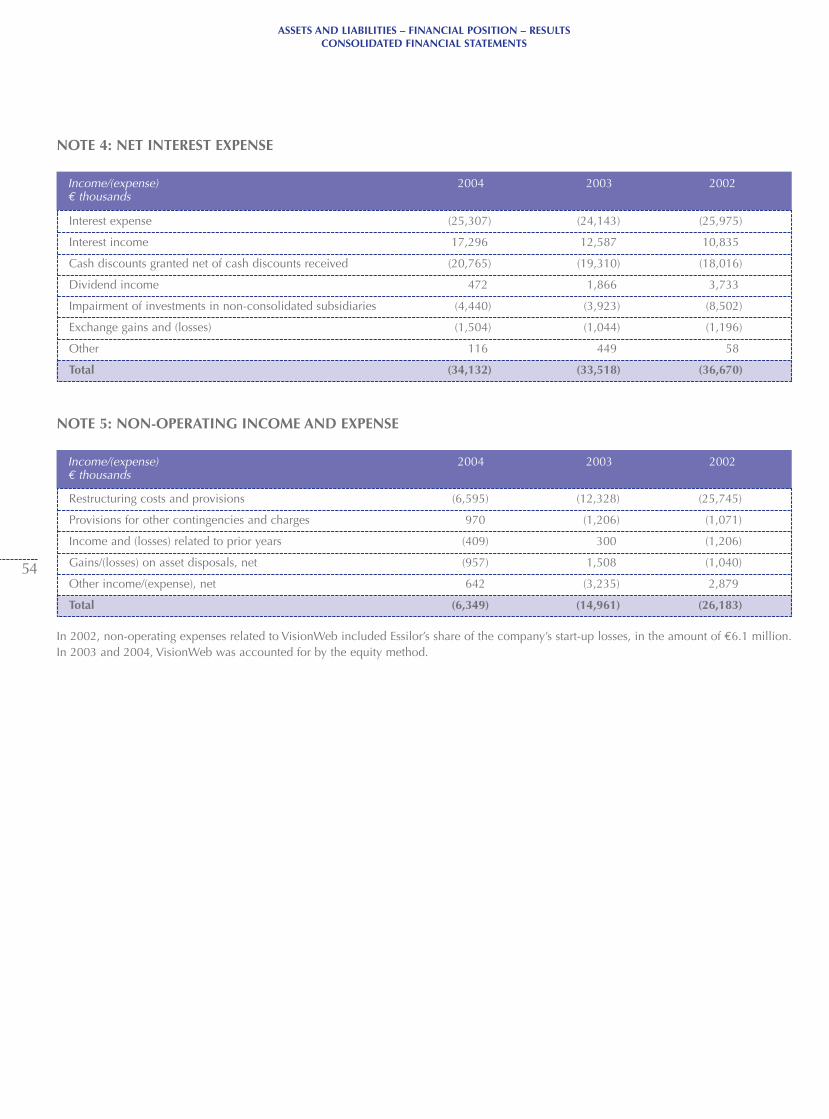
Income/(expense) 2004 2003 2002€ thousands
Income/(expense) 2004 2003 2002€ thousands
ASSETS AND LIABILITIES – FINANCIAL POSITION – RESULTSCONSOLIDATED FINANCIAL STATEMENTS
54
NOTE 4: NET INTEREST EXPENSE
Interest expense (25,307) (24,143) (25,975)
Interest income 17,296 12,587 10,835
Cash discounts granted net of cash discounts received (20,765) (19,310) (18,016)
Dividend income 472 1,866 3,733
Impairment of investments in non-consolidated subsidiaries (4,440) (3,923) (8,502)
Exchange gains and (losses) (1,504) (1,044) (1,196)
Other 116 449 58
Total (34,132) (33,518) (36,670)
NOTE 5: NON-OPERATING INCOME AND EXPENSE
Restructuring costs and provisions (6,595) (12,328) (25,745)
Provisions for other contingencies and charges 970 (1,206) (1,071)
Income and (losses) related to prior years (409) 300 (1,206)
Gains/(losses) on asset disposals, net (957) 1,508 (1,040)
Other income/(expense), net 642 (3,235) 2,879
Total (6,349) (14,961) (26,183)
In 2002, non-operating expenses related to VisionWeb included Essilor’s share of the company’s start-up losses, in the amount of €6.1 million.In 2003 and 2004, VisionWeb was accounted for by the equity method.
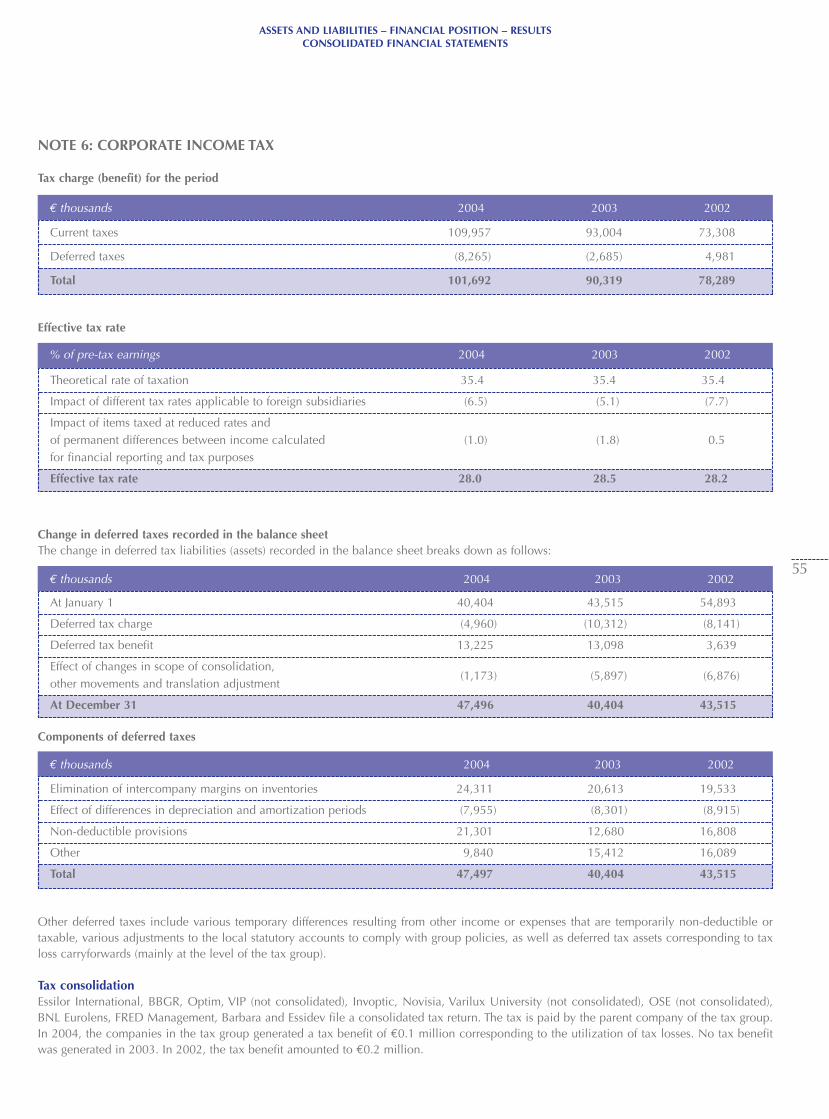
€ thousands 2004 2003 2002
% of pre-tax earnings 2004 2003 2002
€ thousands 2004 2003 2002
ASSETS AND LIABILITIES – FINANCIAL POSITION – RESULTSCONSOLIDATED FINANCIAL STATEMENTS
55
NOTE 6: CORPORATE INCOME TAX
Tax charge (benefit) for the period
Current taxes 109,957 93,004 73,308
Deferred taxes (8,265) (2,685) 4,981
Total 101,692 90,319 78,289
Effective tax rate
Theoretical rate of taxation 35.4 35.4 35.4
Impact of different tax rates applicable to foreign subsidiaries (6.5) (5.1) (7.7)
Impact of items taxed at reduced rates and of permanent differences between income calculated (1.0) (1.8) 0.5for financial reporting and tax purposes
Effective tax rate 28.0 28.5 28.2
Components of deferred taxes
€ thousands 2004 2003 2002
Change in deferred taxes recorded in the balance sheetThe change in deferred tax liabilities (assets) recorded in the balance sheet breaks down as follows:
At January 1 40,404 43,515 54,893
Deferred tax charge (4,960) (10,312) (8,141)
Deferred tax benefit 13,225 13,098 3,639
Effect of changes in scope of consolidation, other movements and translation adjustment
(1,173) (5,897) (6,876)
At December 31 47,496 40,404 43,515
Other deferred taxes include various temporary differences resulting from other income or expenses that are temporarily non-deductible or taxable, various adjustments to the local statutory accounts to comply with group policies, as well as deferred tax assets corresponding to taxloss carryforwards (mainly at the level of the tax group).
Tax consolidationEssilor International, BBGR, Optim, VIP (not consolidated), Invoptic, Novisia, Varilux University (not consolidated), OSE (not consolidated), BNL Eurolens, FRED Management, Barbara and Essidev file a consolidated tax return. The tax is paid by the parent company of the tax group.In 2004, the companies in the tax group generated a tax benefit of €0.1 million corresponding to the utilization of tax losses. No tax benefitwas generated in 2003. In 2002, the tax benefit amounted to €0.2 million.
Elimination of intercompany margins on inventories 24,311 20,613 19,533
Effect of differences in depreciation and amortization periods (7,955) (8,301) (8,915)
Non-deductible provisions 21,301 12,680 16,808
Other 9,840 15,412 16,089
Total 47,497 40,404 43,515
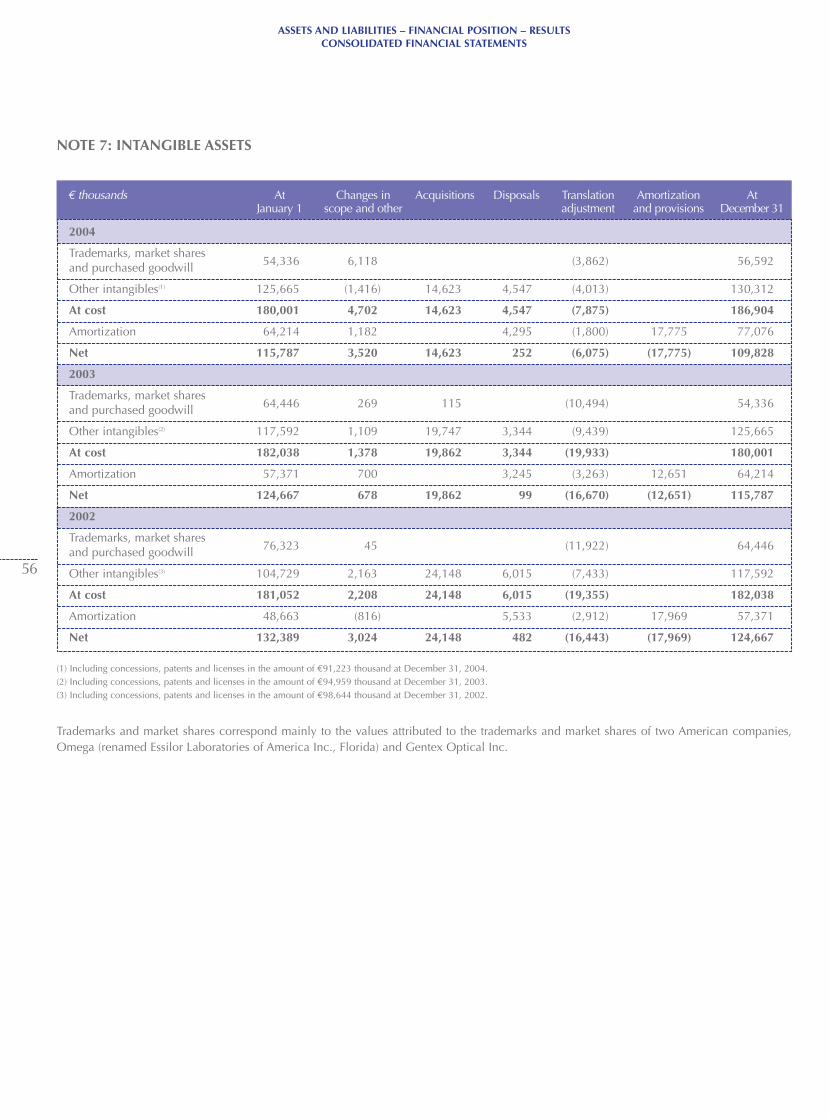
€ thousands At Changes in Acquisitions Disposals Translation Amortization At January 1 scope and other adjustment and provisions December 31
ASSETS AND LIABILITIES – FINANCIAL POSITION – RESULTSCONSOLIDATED FINANCIAL STATEMENTS
56
NOTE 7: INTANGIBLE ASSETS
2004
Trademarks, market shares and purchased goodwill 54,336 6,118 (3,862) 56,592
Other intangibles(1) 125,665 (1,416) 14,623 4,547 (4,013) 130,312
At cost 180,001 4,702 14,623 4,547 (7,875) 186,904
Amortization 64,214 1,182 4,295 (1,800) 17,775 77,076
Net 115,787 3,520 14,623 252 (6,075) (17,775) 109,828
2003
Trademarks, market shares and purchased goodwill 64,446 269 115 (10,494) 54,336
Other intangibles(2) 117,592 1,109 19,747 3,344 (9,439) 125,665
At cost 182,038 1,378 19,862 3,344 (19,933) 180,001
Amortization 57,371 700 3,245 (3,263) 12,651 64,214
Net 124,667 678 19,862 99 (16,670) (12,651) 115,787
2002
Trademarks, market shares and purchased goodwill 76,323 45 (11,922) 64,446
Other intangibles(3) 104,729 2,163 24,148 6,015 (7,433) 117,592
At cost 181,052 2,208 24,148 6,015 (19,355) 182,038
Amortization 48,663 (816) 5,533 (2,912) 17,969 57,371
Net 132,389 3,024 24,148 482 (16,443) (17,969) 124,667
(1) Including concessions, patents and licenses in the amount of €91,223 thousand at December 31, 2004.(2) Including concessions, patents and licenses in the amount of €94,959 thousand at December 31, 2003.(3) Including concessions, patents and licenses in the amount of €98,644 thousand at December 31, 2002.
Trademarks and market shares correspond mainly to the values attributed to the trademarks and market shares of two American companies,Omega (renamed Essilor Laboratories of America Inc., Florida) and Gentex Optical Inc.
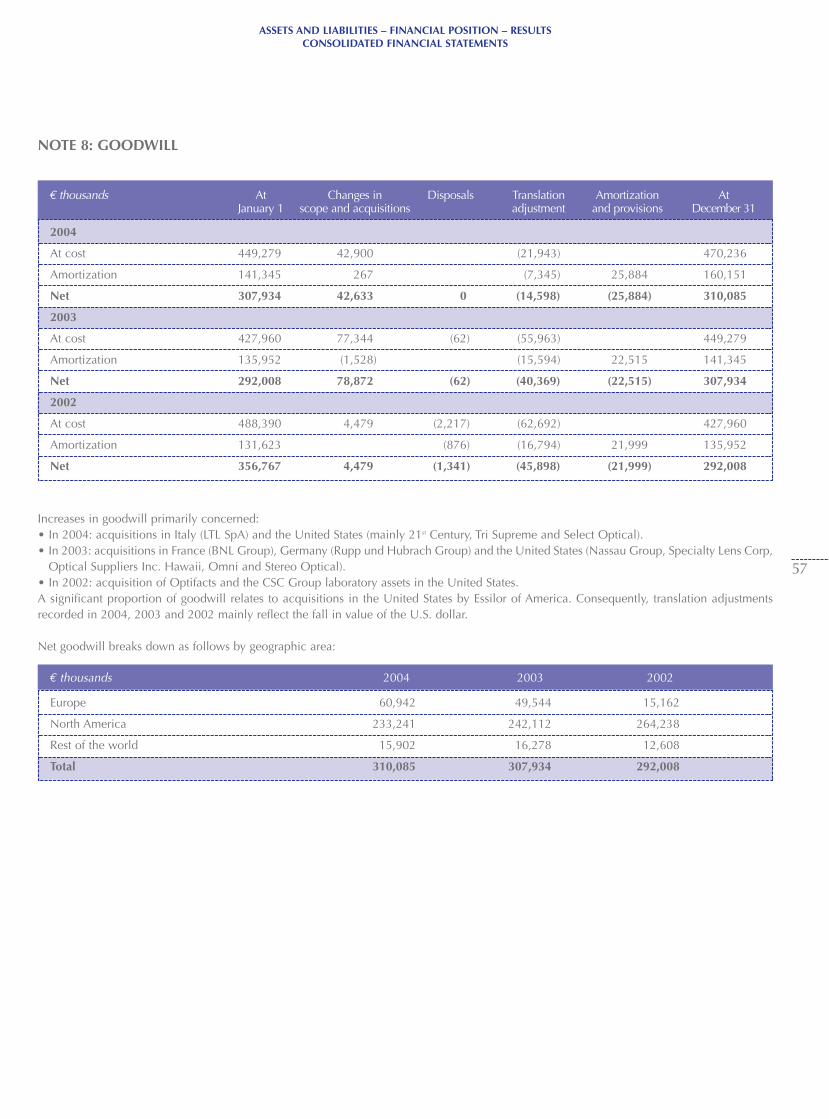
€ thousands 2004 2003 2002
€ thousands At Changes in Disposals Translation Amortization At January 1 scope and acquisitions adjustment and provisions December 31
ASSETS AND LIABILITIES – FINANCIAL POSITION – RESULTSCONSOLIDATED FINANCIAL STATEMENTS
57
NOTE 8: GOODWILL
Increases in goodwill primarily concerned:• In 2004: acquisitions in Italy (LTL SpA) and the United States (mainly 21st Century, Tri Supreme and Select Optical).• In 2003: acquisitions in France (BNL Group), Germany (Rupp und Hubrach Group) and the United States (Nassau Group, Specialty Lens Corp,
Optical Suppliers Inc. Hawaii, Omni and Stereo Optical).• In 2002: acquisition of Optifacts and the CSC Group laboratory assets in the United States.A significant proportion of goodwill relates to acquisitions in the United States by Essilor of America. Consequently, translation adjustmentsrecorded in 2004, 2003 and 2002 mainly reflect the fall in value of the U.S. dollar.
Net goodwill breaks down as follows by geographic area:
2004
At cost 449,279 42,900 (21,943) 470,236
Amortization 141,345 267 (7,345) 25,884 160,151
Net 307,934 42,633 0 (14,598) (25,884) 310,085
2003
At cost 427,960 77,344 (62) (55,963) 449,279
Amortization 135,952 (1,528) (15,594) 22,515 141,345
Net 292,008 78,872 (62) (40,369) (22,515) 307,934
2002
At cost 488,390 4,479 (2,217) (62,692) 427,960
Amortization 131,623 (876) (16,794) 21,999 135,952
Net 356,767 4,479 (1,341) (45,898) (21,999) 292,008
Europe 60,942 49,544 15,162
North America 233,241 242,112 264,238
Rest of the world 15,902 16,278 12,608
Total 310,085 307,934 292,008
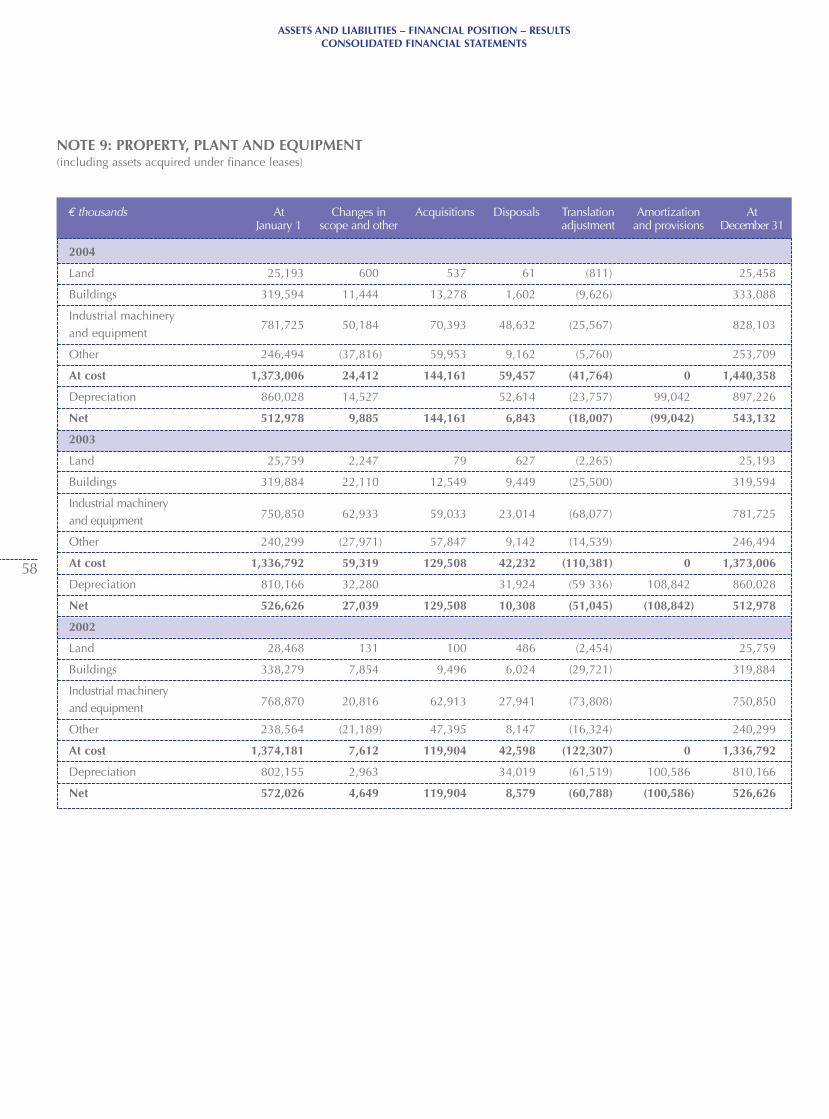
€ thousands At Changes in Acquisitions Disposals Translation Amortization At January 1 scope and other adjustment and provisions December 31
ASSETS AND LIABILITIES – FINANCIAL POSITION – RESULTSCONSOLIDATED FINANCIAL STATEMENTS
58
NOTE 9: PROPERTY, PLANT AND EQUIPMENT(including assets acquired under finance leases)
2004
Land 25,193 600 537 61 (811) 25,458
Buildings 319,594 11,444 13,278 1,602 (9,626) 333,088
Industrial machinery and equipment
781,725 50,184 70,393 48,632 (25,567) 828,103
Other 246,494 (37,816) 59,953 9,162 (5,760) 253,709
At cost 1,373,006 24,412 144,161 59,457 (41,764) 0 1,440,358
Depreciation 860,028 14,527 52,614 (23,757) 99,042 897,226
Net 512,978 9,885 144,161 6,843 (18,007) (99,042) 543,132
2003
Land 25,759 2,247 79 627 (2,265) 25,193
Buildings 319,884 22,110 12,549 9,449 (25,500) 319,594
Industrial machinery and equipment 750,850 62,933 59,033 23,014 (68,077) 781,725
Other 240,299 (27,971) 57,847 9,142 (14,539) 246,494
At cost 1,336,792 59,319 129,508 42,232 (110,381) 0 1,373,006
Depreciation 810,166 32,280 31,924 (59 336) 108,842 860,028
Net 526,626 27,039 129,508 10,308 (51,045) (108,842) 512,978
2002
Land 28,468 131 100 486 (2,454) 25,759
Buildings 338,279 7,854 9,496 6,024 (29,721) 319,884
Industrial machinery and equipment 768,870 20,816 62,913 27,941 (73,808) 750,850
Other 238,564 (21,189) 47,395 8,147 (16,324) 240,299
At cost 1,374,181 7,612 119,904 42,598 (122,307) 0 1,336,792
Depreciation 802,155 2,963 34,019 (61,519) 100,586 810,166
Net 572,026 4,649 119,904 8,579 (60,788) (100,586) 526,626
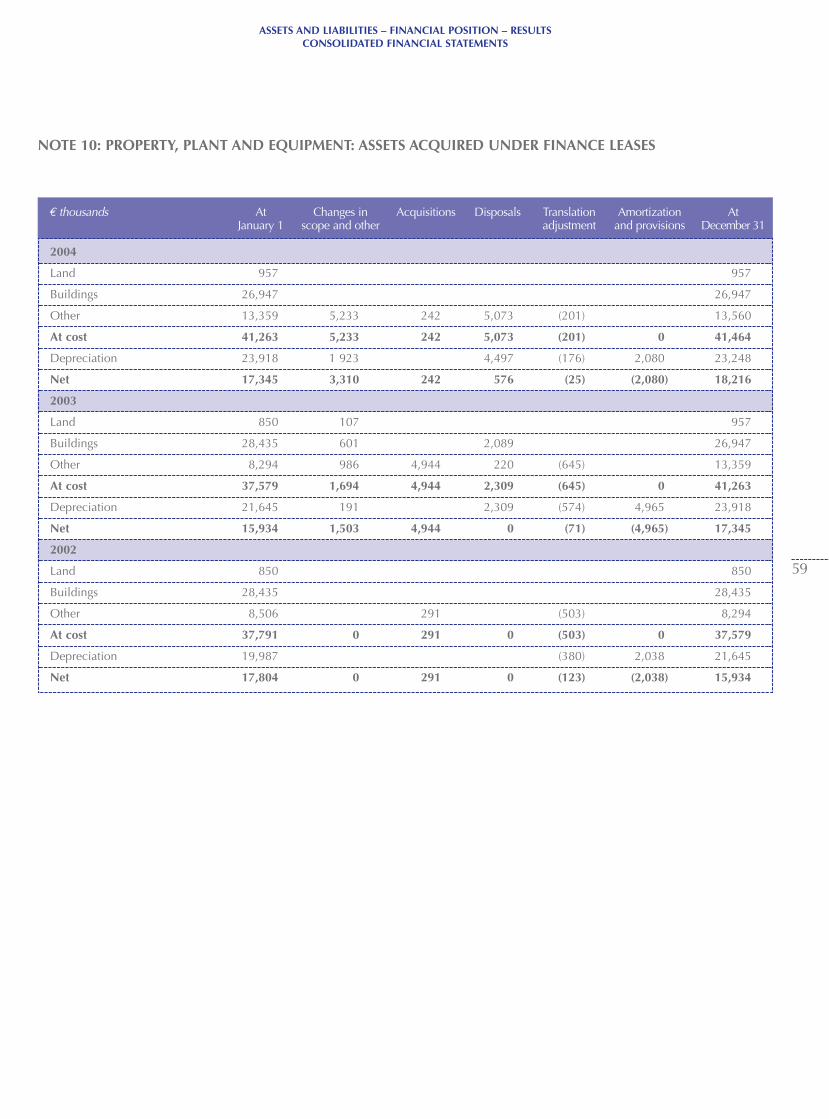
€ thousands At Changes in Acquisitions Disposals Translation Amortization At January 1 scope and other adjustment and provisions December 31
ASSETS AND LIABILITIES – FINANCIAL POSITION – RESULTSCONSOLIDATED FINANCIAL STATEMENTS
59
NOTE 10: PROPERTY, PLANT AND EQUIPMENT: ASSETS ACQUIRED UNDER FINANCE LEASES
2004
Land 957 957
Buildings 26,947 26,947
Other 13,359 5,233 242 5,073 (201) 13,560
At cost 41,263 5,233 242 5,073 (201) 0 41,464
Depreciation 23,918 1 923 4,497 (176) 2,080 23,248
Net 17,345 3,310 242 576 (25) (2,080) 18,216
2003
Land 850 107 957
Buildings 28,435 601 2,089 26,947
Other 8,294 986 4,944 220 (645) 13,359
At cost 37,579 1,694 4,944 2,309 (645) 0 41,263
Depreciation 21,645 191 2,309 (574) 4,965 23,918
Net 15,934 1,503 4,944 0 (71) (4,965) 17,345
2002
Land 850 850
Buildings 28,435 28,435
Other 8,506 291 (503) 8,294
At cost 37,791 0 291 0 (503) 0 37,579
Depreciation 19,987 (380) 2,038 21,645
Net 17,804 0 291 0 (123) (2,038) 15,934
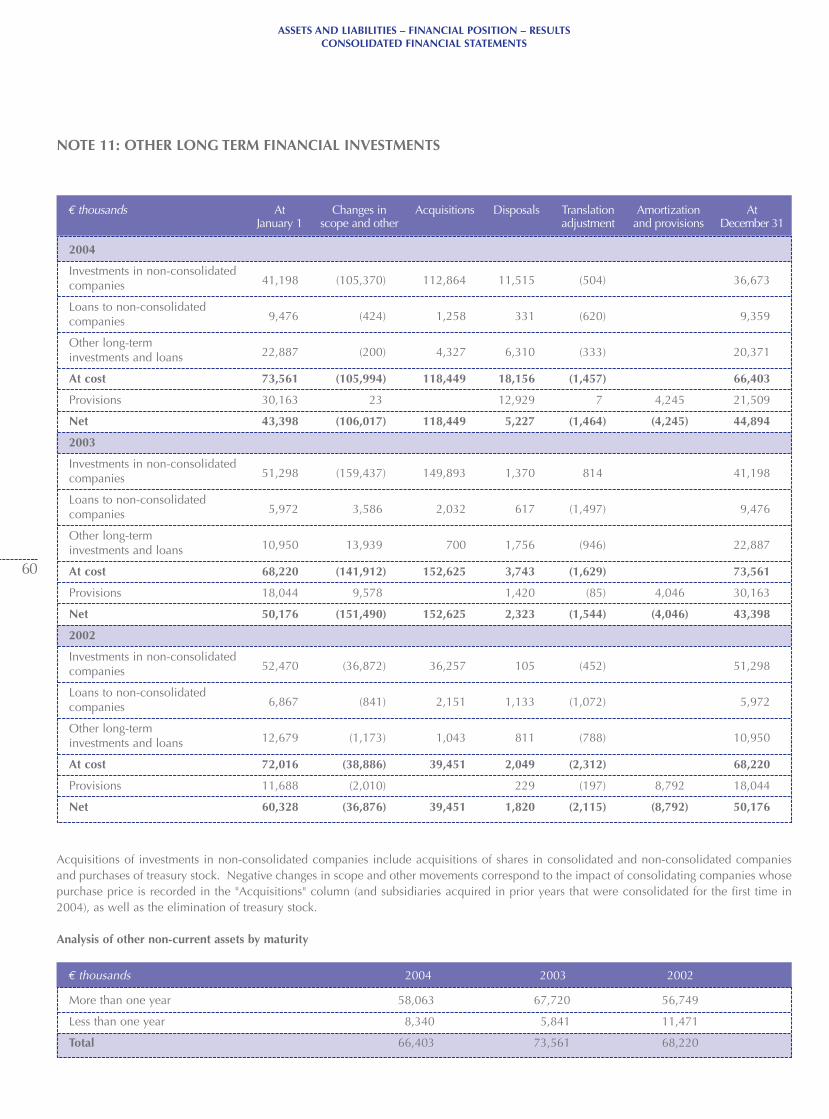
€ thousands 2004 2003 2002
€ thousands At Changes in Acquisitions Disposals Translation Amortization At January 1 scope and other adjustment and provisions December 31
ASSETS AND LIABILITIES – FINANCIAL POSITION – RESULTSCONSOLIDATED FINANCIAL STATEMENTS
60
NOTE 11: OTHER LONG TERM FINANCIAL INVESTMENTS
Acquisitions of investments in non-consolidated companies include acquisitions of shares in consolidated and non-consolidated companiesand purchases of treasury stock. Negative changes in scope and other movements correspond to the impact of consolidating companies whosepurchase price is recorded in the "Acquisitions" column (and subsidiaries acquired in prior years that were consolidated for the first time in2004), as well as the elimination of treasury stock.
Analysis of other non-current assets by maturity
2004
Investments in non-consolidated companies 41,198 (105,370) 112,864 11,515 (504) 36,673
Loans to non-consolidated companies 9,476 (424) 1,258 331 (620) 9,359
Other long-term investments and loans 22,887 (200) 4,327 6,310 (333) 20,371
At cost 73,561 (105,994) 118,449 18,156 (1,457) 66,403
Provisions 30,163 23 12,929 7 4,245 21,509
Net 43,398 (106,017) 118,449 5,227 (1,464) (4,245) 44,894
2003
Investments in non-consolidated companies 51,298 (159,437) 149,893 1,370 814 41,198
Loans to non-consolidatedcompanies 5,972 3,586 2,032 617 (1,497) 9,476
Other long-term investments and loans 10,950 13,939 700 1,756 (946) 22,887
At cost 68,220 (141,912) 152,625 3,743 (1,629) 73,561
Provisions 18,044 9,578 1,420 (85) 4,046 30,163
Net 50,176 (151,490) 152,625 2,323 (1,544) (4,046) 43,398
2002
Investments in non-consolidated companies 52,470 (36,872) 36,257 105 (452) 51,298
Loans to non-consolidatedcompanies 6,867 (841) 2,151 1,133 (1,072) 5,972
Other long-term investments and loans 12,679 (1,173) 1,043 811 (788) 10,950
At cost 72,016 (38,886) 39,451 2,049 (2,312) 68,220
Provisions 11,688 (2,010) 229 (197) 8,792 18,044
Net 60,328 (36,876) 39,451 1,820 (2,115) (8,792) 50,176
More than one year 58,063 67,720 56,749
Less than one year 8,340 5,841 11,471
Total 66,403 73,561 68,220
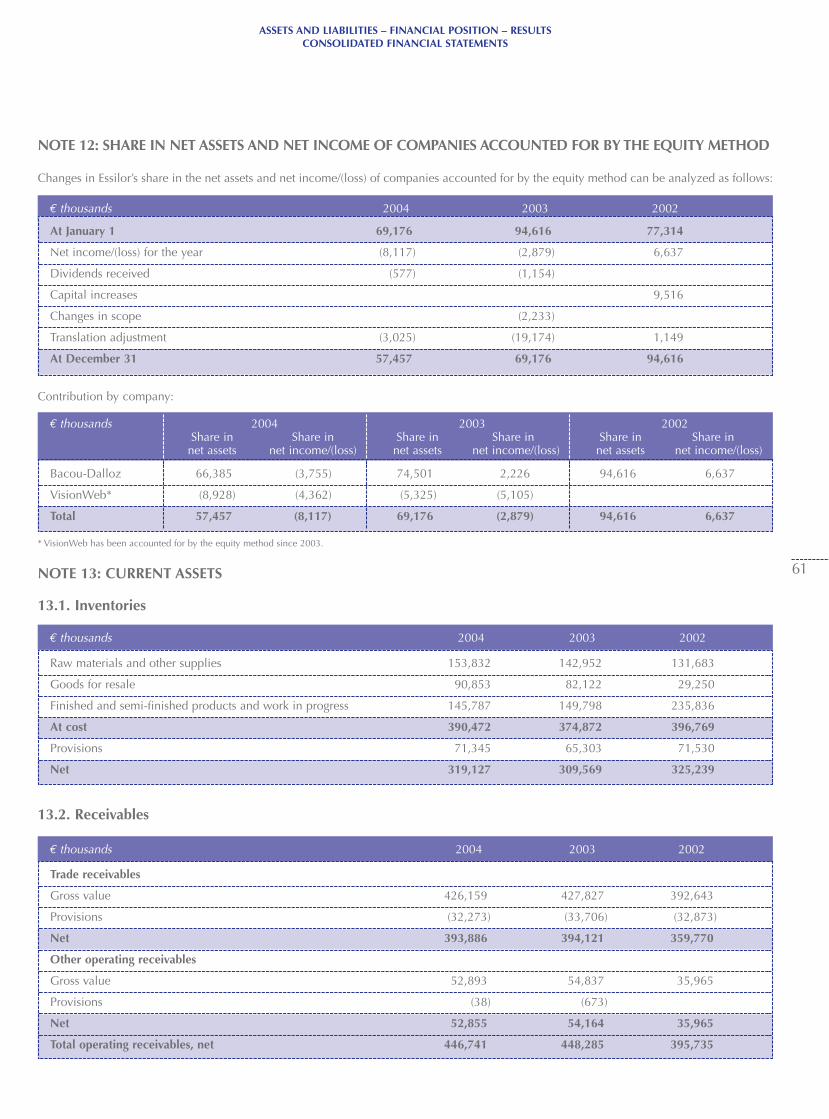
€ thousands 2004 2003 2002
€ thousands 2004 2003 2002Share in Share in Share in Share in Share in Share innet assets net income/(loss) net assets net income/(loss) net assets net income/(loss)
€ thousands 2004 2003 2002
€ thousands 2004 2003 2002
ASSETS AND LIABILITIES – FINANCIAL POSITION – RESULTSCONSOLIDATED FINANCIAL STATEMENTS
61
NOTE 12: SHARE IN NET ASSETS AND NET INCOME OF COMPANIES ACCOUNTED FOR BY THE EQUITY METHOD
Changes in Essilor’s share in the net assets and net income/(loss) of companies accounted for by the equity method can be analyzed as follows:
At January 1 69,176 94,616 77,314
Net income/(loss) for the year (8,117) (2,879) 6,637
Dividends received (577) (1,154)
Capital increases 9,516
Changes in scope (2,233)
Translation adjustment (3,025) (19,174) 1,149
At December 31 57,457 69,176 94,616
Contribution by company:
* VisionWeb has been accounted for by the equity method since 2003.
NOTE 13: CURRENT ASSETS
13.1. Inventories
Bacou-Dalloz 66,385 (3,755) 74,501 2,226 94,616 6,637
VisionWeb* (8,928) (4,362) (5,325) (5,105)
Total 57,457 (8,117) 69,176 (2,879) 94,616 6,637
Raw materials and other supplies 153,832 142,952 131,683
Goods for resale 90,853 82,122 29,250
Finished and semi-finished products and work in progress 145,787 149,798 235,836
At cost 390,472 374,872 396,769
Provisions 71,345 65,303 71,530
Net 319,127 309,569 325,239
13.2. Receivables
Trade receivables
Gross value 426,159 427,827 392,643
Provisions (32,273) (33,706) (32,873)
Net 393,886 394,121 359,770
Other operating receivables
Gross value 52,893 54,837 35,965
Provisions (38) (673)
Net 52,855 54,164 35,965
Total operating receivables, net 446,741 448,285 395,735
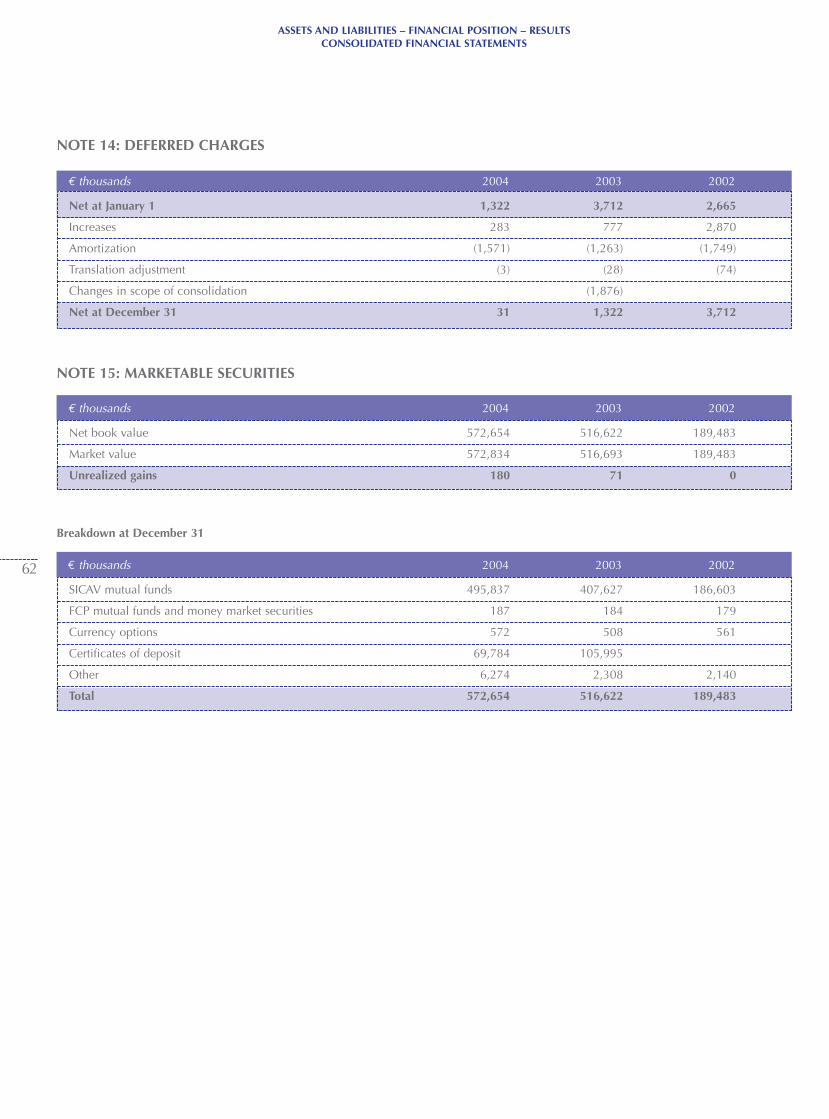
€ thousands 2004 2003 2002
€ thousands 2004 2003 2002
€ thousands 2004 2003 2002
ASSETS AND LIABILITIES – FINANCIAL POSITION – RESULTSCONSOLIDATED FINANCIAL STATEMENTS
62
NOTE 14: DEFERRED CHARGES
Net at January 1 1,322 3,712 2,665
Increases 283 777 2,870
Amortization (1,571) (1,263) (1,749)
Translation adjustment (3) (28) (74)
Changes in scope of consolidation (1,876)
Net at December 31 31 1,322 3,712
NOTE 15: MARKETABLE SECURITIES
Net book value 572,654 516,622 189,483
Market value 572,834 516,693 189,483
Unrealized gains 180 71 0
Breakdown at December 31
SICAV mutual funds 495,837 407,627 186,603
FCP mutual funds and money market securities 187 184 179
Currency options 572 508 561
Certificates of deposit 69,784 105,995
Other 6,274 2,308 2,140
Total 572,654 516,622 189,483
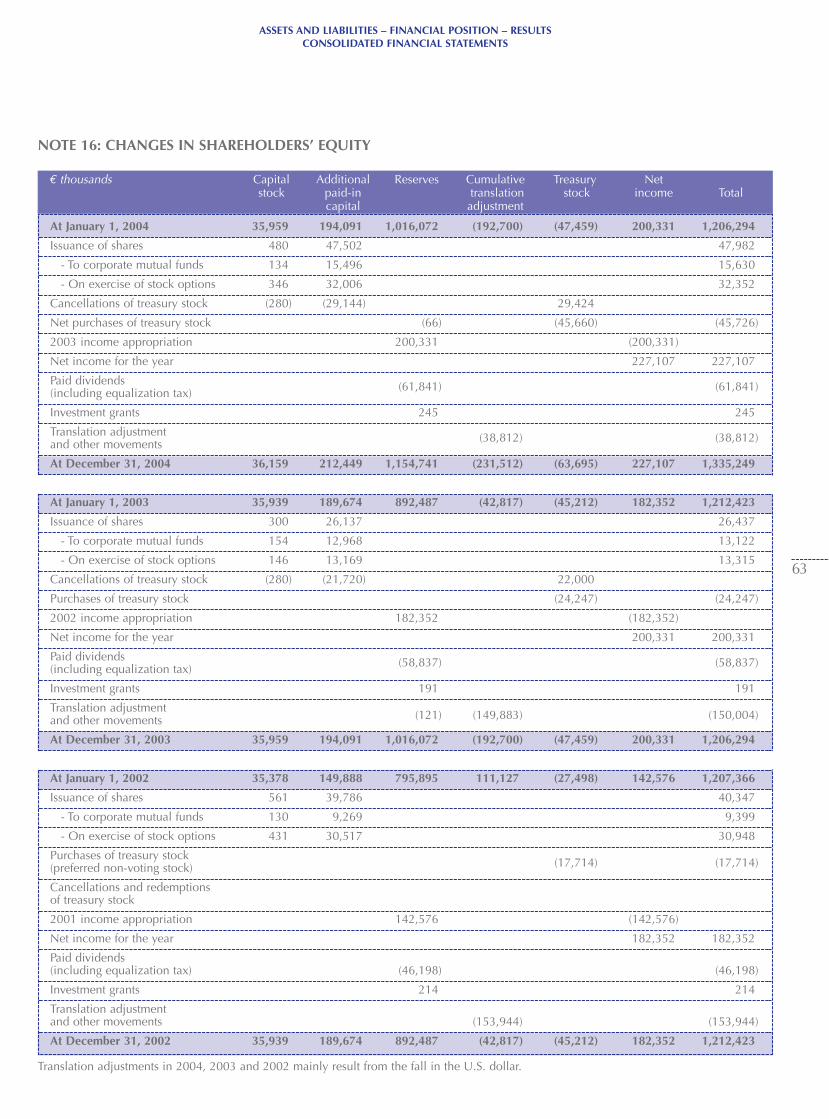
€ thousands Capital Additional Reserves Cumulative Treasury Net stock paid-in translation stock income Total
capital adjustment
ASSETS AND LIABILITIES – FINANCIAL POSITION – RESULTSCONSOLIDATED FINANCIAL STATEMENTS
63
NOTE 16: CHANGES IN SHAREHOLDERS’ EQUITY
At January 1, 2004 35,959 194,091 1,016,072 (192,700) (47,459) 200,331 1,206,294
Issuance of shares 480 47,502 47,982
- To corporate mutual funds 134 15,496 15,630
- On exercise of stock options 346 32,006 32,352
Cancellations of treasury stock (280) (29,144) 29,424
Net purchases of treasury stock (66) (45,660) (45,726)
2003 income appropriation 200,331 (200,331)
Net income for the year 227,107 227,107
Paid dividends (including equalization tax) (61,841) (61,841)
Investment grants 245 245
Translation adjustment and other movements (38,812) (38,812)
At December 31, 2004 36,159 212,449 1,154,741 (231,512) (63,695) 227,107 1,335,249
At January 1, 2003 35,939 189,674 892,487 (42,817) (45,212) 182,352 1,212,423
Issuance of shares 300 26,137 26,437
- To corporate mutual funds 154 12,968 13,122
- On exercise of stock options 146 13,169 13,315
Cancellations of treasury stock (280) (21,720) 22,000
Purchases of treasury stock (24,247) (24,247)
2002 income appropriation 182,352 (182,352)
Net income for the year 200,331 200,331
Paid dividends (including equalization tax) (58,837) (58,837)
Investment grants 191 191
Translation adjustment and other movements (121) (149,883) (150,004)
At December 31, 2003 35,959 194,091 1,016,072 (192,700) (47,459) 200,331 1,206,294
At January 1, 2002 35,378 149,888 795,895 111,127 (27,498) 142,576 1,207,366
Issuance of shares 561 39,786 40,347
- To corporate mutual funds 130 9,269 9,399
- On exercise of stock options 431 30,517 30,948
Purchases of treasury stock (preferred non-voting stock) (17,714) (17,714)
Cancellations and redemptions of treasury stock
2001 income appropriation 142,576 (142,576)
Net income for the year 182,352 182,352
Paid dividends (including equalization tax) (46,198) (46,198)
Investment grants 214 214
Translation adjustment and other movements (153,944) (153,944)
At December 31, 2002 35,939 189,674 892,487 (42,817) (45,212) 182,352 1,212,423
Translation adjustments in 2004, 2003 and 2002 mainly result from the fall in the U.S. dollar.
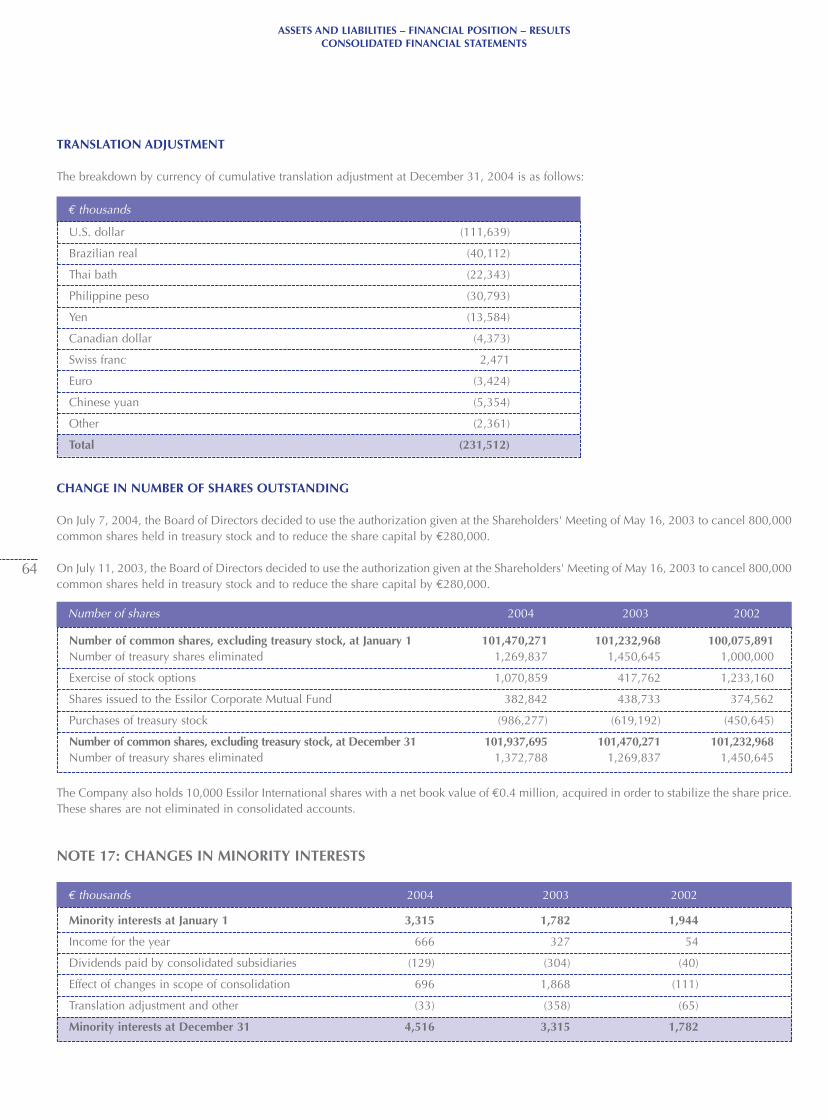
€ thousands 2004 2003 2002
Number of shares 2004 2003 2002
€ thousands
ASSETS AND LIABILITIES – FINANCIAL POSITION – RESULTSCONSOLIDATED FINANCIAL STATEMENTS
64
U.S. dollar (111,639)
Brazilian real (40,112)
Thai bath (22,343)
Philippine peso (30,793)
Yen (13,584)
Canadian dollar (4,373)
Swiss franc 2,471
Euro (3,424)
Chinese yuan (5,354)
Other (2,361)
Total (231,512)
TRANSLATION ADJUSTMENT
The breakdown by currency of cumulative translation adjustment at December 31, 2004 is as follows:
Number of common shares, excluding treasury stock, at January 1 101,470,271 101,232,968 100,075,891Number of treasury shares eliminated 1,269,837 1,450,645 1,000,000
Exercise of stock options 1,070,859 417,762 1,233,160
Shares issued to the Essilor Corporate Mutual Fund 382,842 438,733 374,562
Purchases of treasury stock (986,277) (619,192) (450,645)
Number of common shares, excluding treasury stock, at December 31 101,937,695 101,470,271 101,232,968Number of treasury shares eliminated 1,372,788 1,269,837 1,450,645
CHANGE IN NUMBER OF SHARES OUTSTANDING
On July 7, 2004, the Board of Directors decided to use the authorization given at the Shareholders' Meeting of May 16, 2003 to cancel 800,000common shares held in treasury stock and to reduce the share capital by €280,000.
On July 11, 2003, the Board of Directors decided to use the authorization given at the Shareholders' Meeting of May 16, 2003 to cancel 800,000common shares held in treasury stock and to reduce the share capital by €280,000.
The Company also holds 10,000 Essilor International shares with a net book value of €0.4 million, acquired in order to stabilize the share price.These shares are not eliminated in consolidated accounts.
NOTE 17: CHANGES IN MINORITY INTERESTS
Minority interests at January 1 3,315 1,782 1,944
Income for the year 666 327 54
Dividends paid by consolidated subsidiaries (129) (304) (40)
Effect of changes in scope of consolidation 696 1,868 (111)
Translation adjustment and other (33) (358) (65)
Minority interests at December 31 4,516 3,315 1,782
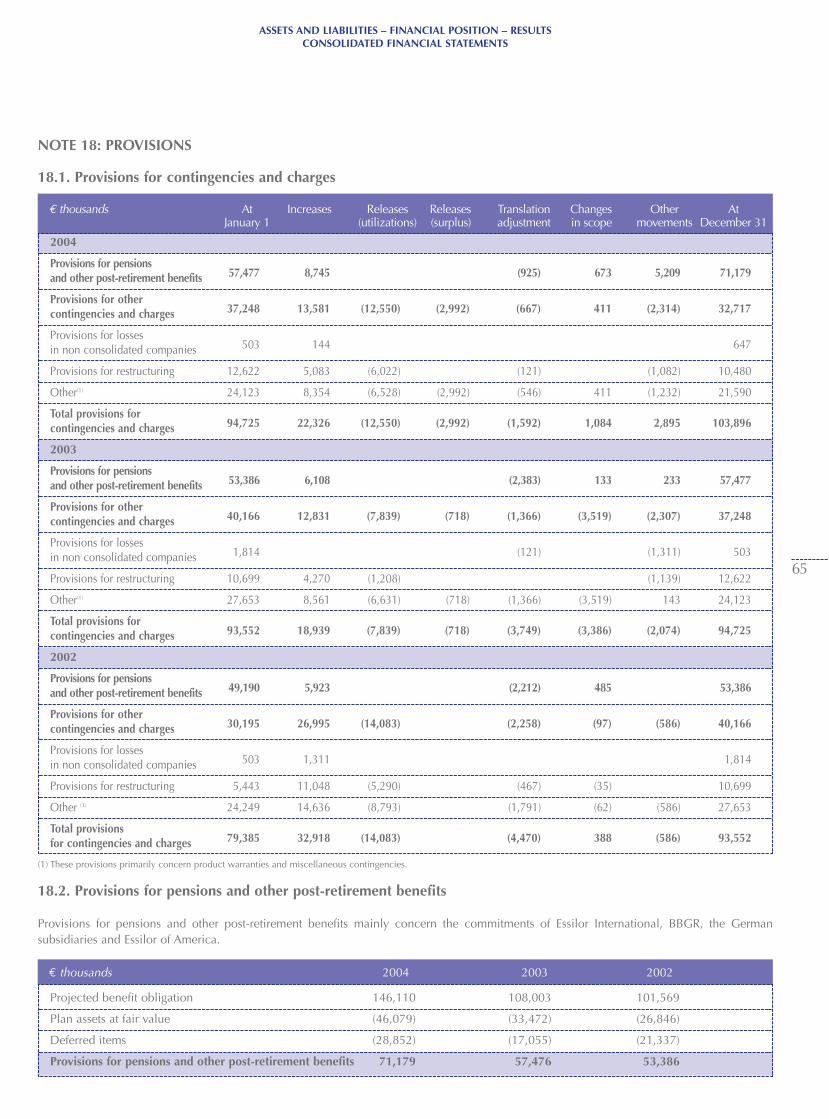
€ thousands At Increases Releases Releases Translation Changes Other At January 1 (utilizations) (surplus) adjustment in scope movements December 31
ASSETS AND LIABILITIES – FINANCIAL POSITION – RESULTSCONSOLIDATED FINANCIAL STATEMENTS
65
NOTE 18: PROVISIONS
18.1. Provisions for contingencies and charges
(1) These provisions primarily concern product warranties and miscellaneous contingencies.
2004
Provisions for pensions and other post-retirement benefits 57,477 8,745 (925) 673 5,209 71,179
Provisions for other contingencies and charges 37,248 13,581 (12,550) (2,992) (667) 411 (2,314) 32,717
Provisions for lossesin non consolidated companies 503 144 647
Provisions for restructuring 12,622 5,083 (6,022) (121) (1,082) 10,480
Other(1) 24,123 8,354 (6,528) (2,992) (546) 411 (1,232) 21,590
Total provisions for contingencies and charges 94,725 22,326 (12,550) (2,992) (1,592) 1,084 2,895 103,896
2003
Provisions for pensions and other post-retirement benefits 53,386 6,108 (2,383) 133 233 57,477
Provisions for other contingencies and charges 40,166 12,831 (7,839) (718) (1,366) (3,519) (2,307) 37,248
Provisions for losses in non consolidated companies 1,814 (121) (1,311) 503
Provisions for restructuring 10,699 4,270 (1,208) (1,139) 12,622
Other(1) 27,653 8,561 (6,631) (718) (1,366) (3,519) 143 24,123
Total provisions for contingencies and charges 93,552 18,939 (7,839) (718) (3,749) (3,386) (2,074) 94,725
2002
Provisions for pensions and other post-retirement benefits 49,190 5,923 (2,212) 485 53,386
Provisions for other contingencies and charges 30,195 26,995 (14,083) (2,258) (97) (586) 40,166
Provisions for lossesin non consolidated companies 503 1,311 1,814
Provisions for restructuring 5,443 11,048 (5,290) (467) (35) 10,699
Other (1) 24,249 14,636 (8,793) (1,791) (62) (586) 27,653
Total provisions for contingencies and charges 79,385 32,918 (14,083) (4,470) 388 (586) 93,552
€ thousands 2004 2003 2002
18.2. Provisions for pensions and other post-retirement benefits
Provisions for pensions and other post-retirement benefits mainly concern the commitments of Essilor International, BBGR, the Germansubsidiaries and Essilor of America.
Projected benefit obligation 146,110 108,003 101,569
Plan assets at fair value (46,079) (33,472) (26,846)
Deferred items (28,852) (17,055) (21,337)
Provisions for pensions and other post-retirement benefits 71,179 57,476 53,386
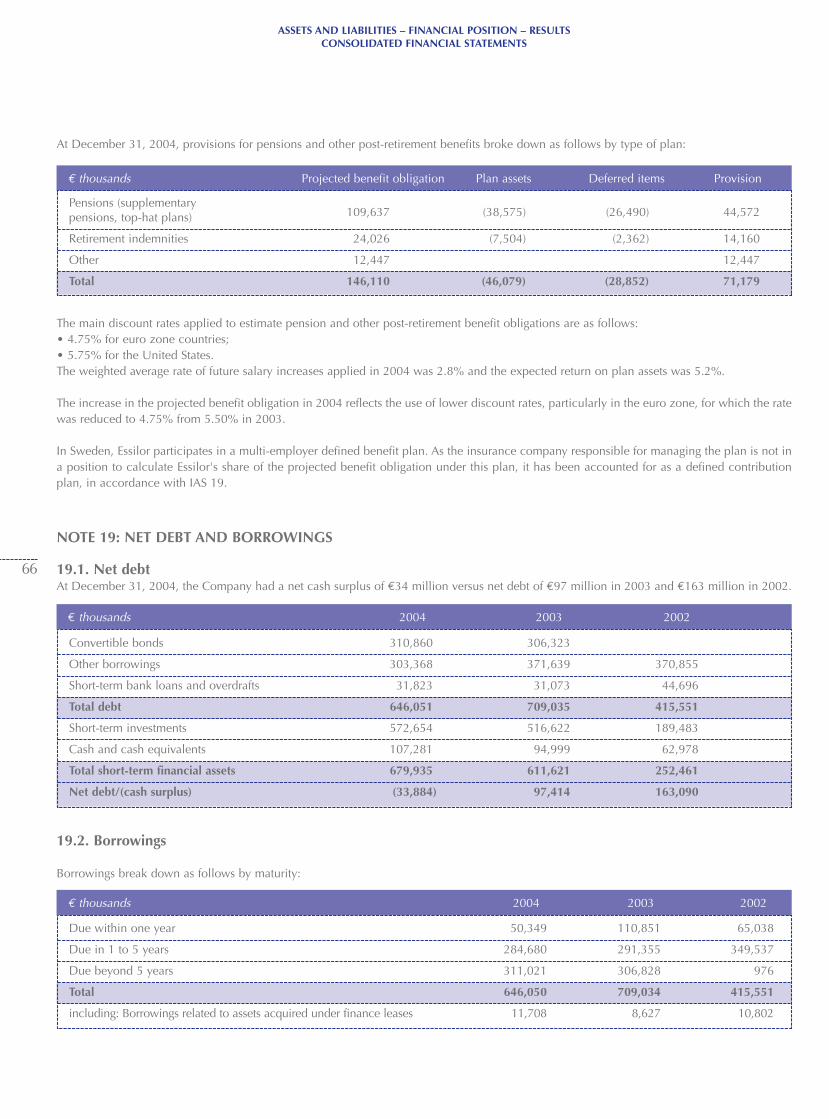
€ thousands 2004 2003 2002
€ thousands 2004 2003 2002
€ thousands Projected benefit obligation Plan assets Deferred items Provision
19.2. Borrowings
Borrowings break down as follows by maturity:
ASSETS AND LIABILITIES – FINANCIAL POSITION – RESULTSCONSOLIDATED FINANCIAL STATEMENTS
66
Due within one year 50,349 110,851 65,038
Due in 1 to 5 years 284,680 291,355 349,537
Due beyond 5 years 311,021 306,828 976
Total 646,050 709,034 415,551
including: Borrowings related to assets acquired under finance leases 11,708 8,627 10,802
Convertible bonds 310,860 306,323
Other borrowings 303,368 371,639 370,855
Short-term bank loans and overdrafts 31,823 31,073 44,696
Total debt 646,051 709,035 415,551
Short-term investments 572,654 516,622 189,483
Cash and cash equivalents 107,281 94,999 62,978
Total short-term financial assets 679,935 611,621 252,461
Net debt/(cash surplus) (33,884) 97,414 163,090
At December 31, 2004, provisions for pensions and other post-retirement benefits broke down as follows by type of plan:
The main discount rates applied to estimate pension and other post-retirement benefit obligations are as follows:• 4.75% for euro zone countries;• 5.75% for the United States.The weighted average rate of future salary increases applied in 2004 was 2.8% and the expected return on plan assets was 5.2%.
The increase in the projected benefit obligation in 2004 reflects the use of lower discount rates, particularly in the euro zone, for which the ratewas reduced to 4.75% from 5.50% in 2003.
In Sweden, Essilor participates in a multi-employer defined benefit plan. As the insurance company responsible for managing the plan is not ina position to calculate Essilor's share of the projected benefit obligation under this plan, it has been accounted for as a defined contributionplan, in accordance with IAS 19.
NOTE 19: NET DEBT AND BORROWINGS
19.1. Net debt At December 31, 2004, the Company had a net cash surplus of €34 million versus net debt of €97 million in 2003 and €163 million in 2002.
Pensions (supplementarypensions, top-hat plans) 109,637 (38,575) (26,490) 44,572
Retirement indemnities 24,026 (7,504) (2,362) 14,160
Other 12,447 12,447
Total 146,110 (46,079) (28,852) 71,179
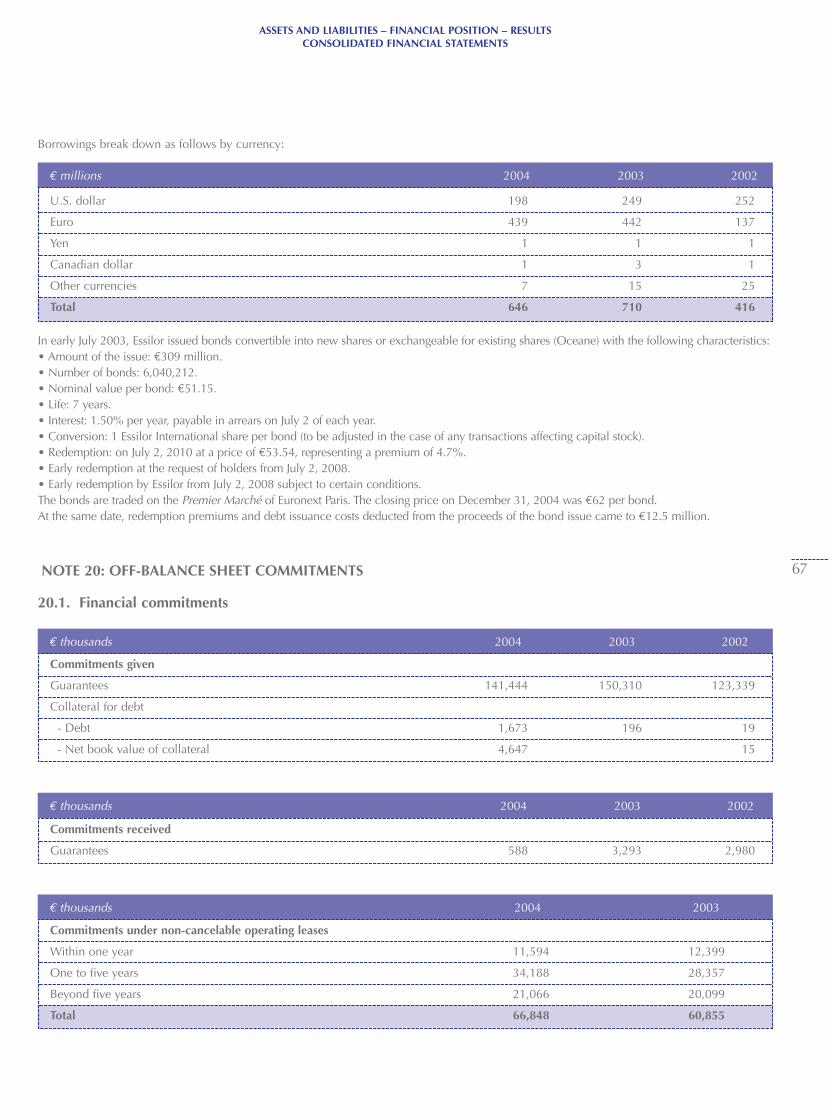
€ thousands 2004 2003 2002
€ thousands 2004 2003 2002
€ millions 2004 2003 2002
ASSETS AND LIABILITIES – FINANCIAL POSITION – RESULTSCONSOLIDATED FINANCIAL STATEMENTS
67
Borrowings break down as follows by currency:
In early July 2003, Essilor issued bonds convertible into new shares or exchangeable for existing shares (Oceane) with the following characteristics:• Amount of the issue: €309 million.• Number of bonds: 6,040,212.• Nominal value per bond: €51.15.• Life: 7 years.• Interest: 1.50% per year, payable in arrears on July 2 of each year.• Conversion: 1 Essilor International share per bond (to be adjusted in the case of any transactions affecting capital stock).• Redemption: on July 2, 2010 at a price of €53.54, representing a premium of 4.7%.• Early redemption at the request of holders from July 2, 2008.• Early redemption by Essilor from July 2, 2008 subject to certain conditions.The bonds are traded on the Premier Marché of Euronext Paris. The closing price on December 31, 2004 was €62 per bond. At the same date, redemption premiums and debt issuance costs deducted from the proceeds of the bond issue came to €12.5 million.
NOTE 20: OFF-BALANCE SHEET COMMITMENTS
20.1. Financial commitments
U.S. dollar 198 249 252
Euro 439 442 137
Yen 1 1 1
Canadian dollar 1 3 1
Other currencies 7 15 25
Total 646 710 416
Commitments given
Guarantees 141,444 150,310 123,339
Collateral for debt
- Debt 1,673 196 19
- Net book value of collateral 4,647 15
Commitments received
Guarantees 588 3,293 2,980
€ thousands 2004 2003
Commitments under non-cancelable operating leases
Within one year 11,594 12,399
One to five years 34,188 28,357
Beyond five years 21,066 20,099
Total 66,848 60,855
ASSETS AND LIABILITIES – FINANCIAL POSITION – RESULTSCONSOLIDATED FINANCIAL STATEMENTS
68
20.2. Management of interest rate, liquidity and currency risks
Interest rate risk managementThe Company's interest rate management policy consists in protectingpositions against the effects of an unfavorable change in interestrates and taking advantage of or locking in the benefits of favorablerates.
The nominal amounts of interest rate hedging instruments (withforeign currency items valuted at the December 31, 2004 fixing rate)were as follows:
- Swap where the Company is the fixed rate borrower: €114 million(€170 million in 2003 and €205 million in 2002).
This swap is linked to a cross-currency swap, originally on anotional amount of €122 million. In 2003 and 2002, the notionalamount was €182 million (amounts in euros converted at theoriginal exchange rate of the cross-currency swaps).
The gross debt includes private placement notes for €150 million,bonds for €433 million and miscellaneous lines of credit for €63million.
Fixed rate debt before hedging represented 48% of the total. Aftertaking into account the effect of the swap, 67% of debt was at fixedrates (69% in 2003 and 55% in 2002). The weighted average rate of interest on debt, after hedging, was2.89% at December 31, 2004 (3.06% in 2003 and 3.92% in 2002).
Liquidity risk managementIn 2004, the Company had a net cash position. However, in linewith its policy of ensuring that it has constant access to financing forits long-term needs and to take advantage of favorable market, theCompany canceled the €320 million syndicated line of creditexpiring at the end of 2005 and replaced it with a new €600 millionsyndicated facility expiring in 2009. This new line of credit was notdrawn down in 2004.
Currency risk managementThe Company's policy concerning currency risk managementconsists in systematically hedging these risks using appropriatemarket instruments, including forward purchases and sales offoreign currencies, and purchases of currency options.
Intercompany purchases and sales are billed in the local currency ofthe importing or exporting entity, to position substantially allcurrency risks at the level of Essilor International, the parentcompany. Subsidiaries exposed to material currency risks hedgethese risks with Corporate Treasury, which in turn hedges thepositions with its usual counterparties. Currency risks incurred byother subsidiaries are very limited. The Company's manufacturingunits operate essentially in US dollars; this means that the bulk ofintercompany transactions are billed in the US currency, helping toreduce net positions. It is Company policy not to hedge certain localrisks, primarily the risk of a fall in the US dollar against thecurrencies of certain Asian countries (other than Japan) where theCompany has manufacturing operations.
Currency market transactions are intended solely to hedge risksarising on business operations. The Company does not proceed totrading operations in foreign currencies, with no underlying.
All currency transactions are subject to pre-determined positionlimits, in order to optimize the protection afforded by the hedges. AtDecember 31, 2004, residual open positions were not material andremained easily within the limits set by the Company (hedgingbetween 80 and 100% of the identified risk position).
At December 31, 2004, currency positions including cross-currencyswaps but excluding options totaled €587 million (2003: €582million; 2002: €499 million). Currency options outstanding atDecember 31, 2004 totaled €59 million (2003: €98 million; 2002: €20 million).
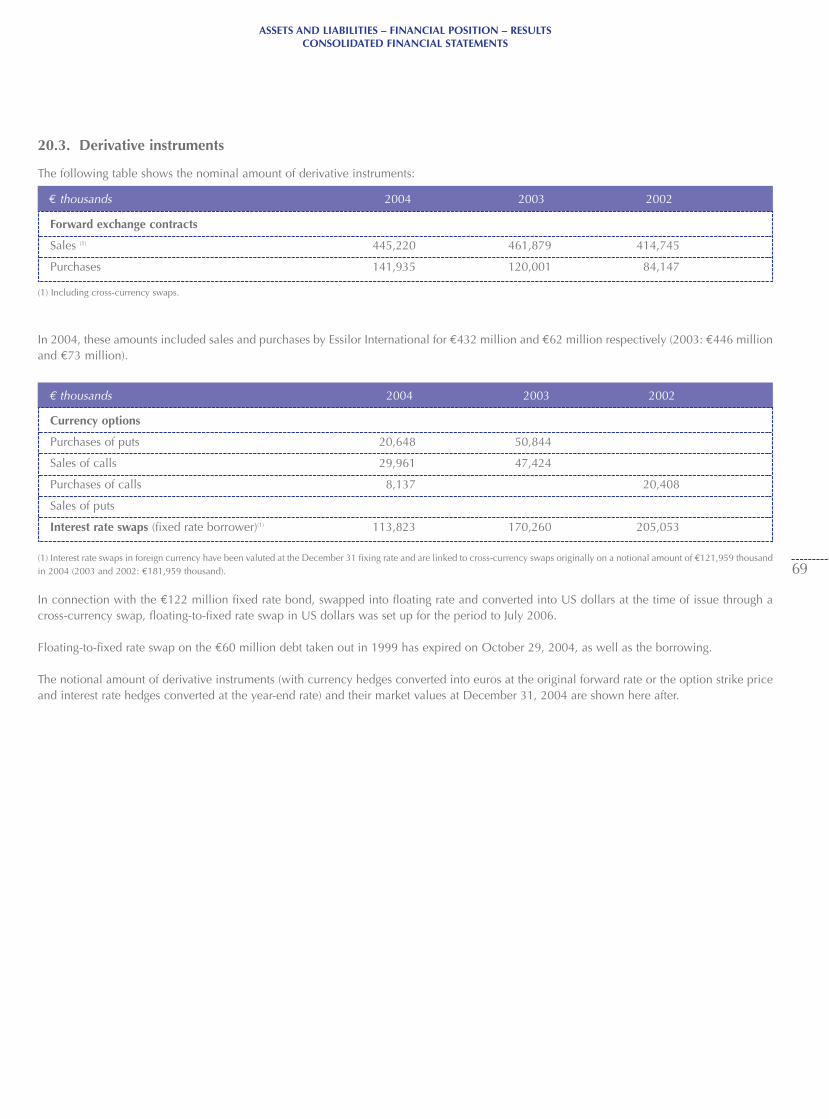
€ thousands 2004 2003 2002
€ thousands 2004 2003 2002
ASSETS AND LIABILITIES – FINANCIAL POSITION – RESULTSCONSOLIDATED FINANCIAL STATEMENTS
69
Forward exchange contracts
Sales (1) 445,220 461,879 414,745
Purchases 141,935 120,001 84,147
Currency options
Purchases of puts 20,648 50,844
Sales of calls 29,961 47,424
Purchases of calls 8,137 20,408
Sales of puts
Interest rate swaps (fixed rate borrower)(1) 113,823 170,260 205,053
(1) Including cross-currency swaps.
In 2004, these amounts included sales and purchases by Essilor International for €432 million and €62 million respectively (2003: €446 millionand €73 million).
(1) Interest rate swaps in foreign currency have been valuted at the December 31 fixing rate and are linked to cross-currency swaps originally on a notional amount of €121,959 thousandin 2004 (2003 and 2002: €181,959 thousand).
In connection with the €122 million fixed rate bond, swapped into floating rate and converted into US dollars at the time of issue through across-currency swap, floating-to-fixed rate swap in US dollars was set up for the period to July 2006.
Floating-to-fixed rate swap on the €60 million debt taken out in 1999 has expired on October 29, 2004, as well as the borrowing.
The notional amount of derivative instruments (with currency hedges converted into euros at the original forward rate or the option strike priceand interest rate hedges converted at the year-end rate) and their market values at December 31, 2004 are shown here after.
20.3. Derivative instruments
The following table shows the nominal amount of derivative instruments:
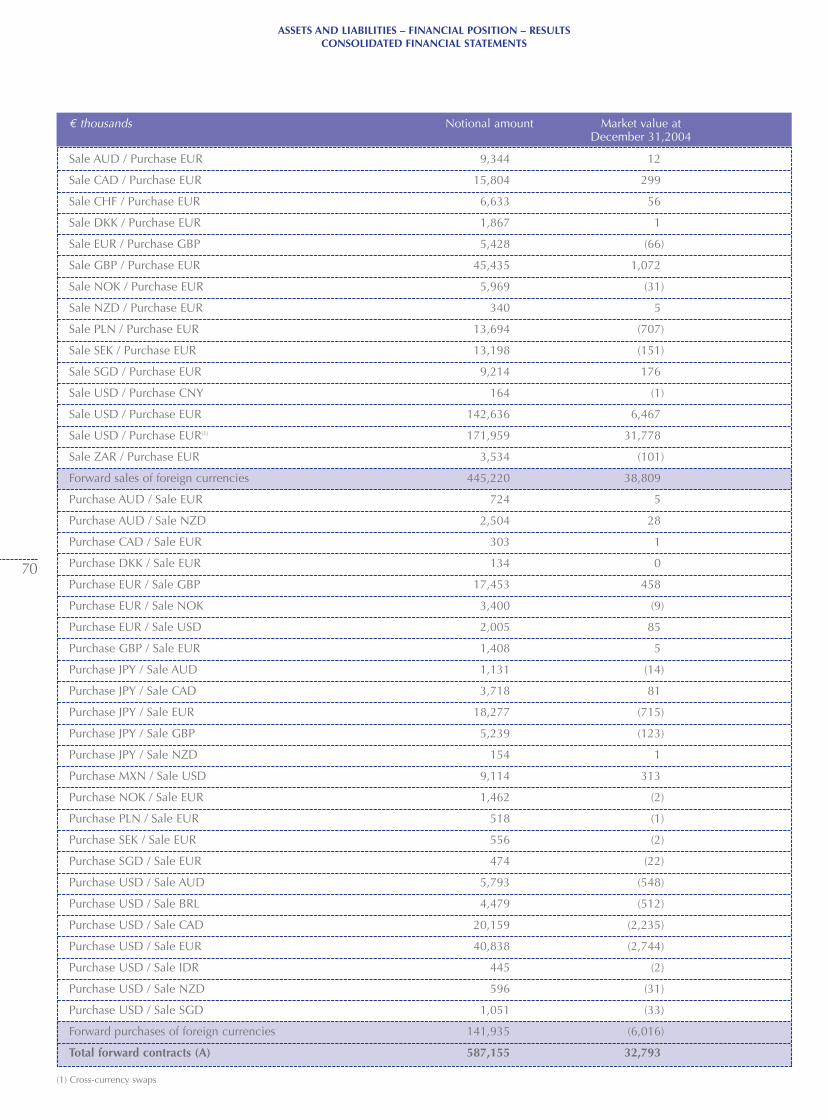
€ thousands Notional amount Market value at December 31,2004
ASSETS AND LIABILITIES – FINANCIAL POSITION – RESULTSCONSOLIDATED FINANCIAL STATEMENTS
70
Sale AUD / Purchase EUR 9,344 12
Sale CAD / Purchase EUR 15,804 299
Sale CHF / Purchase EUR 6,633 56
Sale DKK / Purchase EUR 1,867 1
Sale EUR / Purchase GBP 5,428 (66)
Sale GBP / Purchase EUR 45,435 1,072
Sale NOK / Purchase EUR 5,969 (31)
Sale NZD / Purchase EUR 340 5
Sale PLN / Purchase EUR 13,694 (707)
Sale SEK / Purchase EUR 13,198 (151)
Sale SGD / Purchase EUR 9,214 176
Sale USD / Purchase CNY 164 (1)
Sale USD / Purchase EUR 142,636 6,467
Sale USD / Purchase EUR(1) 171,959 31,778
Sale ZAR / Purchase EUR 3,534 (101)
Forward sales of foreign currencies 445,220 38,809
Purchase AUD / Sale EUR 724 5
Purchase AUD / Sale NZD 2,504 28
Purchase CAD / Sale EUR 303 1
Purchase DKK / Sale EUR 134 0
Purchase EUR / Sale GBP 17,453 458
Purchase EUR / Sale NOK 3,400 (9)
Purchase EUR / Sale USD 2,005 85
Purchase GBP / Sale EUR 1,408 5
Purchase JPY / Sale AUD 1,131 (14)
Purchase JPY / Sale CAD 3,718 81
Purchase JPY / Sale EUR 18,277 (715)
Purchase JPY / Sale GBP 5,239 (123)
Purchase JPY / Sale NZD 154 1
Purchase MXN / Sale USD 9,114 313
Purchase NOK / Sale EUR 1,462 (2)
Purchase PLN / Sale EUR 518 (1)
Purchase SEK / Sale EUR 556 (2)
Purchase SGD / Sale EUR 474 (22)
Purchase USD / Sale AUD 5,793 (548)
Purchase USD / Sale BRL 4,479 (512)
Purchase USD / Sale CAD 20,159 (2,235)
Purchase USD / Sale EUR 40,838 (2,744)
Purchase USD / Sale IDR 445 (2)
Purchase USD / Sale NZD 596 (31)
Purchase USD / Sale SGD 1,051 (33)
Forward purchases of foreign currencies 141,935 (6,016)
Total forward contracts (A) 587,155 32,793
(1) Cross-currency swaps
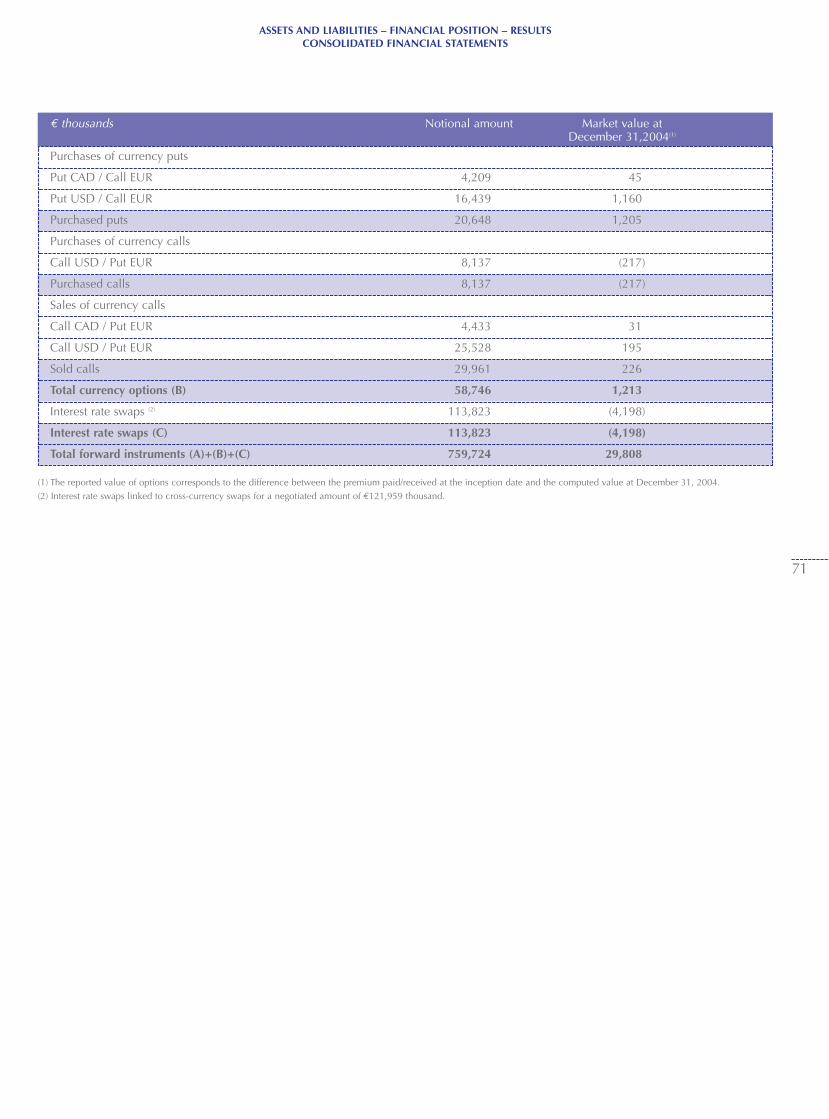
ASSETS AND LIABILITIES – FINANCIAL POSITION – RESULTSCONSOLIDATED FINANCIAL STATEMENTS
71
€ thousands Notional amount Market value at December 31,2004(1)
Purchases of currency puts
Put CAD / Call EUR 4,209 45
Put USD / Call EUR 16,439 1,160
Purchased puts 20,648 1,205
Purchases of currency calls
Call USD / Put EUR 8,137 (217)
Purchased calls 8,137 (217)
Sales of currency calls
Call CAD / Put EUR 4,433 31
Call USD / Put EUR 25,528 195
Sold calls 29,961 226
Total currency options (B) 58,746 1,213
Interest rate swaps (2) 113,823 (4,198)
Interest rate swaps (C) 113,823 (4,198)
Total forward instruments (A)+(B)+(C) 759,724 29,808
(1) The reported value of options corresponds to the difference between the premium paid/received at the inception date and the computed value at December 31, 2004.(2) Interest rate swaps linked to cross-currency swaps for a negotiated amount of €121,959 thousand.
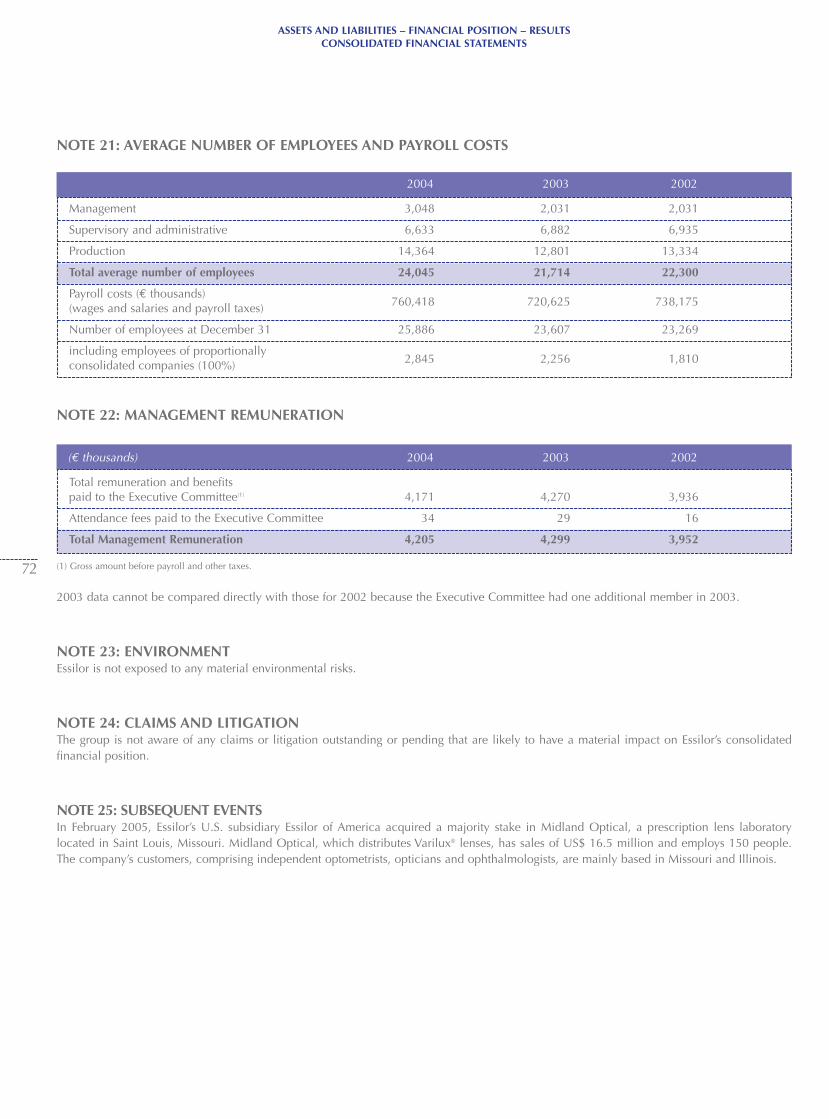
(€ thousands) 2004 2003 2002
2004 2003 2002
ASSETS AND LIABILITIES – FINANCIAL POSITION – RESULTSCONSOLIDATED FINANCIAL STATEMENTS
72
Management 3,048 2,031 2,031
Supervisory and administrative 6,633 6,882 6,935
Production 14,364 12,801 13,334
Total average number of employees 24,045 21,714 22,300
Payroll costs (€ thousands)(wages and salaries and payroll taxes) 760,418 720,625 738,175
Number of employees at December 31 25,886 23,607 23,269
including employees of proportionally consolidated companies (100%) 2,845 2,256 1,810
Total remuneration and benefits paid to the Executive Committee(1) 4,171 4,270 3,936
Attendance fees paid to the Executive Committee 34 29 16
Total Management Remuneration 4,205 4,299 3,952
NOTE 22: MANAGEMENT REMUNERATION
NOTE 21: AVERAGE NUMBER OF EMPLOYEES AND PAYROLL COSTS
(1) Gross amount before payroll and other taxes.
2003 data cannot be compared directly with those for 2002 because the Executive Committee had one additional member in 2003.
NOTE 23: ENVIRONMENTEssilor is not exposed to any material environmental risks.
NOTE 24: CLAIMS AND LITIGATIONThe group is not aware of any claims or litigation outstanding or pending that are likely to have a material impact on Essilor’s consolidated financial position.
NOTE 25: SUBSEQUENT EVENTSIn February 2005, Essilor’s U.S. subsidiary Essilor of America acquired a majority stake in Midland Optical, a prescription lens laboratory located in Saint Louis, Missouri. Midland Optical, which distributes Varilux® lenses, has sales of US$ 16.5 million and employs 150 people. The company’s customers, comprising independent optometrists, opticians and ophthalmologists, are mainly based in Missouri and Illinois.
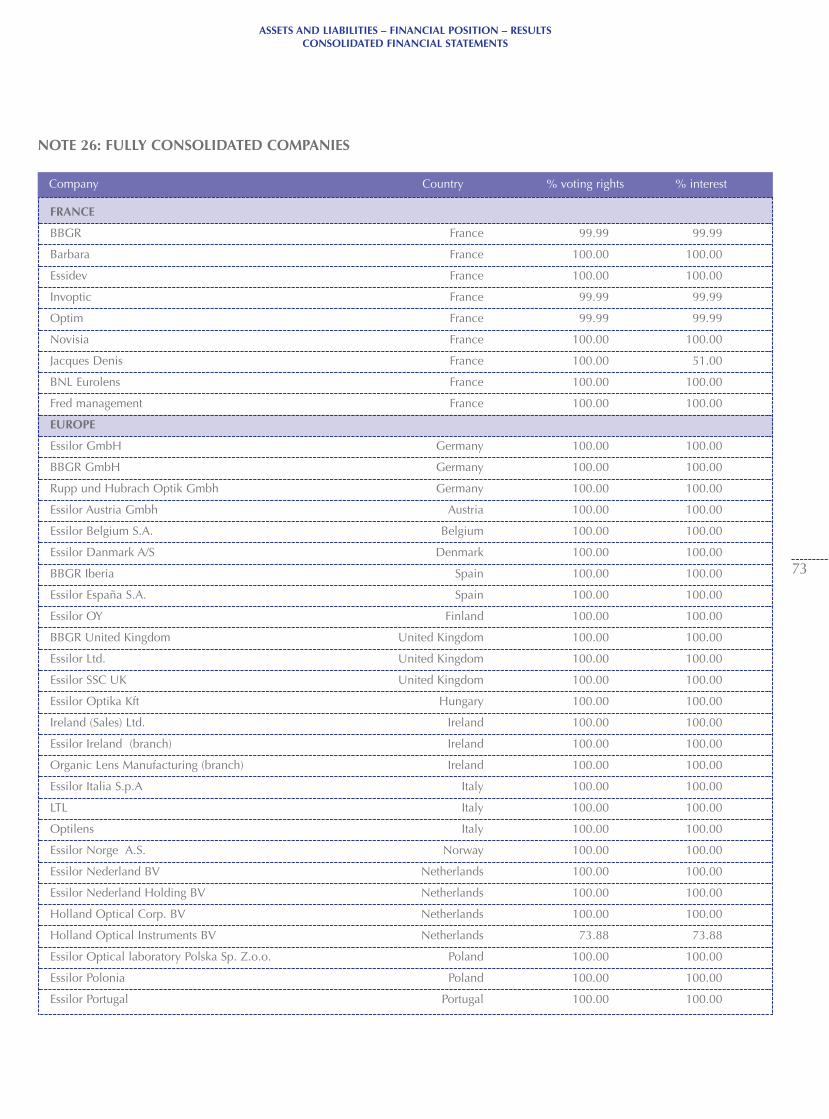
Company Country % voting rights % interest
ASSETS AND LIABILITIES – FINANCIAL POSITION – RESULTSCONSOLIDATED FINANCIAL STATEMENTS
73
NOTE 26: FULLY CONSOLIDATED COMPANIES
FRANCE
BBGR France 99.99 99.99
Barbara France 100.00 100.00
Essidev France 100.00 100.00
Invoptic France 99.99 99.99
Optim France 99.99 99.99
Novisia France 100.00 100.00
Jacques Denis France 100.00 51.00
BNL Eurolens France 100.00 100.00
Fred management France 100.00 100.00
EUROPE
Essilor GmbH Germany 100.00 100.00
BBGR GmbH Germany 100.00 100.00
Rupp und Hubrach Optik Gmbh Germany 100.00 100.00
Essilor Austria Gmbh Austria 100.00 100.00
Essilor Belgium S.A. Belgium 100.00 100.00
Essilor Danmark A/S Denmark 100.00 100.00
BBGR Iberia Spain 100.00 100.00
Essilor España S.A. Spain 100.00 100.00
Essilor OY Finland 100.00 100.00
BBGR United Kingdom United Kingdom 100.00 100.00
Essilor Ltd. United Kingdom 100.00 100.00
Essilor SSC UK United Kingdom 100.00 100.00
Essilor Optika Kft Hungary 100.00 100.00
Ireland (Sales) Ltd. Ireland 100.00 100.00
Essilor Ireland (branch) Ireland 100.00 100.00
Organic Lens Manufacturing (branch) Ireland 100.00 100.00
Essilor Italia S.p.A Italy 100.00 100.00
LTL Italy 100.00 100.00
Optilens Italy 100.00 100.00
Essilor Norge A.S. Norway 100.00 100.00
Essilor Nederland BV Netherlands 100.00 100.00
Essilor Nederland Holding BV Netherlands 100.00 100.00
Holland Optical Corp. BV Netherlands 100.00 100.00
Holland Optical Instruments BV Netherlands 73.88 73.88
Essilor Optical laboratory Polska Sp. Z.o.o. Poland 100.00 100.00
Essilor Polonia Poland 100.00 100.00
Essilor Portugal Portugal 100.00 100.00
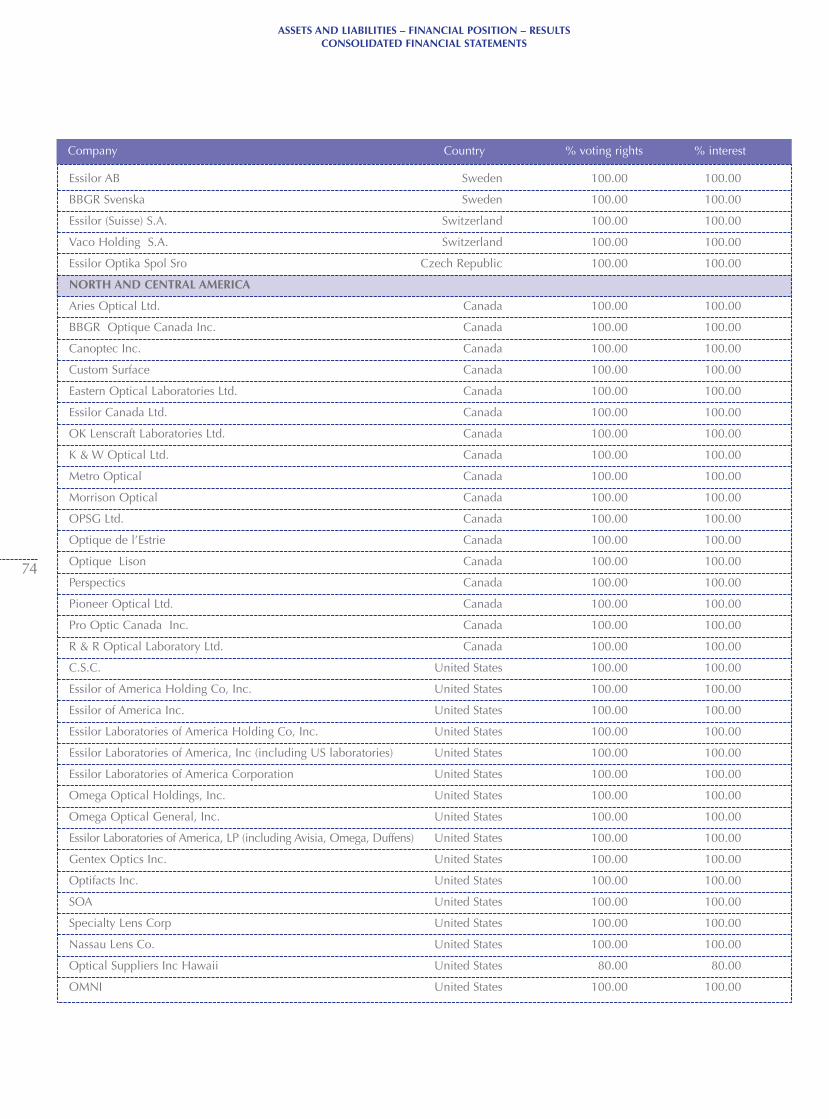
Company Country % voting rights % interest
ASSETS AND LIABILITIES – FINANCIAL POSITION – RESULTSCONSOLIDATED FINANCIAL STATEMENTS
74
Essilor AB Sweden 100.00 100.00
BBGR Svenska Sweden 100.00 100.00
Essilor (Suisse) S.A. Switzerland 100.00 100.00
Vaco Holding S.A. Switzerland 100.00 100.00
Essilor Optika Spol Sro Czech Republic 100.00 100.00
NORTH AND CENTRAL AMERICA
Aries Optical Ltd. Canada 100.00 100.00
BBGR Optique Canada Inc. Canada 100.00 100.00
Canoptec Inc. Canada 100.00 100.00
Custom Surface Canada 100.00 100.00
Eastern Optical Laboratories Ltd. Canada 100.00 100.00
Essilor Canada Ltd. Canada 100.00 100.00
OK Lenscraft Laboratories Ltd. Canada 100.00 100.00
K & W Optical Ltd. Canada 100.00 100.00
Metro Optical Canada 100.00 100.00
Morrison Optical Canada 100.00 100.00
OPSG Ltd. Canada 100.00 100.00
Optique de l’Estrie Canada 100.00 100.00
Optique Lison Canada 100.00 100.00
Perspectics Canada 100.00 100.00
Pioneer Optical Ltd. Canada 100.00 100.00
Pro Optic Canada Inc. Canada 100.00 100.00
R & R Optical Laboratory Ltd. Canada 100.00 100.00
C.S.C. United States 100.00 100.00
Essilor of America Holding Co, Inc. United States 100.00 100.00
Essilor of America Inc. United States 100.00 100.00
Essilor Laboratories of America Holding Co, Inc. United States 100.00 100.00
Essilor Laboratories of America, Inc (including US laboratories) United States 100.00 100.00
Essilor Laboratories of America Corporation United States 100.00 100.00
Omega Optical Holdings, Inc. United States 100.00 100.00
Omega Optical General, Inc. United States 100.00 100.00
Essilor Laboratories of America, LP (including Avisia, Omega, Duffens) United States 100.00 100.00
Gentex Optics Inc. United States 100.00 100.00
Optifacts Inc. United States 100.00 100.00
SOA United States 100.00 100.00
Specialty Lens Corp United States 100.00 100.00
Nassau Lens Co. United States 100.00 100.00
Optical Suppliers Inc Hawaii United States 80.00 80.00
OMNI United States 100.00 100.00
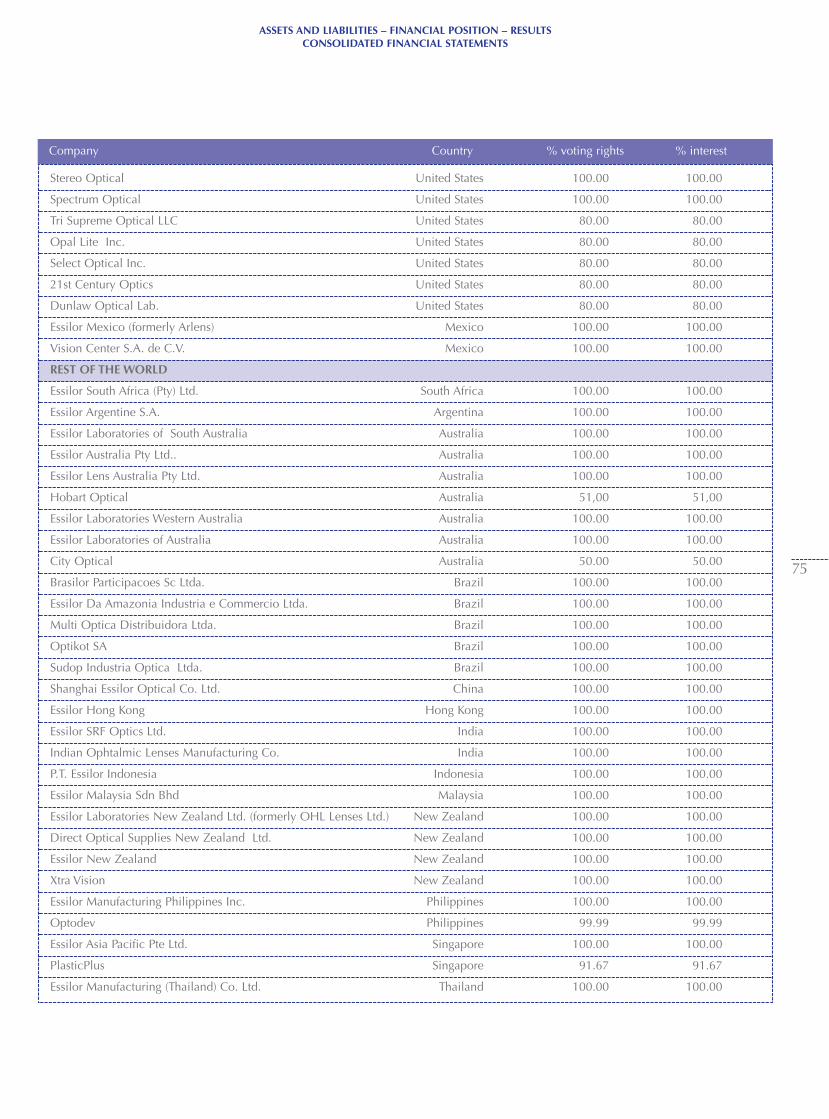
Company Country % voting rights % interest
ASSETS AND LIABILITIES – FINANCIAL POSITION – RESULTSCONSOLIDATED FINANCIAL STATEMENTS
75
Stereo Optical United States 100.00 100.00
Spectrum Optical United States 100.00 100.00
Tri Supreme Optical LLC United States 80.00 80.00
Opal Lite Inc. United States 80.00 80.00
Select Optical Inc. United States 80.00 80.00
21st Century Optics United States 80.00 80.00
Dunlaw Optical Lab. United States 80.00 80.00
Essilor Mexico (formerly Arlens) Mexico 100.00 100.00
Vision Center S.A. de C.V. Mexico 100.00 100.00
REST OF THE WORLD
Essilor South Africa (Pty) Ltd. South Africa 100.00 100.00
Essilor Argentine S.A. Argentina 100.00 100.00
Essilor Laboratories of South Australia Australia 100.00 100.00
Essilor Australia Pty Ltd.. Australia 100.00 100.00
Essilor Lens Australia Pty Ltd. Australia 100.00 100.00
Hobart Optical Australia 51,00 51,00
Essilor Laboratories Western Australia Australia 100.00 100.00
Essilor Laboratories of Australia Australia 100.00 100.00
City Optical Australia 50.00 50.00
Brasilor Participacoes Sc Ltda. Brazil 100.00 100.00
Essilor Da Amazonia Industria e Commercio Ltda. Brazil 100.00 100.00
Multi Optica Distribuidora Ltda. Brazil 100.00 100.00
Optikot SA Brazil 100.00 100.00
Sudop Industria Optica Ltda. Brazil 100.00 100.00
Shanghai Essilor Optical Co. Ltd. China 100.00 100.00
Essilor Hong Kong Hong Kong 100.00 100.00
Essilor SRF Optics Ltd. India 100.00 100.00
Indian Ophtalmic Lenses Manufacturing Co. India 100.00 100.00
P.T. Essilor Indonesia Indonesia 100.00 100.00
Essilor Malaysia Sdn Bhd Malaysia 100.00 100.00
Essilor Laboratories New Zealand Ltd. (formerly OHL Lenses Ltd.) New Zealand 100.00 100.00
Direct Optical Supplies New Zealand Ltd. New Zealand 100.00 100.00
Essilor New Zealand New Zealand 100.00 100.00
Xtra Vision New Zealand 100.00 100.00
Essilor Manufacturing Philippines Inc. Philippines 100.00 100.00
Optodev Philippines 99.99 99.99
Essilor Asia Pacific Pte Ltd. Singapore 100.00 100.00
PlasticPlus Singapore 91.67 91.67
Essilor Manufacturing (Thailand) Co. Ltd. Thailand 100.00 100.00
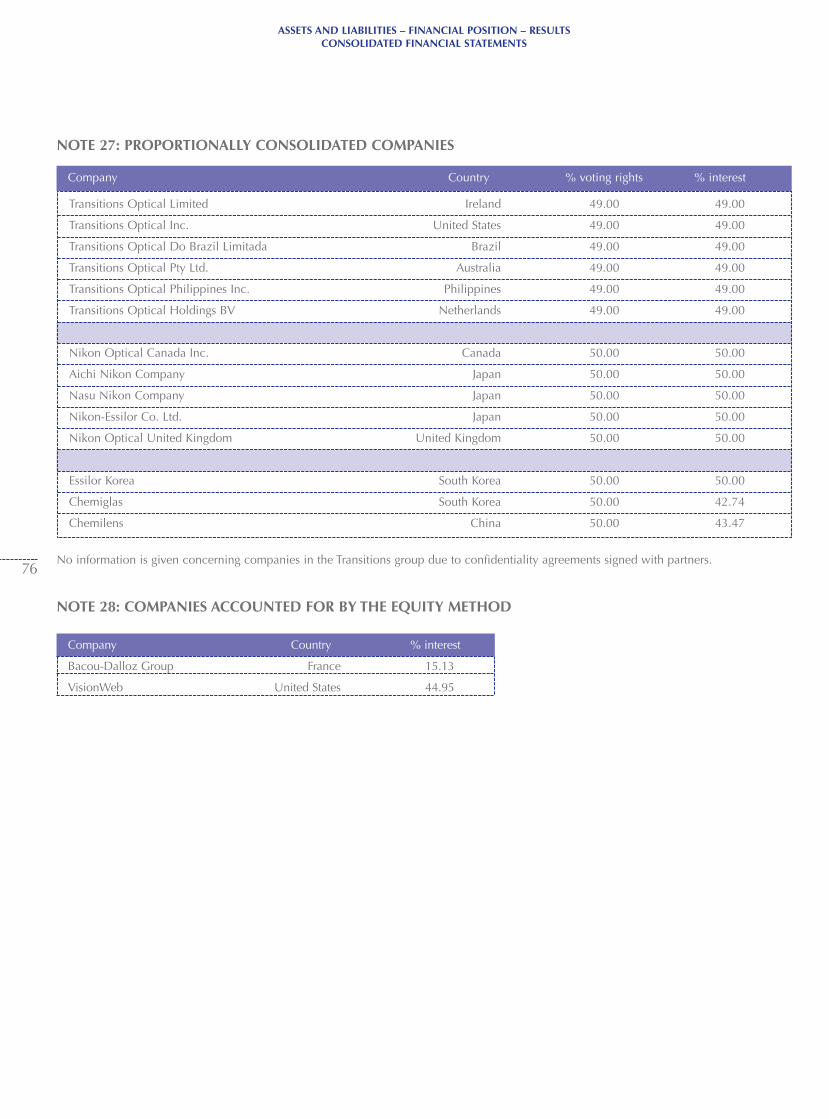
Company Country % voting rights % interest
ASSETS AND LIABILITIES – FINANCIAL POSITION – RESULTSCONSOLIDATED FINANCIAL STATEMENTS
76
NOTE 27: PROPORTIONALLY CONSOLIDATED COMPANIES
No information is given concerning companies in the Transitions group due to confidentiality agreements signed with partners.
NOTE 28: COMPANIES ACCOUNTED FOR BY THE EQUITY METHOD
Company Country % interest
Bacou-Dalloz Group France 15.13
VisionWeb United States 44.95
Transitions Optical Limited Ireland 49.00 49.00
Transitions Optical Inc. United States 49.00 49.00
Transitions Optical Do Brazil Limitada Brazil 49.00 49.00
Transitions Optical Pty Ltd. Australia 49.00 49.00
Transitions Optical Philippines Inc. Philippines 49.00 49.00
Transitions Optical Holdings BV Netherlands 49.00 49.00
Nikon Optical Canada Inc. Canada 50.00 50.00
Aichi Nikon Company Japan 50.00 50.00
Nasu Nikon Company Japan 50.00 50.00
Nikon-Essilor Co. Ltd. Japan 50.00 50.00
Nikon Optical United Kingdom United Kingdom 50.00 50.00
Essilor Korea South Korea 50.00 50.00
Chemiglas South Korea 50.00 42.74
Chemilens China 50.00 43.47
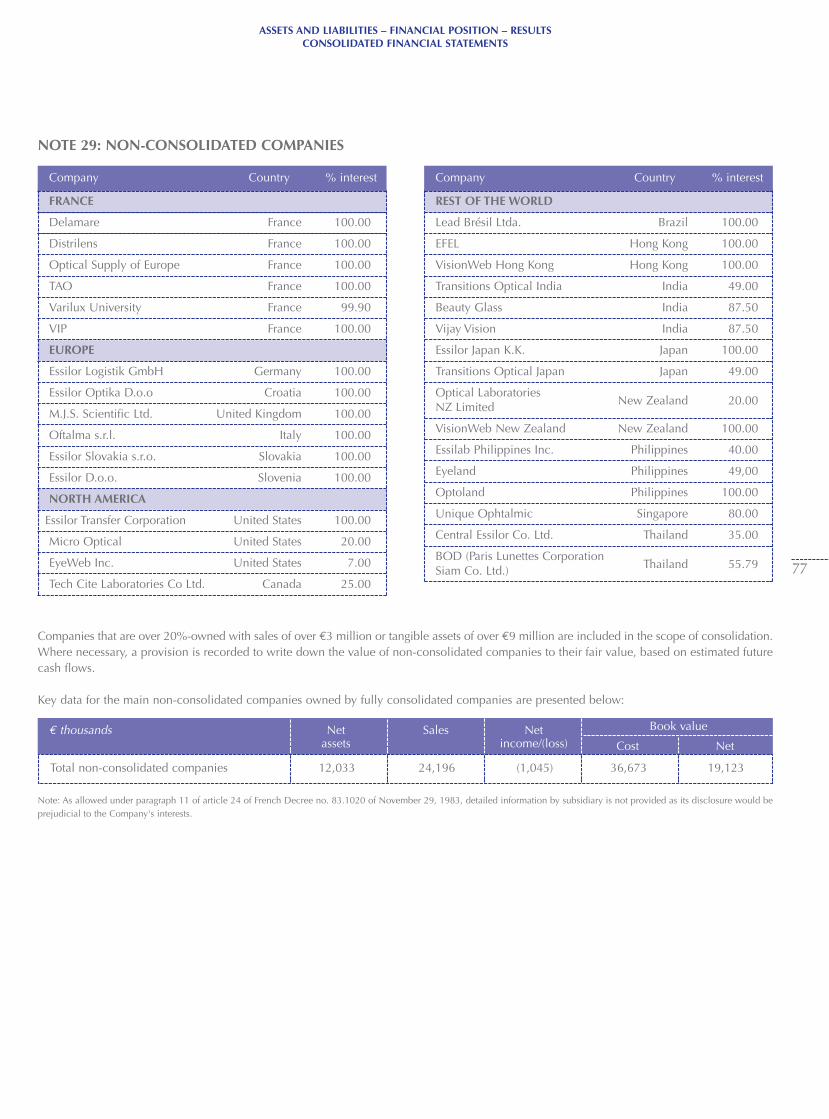
€ thousands Net Sales Net Book valueassets income/(loss) Cost Net
Company Country % interestCompany Country % interest
ASSETS AND LIABILITIES – FINANCIAL POSITION – RESULTSCONSOLIDATED FINANCIAL STATEMENTS
77
FRANCE
Delamare France 100.00
Distrilens France 100.00
Optical Supply of Europe France 100.00
TAO France 100.00
Varilux University France 99.90
VIP France 100.00
EUROPE
Essilor Logistik GmbH Germany 100.00
Essilor Optika D.o.o Croatia 100.00
M.J.S. Scientific Ltd. United Kingdom 100.00
Oftalma s.r.l. Italy 100.00
Essilor Slovakia s.r.o. Slovakia 100.00
Essilor D.o.o. Slovenia 100.00
NORTH AMERICA
Essilor Transfer Corporation United States 100.00
Micro Optical United States 20.00
EyeWeb Inc. United States 7.00
Tech Cite Laboratories Co Ltd. Canada 25.00
REST OF THE WORLD
Lead Brésil Ltda. Brazil 100.00
EFEL Hong Kong 100.00
VisionWeb Hong Kong Hong Kong 100.00
Transitions Optical India India 49.00
Beauty Glass India 87.50
Vijay Vision India 87.50
Essilor Japan K.K. Japan 100.00
Transitions Optical Japan Japan 49.00
Optical Laboratories NZ Limited New Zealand 20.00
VisionWeb New Zealand New Zealand 100.00
Essilab Philippines Inc. Philippines 40.00
Eyeland Philippines 49,00
Optoland Philippines 100.00
Unique Ophtalmic Singapore 80.00
Central Essilor Co. Ltd. Thailand 35.00
BOD (Paris Lunettes Corporation Siam Co. Ltd.) Thailand 55.79
NOTE 29: NON-CONSOLIDATED COMPANIES
Companies that are over 20%-owned with sales of over €3 million or tangible assets of over €9 million are included in the scope of consolidation.Where necessary, a provision is recorded to write down the value of non-consolidated companies to their fair value, based on estimated futurecash flows.
Key data for the main non-consolidated companies owned by fully consolidated companies are presented below:
Total non-consolidated companies 12,033 24,196 (1,045) 36,673 19,123
Note: As allowed under paragraph 11 of article 24 of French Decree no. 83.1020 of November 29, 1983, detailed information by subsidiary is not provided as its disclosure would beprejudicial to the Company's interests.
ASSETS AND LIABILITIES – FINANCIAL POSITION – RESULTS
78
5.1.6. Statutory Auditor’s Report on the Consolidated Financial Statements
For the year ended December 31, 2004
This is a free translation into English of the Statutory Auditors’ report issued in the French language and is provided solely for the convenienceof English speaking readers. The Statutory Auditors’ report includes information specifically required by French law in all audit reports, whetherqualified or not, and this is presented below the opinion on the consolidated financial statements. This information includes an explanatoryparagraph discussing the auditors’ assessments of certain significant accounting and auditing matters. These assessments were considered forthe purpose of issuing an audit opinion on the consolidated financial statements taken as a whole and not to provide separate assurance onindividual account captions or on information taken outside of the consolidated financial statements. This report, together with the Statutory Auditors’ report addressing financial and accounting information in the President’s report on internalcontrol, should be read in conjunction with, and construed in accordance with, French law and professional auditing standards applicable inFrance.
To the Shareholders,
In compliance with the assignment entrusted to us by the General Shareholders' Meeting, we have audited the accompanying consolidatedfinancial statements of Essilor International for the year ended December 31, 2004.
The consolidated financial statements have been approved by the Board of Directors. Our role is to express an opinion on these financial statements based on our audit.
Opinion on the consolidated financial statementsWe conducted our audit in accordance with professional standards applicable in France. Those standards require that we plan and perform theaudit to obtain reasonable assurance about whether the consolidated financial statements are free of material misstatement. An audit includesexamining, on a test basis, evidence supporting the amounts and disclosures in the financial statements. An audit also includes assessing theaccounting principles used and significant estimates made by the management, as well as evaluating the overall financial statements presentation.We believe that our audit provides a reasonable basis for our opinion.
In our opinion, the consolidated financial statements give a true and fair view of the assets, liabilities, financial position and results of the consolidated group of companies in accordance with the accounting rules and principles applicable in France.
Justification of our assessmentsIn accordance with the requirements of article L.225-235 of the Commercial Code relating to the justification of our assessments, we bring toyour attention the following matter:Note 1.5 to the consolidated financial statements describes the accounting treatment of goodwill. As part of our assessment of the Company'saccounting principles and policies, we verified the appropriateness of the policies and methods applied to goodwill and of the information disclosed in the notes to the consolidated financial statements. We also obtained assurance that these policies and methods had been properlyapplied.The assessments were made in the context of our audit of the consolidated financial statements, taken as a whole, and therefore contributed tothe formation of the unqualified opinion expressed in the first part of this report.
Specific verification In accordance with professional standards applicable in France, we have also verified the information given in the group management report.We have no matters to report regarding its fair presentation and conformity with the consolidated financial statements.
Paris, March 10, 2005
The Statutory Auditors
PricewaterhouseCoopers Audit Cabinet Dauge et AssociésJacques Denizeau Gérard Dauge
ASSETS AND LIABILITIES – FINANCIAL POSITION – RESULTS
79
5.1.7. Main effects of the transition to IAS/IFRS
5.1.7.1. Background
In accordance with European regulation N°1606/2002 dated July19, 2002, Essilor will prepare its consolidated financial statementsfor the year ending December 31, 2005 in accordance with theInternational Accounting Standards (IAS), International FinancialReporting Standards (IFRS) and related interpretations applicable atthat date as endorsed by the European Union.The 2005 IFRS consolidated financial statements will include comparative 2004 data prepared in accordance with the same standards, except for IAS 32 and IAS 39, which will be applied bythe Company effective from January 1, 2005.In preparation for the publication of comparative IFRS financial statements for 2005, the Company has prepared preliminary financial information about the effects of the transition to IFRS onthe following items of the 2004 financial statements:• The opening IFRS balance sheet at the transition date (January 1,
2004), which will include in equity the effects of the changes ofmethod arising from the transition to IFRS (except for the effects ofapplying IAS 32 and IAS 39 which will be recognized in equity inthe opening balance sheet at January 1, 2005).
• The Company's consolidated financial position at December 31,2004 and its results for 2004.
The information on the estimated impact of IFRS on the 2004 financial statements has been prepared by applying to 2004financial data the IFRS and interpretations that the Company will be required to apply to prepare its 2005 consolidated financialstatements under IFRS.
The 2004 financial information has therefore been prepared on thebasis of:• The IFRSs and related interpretations whose application is
expected to be mandatory at December 31, 2005, based on current information
• The options and exemptions that the Company expects to applyfor the preparation of its first IFRS financial statements in 2005.
For these reasons, the effects of the transition to IFRS on the 2004financial statements described below may be subsequently modifiedand other effects may arise.
5.1.7.2. Organization of the transition project
A work group led by the Consolidation Department and comprisingrepresentatives of Corporate Finance, Consolidation, CorporateTreasury, Corporate Financial Control and Internal Audit was taskedwith adapting the Company's accounting policies to comply withIFRS and determining the effects of the transition on the consolidatedfinancial statements. The transition principles and the determinationof the related effects were discussed by the Audit Committee andreviewed by the Auditors. Certain information concerning the effects of IFRS adjustments havenot yet been received from companies that are accounted for by theequity method in the consolidated financial statements. TheCompany has therefore decided not to finalize the IFRS statements
of shareholders' equity at January 1 and December 31, 2004 untilthe publication of the interim consolidated financial statements forthe six months ending June 30, 2005.
5.1.7.3. Standards and interpretations applied to prepare the preliminary IFRS financial information
Description of the accounting options and exemptions selected forthe first-time adoption of IFRSAs allowed under IFRS 1, the Company has opted:• Not to restate business combinations carried out before January 1,
2004.• To reclassify as retained earnings cumulative translation
adjustments at January 1, 2004.• To recognize in equity cumulative actuarial gains and losses on
employee benefit plans.• To apply the transitional provisions of IFRS 2 to grants of share
options that were granted after November 7, 2002 and had not yetvested at January 1, 2005.
• To apply IAS 32 and IAS 39 effective from January 1, 2005.
Description of IFRS adjustments and differences between theCompany's French GAAP and IFRS accounting policies
Goodwill (IFRS 1 and IFRS 3)As explained in note 1.5 to the consolidated financial statements,goodwill corresponds to the excess of the cost of acquisition overEssilor International's share in the fair value of net assets of theacquired company at the date of acquisition.As allowed under IFRS 1, Essilor has opted not to restate businesscombinations carried out before January 1, 2004. Therefore, in theopening IFRS balance sheet, the assets and liabilities acquiredthrough these business combinations are considered as representingassets and liabilities of the first-time adopter and not of the acquiredcompanies.
Effective from January 1, 2004, goodwill will no longer be amortizedbut will be tested for impairment by the method described in IAS 36– Impairment of Assets.
Intangible assetsAs explained in note 1.14 to the 2004 consolidated financialstatements, intangible assets include market shares recognized onacquisitions made since January 1, 1995. Under French GAAP, theseassets are not amortized.
Market shares do not fulfill the criteria laid down in IAS 38 forrecognition as intangible assets and will be reclassified as goodwillin the opening IFRS balance sheet, in accordance with IAS 38 –Intangible Assets and IFRS 3 – Business Combinations.
Property, plant and equipmentAnalyses are in the process of being finalized regarding theimplementation of the components method and depreciationperiods are being reviewed for the main categories of property, plantand equipment, in accordance with IAS 16 – Property, Plant andEquipment. The results of these analyses are not expected to lead toany material adjustments to the consolidated financial statements.
Pensions and other post-retirement benefit obligations (IFRS 1 and IAS 19)As allowed under IFRS 1, cumulative actuarial gains and losses atJanuary 1, 2004 will be recognized in equity in the opening IFRSbalance sheet and provisions for pensions and other post-retirementbenefit obligations will be increased by the same amount.Actuarial gains and losses arising after January 1, 2004 will continueto be recognized by the corridor method, unless the Company electsfor early adoption of the amendment to IAS 19 – Employee Benefits,which is applicable as from January 1, 2006. This amendment,which has not yet been endorsed by the European Commission,allows companies to recognize all actuarial gains and losses inequity.
Stock options and new shares offered to employees at a discount (IFRS 2)According to IFRS 2, stock options granted to employees afterNovember 7, 2002 that had not yet vested at January 1, 2005 aremeasured at fair value at the grant date.The fair value of stock options is recognized in personnel costs overthe vesting period, with a corresponding increase in equity.Consequently, this adjustment will have no effect on equity in theopening IFRS balance sheet at January 1, 2004 but it will affect the2004 IFRS income statement.Employees of French entities are given the opportunity to purchaseEssilor International shares at a 20% discount through theCompany's Employee Stock Ownership Plan. The fair value of thisbenefit will be recognized as an expense, with a correspondingincrease in equity.
Investment grantsInvestment grants included in equity in the French GAAP balancesheet at December 31, 2003 will be reclassified as liabilities in theopening IFRS balance sheet at January 1, 2004.
Deferred taxesDeferred tax assets and liabilities will be affected by the variousadjustments described above.
Consolidation methodFor several years, the Transitions sub-group has been proportionallyconsolidated in the Essilor consolidated financial statements, as thismethod was considered as best reflecting the way control is sharedwith Essilor's partner, PPG. Based on an analysis of the contractual clauses, in the IFRS financialstatements Transitions will be accounted for by the equity method inaccordance with IAS 28 and IAS 31.
Consequently:• Transitions' contributions to the various balance sheet items will
be cancelled and recognized on a net basis under "Investments incompanies accounted for by the equity method".
• Transitions' contributions to the various income statement itemswill be cancelled and recognized on a net basis under "Share ofprofit in companies accounted for by the equity method".
These reclassifications will have no effect on consolidated net assetsor net income.
In addition, based on the economic analysis of purchases by Essilorfrom Transitions and by Transitions from Essilor, and of sales byEssilor to third parties of Transitions products, in Essilor’s IFRSincome statement: • In accordance with IAS 18, sales by Essilor to Transitions and the
corresponding cost of sales will be cancelled.• The cost of subcontracting services provided by Transitions on
Essilor's behalf will be reallocated between cost of sales andmarketing costs for the Transitions brand.
Lastly, subject to the agreement of the French securities regulator(Autorité des Marchés Financiers), the summary financialinformation about the Transitions sub-group required by IAS 28 willnot be disclosed, as this would breach the confidentiality agreementsigned with PPG.
5.1.7.4. Effect of the main adjustments describedabove
Opening balance sheet at January 1, 2004Intangible assets Market shares, which do not qualify for recognition as intangibleassets under IAS 38, will be reclassified as goodwill for an amount of€19 million.
Pensions and other post-retirement benefit obligations The net cumulative actuarial loss at December 31, 2003 will berecognized in equity in the amount of €10.8 million, leading to acorresponding increase in provisions for pensions and other post-retirement benefit obligations.
Equity• Cumulative translation adjustmentCumulative translation adjustments at December 31, 2003 will be resetat zero, leading to a €192.7 million reduction in retained earnings.• Investment grantsInvestment grants carried in equity at December 31, 2003 in theamount of €0.6 million will be reclassified as liabilities.
Deferred taxesThe adjustments described above will affect deferred tax assets andliabilities. The effects on opening net assets will be as follows:• Adjustment of market shares: recognition of a €14.4 million
deferred tax liability.• Net cumulative actuarial loss recognized in equity: recognition of
a deferred tax asset of €3.8 million.• Possible adjustments to the carrying value of property, plant and
equipment due to a change in estimated useful lives could lead tothe recognition of a deferred tax liability.
2004 IFRS income statementNet salesNet sales reported in the IFRS income statement will beapproximately €59 million below published net sales. Theadjustment is due to:• Deduction from sales of cash discounts granted to customers
(previously recognized in interest expense).
ASSETS AND LIABILITIES – FINANCIAL POSITION – RESULTS
80
ASSETS AND LIABILITIES – FINANCIAL POSITION – RESULTS
81
• Deduction from sales of certain commissions calculated as apercentage of sales (previously recognized in operating expenses).
• Change in the consolidation method applied to Transitions.
Cost of salesCost of sales reported in the IFRS income statement will beapproximately €65 million higher, due to: • Reclassification of cash discounts received from suppliers
(recognized in interest income in the French GAAP accounts).• Change in the consolidation method applied to Transitions.
Operating expensesOperating expenses reported in the IFRS income statement will bearound €73 million lower, due to:• Reclassification of certain commissions, deducted from sales in
the IFRS accounts and previously recorded in other expenses.• Cancellation of the amortization of actuarial gains and losses on
pensions and other post-retirement benefit obligations recognizedin the 2004 published accounts.
• Change in the consolidation method applied to Transitions.
Net marginNet margin, corresponding to net sales less cost of sales and operatingexpenses, as defined above, will be shown on a separate line in the IFRS income statement to make the Company's results easier toanalyze and maintain consistency with "operating income" as previously reported.Net margin will be affected by the change in the consolidationmethod applied to the Transitions sub-group, whose income willnow be recognized on the line "Share of profit of companies accounted for by the equity method". The amount of thereclassification will be close to €30 million.
Profit from ordinary activitiesExpenses taken into account for the determination of profit fromordinary activities will also include:• Amortization of the fair value of stock options granted to
employees, estimated at around €5 million for 2004.• Cost of the discount granted to employees in France who purchase
shares through the Company's Employee Stock Ownership Plan;depending on the calculation method finally selected, this will beless than or equal to €3.9 million for 2004.
Profit from operationsIAS 1 – Presentation of financial statements does not recognize the concept of non-operating expense. Consequently, profit from operations will include a certain number of new items, as follows: • Other revenues / expenses on operations
The majority of revenues and expenses classified as "non-operating" in the French GAAP accounts will be reported underthis caption, representing a net expense of €6.3 million in 2004;
• Goodwill write-downs- The €2.5 million impairment loss recognized in non-operating
expense in the 2004 French GAAP accounts will be reclassifiedat this level.
- The goodwill amortization charge recognized in the 2004 published accounts in the amount of €23.3 million will becancelled in the IFRS income statement.
Net financial expenseNet financial expense will no longer include cash discounts paidand received, which represented a net expense of €20.8 million.
Income taxThe income tax charge will be affected by the adjustments describedabove. In particular, the change in consolidation method applied toTransitions will reduce the tax charge by some €14 million, whilecancellation of the amortization of actuarial gains and losses onemployee benefit obligations will reduce the deferred tax charge by€0.2 million.
Share in profit of companies accounted for by the equity methodAdjustments to this item are in the process of being determined. Theywill include cancellation of the goodwill amortization recognized inthese companies' income statements.In addition, Essilor's 49% share in the profit of Transitions, after eliminating intercompany transactions between the two companies,will be added for an amount of approximately €17 million.
5.1.7.5. Application of IAS 32 and IAS 39 effectivefrom January 1, 2005.
IAS 39In accordance with IAS 39, currency and interest rate hedginginstruments will be recognized as follows: • In the balance sheet, at fair value with recognition of the
corresponding deferred tax effect.• In the income statement, recognition of gains and losses arising
from remeasurement of hedging instruments at fair value, on asymmetrical basis with the gains and losses arising fromremeasurement of the hedged assets or liabilities.
• In equity, recognition of the effective portion of gains and losseson cash flow hedges, net of deferred taxes.
The effects of applying IAS 39 will depend to a significant extent onexchange rate changes in 2005. Consequently, it is currentlyimpossible to reliably estimate the impact.
IAS 32In 2003, Essilor issued bonds convertible into new shares orexchangeable for existing shares (oceanes). Under IAS 32, theportion of the issue price representing the value of the embeddedconversion option at the issue date, estimated at around €41million, will be added to equity in the opening balance sheet atJanuary 1, 2005. Debt will be reduced by the same amount. In addition, the bonds will be measured at amortized cost.
Consequently:• Finance costs will be increased by the amortization of the embedded
option, estimated at €5.4 million for 2005.• Amortization expense for the period from the issue date (June
2003) to December 31, 2004 will be recognized as an adjustmentto equity in the opening balance sheet at January 1, 2005, for anamount of €7.7 million.
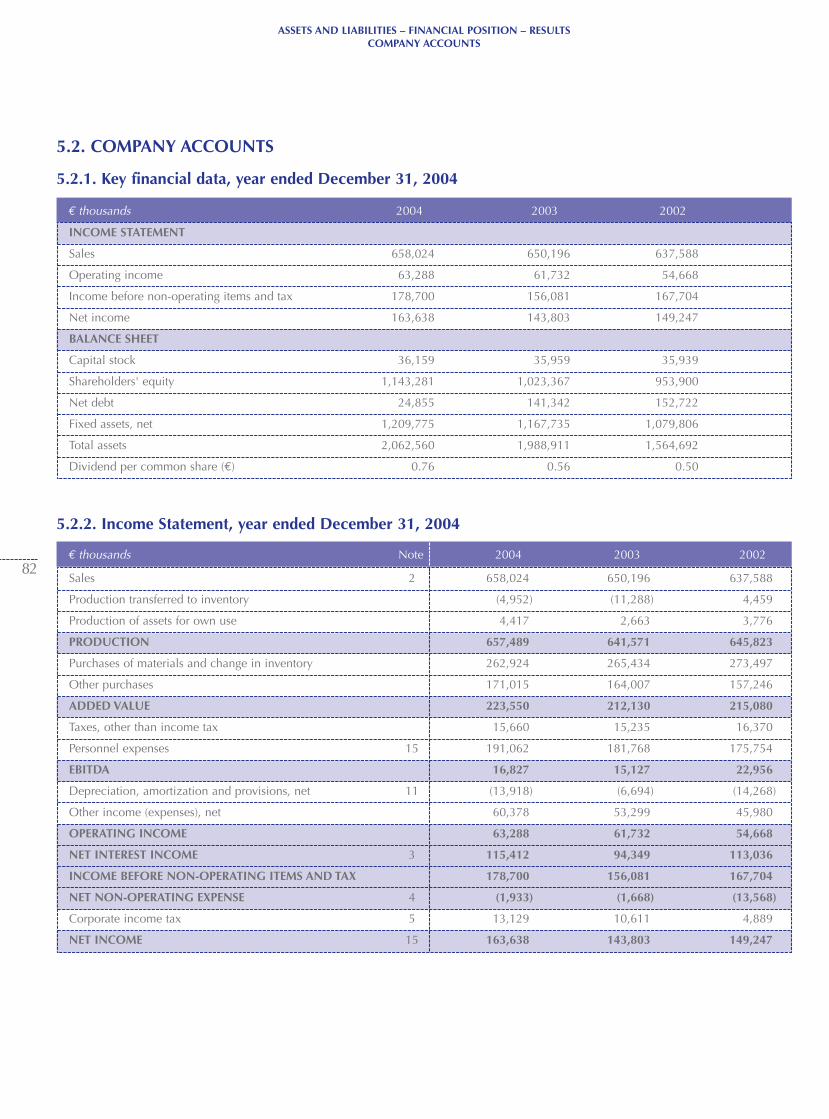
€ thousands 2004 2003 2002
ASSETS AND LIABILITIES – FINANCIAL POSITION – RESULTSCOMPANY ACCOUNTS
82
5.2. COMPANY ACCOUNTS
5.2.1. Key financial data, year ended December 31, 2004
INCOME STATEMENT
Sales 658,024 650,196 637,588
Operating income 63,288 61,732 54,668
Income before non-operating items and tax 178,700 156,081 167,704
Net income 163,638 143,803 149,247
BALANCE SHEET
Capital stock 36,159 35,959 35,939
Shareholders' equity 1,143,281 1,023,367 953,900
Net debt 24,855 141,342 152,722
Fixed assets, net 1,209,775 1,167,735 1,079,806
Total assets 2,062,560 1,988,911 1,564,692
Dividend per common share (€) 0.76 0.56 0.50
€ thousands Note 2004 2003 2002
5.2.2. Income Statement, year ended December 31, 2004
Sales 2 658,024 650,196 637,588
Production transferred to inventory (4,952) (11,288) 4,459
Production of assets for own use 4,417 2,663 3,776
PRODUCTION 657,489 641,571 645,823
Purchases of materials and change in inventory 262,924 265,434 273,497
Other purchases 171,015 164,007 157,246
ADDED VALUE 223,550 212,130 215,080
Taxes, other than income tax 15,660 15,235 16,370
Personnel expenses 15 191,062 181,768 175,754
EBITDA 16,827 15,127 22,956
Depreciation, amortization and provisions, net 11 (13,918) (6,694) (14,268)
Other income (expenses), net 60,378 53,299 45,980
OPERATING INCOME 63,288 61,732 54,668
NET INTEREST INCOME 3 115,412 94,349 113,036
INCOME BEFORE NON-OPERATING ITEMS AND TAX 178,700 156,081 167,704
NET NON-OPERATING EXPENSE 4 (1,933) (1,668) (13,568)
Corporate income tax 5 13,129 10,611 4,889
NET INCOME 15 163,638 143,803 149,247
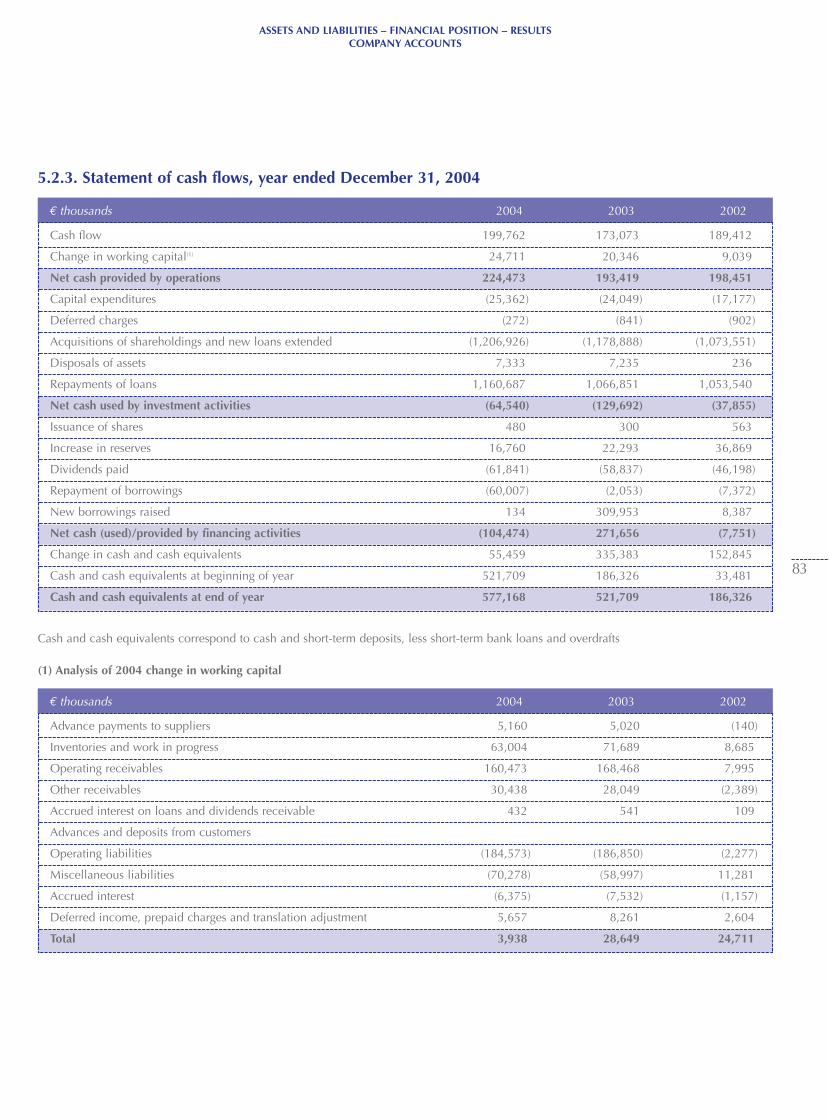
ASSETS AND LIABILITIES – FINANCIAL POSITION – RESULTSCOMPANY ACCOUNTS
83
€ thousands 2004 2003 2002
€ thousands 2004 2003 2002
5.2.3. Statement of cash flows, year ended December 31, 2004
Cash flow 199,762 173,073 189,412
Change in working capital(1) 24,711 20,346 9,039
Net cash provided by operations 224,473 193,419 198,451
Capital expenditures (25,362) (24,049) (17,177)
Deferred charges (272) (841) (902)
Acquisitions of shareholdings and new loans extended (1,206,926) (1,178,888) (1,073,551)
Disposals of assets 7,333 7,235 236
Repayments of loans 1,160,687 1,066,851 1,053,540
Net cash used by investment activities (64,540) (129,692) (37,855)
Issuance of shares 480 300 563
Increase in reserves 16,760 22,293 36,869
Dividends paid (61,841) (58,837) (46,198)
Repayment of borrowings (60,007) (2,053) (7,372)
New borrowings raised 134 309,953 8,387
Net cash (used)/provided by financing activities (104,474) 271,656 (7,751)
Change in cash and cash equivalents 55,459 335,383 152,845
Cash and cash equivalents at beginning of year 521,709 186,326 33,481
Cash and cash equivalents at end of year 577,168 521,709 186,326
Advance payments to suppliers 5,160 5,020 (140)
Inventories and work in progress 63,004 71,689 8,685
Operating receivables 160,473 168,468 7,995
Other receivables 30,438 28,049 (2,389)
Accrued interest on loans and dividends receivable 432 541 109
Advances and deposits from customers
Operating liabilities (184,573) (186,850) (2,277)
Miscellaneous liabilities (70,278) (58,997) 11,281
Accrued interest (6,375) (7,532) (1,157)
Deferred income, prepaid charges and translation adjustment 5,657 8,261 2,604
Total 3,938 28,649 24,711
Cash and cash equivalents correspond to cash and short-term deposits, less short-term bank loans and overdrafts
(1) Analysis of 2004 change in working capital
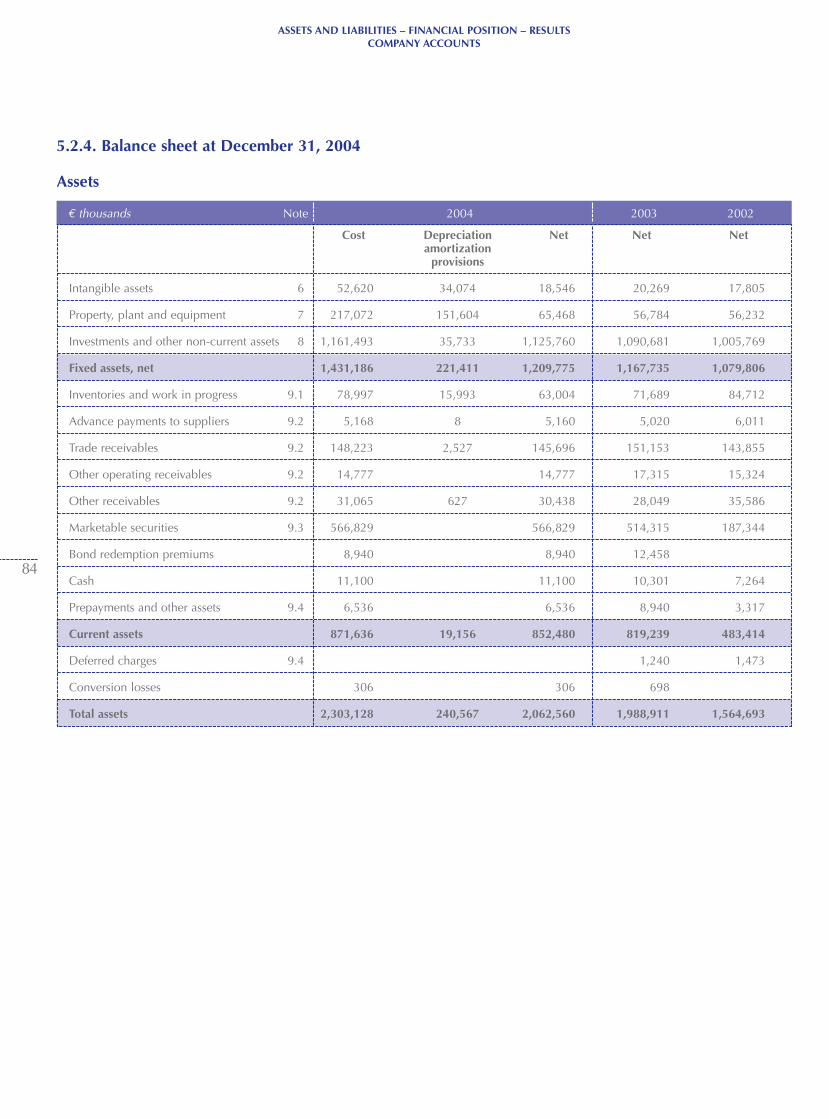
€ thousands Note 2004 2003 2002
ASSETS AND LIABILITIES – FINANCIAL POSITION – RESULTSCOMPANY ACCOUNTS
84
5.2.4. Balance sheet at December 31, 2004
Assets
Cost Depreciation Net Net Netamortization
provisions
Intangible assets 6 52,620 34,074 18,546 20,269 17,805
Property, plant and equipment 7 217,072 151,604 65,468 56,784 56,232
Investments and other non-current assets 8 1,161,493 35,733 1,125,760 1,090,681 1,005,769
Fixed assets, net 1,431,186 221,411 1,209,775 1,167,735 1,079,806
Inventories and work in progress 9.1 78,997 15,993 63,004 71,689 84,712
Advance payments to suppliers 9.2 5,168 8 5,160 5,020 6,011
Trade receivables 9.2 148,223 2,527 145,696 151,153 143,855
Other operating receivables 9.2 14,777 14,777 17,315 15,324
Other receivables 9.2 31,065 627 30,438 28,049 35,586
Marketable securities 9.3 566,829 566,829 514,315 187,344
Bond redemption premiums 8,940 8,940 12,458
Cash 11,100 11,100 10,301 7,264
Prepayments and other assets 9.4 6,536 6,536 8,940 3,317
Current assets 871,636 19,156 852,480 819,239 483,414
Deferred charges 9.4 1,240 1,473
Conversion losses 306 306 698
Total assets 2,303,128 240,567 2,062,560 1,988,911 1,564,693
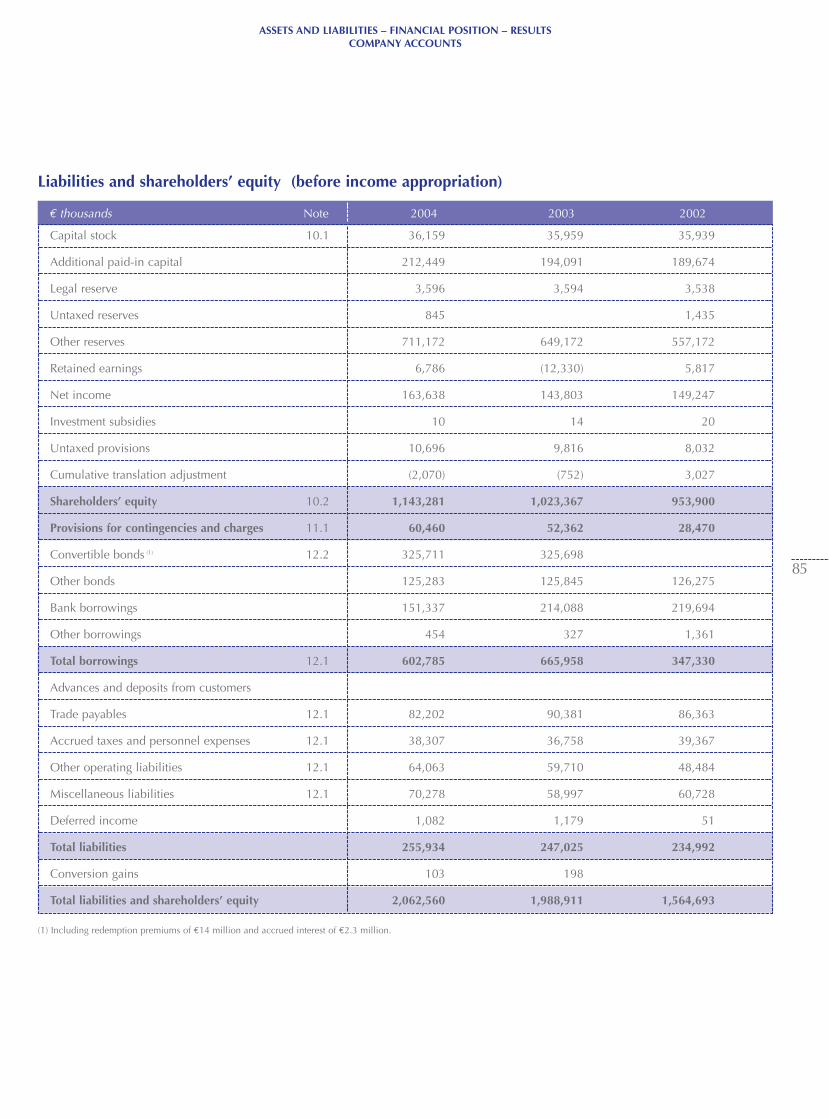
€ thousands Note 2004 2003 2002
ASSETS AND LIABILITIES – FINANCIAL POSITION – RESULTSCOMPANY ACCOUNTS
85
Capital stock 10.1 36,159 35,959 35,939
Additional paid-in capital 212,449 194,091 189,674
Legal reserve 3,596 3,594 3,538
Untaxed reserves 845 1,435
Other reserves 711,172 649,172 557,172
Retained earnings 6,786 (12,330) 5,817
Net income 163,638 143,803 149,247
Investment subsidies 10 14 20
Untaxed provisions 10,696 9,816 8,032
Cumulative translation adjustment (2,070) (752) 3,027
Shareholders’ equity 10.2 1,143,281 1,023,367 953,900
Provisions for contingencies and charges 11.1 60,460 52,362 28,470
Convertible bonds (1) 12.2 325,711 325,698
Other bonds 125,283 125,845 126,275
Bank borrowings 151,337 214,088 219,694
Other borrowings 454 327 1,361
Total borrowings 12.1 602,785 665,958 347,330
Advances and deposits from customers
Trade payables 12.1 82,202 90,381 86,363
Accrued taxes and personnel expenses 12.1 38,307 36,758 39,367
Other operating liabilities 12.1 64,063 59,710 48,484
Miscellaneous liabilities 12.1 70,278 58,997 60,728
Deferred income 1,082 1,179 51
Total liabilities 255,934 247,025 234,992
Conversion gains 103 198
Total liabilities and shareholders’ equity 2,062,560 1,988,911 1,564,693
Liabilities and shareholders’ equity (before income appropriation)
(1) Including redemption premiums of €14 million and accrued interest of €2.3 million.
ASSETS AND LIABILITIES – FINANCIAL POSITION – RESULTSCOMPANY ACCOUNTS
86
The balance sheet at December 31, 2004 shows total assets of€2,062,560 thousand and the statement of income for the year thenended shows net income of €163,638 thousand.
The financial statements cover the 12-month period from January 1 toDecember 31, 2004.
The parent company is Essilor International (“Essilor”).
In the following notes, all amounts are stated in thousands of euros.
SIGNIFICANT EVENTS OF THE YEAR
Essilor International turned in a very good performance in France in2004. This was partially offset, however, by slower growth in lensdeliveries from the logistics center to the European distribution entities, on the heels of a sharp drop in the German market.
For the second consecutive year, sales by the Puerto Rican branchcontracted significantly, due to lower sales of Orma lenses in theU.S. market.
A provision was recorded in the balance sheet for the cost ofrestructuring a production facility. In addition, the Company’semployee benefit obligations were fully provided for at the year-end.As part of its external growth strategy, Essilor International acquiredboth LTL, an Italy-based distribution company, and Delamare-Sovra,a surfacing materials manufacturer.
Lastly, December 2004 saw the formation of TAO, a wholly-ownedsubsidiary set up to design and roll out new computer systems inEurope to keep pace with the changes in the Company's business.
NOTE 1: ACCOUNTING POLICIES
1.1. GeneralThe financial statements of the Company have been prepared inaccordance with the French 1999 General Accounting Plan approvedby government order of June 22, 1999, the law of April 30, 1983 andthe decree of November 29, 1983.
1.2. Intangible assetsIntangible assets correspond primarily to purchased goodwill,concessions, patents, licenses and software. They are stated at costand amortized by the straight-line method over 3 to 10 years.Legally-protected purchased goodwill is not amortized.
1.3. Property, plant and equipmentProperty, plant and equipment are stated at acquisition orproduction cost. Assets acquired prior to December 31, 1976which were included in the 1978 legal revaluation are stated atrevalued cost.
Depreciation of property, plant and equipment is calculated on astraight-line basis over the estimated useful lives of the assets, as follows:
Buildings 20 to 33 years
Building improvements 7 to 10 years
Industrial machinery, equipment and tools 3 to 10 years
Other property, plant and equipment 3 to 10 years
Differences between straight-line depreciation and reducingbalance depreciation charged for tax purposes are included inuntaxed provisions on the liabilities side of the balance sheet.
1.4. Investments Shares in subsidiaries and affiliates are stated at the lower of cost andfair value, based on estimated future cash flows. The cost ofinvestments acquired prior to December 31, 1976 which wereincluded in the 1978 legal revaluation corresponds to revalued cost.The revaluation difference originally credited to reserves wastransferred to the capital account in 1980.
1.5. Inventories and work in progressRaw materials and goods inventories are stated at weighted averagecost. Finished products, semi-finished products and work in progressare stated at standard production cost.Provisions are recorded against inventories, taking into account marketprices, sales prospects and the risk of obsolescence.
1.6. Receivables and payablesReceivables and payables in euros are stated at their nominal value.Foreign currency receivables and payables are converted into eurosat the year-end exchange rate or the hedging rate. Provisions arerecorded to cover any risk of non-recovery, based on the age ofreceivables.
1.7. Marketable securitiesMarketable securities, consisting primarily of Sicav and FCP mutualfunds, are stated at cost.A provision is recorded if the net asset value of the units representsless than their cost. This item also includes treasury shares acquiredunder the Company’s liquidity contract.
5.2.5. Notes to the parent Company financial statements for the year ended December 31, 2004
ASSETS AND LIABILITIES – FINANCIAL POSITION – RESULTSCOMPANY ACCOUNTS
87
1.8. Financial InstrumentsFinancial instruments are used only to hedge risks on commercialtransactions and identified foreign currency receivables andpayables. They include forward exchange contracts and currencyoptions.
The Company uses financial instruments solely for hedgingpurposes. All currency transactions are subject to pre-determinedposition limits which are designed to optimize the protectionafforded by the hedges.
The Company's interest rate management policy consists of hedginginterest rate risks.
Exchange gains and losses on financial instruments are recognizedin the year in which they arise. They are based on contractualforward rates at maturity. If hedging positions at the year-end exceedthe currency positions reflected in the balance sheet, a provision isrecorded for the estimated cost of unwinding the hedges.
1.9. Foreign currency transactionsSubstantially all foreign currency transactions are hedged and areconverted into euros at the hedging rate. Foreign currencyreceivables and payables are converted at the hedging rate or theyear-end rate if they are not hedged. Foreign currency bank balancesare converted at the month-end exchange rate.
1.10. Pensions and other post-retirement benefitsThe Company's obligations for the payment of retirementindemnities are funded under an insured plan. The differencebetween the projected benefit obligation and the fair value of planassets is covered by a provision. The projected benefit obligationtakes into account years of service, mortality and staff turnover rates,future salary levels and an appropriate discount rate.
The Company's obligations for the payment of top-hat pensions tomanagement and employees are funded under an insured plan (seenote 13.4).
At December 31, 2004, a provision was recorded for the unfundedportion of supplementary pension benefit obligations, and theprovision for long-service awards was adjusted.
1.11. Translation of the financial statements of theforeign branch The financial statements of the foreign branch, Essilor Industries –which is considered as representing an independent entity – are translatedinto euros as follows:• Income statement items are translated at the average hedging rate
for the year.• Balance sheet items are translated at the exchange rate ruling on
December 31, except for:- Reserves, which are translated at the historical rate.- Net income, which is translated at the hedging rate.
The difference arising on translation is recorded in shareholders'equity under "Cumulative translation adjustment".
1.12. Corporate income tax (group relief)Essilor International files a consolidated tax return with BBGR,Optim, VIP, Invoptic, Varilux University, Novisia, OSE, Essidev,Barbara, BNL Eurolens and Fred Management and pays thecorporate income tax due by the tax group.Each company in the tax group records the income tax charge thatwould apply if it were not a member of the tax group. This has noimpact on the parent company accounts.
In 2004, the corporate income tax due by the tax group amountedto €22,880 thousand.
1.13. Recognition and measurement of provisions
Untaxed provisionsThese mainly comprise provisions for excess tax depreciation.
Provisions for warranties and returned itemsA provision is set up at the time of sale to cover the estimated costof guaranteeing corrective lenses and optical instruments.
Provisions for treasury sharesEssilor International shares held by the Company for allocation onexercise of employee stock options are carried at cost under “Otherlong-term investments”. Where appropriate, a provision is recorded tocover the difference between the option exercise price and theweighted average price at the year-end.
Provisions for other contingencies and chargesThese provisions are set up to cover any other commitments that areoutstanding at the year-end.
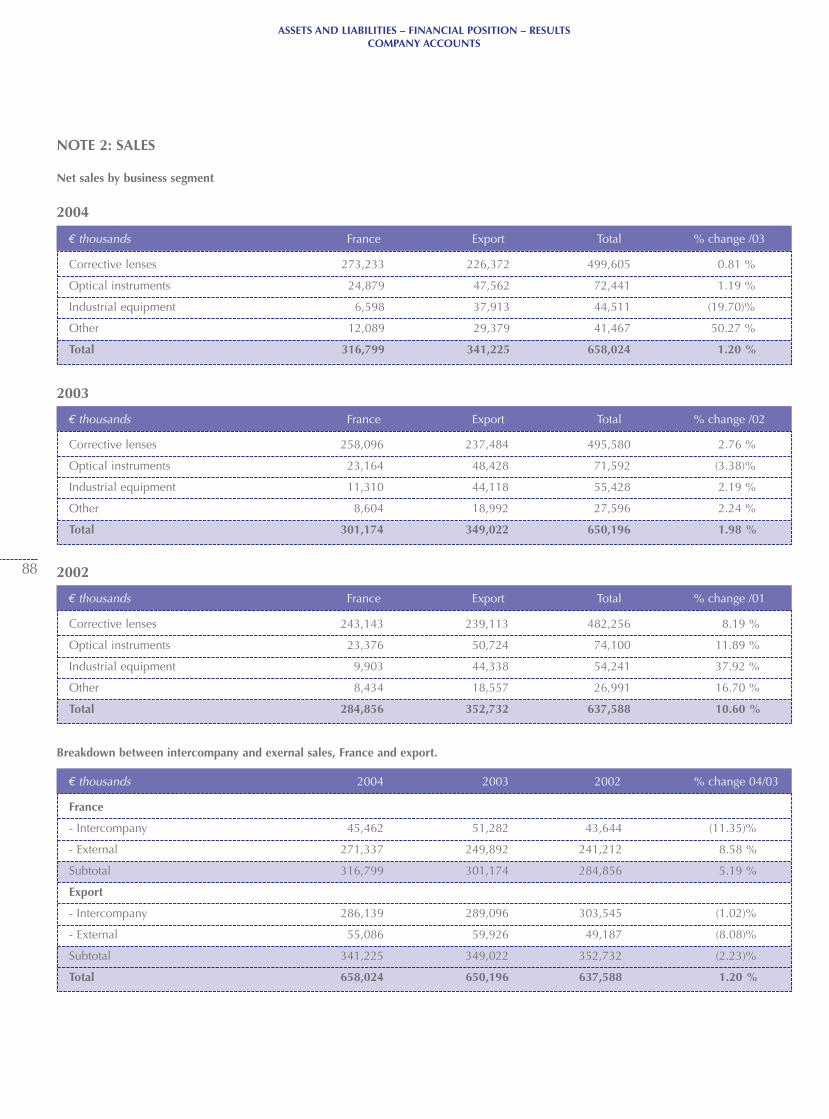
€ thousands 2004 2003 2002 % change 04/03
€ thousands France Export Total % change /01
€ thousands France Export Total % change /02
€ thousands France Export Total % change /03
ASSETS AND LIABILITIES – FINANCIAL POSITION – RESULTSCOMPANY ACCOUNTS
88
NOTE 2: SALES
Net sales by business segment
Corrective lenses 273,233 226,372 499,605 0.81 %
Optical instruments 24,879 47,562 72,441 1.19 %
Industrial equipment 6,598 37,913 44,511 (19.70)%
Other 12,089 29,379 41,467 50.27 %
Total 316,799 341,225 658,024 1.20 %
Corrective lenses 258,096 237,484 495,580 2.76 %
Optical instruments 23,164 48,428 71,592 (3.38)%
Industrial equipment 11,310 44,118 55,428 2.19 %
Other 8,604 18,992 27,596 2.24 %
Total 301,174 349,022 650,196 1.98 %
Corrective lenses 243,143 239,113 482,256 8.19 %
Optical instruments 23,376 50,724 74,100 11.89 %
Industrial equipment 9,903 44,338 54,241 37.92 %
Other 8,434 18,557 26,991 16.70 %
Total 284,856 352,732 637,588 10.60 %
France
- Intercompany 45,462 51,282 43,644 (11.35)%
- External 271,337 249,892 241,212 8.58 %
Subtotal 316,799 301,174 284,856 5.19 %
Export
- Intercompany 286,139 289,096 303,545 (1.02)%
- External 55,086 59,926 49,187 (8.08)%
Subtotal 341,225 349,022 352,732 (2.23)%
Total 658,024 650,196 637,588 1.20 %
Breakdown between intercompany and exernal sales, France and export.
2002
2003
2004
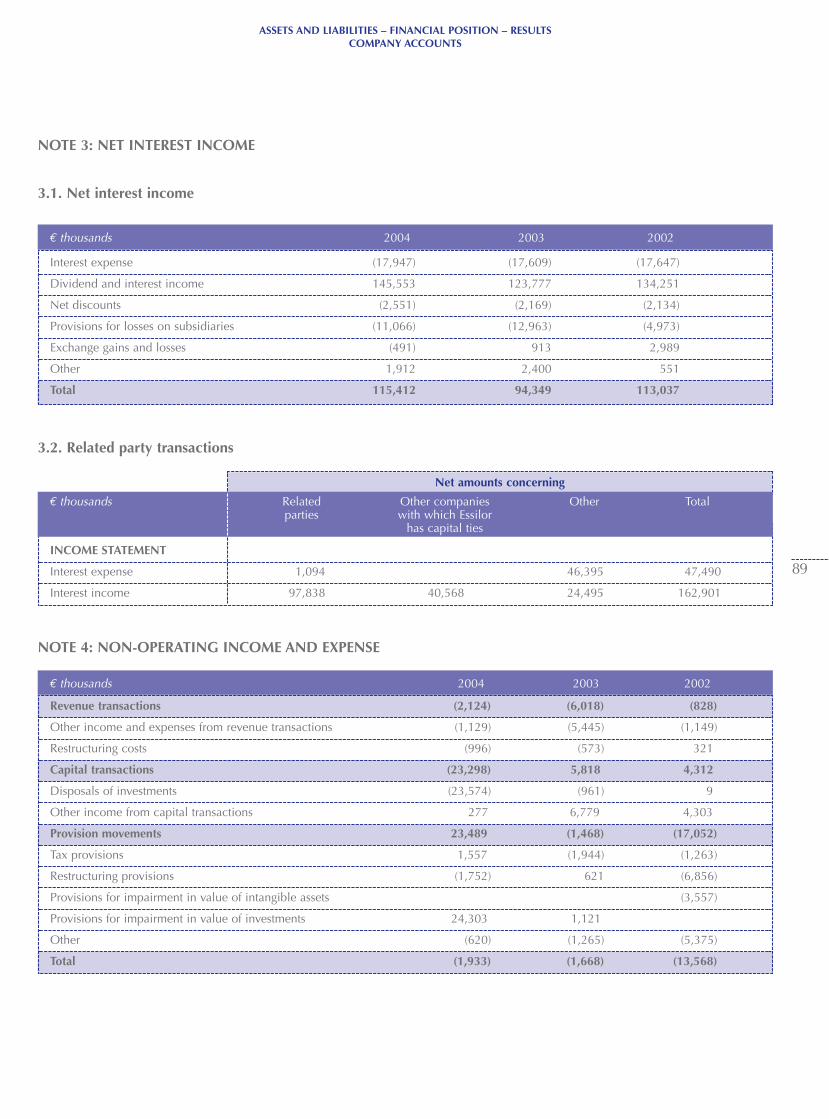
€ thousands 2004 2003 2002
€ thousands 2004 2003 2002
Net amounts concerning
ASSETS AND LIABILITIES – FINANCIAL POSITION – RESULTSCOMPANY ACCOUNTS
89
NOTE 3: NET INTEREST INCOME
3.1. Net interest income
Interest expense (17,947) (17,609) (17,647)
Dividend and interest income 145,553 123,777 134,251
Net discounts (2,551) (2,169) (2,134)
Provisions for losses on subsidiaries (11,066) (12,963) (4,973)
Exchange gains and losses (491) 913 2,989
Other 1,912 2,400 551
Total 115,412 94,349 113,037
Revenue transactions (2,124) (6,018) (828)
Other income and expenses from revenue transactions (1,129) (5,445) (1,149)
Restructuring costs (996) (573) 321
Capital transactions (23,298) 5,818 4,312
Disposals of investments (23,574) (961) 9
Other income from capital transactions 277 6,779 4,303
Provision movements 23,489 (1,468) (17,052)
Tax provisions 1,557 (1,944) (1,263)
Restructuring provisions (1,752) 621 (6,856)
Provisions for impairment in value of intangible assets (3,557)
Provisions for impairment in value of investments 24,303 1,121
Other (620) (1,265) (5,375)
Total (1,933) (1,668) (13,568)
3.2. Related party transactions
INCOME STATEMENT
Interest expense 1,094 46,395 47,490
Interest income 97,838 40,568 24,495 162,901
€ thousands Related Other companies Other Totalparties with which Essilor
has capital ties
NOTE 4: NON-OPERATING INCOME AND EXPENSE
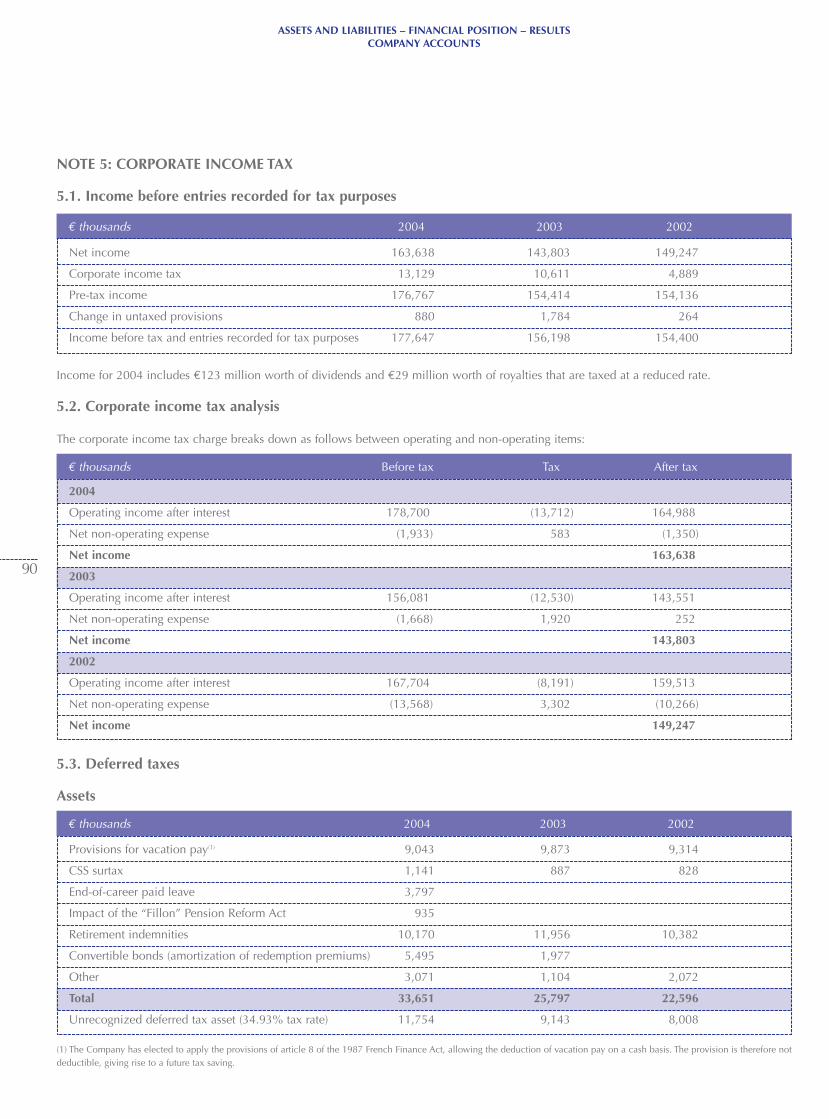
€ thousands 2004 2003 2002
€ thousands Before tax Tax After tax
€ thousands 2004 2003 2002
ASSETS AND LIABILITIES – FINANCIAL POSITION – RESULTSCOMPANY ACCOUNTS
90
NOTE 5: CORPORATE INCOME TAX
5.1. Income before entries recorded for tax purposes
Net income 163,638 143,803 149,247
Corporate income tax 13,129 10,611 4,889
Pre-tax income 176,767 154,414 154,136
Change in untaxed provisions 880 1,784 264
Income before tax and entries recorded for tax purposes 177,647 156,198 154,400
5.3. Deferred taxes
Assets
Provisions for vacation pay(1) 9,043 9,873 9,314
CSS surtax 1,141 887 828
End-of-career paid leave 3,797
Impact of the “Fillon” Pension Reform Act 935
Retirement indemnities 10,170 11,956 10,382
Convertible bonds (amortization of redemption premiums) 5,495 1,977
Other 3,071 1,104 2,072
Total 33,651 25,797 22,596
Unrecognized deferred tax asset (34.93% tax rate) 11,754 9,143 8,008
2004
Operating income after interest 178,700 (13,712) 164,988
Net non-operating expense (1,933) 583 (1,350)
Net income 163,638
2003
Operating income after interest 156,081 (12,530) 143,551
Net non-operating expense (1,668) 1,920 252
Net income 143,803
2002
Operating income after interest 167,704 (8,191) 159,513
Net non-operating expense (13,568) 3,302 (10,266)
Net income 149,247
Income for 2004 includes €123 million worth of dividends and €29 million worth of royalties that are taxed at a reduced rate.
5.2. Corporate income tax analysis
The corporate income tax charge breaks down as follows between operating and non-operating items:
(1) The Company has elected to apply the provisions of article 8 of the 1987 French Finance Act, allowing the deduction of vacation pay on a cash basis. The provision is therefore notdeductible, giving rise to a future tax saving.
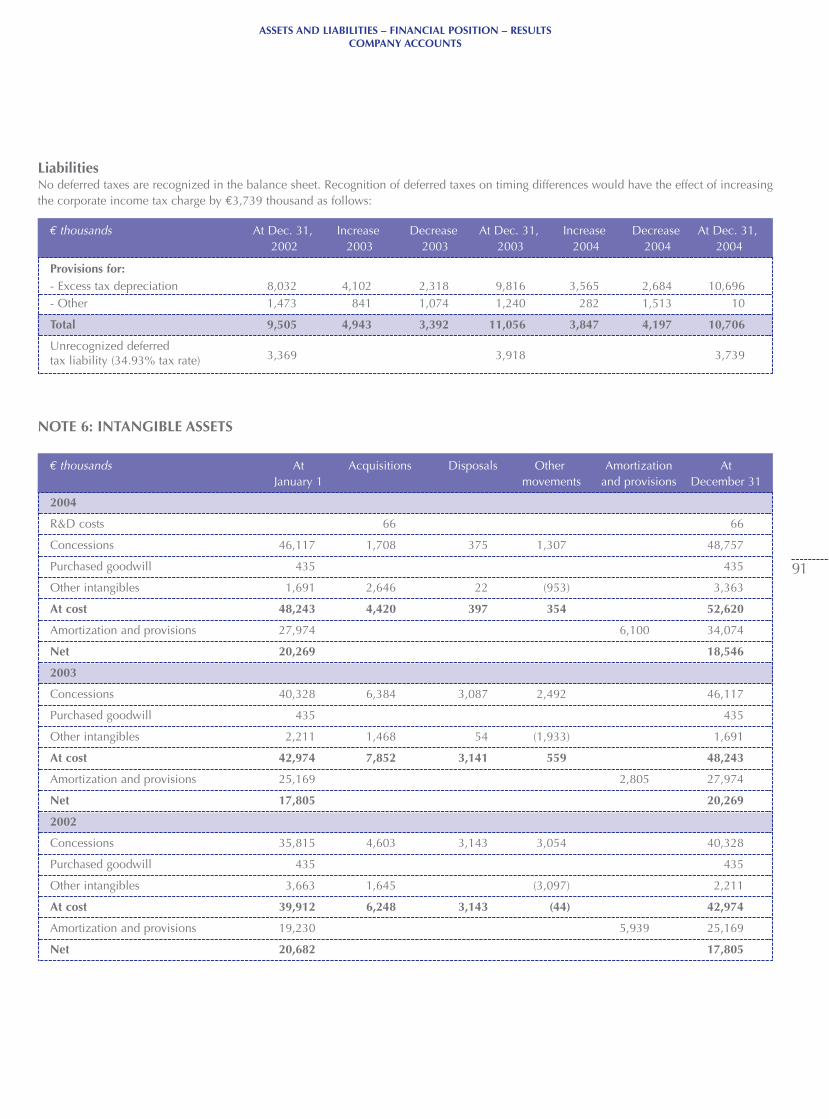
€ thousands At Acquisitions Disposals Other Amortization AtJanuary 1 movements and provisions December 31
€ thousands At Dec. 31, Increase Decrease At Dec. 31, Increase Decrease At Dec. 31,2002 2003 2003 2003 2004 2004 2004
ASSETS AND LIABILITIES – FINANCIAL POSITION – RESULTSCOMPANY ACCOUNTS
91
LiabilitiesNo deferred taxes are recognized in the balance sheet. Recognition of deferred taxes on timing differences would have the effect of increasingthe corporate income tax charge by €3,739 thousand as follows:
Provisions for: - Excess tax depreciation 8,032 4,102 2,318 9,816 3,565 2,684 10,696- Other 1,473 841 1,074 1,240 282 1,513 10
Total 9,505 4,943 3,392 11,056 3,847 4,197 10,706
Unrecognized deferred tax liability (34.93% tax rate) 3,369 3,918 3,739
NOTE 6: INTANGIBLE ASSETS
2004
R&D costs 66 66
Concessions 46,117 1,708 375 1,307 48,757
Purchased goodwill 435 435
Other intangibles 1,691 2,646 22 (953) 3,363
At cost 48,243 4,420 397 354 52,620
Amortization and provisions 27,974 6,100 34,074
Net 20,269 18,546
2003
Concessions 40,328 6,384 3,087 2,492 46,117
Purchased goodwill 435 435
Other intangibles 2,211 1,468 54 (1,933) 1,691
At cost 42,974 7,852 3,141 559 48,243
Amortization and provisions 25,169 2,805 27,974
Net 17,805 20,269
2002
Concessions 35,815 4,603 3,143 3,054 40,328
Purchased goodwill 435 435
Other intangibles 3,663 1,645 (3,097) 2,211
At cost 39,912 6,248 3,143 (44) 42,974
Amortization and provisions 19,230 5,939 25,169
Net 20,682 17,805
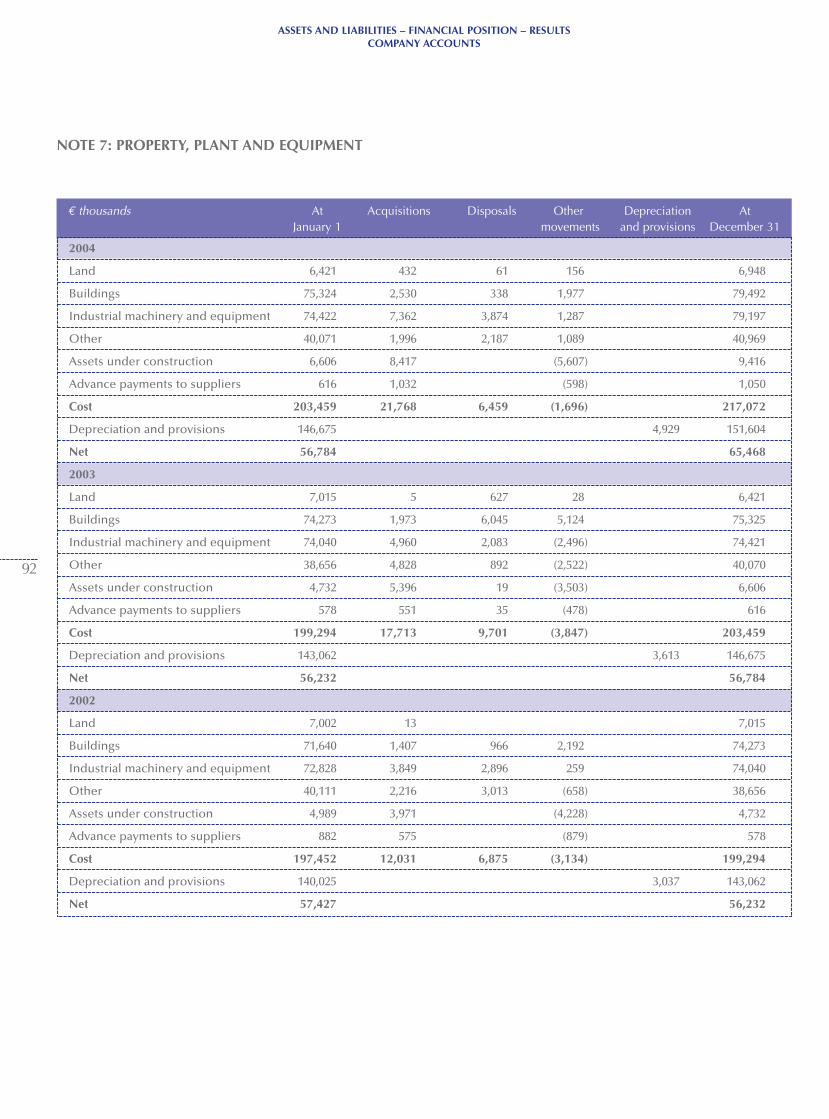
€ thousands At Acquisitions Disposals Other Depreciation AtJanuary 1 movements and provisions December 31
ASSETS AND LIABILITIES – FINANCIAL POSITION – RESULTSCOMPANY ACCOUNTS
92
NOTE 7: PROPERTY, PLANT AND EQUIPMENT
2004
Land 6,421 432 61 156 6,948
Buildings 75,324 2,530 338 1,977 79,492
Industrial machinery and equipment 74,422 7,362 3,874 1,287 79,197
Other 40,071 1,996 2,187 1,089 40,969
Assets under construction 6,606 8,417 (5,607) 9,416
Advance payments to suppliers 616 1,032 (598) 1,050
Cost 203,459 21,768 6,459 (1,696) 217,072
Depreciation and provisions 146,675 4,929 151,604
Net 56,784 65,468
2003
Land 7,015 5 627 28 6,421
Buildings 74,273 1,973 6,045 5,124 75,325
Industrial machinery and equipment 74,040 4,960 2,083 (2,496) 74,421
Other 38,656 4,828 892 (2,522) 40,070
Assets under construction 4,732 5,396 19 (3,503) 6,606
Advance payments to suppliers 578 551 35 (478) 616
Cost 199,294 17,713 9,701 (3,847) 203,459
Depreciation and provisions 143,062 3,613 146,675
Net 56,232 56,784
2002
Land 7,002 13 7,015
Buildings 71,640 1,407 966 2,192 74,273
Industrial machinery and equipment 72,828 3,849 2,896 259 74,040
Other 40,111 2,216 3,013 (658) 38,656
Assets under construction 4,989 3,971 (4,228) 4,732
Advance payments to suppliers 882 575 (879) 578
Cost 197,452 12,031 6,875 (3,134) 199,294
Depreciation and provisions 140,025 3,037 143,062
Net 57,427 56,232
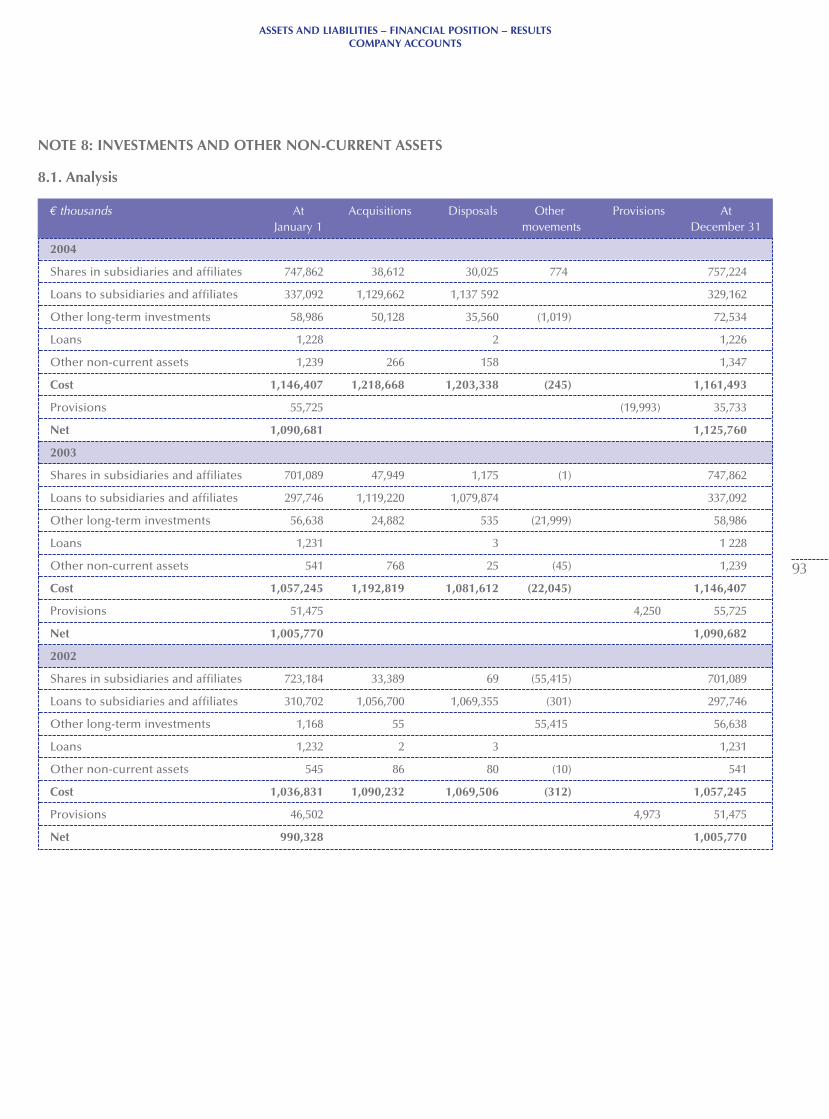
€ thousands At Acquisitions Disposals Other Provisions AtJanuary 1 movements December 31
ASSETS AND LIABILITIES – FINANCIAL POSITION – RESULTSCOMPANY ACCOUNTS
93
NOTE 8: INVESTMENTS AND OTHER NON-CURRENT ASSETS
8.1. Analysis
2004
Shares in subsidiaries and affiliates 747,862 38,612 30,025 774 757,224
Loans to subsidiaries and affiliates 337,092 1,129,662 1,137 592 329,162
Other long-term investments 58,986 50,128 35,560 (1,019) 72,534
Loans 1,228 2 1,226
Other non-current assets 1,239 266 158 1,347
Cost 1,146,407 1,218,668 1,203,338 (245) 1,161,493
Provisions 55,725 (19,993) 35,733
Net 1,090,681 1,125,760
2003
Shares in subsidiaries and affiliates 701,089 47,949 1,175 (1) 747,862
Loans to subsidiaries and affiliates 297,746 1,119,220 1,079,874 337,092
Other long-term investments 56,638 24,882 535 (21,999) 58,986
Loans 1,231 3 1 228
Other non-current assets 541 768 25 (45) 1,239
Cost 1,057,245 1,192,819 1,081,612 (22,045) 1,146,407
Provisions 51,475 4,250 55,725
Net 1,005,770 1,090,682
2002
Shares in subsidiaries and affiliates 723,184 33,389 69 (55,415) 701,089
Loans to subsidiaries and affiliates 310,702 1,056,700 1,069,355 (301) 297,746
Other long-term investments 1,168 55 55,415 56,638
Loans 1,232 2 3 1,231
Other non-current assets 545 86 80 (10) 541
Cost 1,036,831 1,090,232 1,069,506 (312) 1,057,245
Provisions 46,502 4,973 51,475
Net 990,328 1,005,770
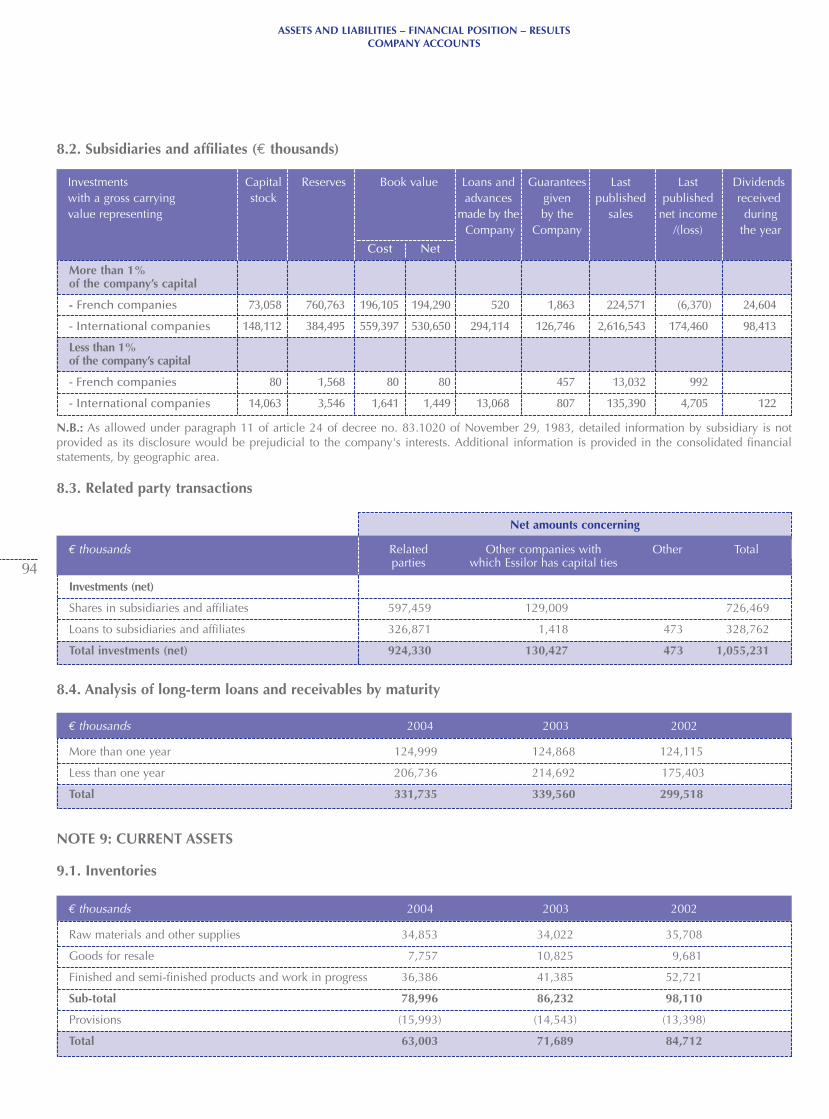
€ thousands 2004 2003 2002
€ thousands 2004 2003 2002
Investments Capital Reserves Book value Loans and Guarantees Last Last Dividendswith a gross carrying stock advances given published published receivedvalue representing made by the by the sales net income during
Company Company /(loss) the year
Cost Net
Net amounts concerning
Investments (net)
Shares in subsidiaries and affiliates 597,459 129,009 726,469
Loans to subsidiaries and affiliates 326,871 1,418 473 328,762
Total investments (net) 924,330 130,427 473 1,055,231
ASSETS AND LIABILITIES – FINANCIAL POSITION – RESULTSCOMPANY ACCOUNTS
94
8.2. Subsidiaries and affiliates (€ thousands)
N.B.: As allowed under paragraph 11 of article 24 of decree no. 83.1020 of November 29, 1983, detailed information by subsidiary is not provided as its disclosure would be prejudicial to the company's interests. Additional information is provided in the consolidated financial statements, by geographic area.
8.3. Related party transactions
8.4. Analysis of long-term loans and receivables by maturity
More than 1% of the company’s capital
- French companies 73,058 760,763 196,105 194,290 520 1,863 224,571 (6,370) 24,604
- International companies 148,112 384,495 559,397 530,650 294,114 126,746 2,616,543 174,460 98,413
Less than 1% of the company’s capital
- French companies 80 1,568 80 80 457 13,032 992
- International companies 14,063 3,546 1,641 1,449 13,068 807 135,390 4,705 122
€ thousands Related Other companies with Other Totalparties which Essilor has capital ties
More than one year 124,999 124,868 124,115
Less than one year 206,736 214,692 175,403
Total 331,735 339,560 299,518
Raw materials and other supplies 34,853 34,022 35,708
Goods for resale 7,757 10,825 9,681
Finished and semi-finished products and work in progress 36,386 41,385 52,721
Sub-total 78,996 86,232 98,110
Provisions (15,993) (14,543) (13,398)
Total 63,003 71,689 84,712
NOTE 9: CURRENT ASSETS
9.1. Inventories
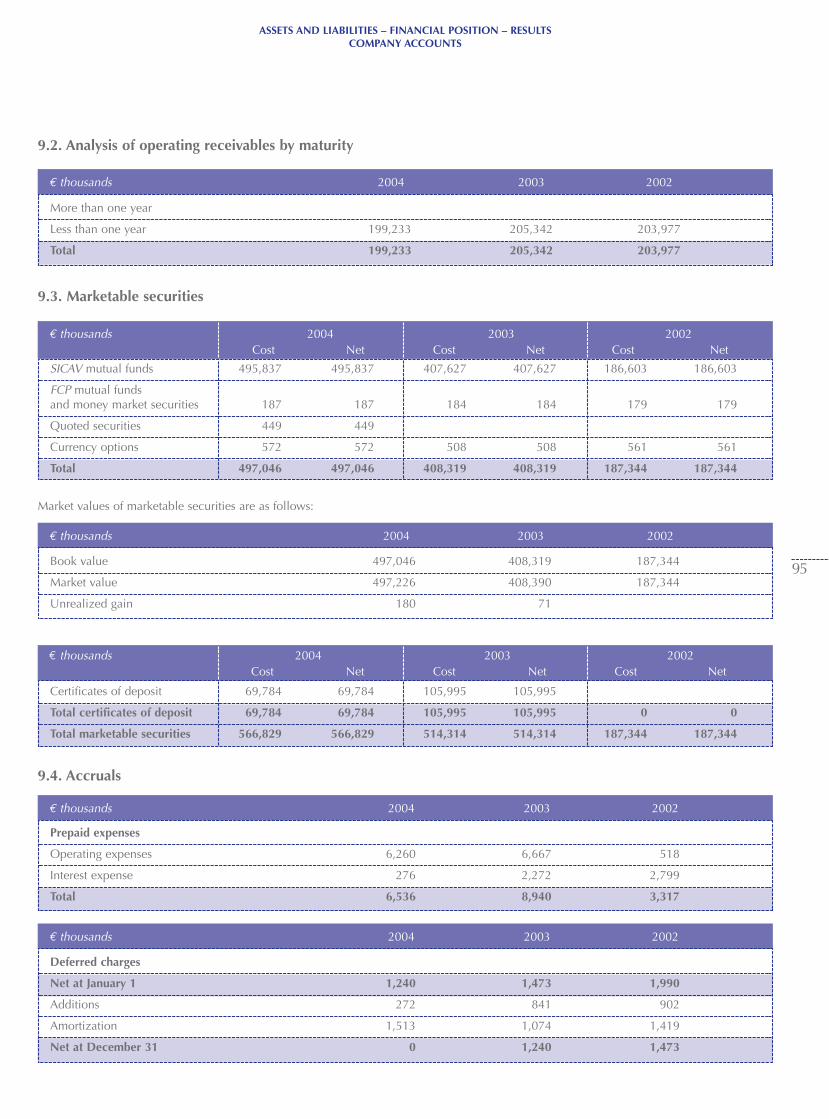
€ thousands 2004 2003 2002
€ thousands 2004 2003 2002
€ thousands 2004 2003 2002Cost Net Cost Net Cost Net
€ thousands 2004 2003 2002
€ thousands 2004 2003 2002Cost Net Cost Net Cost Net
€ thousands 2004 2003 2002
ASSETS AND LIABILITIES – FINANCIAL POSITION – RESULTSCOMPANY ACCOUNTS
95
9.2. Analysis of operating receivables by maturity
More than one year
Less than one year 199,233 205,342 203,977
Total 199,233 205,342 203,977
9.4. Accruals
Prepaid expenses
Operating expenses 6,260 6,667 518
Interest expense 276 2,272 2,799
Total 6,536 8,940 3,317
Deferred charges
Net at January 1 1,240 1,473 1,990
Additions 272 841 902
Amortization 1,513 1,074 1,419
Net at December 31 0 1,240 1,473
Market values of marketable securities are as follows:
Book value 497,046 408,319 187,344
Market value 497,226 408,390 187,344
Unrealized gain 180 71
9.3. Marketable securities
SICAV mutual funds 495,837 495,837 407,627 407,627 186,603 186,603
FCP mutual funds and money market securities 187 187 184 184 179 179
Quoted securities 449 449
Currency options 572 572 508 508 561 561
Total 497,046 497,046 408,319 408,319 187,344 187,344
Certificates of deposit 69,784 69,784 105,995 105,995
Total certificates of deposit 69,784 69,784 105,995 105,995 0 0
Total marketable securities 566,829 566,829 514,314 514,314 187,344 187,344
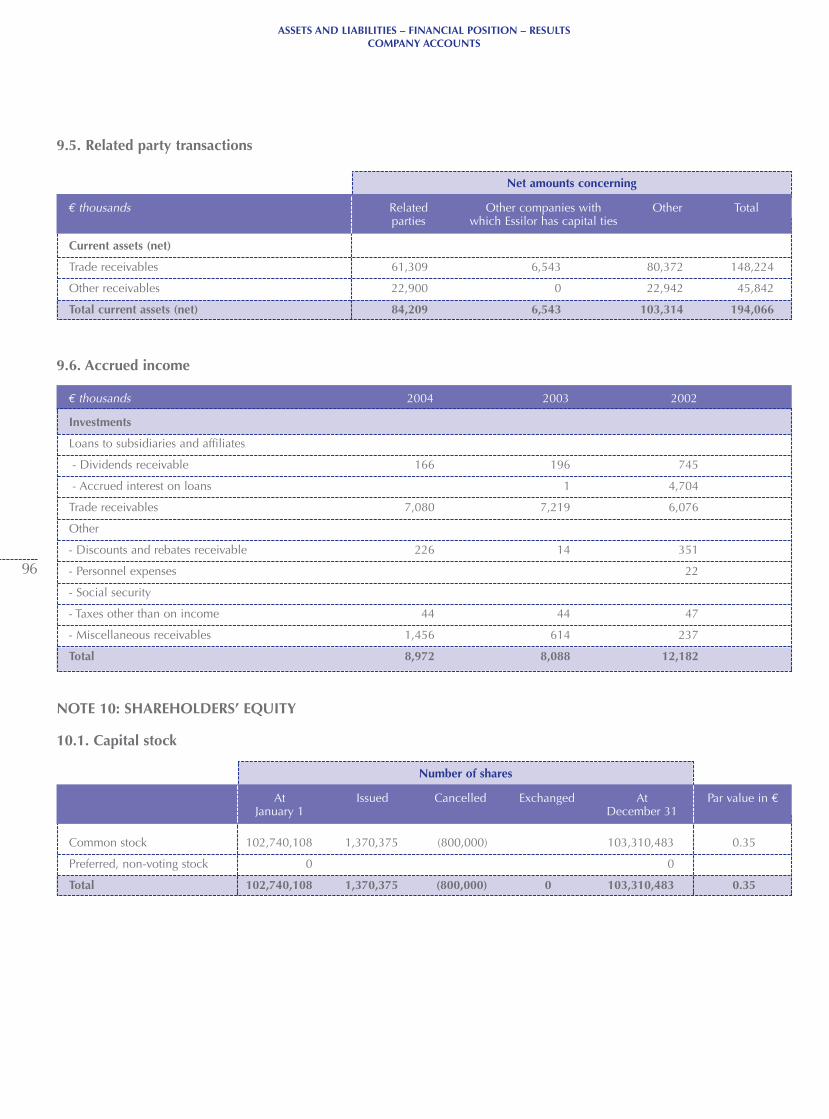
€ thousands 2004 2003 2002
ASSETS AND LIABILITIES – FINANCIAL POSITION – RESULTSCOMPANY ACCOUNTS
96
Net amounts concerning
Current assets (net)
Trade receivables 61,309 6,543 80,372 148,224
Other receivables 22,900 0 22,942 45,842
Total current assets (net) 84,209 6,543 103,314 194,066
9.5. Related party transactions
€ thousands Related Other companies with Other Totalparties which Essilor has capital ties
Number of shares
Common stock 102,740,108 1,370,375 (800,000) 103,310,483 0.35
Preferred, non-voting stock 0 0
Total 102,740,108 1,370,375 (800,000) 0 103,310,483 0.35
NOTE 10: SHAREHOLDERS’ EQUITY
10.1. Capital stock
At Issued Cancelled Exchanged At Par value in €January 1 December 31
9.6. Accrued income
Investments
Loans to subsidiaries and affiliates
- Dividends receivable 166 196 745
- Accrued interest on loans 1 4,704
Trade receivables 7,080 7,219 6,076
Other
- Discounts and rebates receivable 226 14 351
- Personnel expenses 22
- Social security
- Taxes other than on income 44 44 47
- Miscellaneous receivables 1,456 614 237
Total 8,972 8,088 12,182
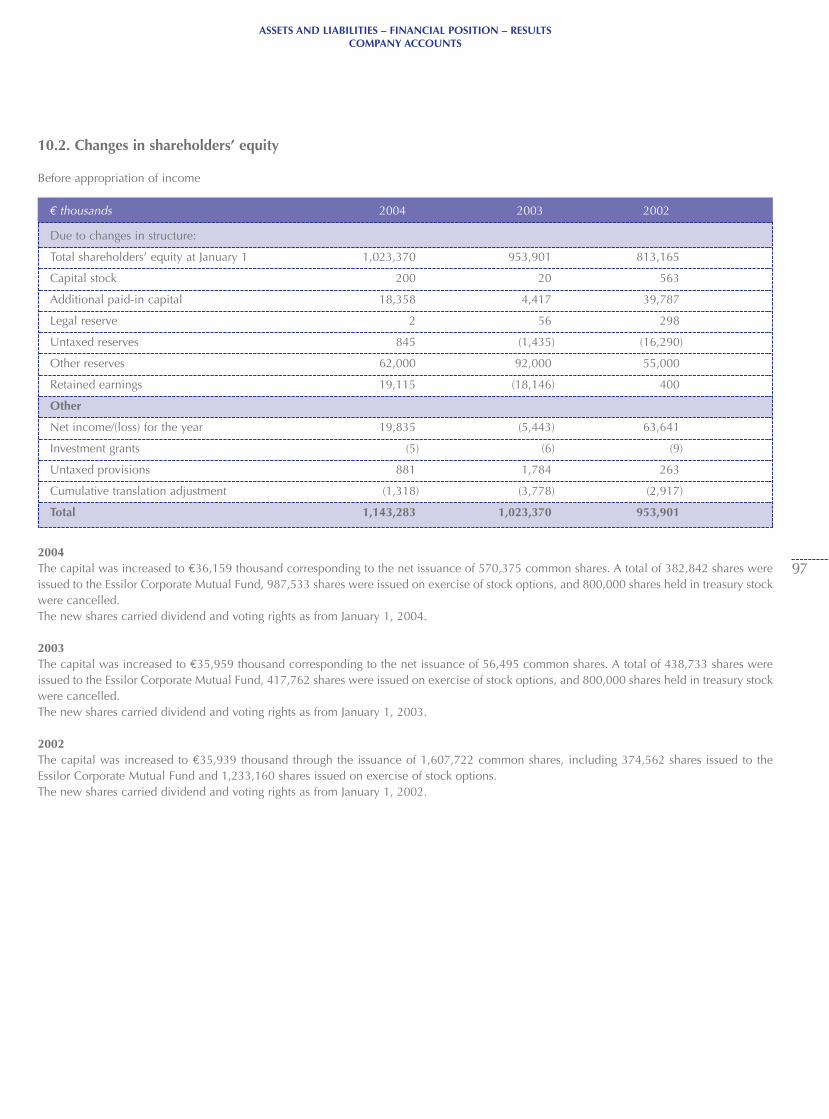
€ thousands 2004 2003 2002
ASSETS AND LIABILITIES – FINANCIAL POSITION – RESULTSCOMPANY ACCOUNTS
97
10.2. Changes in shareholders’ equity
Before appropriation of income
Due to changes in structure:
Total shareholders’ equity at January 1 1,023,370 953,901 813,165
Capital stock 200 20 563
Additional paid-in capital 18,358 4,417 39,787
Legal reserve 2 56 298
Untaxed reserves 845 (1,435) (16,290)
Other reserves 62,000 92,000 55,000
Retained earnings 19,115 (18,146) 400
Other
Net income/(loss) for the year 19,835 (5,443) 63,641
Investment grants (5) (6) (9)
Untaxed provisions 881 1,784 263
Cumulative translation adjustment (1,318) (3,778) (2,917)
Total 1,143,283 1,023,370 953,901
2004The capital was increased to €36,159 thousand corresponding to the net issuance of 570,375 common shares. A total of 382,842 shares wereissued to the Essilor Corporate Mutual Fund, 987,533 shares were issued on exercise of stock options, and 800,000 shares held in treasury stockwere cancelled.The new shares carried dividend and voting rights as from January 1, 2004.
2003The capital was increased to €35,959 thousand corresponding to the net issuance of 56,495 common shares. A total of 438,733 shares wereissued to the Essilor Corporate Mutual Fund, 417,762 shares were issued on exercise of stock options, and 800,000 shares held in treasury stockwere cancelled.The new shares carried dividend and voting rights as from January 1, 2003.
2002The capital was increased to €35,939 thousand through the issuance of 1,607,722 common shares, including 374,562 shares issued to theEssilor Corporate Mutual Fund and 1,233,160 shares issued on exercise of stock options. The new shares carried dividend and voting rights as from January 1, 2002.
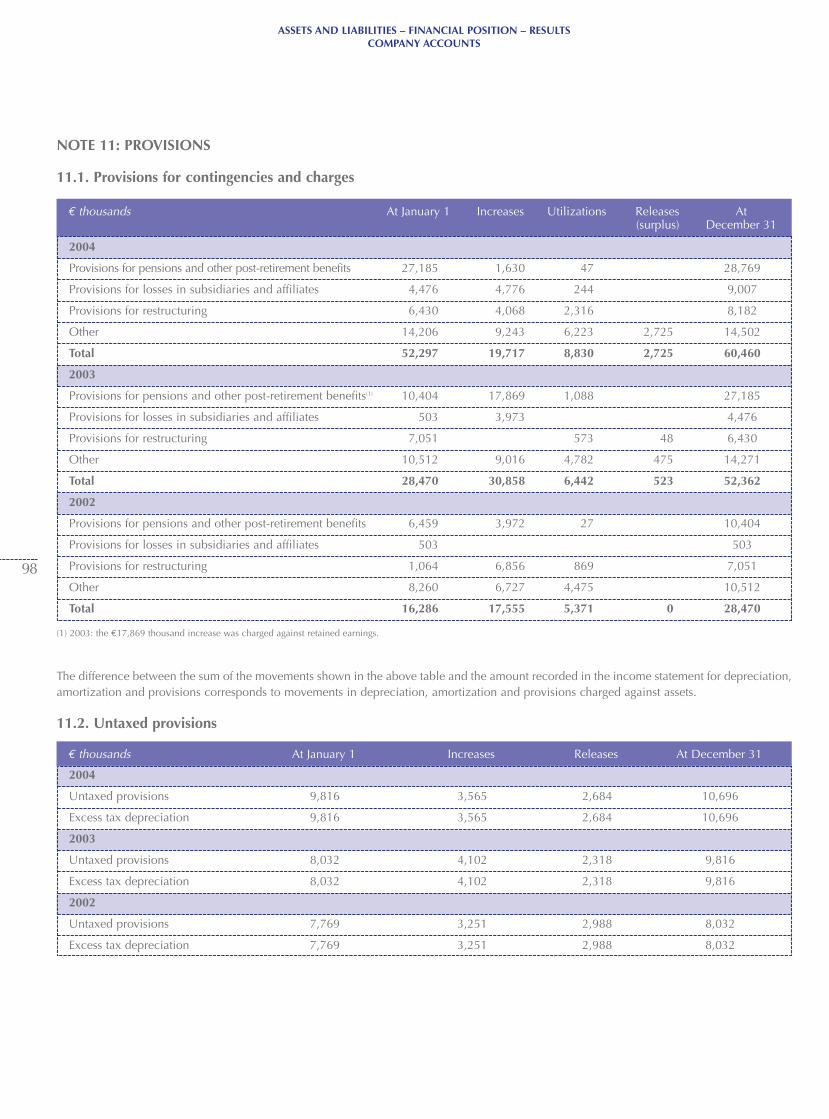
€ thousands At January 1 Increases Utilizations Releases At (surplus) December 31
ASSETS AND LIABILITIES – FINANCIAL POSITION – RESULTSCOMPANY ACCOUNTS
98
2004
Provisions for pensions and other post-retirement benefits 27,185 1,630 47 28,769
Provisions for losses in subsidiaries and affiliates 4,476 4,776 244 9,007
Provisions for restructuring 6,430 4,068 2,316 8,182
Other 14,206 9,243 6,223 2,725 14,502
Total 52,297 19,717 8,830 2,725 60,460
2003
Provisions for pensions and other post-retirement benefits(1) 10,404 17,869 1,088 27,185
Provisions for losses in subsidiaries and affiliates 503 3,973 4,476
Provisions for restructuring 7,051 573 48 6,430
Other 10,512 9,016 4,782 475 14,271
Total 28,470 30,858 6,442 523 52,362
2002
Provisions for pensions and other post-retirement benefits 6,459 3,972 27 10,404
Provisions for losses in subsidiaries and affiliates 503 503
Provisions for restructuring 1,064 6,856 869 7,051
Other 8,260 6,727 4,475 10,512
Total 16,286 17,555 5,371 0 28,470
NOTE 11: PROVISIONS
11.1. Provisions for contingencies and charges
2004
Untaxed provisions 9,816 3,565 2,684 10,696
Excess tax depreciation 9,816 3,565 2,684 10,696
2003
Untaxed provisions 8,032 4,102 2,318 9,816
Excess tax depreciation 8,032 4,102 2,318 9,816
2002
Untaxed provisions 7,769 3,251 2,988 8,032
Excess tax depreciation 7,769 3,251 2,988 8,032
€ thousands At January 1 Increases Releases At December 31
(1) 2003: the €17,869 thousand increase was charged against retained earnings.
The difference between the sum of the movements shown in the above table and the amount recorded in the income statement for depreciation,amortization and provisions corresponds to movements in depreciation, amortization and provisions charged against assets.
11.2. Untaxed provisions
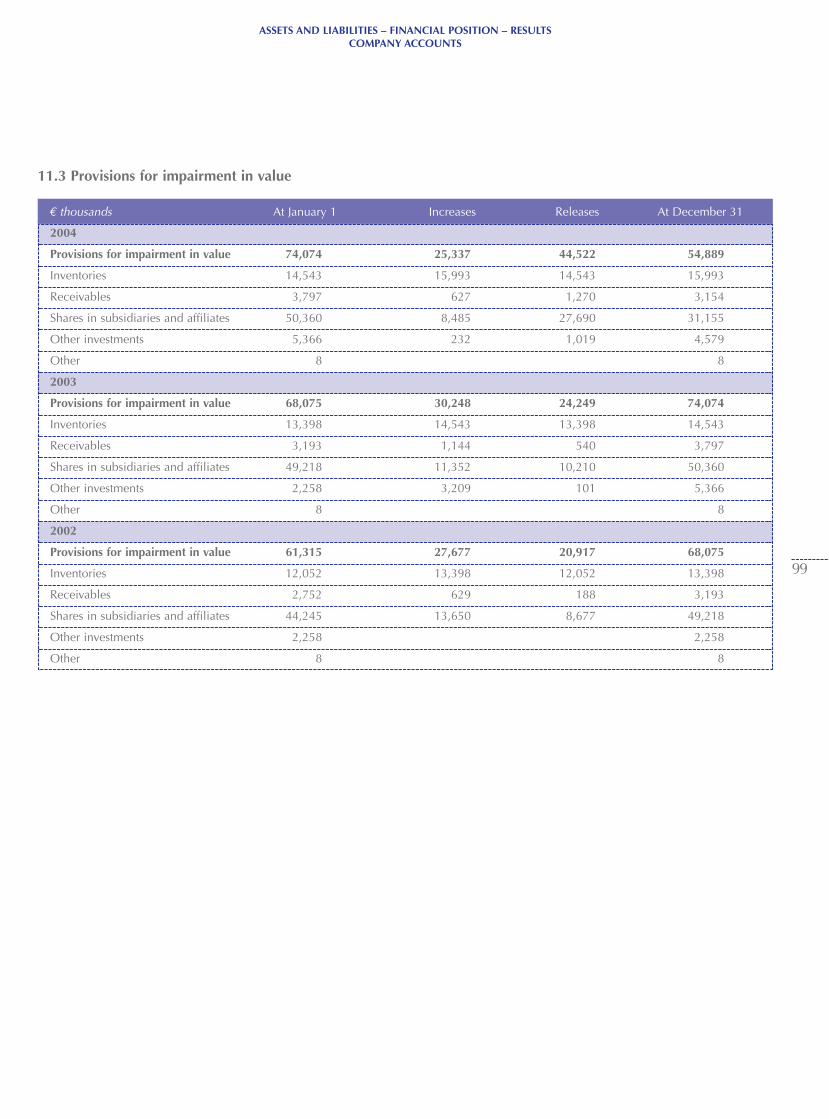
ASSETS AND LIABILITIES – FINANCIAL POSITION – RESULTSCOMPANY ACCOUNTS
99
11.3 Provisions for impairment in value
2004
Provisions for impairment in value 74,074 25,337 44,522 54,889
Inventories 14,543 15,993 14,543 15,993
Receivables 3,797 627 1,270 3,154
Shares in subsidiaries and affiliates 50,360 8,485 27,690 31,155
Other investments 5,366 232 1,019 4,579
Other 8 8
2003
Provisions for impairment in value 68,075 30,248 24,249 74,074
Inventories 13,398 14,543 13,398 14,543
Receivables 3,193 1,144 540 3,797
Shares in subsidiaries and affiliates 49,218 11,352 10,210 50,360
Other investments 2,258 3,209 101 5,366
Other 8 8
2002
Provisions for impairment in value 61,315 27,677 20,917 68,075
Inventories 12,052 13,398 12,052 13,398
Receivables 2,752 629 188 3,193
Shares in subsidiaries and affiliates 44,245 13,650 8,677 49,218
Other investments 2,258 2,258
Other 8 8
€ thousands At January 1 Increases Releases At December 31
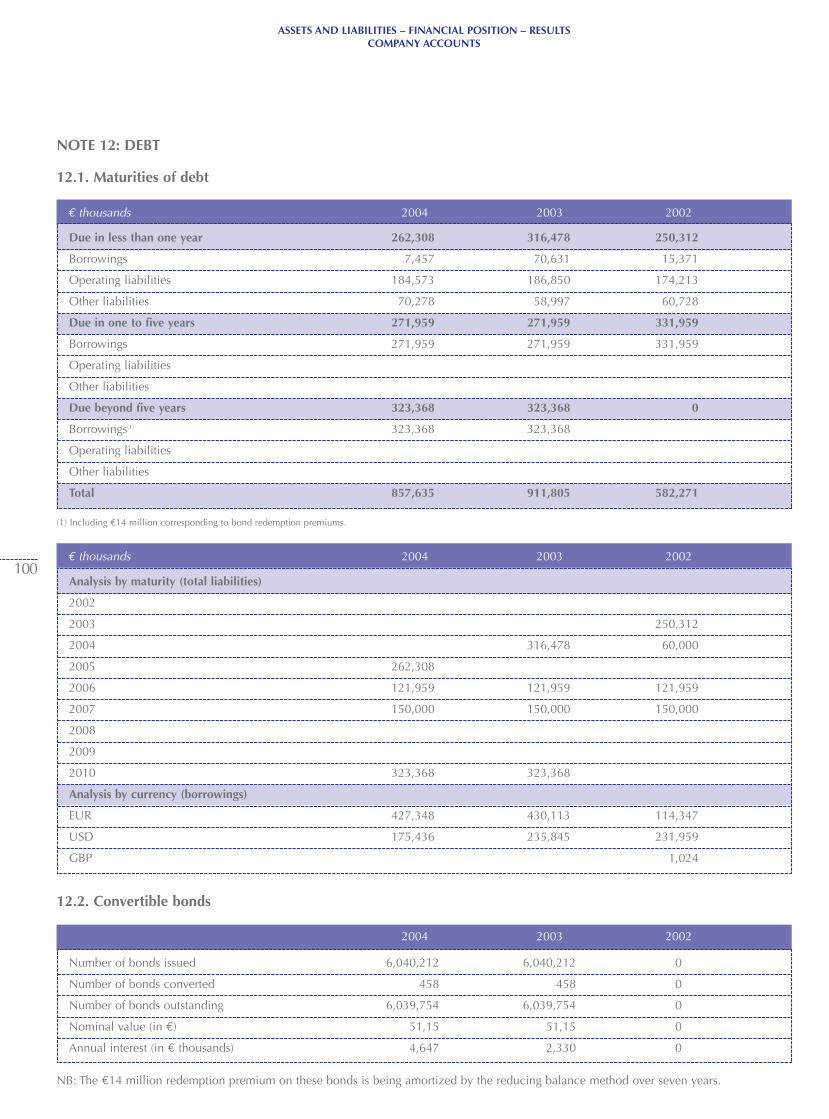
2004 2003 2002
€ thousands 2004 2003 2002
€ thousands 2004 2003 2002
ASSETS AND LIABILITIES – FINANCIAL POSITION – RESULTSCOMPANY ACCOUNTS
100Analysis by maturity (total liabilities)
2002
2003 250,312
2004 316,478 60,000
2005 262,308
2006 121,959 121,959 121,959
2007 150,000 150,000 150,000
2008
2009
2010 323,368 323,368
Analysis by currency (borrowings)
EUR 427,348 430,113 114,347
USD 175,436 235,845 231,959
GBP 1,024
12.2. Convertible bonds
Number of bonds issued 6,040,212 6,040,212 0
Number of bonds converted 458 458 0
Number of bonds outstanding 6,039,754 6,039,754 0
Nominal value (in €) 51,15 51,15 0
Annual interest (in € thousands) 4,647 2,330 0
NB: The €14 million redemption premium on these bonds is being amortized by the reducing balance method over seven years.
Due in less than one year 262,308 316,478 250,312
Borrowings 7,457 70,631 15,371
Operating liabilities 184,573 186,850 174,213
Other liabilities 70,278 58,997 60,728
Due in one to five years 271,959 271,959 331,959
Borrowings 271,959 271,959 331,959
Operating liabilities
Other liabilities
Due beyond five years 323,368 323,368 0
Borrowings(1) 323,368 323,368
Operating liabilities
Other liabilities
Total 857,635 911,805 582,271
NOTE 12: DEBT
12.1. Maturities of debt
(1) Including €14 million corresponding to bond redemption premiums.
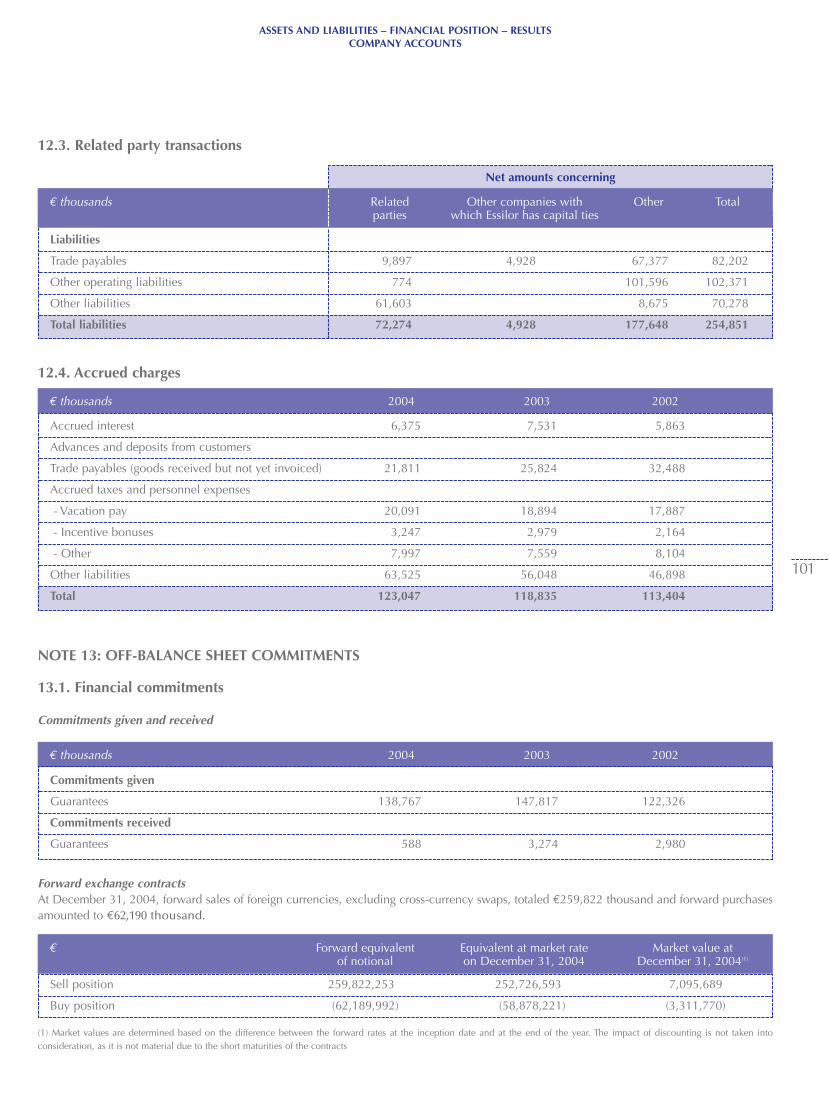
€ Forward equivalent Equivalent at market rate Market value atof notional on December 31, 2004 December 31, 2004(1)
€ thousands 2004 2003 2002
€ thousands 2004 2003 2002
ASSETS AND LIABILITIES – FINANCIAL POSITION – RESULTSCOMPANY ACCOUNTS
101
12.3. Related party transactions
12.4. Accrued charges
Accrued interest 6,375 7,531 5,863
Advances and deposits from customers
Trade payables (goods received but not yet invoiced) 21,811 25,824 32,488
Accrued taxes and personnel expenses
- Vacation pay 20,091 18,894 17,887
- Incentive bonuses 3,247 2,979 2,164
- Other 7,997 7,559 8,104
Other liabilities 63,525 56,048 46,898
Total 123,047 118,835 113,404
NOTE 13: OFF-BALANCE SHEET COMMITMENTS
13.1. Financial commitments
Commitments given and received
Commitments given
Guarantees 138,767 147,817 122,326
Commitments received
Guarantees 588 3,274 2,980
Forward exchange contractsAt December 31, 2004, forward sales of foreign currencies, excluding cross-currency swaps, totaled €259,822 thousand and forward purchasesamounted to €62,190 thousand.
Net amounts concerning
Liabilities
Trade payables 9,897 4,928 67,377 82,202
Other operating liabilities 774 101,596 102,371
Other liabilities 61,603 8,675 70,278
Total liabilities 72,274 4,928 177,648 254,851
€ thousands Related Other companies with Other Totalparties which Essilor has capital ties
Sell position 259,822,253 252,726,593 7,095,689
Buy position (62,189,992) (58,878,221) (3,311,770)
(1) Market values are determined based on the difference between the forward rates at the inception date and at the end of the year. The impact of discounting is not taken into consideration, as it is not material due to the short maturities of the contracts
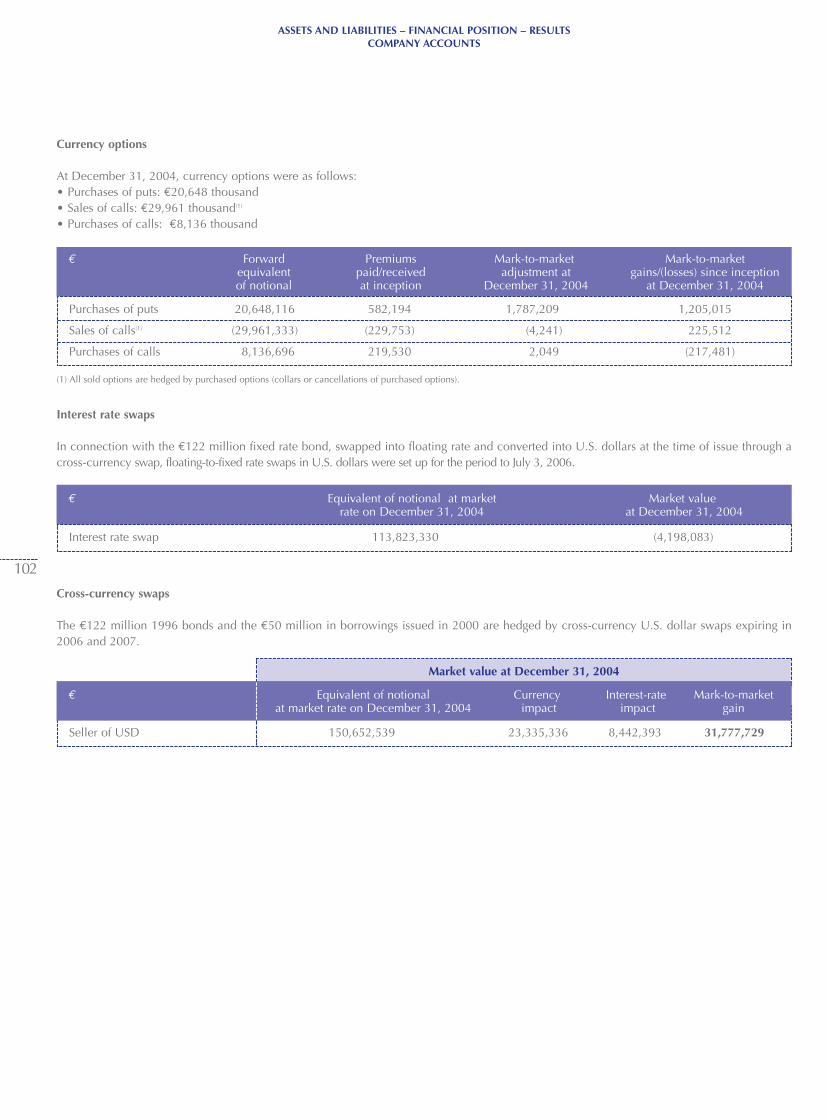
€ Equivalent of notional at market Market valuerate on December 31, 2004 at December 31, 2004
€ Forward Premiums Mark-to-market Mark-to-market equivalent paid/received adjustment at gains/(losses) since inception of notional at inception December 31, 2004 at December 31, 2004
Market value at December 31, 2004
ASSETS AND LIABILITIES – FINANCIAL POSITION – RESULTSCOMPANY ACCOUNTS
102
Currency options
At December 31, 2004, currency options were as follows:• Purchases of puts: €20,648 thousand• Sales of calls: €29,961 thousand(1)
• Purchases of calls: €8,136 thousand
Purchases of puts 20,648,116 582,194 1,787,209 1,205,015
Sales of calls(1) (29,961,333) (229,753) (4,241) 225,512
Purchases of calls 8,136,696 219,530 2,049 (217,481)
Cross-currency swaps
The €122 million 1996 bonds and the €50 million in borrowings issued in 2000 are hedged by cross-currency U.S. dollar swaps expiring in2006 and 2007.
Seller of USD 150,652,539 23,335,336 8,442,393 31,777,729
€ Equivalent of notional Currency Interest-rate Mark-to-market at market rate on December 31, 2004 impact impact gain
Interest rate swaps
In connection with the €122 million fixed rate bond, swapped into floating rate and converted into U.S. dollars at the time of issue through across-currency swap, floating-to-fixed rate swaps in U.S. dollars were set up for the period to July 3, 2006.
Interest rate swap 113,823,330 (4,198,083)
(1) All sold options are hedged by purchased options (collars or cancellations of purchased options).

€ thousands Lease payments Future minimum lease payments Total residual value
For the year Cumulative 1 year 1 to 5 years Beyond 5 years Total
€ thousands Cost at inception Depreciation Netof the lease For the year Accumulated
€ thousands Lease payments Future minimum lease payments Total residual value
For the year Cumulative 1 year 1 to 5 years Beyond 5 years Total
€ thousands Cost at inception Depreciation Netof the lease For the year Accumulated
€ thousands Lease payments Future minimum lease payments Total residual value
For the year Cumulative 1 year 1 to 5 years Beyond 5 years Total
€ thousands Cost at inception Depreciation Netof the lease For the year Accumulated
ASSETS AND LIABILITIES – FINANCIAL POSITION – RESULTSCOMPANY ACCOUNTS
103
13.2. Commitments under finance leases
2004Assets acquired under finance leases
Land 97 97
Buildings 12,542 627 2,822 9,720
Total 12,639 627 2,822 9,817
Lease commitments
Land 3 192 0 0
Buildings 2,012 9,158 1,338 5,148 6,486 5,148
Total 2,015 9,350 1,338 5,148 0 6,486 5,148
2003Assets acquired under finance leases
Land 97 97
Buildings 12,542 627 2,195 10,347
Total 12,639 627 2,195 10,444
Lease commitments
Land 14 188 3 3 0
Buildings 2,109 7,146 1,530 6,486 8,016 5,148
Total 2,123 7,334 1,533 6,486 0 8,019 5,148
Land 13 1,320 12 14 25 0
Buildings 2,082 18,777 1,485 8,076 9,561 5,148
Total 2,094 20,098 1,496 8,090 0 9,586 5,148
2002Assets acquired under finance leases
Land 779 779
Buildings 20,720 1,036 8,233 12,497
Total 21,499 1,036 8,233 13,276
Lease commitments
Analysis of average number of employees 2004 2003 2002
€ thousands 2004 2003 2002
€ thousands Future minimum lease payments1 year 1 to 5 years Beyond 5 years Total
ASSETS AND LIABILITIES – FINANCIAL POSITION – RESULTSCOMPANY ACCOUNTS
104
13.4. Employee benefit commitments
Supplementary pensionsThe Company's obligations under supplementary pension plans in favor of management and certain other long-serving employees were revalued in 2004, using the projected unit credit method, based on a 3.0% rate of salary increases and a discount rate of 4.75% (higher thaninflation). The total obligation at December 31, 2004 stood at €30,215 thousand including €11,767 thousand funded under insured plans bythe end of the year.Since 2003, the unfunded portion of supplementary pension obligations is recognized in the Company accounts.
Long-service awardsThe Company's obligation for the payment of statutory long-service awards, in application of French labor laws, collective bargainingagreements and trade union agreements, was estimated at €2,855 thousand at December 31, 2004. This amount, which corresponds to thediscounted present value of the obligation, determined by applying a discount rate of 4.75% (higher than inflation), has been recognized in thebalance sheet at that date.
NOTE 14: EMPLOYEE DATA
14.1. Average number of employees
14.2. Management compensationIn accordance with article 24-18 of the decree of November 29, 1983 no loans or advances have been granted to management.Total compensation and benefits paid to directors and senior management amounted to:• €1,459 thousand in 2004.• €1,415 thousand in 2003.• €1,309 thousand in 2002.
13.3. Commitments under non-cancelable operating leases
Contractual obligations
Operating lease Vincennes facility 2,843 11,372 14,215 28,430
Total 2,843 11,372 14,215 28,430
Application of a discount rate Yes Yes Yes
Projected benefit obligation 30,215 29,548 14,991
Fair value of plan assets 11,767 11,837 12,351
Provision recorded in the accounts 17,664 17,711
Unfunded obligation 0 0 2,640
Management 850 778 710
Supervisory and administrative 1,325 1,313 1,301
Production 1,392 1,438 1,476
Total 3,567 3,529 3,487
2004 2003 2002 2001 2000
ASSETS AND LIABILITIES – FINANCIAL POSITION – RESULTSCOMPANY ACCOUNTS
105
NOTE 15: FIVE-YEAR FINANCIAL SUMMARY
NOTE 16: SUBSEQUENT EVENTS
To the best of the Company's knowledge, no events have occurred since the balance-sheet date that could have a material impact on theCompany’s accounts.
CAPITAL AT YEAR-END(€ thousands)
Capital stock 36,159 35,959 35,939 35,377 32,399
Number of common shares outstanding(1) 103,310,483 102,740,108 102,683,613 101,075,891 10,569,681
o/w treasury stock(1) 1,382,788 1,269,837 1,450,645 1,000,000 741,027
Number of preferred, non-voting shares outstanding 56,418
RESULTS OF OPERATIONS(€ thousands)
Net sales 658,024 650,196 637,588 576,496 589,808
Income before tax, depreciation, amortization and provisions 180,912 190,554 196,165 83,039 139,985
Corporate income tax 13,129 10,611 4,889 2,773 14,479
Employee profit-sharing
Net income 163,638 143,803 149,247 85,606 105,588
Total dividends 77,465 56,823 50,616 41,031 38,721
PER SHARE DATA(in €)
Income after tax and employee profit sharing, before depreciation, amortization and provisions, excluding treasury stock(1) 1.65 1.77 1.89 0.80 12.70
Net income, excluding treasury stock(1) 1.61 1.42 1.47 0.86 10.68
Net dividend per common share(1) 0.76 0.56 0.50 0.41 3.90
Net dividend per preferred, non-voting share 4.02
EMPLOYEE DATA
Average number of employees 3,567 3,529 3,487 3,475 3,575
Total payroll (€ thousands) 123,702 118,661 116,276 111,050 107,619
Total benefits (€ thousands) 58,252 54,879 52,465 48,671 49,470
(1) In 2001, the number of shares increased tenfold following the 10-for-1 stock-split.
ASSETS AND LIABILITIES – FINANCIAL POSITION – RESULTS
106
5.2.6. Statutory Auditors’ Report on the Financial Statements
For the Year ended December 31, 2004
This is a free translation into English of the Statutory Auditors’ report issued in the French language and is provided solely for the convenienceof English speaking readers. The Statutory Auditors’ report includes information specifically required by French law in all audit reports, whetherqualified or not, and this is presented below the opinion on the financial statements. This information includes an explanatory paragraph discussing the auditors’ assessments of certain significant accounting and auditing matters. These assessments were considered for the purposeof issuing an audit opinion on the financial statements taken as a whole and not to provide separate assurance on individual account captionsor on information taken outside of the financial statements. This report, together with the Statutory Auditors’ report addressing financial and accounting information in the President’s report on internalcontrol, should be read in conjunction with, and construed in accordance with, French law and professional auditing standards applicable inFrance.
To the Shareholders,
In compliance with the assignment entrusted to us by the Shareholders' Meeting, we hereby report to you, for the year ended December 31,2004, on:• the audit of the accompanying financial statements of Essilor International;• the justification of our assessments;• the specific verifications and information required by law.These financial statements have been approved by the Board of Directors. Our role is to express an opinion on these financial statements basedon our audit.
Opinion on the financial statementsWe conducted our audit in accordance with professional standards applicable in France. Those standards require that we plan and perform theaudit to obtain reasonable assurance about whether the financial statements are free of material misstatement. An audit includes examining,on a test basis, evidence supporting the amounts and disclosures in the financial statements. An audit also includes assessing the accountingprinciples used and significant estimates made by the management, as well as evaluating the overall financial statements presentation. Webelieve that our audit provides a reasonable basis for our opinion.
In our opinion, the financial statements give a true and fair view of the Company’s financial position and its assets and liabilities, as of December31, 2004, and of the results of its operations for the year then ended in accordance with the accounting rules and principles applicable in France
Justification of our assessmentsIn accordance with the requirements of article L.225-235 of the Commercial Code relating to the justification of our assessments, we bring toyour attention the following matter:
Note 1.4 to the financial statements describes the accounting treatment of investments. As part of our assessment of the Company's accountingprinciples and policies, we verified the appropriateness of the policies and methods applied to investments and of the information disclosed inthe notes to the consolidated financial statements. We also obtained assurance that these policies and methods had been properly applied
The assessments were made in the context of our audit of the financial statements, taken as a whole, and therefore contributed to the formationof the unqualified opinion expressed in the first part of this report.
Specific verifications and information We have also performed the specific verifications required by law in accordance with professional standards applicable in France.
We have no matters to report regarding the fair presentation and the conformity with the financial statements of the information given in themanagement report of the Board of Directors, and in the documents addressed to the shareholders with respect to the financial position and thefinancial statements.
Paris, March 10, 2005
The Statutory Auditors
PricewaterhouseCoopers Audit Cabinet Dauge et AssociésJacques Denizeau Gérard Dauge
ASSETS AND LIABILITIES – FINANCIAL POSITION – RESULTS
107
5.2.7. Statutory Auditors’ Special Report on Agreements Involving Directors
For the year ended December 31, 20044
This is a free translation into English of the Statutory Auditors’ Special report issued in the French language and is provided solely for theconvenience of English speaking readers.
To the Shareholders,
In our capacity as Statutory Auditors of Essilor International, we are required to report on certain contractual agreements with certain relatedparties of which we have been advised.
Agreements entered into during the yearUnder the provisions of article L.225-40 of the Commercial Code, we have been informed of the following agreement which received priorapproval in advance by the Board of Directors.
Our responsibility does not include identifying any undisclosed agreements. We are required to report to shareholders, based on the informationprovided, about the main terms and conditions of agreements that have been disclosed to us, without commenting on their relevance orsubstance. Under the provisions of article 92 of the March 23, 1967 decree, it is the responsibility of shareholders to determine whether theagreements are appropriate and should be approved.
We conducted our review in accordance with the standards of our profession applicable in France. Those standards require that we carry outthe necessary procedures to verify the consistency of the information disclosed to us with the source documents.
Person concernedOlivier PécouxManaging Partner of Rothschild & Cie BanqueDirector of Essilor International
PurposeLiquidity contract signed on November 18, 2004
Under the terms of this contract, Essilor has retained the services of Rothschild & Cie Banque to trade in Essilor International shares on the market,on an independent basis on the Company's behalf, to promote a liquid market for the shares and stabilize the share price. Capital assigned to thiscontract represents approximately €12 million. Rothschild & Cie Banque charges the Company an annual fee of €280,000 for its services.
This contract was signed for a period of one year and is automatically renewable.
Paris, March 10, 2005
The Statutory Auditors
PricewaterhouseCoopers Audit Cabinet Dauge et AssociésJacques Denizeau Gérard Dauge
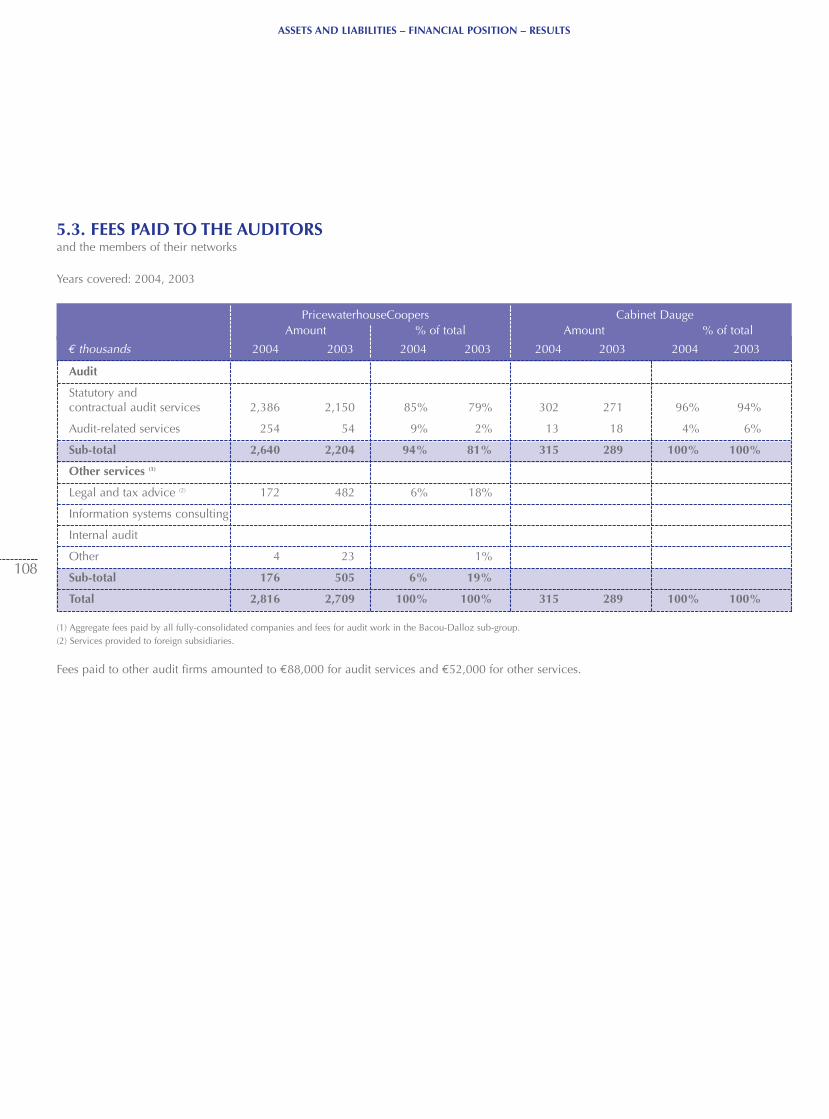
2004 2003 2004 2003 2004 2003 2004 2003€ thousands 2004 2003 2004 2003 2004 2003 2004 2003
ASSETS AND LIABILITIES – FINANCIAL POSITION – RESULTS
108
5.3. FEES PAID TO THE AUDITORS and the members of their networks
Years covered: 2004, 2003
Audit
Statutory and contractual audit services 2,386 2,150 85% 79% 302 271 96% 94%
Audit-related services 254 54 9% 2% 13 18 4% 6%
Sub-total 2,640 2,204 94% 81% 315 289 100% 100%
Other services (1)
Legal and tax advice (2) 172 482 6% 18%
Information systems consulting
Internal audit
Other 4 23 1%
Sub-total 176 505 6% 19%
Total 2,816 2,709 100% 100% 315 289 100% 100%
Amount % of total Amount % of totalPricewaterhouseCoopers Cabinet Dauge
(1) Aggregate fees paid by all fully-consolidated companies and fees for audit work in the Bacou-Dalloz sub-group.(2) Services provided to foreign subsidiaries.
Fees paid to other audit firms amounted to €88,000 for audit services and €52,000 for other services.
109
6.1. MEMBERSHIP AND PROCEDURES OF THE BOARD OF DIRECTORS, THE COMMITTEES OFTHE BOARD AND THE EXECUTIVE COMMITTEE
6.1.1. Board of Directors
6.1.1.1. Members (at December 31, 2004)The Company's bylaws (article 12) stipulate that the Board of Directors must have at least three and no more than fifteen members. As ofDecember 31, 2004, the Board had twelve members. Directors are elected for a three-year term and may stand for re-election. The terms ofone-third of the directors expire at each Annual Shareholders' Meeting, so that the entire Board is re-elected over a three-year rolling period.The average age of directors is 56. Each director is required to hold 500 Essilor International shares.
At the Annual Shareholders' Meeting of May 14, 2004, Yves Chevillotte was elected as director, together with Louis Lesperance and Jean-PierreMartin who replaced Robert Colucci and Alain-Claude Mathieu as representatives of employee-shareholders.
The criteria for determining directors' independence as set out in the Bouton Committee's report on corporate governance have been taken upin the Company's internal rules, as follows and which were adopted by the Board on November 18, 2003:
Seven of the twelve members of the Board are independent based on the above criteria, and represent more than the one-third minimumprescribed in the internal rules.
SECTION VI
Corporate Governance
A director is independent when he or she has no relationship of any kind whatsoever with the corporation, its group or the managementof either, that is such as to colour his or her judgment. In particular:• The director is neither an employee nor corporate officer (mandataire social) of the Company, nor an employee or director of its parent
or of one of its consolidated subsidiaries, and has not been during the previous five years.• The director is not a corporate officer of a company in which the Company holds, either directly or indirectly, a directorship, or in which
a directorship is held by an employee of the company designated as such or by a current or former (going back five years) corporate officer of the Company.
• The director is none of the following (whether directly or indirectly) a customer, supplier, investment banker or commercial banker – ineach case:- which is material for the Company or its group, or- for which the Company or its group represents a material proportion of that entity’s activity.
• The director does not have any close family ties with a corporate officer (mandataire social) of the Company.• The director has not been an auditor of the Company over the past five years (article L 225-225 of the French Commercial Code).• The director has not been a director of the Company for more than twelve years
Directors representing significant shareholders of the Company or its parent company are considered independent as long as they do notin whole or in part control the Company; beyond a threshold of 10% of the share capital or voting rights, the Board shall examineindividually each case in order to determine whether the given director may be considered independent or not, taking into account thecomposition of the Company’s share capital and whether there exists potential for any conflict of interest.
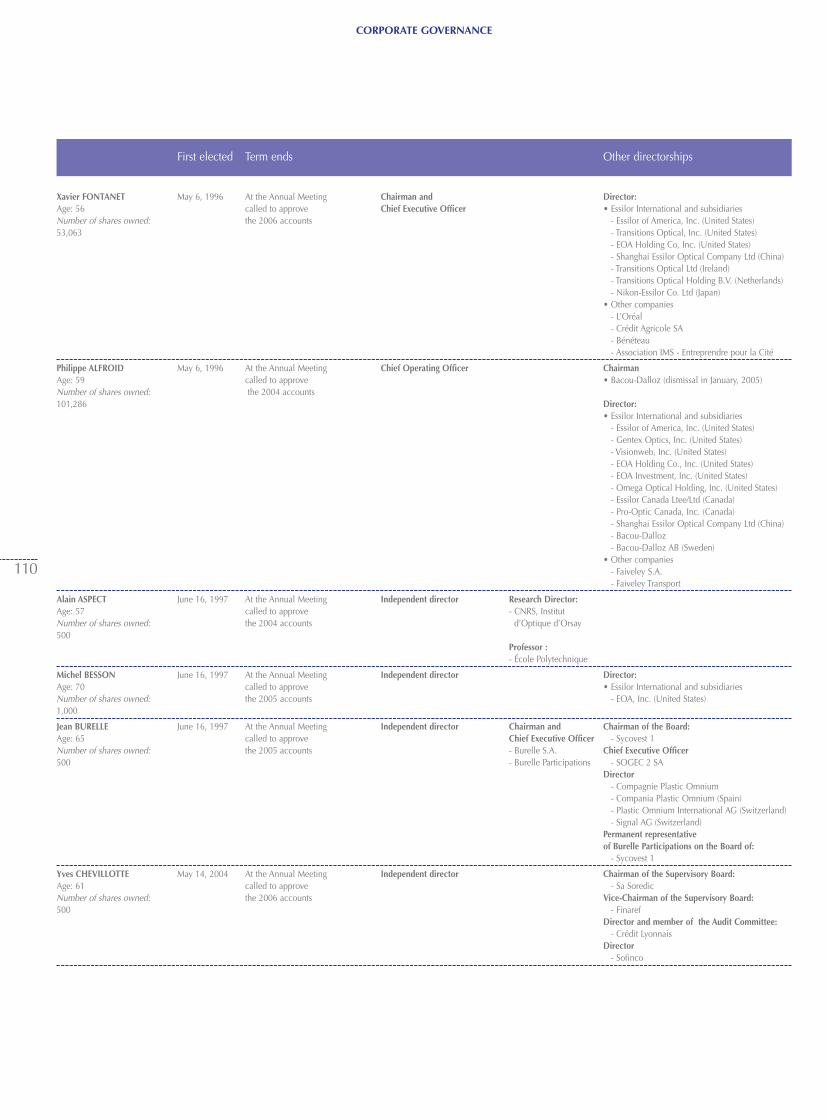
CORPORATE GOVERNANCE
110
First elected Term ends Other directorships
Xavier FONTANET May 6, 1996 At the Annual Meeting Chairman and Director: Age: 56 called to approve Chief Executive Officer • Essilor International and subsidiariesNumber of shares owned: the 2006 accounts - Essilor of America, Inc. (United States)53,063 - Transitions Optical, Inc. (United States)
- EOA Holding Co, Inc. (United States)- Shanghai Essilor Optical Company Ltd (China)- Transitions Optical Ltd (Ireland)- Transitions Optical Holding B.V. (Netherlands)- Nikon-Essilor Co. Ltd (Japan)
• Other companies- L’Oréal- Crédit Agricole SA- Bénéteau- Association IMS - Entreprendre pour la Cité
Philippe ALFROID May 6, 1996 At the Annual Meeting Chief Operating Officer ChairmanAge: 59 called to approve • Bacou-Dalloz (dismissal in January, 2005)Number of shares owned: the 2004 accounts101,286 Director:
• Essilor International and subsidiaries- Essilor of America, Inc. (United States)- Gentex Optics, Inc. (United States)- Visionweb, Inc. (United States)- EOA Holding Co., Inc. (United States)- EOA Investment, Inc. (United States)- Omega Optical Holding, Inc. (United States)- Essilor Canada Ltee/Ltd (Canada)- Pro-Optic Canada, Inc. (Canada)- Shanghai Essilor Optical Company Ltd (China)- Bacou-Dalloz- Bacou-Dalloz AB (Sweden)
• Other companies- Faiveley S.A.- Faiveley Transport
Alain ASPECT June 16, 1997 At the Annual Meeting Independent director Research Director: Age: 57 called to approve - CNRS, InstitutNumber of shares owned: the 2004 accounts d’Optique d’Orsay500
Professor : - École Polytechnique
Michel BESSON June 16, 1997 At the Annual Meeting Independent director Director: Age: 70 called to approve • Essilor International and subsidiariesNumber of shares owned: the 2005 accounts - EOA, Inc. (United States)1,000
Jean BURELLE June 16, 1997 At the Annual Meeting Independent director Chairman and Chairman of the Board: Age: 65 called to approve Chief Executive Officer - Sycovest 1Number of shares owned: the 2005 accounts - Burelle S.A. Chief Executive Officer500 - Burelle Participations - SOGEC 2 SA
Director- Compagnie Plastic Omnium- Compania Plastic Omnium (Spain)- Plastic Omnium International AG (Switzerland)- Signal AG (Switzerland)
Permanent representative of Burelle Participations on the Board of:
- Sycovest 1
Yves CHEVILLOTTE May 14, 2004 At the Annual Meeting Independent director Chairman of the Supervisory Board:Age: 61 called to approve - Sa SoredicNumber of shares owned: the 2006 accounts Vice-Chairman of the Supervisory Board:500 - Finaref
Director and member of the Audit Committee:- Crédit Lyonnais
Director- Sofinco
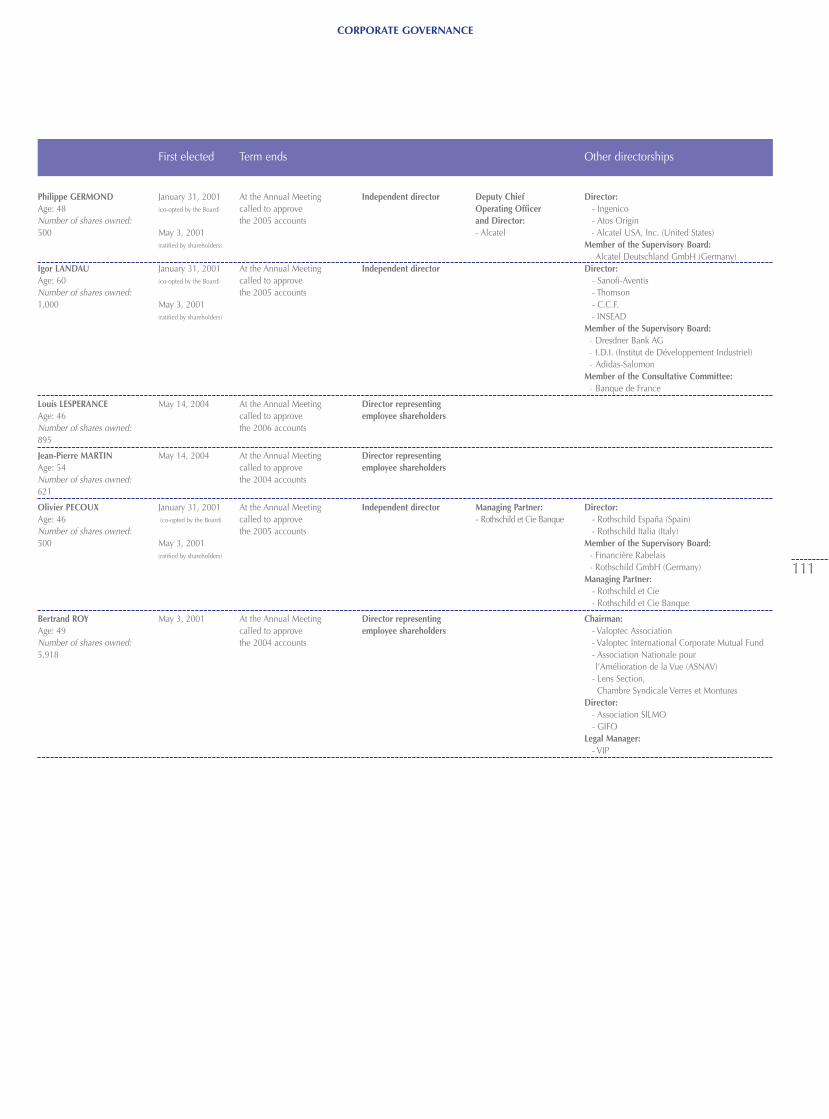
CORPORATE GOVERNANCE
111
First elected Term ends Other directorships
Philippe GERMOND January 31, 2001 At the Annual Meeting Independent director Deputy Chief Director:Age: 48 (co-opted by the Board) called to approve Operating Officer - IngenicoNumber of shares owned: the 2005 accounts and Director: - Atos Origin500 May 3, 2001 - Alcatel - Alcatel USA, Inc. (United States)
(ratified by shareholders) Member of the Supervisory Board:- Alcatel Deutschland GmbH (Germany)
Igor LANDAU January 31, 2001 At the Annual Meeting Independent director Director:Age: 60 (co-opted by the Board) called to approve - Sanofi-AventisNumber of shares owned: the 2005 accounts - Thomson1,000 May 3, 2001 - C.C.F.
(ratified by shareholders) - INSEADMember of the Supervisory Board:
- Dresdner Bank AG- I.D.I. (Institut de Développement Industriel)- Adidas-Salomon
Member of the Consultative Committee:- Banque de France
Louis LESPERANCE May 14, 2004 At the Annual Meeting Director representingAge: 46 called to approve employee shareholdersNumber of shares owned: the 2006 accounts895
Jean-Pierre MARTIN May 14, 2004 At the Annual Meeting Director representing Age: 54 called to approve employee shareholdersNumber of shares owned: the 2004 accounts621
Olivier PECOUX January 31, 2001 At the Annual Meeting Independent director Managing Partner: Director:Age: 46 (co-opted by the Board) called to approve - Rothschild et Cie Banque - Rothschild España (Spain)Number of shares owned: the 2005 accounts - Rothschild Italia (Italy)500 May 3, 2001 Member of the Supervisory Board:
(ratified by shareholders) - Financière Rabelais- Rothschild GmbH (Germany)
Managing Partner: - Rothschild et Cie- Rothschild et Cie Banque
Bertrand ROY May 3, 2001 At the Annual Meeting Director representing Chairman:Age: 49 called to approve employee shareholders - Valoptec Association Number of shares owned: the 2004 accounts - Valoptec International Corporate Mutual Fund5,918 - Association Nationale pour
l’Amélioration de la Vue (ASNAV)- Lens Section,
Chambre Syndicale Verres et MonturesDirector:
- Association SILMO- GIFO
Legal Manager: - VIP
CORPORATE GOVERNANCE
112
6.1.1.2. Board ProceduresThe procedures of the Board of Directors and the Committees of theBoard are governed by internal rules adopted by the Board onNovember 18, 2003, as amended on January 27, 2005. The mainprovisions of the internal rules concerning the Board's proceduresare as follows:
In accordance with the Viénot and Bouton Commitees and with the2003 AFEP/MEDEF report concerning corporate governance rules,the Board performed, in 2004, a formal self-assessment of itsprocedures as provided for in the internal rules. The self-assessmentwas based on a questionnaire prepared by the Company (butallowing for additional answers or suggestions) distributed todirectors during one of the Board meetings. The completedquestionnaires were analysed by an independent director and theresults were presented and discussed at the November 17, 2004Board meeting. The overall conclusion was that the Board's
procedures are satisfactory and that important issues are properlyanalyzed and discussed. Recommended improvements primarilyconcerned the directors' specific training needs. In response to thisrecommendation, the Board added the following provisions toparagraph 3.2 of the internal rules:
At its meeting on January 27, 2005, the Board amended the directors'charter adopted on November 18, 2003, which sets out the rights andobligations of Essilor directors, to take into account:
1/ The provisions of the Market Abuse Directive (framework directive2003/6/EC dated January 28, 2003) on insider dealing and marketmanipulation, which came into effect on October 12, 2004. Thecharter states that:
2/ The new requirement for corporate officers to disclose any tradingin the Company's shares they or their close relations have carried out,which came into effect on November 25, 2004. The charter statesthat:
Information to be made available to directorsAll documents necessary to inform the directors about matters to bediscussed at Board meetings shall be enclosed with the notice ofmeeting or sent or handed to directors reasonably in advance of themeeting.
Each director shall ensure that he or she has all essential informationto enable the Board or the Committees of the Board to engage in aninformed discussion and make informed decisions. If any informationis not made available, or if the director believes that information mayhave been withheld, he or she shall ask for it to be supplied. Therequest shall be made to the Chairman of the Board (or the ChiefExecutive Officer if the two positions are separated), who is under anobligation to ensure that directors are able to fulfill their duties.Between meetings, directors shall receive all useful information,including any critical comments, about all significant events ortransactions affecting the Company. In particular, they shall receivecopies of all press releases published by the Company.
Meetings of the boardThe Board shall meet as frequently as necessary in the Company'sinterest and at least five times per year. The dates of the followingyear's meetings shall be set no later than one month before the end ofthe year, except for special meetings.
Committees of the boardAt the Chairman’s recommendation, the Board may set up committeesand decide on their terms of reference and their composition. TheseCommittees shall examine matters submitted to them by the Board,falling within their respective terms of reference, and shall makerecommendations and proposals to the Board.
Annual self-assessmentOnce a year, the Board shall perform a formal assessment of itsprocedures and take any appropriate measures to improve itsefficiency. The Board shall inform shareholders of the results of theself-assessment in the annual report.
Amendments to the internal rulesThese internal rules may be amended by decision of the Board.
"Directors shall receive training on the financial and legal aspects oftheir mission. The members of the Committees of the Board may beput in contact with their counterparts in other listed companies; sitevisits will be organized for directors and presentations will be madeto them by members of the Executive Committee, specifically tailored to their needs."
Each director who has access to inside information may not trade in theCompany's shares, directly or through a third party, or cause any otherperson to trade in the Company's shares on the strength of thatinformation for as long as it has not been made public. In addition, inthe same way as for Company executives who have access to insideinformation, directors are prohibited from trading in Company's sharesduring the period preceding the publication of inside information ofwhich they are aware and also during the 21-day period that precedesthe announcement of the Company's annual and half-yearly results andquarterly sales.
In accordance with Article 621-18-2 of the Monetary and FinancialCode, introduced in Act 2003-706 dated August 1, 2003 (theFinancial Security Act), Articles 222-14 and 222-15 of theregulations of the Autorité des Marchés Financiers (AMF), and theAMF's press release dated December 27, 2004, each directorundertakes to report immediately to Essilor, through the Company'sregistrar, any and all transactions on the Company's shares orfinancial instruments carried out by him or her or by any closerelation, in order to enable the Company to report these transactionsto the AMF and to announce them in a press release, within therequired timeframe.
CORPORATE GOVERNANCE
113
6.1.2. Committees of the BoardIn 1997, Essilor set up various Committees of the Board inaccordance with corporate governance rules (Audit Committee,Remunerations Committee and Strategy Committee). EachCommittee reports to the Board on its work and the resultingproposals.
6.1.2.1. Audit Committee: members and role The Board's internal rules stipulate that the Audit Committee shallhave at least three members, appointed by the Board from amongthe directors. At least two-thirds of the Committee members must beindependent directors. The members of the Audit Committee cannothold senior management positions or be executive directors.
The Committee is chaired by Yves Chevillotte, who was appointedas Chairman by the Board of Directors on May 14, 2004 to replaceOliver Pécoux, who took over as acting Chairman following thedeath of René Thomas in October 2003. The other members areAlain Aspect, Michel Besson, Olivier Pécoux and Bertrand Roy.More than two-thirds of the members are independent directors.
The role of the Audit Committee, as described in the Board's internalrules, is to ensure that Group management has the necessaryresources to identify and manage the business, financial and legalrisks to which the group may be exposed in France and abroad, inthe normal course of business or in exceptional circumstances, inorder to avoid any erosion of the value of group assets. To this end,the Audit Committee analyses the procedures in place within thegroup to ensure that:• Accounting regulations are complied with and group accounting
principles and policies are properly applied.• Information is properly reported and processed at all levels in the
organization.• The business, financial and legal risks facing the Company and its
subsidiaries in France and abroad are identified, assessed,anticipated and managed.
• Internal controls are applied to the preparation of accounting andfinancial information at all levels of the organization.
• Securities regulations and the strict insider dealing rules in forcewithin the Company are fully complied with.
Based on these analyses, the Committee makes recommendations asrequired concerning improvements to existing procedures and theintroduction of new ones.
The Audit Committee may be consulted by the Board or by groupmanagement about any issues concerning procedures to controlnon-recurring risks.
6.1.2.2. Remunerations Committee: members and roleThe Board's internal rules stipulate that the RemunerationsCommittee shall have at least three members, who must all beindependent non-executive directors.
The Remunerations Committee is made up of Jean Burelle,Chairman, and Michel Besson. René Thomas, who died in October2003, has not yet been replaced. The Committee is composedexclusively of independent directors.
The role of the Remunerations Committee, as described in theBoard's internal rules, is to:• Make recommendations concerning senior management
compensation.• Make recommendations concerning stock option grants.• Review the compensation policies applied within the group.• Assist the Chairman and the Board with succession planning
issues.• Consider whether the composition of the Board is appropriate and
recommend possible changes.
6.1.2.3. Strategy Committee: members and role The Board's internal rules stipulate that the Strategy Committee shallhave at least five members, selected from among the directors.
The Strategy Committee is chaired by Xavier Fontanet and its othermembers are Philippe Alfroid, Michel Besson, Jean Burelle, PhilippeGermond, Igor Landau, Olivier Pécoux and Bertrand Roy. Five of theeight members are independent directors.
The role of the Strategy Committee, as described in the Board's internalrules, is to regularly review the Company's product, technology,geographic and marketing strategies.
CORPORATE GOVERNANCE
114
6.1.3. Executive Committee
6.1.3.1. Members
Xavier Fontanet, Chairman and Chief Executive OfficerPhilippe Alfroid, Chief Operating OfficerBertrand de Limé, Executive Vice President
Vice President, EuropeClaude Brignon, Vice President, OperationsPatrick Cherrier, Vice President, AsiaDidier Lambert, Vice President, Information SystemsFabienne Lecorvaisier, Chief Financial OfficerOlivier Mathieux, Vice President, Latin AmericaThierry Robin, Vice President, Strategic MarketingHubert Sagnières, President, Essilor of AmericaJean-Luc Schuppiser, Vice President, Research and DevelopmentHenri Vidal, Vice President, Human ResourcesCarol Xueref, Vice President, Legal Affairs
and Corporate Development
6.1.3.2. Role The Executive Committee meets once a month to review the Company'sbusiness performance and all short-term activities. It also draws uptimelines and medium and long-term projections for theimplementation of strategic action plans.
Chaired by Xavier Fontanet, the Committee is made up of theCompany's top corporate and business executives, with either globalresponsabilities – for example lens manufacturing – or regionalresponsibilities (Europe, North America, Latin America, Asia).
6.2. DIRECTORS' INTERESTS
The members of the Board of Directors and the members of theExecutive Committee together hold less than 0.5% of the Company’scapital.
6.2.1. Remuneration of corporate officers The remuneration paid to Xavier Fontanet, Chairman and ChiefExecutive Officer, and Philippe Alfroid, Chief Operating Officer,comprise a fixed portion and a variable portion based on results. Thevariable portion corresponds to a percentage of their fixedremuneration, which may increase if their targets are exceeded, upto a certain limit. The rules applied to determine their variableremuneration payable in 2005 based on 2004 results is as follows:• 100% of the target bonus if the results target is met;• no bonus if results are 20% or more below target;• maximum of 150% of the target bonus, if the results target is
exceeded by 20% or more;• proportional adjustment of the bonus if results are within the 20%
corridor;• the effects of changes in the dollar/euro exchange rate are
neutralized for the calculation of the bonus. The reference result corresponds to consolidated net incomeexcluding the effect of acquisitions.
The gross fixed remuneration paid in 2004 to Xavier Fontanet, for hisservices as Chairman and Chief Executive Officer, by group companiesamounted to €427,387. He also has the use of a company car andwas covered by unemployment insurance paid for by the Company.These benefits in kind are estimated at €2,195 and €14,333respectively. The gross variable remuneration paid to him in 2004 inrespect of 2003 results amounted to €226,432.
The gross fixed remuneration paid in 2004 to Philippe Alfroid, for hisservices as Chief Operating Officer, by group companies, amountedto €387,687. He also had the use of a company car, the value ofwhich is estimated at €2,195. The gross variable remuneration paidto him in 2004 in respect of 2003 results totaled €109,035,including €74,365 received from Essilor International and €34,670*from Bacou-Dalloz.
The variable remuneration paid to Xavier Fontanet and PhilippeAlfroid in respect of 2004 results, will be determined according tothe formula given above, based on the financial statements approvedat the Annual Shareholders' Meeting.
Xavier Fontanet and Philippe Alfroid are also covered bysupplementary pension plans. the contributions paid by Essilor ontheir behalf currently represent 20% of their reference salary, therate specified in Article 39 of the General Tax Code.
(*) Based on an exchange rate of US$1.24615.
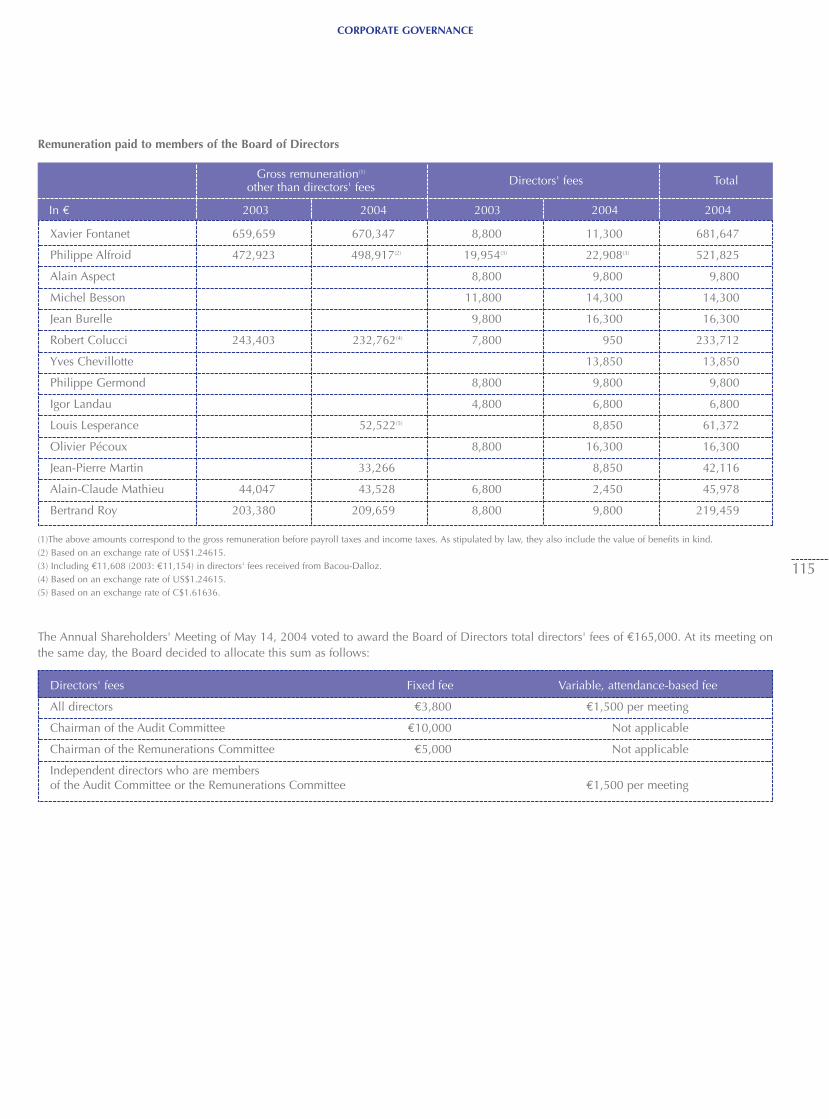
CORPORATE GOVERNANCE
115
In € 2003 2004 2003 2004 2004
Remuneration paid to members of the Board of Directors
Gross remuneration(1)
other than directors' fees Directors' fees Total
(1)The above amounts correspond to the gross remuneration before payroll taxes and income taxes. As stipulated by law, they also include the value of benefits in kind.(2) Based on an exchange rate of US$1.24615.(3) Including €11,608 (2003: €11,154) in directors' fees received from Bacou-Dalloz.(4) Based on an exchange rate of US$1.24615.(5) Based on an exchange rate of C$1.61636.
The Annual Shareholders' Meeting of May 14, 2004 voted to award the Board of Directors total directors' fees of €165,000. At its meeting onthe same day, the Board decided to allocate this sum as follows:
Directors' fees Fixed fee Variable, attendance-based fee
All directors €3,800 €1,500 per meeting
Chairman of the Audit Committee €10,000 Not applicable
Chairman of the Remunerations Committee €5,000 Not applicable
Independent directors who are members of the Audit Committee or the Remunerations Committee €1,500 per meeting
Xavier Fontanet 659,659 670,347 8,800 11,300 681,647
Philippe Alfroid 472,923 498,917(2) 19,954(3) 22,908(3) 521,825
Alain Aspect 8,800 9,800 9,800
Michel Besson 11,800 14,300 14,300
Jean Burelle 9,800 16,300 16,300
Robert Colucci 243,403 232,762(4) 7,800 950 233,712
Yves Chevillotte 13,850 13,850
Philippe Germond 8,800 9,800 9,800
Igor Landau 4,800 6,800 6,800
Louis Lesperance 52,522(5) 8,850 61,372
Olivier Pécoux 8,800 16,300 16,300
Jean-Pierre Martin 33,266 8,850 42,116
Alain-Claude Mathieu 44,047 43,528 6,800 2,450 45,978
Bertrand Roy 203,380 209,659 8,800 9,800 219,459
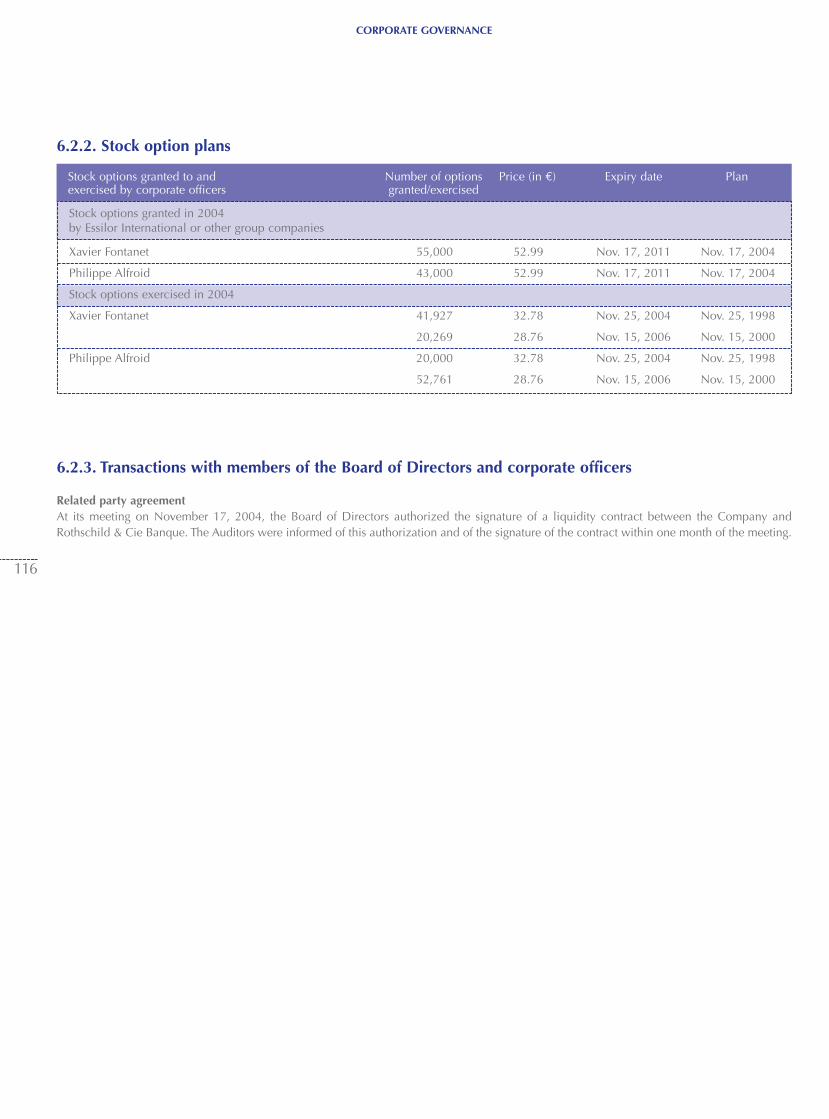
Stock options granted to and Number of options Price (in €) Expiry date Planexercised by corporate officers granted/exercised
CORPORATE GOVERNANCE
116
6.2.2. Stock option plans
6.2.3. Transactions with members of the Board of Directors and corporate officers
Related party agreementAt its meeting on November 17, 2004, the Board of Directors authorized the signature of a liquidity contract between the Company andRothschild & Cie Banque. The Auditors were informed of this authorization and of the signature of the contract within one month of the meeting.
Stock options granted in 2004 by Essilor International or other group companies
Xavier Fontanet 55,000 52.99 Nov. 17, 2011 Nov. 17, 2004
Philippe Alfroid 43,000 52.99 Nov. 17, 2011 Nov. 17, 2004
Stock options exercised in 2004
Xavier Fontanet 41,927 32.78 Nov. 25, 2004 Nov. 25, 1998
20,269 28.76 Nov. 15, 2006 Nov. 15, 2000
Philippe Alfroid 20,000 32.78 Nov. 25, 2004 Nov. 25, 1998
52,761 28.76 Nov. 15, 2006 Nov. 15, 2000
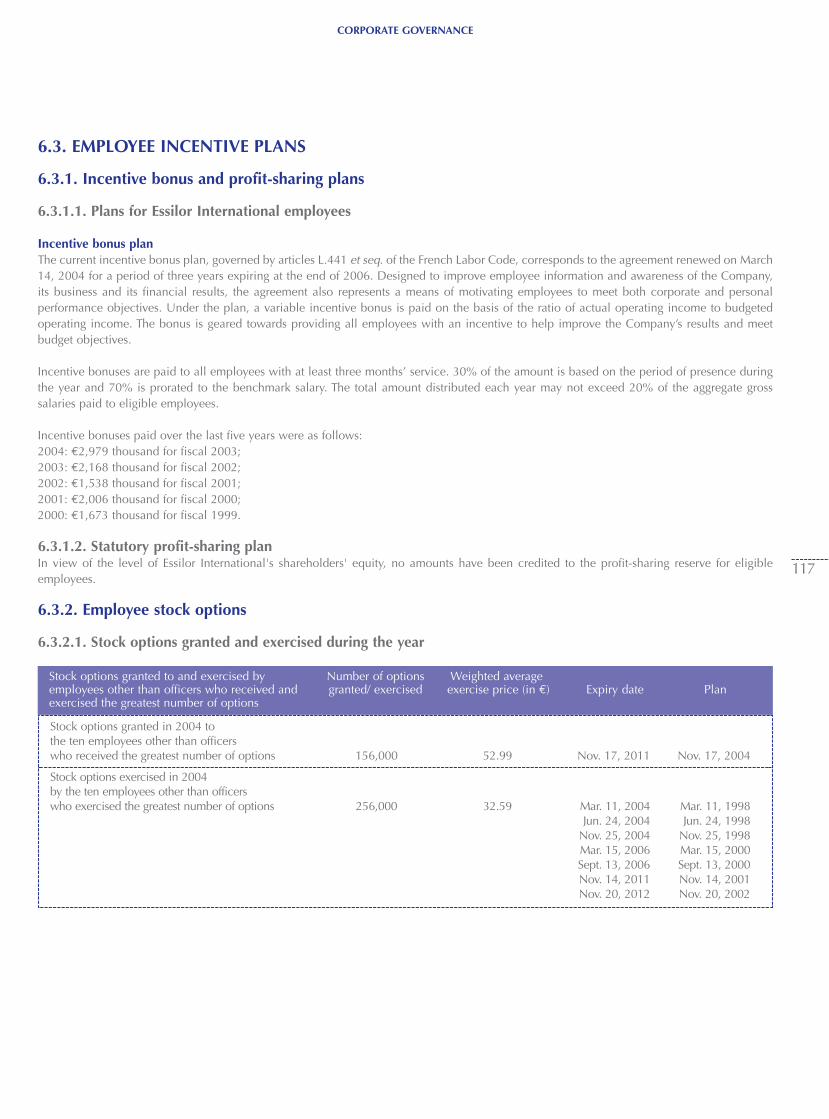
Stock options granted to and exercised by Number of options Weighted average employees other than officers who received and granted/ exercised exercise price (in €) Expiry date Planexercised the greatest number of options
CORPORATE GOVERNANCE
117
6.3. EMPLOYEE INCENTIVE PLANS
6.3.1. Incentive bonus and profit-sharing plans
6.3.1.1. Plans for Essilor International employees
Incentive bonus planThe current incentive bonus plan, governed by articles L.441 et seq. of the French Labor Code, corresponds to the agreement renewed on March14, 2004 for a period of three years expiring at the end of 2006. Designed to improve employee information and awareness of the Company,its business and its financial results, the agreement also represents a means of motivating employees to meet both corporate and personal performance objectives. Under the plan, a variable incentive bonus is paid on the basis of the ratio of actual operating income to budgeted operating income. The bonus is geared towards providing all employees with an incentive to help improve the Company’s results and meetbudget objectives.
Incentive bonuses are paid to all employees with at least three months’ service. 30% of the amount is based on the period of presence duringthe year and 70% is prorated to the benchmark salary. The total amount distributed each year may not exceed 20% of the aggregate gross salaries paid to eligible employees.
Incentive bonuses paid over the last five years were as follows:2004: €2,979 thousand for fiscal 2003;2003: €2,168 thousand for fiscal 2002;2002: €1,538 thousand for fiscal 2001;2001: €2,006 thousand for fiscal 2000;2000: €1,673 thousand for fiscal 1999.
6.3.1.2. Statutory profit-sharing planIn view of the level of Essilor International's shareholders' equity, no amounts have been credited to the profit-sharing reserve for eligibleemployees.
6.3.2. Employee stock options
6.3.2.1. Stock options granted and exercised during the year
Stock options granted in 2004 to the ten employees other than officers who received the greatest number of options 156,000 52.99 Nov. 17, 2011 Nov. 17, 2004
Stock options exercised in 2004 by the ten employees other than officers who exercised the greatest number of options 256,000 32.59 Mar. 11, 2004 Mar. 11, 1998
Jun. 24, 2004 Jun. 24, 1998Nov. 25, 2004 Nov. 25, 1998Mar. 15, 2006 Mar. 15, 2000Sept. 13, 2006 Sept. 13, 2000Nov. 14, 2011 Nov. 14, 2001Nov. 20, 2012 Nov. 20, 2002
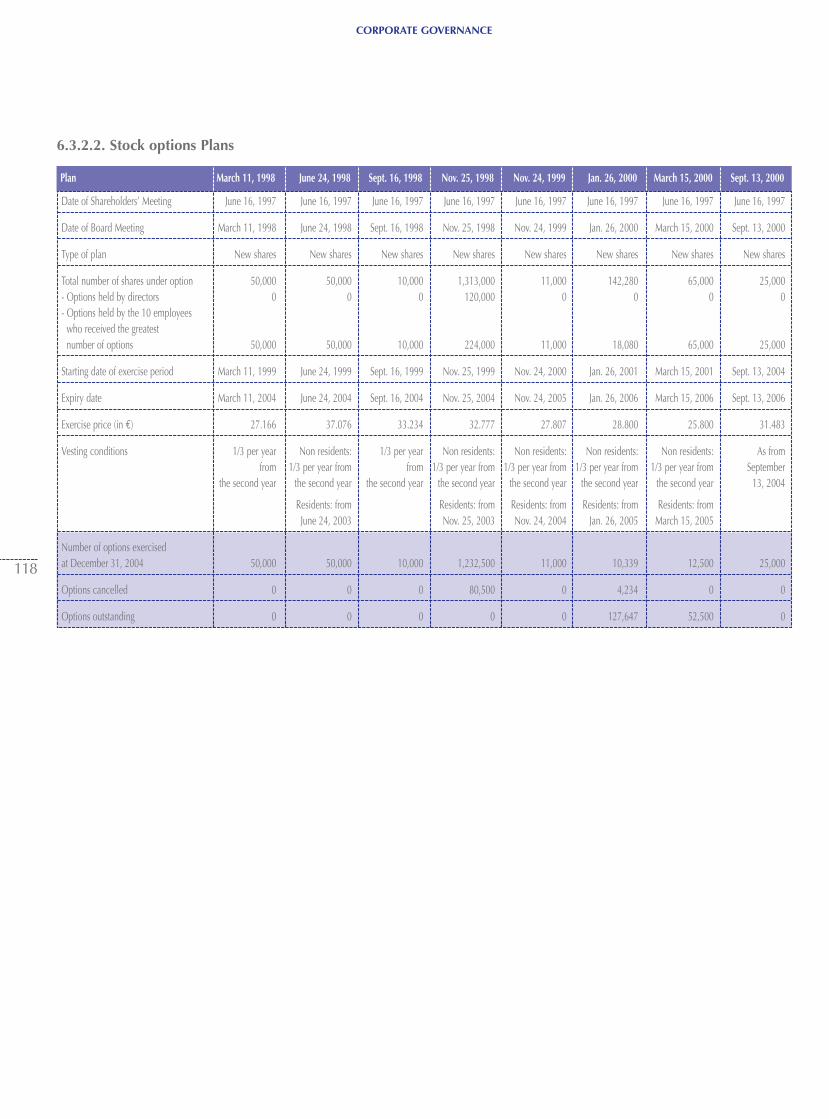
Plan March 11, 1998 June 24, 1998 Sept. 16, 1998 Nov. 25, 1998 Nov. 24, 1999 Jan. 26, 2000 March 15, 2000 Sept. 13, 2000
CORPORATE GOVERNANCE
118
Date of Shareholders’ Meeting June 16, 1997 June 16, 1997 June 16, 1997 June 16, 1997 June 16, 1997 June 16, 1997 June 16, 1997 June 16, 1997
Date of Board Meeting March 11, 1998 June 24, 1998 Sept. 16, 1998 Nov. 25, 1998 Nov. 24, 1999 Jan. 26, 2000 March 15, 2000 Sept. 13, 2000
Type of plan New shares New shares New shares New shares New shares New shares New shares New shares
Total number of shares under option 50,000 50,000 10,000 1,313,000 11,000 142,280 65,000 25,000- Options held by directors 0 0 0 120,000 0 0 0 0- Options held by the 10 employees
who received the greatest number of options 50,000 50,000 10,000 224,000 11,000 18,080 65,000 25,000
Starting date of exercise period March 11, 1999 June 24, 1999 Sept. 16, 1999 Nov. 25, 1999 Nov. 24, 2000 Jan. 26, 2001 March 15, 2001 Sept. 13, 2004
Expiry date March 11, 2004 June 24, 2004 Sept. 16, 2004 Nov. 25, 2004 Nov. 24, 2005 Jan. 26, 2006 March 15, 2006 Sept. 13, 2006
Exercise price (in €) 27.166 37.076 33.234 32.777 27.807 28.800 25.800 31.483
Vesting conditions 1/3 per year Non residents: 1/3 per year Non residents: Non residents: Non residents: Non residents: As from from 1/3 per year from from 1/3 per year from 1/3 per year from 1/3 per year from 1/3 per year from September
the second year the second year the second year the second year the second year the second year the second year 13, 2004
Residents: from Residents: from Residents: from Residents: from Residents: from June 24, 2003 Nov. 25, 2003 Nov. 24, 2004 Jan. 26, 2005 March 15, 2005
Number of options exercised at December 31, 2004 50,000 50,000 10,000 1,232,500 11,000 10,339 12,500 25,000
Options cancelled 0 0 0 80,500 0 4,234 0 0
Options outstanding 0 0 0 0 0 127,647 52,500 0
6.3.2.2. Stock options Plans
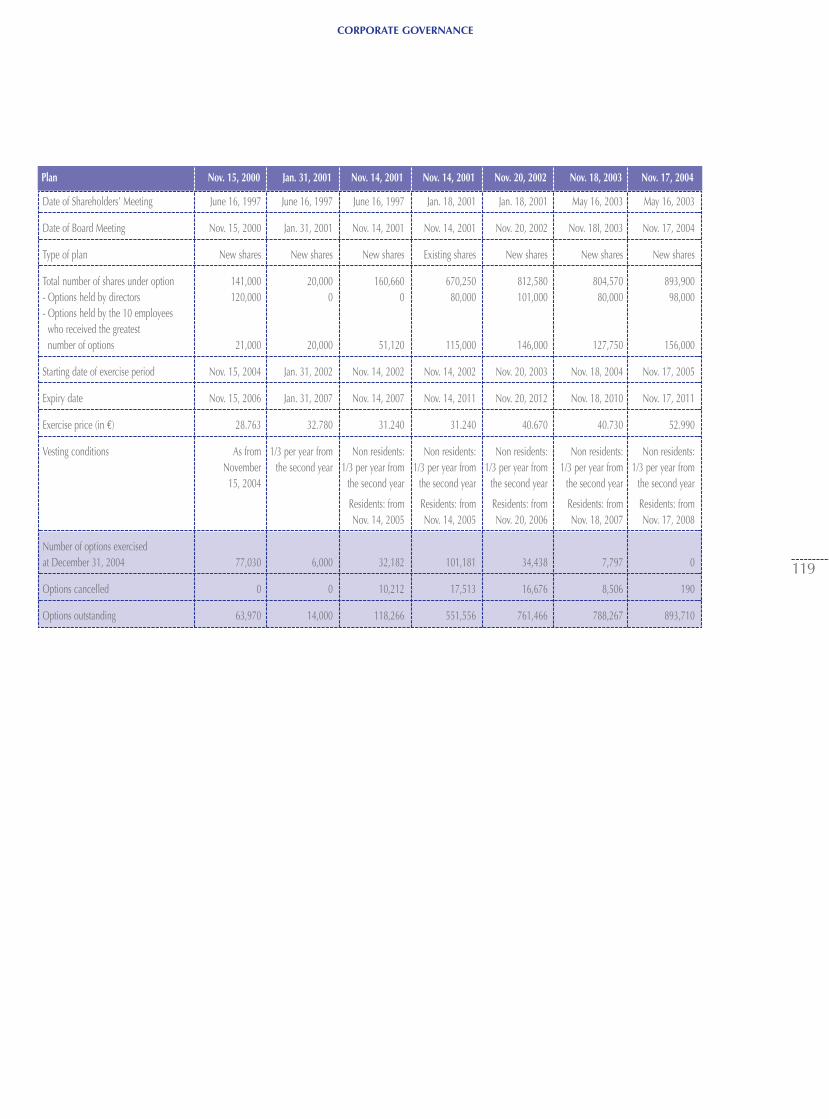
Plan Nov. 15, 2000 Jan. 31, 2001 Nov. 14, 2001 Nov. 14, 2001 Nov. 20, 2002 Nov. 18, 2003 Nov. 17, 2004
CORPORATE GOVERNANCE
119
Date of Shareholders’ Meeting June 16, 1997 June 16, 1997 June 16, 1997 Jan. 18, 2001 Jan. 18, 2001 May 16, 2003 May 16, 2003
Date of Board Meeting Nov. 15, 2000 Jan. 31, 2001 Nov. 14, 2001 Nov. 14, 2001 Nov. 20, 2002 Nov. 18I, 2003 Nov. 17, 2004
Type of plan New shares New shares New shares Existing shares New shares New shares New shares
Total number of shares under option 141,000 20,000 160,660 670,250 812,580 804,570 893,900- Options held by directors 120,000 0 0 80,000 101,000 80,000 98,000- Options held by the 10 employees
who received the greatest number of options 21,000 20,000 51,120 115,000 146,000 127,750 156,000
Starting date of exercise period Nov. 15, 2004 Jan. 31, 2002 Nov. 14, 2002 Nov. 14, 2002 Nov. 20, 2003 Nov. 18, 2004 Nov. 17, 2005
Expiry date Nov. 15, 2006 Jan. 31, 2007 Nov. 14, 2007 Nov. 14, 2011 Nov. 20, 2012 Nov. 18, 2010 Nov. 17, 2011
Exercise price (in €) 28.763 32.780 31.240 31.240 40.670 40.730 52.990
Vesting conditions As from 1/3 per year from Non residents: Non residents: Non residents: Non residents: Non residents:November the second year 1/3 per year from 1/3 per year from 1/3 per year from 1/3 per year from 1/3 per year from
15, 2004 the second year the second year the second year the second year the second year
Residents: from Residents: from Residents: from Residents: from Residents: fromNov. 14, 2005 Nov. 14, 2005 Nov. 20, 2006 Nov. 18, 2007 Nov. 17, 2008
Number of options exercised at December 31, 2004 77,030 6,000 32,182 101,181 34,438 7,797 0
Options cancelled 0 0 10,212 17,513 16,676 8,506 190
Options outstanding 63,970 14,000 118,266 551,556 761,466 788,267 893,710
CORPORATE GOVERNANCE
120
6.4. CHAIRMAN'S REPORT ON INTERNAL CONTROL
To the Shareholders
In application of Article 117 of the Financial Security Act (Act no. 2003-706) and Article L.225-37, paragraph 6, of theCommercial Code, I present below my report describing:• the preparation and organization of Board of Directors meetings
during the year ended December 31, 2004;• the Company's internal control procedures;• any restrictions on the powers of the Chief Executive Officer decided
by the Board of Directors.in order to help shareholders understand our Company'smanagement processes and methods.
6.4.1. Preparation and organization of meetingsof the Board of Directors
Frequency of Board MeetingsIn 2004, the Board of Directors met five times. On average, meetingslasted was two-and-a-half hours and the average attendance ratewas more than 86%. Four of the meetings were held at theCompany's headquarters, on the dates set in the timetable drawn upin 2003 (March 3, July 7, September 8 and November 17), and thefifth meeting took place at the Paris Stock Exchange, Palais de laBourse, following the Annual Shareholders' Meeting on May 14.
Calls to meetingIn accordance with the Board's internal rules, calls to meeting weresent to the directors by post, at least seven days before each meeting. The Auditors were asked to attend the Board meetings called to review the interim and annual financial statements, asprovided for in Article L.225-238 of the Commercial Code.
Information given to directorsFor each Board meeting, all the documents needed to inform thedirectors about the agenda and the matters to be reviewed by theBoard were either enclosed with the call to meeting or sent or givento the directors a reasonable period of time before the meeting.
Minutes of Board meetings The draft minutes of Board meetings were sent to all directors at thelatest with the call to the next meeting.
Committees of the BoardIn 1997, based on a recommendation by the Chairman, Essilor setup three Committees of the Board: the Audit Committee, theRemunerations Committee and the Strategy Committee. The rulesgoverning these Committees' membership and terms of referenceare set out in the internal rules adopted on November 18, 2003,which are regularly updated.
• Audit CommitteeThe Audit Committee met on September 6, 2004 to review the interim consolidated financial statements and on March 7, 2005 toreview the annual consolidated financial statements. The ChiefFinancial Officer and the external Auditors attended both of thesemeetings, to present the accounts and answer the Committee's questions. The latest information on the estimated effect of the transition to IFRS rules on the accounts was also discussed on bothoccasions.The Committee also met on February 1, 2005 to review theCompany's currency hedging strategy and the main effects ofapplying IAS 39. It also reviewed the results of internal audits carried out in 2004 and the 2005 internal audit plan.
The Chairman of the Committee had private meetings with the headof Internal Audit in July and September 2004 to obtain informationabout the organization of internal audits carried out at EssilorInternational and measures to be taken to comply with the FinancialSecurity Act.
• Remunerations Committee The Remunerations Committee met once during the year, onNovember 3, to review the 2005 compensation of corporate officersand shareholder-approved management stock option plans. TheCommittee presented its report to the Board of Directors at themeeting on November 17, 2004, at which the details ofmanagement remuneration packages were decided.
• Strategy CommitteeThe Strategy Committee met twice in 2004 to discuss the Company'sexternal growth strategy and to review in detail the quarterlyconsolidated results (unpublished). The Committee also reviewedwith the Vice President, Operations the Company's performance inthe areas of production, logistics, industrial engineering andprescription lenses.
Matters submitted to the Board and related decisionsThe matters examined by the Board during 2004 and the decisionstaken covered a wide range of areas, including:• the Company's business performance;• strategic choices;• the interim and annual financial statements, financial forecasts
and projections;• reports to shareholders;• acquisitions and other strategic projects;• internal restructuring plans;• the IAS rules;• agreements involving directors to be authorized and disclosed;• the amount of guarantees given by the Company;• employee share issues and matching payments by the Company;• stock option grants;• the share buyback program;• re-election of directors and decision on whether to combine or
separate the functions of Chairman and Chief Executive Officer;• management remuneration;
CORPORATE GOVERNANCE
121
• allocation of directors' fees;• cancellation of 800,000 shares held in treasury stock;• corporate governance issues, including transactions in the
Company's shares by directors and officers;• employee-related issues;• press articles and financial analysts' research reports.
Additional information is provided in Section 6.1 – Corporategovernance of this reference document.
6.4.2 Report on Essilor International S.A. internalcontrol procedures
Internal control objectives• Ensure that all acts of management, all transactions, and the
behaviour of all Company employees, comply with the generalstrategic guidelines established by the Board of Directors, withapplicable laws and regulations, and the Company's corporatevalues, standards and internal rules.
• Ensure that all accounting, financial and management informationreported to the Board of Directors, the regulatory authorities,shareholders or the public gives a true and fair view of theCompany's business and financial position.
• Ensure that the Company's internal policies and proceduresprovide reasonable assurance that the business is managedefficiently and effectively.
One of the objectives of a system of internal control is to preventand manage business, financial and legal risks, including the risk oferrors and fraud, to which the Company and its subsidiaries areexposed in France and abroad. However, no system of controls canprovide an absolute guarantee that all such risks have beencompletely eliminated or entirely brought under control.
At Essilor, the system of internal control is strengthened by a cultureof frank discussion and integrity, as well as by our core values oftrust, a sense of co-destiny, responsiveness, teamwork and consistentencouragement of ethical behavior. These values are instrumental inguaranteeing high standards of internal control.
The charter of the Valoptec association, which is made up of activeand retired Essilor employees, states that the association's purpose isto "promote the adoption by group companies of sound businesspractices and human resources management policies." The charterupholds the values of respect and trust among individuals.Employees are not asked to sign the charter when they join Essilor,because what it describes is a general mind-set. Those employeeswho are members of Valoptec hold around 15% of the Company'svoting rights.
Continuous adherence to these values is guaranteed by the stabilityof the management team and generally low staff turnover ratesthroughout the organization.
The Board of Directors and senior management consider that aneffective system of internal control is of critical importance and thisis borne out by the Audit Committee's attention to internal controlissues. Senior management defines the general principles andensures that they are fully implemented within the Company.Support is provided by the various staff and line executives who aremembers of the Executive Committee, based on their respectiveareas of competence and according to an organization structure bycountry, by region and by technical area. The Chief Financial Officerand the Vice-President, Legal Affairs, who have front-lineresponsibility for internal control, are also members of the ExecutiveCommittee.
Overall organization of internal controlInternal control is a process that ensures that the standards andprocedures defined at corporate level are consistent with thestrategies run by senior management. The departments with specificresponsibility for internal control are as follows:
• Internal Audit: the Internal Audit department reports to theChairman and Chief Executive Officer. It is organized on adecentralized basis, with teams based at Company headquarters(responsible for auditing corporate units and operations in Europeand South America), the United States (covering North America) andSingapore (covering the Asia-Pacific region).
The internal auditor’s main role is to ensure that internal controlprocedures are properly applied throughout the organization, bychecking that practices comply with internal rules and procedures,verifying the reliability of accounting information and reviewing theefficiency of internal processes.
Internal audits are planned on the basis of identified process risks,according to a cycle covering all subsidiaries, with special auditsadded to the programme at the request of Company seniormanagement or a regional Vice President. Certain audits are carriedout by multidisciplinary teams comprising internal auditors, tax andlegal specialists. An internal audit program is drawn up at thebeginning of each year and submitted to Company seniormanagement and the Audit Committee for approval.
The same methodology is applied in all regions and on completionof each audit, a report is drawn up setting out the internal auditors'findings and recommendations. The internal auditors ensure that therecommendations are acted upon, by reviewing implementation ofthe action plans decided jointly with the management of the auditedunits. A copy of their report is given to the management of theaudited unit, Company senior management and the Chief FinancialOfficer, as well as to the heads of the operating and corporate unitsconcerned. Each year, a summary of the internal auditors' findingsand recommendations is presented to the Chairman of the Boardand the Audit Committee.
• Consolidation: the Consolidation Department is responsible fordefining consolidation rules and methods complying withapplicable regulations, to be applied throughout the Company,and preparing quarterly consolidated income statements andbalance sheets in accordance with the Company's generalpolicies. It also leads and coordinates the financial reportingactivities of the consolidated companies. It produces theconsolidated financial statements based on the accounts of thevarious subsidiaries, as adjusted to comply with Essilor accountingpolicies, and analyses quarterly accounting data and balancesheets for each legal entity included in the scope of consolidation.Regular reconciliations of statutory and management reportingdata help to guarantee the consistency of financial informationand also to swiftly identify and resolve any errors orinconsistencies.
The Consolidation Department informs all consolidatedcompanies on a timely basis of new and amended rules affectingthe preparation of financial statements. In this regard, it has playeda leading role in the IFRS transition project, at corporate level andwith all companies included in the scope of consolidation. A workgroup led by the Consolidation Department and comprisingrepresentatives of the Finance Department, the ConsolidationDepartment, Corporate Treasury, Corporate ManagementAccounting and Internal Audit was tasked with adapting theCompany's accounting policies to comply with IFRS anddetermining the effects of the transition on the consolidatedfinancial statements. The transition principles and thedetermination of the related effects were discussed by the AuditCommittee and reviewed by the Auditors. Detailed informationabout the transition to IFRS is presented elsewhere in this AnnualReport
• Management Accounting: each group unit has its ownmanagement accounting team responsible for analysing the unit'sperformance, with guidance from the regional or divisionalmanagement accounting department. To ensure that managementaccounting information is reliable, Corporate ManagementAccounting oversees a network of management accountants,provides decision-making guidance and monitors the monthlymanagement results of each group entity and business unit. Itproduces the monthly consolidated management accounts, aswell as the consolidated budget, performs monthly varianceanalyses and checks the consistency of transfer prices. Themanagement accountants report to both line and staffmanagement.
Reporting to the Chief Financial Officer, Corporate ManagementAccounting also analyses, monitors and validates the financialaspects of proposed business acquisitions submitted to the Boardof Directors for approval.
• Sustainable Development: this department is responsible foranticipating and warning management about foreseeable changesin the business and the economic, human and environmentalconsequences of the Company's various initiatives, in order todevise appropriate responses. The department also publishes non-financial information.
• Workplace Health and Safety: reporting to Human Resources, thisdepartment is responsible for setting up an appropriate organizationstructure to implement and improve Company-wide policies toprevent risks and achieve high standards of workplace health andsafety, as well as high environmental standards.
• Legal Affairs: the Legal Affairs department offers advice andassistance to all departments of the Company and its subsidiariesin preventing claims and litigation. It is responsible for negotiatingand drafting contracts and other legal documents relating inparticular to business acquisitions, as well as for ensuring that theCompany's intellectual property is protected. It also plays a keyrole in legal and regulatory compliance programmes. It ensuresthat senior management are aware of potential liability risks andproposes legal solutions that contribute to strengthening thecontrol environment. It provides answers to all legal questionsraised by the various departments of the company in aninternational legal and regulatory environment which is bothcomplex and burdensome. It ensures that the Company fulfils itscontractual obligations. The insurance department, which is partof Legal Affairs, implements a policy that combines prevention, inthe form of regular site visits and audits, with protection, in theform of international insurance programmes.
• Quality: this department is responsible for establishing andregularly upgrading a consistent and coherent quality systemdesigned to ensure that the products delivered to customers aresatisfactory in all respects (product quality, lead time, service andcost).
• Cash Management: this department manages the Company's cashposition, currency and interest rate hedging programmes,financing and liquidity programmes, and banking relations. It alsoprovides advice and assistance to subsidiaries on all mattersrelated to cash management and changes in their cash position. Itis working alongside the Consolidation Department to prepare thetransition to IFRS in the specific area of currency hedging.
CORPORATE GOVERNANCE
122
CORPORATE GOVERNANCE
123
Internal control standards and proceduresa) The Group Financial Manual (GFM) sets out mandatory policiesand procedures applie to all Essilor units and departments such aspurchasing, communication, finance, legal affairs, operations, R&Dand human resources. The procedures are organized by process,including fixed assets, inventories, sales/receivables, treasury,purchasing, on and off-balance sheet commitments, tax, R&D andstart-up costs, production accounting, fraud prevention, insurance,personnel and human resources, legal affairs and consolidation.Available for on-line consultation on the Company's intranet, inFrench and English, the GFM provides essential guidelines for thepreparation of accounts and to maintain an appropriate controlenvironment in all units. It is regularly updated to take changes inregulations and the Company's needs into account, and toincorporate new international standards applicable to the Company.In 2004, the main updates concerned the incorporation of IFRS andof certain control procedures recommended by the internal auditors.Each unit's finance director is responsible for ensuring that theserules and procedures are fully and properly applied.
b) The quality and reliability of financial information is guaranteedby the use of an integrated statutory and consolidated reportingsystem, “Figures”. Local accounting data are entered in the systemeither directly or via an interface, according to a detailed reportingtimetable issued by Corporate Finance at the beginning of each year. The “Figures” manual includes a glossary stipulating the informationto be put in for each module in accordance with Company rules(income statement, balance sheet, appendix, treasury, inventory,capital expenditure) and defining accounting flows and businesssegments. The glossary and all reporting instructions are available forconsultation on the Company's intranet. They are updated each timea change is made and when new standards are adopted (forexample, IFRS).Local finance managers are responsible for ensuring that the datareported in “Figures” comply with Company accounting policiesand procedures.The use of “Figures” guarantees consistent accounting treatment oftransactions and enables us to exercise close control over thepreparation of the accounts of the various units.
c) We have numerous information systems to manage, monitor,analyse and control both upstream activities (production/logistics)and downstream activities (prescription/distribution). In addition, aninternational intranet charter has been drawn up to coordinate thecirculation and sharing of information via Essilor’s intranet.
d) Essilor is included in the FTSE4GOOD Europe sustainabledevelopment index.
e) The Company has a charter in France and the United States for theprevention of all forms of illegal discrimination. This charter helps tostrengthen our vigilance against all situations that go against ourfundamental values.
f) All our plants are ISO 9001-certified; 13 plants are also ISO14001-certified and 7 are OHSAS 18001-certified.
g) We have drawn up general conditions of sale and purchase, acode of ethics governing transactions in the Company's shares(which is regularly updated to take into account new regulations andcase law), procedures dealing with commitments and amemorandum on the application of the provisions of the FinancialSecurity Act concerning services supplied by the Auditors.
Description of internal control systemsInternal controls are based on the organizations of structure andspecific methodologies. They concern all Essilor entities and aremonitored by individuals or structures responsible for controllingactivities in accordance with Company standards and procedures.They enable us to classify the various strategic risks andopportunities in order to set priorities.
Each year, our main risk exposures (market risk, production risk,environmental risk) are analysed in connection with the preparationof on rolling 5-year business plan. The overall risk managementstrategy is developed based on analyses performed by eachdepartment of those specific risks associated with its activities. Weare capable of reacting swiftly to any change in circumstances orany incident that could severely affect our ability to fulfill ourobjectives, by adjusting our overall strategy or the strategy followedin a given area. At local level, identifying risks is the responsibilityof regional vice-presidents and subsidiaries management. Allinformation about risks and related protection is reported to themembers of the Executive Committee.
We have some 180 legal entities, the majority of which are directsubsidiaries of Essilor International. Levels of authority andaccountability are clearly defined for each management level, withvery strong cross-functional relations. Certain Corporate functions,such as Purchasing, Internal Audit, Management Accounting, LegalAffairs and Human Resources, have a dual reporting relationship,with local management and with the corporate Vice President whoheads the department concerned. On the operations side, each plantmanager reports to the regional Production Director who in turnreports to the Vice President, Operations. On the sales side, themanager of each subsidiary reports to the regional Vice President.
The various reporting packages and external controls performed ona monthly or quarterly basis, help us to monitor and controlsubsidiaries activities in the areas of finance, sales, workplaceaccidents, workplace health and safety audits, APAVE inspections,ISO certification, sustainable development, logistics (monthlyreporting), insurance claims, etc.
Internal control procedures for the production and processingof financial and accounting informationAs explained above, each operating division draws up its own five-year business plan setting strategic objectives based on the overallstrategy decided by the Company's senior management. Thebusiness plan submitted to senior management reflects thesestrategic objectives and the related action plans. The key points ofthe business plan are presented to the Strategy Committee.
The budgeting process begins in July, with significant input from theregional units which provide analyses of transaction volumesbetween the central marketing unit, the logistics unit and theregions. Each entity's budget is prepared on the basis of budgetobjectives and guidelines issued by the regional or operatingdivision, and on the entity's own strategy for the coming year.
The budgets are presented to the Company's senior management atbudget review meetings held at the end of the year. The consolidatedbudget is produced at the end of November and the final budget isissued in December.
The annual budget is updated in August of the budget year and onceagain in November, when the following year's budget is prepared.
The process, which concerns all Essilor units, is led and monitoredby Corporate Management Accounting, in order to ensure that allbudgets are prepared on the same basis and are consistent with theCompany's overall strategic objectives.
Actual performance is analysed on a monthly basis via the “Figures“reporting system, which is used not only to perform managementanalyses but also for the statutory consolidation. All units aremanaged by the system, including entities that are not consolidated,to maintain strict control over accounting and financial information.
For statutory consolidation purposes, balance sheet data arereported on a quarterly basis, in addition to the monthly reporting.The Consolidation Department checks the figures entered in thesystem and ensures that they comply with Essilor accountingpolicies.
The aims of consolidation procedures are to:• guarantee compliance with applicable rules (IFRS, company
policies, AMF guidelines, etc.) through the implementation ofgeneral procedures and the issuance of specific consolidationinstructions to the various entities;
• provide assurance concerning the reliability of financialinformation, through the execution of controls programmed intothe system or performed by the various finance departments(management accounting, consolidation, treasury) within therequired timeframes;
• guarantee data integrity through high-levels systems security.
Specific instructions are issued to reporting entities before eachconsolidation exercise, including a detailed reporting timetable.
The procedures for monitoring off-balance sheet commitments andassets are included in the GFM procedure manual. They stipulate thetypes of commitments to be recorded on- and off-balance sheet. Fullinformation about these commitments is provided by the reportingsystem.
The budgeting process and consolidation procedures enable us toconstantly monitor the performance of the various units and toswiftly identify any variances from budget in order to takeimmediate corrective action.
All the procedures set out in the GFM manual apply to all Essilorcompanies, whether or not they are consolidated, and the internalauditors' work programmes include checking that the proceduresare implemented. The external Auditors review accounting andinternal control systems in order to plan their audit engagementsand determine their audit approach. The Audit Committee meetstwice a year to review annual and interim financial statements. Themeetings are attended by the Chief Financial Officer and theexternal Auditors, who present the accounts and discuss with theCommittee all significant transactions and the main accountingoptions selected to address potential risks.
External Auditors are responsible for expressing an opinion as towhether the financial statements have been properly prepared andgive a true and fair view of the assets and liabilities, financialposition and results of operations of Essilor, in accordance withgenerally accepted accounting principles. The accounts of allconsolidated and non-consolidated entities are audited by localauditors, most of whom are members of the networks of theaccounting firms that audit the Company's consolidated accounts.
CORPORATE GOVERNANCE
124
CORPORATE GOVERNANCE
125
Work in 2004 and future developmentsTo comply with the requirements of the Financial Security Act, welaunched a phased project to assess the level of compliance of ourinternal procedures. The project began at the end of 2003 with areview of the control environment and was continued in 2004 withthe introduction of a self-assessment process at certain entities,overseen by the Internal Audit Department.
A description of the main processes for the production of financialinformation was drawn up at the beginning of 2004. The associatedrisks and the controls required to manage them were identified forthe first three processes (purchases/sales/inventories) andquestionnaires describing some one hundred control points for eachprocess were sent to all consolidated subsidiaries. As part of theiraudit procedures, internal auditors verify the quality of the self-assessment process and the action plans implemented for anycontrol points that require improvement. A summary by subsidiaryis sent to each subsidiary concerned and a Company-level summaryis presented to senior management and to the Audit Committee.
The self-assessment procedure will continue in 2005, with theaddition of three new processes (reporting/cash management/fixedassets). This approach, which forms part of a process of constantquality improvement, helps us to guarantee the quality andreliability of financial information by strengthening proceduresapplied throughout the organization on a consistent basis.
All the identified processes will be analysed in the coming years,ultimately allowing us to report conclusively on the quality ofinternal control.
6.4.3. Powers of the Chief Executive Officer
At its meeting on May 14, 2004, the Board of Directors decided for the second time not to separate the functions of Chairman and ChiefExecutive Officer and not to place any restrictions on the Chairman and Chief Executive Officer's executive powers
Charenton, March 9, 2005
Xavier Fontanet
ASSETS AND LIABILITIES – FINANCIAL POSITION – RESULTS
126
6.4.4. Statutory Auditors’ Report on the Chairman’s Special Report
(Prepared in accordance with article L.225-235 of the Commercial Code, on the report prepared by the Chairman of the Board of Directors ofEssilor International on the internal control procedures relating to the preparation and processing of financial and accounting information.)
This is a free translation into English of the Statutory Auditors’ report issued in the French language and is provided solely for the convenienceof English speaking readers. This report should be read in conjunction with, and construed in accordance with, French law and professionalauditing standards applicable in France.
To the Shareholders,
In our capacity as statutory auditors of Essilor International, and in accordance with the final paragraph of article L.225 235 of the CommercialCode, we report to you on the report prepared by the Chairman of your company in accordance with article L.225-37 of the Commercial Codefor the year ended December 31, 2004.
It is the responsibility of the Chairman to give an account, in his report, notably of the conditions in which the duties of the Board of Directorsare prepared and organized and the internal control procedures in place within the Company. It is our responsibility to report to you ourobservations on the information set out in the Chairman's report on the internal control procedures relating to the preparation and processingof financial and accounting information.
We performed our procedures in accordance with professional guidelines applicable in France. These require us to perform procedures to assessthe fairness of the information set out in the Chairman's report on the internal control procedures relating to the preparation and processing offinancial and accounting information. These procedures notably consisted of:• Obtaining an understanding of the objectives and general organization of internal control, as well as the internal control procedures relating
to the preparation and processing of financial and accounting information, as set out in the Chairman's report.• Obtaining an understanding of the work performed to support the information given in the report.
On the basis of these procedures, we have no matters to report in connection with the information given on the internal control proceduresrelating to the preparation and processing of financial and accounting information, contained in the Chairman of the Board’s report, preparedin accordance with article L.225-37 of the Commercial Code.
Paris, March 10, 2005
The Statutory Auditors
PricewaterhouseCoopers Audit Cabinet Dauge et AssociésJacques Denizeau Gérard Dauge
Concept-Design: Terre de SienneEnglish adaptation: ICC (Paris)
Photos: Laurent Monlaü/Rapho.
Produced by Essilor International Investor Relations Department
Phone: +33 (0) 1 49 77 42 16
Fax: +33 (0) 1 49 77 43 24
E-mail: [email protected]
www.essilor.com
2004REFERENCE DOCUMENT

ESSILOR INTERNATIONAL
Compagnie Générale d’Optique
147, rue de Paris
94220 Charenton-le-Pont
France
Phone: +33 (0) 1 49 77 42 24 - Fax: +33 (0) 1 49 77 44 20
www.essilor.com
A French corporation with fully paid-up capital of €36,158,669.05
Registred under the number 712 049 618 in Créteil, France.
2004
REF
EREN
CE
DO
CU
MEN
T ES
SILO
R