Embed Size (px)
Citation preview
STRATEGIC TRANSPORT PROJECTS REVIEW INTERVENTION 14: FORTH REPLACEMENT CROSSING
PUBLIC TRANSPORT STRATEGY
January 2010
Public Transport Strategy 1. The public transport strategy in support of the Forth Replacement Crossing seeks to achieve contributions against the planning objectives of the project, building upon a series of schemes and measures recommended within the Strategic Transport Projects Review and those being promoted/ developed by adjacent local authorities and SEStrans. Background 2. The planning objectives for the Forth Replacement Crossing emphasised the need to maintain levels of service for all traffic at 2006 levels, provide opportunities for sustainable transport modes and to support the Government’s purpose of sustainable economic growth. Development of the crossing proposals has developed the scheme from a single replacement crossing with additional multi-modal capacity to a managed crossing scheme (MCS) making use of both the existing and new bridges. The full planning objectives of the Forth Replacement Crossing Study (Report 5) are: • Maintain cross-Forth transport links for all modes to at least the level of service
offered in 2006; • Connect to the strategic transport network to aid optimisation of the network as a
whole; • Improve reliability of journey times for all modes; • Increase travel choices and improve integration across modes to encourage
modal shift of people and goods; • Improve accessibility and social inclusion; • Minimise the impacts of maintenance on the effective operation of the transport
network; • Minimise the impact on people, the natural and cultural heritage of the Forth area;
and • Support sustainable development an economic growth. 3. The existing Forth Road Bridge will, once the replacement crossing is available, be used as a public transport corridor in addition to being available for the significant maintenance that is required of the structure. By removal of the vast majority of the traffic from the existing Bridge, the four lanes may be managed to ensure continual use as a public transport corridor whilst such maintenance is carried out. 4. As part of the Managed Crossing Scheme (MCS) the approach roads to the Forth have been designed to allow a variety of uses, paths and alternatives for all travellers. This includes significant enhancements to the traffic arrangements on the north side
1
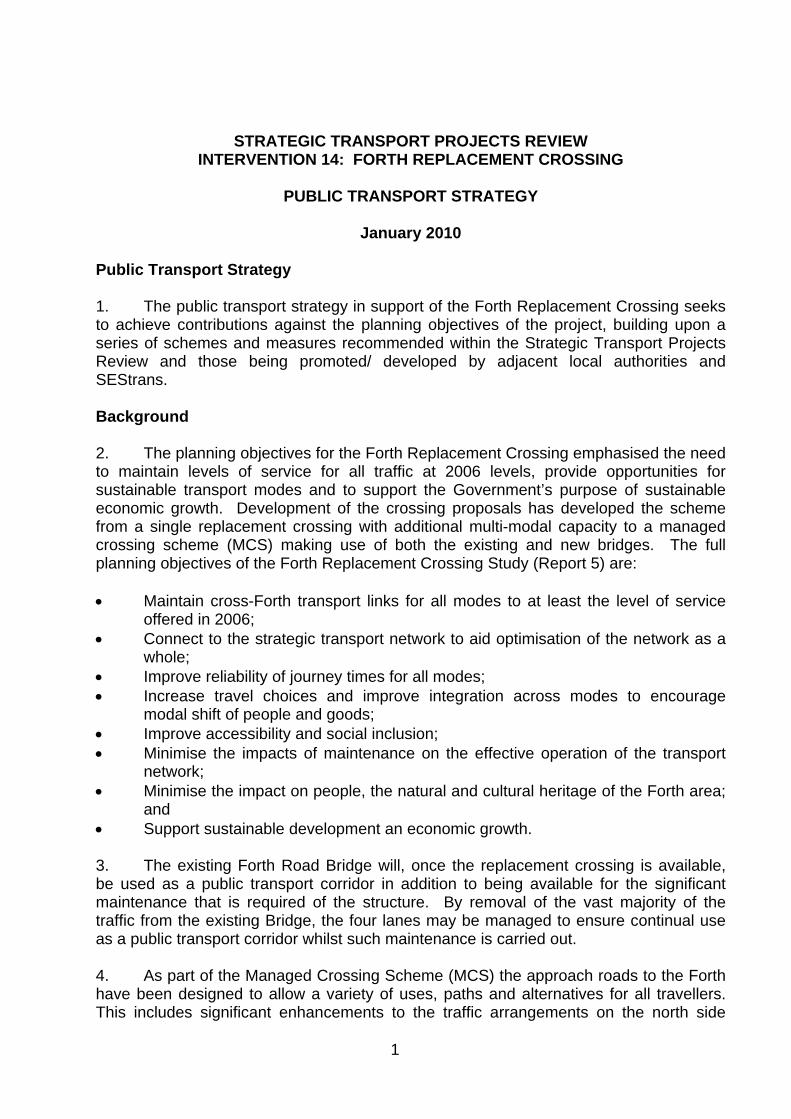
together with a modified Ferrytoll Park and Ride entrance and bus plaza whilst on the south side the opportunity will exist to provide priority for buses on the B800 and links to the A90. A copy of the infrastructure proposed as part of the MCS is shown in Annex A Analysis of Cross-Forth Demand 5. It is well understood that demand for travel across the Forth exceeds capacity in the peak period, resulting in both queuing and the phenomenon of peak spreading. Looking to the future, the land use plans of the adjacent local authorities indicate a continued increase in the demand for travel across the Forth in both directions. Whilst broadly the origins and destinations remain similar to those at present, there is considerable growth in the West Edinburgh and West Lothian areas. 6. Annex B sets out the analysis undertaken to determine the potential for public transport to cater for forecast car based demand in 2022. In undertaking this analysis assumptions have been made on the contributions of the rail projects identified within the STPR affecting cross-Forth demand. This includes the Edinburgh – Glasgow Rail Improvements Programme and its Gogar station to serve Edinburgh Airport. These measures anticipate an increase in rail trips over the Forth of between 4% and 15%, however, there is no significant reduction in car trips over the Forth. 7. Approximately 10% of cross Forth trips in 2005 were made by bus: due to the distribution of growth, the assumption of fixed bus services and the relative attractiveness of the car in the strategic model, this is expected to drop to 5% by 2022. The analysis demonstrates that there is a significant unmet demand for travel across the forth, and that this will change in both its origin and destination as land uses are developed over the coming years. Some 48% of car based travel demand is forecast to be from Fife or Clackmannanshire to the West of Edinburgh and West Lothian, with a further 19% being to the centre and north of Edinburgh. The remainder is more widely dispersed in origin and destination. A series of assumptions about bus attractiveness along seven indicative corridors have been tested and lead to an estimated transfer from car to bus of 300 cars per hour in the peak periods. This increase in bus patronage is equivalent to 8.5% of all cross Forth demand 8. Two scenarios for public transport enhancements (PT1 and PT2) have been analysed and are shown to benefit public transport (Annex B). The detail of these requires considerable further work to ensure a balance is struck, but features which indicate the greatest contribution to public transport attractiveness include the provision of Park and Ride sites to the North of the Forth and bus-only slip lanes between the A90 and B800. 9. It is clear from the analysis of the longer term land use changes that travel demand will increase south of the Forth (due to major land releases at Winchburgh and West Edinburgh). Both of these have high aspirations in securing public transport mode shares and their promoters propose a range of measures to achieve this including hard shoulder running and queue bypass schemes. The modelling undertaken to investigate the potential benefits of a major series of public transport measures associated with the Forth Replacement Crossing indicates that considerable further work is required to understand the contribution, and the timing of that contribution, of individual measures. The level of prioritisation of public transport together with the land use requirements of
2
individual schemes and measures should be discussed with City of Edinburgh Council, West Lothian and SEStrans. Action Plan 10. The analysis demonstrates that the public transport strategy is achievable through utilising a range of schemes and measures (some of which are set out in Annex C). To progress with the delivery of the public transport strategy, the following activities will be prioritised in the short term (2010 – 2012): • Continue to work with local authorities/ bus industry stakeholders to develop bus
services in advance of opening of FRC, aligned with the land use development plans and travelling populations to both North and South of the Forth;
• Review the design development of the Halbeath Park and Ride site in order that it can contribute to the traffic management associated with the construction of the FRC. Including the consideration of a short term bus priority system utilising hard shoulder running on the M90 (North of Admiralty) allowing buses to maintain reliable journey times, under ITS control, through the congested network north of Ferrytoll.
11. The analysis of the operation of the MCS indicates that the remaining schemes and measures will be required after opening. The inclusion of ITS within the MCS seeks to ensure the steady flow of traffic within the network and negate the need for additional capacity using the hard shoulder. As land use patterns emerge, the remaining schemes and measures identified within the strategy will be considered for implementation. 12. In the longer term, there is the potential for conversion of the bus-based light rapid transit systems to rail based systems. This would relieve pressure on bus based systems allowing the provision of new bus services to more diverse origins and destinations, whilst rail serves the heaviest demands. The public transport crossings would then accommodate heavy rail, light rail and bus (both strategic and commuter). SEStran have already undertaken work on BRT links to the crossing and further work will be undertaken to fully understand the capabilities for this mode. Summary 13. The Public Transport Strategy in support of the Forth Replacement Crossing sees the implementation of a series of schemes and measures to contribute to the planning objectives for the Crossing. The contribution of these has been assessed against the likely demand for travel across the Forth and three key measures are recommended for prioritisation to facilitate not only the scheme objectives, but mitigate the impacts of constructing the MCS. Transport Scotland January 2010
3
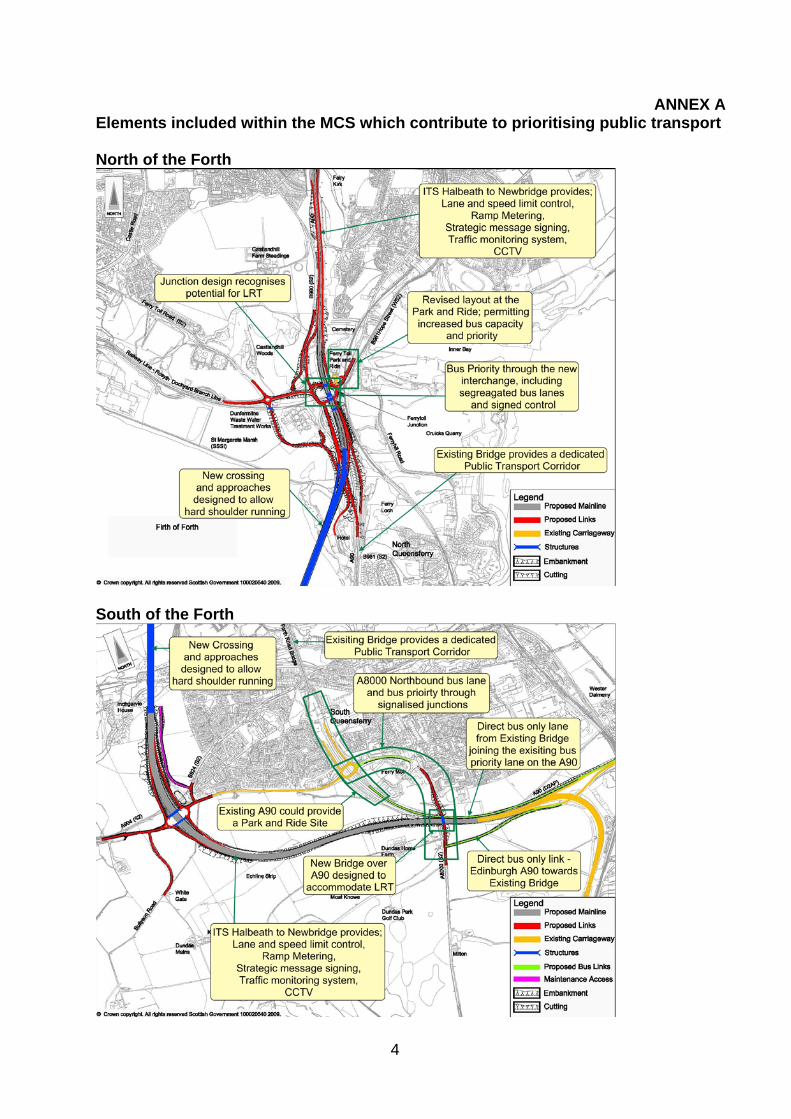
ANNEX A Elements included within the MCS which contribute to prioritising public transport North of the Forth
South of the Forth
4
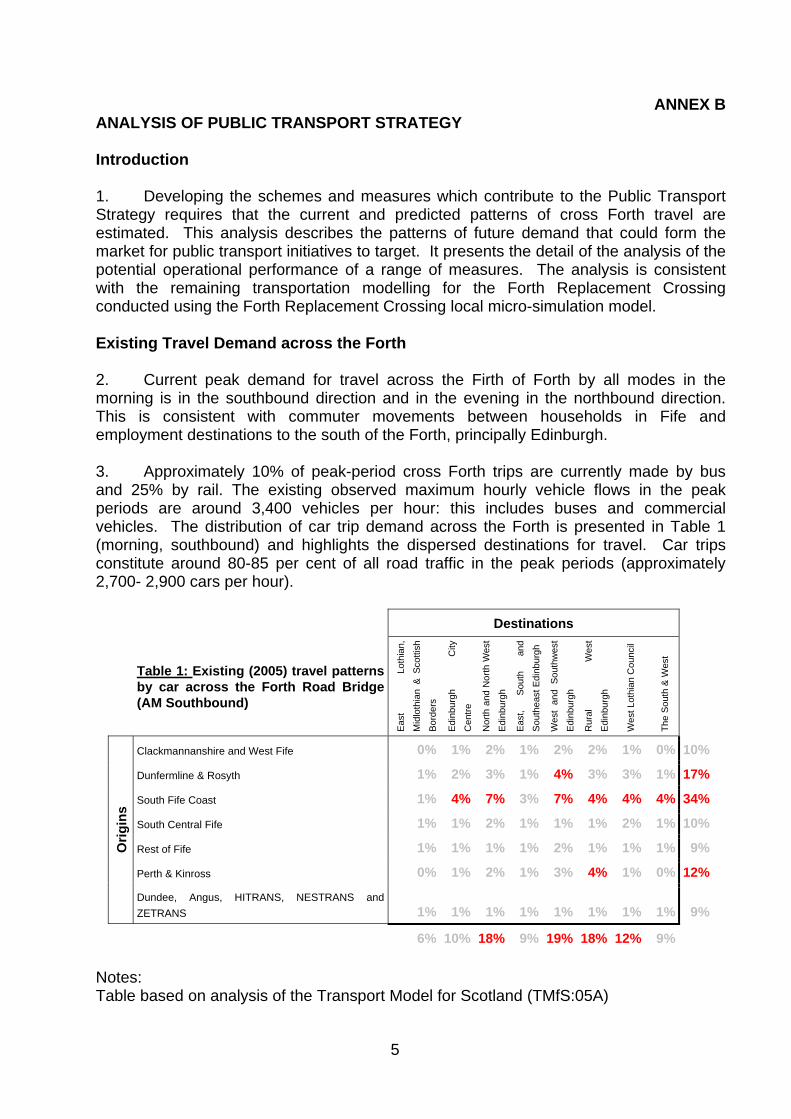
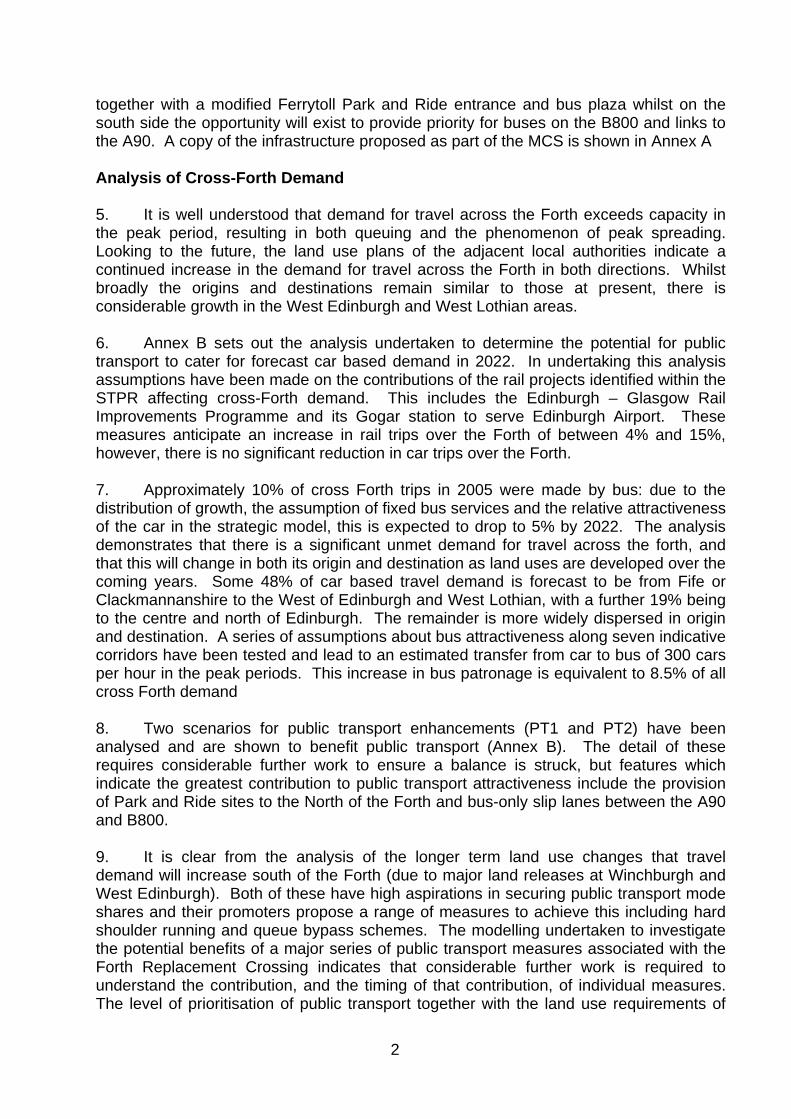
ANNEX B ANALYSIS OF PUBLIC TRANSPORT STRATEGY Introduction 1. Developing the schemes and measures which contribute to the Public Transport Strategy requires that the current and predicted patterns of cross Forth travel are estimated. This analysis describes the patterns of future demand that could form the market for public transport initiatives to target. It presents the detail of the analysis of the potential operational performance of a range of measures. The analysis is consistent with the remaining transportation modelling for the Forth Replacement Crossing conducted using the Forth Replacement Crossing local micro-simulation model. Existing Travel Demand across the Forth 2. Current peak demand for travel across the Firth of Forth by all modes in the morning is in the southbound direction and in the evening in the northbound direction. This is consistent with commuter movements between households in Fife and employment destinations to the south of the Forth, principally Edinburgh. 3. Approximately 10% of peak-period cross Forth trips are currently made by bus and 25% by rail. The existing observed maximum hourly vehicle flows in the peak periods are around 3,400 vehicles per hour: this includes buses and commercial vehicles. The distribution of car trip demand across the Forth is presented in Table 1 (morning, southbound) and highlights the dispersed destinations for travel. Car trips constitute around 80-85 per cent of all road traffic in the peak periods (approximately 2,700- 2,900 cars per hour).
Destinations
Table 1: Existing (2005) travel patterns by car across the Forth Road Bridge (AM Southbound)
Eas
t Lo
thia
n,
Mid
loth
ian
& S
cotti
sh
Bor
ders
Edi
nbur
gh
Cit y
Cen
tre
Nor
th a
nd N
orth
Wes
t
Edi
nbur
gh
Eas
t, S
outh
an
d
Sou
thea
st E
dinb
urgh
Wes
t an
d S
outh
wes
t
Edi
nbur
gh
Rur
al
Wes
t
Edi
nbur
gh
Wes
t Lot
hian
Cou
ncil
The
Sou
th &
Wes
t
Clackmannanshire and West Fife 0% 1% 2% 1% 2% 2% 1% 0% 10%
Dunfermline & Rosyth 1% 2% 3% 1% 4% 3% 3% 1% 17%
South Fife Coast 1% 4% 7% 3% 7% 4% 4% 4% 34%
South Central Fife 1% 1% 2% 1% 1% 1% 2% 1% 10%
Rest of Fife 1% 1% 1% 1% 2% 1% 1% 1% 9%
Perth & Kinross 0% 1% 2% 1% 3% 4% 1% 0% 12%
Orig
ins
Dundee, Angus, HITRANS, NESTRANS and ZETRANS 1% 1% 1% 1% 1% 1% 1% 1% 9%
6% 10% 18% 9% 19% 18% 12% 9% Notes: Table based on analysis of the Transport Model for Scotland (TMfS:05A)
5
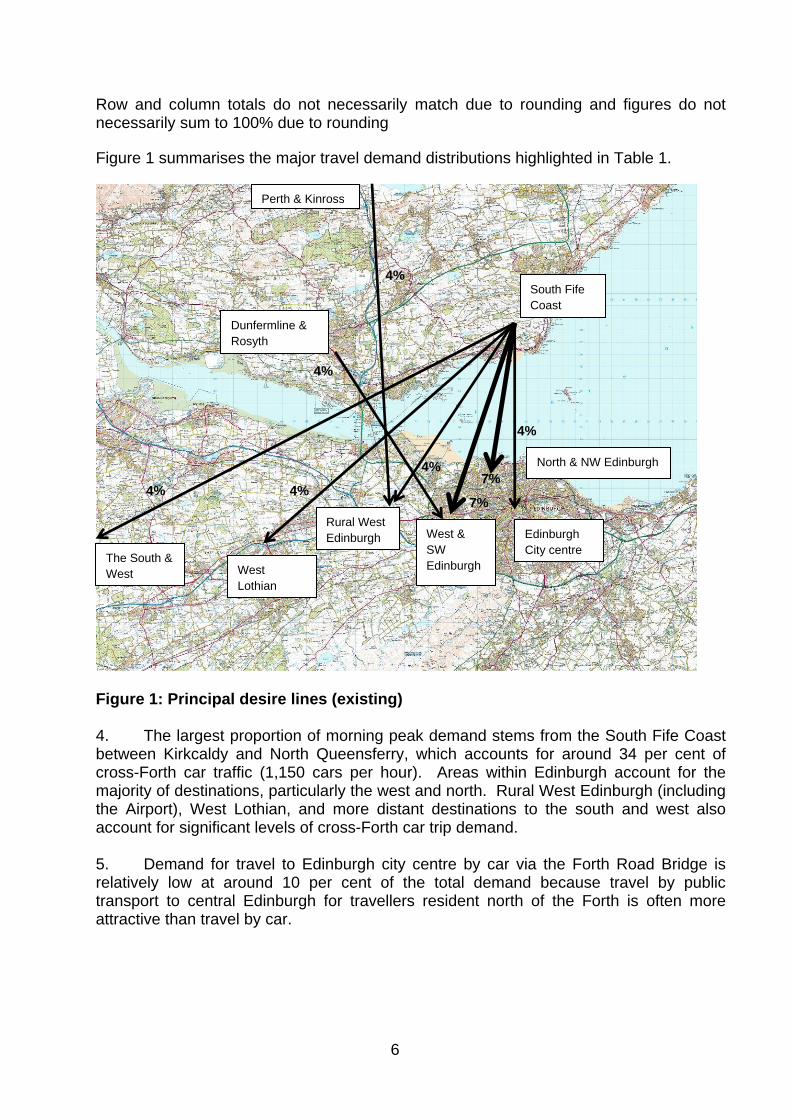
Row and column totals do not necessarily match due to rounding and figures do not necessarily sum to 100% due to rounding Figure 1 summarises the major travel demand distributions highlighted in Table 1.
7%
7%4%
4%
4%
4% 4%
4%
West & SW Edinburgh
Edinburgh City centre
North & NW Edinburgh
Rural West Edinburgh
West Lothian
The South & West
Dunfermline & Rosyth
South Fife Coast
Perth & Kinross
Figure 1: Principal desire lines (existing) 4. The largest proportion of morning peak demand stems from the South Fife Coast between Kirkcaldy and North Queensferry, which accounts for around 34 per cent of cross-Forth car traffic (1,150 cars per hour). Areas within Edinburgh account for the majority of destinations, particularly the west and north. Rural West Edinburgh (including the Airport), West Lothian, and more distant destinations to the south and west also account for significant levels of cross-Forth car trip demand. 5. Demand for travel to Edinburgh city centre by car via the Forth Road Bridge is relatively low at around 10 per cent of the total demand because travel by public transport to central Edinburgh for travellers resident north of the Forth is often more attractive than travel by car.
6
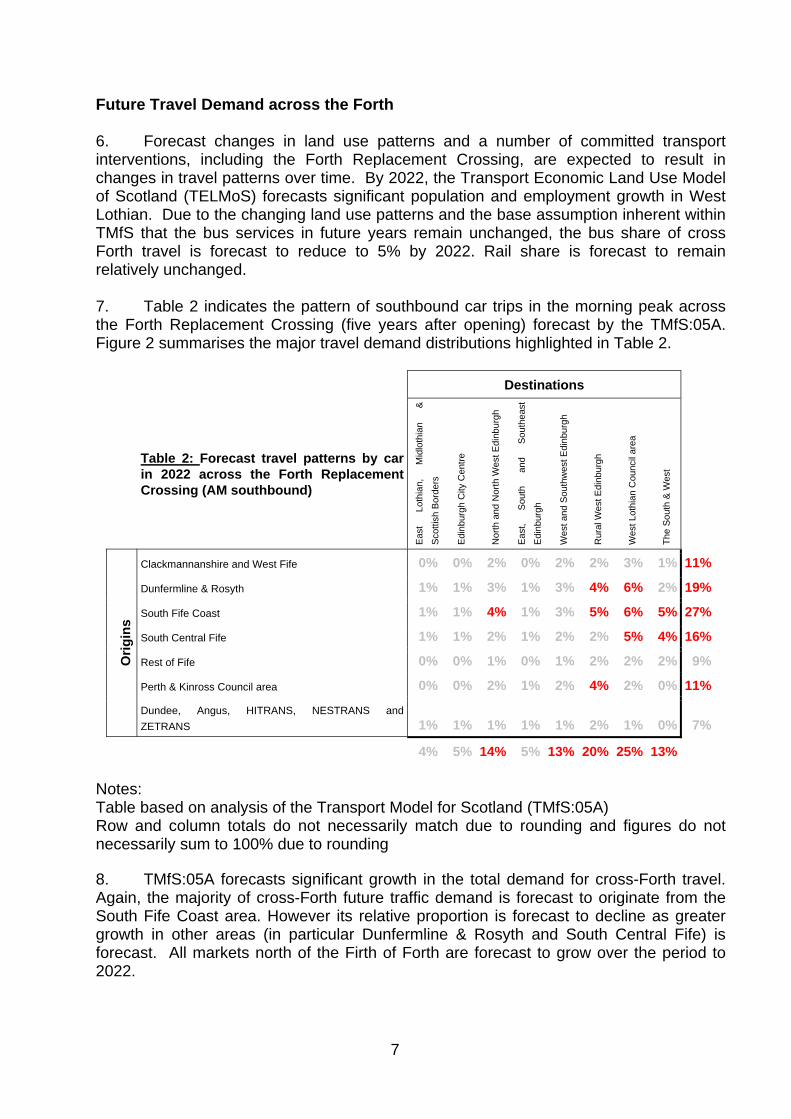
Future Travel Demand across the Forth 6. Forecast changes in land use patterns and a number of committed transport interventions, including the Forth Replacement Crossing, are expected to result in changes in travel patterns over time. By 2022, the Transport Economic Land Use Model of Scotland (TELMoS) forecasts significant population and employment growth in West Lothian. Due to the changing land use patterns and the base assumption inherent within TMfS that the bus services in future years remain unchanged, the bus share of cross Forth travel is forecast to reduce to 5% by 2022. Rail share is forecast to remain relatively unchanged. 7. Table 2 indicates the pattern of southbound car trips in the morning peak across the Forth Replacement Crossing (five years after opening) forecast by the TMfS:05A. Figure 2 summarises the major travel demand distributions highlighted in Table 2.
Destinations
Table 2: Forecast travel patterns by car in 2022 across the Forth Replacement Crossing (AM southbound)
Eas
t Lo
thia
n,
Mid
loth
ian
&
Sco
ttish
Bor
ders
Edi
nbur
gh C
ity C
entre
Nor
th a
nd N
orth
Wes
t Edi
nbur
gh
Eas
t, S
outh
an
d S
outh
east
Edi
nbur
gh
Wes
t and
Sou
thw
est E
dinb
urgh
Rur
al W
est E
dinb
urgh
Wes
t Lot
hian
Cou
ncil
area
The
Sou
th &
Wes
t
Clackmannanshire and West Fife 0% 0% 2% 0% 2% 2% 3% 1% 11%
Dunfermline & Rosyth 1% 1% 3% 1% 3% 4% 6% 2% 19%
South Fife Coast 1% 1% 4% 1% 3% 5% 6% 5% 27%
South Central Fife 1% 1% 2% 1% 2% 2% 5% 4% 16%
Rest of Fife 0% 0% 1% 0% 1% 2% 2% 2% 9%
Perth & Kinross Council area 0% 0% 2% 1% 2% 4% 2% 0% 11%
Orig
ins
Dundee, Angus, HITRANS, NESTRANS and ZETRANS 1% 1% 1% 1% 1% 2% 1% 0% 7%
4% 5% 14% 5% 13% 20% 25% 13% Notes: Table based on analysis of the Transport Model for Scotland (TMfS:05A) Row and column totals do not necessarily match due to rounding and figures do not necessarily sum to 100% due to rounding 8. TMfS:05A forecasts significant growth in the total demand for cross-Forth travel. Again, the majority of cross-Forth future traffic demand is forecast to originate from the South Fife Coast area. However its relative proportion is forecast to decline as greater growth in other areas (in particular Dunfermline & Rosyth and South Central Fife) is forecast. All markets north of the Firth of Forth are forecast to grow over the period to 2022.
7
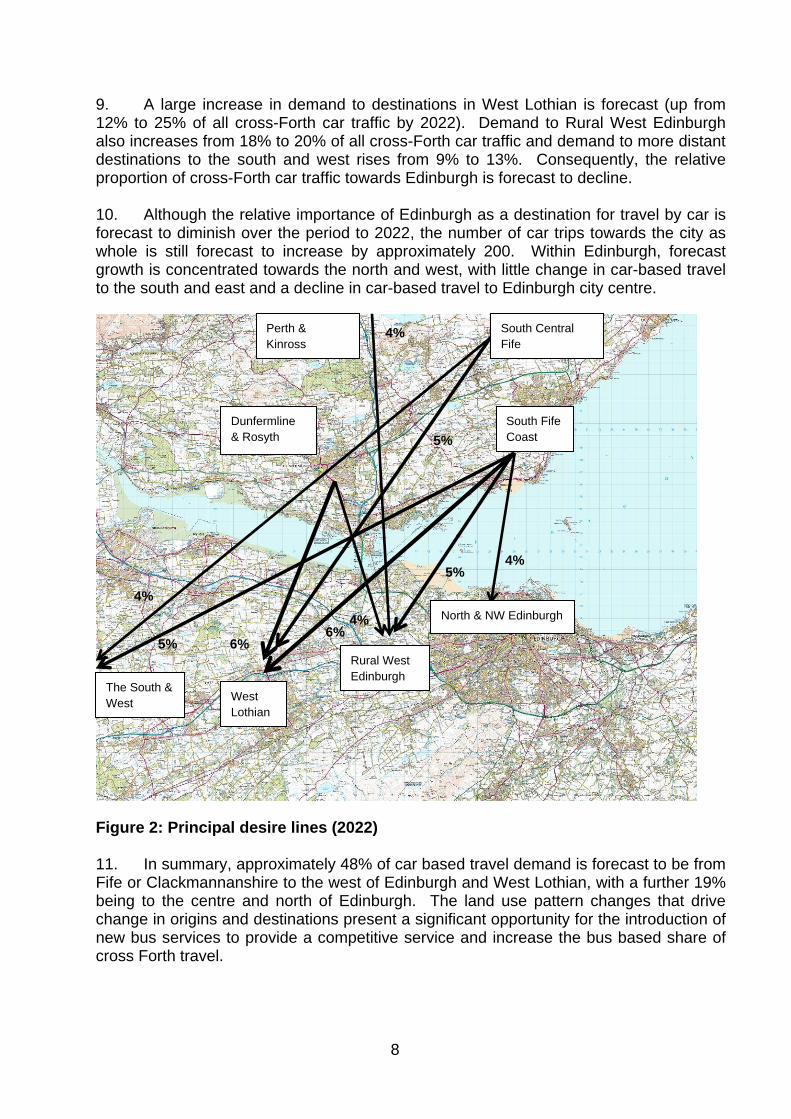
9. A large increase in demand to destinations in West Lothian is forecast (up from 12% to 25% of all cross-Forth car traffic by 2022). Demand to Rural West Edinburgh also increases from 18% to 20% of all cross-Forth car traffic and demand to more distant destinations to the south and west rises from 9% to 13%. Consequently, the relative proportion of cross-Forth car traffic towards Edinburgh is forecast to decline. 10. Although the relative importance of Edinburgh as a destination for travel by car is forecast to diminish over the period to 2022, the number of car trips towards the city as whole is still forecast to increase by approximately 200. Within Edinburgh, forecast growth is concentrated towards the north and west, with little change in car-based travel to the south and east and a decline in car-based travel to Edinburgh city centre.
Figure 2: Principal desire lines (2022) 11. In summary, approximately 48% of car based travel demand is forecast to be from Fife or Clackmannanshire to the west of Edinburgh and West Lothian, with a further 19% being to the centre and north of Edinburgh. The land use pattern changes that drive change in origins and destinations present a significant opportunity for the introduction of new bus services to provide a competitive service and increase the bus based share of cross Forth travel.
Perth & Kinross
South Central Fife
4%
Dunfermline & Rosyth
South Fife Coast
West Lothian
Rural West Edinburgh
The South & West
North & NW Edinburgh 4%
5%
5%
4%
4%
6%5% 6%
8
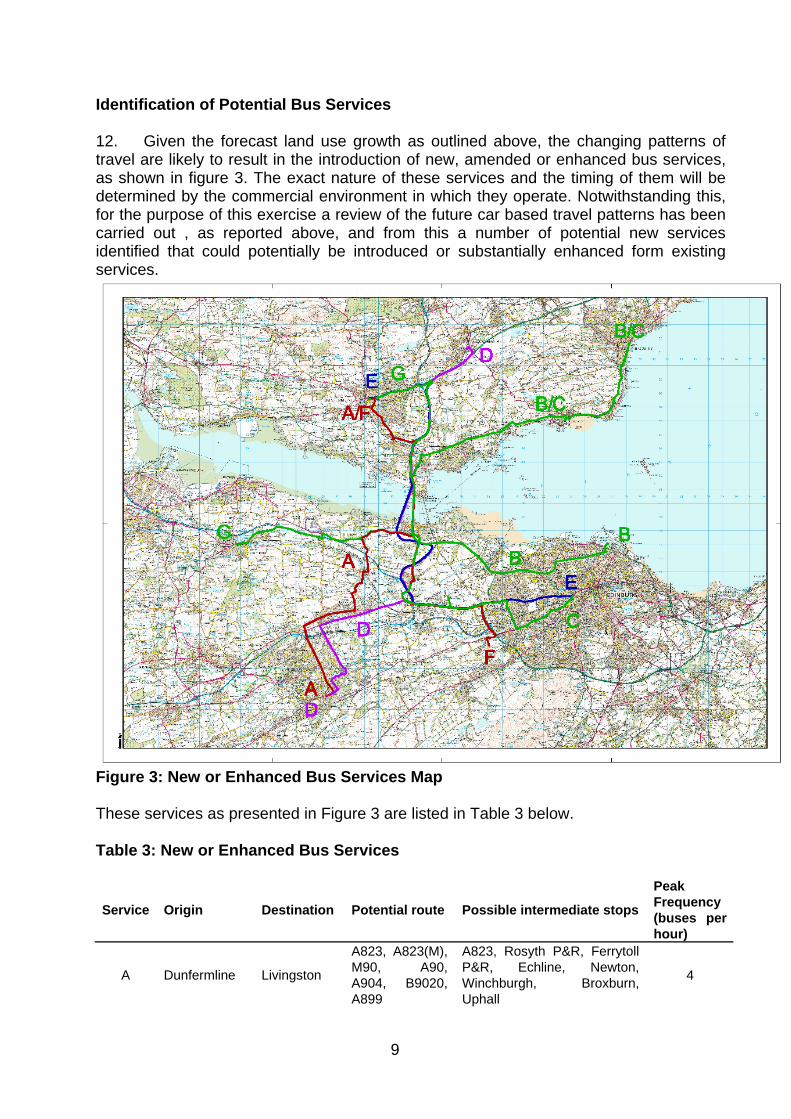
Identification of Potential Bus Services 12. Given the forecast land use growth as outlined above, the changing patterns of travel are likely to result in the introduction of new, amended or enhanced bus services, as shown in figure 3. The exact nature of these services and the timing of them will be determined by the commercial environment in which they operate. Notwithstanding this, for the purpose of this exercise a review of the future car based travel patterns has been carried out , as reported above, and from this a number of potential new services identified that could potentially be introduced or substantially enhanced form existing services.
Figure 3: New or Enhanced Bus Services Map These services as presented in Figure 3 are listed in Table 3 below. Table 3: New or Enhanced Bus Services
Service Origin Destination Potential route Possible intermediate stops
Peak Frequency (buses per hour)
A Dunfermline Livingston
A823, A823(M), M90, A90, A904, B9020, A899
A823, Rosyth P&R, Ferrytoll P&R, Echline, Newton, Winchburgh, Broxburn, Uphall
4
9
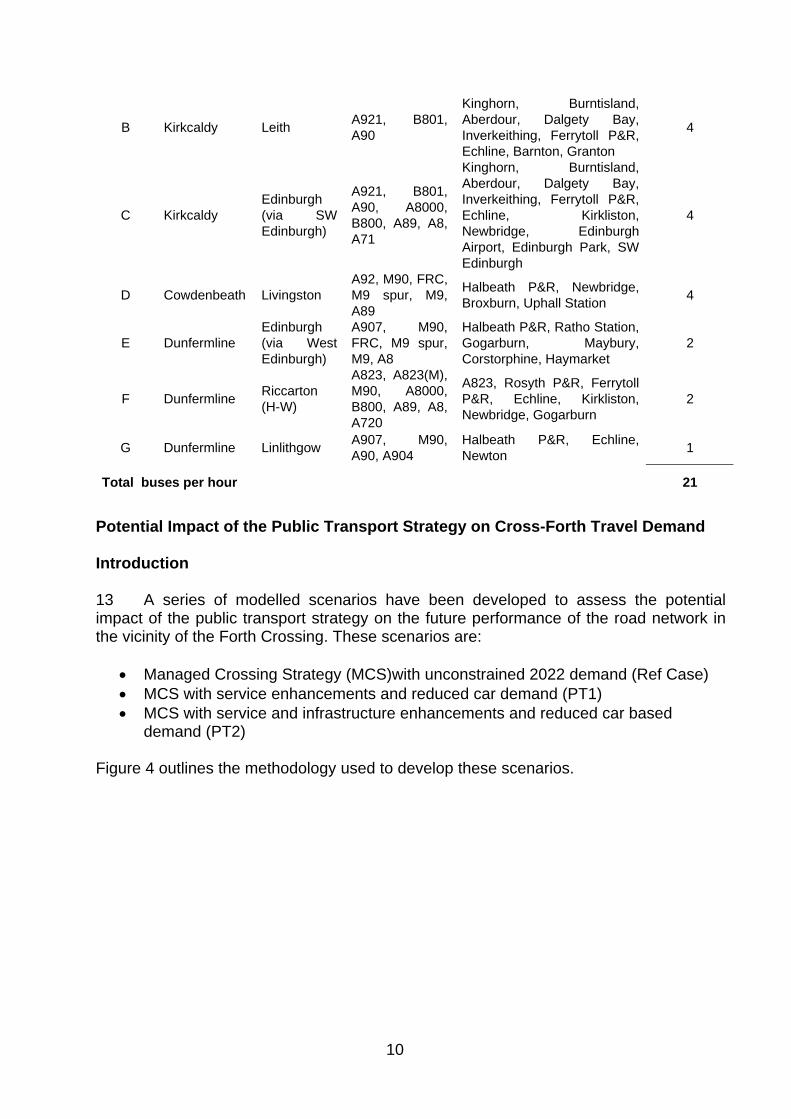
B Kirkcaldy Leith A921, B801, A90
Kinghorn, Burntisland, Aberdour, Dalgety Bay, Inverkeithing, Ferrytoll P&R, Echline, Barnton, Granton
4
C Kirkcaldy Edinburgh (via SW Edinburgh)
A921, B801, A90, A8000, B800, A89, A8, A71
Kinghorn, Burntisland, Aberdour, Dalgety Bay, Inverkeithing, Ferrytoll P&R, Echline, Kirkliston, Newbridge, Edinburgh Airport, Edinburgh Park, SW Edinburgh
4
D Cowdenbeath Livingston A92, M90, FRC, M9 spur, M9, A89
Halbeath P&R, Newbridge, Broxburn, Uphall Station 4
E Dunfermline Edinburgh (via West Edinburgh)
A907, M90, FRC, M9 spur, M9, A8
Halbeath P&R, Ratho Station, Gogarburn, Maybury, Corstorphine, Haymarket
2
F Dunfermline Riccarton (H-W)
A823, A823(M), M90, A8000, B800, A89, A8, A720
A823, Rosyth P&R, Ferrytoll P&R, Echline, Kirkliston, Newbridge, Gogarburn
2
G Dunfermline Linlithgow A907, M90, A90, A904
Halbeath P&R, Echline, Newton 1
Total buses per hour 21
Potential Impact of the Public Transport Strategy on Cross-Forth Travel Demand Introduction 13 A series of modelled scenarios have been developed to assess the potential impact of the public transport strategy on the future performance of the road network in the vicinity of the Forth Crossing. These scenarios are:
• Managed Crossing Strategy (MCS)with unconstrained 2022 demand (Ref Case) • MCS with service enhancements and reduced car demand (PT1) • MCS with service and infrastructure enhancements and reduced car based
demand (PT2) Figure 4 outlines the methodology used to develop these scenarios.
10
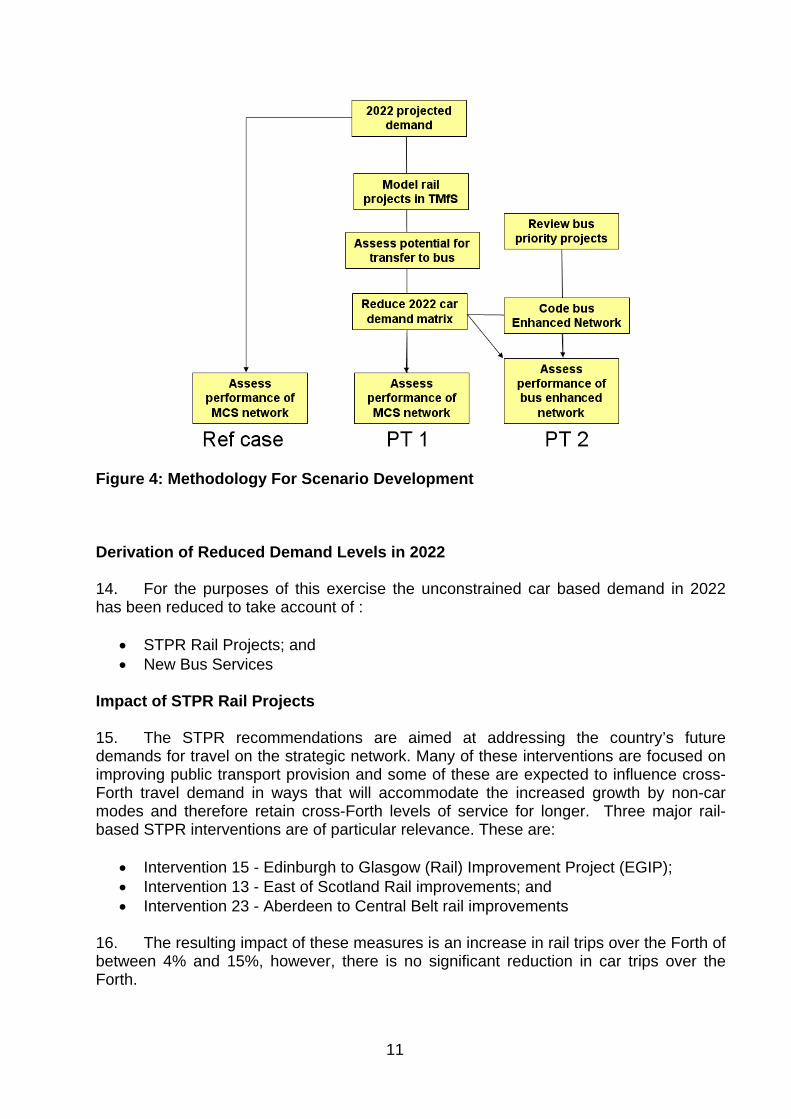
Figure 4: Methodology For Scenario Development Derivation of Reduced Demand Levels in 2022 14. For the purposes of this exercise the unconstrained car based demand in 2022 has been reduced to take account of :
• STPR Rail Projects; and • New Bus Services
Impact of STPR Rail Projects 15. The STPR recommendations are aimed at addressing the country’s future demands for travel on the strategic network. Many of these interventions are focused on improving public transport provision and some of these are expected to influence cross-Forth travel demand in ways that will accommodate the increased growth by non-car modes and therefore retain cross-Forth levels of service for longer. Three major rail-based STPR interventions are of particular relevance. These are:
• Intervention 15 - Edinburgh to Glasgow (Rail) Improvement Project (EGIP); • Intervention 13 - East of Scotland Rail improvements; and • Intervention 23 - Aberdeen to Central Belt rail improvements
16. The resulting impact of these measures is an increase in rail trips over the Forth of between 4% and 15%, however, there is no significant reduction in car trips over the Forth.
11
Impact of New Bus Services 17. The introduction of the new bus services as outlined in Table 3 would result in approximately 20 additional buses in a southbound direction in the morning peak hour. Adopting the principles of industry standard elasticity factors an assessment has been made of the potential transfer from car to bus in 2022. Abstraction factors relating to a transfer from car to bus have been developed, which differentiate between:
• existing and new trips (with higher rates applied to new trips); • direct and indirect trips (with higher rates applied to direct trips); and • direction of travel (with higher rates applied to southbound trips).
18. Applying these abstraction rates, the car-based demand in the morning peak is forecast to reduce by 1,200 vehicles over the four-hour period 0600 hrs to 1000 hrs. Of these 925 would be southbound trips, of which 600 would use park and ride facilities at Halbeath, Pitreavie and Ferrytoll. The consequence of this transfer would be to achieve a 10% mode share for buses for southbound trips in the morning peak, the same proportion as currently modelled in the base year (2005). 19. It is considered that these assumptions present a realistic scenario from which to base the operational assessment. It could be argued that the potential transfer to bus would be greater than this as no account has been taken for new services in the area that do not involve the need to travel across the Forth (ie West Lothian to Edinburgh). Modelled Scenarios 20. The operational assessment determines the improvements in performance resulting from the implementation of the additional public transport interventions, over and above those contained as part of the MCS. Two such scenarios have been assessed and compared against the MCS with unconstrained 2022 demand levels. MCS with service enhancements and reduced car demand (PT1) 21. This scenario consists of:
• Managed Crossing Scheme • Reduced demand to reflect additional transfer to buses; and • Introduction of Halbeath Park and Ride and Pitreavie Park and Ride/Choose
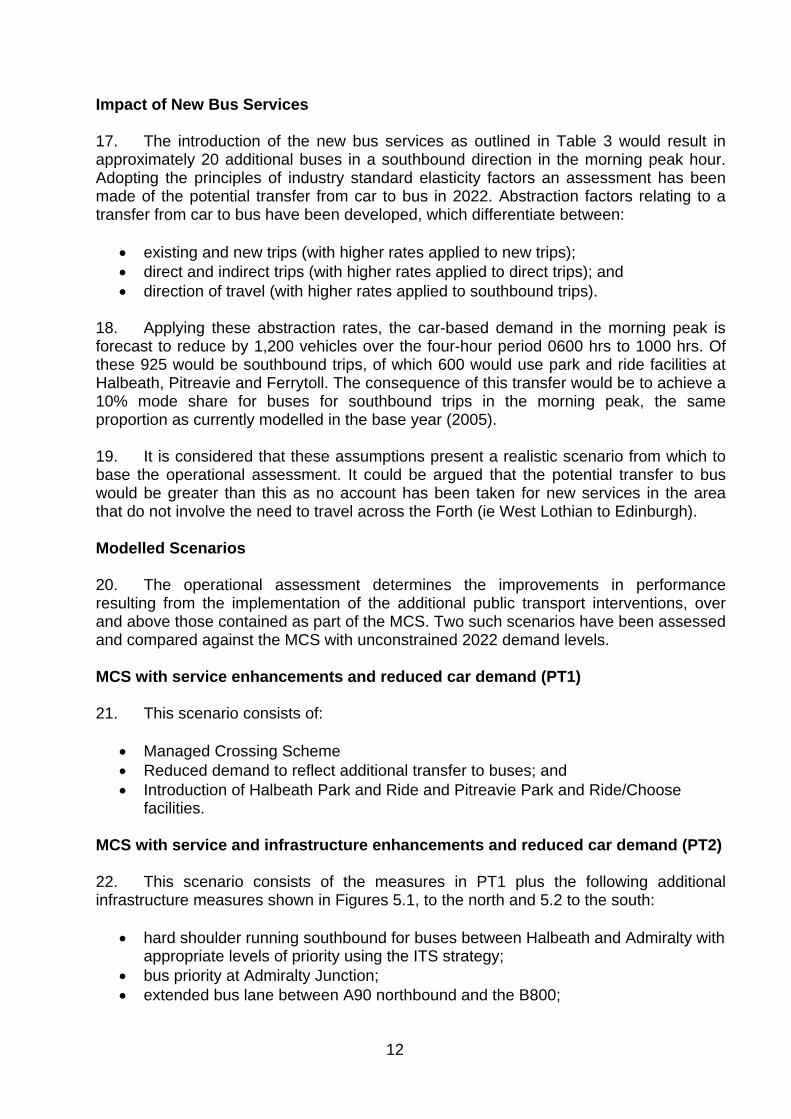
facilities. MCS with service and infrastructure enhancements and reduced car demand (PT2) 22. This scenario consists of the measures in PT1 plus the following additional infrastructure measures shown in Figures 5.1, to the north and 5.2 to the south:
• hard shoulder running southbound for buses between Halbeath and Admiralty with appropriate levels of priority using the ITS strategy;
• bus priority at Admiralty Junction; • extended bus lane between A90 northbound and the B800;
12
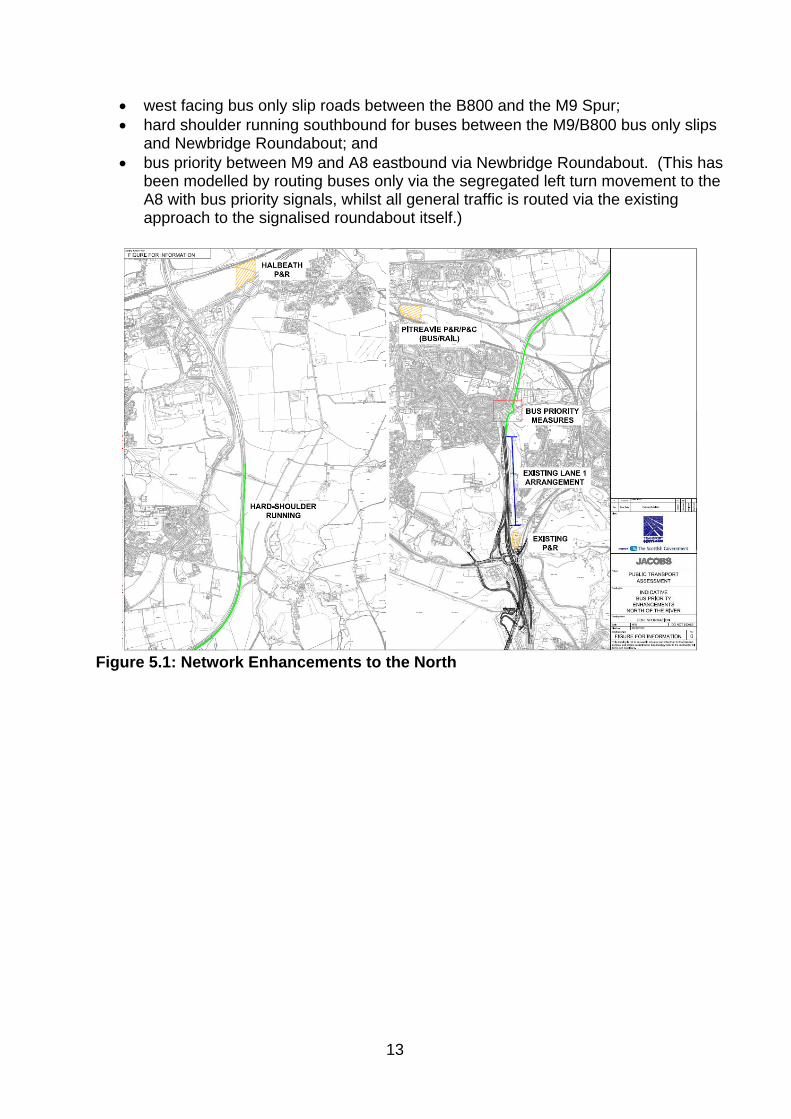
• west facing bus only slip roads between the B800 and the M9 Spur; • hard shoulder running southbound for buses between the M9/B800 bus only slips
and Newbridge Roundabout; and • bus priority between M9 and A8 eastbound via Newbridge Roundabout. (This has
been modelled by routing buses only via the segregated left turn movement to the A8 with bus priority signals, whilst all general traffic is routed via the existing approach to the signalised roundabout itself.)
Figure 5.1: Network Enhancements to the North
13
Figure 5.2: Network Enhancements to the South Performance of the Modelled Scenarios Details of the Modelled Scenarios 23. The comparative performance of the three modelled scenarios is discussed in the following paragraphs. The PT1 and PT2 scenarios described in section 13 were modelled using the Corridor Operational Model that was developed for the Forth Replacement Crossing. The results are based on analysis of the modelled scenarios under a 2022 forecast scenario, and comparison against the 2022 MCS reference case scenario. 24. 2022 MCS scenario was used as a reference case for this analysis instead of 2017 MCS. The overall demand increases by 3% from 2017 to 2022 in the AM period, however the trip distribution changes significantly due to changes in development areas between 2017 and 2022. This change in distribution results in zero growth in cross Forth trips southbound in the AM, with a reduction in trips from the North to Barnton of 7% and an increase of trips to Newbridge of 5%. The reduction of trips from the North to Barnton (the main existing bus service route across the Forth) in the AM between 2017 and 2022 causes a reduction in journey time for this movement in 2022. 2017 MCS is not a suitable reference case for this analysis as the reduction in journey times in PT1 and PT2 between the North and Barnton attributed to the PT improvements will not be detected from the general reduction due to the change in trip distribution. 25. The PT2 modelled scenario includes a proposed section of hard shoulder running on the M90 southbound south of the A92 merges to Admiralty, and includes through
14
junction hard shoulder running at the Masterton junction. To assess the feasibility of the potential implementation of through junction hard shoulder running at Masterton, the guidance in the Highways Agency’s Interim Advice Note IAN 111_09 was used to determine and confirm that there would be sufficient scope within the existing carriageway to meet the advice on lane width adjustments. Note that this has not been subject to any detailed design process, and as it would require approval by Transport Scotland’s Standards Branch should only be considered as potentially feasible at this stage. 26. A number of assumptions were also made to overcome some limitations of modelling the ITS strategy to extend the lane and speed control to the hard shoulder running sections, and to retain the merging behaviour of vehicles at the Masterton southbound merge on the through junction running section. 27. The relative performance of the models was based upon comparing bus and car journey times for selected routes from Fife to Edinburgh and West Lothian. Results of Assessment 28. Including the additional bus services identified in table 3, the performance of the three models is discussed below. The table presents the journey times for selected routes extracted from the model analyses for the 2022 reference case and the two public transport scenarios PT1 – the scheme plus additional bus services, and PT2 – the scheme plus additional bus services and infrastructure. The table shows the key routes to Barnton as a comparison between the three models followed by the journey times of the new services for comparison. Table 4 presents details of the journey times averaged over the four hour modelled period.
15
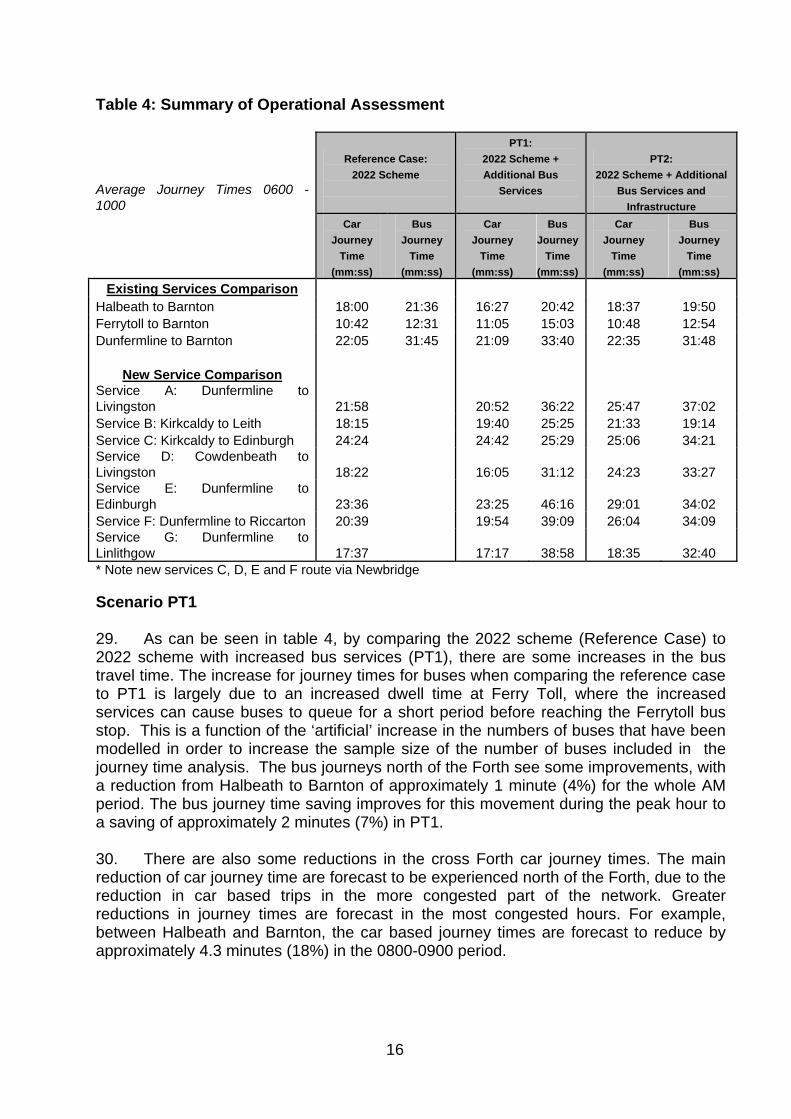
Table 4: Summary of Operational Assessment
Average Journey Times 0600 - 1000
Reference Case: 2022 Scheme
PT1: 2022 Scheme + Additional Bus
Services
PT2: 2022 Scheme + Additional
Bus Services and Infrastructure
Car Journey
Time (mm:ss)
Bus Journey
Time (mm:ss)
Car Journey
Time (mm:ss)
Bus Journey
Time (mm:ss)
Car Journey
Time (mm:ss)
Bus Journey
Time (mm:ss)
Existing Services Comparison Halbeath to Barnton 18:00 21:36 16:27 20:42 18:37 19:50 Ferrytoll to Barnton 10:42 12:31 11:05 15:03 10:48 12:54 Dunfermline to Barnton 22:05 31:45 21:09 33:40 22:35 31:48
New Service Comparison
Service A: Dunfermline to Livingston 21:58 20:52 36:22 25:47 37:02 Service B: Kirkcaldy to Leith 18:15 19:40 25:25 21:33 19:14 Service C: Kirkcaldy to Edinburgh 24:24 24:42 25:29 25:06 34:21 Service D: Cowdenbeath to Livingston 18:22 16:05 31:12 24:23 33:27 Service E: Dunfermline to Edinburgh 23:36 23:25 46:16 29:01 34:02 Service F: Dunfermline to Riccarton 20:39 19:54 39:09 26:04 34:09 Service G: Dunfermline to Linlithgow 17:37 17:17 38:58 18:35 32:40 * Note new services C, D, E and F route via Newbridge Scenario PT1 29. As can be seen in table 4, by comparing the 2022 scheme (Reference Case) to 2022 scheme with increased bus services (PT1), there are some increases in the bus travel time. The increase for journey times for buses when comparing the reference case to PT1 is largely due to an increased dwell time at Ferry Toll, where the increased services can cause buses to queue for a short period before reaching the Ferrytoll bus stop. This is a function of the ‘artificial’ increase in the numbers of buses that have been modelled in order to increase the sample size of the number of buses included in the journey time analysis. The bus journeys north of the Forth see some improvements, with a reduction from Halbeath to Barnton of approximately 1 minute (4%) for the whole AM period. The bus journey time saving improves for this movement during the peak hour to a saving of approximately 2 minutes (7%) in PT1. 30. There are also some reductions in the cross Forth car journey times. The main reduction of car journey time are forecast to be experienced north of the Forth, due to the reduction in car based trips in the more congested part of the network. Greater reductions in journey times are forecast in the most congested hours. For example, between Halbeath and Barnton, the car based journey times are forecast to reduce by approximately 4.3 minutes (18%) in the 0800-0900 period.
16
Scenario PT 2 31. To assess the additional bus journey time savings resulting from the PT infrastructure improvements PT2 was compared to PT1. The PT infrastructure improvements reduce the bus journey times for the main existing service paths across the Forth. Ferrytoll to Barnton bus journey time has the largest saving of approximately 2 minutes (14%), Halbeath to Barnton has a journey time reduction of 4% and Dunfermline to Barnton reduces by 6% for the whole AM period, with the peak hour having a slightly higher saving. 32. The public transport infrastructure improvements generally result in improved proposed new services bus journey times. New services B, F and G improve by approximately 5 to 6.5 minutes (13% to 24%) for the whole AM period. New bus service E, from Dunfermline to Edinburgh has the most significant journey time improvement for the whole AM period of 12 minutes (26%) as this route uses the bus only segregated left turn at Newbridge. The infrastructure changes have however increased the journey time for some bus services, namely to new service C and D. The delay to service C is due to cars rerouting though Kirkliston. The delay to service D is caused at Newbridge, the service approaches Newbridge from the M9 North and turns right along A89, the M9 North approach is significantly queued, due to the bus only segregated left turn, and buses merge into the queue early on causing the delay. A bus gate to give priority to buses turning right at Newbridge would improve this however this would cause additional delay to general traffic. 33. The main delay to cars from the infrastructure changes on approach to the Newbridge junction, are due to the change of the segregated left (M9 North to A8 Edinburgh) to a bus only lane, which causes more queuing to the cars approaching the junction. This has an effect on new service C, which routes through Kirkliston. The additional delay on the spur and M9, caused from vehicles blocking back from Newbridge, causes some cars to reroute through the local road. The car rerouting through Kirkliston creates an additional delay of approximately 10 minutes to bus service C. However, by way of comparison, the buses travelling a similar section from approximately Scotstoun to the M9 (Note the buses use the B800 before joining the Spur using west facing slips and finish the journey on hard shoulder) see a journey time from 0700-0800 of under 5mins in comparison to the car which takes nearly 10 minutes. 34. Table 4 shows an increase in average journey time for cars travelling a similar path to the new bus services of up to 8 minutes for the whole AM period, as a result of some of the bus priority infrastructure improvements. The principal impact to cars is on the approach to Newbridge, given the priority afforded to buses on the hard shoulder and approach to the roundabout which causes delays back to the M9 Spur. The average car journey time to traverse the M9 Spur is increased by approximately 6 minutes (from 5.5 minutes to 11.5minutes) with the new PT infrastructure over the whole AM period. During the peak hour (0800 to 0900) the delay to cars increases to 11 minutes on the M9 Spur. 35. Note that a viable alternative to the Newbridge bus priority measures that have been modelled for this assessment would be to implement a set of bus pre-signals to control general traffic in advance of the segregated left turn lane, and allow buses running on the hard shoulder to enter the general traffic stream and access the A8 via the segregated left turn lane. This would still provide for significant benefits to public
17
18
transport users and would help minimise the impact on general traffic by also allowing non-public transport vehicles to continue to use the segregated left turn lane rather than being routed via the signalised roundabout itself. Summary 36. This test focused on two possible schemes, to provide additional capacity via modal shift to bus. The first scheme tested the benefit of adding additional cross Forth bus services and reducing the car demand, the second scheme tested the benefits gained by giving the new bus services additional infrastructure and priority at key locations over the cars. The outcome from the tests would show that both schemes give benefits to the journey times of public transport users, with the second scheme giving potentially more.
ANNEX C
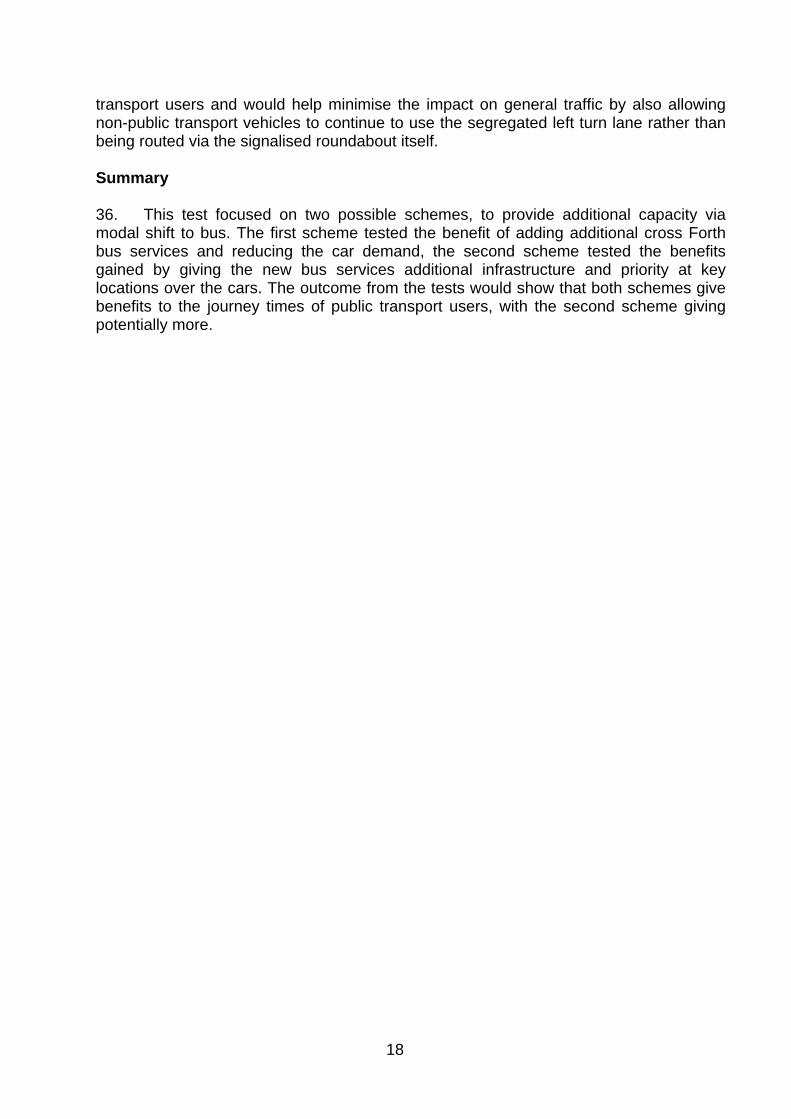
SCHEMES AND MEASURES AVAILABLE TO SUPPORT MANAGED CROSSING STRATEGY IN DELIVERING PUBLIC TRANSPORT STRATEGY Intervention Timescale for
Delivery Indicative Cost (£) Lead Authority
Halbeath Park and Choose Short term (<5 years)
£7-10 m (from Fife Council work) Fife Council
Rosyth Park and Choose
Short term (<5 years)
£4-6m (from Fife Council work) Fife Council
Hard Shoulder Running for buses on M90 north of Admiralty (works arrangement)
Short term (<5 years)
£5m Transport Scotland
Improvements at Admiralty Junction
Short term (<5 years)
£0.5m - £1M Fife Council/Transport Scotland
Hard Shoulder Running for buses on M9 approach to Newbridge
Short term (<5 years)
£0.5m - £1M City of Edinburgh Council
Improvements to Newbridge Interchange
Medium term (5 – 10 years)
£4.5m (from Halcrow work for City of Edinburgh Council)
City of Edinburgh Council/Transport Scotland
New slips from B800 to M9 Spur including dedicated right turn lane.
Medium term (5 – 10 years)
£2m - £3M City of Edinburgh Council/Transport Scotland
Hard Shoulder Running for buses on M90 north of Admiralty (corridor enhancement)
Medium term (5 – 10 years)
£10M Transport Scotland
Bus lanes on A8 westbound Bus Lane on A89 Eastbound
Short term (<5 years)
£7.2m (from Halcrow work for City of Edinburgh Council) A8 Westbound £2m - £2.5M A89 Eastbound £0.5m -£1M
Notes: see over
19
20
• The costs are at Q4 2006 prices • The costs quoted here are offered as an indicative guide only. • The costs do not include VAT or optimism bias. • Hard shoulder running costs are subject to further investigation of the condition of the hard shoulder. • Hard shoulder running is based on southbound only in accordance with IAN 111/09 Managed Motorway Implementation
Guidance - Hard Shoulder Running. Through junction Hard Shoulder running is assumed at Masterton interchange in accordance with IAN 112/09 Managed Motorway Implementation Guidance – Through Junction Hard Shoulder Running. Estimate seems high as lane configuration can be accommodated within existing carriageway.
• Improvements to Admiralty Junction allows for bus priority measures at the gyratory and dynamic use of the hard shoulder on the slip roads. Priority bus control on slip road including widening of carriageway to create splitter island for signals. New control on gyratory and westbound approach on Admiralty Road.
• Newbridge public transport priority measures • Bus Lane A8 westbound carriageway approximate linear length 2km including bus priority signals at Lochend Road • Bus lane A89 eastbound carriageway approximate linear length 600m including bus priority signals. • New slips from the M9 Spur to the B800 includes for widening of the B800 to provide a dedicated right turn lane. • M9 Approach to Newbridge assumed road markings with sufficient carriageway width or minor localised widening. Widening
of the A8 between the Newbridge M9 Slip and Lochend Road.


![[Preservation Tips & Tools] Find Funding for Emergency/Intervention Preservation Projects](https://img.pdfslide.us/doc/110x75/549d4ec8ac7959c92a8b49d0/preservation-tips-tools-find-funding-for-emergencyintervention-preservation-projects.jpg)