Embed Size (px)
Citation preview
International Journal of Scientific & Engineering Research Volume 11, Issue 2, February-2020 958
ISSN 2229-5518
IJSER © 2020
http://www.ijser.org
Prioritizing Intervention Projects in Slums Using Optimization Models
Dr. Mohamed Fawzy Ahmed, Dr. Engy Fawzy Ahmed
Abstract— Slums represent major national challenges in third world countries. Selecting the most suitable intervention strategies for each slum area and determining the priorities of these intervention strategies are important goals in the development process. This paper presents novel and comprehensive models that are capable of supporting planning authorities in identifying (1) the needed intervention strategies for the slums area and (2) the optimal priorities among these intervention projects. Two techniques are used which are: (1) Classical Optimization and (2) Meta-heuristic optimization, in meta- heuristic techniques two methods are used which are Artificial Bee Colony (ABC) and Particle Swarm Optimization (PSO). In the proposed models, decision is made taking into consideration two main factors; namely (1) the priority package within which an intervention project can be classified and (2) the construction sequence within the same area. In lieu of this analysis, classical optimization and meta- heuristic optimization identify the optimal priorities among intervention projects by accelerating the benefits achieved to residents by maximizing the benefits through optimizing area of benefit with respect to annual budget constraints. In classical method exhaustive or systematic enumeration solution is used versus stochastic and random solution is used in meta- heuristic method to find optimum or near optimum solution. Two case studies are used to demonstrate the potentials of the proposed models. Based on the results of the studies, it is evident that ABC model is the best with respect to efficiency and effectiveness compared with other models. It is the best compared to classical model and PSO, it reaches to the optimum solution the same as classical optimization in time less than it with 170 times and although the running time of it is the same as PSO but The effectiveness of the solution of PSO compared to the optimum is 99.57 % with deviation of 0.43 %. ABC takes into consideration not only the priorities of intervention projects but also the starting of these projects by maximizing the benefit reached to residents by accelerating this benefit which is an important issue.
Index Terms— Artificial Bee Colony, Intervention Project, Meta-heuristic, Model, Optimization, Particle Swarm Optimization, Slums.
—————————— ——————————
1 INTRODUCTION
lums are areas of population concentrations that are illegally developed on property of the State in the absence of planning and lack access to basic services and life essentials. Slums represent serious national challenges in countries where they exist, especially third world
countries. Selecting intervention strategies for each slum zone and determining their priorities is an important issue in the development process. This paper supports decision makers in prioritizing slums intervention projects by proposing models that adopts an objective and systematic procedure. The objective of this research is to present novel models for slums intervention projects, which is capable of (1) assessing the slum’s conditions and identifying the needed intervention strategies, and (2) prioritizing the identified intervention projects taking into account practical budgetary constraints and construction sequencing. The following sections briefly highlight slums and
optimization.
2 SLUMS
Large parts of cities in all developing countries are formed of slums. The growth of substandard, illegal or informal housing is understood by experts as a normal phenomenon accompanying quick urbanization, where housing markets cannot face the excessive demand and urgent need for shelter by the poor people [1]. Informal areas occur when planning,
land administration and housing policies fail to address the needs of the whole society [2]. A slum is a heavily populated urban informal settlement marked by inadequate housing and unsuitable living conditions and lack of basic services. Slums differ in size, shape and characteristics from place to place. Slum households suffer from one or more of the following conditions: (1) lack of access to clean water; (2) lack of access to improved sanitation facilities; (3) insufficient and overcrowded living area; (4) inadequate structural quality or durability of dwellings; and (5) lack of tenure security [3]. Slums form and grow in different parts of the world for various reasons, including the quick rural-to-urban migration, recession, poverty, informal economy, high jobless rates, bad planning, natural catastrophes, and social conflicts [4]. Slums are heavily populated urban informal settlements characterized by substandard housing and inadequate living conditions [5]. Slums are a significant problem to several countries especially the developing countries since they house the poorest groups in conditions that threaten human development. About 30 % of the world’s population lives in slums and 40 % of residents in third world countries are slum inhabitants [2-3] The following section introduces a brief description on slum upgrading policies and previous studies in slum intervention prioritization.
2.1 Slum Upgrading Policies
A review of several countries' experiences with upgrading of informal settlements and identifying their priorities show that governments have moved away from negligence policy that deny the reality of slums and the rights of its residents to eradication and eviction policies that advocated the bulldoze of these settlements then to the provision, enabling, and participatory policies [6]. Participatory upgrading is a more
S
————————————————
Dr. Mohamed F. Ahmed, Senior Planning Engineer, Planning Department, Petrojet Company, Cairo, Egypt Email: [email protected]
Dr. Engy F. Ahmed Lecturer, Architecture Engineering Department, Thebes Academy for Engineering, Cairo, Egypt Email: [email protected]
Dr. Engy F. Ahmed
Co-Author name is currently pursuing masters degree program in electric power engineering in University, Country, PH-01123456789. E-mail:
IJSER
International Journal of Scientific & Engineering Research Volume 11, Issue 2, February-2020 959
ISSN 2229-5518
959 IJSER © 2020
http://www.ijser.org
effective strategy used in the upgrading process and in determining intervention priorities, where the slum dwellers and the development partners are involved in re-planning and upgrading of the area and participate in the decision making. it is understood as a "process in which people, and specially disadvantaged people, influence resource allocation and the planning and implementation of policies and programs, and are involved at different levels and degrees of intensity in the identification, timing, planning, design, implementation, evaluation, and post-implementation stage of development projects" [7]. The success of this strategy depends on engaging all stakeholders in the processes of determining their priority needs and problems, deciding on interventions, implementing the upgrading measures agreed upon, and co-managing the improved community facilities [4]. It is important that all stakeholders agree on the upgrading objectives and on the respective interventions before starting any upgrading scheme. Upgrading also balances between priority needs of local residents of the informal areas (as determined through the participatory process) and the strategic vision of the government for the development of the city as a whole [3]. Participatory upgrading is the current method used for slum
intervention prioritization.
2.2 Previous studies in slums and slum intervention prioritization
Several studies have been dedicated to investigate slums from many aspects, including the social, environmental, urban, health, political, and economic aspects, as well as the construction costs of slums upgrading projects [8-9-10-11-12-13-14-15-16-17-18-19-20-21]. In spite of the important contributions of these researches, there is little research on prioritizing slum intervention projects and strategies. For instance, one study presented a framework using an expert system to identify the best intervention strategies, such as demolition, upgrading, or conservation by calculating area an informality degree. This approach is applicable to cases when it is needed to prioritize interventions at the strategy level (e.g. upgrading utilities first), but is limited in its ability to prioritize intervention projects (e.g. which utilities upgrading project should receive a higher priority; water supply, sewage, or electricity upgrading?) [22]. Another study presented a framework that integrates urban and construction planning in an effort to determine the optimum slums upgrading plans by maximizing benefits to households and minimizing construction costs and the socioeconomic disruptions [23-24-25]. This study focuses on the computational implementation of the proposed integration, but still needs to be complemented with a methodology to identify the optimal intervention projects. Another study presented a Framework for Prioritizing Intervention Projects in Slums using Benefit/ Cost Analysis model which determines upgrading project priorities in terms of project orders not determining the starting of these projects neglecting annual budgetary constraints which is an important issue in slum development [26].
3 OPTIMIZATION
Optimization refers to choosing the best selection from a set of available options. Optimization problems focus on finding the values for one or more decision variables that achieves the assigned objectives without violating the constraints [27-28-29]. Classical Optimization Technique based on exhaustive search or complete enumeration where all the available candidate solutions are tested [30]. Classical optimization is based on the following ideas: (1) the problem solution is obtained by enumeration or differential calculus; (2) a unique solution exists for the given problem; and (3) it converge to the solution of the corresponding first-order conditions. However, classical optimization becomes difficult when the given problems do not fulfill the requirements of these methods, or when problem sizes are large leading to intensive calculations. Meta-heuristic optimization techniques incorporate stochastic elements. The optimization mechanism drives the search towards promising locations in the search space. They aim to converge to the optimum in course of iterated search; they are very flexible and therefore are less restricted to certain forms of constraints. Meta-heuristic methods intend to compute efficiently, good solutions to a problem with no guarantee of optimality. Examples of meta-heuristics include tabu search, evolutionary algorithms, simulated annealing, artificial bee colony and particle swarm optimization.
3.1 Artificial Bee Colony
Artificial Bee Colony (ABC) is a recent algorithm implemented by Dervis Karaboga in 2005 [31], inspired by the intelligent behavior of honey bees. ABC is an optimization algorithm that provides a population-based search steps in which individuals called foods locations are changed by the artificial bees with time and the aim of the bee is to discover the places that are rich in their nectar amount and finally the place with the highest nectar. In ABC system, artificial bees are classified into three categories: employed, onlooker and scout bees. Half of the colony are employed bees and the rest are onlooker bees. The duty of employed bees is to search for food sources, which are the candidate solutions. Later, the nectars amount is calculated. Then, the obtained information is shared with the waiting onlooker bees in the hive. The onlooker bees exploit a nectar source depending on the shared information by the employed bees. The onlooker bees also determine the source to be ignored and allocate its employed bee as scout bees. While the task of the scout bees is to search for new food sources locations.
3.2 Particle Swarm Optimization
Particle Swarm Optimization (PSO) is a stochastic meta- heuristic optimization algorithm based on the movement and intelligence of swarms, motivated by the social behavior, and originally designed and developed by Eberhart and Kennedy [32-33-34]. The population of PSO is called a swarm and each candidate solution is called a particle [35]. PSO simulates the behaviors of a flock of birds. In such a flock a group of birds are randomly searching for food in a certain area. There is only one piece of food in that area. Not all the birds know
IJSER
International Journal of Scientific & Engineering Research Volume 11, Issue 2, February-2020 960
ISSN 2229-5518
960 IJSER © 2020
http://www.ijser.org
where the food is, but they know how far they are away from the food in each iteration. So the effective strategy is to follow the bird which is nearest to the food. PSO learned from this flock scenario and used it to solve the optimization problem. In PSO, each single particle is a "bird" in the search space. All particles have fitness values which are determined by the fitness function to be optimized, and have velocities which is used to update the particles positions. The particles explore the problem space by following the current optimum particles. PSO is initialized with a number of random candidate solutions and then searches for optimum ones by updating generations. In every iteration, the position of each particle is updated by following two "best" values. The first one is the best solution it has achieved so far. This value is called pbest. Another "best" value that is tracked is the best solution obtained so far by any particle in the swarm. This best value is a global best and called gbest.
4 METHODOLOGY
A hierarchical scaling system which is proposed by [26] and is
designed according to the Egyptian Informal Settlement
Development Fund (ISDF) classifications to slum areas which
classifies slums into unplanned areas and unsafe areas [36].is
used in models formulation. The proposed scaling system is
classified hierarchically into three levels; namely priority
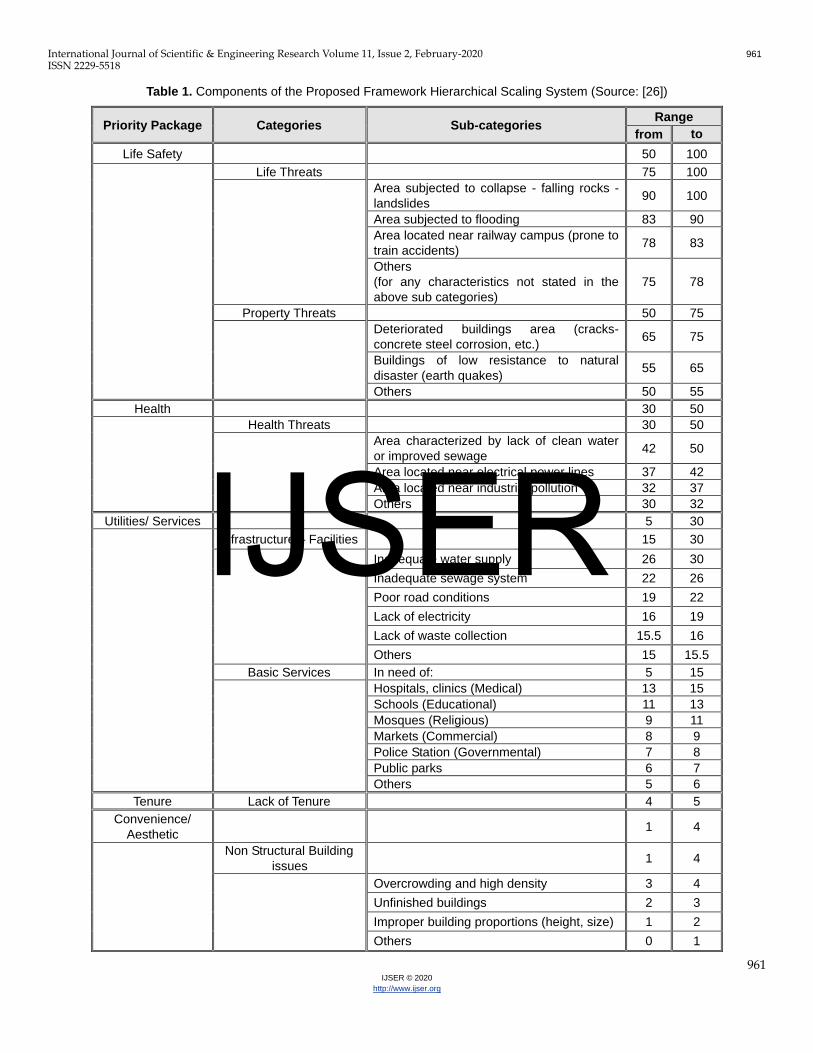
packages, categories, and subcategories, there are five main
priority packages in the proposed framework covering
intervention projects addressing life safety, health,
utilities/services, tenure, and convenience/aesthetics.
The priority packages are used to guarantee that any
intervention strategy complies with all safety, health, and urban
constraints. They are used to define high-level priorities
among the proposed intervention projects. While in case of
projects within the same priority package, an urgency factor is
computed for each project. These urgency factors are
computed based on a number of criteria including the project
category and subcategory. The scaling system is summarized
in Table 1
IJSER
International Journal of Scientific & Engineering Research Volume 11, Issue 2, February-2020 961
ISSN 2229-5518
961 IJSER © 2020
http://www.ijser.org
Table 1. Components of the Proposed Framework Hierarchical Scaling System (Source: [26])
Priority Package Categories Sub-categories Range
from to
Life Safety 50 100
Life Threats 75 100
Area subjected to collapse - falling rocks -
landslides 90 100
Area subjected to flooding 83 90
Area located near railway campus (prone to
train accidents) 78 83
Others
(for any characteristics not stated in the
above sub categories)
75 78
Property Threats 50 75
Deteriorated buildings area (cracks-
concrete steel corrosion, etc.) 65 75
Buildings of low resistance to natural
disaster (earth quakes) 55 65
Others 50 55
Health 30 50
Health Threats 30 50
Area characterized by lack of clean water
or improved sewage 42 50
Area located near electrical power lines 37 42
Area located near industrial pollution 32 37
Others 30 32
Utilities/ Services 5 30
Infrastructure – Facilities 15 30
Inadequate water supply 26 30
Inadequate sewage system 22 26
Poor road conditions 19 22
Lack of electricity 16 19
Lack of waste collection 15.5 16
Others 15 15.5
Basic Services In need of: 5 15
Hospitals, clinics (Medical) 13 15
Schools (Educational) 11 13
Mosques (Religious) 9 11
Markets (Commercial) 8 9
Police Station (Governmental) 7 8
Public parks 6 7
Others 5 6
Tenure Lack of Tenure 4 5
Convenience/
Aesthetic 1 4
Non Structural Building
issues 1 4
Overcrowding and high density 3 4
Unfinished buildings 2 3
Improper building proportions (height, size) 1 2
Others 0 1
IJSER
International Journal of Scientific & Engineering Research Volume 11, Issue 2, February-2020 962
ISSN 2229-5518
962 IJSER © 2020
http://www.ijser.org
363534333231302928272625242322212019181716151413121110987654321
Maximize
Area of Benefit Index (inside
curve)
3
2
sD
Project
5
Minimize
Area of Benefit Index
(outside curve)
4
1
Time (month)
4.1 Optimization Model
This section introduces the following: (1) The proposed optimization model design presenting optimization objective, decision variables, constraints variables and implementation of this optimization mode and (2) The models validation including the structured interviews with experts in slums upgrading projects and the results of these interviews.
4.1.1 Optimization Model Objective
The objective of this model is the same as the objective of benefit/ cost analysis model discussed in the previous chapter which is identifying the optimal priorities among slums intervention projects that achieve the main objective which is maximizing the benefits of upgrading projects to slum dwellers by accelerating the delivery of the urgent projects. To achieve this objective, this model is designed to utilize single objective optimization algorithms. The following section briefly describe the proposed model design presenting optimization objective, decision variables, constraints variables and implementation design of this optimization model
4.1.2 Optimization Model Design
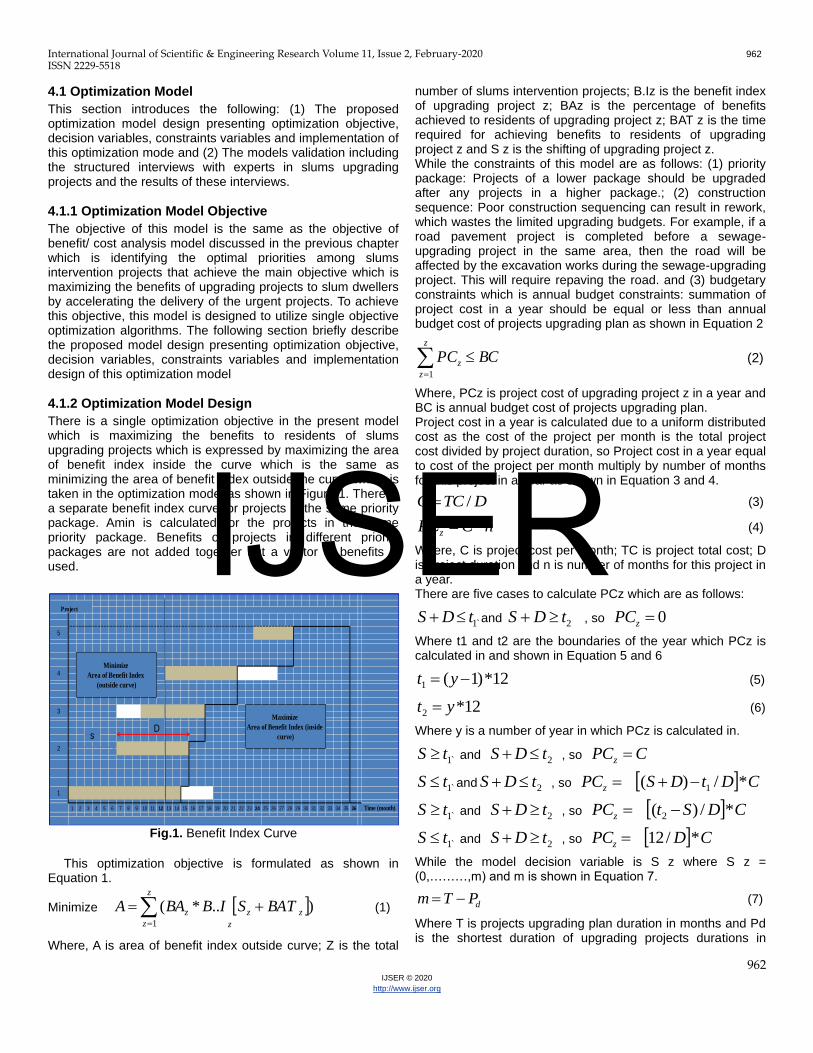
There is a single optimization objective in the present model which is maximizing the benefits to residents of slums upgrading projects which is expressed by maximizing the area of benefit index inside the curve which is the same as minimizing the area of benefit index outside the curve which is taken in the optimization model as shown in Figure 1. There is a separate benefit index curve for projects in the same priority package. Amin is calculated for the projects in the same priority package. Benefits of projects in different priority packages are not added together but a vector of benefits is used.
Fig.1. Benefit Index Curve
This optimization objective is formulated as shown in
Equation 1.
Minimize )..*(1
zz
z
z
z
z BATSIBBAA
(1)
Where, A is area of benefit index outside curve; Z is the total
number of slums intervention projects; B.Iz is the benefit index of upgrading project z; BAz is the percentage of benefits achieved to residents of upgrading project z; BAT z is the time required for achieving benefits to residents of upgrading project z and S z is the shifting of upgrading project z. While the constraints of this model are as follows: (1) priority package: Projects of a lower package should be upgraded after any projects in a higher package.; (2) construction sequence: Poor construction sequencing can result in rework, which wastes the limited upgrading budgets. For example, if a road pavement project is completed before a sewage-upgrading project in the same area, then the road will be affected by the excavation works during the sewage-upgrading project. This will require repaving the road. and (3) budgetary constraints which is annual budget constraints: summation of project cost in a year should be equal or less than annual budget cost of projects upgrading plan as shown in Equation 2
z
z
z BCPC1
(2)
Where, PCz is project cost of upgrading project z in a year and BC is annual budget cost of projects upgrading plan. Project cost in a year is calculated due to a uniform distributed cost as the cost of the project per month is the total project cost divided by project duration, so Project cost in a year equal to cost of the project per month multiply by number of months for this project in a year as shown in Equation 3 and 4.
DTCC / (3)
nCPCz * (4)
Where, C is project cost per month; TC is project total cost; D is project duration and n is number of months for this project in a year. There are five cases to calculate PCz which are as follows:
`1tDS and 2tDS , so 0zPC
Where t1 and t2 are the boundaries of the year which PCz is calculated in and shown in Equation 5 and 6
12*)1(1 yt (5)
12*2 yt (6)
Where y is a number of year in which PCz is calculated in.
`1tS and 2tDS , so CPCz
`1tS and 2tDS , so CDtDSPCz */)( 1
`1tS and 2tDS , so CDStPCz */)( 2
`1tS and 2tDS , so CDPCz */12
While the model decision variable is S z where S z = (0,………,m) and m is shown in Equation 7.
dPTm (7)
Where T is projects upgrading plan duration in months and Pd is the shortest duration of upgrading projects durations in
IJSER
International Journal of Scientific & Engineering Research Volume 11, Issue 2, February-2020 963
ISSN 2229-5518
963 IJSER © 2020
http://www.ijser.org
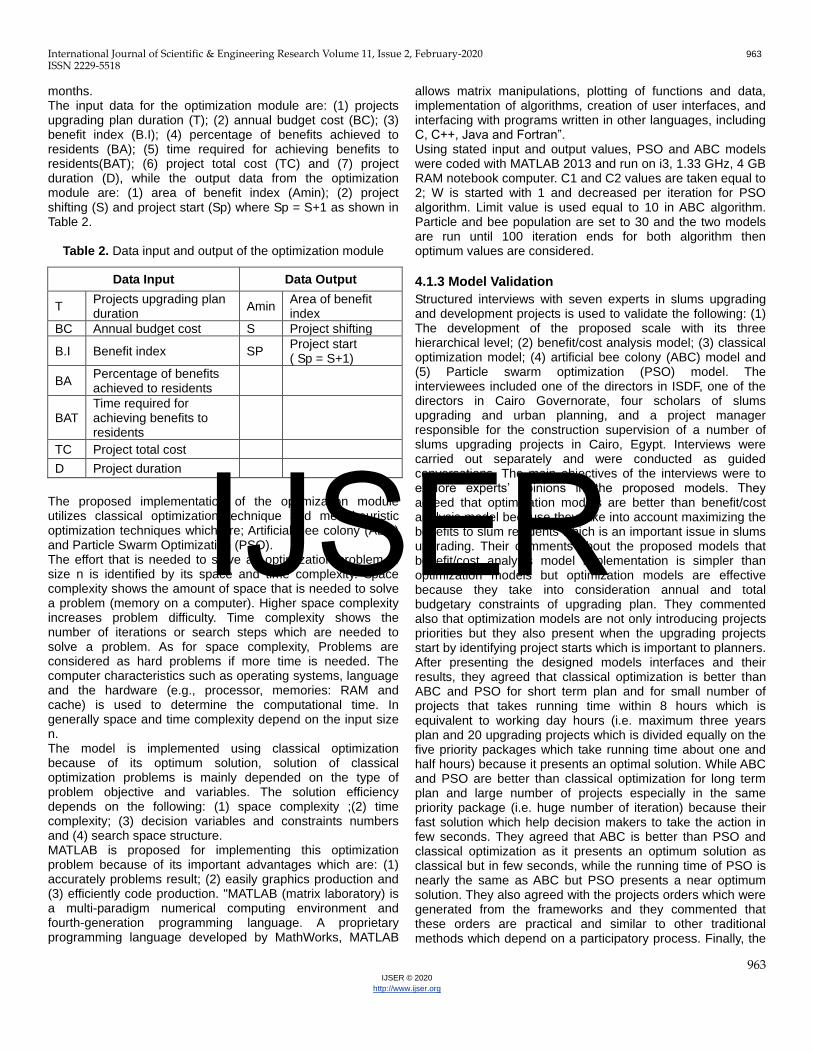
months. The input data for the optimization module are: (1) projects upgrading plan duration (T); (2) annual budget cost (BC); (3) benefit index (B.I); (4) percentage of benefits achieved to residents (BA); (5) time required for achieving benefits to residents(BAT); (6) project total cost (TC) and (7) project duration (D), while the output data from the optimization module are: (1) area of benefit index (Amin); (2) project shifting (S) and project start (Sp) where Sp = S+1 as shown in Table 2.
Table 2. Data input and output of the optimization module
The proposed implementation of the optimization module utilizes classical optimization technique and meta-heuristic optimization techniques which are; Artificial Bee colony (ABC) and Particle Swarm Optimization (PSO). The effort that is needed to solve an optimization problem of size n is identified by its space and time complexity. Space complexity shows the amount of space that is needed to solve a problem (memory on a computer). Higher space complexity increases problem difficulty. Time complexity shows the number of iterations or search steps which are needed to solve a problem. As for space complexity, Problems are considered as hard problems if more time is needed. The computer characteristics such as operating systems, language and the hardware (e.g., processor, memories: RAM and cache) is used to determine the computational time. In generally space and time complexity depend on the input size n. The model is implemented using classical optimization because of its optimum solution, solution of classical optimization problems is mainly depended on the type of problem objective and variables. The solution efficiency depends on the following: (1) space complexity ;(2) time complexity; (3) decision variables and constraints numbers and (4) search space structure. MATLAB is proposed for implementing this optimization problem because of its important advantages which are: (1) accurately problems result; (2) easily graphics production and (3) efficiently code production. "MATLAB (matrix laboratory) is a multi-paradigm numerical computing environment and fourth-generation programming language. A proprietary programming language developed by MathWorks, MATLAB
allows matrix manipulations, plotting of functions and data, implementation of algorithms, creation of user interfaces, and interfacing with programs written in other languages, including C, C++, Java and Fortran”. Using stated input and output values, PSO and ABC models were coded with MATLAB 2013 and run on i3, 1.33 GHz, 4 GB RAM notebook computer. C1 and C2 values are taken equal to 2; W is started with 1 and decreased per iteration for PSO algorithm. Limit value is used equal to 10 in ABC algorithm. Particle and bee population are set to 30 and the two models are run until 100 iteration ends for both algorithm then optimum values are considered.
4.1.3 Model Validation
Structured interviews with seven experts in slums upgrading and development projects is used to validate the following: (1) The development of the proposed scale with its three hierarchical level; (2) benefit/cost analysis model; (3) classical optimization model; (4) artificial bee colony (ABC) model and (5) Particle swarm optimization (PSO) model. The interviewees included one of the directors in ISDF, one of the directors in Cairo Governorate, four scholars of slums upgrading and urban planning, and a project manager responsible for the construction supervision of a number of slums upgrading projects in Cairo, Egypt. Interviews were carried out separately and were conducted as guided conversations. The main objectives of the interviews were to explore experts’ opinions in the proposed models. They agreed that optimization models are better than benefit/cost analysis model because they take into account maximizing the benefits to slum residents which is an important issue in slums upgrading. Their comments about the proposed models that benefit/cost analysis model implementation is simpler than optimization models but optimization models are effective because they take into consideration annual and total budgetary constraints of upgrading plan. They commented also that optimization models are not only introducing projects priorities but they also present when the upgrading projects start by identifying project starts which is important to planners. After presenting the designed models interfaces and their results, they agreed that classical optimization is better than ABC and PSO for short term plan and for small number of projects that takes running time within 8 hours which is equivalent to working day hours (i.e. maximum three years plan and 20 upgrading projects which is divided equally on the five priority packages which take running time about one and half hours) because it presents an optimal solution. While ABC and PSO are better than classical optimization for long term plan and large number of projects especially in the same priority package (i.e. huge number of iteration) because their fast solution which help decision makers to take the action in few seconds. They agreed that ABC is better than PSO and classical optimization as it presents an optimum solution as classical but in few seconds, while the running time of PSO is nearly the same as ABC but PSO presents a near optimum solution. They also agreed with the projects orders which were generated from the frameworks and they commented that these orders are practical and similar to other traditional methods which depend on a participatory process. Finally, the
Data Input Data Output
T Projects upgrading plan duration
Amin Area of benefit index
BC Annual budget cost S Project shifting
B.I Benefit index SP Project start ( Sp = S+1)
BA Percentage of benefits achieved to residents
BAT Time required for achieving benefits to residents
TC Project total cost D Project duration
IJSER
International Journal of Scientific & Engineering Research Volume 11, Issue 2, February-2020 964
ISSN 2229-5518
964 IJSER © 2020
http://www.ijser.org
interviewers approved the designed four models interfaces as they help the users to apply the models without using complex calculations. The following section presents the illustrative example used for testing the proposed models.
4.1.4 Illustrative Example
The objective of this illustrative example is to demonstrate the potentials of implementing the proposed models in two areas which are Ezbet Bekhit a part of Manshiet Nasser district and Ezbet El-Nasr a part of Basateen district. Ezbet Bekhit is a part of Manshiet Nasser, Manshiet Nasser is a squatter settlement entirely built on government owned land in Cairo, Egypt, with a population of about 300,000. Ezbet Bekhit area is estimated at 42 feddans. It has a population of 37,000 residents [37-38]. It is strategically located in a crossroad. On its northwest side lies the highway connecting Cairo downtown to Nasr City and its northeast border is Tayaran Street terminating at a security forces camp. It is surrounded from the east and south sides by other areas within Manshiet Nasser. The main topographic features of the area are characterized by sharp edges and mountain cliffs. Ezbet Bekhit has no access from the south and west sides and the sharp cliffs constitute a potential risk from falling stones [38]. Ezbet El-Nasr is an informal settlement situated in the Basateen District, in the South Zone of Cairo Governorate. Located 4 km east of the Nile River and 8 km south of Cairo’s historic centre, the site was planned as an industrial area in Cairo’s outskirts. As Cairo expanded, the settlement became increasingly integrated into the city and today it is in a strategic position adjacent to several new formal housing developments. Estimated population residing in the 55 hectares of Ezbet El-Nasr total area is about 72,000 inhabitants [37]. The residents occupy 30 hectares while another 25 hectares are dedicated to the Jewish cemetery. The main population was generated from the migration of people from all over Egypt. It was a strategic location, near the Autostrade and the Ring-Road, with factories nearby and on the periphery of the area to provide jobs. The settlement is bounded by a slaughterhouse in the North, commercial developments in the East and dense residential areas in the south and west. A Literature reviews, site visits, meetings and interviews with residents and relevant authorities are used in studying these two areas. In Ezbet Bekhit, the area needs five projects which are: (1) new buildings project to relocate slum residents; (2) water supply project; (3) sewage upgrading project; (4) electricity project and (5) roads pavement project. While Ezbet El-Nasr area needs three projects which are: (1) hospital project: (2) police station project and (3) improving sewage network project. The following sections present briefly the implementation of the three proposed optimization models.
4.2 Enumeration- Based Optimization Model Implementation
The optimization module is implemented using Enumeration- Based Optimization technique. In Ezbet Bekhit area, based on scaling system [26]. there are 5 upgrading projects under two priority packages which are: (1) 1 project under priority
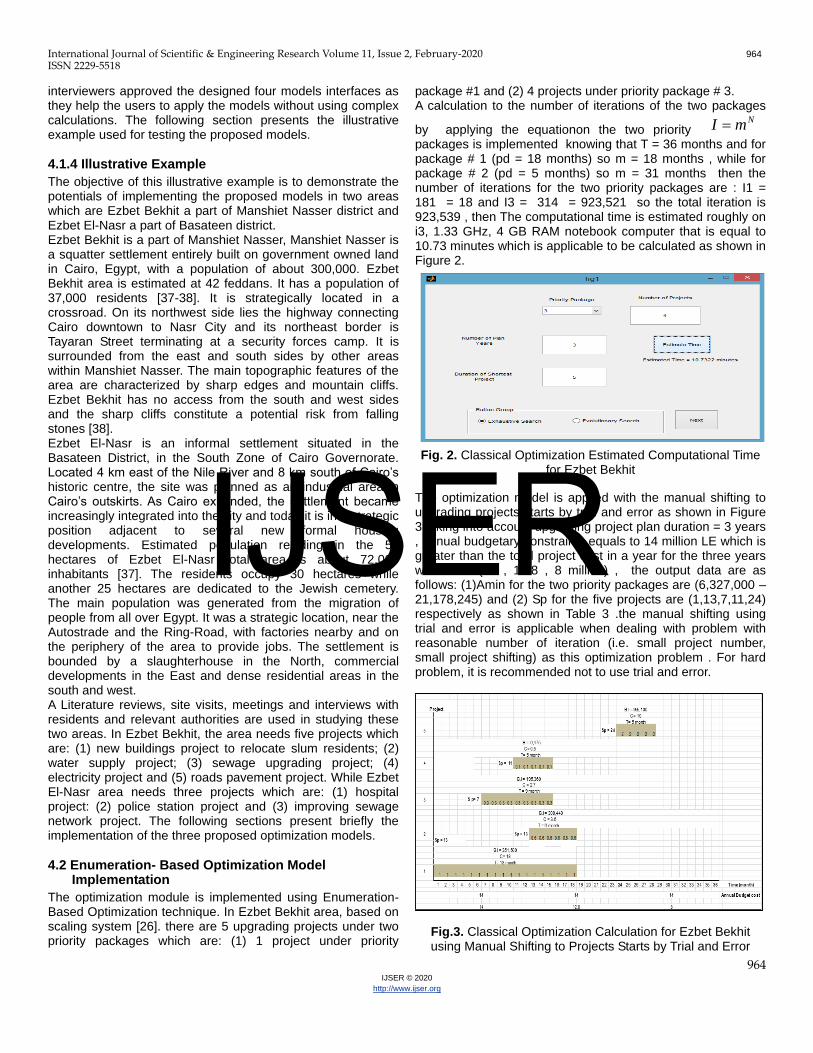
package #1 and (2) 4 projects under priority package # 3. A calculation to the number of iterations of the two packages
by applying the equation NmI on the two priority
packages is implemented knowing that T = 36 months and for package # 1 (pd = 18 months) so m = 18 months , while for package # 2 (pd = 5 months) so m = 31 months then the number of iterations for the two priority packages are : I1 = 181 = 18 and I3 = 314 = 923,521 so the total iteration is 923,539 , then The computational time is estimated roughly on i3, 1.33 GHz, 4 GB RAM notebook computer that is equal to 10.73 minutes which is applicable to be calculated as shown in Figure 2.
Fig. 2. Classical Optimization Estimated Computational Time for Ezbet Bekhit
The optimization model is applied with the manual shifting to upgrading projects starts by trial and error as shown in Figure 3 taking into account upgrading project plan duration = 3 years , annual budgetary constraints equals to 14 million LE which is greater than the total project cost in a year for the three years which are (14 , 12.8 , 8 million) , the output data are as follows: (1)Amin for the two priority packages are (6,327,000 – 21,178,245) and (2) Sp for the five projects are (1,13,7,11,24) respectively as shown in Table 3 .the manual shifting using trial and error is applicable when dealing with problem with reasonable number of iteration (i.e. small project number, small project shifting) as this optimization problem . For hard problem, it is recommended not to use trial and error.
Fig.3. Classical Optimization Calculation for Ezbet Bekhit using Manual Shifting to Projects Starts by Trial and Error
IJSER
International Journal of Scientific & Engineering Research Volume 11, Issue 2, February-2020 965
ISSN 2229-5518
965 IJSER © 2020
http://www.ijser.org
The results of priorities of intervention projects are summarized in Table 3. Table 3. Enumeration- Based Optimization Model Calculations
of Ezbet Bekhit
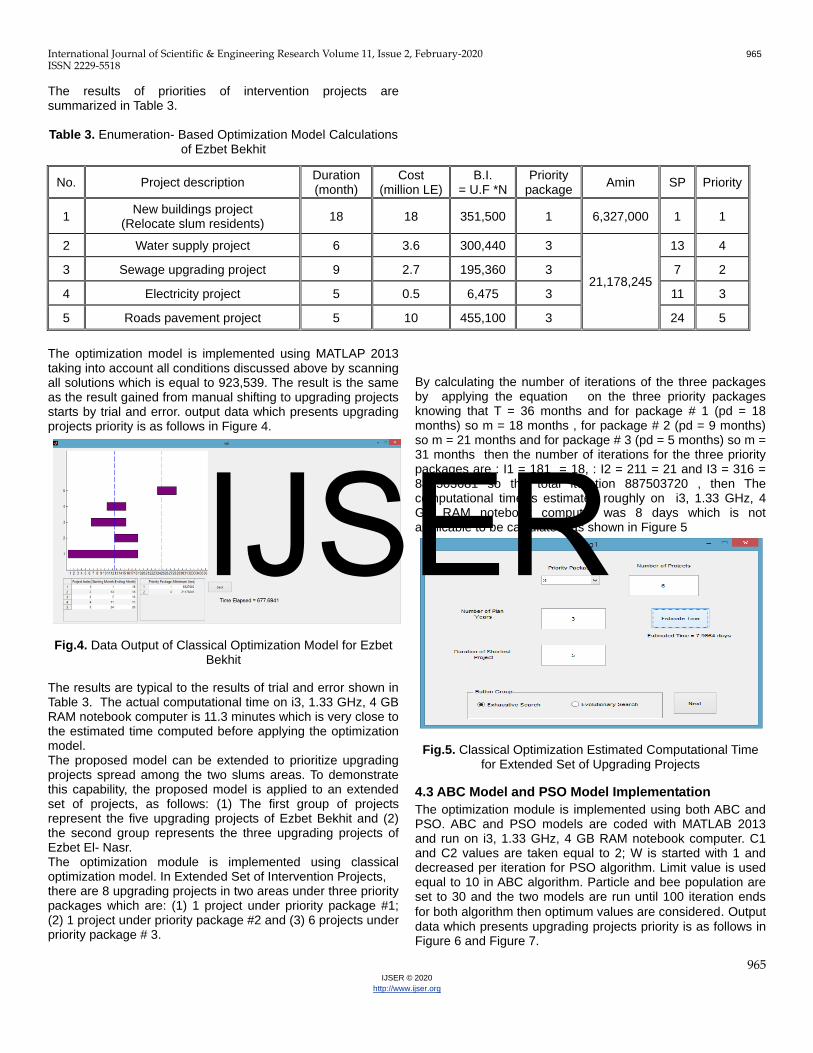
The optimization model is implemented using MATLAP 2013 taking into account all conditions discussed above by scanning all solutions which is equal to 923,539. The result is the same as the result gained from manual shifting to upgrading projects starts by trial and error. output data which presents upgrading projects priority is as follows in Figure 4.
Fig.4. Data Output of Classical Optimization Model for Ezbet Bekhit
The results are typical to the results of trial and error shown in Table 3. The actual computational time on i3, 1.33 GHz, 4 GB RAM notebook computer is 11.3 minutes which is very close to the estimated time computed before applying the optimization model. The proposed model can be extended to prioritize upgrading projects spread among the two slums areas. To demonstrate this capability, the proposed model is applied to an extended set of projects, as follows: (1) The first group of projects represent the five upgrading projects of Ezbet Bekhit and (2) the second group represents the three upgrading projects of Ezbet El- Nasr. The optimization module is implemented using classical optimization model. In Extended Set of Intervention Projects, there are 8 upgrading projects in two areas under three priority packages which are: (1) 1 project under priority package #1; (2) 1 project under priority package #2 and (3) 6 projects under priority package # 3.
By calculating the number of iterations of the three packages by applying the equation on the three priority packages knowing that T = 36 months and for package # 1 (pd = 18 months) so m = 18 months , for package # 2 (pd = 9 months) so m = 21 months and for package # 3 (pd = 5 months) so m = 31 months then the number of iterations for the three priority packages are : I1 = 181 = 18, : I2 = 211 = 21 and I3 = 316 = 887503681 so the total iteration 887503720 , then The computational time is estimated roughly on i3, 1.33 GHz, 4 GB RAM notebook computer was 8 days which is not applicable to be calculated as shown in Figure 5
Fig.5. Classical Optimization Estimated Computational Time for Extended Set of Upgrading Projects
4.3 ABC Model and PSO Model Implementation
The optimization module is implemented using both ABC and PSO. ABC and PSO models are coded with MATLAB 2013 and run on i3, 1.33 GHz, 4 GB RAM notebook computer. C1 and C2 values are taken equal to 2; W is started with 1 and decreased per iteration for PSO algorithm. Limit value is used equal to 10 in ABC algorithm. Particle and bee population are set to 30 and the two models are run until 100 iteration ends
for both algorithm then optimum values are considered. Output data which presents upgrading projects priority is as follows in Figure 6 and Figure 7.
No. Project description Duration (month)
Cost (million LE)
B.I. = U.F *N
Priority package
Amin SP Priority
1 New buildings project
(Relocate slum residents) 18 18 351,500 1 6,327,000 1 1
2 Water supply project 6 3.6 300,440 3
21,178,245
13 4
3 Sewage upgrading project 9 2.7 195,360 3 7 2
4 Electricity project 5 0.5 6,475 3 11 3
5 Roads pavement project 5 10 455,100 3 24 5
IJSER
International Journal of Scientific & Engineering Research Volume 11, Issue 2, February-2020 966
ISSN 2229-5518
966 IJSER © 2020
http://www.ijser.org
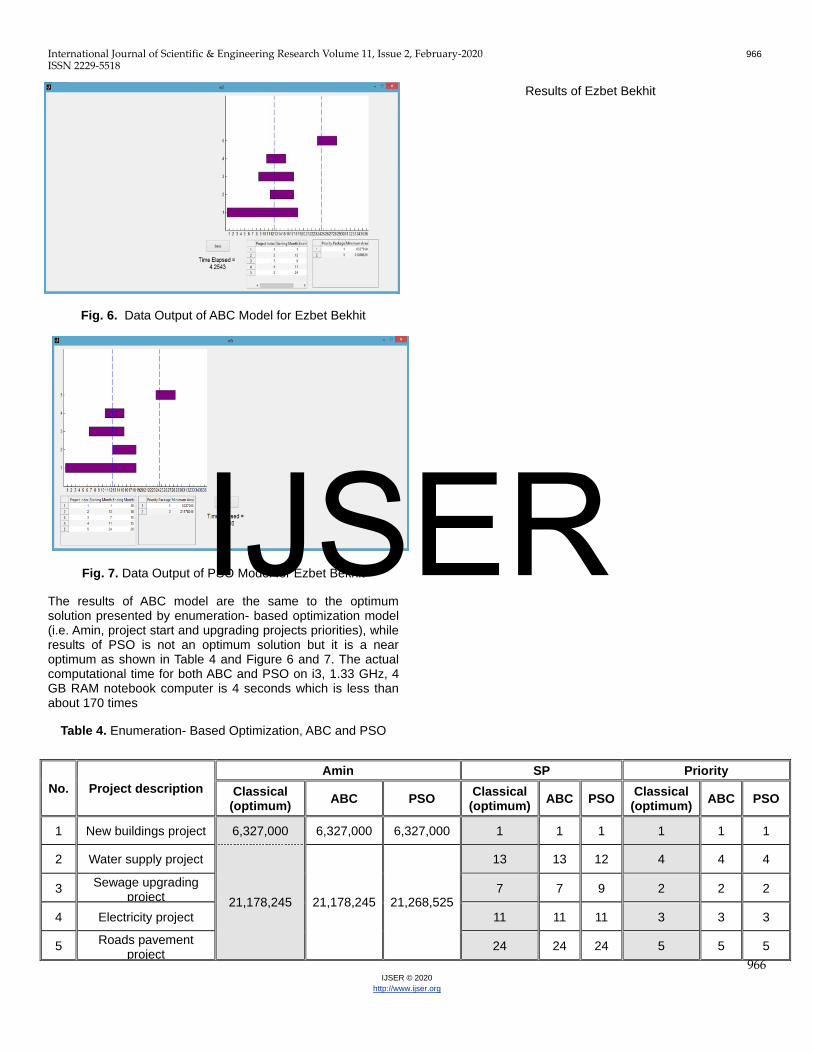
Fig. 6. Data Output of ABC Model for Ezbet Bekhit
Fig. 7. Data Output of PSO Model for Ezbet Bekhit
The results of ABC model are the same to the optimum solution presented by enumeration- based optimization model (i.e. Amin, project start and upgrading projects priorities), while results of PSO is not an optimum solution but it is a near optimum as shown in Table 4 and Figure 6 and 7. The actual computational time for both ABC and PSO on i3, 1.33 GHz, 4 GB RAM notebook computer is 4 seconds which is less than about 170 times
Table 4. Enumeration- Based Optimization, ABC and PSO
Results of Ezbet Bekhit
No. Project description
Amin SP Priority
Classical (optimum)
ABC PSO Classical
(optimum) ABC PSO
Classical (optimum)
ABC PSO
1 New buildings project 6,327,000 6,327,000 6,327,000 1 1 1 1 1 1
2 Water supply project
21,178,245 21,178,245 21,268,525
13 13 12 4 4 4
3 Sewage upgrading
project 7 7 9 2 2 2
4 Electricity project 11 11 11 3 3 3
5 Roads pavement
project 24 24 24 5 5 5
IJSER
International Journal of Scientific & Engineering Research Volume 11, Issue 2, February-2020 967
ISSN 2229-5518
967 IJSER © 2020
http://www.ijser.org
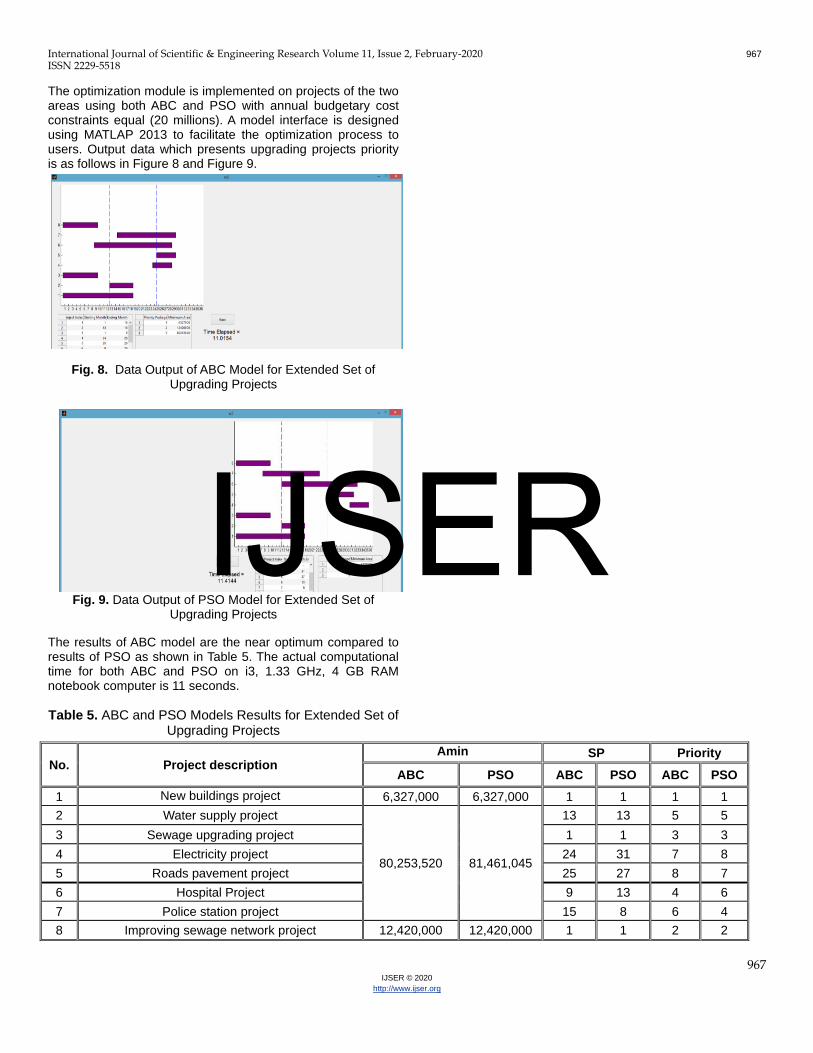
The optimization module is implemented on projects of the two areas using both ABC and PSO with annual budgetary cost constraints equal (20 millions). A model interface is designed using MATLAP 2013 to facilitate the optimization process to users. Output data which presents upgrading projects priority is as follows in Figure 8 and Figure 9.
Fig. 8. Data Output of ABC Model for Extended Set of Upgrading Projects
Fig. 9. Data Output of PSO Model for Extended Set of Upgrading Projects
The results of ABC model are the near optimum compared to results of PSO as shown in Table 5. The actual computational time for both ABC and PSO on i3, 1.33 GHz, 4 GB RAM notebook computer is 11 seconds.
Table 5. ABC and PSO Models Results for Extended Set of Upgrading Projects
No. Project description Amin SP Priority
ABC PSO ABC PSO ABC PSO
1 New buildings project 6,327,000 6,327,000 1 1 1 1
2 Water supply project
80,253,520 81,461,045
13 13 5 5
3 Sewage upgrading project 1 1 3 3
4 Electricity project 24 31 7 8
5 Roads pavement project 25 27 8 7
6 Hospital Project 9 13 4 6
7 Police station project 15 8 6 4
8 Improving sewage network project 12,420,000 12,420,000 1 1 2 2
IJSER
International Journal of Scientific & Engineering Research Volume 11, Issue 2, February-2020 968
ISSN 2229-5518
968 IJSER © 2020
http://www.ijser.org
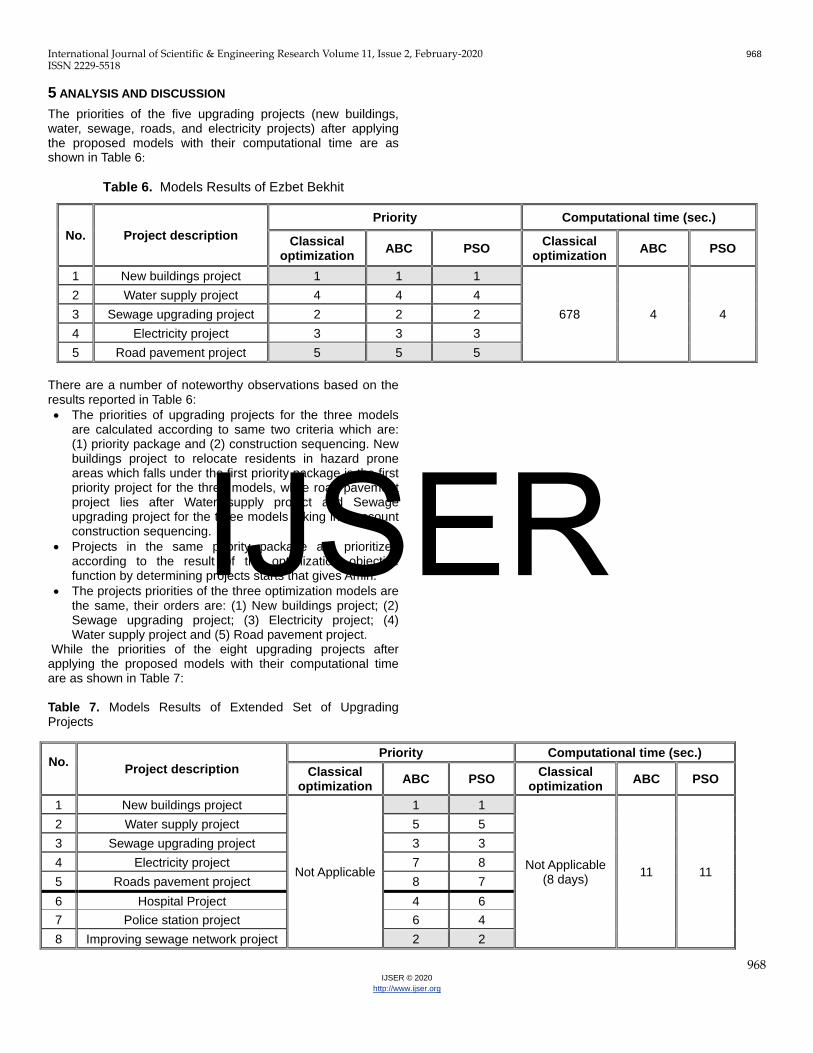
5 ANALYSIS AND DISCUSSION
The priorities of the five upgrading projects (new buildings, water, sewage, roads, and electricity projects) after applying the proposed models with their computational time are as shown in Table 6:
Table 6. Models Results of Ezbet Bekhit
There are a number of noteworthy observations based on the results reported in Table 6:
The priorities of upgrading projects for the three models are calculated according to same two criteria which are: (1) priority package and (2) construction sequencing. New buildings project to relocate residents in hazard prone areas which falls under the first priority package is the first priority project for the three models, while road pavement project lies after Water supply project and Sewage upgrading project for the three models taking into account construction sequencing.
Projects in the same priority package are prioritized according to the result of the optimization objective function by determining projects starts that gives Amin.
The projects priorities of the three optimization models are the same, their orders are: (1) New buildings project; (2) Sewage upgrading project; (3) Electricity project; (4) Water supply project and (5) Road pavement project.
While the priorities of the eight upgrading projects after applying the proposed models with their computational time are as shown in Table 7: Table 7. Models Results of Extended Set of Upgrading Projects
No. Project description
Priority Computational time (sec.)
Classical optimization
ABC PSO Classical
optimization ABC PSO
1 New buildings project 1 1 1
678 4 4
2 Water supply project 4 4 4
3 Sewage upgrading project 2 2 2
4 Electricity project 3 3 3
5 Road pavement project 5 5 5
No.
Project description
Priority Computational time (sec.)
Classical optimization
ABC PSO Classical
optimization ABC PSO
1 New buildings project
Not Applicable
1 1
Not Applicable (8 days)
11 11
2 Water supply project 5 5
3 Sewage upgrading project 3 3
4 Electricity project 7 8
5 Roads pavement project 8 7
6 Hospital Project 4 6
7 Police station project 6 4
8 Improving sewage network project 2 2
IJSER
International Journal of Scientific & Engineering Research Volume 11, Issue 2, February-2020 969
ISSN 2229-5518
969 IJSER © 2020
http://www.ijser.org
There are a number of noteworthy observations based on the results reported in Table 7:
The priorities of upgrading projects for classical optimization model is not applicable to be calculated due to a roughly estimation to the computational time on i3, 1.33 GHz, 4 GB RAM notebook computer which is 8 days.
The priorities of upgrading projects for the other models are calculated according to same two criteria which are: (1) priority package and (2) construction sequencing. New buildings project to relocate residents in hazard prone areas which falls under the first priority package is the first priority project for the two models, improving sewage network project which falls under second priority package lies in the second order for the two models. While road pavement project of Ezbet Bekhit lies after Water supply project and Sewage upgrading project for the same area for the two models taking into account construction sequencing.
Projects in the same priority are prioritized according to the result of the optimization objective function by determining projects starts that gives Amin.
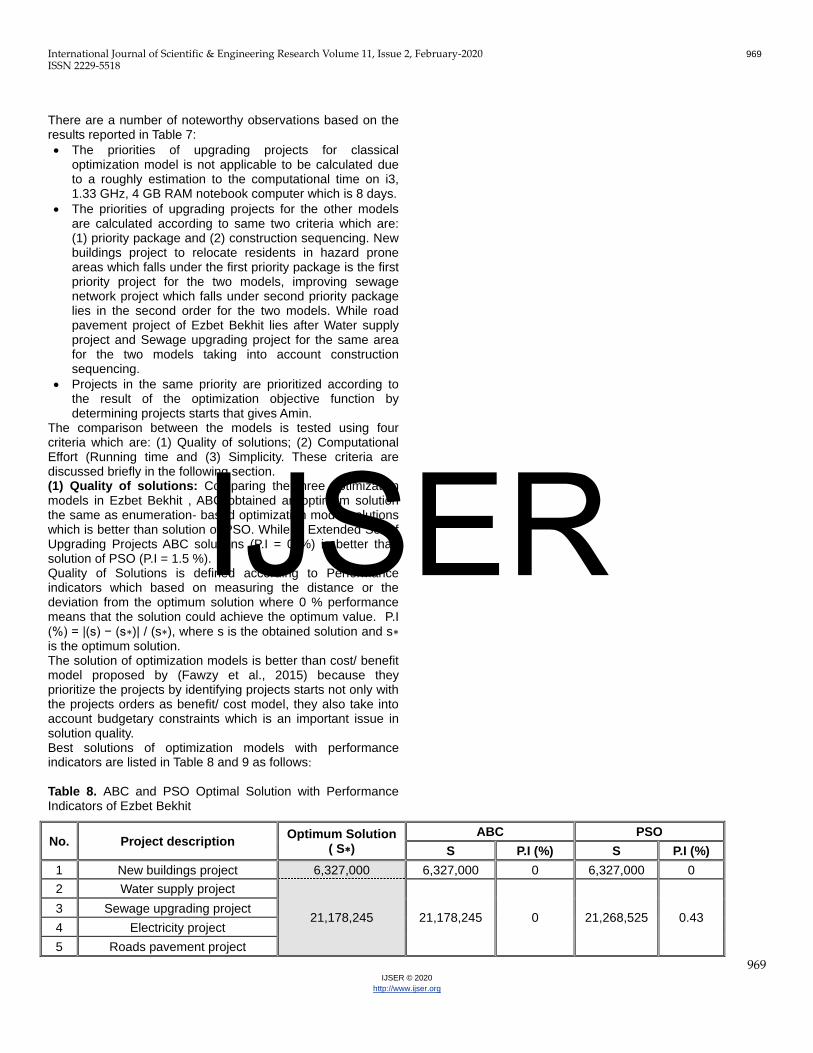
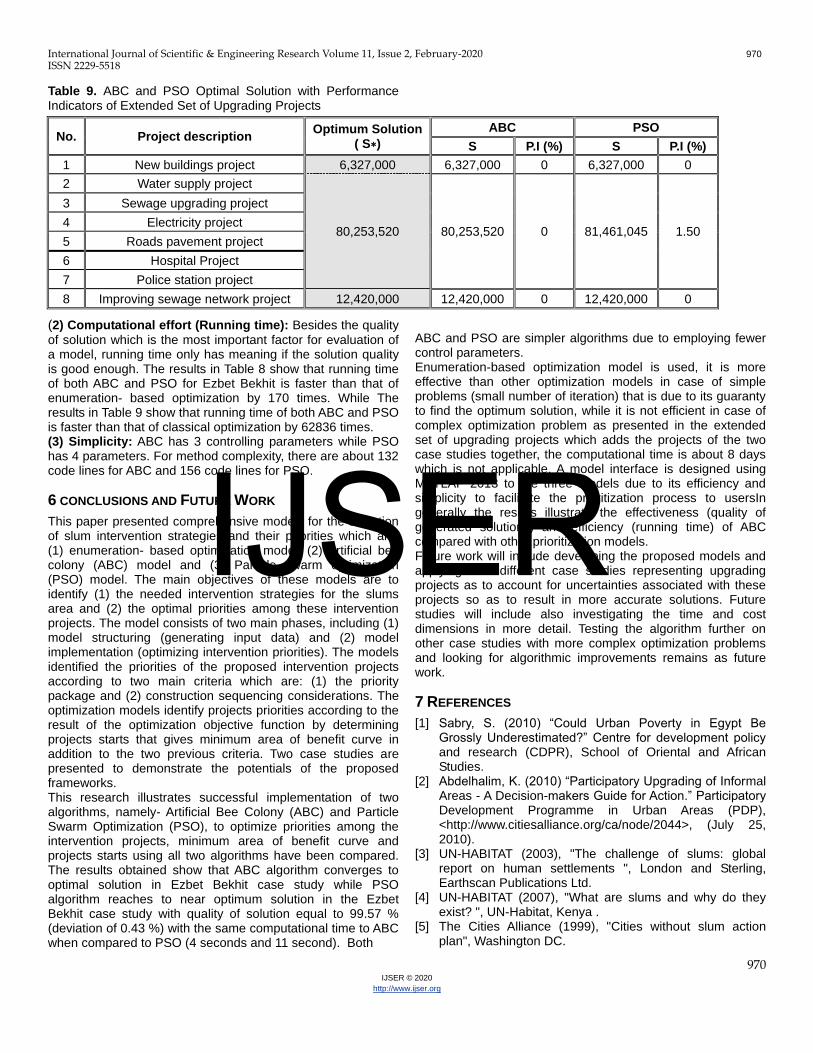
The comparison between the models is tested using four criteria which are: (1) Quality of solutions; (2) Computational Effort (Running time and (3) Simplicity. These criteria are discussed briefly in the following section. (1) Quality of solutions: Comparing the three optimization models in Ezbet Bekhit , ABC obtained an optimum solution the same as enumeration- based optimization model solutions which is better than solution of PSO. While in Extended Set of Upgrading Projects ABC solutions (P.I = 0 %) is better than solution of PSO (P.I = 1.5 %). Quality of Solutions is defined according to Performance indicators which based on measuring the distance or the deviation from the optimum solution where 0 % performance means that the solution could achieve the optimum value. P.I (%) = |(s) − (s∗)| / (s∗), where s is the obtained solution and s∗ is the optimum solution. The solution of optimization models is better than cost/ benefit model proposed by (Fawzy et al., 2015) because they prioritize the projects by identifying projects starts not only with the projects orders as benefit/ cost model, they also take into account budgetary constraints which is an important issue in solution quality. Best solutions of optimization models with performance indicators are listed in Table 8 and 9 as follows:
Table 8. ABC and PSO Optimal Solution with Performance Indicators of Ezbet Bekhit
No. Project description Optimum Solution
( S∗)
ABC PSO
S P.I (%) S P.I (%)
1 New buildings project 6,327,000 6,327,000 0 6,327,000 0
2 Water supply project
21,178,245 21,178,245 0 21,268,525 0.43 3 Sewage upgrading project
4 Electricity project
5 Roads pavement project
IJSER
International Journal of Scientific & Engineering Research Volume 11, Issue 2, February-2020 970
ISSN 2229-5518
970 IJSER © 2020
http://www.ijser.org
Table 9. ABC and PSO Optimal Solution with Performance Indicators of Extended Set of Upgrading Projects
(2) Computational effort (Running time): Besides the quality of solution which is the most important factor for evaluation of a model, running time only has meaning if the solution quality is good enough. The results in Table 8 show that running time of both ABC and PSO for Ezbet Bekhit is faster than that of enumeration- based optimization by 170 times. While The results in Table 9 show that running time of both ABC and PSO is faster than that of classical optimization by 62836 times. (3) Simplicity: ABC has 3 controlling parameters while PSO has 4 parameters. For method complexity, there are about 132 code lines for ABC and 156 code lines for PSO.
6 CONCLUSIONS AND FUTURE WORK
This paper presented comprehensive models for the selection of slum intervention strategies and their priorities which are: (1) enumeration- based optimization model; (2) Artificial bee colony (ABC) model and (3) Particle swarm optimization (PSO) model. The main objectives of these models are to identify (1) the needed intervention strategies for the slums area and (2) the optimal priorities among these intervention projects. The model consists of two main phases, including (1) model structuring (generating input data) and (2) model implementation (optimizing intervention priorities). The models identified the priorities of the proposed intervention projects according to two main criteria which are: (1) the priority package and (2) construction sequencing considerations. The optimization models identify projects priorities according to the result of the optimization objective function by determining projects starts that gives minimum area of benefit curve in addition to the two previous criteria. Two case studies are presented to demonstrate the potentials of the proposed frameworks. This research illustrates successful implementation of two algorithms, namely- Artificial Bee Colony (ABC) and Particle Swarm Optimization (PSO), to optimize priorities among the intervention projects, minimum area of benefit curve and projects starts using all two algorithms have been compared. The results obtained show that ABC algorithm converges to optimal solution in Ezbet Bekhit case study while PSO algorithm reaches to near optimum solution in the Ezbet Bekhit case study with quality of solution equal to 99.57 % (deviation of 0.43 %) with the same computational time to ABC when compared to PSO (4 seconds and 11 second). Both
ABC and PSO are simpler algorithms due to employing fewer control parameters. Enumeration-based optimization model is used, it is more effective than other optimization models in case of simple problems (small number of iteration) that is due to its guaranty to find the optimum solution, while it is not efficient in case of complex optimization problem as presented in the extended set of upgrading projects which adds the projects of the two case studies together, the computational time is about 8 days which is not applicable. A model interface is designed using MATLAP 2013 to the three models due to its efficiency and simplicity to facilitate the prioritization process to usersIn generally the results illustrate the effectiveness (quality of generated solutions) and efficiency (running time) of ABC compared with other prioritization models. Future work will include developing the proposed models and applying it to different case studies representing upgrading projects as to account for uncertainties associated with these projects so as to result in more accurate solutions. Future studies will include also investigating the time and cost dimensions in more detail. Testing the algorithm further on other case studies with more complex optimization problems and looking for algorithmic improvements remains as future work.
7 REFERENCES
[1] Sabry, S. (2010) “Could Urban Poverty in Egypt Be Grossly Underestimated?” Centre for development policy and research (CDPR), School of Oriental and African Studies.
[2] Abdelhalim, K. (2010) “Participatory Upgrading of Informal Areas - A Decision-makers Guide for Action.” Participatory Development Programme in Urban Areas (PDP), <http://www.citiesalliance.org/ca/node/2044>, (July 25, 2010).
[3] UN-HABITAT (2003), "The challenge of slums: global report on human settlements ", London and Sterling, Earthscan Publications Ltd.
[4] UN-HABITAT (2007), "What are slums and why do they exist? ", UN-Habitat, Kenya .
[5] The Cities Alliance (1999), "Cities without slum action plan", Washington DC.
No. Project description Optimum Solution
( S∗)
ABC PSO
S P.I (%) S P.I (%)
1 New buildings project 6,327,000 6,327,000 0 6,327,000 0
2 Water supply project
80,253,520 80,253,520 0 81,461,045 1.50
3 Sewage upgrading project
4 Electricity project
5 Roads pavement project
6 Hospital Project
7 Police station project
8 Improving sewage network project 12,420,000 12,420,000 0 12,420,000 0
IJSER
International Journal of Scientific & Engineering Research Volume 11, Issue 2, February-2020 971
ISSN 2229-5518
971 IJSER © 2020
http://www.ijser.org
[6] Acioly, C. (2002), "The Rationale of Informal Settlements Regularisation Projects: from settlement upgrading to integration approaches". Lecture Notes. Institute for Housing and Urban Development Studies – HIS.
[7] Andres, Camilo (2008), "Learning from Slum Upgrading and Participation". Colombia.
[8] Abiko, A., Cardoso, L., Rinaldelli, R., and Haga, H. (2007). “Basic Costs of Slums Upgrading in Brazil,” Global Urban Development, 3(1), Nov 2007, Washington.
[9] Adedimeji, A.A., Heard, N.J., Odutolu, O., and Omololu, F.M. (2008). “Social factors, social support and condom use behavior among young urban slum inhabitants in southwest Nigeria,” East Afr J Public Health, 5(3), 215-222.
[10] Ancona, A.L. and Lareu, S. (2002). Avaliação do programa Guarapiranga: custos e componentes de infra-estrutura. In: Anais do Seminário de Avaliação de Projetos: Habitação e Meio Ambiente. São Paulo: IPT.
[11] Auyero, J. (2000). “The Logic of Clientelism in Argentina: An Ethnographic Account,” Latin American Research Review, 35(3), 55-81.
[12] Biswas-Diener, R. and Diener, E. (2009). “Making the Best of a Bad Situation: Satisfaction in the Slums of Calcutta”, Culture and Well-Being, Social Indicators Research Series, 38, 261-278.
[13] Carpenter, J.P., Daniere, A.G., and Takahashi, L.M. (2004). “Cooperation, trust, and social capital in Southeast Asian urban slums”, Journal of Economic Behavior & Organization, 55(4), 533-551.
[14] Dietz, H. (1998). Urban Poverty, Political Participation and the State: Lima 1970-1990, University of Pittsburgh Press.
[15] Ferguson, B. and Navarrete, J. (2003). “A financial framework for reducing slums: lessons from experience in Latin America,” Environment and Urbanization, 15(2), 201–215.
[16] Lynch, O.M. (1974). “Political Mobilisation and Ethnicity among Adi-Dravidas in a Bombay Slum,” Economic and Political Weekly, 9(39), (Sep. 28, 1974), pp. 1657-1659+1661-1663+1665+1667-1668.
[17] Portes, A. (1972). “Rationality in the Slum: An Essay on Interpretive Sociology”, Comparative Studies in Society and History, 14, 268-286, Cambridge University Press.
[18] Reis, R.B., Ribeiro, G.S., Felzemburgh, R.D.M., Santana, F.S., Mohr, S., et al. (2008). “Impact of Environment and Social Gradient on Leptospira Infection in Urban Slums.” PLoS Negl Trop Dis, 2(4), e228. doi: 10.1371/journal.pntd.0000228.
[19] Riley, L.W., Ko, A.I., Unger, A., and Reis, M.G. (2007). “Slum health: Diseases of neglected populations,” BMC International Health and Human Rights, 7(2), doi:10.1186/1472-698X-7-2.
[20] Rocha, R.F., Carvalho, C.S., Moretti, R.S., and Samora, P.R. (2002). Procedimentos para tomada de decisão em programas de urbanização de favelas. In: Anais do IX Encontro Nacional de Tecnologia do Ambiente Construído. Foz do Iguaçu: Antac.
[21] Vlahov, D., Freudenberg, N., Proietti, F., Ompad, D., Quinn, A., Nandi, V., and Galea, S. (2007). “Urban as a Determinant of Health”, Journal of Urban Health, 84, Supplement 1, 16-26.
[22] Matouq ,M. (2007), "An Expert System for Developing Informal Settlements", Faculty of Engineering, Cairo University.
[23] Abdel Aziz and El-Anwar (2010), "A Framework for an Automated Decision Support System to Optimize the Upgrading and Replacement Projects for Slums Areas". Proceedings of First International Conference on Sustainability and the Future, the British University in Egypt.
[24] El-Anwar, O. and Abdel Aziz, T. (2011), "An Automated Collaborative Framework to Develop Scenarios for Slums Upgrading Projects According to Implementation Phases and Construction Planning", Proceedings of the ASCE International Workshop on Computing in Civil Engineering, Miami, FL.
[25] El-Anwar, O., and T. A. Aziz (2014), "An Integrated Urban-Construction Planning Framework for Slums Upgrading Projects”, Journal of Construction Engineering and Management, vol. 140, issue 4, pp. 1-12.
[26] Fawzy, M., El-Anwar, O., and Attia, W. (2015), “A Framework for Prioritizing Intervention Projects in Slums”, International Journal of Scientific and Engineering Research (IJSER), Volume 6, Issue10, October 2015
[27] Del Valle, Y., Venayagamoorthy, GK., Mohagheghi, S., Hernandez, JC., Harley, RG, (2008), "Particle swarm optimization: basic concepts, variants and applications in power systems". IEEE Trans Evol Comput 12(2):171–195.
[28] Karaboga, D, Akay, B, (2009), "A comparative study of artificial bee colony algorithm". Appl Math Comput214(12):108–132.
[29] Storn, R., Price, K. (1997), "Differential evolution—a simple and efficient heuristic for global optimization over continuous spaces". J Glob Optim 11(4):341–359.
[30] Dietmar, G. (2005), "Portfolio Management with Heuristic Optimization". Springer, University of Erfurt, Germany
[31] Karaboga,D. (2005), "An Idea Based On Honey Bee Swarm for Numerical Optimization", Technical Report-TR06, Erciyes University, Engineering Faculty, Computer Engineering Department.
[32] Eberhart, R., Kennedy, J. (1995), "A modified optimizer using particle swarm theory". In: Proc. 6th Int. Symp. Micro Machine and Human Science (Nagoya, Japan); p. 39–43.
[33] Eberhart, RC., Kennedy J. (1995), "A new optimizer using particles swarm theory". In: Proc. sixth international symposium on micro machine and human science (Nagoya, Japan). IEEE Service Center: Piscataway, NJ; p. 39–43.
[34] Kennedy, J, Eberhart, RC (1995), "Particle swarm optimization". In: Proc. IEEE international conference on neural networks (Perth, Australia), vol. IV. IEEE Service Center: Piscataway, p. 1942–8.
[35] Kennedy, J (1997), "The particle swarm: social adaptation of knowledge".In: Proc. IEEE international conference on evolutionary computation(Indianapolis, Indiana). IEEE Service Center: Piscataway, p. 303–8.
[36] Informal Settlements Development Fund (ISDF), Terms of references for data collection of slum areas (unsafe and unplanned) in the governorates of the republic. ISDF, 2009
IJSER

International Journal of Scientific & Engineering Research Volume 11, Issue 2, February-2020 972
ISSN 2229-5518
972 IJSER © 2020
http://www.ijser.org
[37] Central Agency for Public Mobilization and Statistics (2013)
[38] El-Araby, M. (2002), "Urban growth and environmental degradation – The case of Cairo". Egypt.
IJSER


![[Challenge:Future] Slums Invasion](https://img.pdfslide.us/doc/110x75/557aa881d8b42a9f2e8b48ec/challengefuture-slums-invasion.jpg)