Embed Size (px)
Citation preview

1
CHAPTER - I
STOCK PRICE VOLATILITY AND INDIAN CAPITAL MARKETS
1.1 Introduction
Economic status of a country is greatly reflected by the introduction of new economic
policy in the middle of the year 1991. The Indian Capital Market has witnessed a tremendous
growth. There was an explosion of investor interest during the nineties and an equity cult
emerged in the country. To experience sustained growth statutory legislations have helped the
capital market. Foreign Exchange Regulations Act is one such legislation in this direction. An
important recent development has been the entry of Foreign Institutional Investors as
participants in the primary and secondary markets for industrial securities. In the past several
years, investments in developing countries have increased remarkably. Among the
developing countries, India has received considerable capital inflows in recent years. The
liberalization policy of the Government of India has now started yielding results and the
country is poised for a big leap in the industrial and economic growth. The economy of the
country is mainly based on the development of the corporate sectors. Funds may be raised
through securities market for financing corporate growth. The Indian capital market has
witnessed radical changes, especially during the last decade. Having discarded the age old
practices like open outcry trading system, physical form of shares and new settlement
procedure, and others, the markets are now operating with world class practices and products.
The reforms in the capital markets have helped to improve efficiency in many aspects
namely, the dissemination of information, transparency in operations, prohibiting unfair trade
practices.
The stock market is one of the most important sources for companies to raise money.
This allows businesses to be publicly traded, or raise additional financial capital for
expansion by selling shares of ownership of the company in a public market. The liquidity
that an exchange affords the investors gives them the ability to quickly and easily sell
securities. This is an attractive feature of investing in stocks, compared to other less liquid
investments such as real estate. Some companies actively increase liquidity by trading in their
own shares. History has shown that the price of shares and other assets is an important part of
the dynamics of economic activity, and can influence or be an indicator of social mood. An
economy where the stock market is on the rise is considered to be an up-and-coming
Please purchase PDF Split-Merge on www.verypdf.com to remove this watermark.

2
economy. In fact, the stock market is often considered the primary indicator of a country's
economic strength and development. Stock prices are changed every day by the market.
Buyers and sellers cause prices to change as they decide how valuable each stock is.
Basically, share prices change because of supply and demand. If more people want to buy a
stock than sell it-the price moves up. Conversely, if more people want to sell a stock, there
would be more supply than demand - the price would start to fall. Volatility in the stock Price
is an integral part of stock market with the alternating bull and bear phases. In the bullish
market, the share prices soar high and in the bearish market, share prices fall down and these
ups and downs, determine the return and volatility of the stock market. Volatility is a
symptom of a highly liquid stock market. Pricing of securities, depends on volatility of each
asset. An increase in stock market volatility brings a large stock price change of advances or
declines. Investors interpret a raise in stock market volatility as an increase in the risk of
equity investment and consequently, they shift their funds to less risky assets. The issues of
price volatility have become increasingly important in recent times to the Indian investors,
regulators, brokers, policy makers, dealers and researchers. Share prices also affect the wealth
of households and their consumption.
1.1.1 Volatility
Volatility is a statistical measure of the dispersion of returns for a given security or
market index. It is generally measured either by using the standard deviation or variance
between returns from that same security or market index. Commonly, the higher the
volatility, the riskier is the security. In terms of option’s pricing, volatility is a variable in
option-pricing formula showing the extent to which the return of the underlying asset will
fluctuate between now and the option’s expiration. Volatility, expressed as a percentage
coefficient within option-pricing formula, arises from daily trading activities. How volatility
is measured, will affect the value of the coefficient used. The concept of volatility refers to a
variable degree of unpredictable change over time. To most investors, risk represents the
variability of an asset’s price. It is typically expressed as the standard deviation of the change
in value of an asset over a given period, typically one year. Volatility, therefore, reflects the
risk taken by someone with exposure to said variable or asset. The more volatile the price of
an asset, the riskier the asset will be. Volatility is much more than the standard deviation of
an asset’s price over time. It is a critical input in valuing options and other derivative
instruments. As such, measures of volatility - historical and prospective - impact the
Please purchase PDF Split-Merge on www.verypdf.com to remove this watermark.

3
valuation and return of a wide range of financial instruments, from interest rates to futures. It
also acts as a barometer of investor sentiment: while high levels of volatility indicate investor
nervousness, low volatility signals a stronger appetite for risk. As a concept, volatility is
simple and intuitive. It measures the variability or dispersion about a central tendency. In
other words, it measures how for the current price of an asset deviates from its average past
values. The study of volatility becomes more important due to the growing linkages of
national markets in currency; commodity and stock with rest of the world markets and
existence of common players have given volatility a new property- that of its speedy
transmissibility across markets.
To many, among the general public, the term volatility, is simply synonymous with
risk: in their view high volatility is to be deplored, because it means that security values are
not dependable and the capital markets are not functioning as well as they should. By
volatility, public seems to mean days when large market movements, particularly down
moves, occur. These precipitous market wide price drops cannot always traced to a specific
news event. Nor should this lack of smoking gun be seen as in any way anomalous in market
for assets like common stock, whose value depends on subjective judgment about cash flow
and resale prices in highly uncertain future. The public takes a more deterministic view of
stock prices; if the market crashes, there must be a specific reason. Asset return variability
can be summarized by statistical distributions. Typically, the normal distribution is used to
characterize a series of returns. The distribution is centred at the mean and its width is
determined by the standard deviation. Return series may not be normally distributed and
often tends to exhibit excess kurtosis, so that extreme values are more likely than the normal
distribution would suggest. Such fat tailed distributions are common with financial
parameters. Skewness is also common, especially with equity returns, where big down moves
are typically more likely than comparable big up moves.
1.1.2 Nature of Stock Market Volatility in Emerging Markets
Emerging markets found to have four distinguishing features: average returns were
higher, correlations with developed markets returns were low, returns were more predictable
and volatility is higher. They argued that Modeling volatility is difficult in emerging markets,
especially in segmented markets. In fully integrated markets, volatility is strongly influenced
by world factors, whereas in segmented markets, it is strongly influenced by local factors.
Please purchase PDF Split-Merge on www.verypdf.com to remove this watermark.

4
More open economies had lower volatility and political risk to a large extent explained the
cross sectional variation in volatility. Finally, they found significant decline in volatility in
emerging markets following capital market liberalization. Bekaert et al. (1998) argued that
emerging markets returns are highly non- normally distributed and exhibit positive skewness
in it.
Generally, the security prices reflect the performance of a company. Both economic
and non-economic factors invariably affect stock return behaviour. Cootner (1964) says that
the prices of securities are typically very sensitive, responsive to all events, both real and
imagined. Again a major factor responsible for stock return fluctuations is speculative
purchase and sale by Foreign Institutional Investors. Indian financial institutions also play a
major role in equity market leading to stock return fluctuations. Many theories have come up
which have empirically verified the investors’ behaviour at the international as well as at the
Indian context. In the present study, it is attempted to test the volatility behaviour, taking 37
companies as the sample size.
Volatility, in simple words, is the variation in the price of financial assets during a
period of time. It is the amount by which the price of a financial asset such as share of a
company has fluctuated or is expected to fluctuate during a period. Thus, it is clear that
volatility measures variability or dispersion. In other words, it measures the deviation from its
average past price. Greater the deviation, the greater is the volatility. Volatility is the measure
of risk and can be used to measure the market risk of an individual asset or an entire portfolio.
Volatility of the financial markets remains a concern for investors, policy makers and
regulators. The concern about volatility stems from the fact that price of an asset under
volatile conditions no longer plays its role as a ‘signal’ about the true value of a firm, a
concept that is core paradigm of the informational efficiency of markets. Volatility is closely
associated with the notion of risk. Risk and uncertainty play critical role in economics. Many
economic models assume that the variance, as a measure of risk and uncertainty, is constant
over time. However, many empirical studies investigating behaviour of returns and volatility
have shown that variance is not constant over time. Most stock returns data are characterized
by a feature called volatility clustering where large volatility tend to be followed by large
volatility and small volatility tend to be followed by small volatility. Thus, volatility can be
predicted as it is determined by the immediate past. In order to model volatility, it is necessary
to formulate an appropriate model not only for variance but also for mean of the data. Engle
Please purchase PDF Split-Merge on www.verypdf.com to remove this watermark.

5
(1982), developed autoregressive conditional heteroscedastic (ARCH) model to capture time
varying variance that has proven to be very useful for Modeling the variance of stock returns
data. The seminal work on ARCH process by Engle (1982) to model volatility and its
generalized from (GARCH) by Bollerslev (1986), has paved a new way of Modeling of
volatility. Much of the empirical work after this has used these models and their various
extensions to incorporate other aspects such as negative asymmetry that is commonly found in
stock return data. This study concentrates on these basic GARCH and asymmetric GARCH
models and evaluates their applicability to some recent Indian stock market data during the
period of the US sub-prime crisis.
Table - 1.1
Volatility* of Major Indices in India
Year/Index BSE
Sensex BSE-100 BSE-500
CNX
Nifty
CNX Nifty
Junior CNX 500
2000-01 2.2 2.4 2.4 2.0 2.8 2.3
2001-02 1.5 1.6 1.6 1.4 1.6 1.6
2002-03 1.0 1.0 1.0 1.0 1.2 1.0
2003-04 1.4 1.5 1.5 1.4 1.6 1.5
2004-05 1.5 1.5 1.6 1.6 1.8 1.7
2005-06 1.0 1.0 1.0 1.0 1.1 1.0
2006-07 1.8 1.8 1.7 1.8 2.1 1.7
2007-08 1.9 2.0 2.0 2.0 2.4 2.0
2008-09 2.8 2.7 2.6 2.7 2.8 2.5
2009-10 1.9 1.8 1.8 1.9 2.0 1.8
2010-11 1.1 1.1 1.1 1.1 1.1 1.0
2011-12 1.3 1.3 1.2 1.3 1.3 1.2
Source: BSE & NSE * Volatility is calculated as the standard deviation of the natural log of returns in indices for
the respective period.
Please purchase PDF Split-Merge on www.verypdf.com to remove this watermark.

6
1.1.3 Forecasting Efficiency of Implied Volatility
The forecasting efficiency of implied volatility is the contemporary phenomenon in
Indian option market. Market expectations are reflected in the option prices about the
distribution of the future value of underlying assets. Under a rational expectations
assumption, the market uses all the information available to form its expectations about future
volatility. Therefore, the market option price displays the market’s true volatility estimate.
Furthermore, the implied volatility is the best possible forecast in case market is efficient.
That is, implied volatility subsumed all necessary information generated by other explanatory
variables to explain future realized volatility. In forecasting volatility, two approaches are
followed. One is the historical variance of the future return and the second is to elicit market
expectations about the future volatility from observed option prices.
Under the assumption that option pricing model correctly represents investors’
behaviour, in deriving the implied volatility from observed option prices and other observable
variables. When the market is informationally efficient, the implied volatility should reflect
the information contained in historical volatility. Hence, forecasts based on historical
volatility should not outperform forecasts based on implied volatilities.
1.1.4 Conceptual Framework of Volatility
The emergence of globalization, leads to stock market booms and the volume of
transactions multiplies its previous quantum, which put the investors, technical analysts,
economists and academicians on high alert for deep studies and understanding the behaviour
of stock market minutely. The stock market development in a nation represents the optimistic
behaviour of investors over there, and the economic development of the nation. With the
liberalization, more and more countries provided access to investors in their markets; one day
number of opportunities comes up for investment in their domestic and foreign markets.
Development of stock markets provides investors with lucrative opportunities to
invest in diversified portfolios across the world. Global investment decisions are taken,
depending upon several aspects, but the knowledge of volatility of market, is a vital aspect
for making smart decisions to get maximum return with minimum risk.
Please purchase PDF Split-Merge on www.verypdf.com to remove this watermark.

7
Globalization enables the investors to make better portfolios in global markets.
Volatility remains high in a single nations portfolio when comparison to international
portfolios in global markets due to economic and political environments, industrial and
business growth rates and inflationary conditions.
To measure the extent of risk involved in an investment, one has to check for the
extent of volatility. It could be said that volatility is the most basic statistical measure of risk.
It can be used to measure the market risk of a single instrument or an entire portfolio of
instruments. The volatility of an asset indicates the variability of its returns. In day to day
practice, volatility is calculated for all sorts of random financial variables such as stock
prices, interest rates, exchange rates, the market value of a portfolio, etc. Stock market
volatility means different things to different people. Most academic studies have defined
volatility in term of statistical measure of the variability of the stock price changes. These
measures are useful because they correspond to standard measure of risk in theories of
portfolio selection and asset pricing. Many investors seem more apt to define volatility as
episode of extreme or rapid price movements within certain days - even if these incidents do
not noticeably affect measure of volatility calculated over longer time periods. Volatility is
defined in term of statistical measure of the variability of percentage price changes or rate of
return. The most commonly used statistical measure of the volatility is the standard deviation
or variance of return. The standard deviation measure the dispersion of return or the degree to
which they vary from period to period, the period being a month, day and even hour or
minute. Thus volatility can be calculated for month to month returns, day to day returns and
even minute to minute returns.
1.1.5 Volatility and Liquidity
Much research has been devoted to modeling and forecasting the volatility of
financial returns, and yet few theoretical models explain how volatility comes to exist in the
first place. Roll (1984) shows that volatility is affected by market microstructure. Glosten and
Milgrom (1985) shows that at least one source of volatility can be explained by the liquidity
provision process. When market makers infer the possibility of adverse selection, they adjust
their trading ranges, which in turn increase the band of price oscillation.
Please purchase PDF Split-Merge on www.verypdf.com to remove this watermark.

8
1.1.6 Volatility and Direction
Volatility is immune to the directional change which measures merely their dispersion
when calculating standard deviation (or variance) and all differences are squared, so that
negative and positive differences are combined into one quantity. Two instruments with
different volatilities may have the same expected return, but the instrument with higher
volatility will have larger swings in values over a given period of time.
1.1.7 Volatility over time
It is common knowledge that types of assets experience periods of high and low
volatility. That is, during some period prices go up and down quickly, while during other
times they might not seem to move at all. Periods when prices fall quickly (a crash) are often
followed by prices going down even more, or going up by an unusual amount. Also, a time
when prices rise quickly (a bubble) may often be followed by prices going up even more, or
going down by an unusual amount. The converse behaviour, the 'doldrums' can last for a long
time as well. Most typically, extreme movements do not appear 'out of nowhere'; they're
presaged by larger movements than usual. This is termed autoregressive conditional
heteroskedasticity. Of course, whether such large movements have the same direction, or the
opposite, is more difficult to say. And an increase in volatility does not always presage a
further increase - the volatility may simply go back down again.
1.1.8 Volatility for Investors
Investors care about volatility for five reasons which are mentioned as follows:
1. The wider the swings in an investment's price the harder emotionally it is not to
worry.
2. When certain cash flows from selling a security are needed at a specific future date,
higher volatility means a greater chance of a shortfall.
3. Higher volatility of returns while saving for retirement results in a wider distribution
of possible final portfolio values.
4. Higher volatility of return when retired gives withdrawals a larger permanent impact
on the portfolio's value.
Please purchase PDF Split-Merge on www.verypdf.com to remove this watermark.

9
5. Price volatility presents opportunities to buy assets cheaply and sell when overpriced.
In today's markets, it is also possible to trade volatility directly, through the use of
derivative securities such as options and variance swaps.
1.1.9 Benefits of Volatility
Volatility is often viewed as a negative phenomenon as it represents uncertainty and
risk. However, volatility can be good if it is peak and buys on the lows, one can make money,
with greater money coming with greater volatility. The possibility for money to be made via
volatile market is how short term market players like day traders hope to make money, and is
in contrast to the long term investment view of buy and hold. The dispersion (volatility) may
be in any direction; it benefits the one and harms the other out of the buyer and the seller.
Now it is the intelligence of the investor that how investor keeps themself as the beneficiary
out of the act of buying or selling. The importance of volatility is as follows:
� The importance of volatility in financial markets is much more than a measure of
investor’s sentiment. Volatility is important because it dramatically affects banks and
hedge funds' Value-at-Risk (VaR). VaR estimates the maximum a bank or hedge fund
can expect to lose over a specific time period at a given confidence interval. VaR is
the primary tool of risk management. Low volatility leads to low VaR, and high
volatility leads to high VaR. Banks and hedge funds' leverage ratios are generally tied
to VaR - the lower an institution's VaR, the more it can lever up. More importantly for
right now, the higher an institution's VaR, the less leverage it can use.
� The importance of volatility is that, it has the single biggest effect of the amount of
extrinsic value in an option's price. When volatility goes up (increases), the extrinsic
value of both the calls and the puts increase. This makes all the option prices more
expensive. When volatility goes down (decreases), the extrinsic value of both the calls
and the puts decrease. This makes all of the option prices less expensive.
� Mobilizing funds from savers and regulating it up to investors is one of the key
functions of financial markets and institutions of an economy. Some volatility in the
prices of financial assets is a normal part of the process of allocating investible funds
among competing users. However, excessive or extreme volatility of stock returns,
interest rates or exchange rates may be detrimental because such volatility may impair
the smooth functioning of the financial system and adversely affect the economic
performance of economy.
Please purchase PDF Split-Merge on www.verypdf.com to remove this watermark.

10
� Volatility has become a matter of concern because when the asset prices fluctuate
sharply over time periods as short as one day, investors may find it difficult to accept
that the explanation for changes lies in information about fundamental economic
factors, and hence, they may associate pure speculation and irrationality with the
market. This can lead to general erosion of investor confidence and flow of capital
away from equity markets.
� The rise in volatility will tend to raise the risks faced by market makers, leading them
to charge correspondingly more for the liquidity they provide.
� Volatility is perceived as an indicator of market inefficiency and a potential threat to
the very integrity of the market mechanism.
The wide spread concern in the market place has underlined the importance of being
able to measure and predict stock market volatility to market participants.
1.1.10 Causes of Volatility
A high frequency of crisis is closely associated with higher macroeconomic volatility
and is just another aspect of higher macro-financial risks and vulnerabilities. In addition to
output forgone during these crises, which entails major welfare losses, there is significant
evidence than such crises have lasting effects on growth because of irreversible losses of
physical, organizational, and human capital. Stock prices are established in the marketplace,
but what exactly causes them to behave the way they do? Here are several factors that
influence their movements.
1) Latest Information on Stock Prices
Information is a crucial factor in the movement of stock prices as it is what the market
uses to put a value on a stock at a certain price level. These are usually based on all data that
the public has been made aware of. As the information is updated, the market adjusts the
prices up or down depending on the way the market interprets that the information will affect
the company's future earnings ability.
2) Inflation and Stock Prices
Inflation is another influential factor that affects the motion of stock prices. History
indicates that there had been a strong inverse correlation between low inflation and
Please purchase PDF Split-Merge on www.verypdf.com to remove this watermark.

11
valuations. This is because low inflation propels high multiples and high inflation drives low
multiples.
3) Economic Strength of Market and Peers
Company stocks have the propensity to track with the market, as well as with their
sector or industry contemporaries. A lot of leading investment firms put significant
importance on overall market and sector movements as major factors involved in the
movement of prices. An example would be when a negative outlook for one stock affects
other similar ones due to mere association with each other, dragging the demand for the
whole sector along the way.
4) Psychological Issues on Stock Prices
These prices are also greatly influenced by human behaviour. Greed is one trait that
can cause stock prices to increase more than it should. New information can elicit a frantic
market, may cause an increase in prices, and may make investors disregard rational valuation,
preferring instead to buy the stock to ensure they are not left behind. Fear can cause
significant decreases in stock prices when investors rush for the exit in an effort to avoid
losses. This factor is probably the most important factor in determining the volatility of the
market at any given time.
5) Supply and Demand
Stocks that trade smaller volumes of shares do not have the liquidity of the more
popular stocks. So, prices for these smaller ones are prone to fluctuations because of supply
and demand. When a large shareholder wants to sell a large quantity of shares into a market
with weak liquidity, that shareholder can considerably move share price.
6) Uncertainty
The movement of stock prices is also affected by a vague future. Prices do tend to
bounce around a bit due to market apprehension and the unpredictable future. Because of the
ambiguity of a company's future, volatility in stock prices is possible even without new
information.
Please purchase PDF Split-Merge on www.verypdf.com to remove this watermark.

12
7) Trading Volume
Trading in any financial asset is induced by the arrival of new information. As the
information is unobserved, price changes or/and trading activity can be used as proxy of
information. Trading volume is supposed to reflect information about aggregate changes in
the expectations of the market participants. Understanding the informational role of trading
volume and its relationship with price changes may help in devising short-term price forecast,
trading and hedging strategies and regulations. The issues like whether positive price changes
(volatility) is associated with higher volume as compared to negative price changes, whether
trading volume is leading the price change or price change is driving the trading volume in a
financial asset, are important from both theoretical as well as practical point of view. The
higher the volume, the narrower are the spreads, as a result, there is less slippage, and less
volatility.
8) Business condition
It is widely said that stock volatility increase during economic recession because
during recession, there is excess capacity and unemployment. Fixed cost for the economy
would have the effect of increasing the volatility of stock returns during period of low
demand. Therefore business conditions are the main cause of high and low volatility.
9) The Media
The media including newspaper, magazine, and news channels are the main source of
information which provides the financial news, views and advice of experts to the public.
These information and advice may influence the decision of investors and fund managers
which could lead to herd-type behaviour and stock price fluctuation. Media comment may
influence the timing of prices changes with or without influencing longer term movements.
10) Market Industry Concentration
Modern portfolio theory predicts a significant relationship between market industry
concentration and market volatility. High industry concentration in a market means less
diversification. Therefore, high industry concentration would lead to high market volatility.
Please purchase PDF Split-Merge on www.verypdf.com to remove this watermark.

13
11) The Average Education Level of Investors
Investors typically exhibit a strong “home bias”. Given the existence of these bias,
local investors collective behaviour could be decisive in shaping stock market movements in
a country. Thus, the collective characteristics of investors that may influence their behaviour
should not be neglected, when one examines stock market fluctuations. We choose the
average education level of investors, which itself is represented by the school life expectancy
in a country, as a proxy for the collective characteristics of all investors in a market. Since
better-educated people may have better cognitive and analytical capability and thus behave
more rationally, therefore it is expected that the average education level of investors is
negatively related to market volatility.
12) International Integration
Increased integration has resulted in the removal of controls on the international
movement of capital by the government. The stocks of leading companies are now quoted on
foreign stock markets. Movements of one country stock prices are affected by the movement
of stock prices on overseas markets. Even the stock prices of one country are influenced by
the international events of their global counterparts, statement made by the US president,
international development and financial crises.
13) Computerized Trading
The remarkable advances in information technology have made it much easier for
large number of people to learn about and react to information very quickly. They have also
made it possible for financial markets to provide liquidity to investors around the world.
Since new information spread more quickly, the rate at which price change in response to
information would also accelerate.
14) The Relative Size of the Equity Market
The relative size of the equity market in a country is defined as:
CAP
GDPX 100
Please purchase PDF Split-Merge on www.verypdf.com to remove this watermark.

14
Where CAP is the total market capitalization of all listed firms in a market and GDP
is the Gross Domestic Production (GDP). Harvey (1995) argues that, in a larger market, noise
trading is probably offset more completely by one another and thus is less influential.
Therefore, market size would be related to market volatility. The larger the market size, the
more stable the market could be.
15) The Number of Listed Firms
On the one hand, the total number of listed firms may be positively related to market
industry concentration. It might be the case that the more firms listed, the more diversified
the market. On the other hand, it could also be true that the more firms listed, the larger the
relative market size. In either case, the number of listed firms could be negatively related to
market volatility.
16) Other Factor
One of the major reasons of volatility in stock market may be due to change in the
macroeconomic policies, regarding different variables like interest rate, money supply,
industrial production, foreign institutional investment, national income, exchange rate etc. If
there is any change in these variables then stock price will adjust accordingly. Other factor
which may influence volatility is attitude of the investor regarding risk.
1.1.11 Measurement of Volatility
Volatility is measured by variance or the standard deviation of stock returns around
their average value. When measuring the volatility, stock returns are taken rather than stock
prices because mean must be stable at the different time period while measuring the
dispersion around an average value. Another reason behind using return is that absolute price
changes are dependent on the price level. In order to symmetrically treat the up moves and
down moves, returns are calculated as the logarithmic difference of closing prices at the
beginning and end of one measurement period. In order to compare the volatilities over
different periods and over different countries, volatility is expressed as an annualized
percentage. To annualize the volatility, the number of trading days in a year must be used.
Also, volatility scales with the square root of time. So annualisation factor would be square
root of the number of trading days in a year.
Please purchase PDF Split-Merge on www.verypdf.com to remove this watermark.

15
1.1.12 Modeling of Volatility
Modeling and forecasting of volatility of asset returns is important in various
applications related to financial markets such as valuation of derivatives, risk management,
etc. Extensive research has been done world over in Modeling volatility for estimation and
forecasting. There are broadly four possible approaches for estimating and forecasting
volatility. These are:
Traditional Volatility Estimators: These estimators assume that ‘true’ volatility is
unconditional and constant. The estimation is based on either squared returns or standard
deviation of returns over a period.
Extreme Value Volatility Estimators: These estimators are similar to traditional estimators
except that these also incorporate high and low prices observed unlike traditional estimators
which are based on closing prices of the asset.
Conditional Volatility Models: These models (ARCH/GARCH type models) take into
account the time-varying nature of volatility. There have been quite a few extensions of the
basic conditional volatility models to incorporate ‘observed’ characteristics of asset/ stock
returns.
Implied Volatility: In case of options, most of the parameters relevant for their valuation can
be directly observed or estimated, except volatility. Volatility is, therefore, backed out from
the observed option values and is used as volatility forecast.
Uncertainty plays an important role in economic theory. Many economic models
assume that the variance, as a measure of uncertainty, is constant through time. However,
empirical evidence rejects this assumption. Financial time series, such as stock returns or
exchange rates exhibit so called volatility clustering. This means that the large changes in
these series tend to be followed by large changes and small changes by small changes. The
technical term given to this behaviour is autoregressive conditional heteroskedasticity
(ARCH). As variance (or standard deviation) is often used as a risk measure in risk
management systems, accurate modeling and forecasting of the variance has received a lot of
attention in the investment community for the last two decades. In a seminal paper, Engle
(1982), for the first time, proposed to model time varying conditional variance with the
Please purchase PDF Split-Merge on www.verypdf.com to remove this watermark.

16
ARCH process that uses past disturbances to model the variances of the series and allows the
variance of the error term to vary over time. Bollerslev (1986) generalized the ARCH process
by allowing the conditional variance to be a function of prior period’s squared errors as well
as its past conditional variances. Following the introduction of models of ARCH by Engle
(1982) and their generalization by Bollerslev (1986), there have been numerous refinements
of the approach to modeling conditional volatility to better capture the stylized characteristics
of the data. Empirically, the family of GARCH (Generalized ARCH) models has been very
successful in describing the financial data. Of these models, the GARCH (1, 1) is often
considered by most investigators to be an excellent model for estimating conditional volatility
for a wide range of financial data.
Though, in most of the cases, the ARCH and the GARCH models are apparently
successful in estimating and forecasting the volatility of the financial time series data, they
cannot capture some of the important features of the data. The most interesting feature not
addressed by these models is the ‘leverage effect’ where the conditional variance tends to
respond asymmetrically to positive and negative shocks in errors. To solve this problem,
many nonlinear extensions of the GARCH model have been proposed. Nelson (1991)
proposed an exponential GARCH (EGARCH) model based on a logarithmic expression of
the conditional variability in the variable under analysis. Later, a number of modifications
were derived from this method. One of them is the Threshold ARCH (TARCH) method
which was introduced by Zakoian (1994). The model developed by Glosten, Jagannathan and
Runkle (GJR, 1993) has been considered the best in estimating the impact of positive and
negative shocks on volatility (Engle and Victor, 1993).
1.2 An Overview of Indian Capital Markets
1.2.1 Introduction
This chapter gives brief account of capital market developments in India under
various heads like Indian Capital Market before 1990s, Indian Capital Market after 1990s,
Primary Market Developments, Secondary Market Developments, SEBI registered market
intermediaries, Mutual Funds, Derivatives, Foreign Institutional Investments, Screen based
Trading System, Depositories, Clearing, Processing and Settlement system, Risk
Management System, Margin Trading Facility, Regulatory Frame work for investor
protection, Security Regulations in force, Security guidelines in force, Grievances Redressal
Please purchase PDF Split-Merge on www.verypdf.com to remove this watermark.
17
Mechanism, Investor Education, Recent initiatives and Indian capital markets future road
map. Capital market is the backbone of any country’s economy. It is an engine for economic
growth, providing an efficient means of resource mobilisation and allocation. The literature is
full of theoretical and empirical evidence that have established robust, statistically significant
two-way relationship between the developments in the securities market and economic
growth. Levine and Zervos (1991) argue that well developed stock markets may be able to
offer financial services of different kind that may provide a different kind of impetus to the
economic development1. In India, Agarwall’s (1999), study clearly supports the Levine and
Zervos’s argument and proves that the two main parameters of capital market development
namely, size and liquidity, are found statistically significant to explain the economic activity.
The Indian capital market is one of the oldest capital markets in the world. It dates
back to the 18th century when the securities of the East India Company were traded in
Mumbai and Kolkata. However, the orderly growth of the capital market began with the
setting up of The Stock Exchange of Bombay in July 1875 and Ahmedabad Stock Exchange
in 1984. Eventually 19 other Stock Exchanges sprang up in various parts of the country. In
this chapter an attempt has been made by the researcher to review the Capital Market
Developments.
1.2.2 Indian Capital Market – Before 1990s
India’s Capital Market was dormant till the mid – 1980s. The long term financing
needs of the corporate sector were met by the Development Financial Institutions (DFIs)
namely IDBI, IFCI, ICICI as well as by other investment institutions like LIC, UTI, GIC etc.
Working capital needs were met by the Commercial Banks through an elaborate network of
bank branches spread all over the country. Capital Market activities were limited mainly due
to the easy availability of loans from banks and financial institutions and administered
structure of interest rates. However, three important legislations namely Capital Issues
(Control) Act 1947: Securities Contracts (Regulation) Act, 1956; and Companies Act, 1956
were enacted to provide suitable legal framework for the development of capital market in
India. The pricing of the primary issues was decided by the Office of the Controller of
Capital Issues. A few stock exchanges, dominated by Bombay Stock Exchange (BSE)
provided the trading platforms for the secondary market transactions under an open outcry
system.
Please purchase PDF Split-Merge on www.verypdf.com to remove this watermark.

Please purchase PDF Split-Merge on www.verypdf.com to remove this watermark.

21
In a deregulated regime, the market determines the price of the public issues, i.e.,
either by the issuer through fixed price or by the investors through book-building process. A
fair system of proportionate allotment of shares has been put in place. The share of retail
investors in the allotment of book-built issues has been increased to 35 per cent.
Discretionary allotment to the Qualified Institutional Buyers (QIBs) has been withdrawn.
Companies are allowed to issue ADRs/ GDRs and also raise funds through external
commercial borrowing. The ADR / GDR’s have two–way functionality. The Foreign
Institutional Investors have been allowed to invest in primary issues within the sectoral limits
set by the Government.
1.2.5 Secondary Market Developments
The securities issued in the Primary Market are traded in the Secondary Market.
Exchanges in India offer screen based on electronic trading. The trading system is connected
using the VSAT technology from around 201 cities. There are 8,652 trading members
registered with SEBI at the end of March 2009. Market capitalization as per cent to GDP in
India reached nearly 58 per cent in 2008–09 and still further on a fluctuating trend.
The rate of growth in market capitalisation and turnover over the period indicates that
more companies have started using the trading platform of the Stock Exchanges. Although
there are 22 stock exchanges, NSE and BSE together account for more than 99 per cent of the
total turnover. Enormous amount of developments have taken place in the secondary market
during the last one decade. The selected indicators given in Table-1.3 clearly indicate this.
Please purchase PDF Split-Merge on www.verypdf.com to remove this watermark.

22
Table - 1.3
Performance of Secondary Markets from 2000 to 2012 – Selected Indicators
(Rs. in Million)
Year
Capital Market Segment of Stock Exchanges
No.
of Brokers
No. of
Listed
Companies
CNX
Nifty
S&P
Sensex
Market
Capitalisation
Market
Capitalisation
Ratio (%)
Turnover
Turnover
Ratio (%)
2000-01 9069 9877 1078.05 3739 740640 34.1 10233820 178.3
2001-02 9192 9871 1528.45 5001 11926300 84.7 20670310 173.3
2002-03 9782 9954 1148.20 3604 7688630 54.5 28809900 374.7
2003-04 9687 9644 1129.55 3469 7492480 36.4 8958180 119.6
2004-05 9519 9413 978.20 3048 6319212 28.5 9689098 153.3
2005-06 9368 8240 1771.90 5590 13187953 52.3 16204977 122.9
2006-07 9128 8645 2035.65 6492 16984280 119.1 16668963 98.1
2007-08 9519 9413 978.20 3048 6319212 28.5 9689098 153.3
2008-09 9335 9020 3402.55 11280 30221900 85.5 23901030 79.09
2009-10 9443 9431 3821.55 13072 35488081 86.0 29014715 81.76
2010-11 9487 6551 4734.50 15644 51497010 109.3 51308160 99.63
2011-12 9628 6856 3020.95 9708 30929738 58.1 38520970 124.54
Sources: SEBI Hand Book 2013
Please purchase PDF Split-Merge on www.verypdf.com to remove this watermark.

23
Table - 1.4
Monthly and Annual Averages of CNX Nifty from 2001 to 2012
(Base: November 3, 1995 = 1000)
Year/
Month Apr May Jun Jul Aug Sep Oct Nov Dec Jan Feb Mar Annual
2000-01 1469.03 1312.65 1451.74 1445.26 1350.94 1371.27 1201.60 1240.59 1291.43 1316.96 1371.91 1214.47 1336.49
2001-02 1116.41 1159.44 1107.15 1077.98 1069.01 949.43 953.92 1031.62 1075.87 1087.20 1138.17 1159.33 1077.13
2002-03 1120.74 1079.80 1065.90 1034.70 977.60 987.12 955.12 992.26 1074.25 1073.48 1055.84 1016.38 1036.10
2003-04 965.08 963.20 1068.59 1150.01 1261.13 1369.03 1506.10 1580.02 1740.06 1906.00 1848.67 1779.63 1428.13
2004-05 1848.45 1640.20 1506.12 1568.08 1615.30 1691.96 1794.98 1873.94 2021.94 1977.83 2067.39 2096.23 1805.26
2005-06 1987.10 2002.28 2134.29 2236.70 2357.56 2511.70 2486.78 2574.66 2772.61 2892.68 3019.48 3235.78 2513.40
2006-07 3494.06 3437.41 2914.91 3092.11 3305.58 3492.13 3649.43 3868.61 3910.18 4037.06 4083.74 3731.13 3572.44
2007-08 3947.28 4184.39 4222.17 4474.18 4301.36 4659.92 5456.62 5748.58 5963.57 5756.35 5201.56 4769.50 4896.60
2008-09 4901.91 5028.66 4463.79 4124.60 4417.12 4206.69 3210.22 2834.79 2895.80 2854.36 2819.21 2802.27 3731.03
2009-10 3359.83 3957.96 4436.37 4343.10 4571.11 4859.31 4994.11 4953.54 5099.74 5156.22 4839.57 5178.15 4657.77
2010-11 5294.76 5052.97 5187.78 5359.75 5457.24 5811.48 6096.11 6055.33 5971.32 5782.71 5400.92 5538.42 5583.54
2011-12 5839.09 5492.20 5472.64 5596.59 5076.74 5015.58 5060.02 5004.28 4782.36 4920.02 5409.09 5242.74 5248.74
Source: NSE
Please purchase PDF Split-Merge on www.verypdf.com to remove this watermark.

24
Table - 1.5
Annual Average of Share Price Indices and Market Capitalization from
2000 to 2012
Year Sensex CNX Nifty
Market Capitalization
( Rs. in Crores )
BSE NSE
2000-01 4270 1335 571553 657847
2001-02 3332 1077 612224 636861
2002-03 3206 1037 572198 537133
2003-04 4492 1428 1201207 1120976
2004-05 5741 1805 1698428 1585585
2005-06 8280 2513 3022191 2813201
2006-07 12277 3572 3545041 3367350
2007-08 16569 4897 5138014 4858122
2008-09 12366 3731 3086075 2896194
2009-10 15585 4658 6165619 6009173
2010-11 18605 5584 6839084 6702616
2011-12 17423 5243 6214941 6096518
Source: BSE, NSE
1.2.6 SEBI Registered Market Intermediaries
Various institutions / intermediaries associated with primary as well as secondary
markets such as merchant bankers, registrars to issues, portfolio managers, underwriters,
bankers to issues, stock exchanges, brokers and sub-brokers, share transfer agents,
depositories, FIIs, custodians, credit rating agencies, venture capital funds, collective
investment schemes including mutual funds have to register with SEBI and operate within the
guidelines issued from time to time. SEBI also promotes self-regulatory organizations. SEBI
registered market intermediaries from 2001 which are listed below in Table-1.6.
Please purchase PDF Split-Merge on www.verypdf.com to remove this watermark.

25
Table -1.6
SEBI Registered Market Intermediaries from 2001 to 2012
Market Intermediates 2001 2002 2003 2004 2005 2006 2007 2008 2009 2010 2011 2012
Stock Exchanges
(Cash Market) 23 23 23 23 22 22 21 19 19 19 19 20
Stock Exchanges
(Derivatives Market) 2 2 2 2 2 2 2 2 2 2 2 2
Stock Exchanges
(Currency Derivatives) - - - - - - - - 3 4 4 4
Brokers
(Cash Segment) 9782 9687 9519 9368 9128 9335 9384 8517 8652 8804 9235 9307
Corporate Brokers
(Cash Segment) 3808 3862 3835 3746 3733 3961 4101 3955 4079 4197 4593 4672
Sub Brokers
(Cash Segment) 9957 12208 13291 12815 13684 23479 27540 43874 62471 75378 83952 77165
Brokers
(Derivative) 519 705 795 829 994 1120 1258 1442 1587 1899 2301 2337
Foreign Institutional
Investors 527 490 502 540 685 882 997 1319 1635 1713 1722 1765
Custodians 14 12 11 11 11 11 11 15 16 17 19 19
Depositories 2 2 2 2 2 2 2 2 2 2 2 2
Depository Participants 335 380 438 431 477 526 593 654 714 758 805 823
Merchant Bankers 233 145 124 123 128 130 152 155 134 164 192 200
Bankers to an issue 69 68 67 55 59 60 47 50 51 48 55 56
Underwriters 57 54 43 47 59 57 45 35 19 5 3 3
Please purchase PDF Split-Merge on www.verypdf.com to remove this watermark.

26
Market Intermediates 2001 2002 2003 2004 2005 2006 2007 2008 2009 2010 2011 2012
Debenture Trustees 37 40 35 34 35 32 30 28 30 30 29 32
Credit Rating Agencies 4 4 4 4 4 4 4 5 5 5 6 5
Venture Capital Funds 35 34 43 45 50 80 90 106 132 158 184 207
Foreign Venture Capital
Investors 1 2 6 9 14 39 78 97 129 143 153 175
Registrars to an Issue &
Share Transfer Agents 186 161 143 78 83 83 82 76 71 74 73 74
Portfolio Managers 39 47 54 60 84 132 158 205 232 243 267 250
Mutual Funds 39 38 38 37 39 38 40 40 44 47 51 49
Collective Investment
Schemes 0 0 0 0 0 0 0 0 1 1 1 1
Approved
Intermediaries(Stock
Lending Schemes)
8 10 4 3 3 3 3 2 3 2 2 2
Source: SEBI Hand Book 2013
As on 31st March 2012, there were 20 Stock Exchanges, 9307 Brokers (Cash Segment) and 77,165 Sub-brokers, over 9,000 Listed
Companies, 2 Depositories, 823 Depository Participants, 200 Merchant Bankers, 3 Underwriters, 5 Credit Rating Agencies and 1765 Foreign
Institutional Investors in India.
Please purchase PDF Split-Merge on www.verypdf.com to remove this watermark.

Please purchase PDF Split-Merge on www.verypdf.com to remove this watermark.

29
��� ���� #�# ���� ���������� #��� ��� ��������� +"� ���-� � ����� ���$� �#���� ��� ���-�
�#�����,’=� ��$�� ����� ���������� �+������������������� �������%������$� � �����
��������:�������������� �+����������������������3 �"��������������� �����
1.2.9 Foreign Institutional Investments
���� 1����%� ��� ����� �������� �1����� ����� �������� �� ����� �� ����� �� ���6�
�������#�������� ������������������"������ ����� �������� ��#�����#��� �����# +����
��� ��������+�����3 �����������������������������������3 ��������������������������-���
���������+���� ����+"����������������������+������� ��������������������1�����
����%������������%����������������������������+���������+���
Table - 1.8�
Foreign Investment Inflows in India from 2000 to 2012
Year
A. Direct Investment B. Portfolio Investment Total (A +B)
(Rs.
Crores )
(Us $
Millions)
(Rs.
Crores )
(US $
Millions)
(Rs.
Crores )
(US $
Millions)
6888&8�� �8�5�� 6;�6� &65 � &��� �8�8�� 6;8��
688�&86� ����� 6�55� ����6� �86�� 66;58� 5����
6886&8�� ��;8�� ;86�� �6�8�� 6 �8� ��8�5� � ���
688�&8;� 6�6�5� ���8� ����� 686�� ��� ;� ��5��
688;&85� 6;�� � 58�5� ; ��� � �� 6��85� �8�;�
6885&8�� ����8� ;�66� 566 �� ��� � 6���� �5����
688�&8 � 6 ���� �85�� ;��5;� ���5� ��8;6� �5����
688 &8�� ��� ;� ����� 55�8 � �6;�6� �;���� 6�;5��
688�&8�� �8��� � 66�6�� �� ��� 88�� ��58�8� 6��6��
688�&�8� ���6 �� �;��6� �8� ;�� 6 6 �� 6;�8� � ������
68�8&��� ���;��� �5���� &������ &���55� � ���� 6�����
68��&�6� ���5;�� ;��;6� �5�8� � � �� ��5�8�� ��8��� Source: RBl Bulletin
1����%� ������� ������� +��� +"� ������ ������� ��� #�������� �������
��� �����4������5��8��)����������’�>���8���7�������������st�7�����68�6��1���������
+���+ ������������������� ��������������������������"�"��������#�����������������
��"�����������������������������-��#���6888&8��?�68��&�6�������������+���+����@�
�
Please purchase PDF Split-Merge on www.verypdf.com to remove this watermark.

30
Table - 1.9
Trends in FII Investment from 2001 to 2012
Year
Gross
Purchases
(Rs. in
Crores )
Gross
Sales
(Rs. in
Crores )
Net
Investment
(Rs. in
Crores )
Net
Investment
(US $ Mns)
Cumulative
Net
Investment
(US $ Mns)
6888&8�� ;85�� �;���� ����� 6��8� ��5���
688�&86� 588 �� ;��8�� � ��� ����� �5� ��
6886&8�� ; 8�6� ;;� 6� 6���� 5��� �5����
688�&8;� �;;�55� ��8��� ;5 �;� �8885� 65�;6�
688;&85� 6��5�� � �8 �� ;5��8� �8�56� ��6���
6885&8�� �;�� �� �8558�� ;�;� � ����� ;5�5 �
688�&8 � 56858�� ;����5� �8�;�� ��6�� 56; �
688 &8�� �;�8��� ������� ��� �� ��;;6� ������
688�&8�� ��;5 �� ��8���� &;5���� &��� � 5�8�6�
688�&�8� �;�;��� 8� �� �;6�5�� �8656� ������
68�8&��� ��65��� �;��5�� �;�;��� �666�� �6�55��
68��&�6� �6�6�5� �6 5�6� �� 65� ���6�� �;8;�6�Source: SEBI
����� � ���������������+"�1�������������������’�>��������7��������������
���7�����68�8��� ���������������� �’� >���;8�;�6�7������+"����������7�����68�6��,��
�������+"�1��������� ������� %��"��’�>��8�(������������������������������ ����
"�����������������%��������"�������� +������:����7���������68�8����� �+������
1������%�����������’=(��������������������� �������������������5�+"����������7�����
68���� :+� � ;�� #��� ��� ��� ���� 1���� ���%���� ����� ��� �’:�� ��������� +"� ��� �0���������������
����#���������
2 ��%� ��� ���� ��� ��� ����� "������ ��� 1���� ����� ��������� ����� ��� �� #���������
��������� ’��%� ������������� � ��������� ���� ��+��� �-� ������� ��������
��� �������������������� ��%�%����#�������� ��������+�� ��������� ����"�%��� �������
���%��#���������������+"����1�������������
�
Please purchase PDF Split-Merge on www.verypdf.com to remove this watermark.

31
1.2.10 Screen Based Trading System
���� ������ +����� ����%� �"���� ��� �� ������$� ��������� � ��� ��� ����� ��#����
���$�������,’=����� ������������&+���������%��������� ���#������������+"������
���$� �-���%���� ���� �����&+����� ����%� ��+���� ��� #�����#��� ���� ������ ����������
��"�� ����������&��������������������� ���#����������8�888����������#����������
;88������������������+��������������#����#�����+�%%�������%�����$����"��� �"����
��� ������� ���� ������ �����%� ��� ���� �����"� �� #����A� ����#�����"�� ���� �����&+�����
����%� ��� ���#���� ��� #�������� �3 ��� ������� �� ���� �������� �����#������ ��� �����
%��%��#���������������’����&+���������%� ������%������"� ��#��������#�� �����3 ���"�
���������$���
1.2.11 Depositories
2�#���������:������������ ������������$�������#��� ����� ��� ��"��������B��
��#���� ���$��� ���������� ��� ��#��������� ����"�� )�� ��� 2�#�����"� ’�������� .������
�)2’.�����,������’�� ������2�#�����"�.�������,’2.���������� #��)2’.����,’2.�
�����+���� ������ �����������������/���������� ������������-��������#������������
�������$����#����/�����) ����"���������������������#��������"�������� %��+��$&
��"� ������ ����� ���� ������ ��"� ��#������ ��� �#����� ��� ���"� ��� ��� ��"� ��� ���
��������"�����:+� ������#�����������������(’=�����88�#�����������������,’=����
����� �� ��+��� ���8� ���� � ����"� ������ ��� %�� �������"�� ������ ��� #����+��� ��"� � �� ��
����������/�����������#�+"���������#����������
Please purchase PDF Split-Merge on www.verypdf.com to remove this watermark.

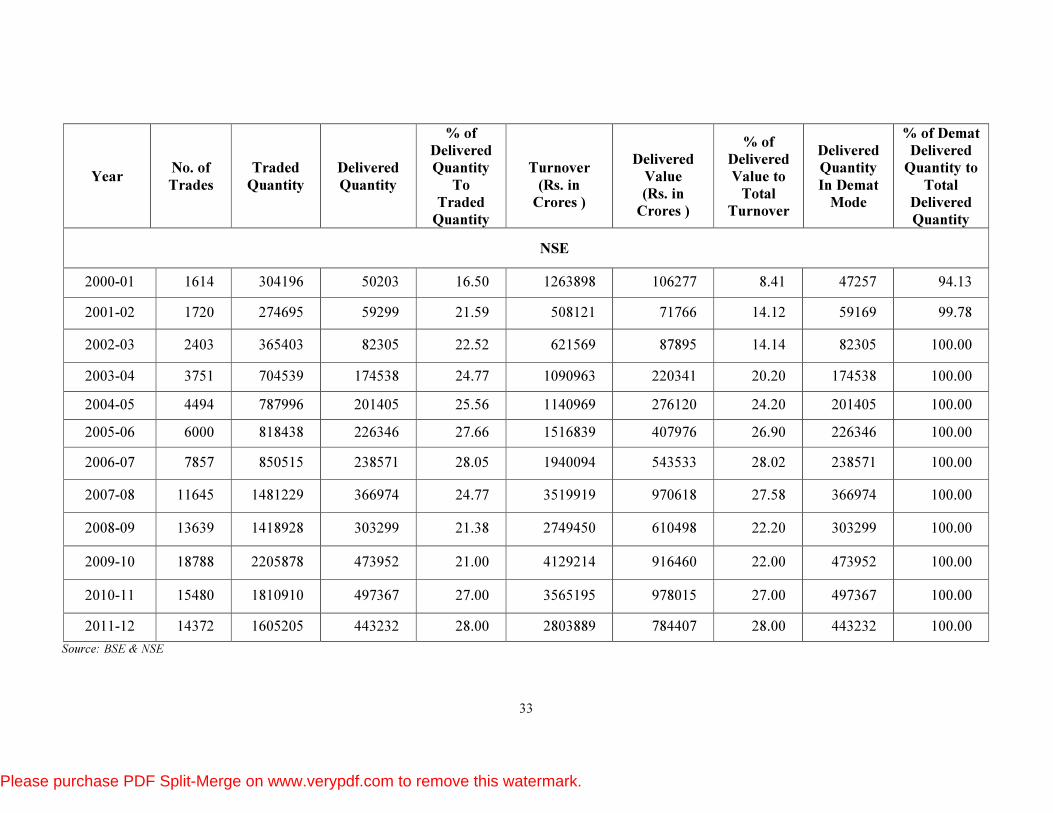
32
Table - 1.10
Settlement Statistics for Cash Segment of BSE and NSE from 2000 to 2012
Year No. of
Trades
Traded
Quantity
Delivered
Quantity
% of
Delivered
Quantity
To
Traded
Quantity
Turnover
(Rs. in
Crores )
Delivered
Value
(Rs. in
Crores )
% of
Delivered
Value to
Total
Turnover
Delivered
Quantity
In Demat
Mode
% of Demat
Delivered
Quantity to
Total
Delivered
Quantity
BSE
2000-01 1428 258511 86684 33.53 1000032 1666941 16.69 - -
2001-02 1277 182196 57668 31.65 307292 59980 19.52 - -
2002-03 1413 221401 69893 31.57 314073 48741 15.52 - -
2003-04 2005 385806 133240 34.54 503053 107153 21.30 132941 99.78
2004-05 2374 477171 187519 39.30 518716 140056 27.00 187347 99.91
2005-06 2643 664467 300653 45.25 816074 271227 33.24 300497 99.95
2006-07 3462 560780 229685 40.96 956185 297660 31.13 229573 99.95
2007-08 5303 986009 361628 36.68 1578855 476196 30.16 361542 99.98
2008-09 5408 739601 196630 26.59 1100074 230332 20.94 196096 99.73
2009-10 6056 1136513 363578 32.00 1378809 311364 23.00 363500 100.00
2010-11 5285 990776 376890 38.00 1105027 302126 27.00 374277 99.00
2011-12 3944 654137 255999 39.00 667498 181560 27.00 255990 100.00
Please purchase PDF Split-Merge on www.verypdf.com to remove this watermark.

33
Year No. of
Trades
Traded
Quantity
Delivered
Quantity
% of
Delivered
Quantity
To
Traded
Quantity
Turnover
(Rs. in
Crores )
Delivered
Value
(Rs. in
Crores )
% of
Delivered
Value to
Total
Turnover
Delivered
Quantity
In Demat
Mode
% of Demat
Delivered
Quantity to
Total
Delivered
Quantity
NSE
2000-01 1614 304196 50203 16.50 1263898 106277 8.41 47257 94.13
2001-02 1720 274695 59299 21.59 508121 71766 14.12 59169 99.78
2002-03 2403 365403 82305 22.52 621569 87895 14.14 82305 100.00
2003-04 3751 704539 174538 24.77 1090963 220341 20.20 174538 100.00
2004-05 4494 787996 201405 25.56 1140969 276120 24.20 201405 100.00
2005-06 6000 818438 226346 27.66 1516839 407976 26.90 226346 100.00
2006-07 7857 850515 238571 28.05 1940094 543533 28.02 238571 100.00
2007-08 11645 1481229 366974 24.77 3519919 970618 27.58 366974 100.00
2008-09 13639 1418928 303299 21.38 2749450 610498 22.20 303299 100.00
2009-10 18788 2205878 473952 21.00 4129214 916460 22.00 473952 100.00
2010-11 15480 1810910 497367 27.00 3565195 978015 27.00 497367 100.00
2011-12 14372 1605205 443232 28.00 2803889 784407 28.00 443232 100.00
Source: BSE & NSE
Please purchase PDF Split-Merge on www.verypdf.com to remove this watermark.

34
1.2.12 Clearing, Processing and Settlement System
The setting of the Clearing Houses / Clearing Corporations (CCs) has been a critical
institutional arrangement to improve the market microstructure of the Indian stock market.
NSE has a dedicated subsidiary namely, National Securities Clearing Corporation Limited
(NSCCL) which performs the role of a central counterparty. The CCs provide full innovation
with multilateral netting. Trade and Settlement Guarantee Funds have been set up to
guarantee settlement in case of default by brokers. There is also a system of security lending
and borrowing to obviate settlement risk. As CCs provide guaranteed settlement; there is no
counterparty risk in India. Moreover, India is one of the few countries of the world to
implement full- fledged Straight Through Processing (STP). The STP has been made
mandatory for all institutional trades.
Another notable achievement has been the short ending of the settlement cycle and
adoption of the rolling settlement. The settlement cycle was as high as 14 days for specified
scripts and 30 days for others. The settlement risk was very high as many things can happen
between the transaction and the settlement. Initially, the settlement cycle was reduced to a
week. Thereafter the settlement vehicle was further reduced to T+3 from April 2002 and to
T+2 from April 2003. Efforts are being made to reduce the settlement cycle further to T+1
basis. India’s settlement cycle is one of the best in the world.
1.2.13 Risk Management System
SEBI has put in place a comprehensive risk management system. The major features
of the dynamic risk management system include, interlaid, capital adequacy norms, trading
and exposure limits, margin requirement based or mark to market and VaR based margins,
market-wide circuit filters, on-line position monitoring and automatic disablement of broker’s
terminals. Indian capital market remained insulated against the South-East Asian meltdown in
the late 1990s. The 17th May 2004, crash of the stock market in India was short-lived due to
comprehensive risk management system. The T+2 trading cycle, settlement guarantee funds,
guaranteed settlement by CCs together with risk management system have significantly
reduced the risk perception of the Indian stock market.
Please purchase PDF Split-Merge on www.verypdf.com to remove this watermark.

35
1.2.14 Margin Trading Facility
SEBI has allowed the member brokers to provide margin trading facility to their
clients in the cash segment since 1st April 2004. Securities with mean impact cost of less than
or equal to one and traded at least 80 per cent of the days during the previous 18 months
would be eligible for margin trading. Only corporate brokers with net-worth of at least Rs. 3
Crores would be eligible to offer this facility after obtaining prior permission from the
exchanges.
1.2.15 Regulatory Framework for Investor Protection
Investors are the major stakeholders in the securities market. It is mandatory for SEBI
to protect the interests of the investors. As a matter of fact, protection of investors’ interest is
pursued by the securities market regulators throughout the world. Although the objective is
more or less the same for most of the regulators, the means to achieve it varies from one
jurisdiction to another. In India, one of the major achievements has been to shift from merit-
based regime to disclosure-based regime. SEBI issued Disclosure and Investor Protection
(DIP) Guidelines in 2000 and amended the same from time to time keeping in view the
investors’ interest. The disclosure norms in India are considered as one of the best in the
world. Listed companies have to comply with the disclosure norms on an initial as well as on
a continuous basis. The major objectives of the disclosure norms have been to ensure
transparency and provide adequate protection to the investors.
Pricing of the public issues has been deregulated, since the early 1990s. In a
deregulated regime, disclosures play a crucial role for the investors to take informed
decisions about their investment. Nevertheless, many companies, which flooded the primary
market in the early 1990s, have vanished. Hence, the disclosure norms have been tightened
from time to time. Disclosure ought to be done on the stock exchange in addition to filing of
regular returns to stock exchange where it is listed, as well as to the Registrar of Companies.
Any price sensitive information about the company disclosed elsewhere attracts penal action.
Moreover, unfair trade practices, including insider trading, is prohibited in India, in
order to provide a level playing field to all investors. If any person indulges in fraudulent and
unfair practices, he shall be liable to a maximum penalty of Rs. 25 Crores or three times the
amount of profits made out of such practices, whichever is higher.
Please purchase PDF Split-Merge on www.verypdf.com to remove this watermark.
36
There is a system of proportional allotment of public issues in India. In case of fixed
price public issues, 50 per cent shares are being allotted to the retail investors. In case of
book-built issues, the share of allotment for the retail investors has been raised from 25 per
cent to 35 per cent. Keeping in view the possible misuse, the discretionary allotment to the
Qualified Institutional Buyers (QIBs) has been withdrawn. In a move towards providing a
level playing field, QIBs have been asked to deposit 10 per cent of the bid amount.
SEBI has given in-principle approval for the introduction of IPO grading at the option
of the issuer. IPO grading would be done by credit rating agencies registered with SEBI. The
grading is intended to be an independent and unbiased opinion of the concerned agency. It
would be a onetime exercise and would focus on assisting the investor, particularly the retail
investors, for taking informed investment decision, SEBI will not certify the assessment made
by the rating agency. An issuer, who has opted for IPO grading, has to disclose all grading in
the offer document. Cost of IPO grading can be met by stock exchanges or out of the corpus
maintained for Investor Education and Protection Funds.
It has been recognised the world over that investors’ protection can be strengthened
by adhering to high corporate governance standards. Corporate governance standards
prescribed in India are based on international best practices. Following recommendations of
the expert committees, SEBI prescribed several governance standards to be achieved by the
companies by 31st December 2005, under the revised Clause 49 of the Listing Agreement
with the stock exchanges. Violation of this would now attract penalty under the Listing
Agreement. Corporate governance needs to be seen not as compliance, but as a way of life. In
this context, the quality of compliance assumes significance. High corporate governance
standards are not only desirable within the economy, but also helpful for companies accessing
the international capital market. SEBI gives utmost importance to the corporate governance
including mandatory induction of independent directors.
The governance standards of the stock exchanges are also being improved through the
process called Corporatisation and Demutualisation (C & D) of stock exchanges. The stock
exchanges, world over, have been generally formed as mutual organisations. The ownership,
trading rights and management are often vested with the same set of persons. This leads to
conflicting interest between ownership and management. In order to segregate the
management function from the ownership and trading rights, there is a need for
demutualisation of stock exchanges. Moreover, stock exchanges should function as body
Please purchase PDF Split-Merge on www.verypdf.com to remove this watermark.

Please purchase PDF Split-Merge on www.verypdf.com to remove this watermark.

39
same on plain paper. Investors who visit the SEBI offices or access the investor helpline are
guided regarding the appropriate authority to lodge their complaints which are outside the
jurisdiction of SEBI. An account of receipt and redressal of investor grievances by SEBI is
highlighted in Table below:
��������
�� �������������������������������������� ����������������������
������������ ����� ������ ������� ������������� � � �������
���������������!"��# ���$��%��
&����� � � ������ # ���$��%��&����� � � ������
1991-92 18794 18794 4061 4061 21.6
1992-93 110317 129111 22946 27007 20.9
1993-94 584662 713773 339517 366524 51.4
1994-95 516080 1229853 351842 718366 58.4
1995-96 376478 1606331 315652 1034018 64.4
1996-97 217394 1823725 431865 1465883 80.4
1997-98 511507 2335232 676555 2142438 91.7
1998-99 99132 2434364 127227 2269665 93.2
1999-00 98605 2532969 146553 2416218 95.4
2000-01 96913 2629882 85583 2501801 95.1
2001-02 81600 2711482 70326 2572129 94.9
2002-03 37434 2748916 38972 2611101 95.0
2003-04 36744 2785660 21531 2632632 94.5
2004-05 54435 2840095 53361 2685993 94.6
2005-06 40485 2880580 37067 2723060 94.5
2006-07 26473 2907053 17899 2740959 94.3
2007-08 54933 2961980 31676 2772577 93.6
2008-09 57580 3019560 75989 2848566 94.3
2009-10 32335 2706895 42742 2546302 94.1
2010-11 56670 2763565 66552 2612854 94.5
2011-12 46548 2810113 53841 2666695 94.9
Sources: SEBI Hand Book 2013
During the period 1991-92 to 2011-12, the SEBI received 28,10,113 grievances from
the investors of which a total of 26,66,695 grievances were redressed by the respective
entities, indicating a redressal rate of 94.9 per cent.
Please purchase PDF Split-Merge on www.verypdf.com to remove this watermark.


44
����������
:��������,-�,���.�����������������’st�#� ����������
;��,��� ;.����� ������.�,���� ;� ���9��� ���.�
1 ACC ACC Ltd. Cement & Cement Products
2 AMBUJACEM Ambuja Cements Ltd. Cement & Cement Products
3 ASIANPAINTS Asian Paints Ltd. Paints
4 AXISBANK Axis Bank Ltd. Banks
5 BAJAJ-AUTO Bajaj Auto Ltd. Automobiles
6 BANKBARODA Bank of Baroda Banks
7 BHEL Bharat Heavy Electricals Ltd. Electrical Equipment
8 BPCL Bharat Petroleum Corporation Ltd. Refineries
9 BHARTIARTL Bharti Airtel Ltd. Telecommunication
10 CAIRN Cairn India Ltd. Oil Exploration / Production
11 CIPLA Cipla Ltd. Pharmaceuticals
12 COALINDIA Coal India Ltd. Mining
13 DLF DLF Ltd. Construction
14 DRREDDY Dr. Reddy's Laboratories Ltd. Pharmaceuticals
15 GAIL GAIL (India) Ltd. Gas
16 GRASIM Grasim Industries Ltd. Cement & Cement Products
17 HCLTECH HCL Tech Numberlogies Ltd. Computers - Software
18 HDFCBANK HDFC Bank Ltd. Banks
19 HEROMOTOCO Hero Motor Corporation Ltd. Automobiles
20 HINDALCO Hindalco Industries Ltd. Aluminium
21 HINDUNILVR Hindustan Unilever Ltd. Diversified
22 HDFC Housing Development Finance
Corporation Ltd. Finance - Housing
23 ITC ITC Ltd. Cigarettes
24 ICICIBANK ICICI Bank Ltd. Banks
25 IDFC IDFC Ltd. Financial Institution
26 INDUSINDBK IndusInd Bank Ltd. Banks
27 INFY Infosys Ltd. Computers - Software
28 JPASSOCIAT Jaiprakash Associates Ltd. Construction
29 JINDALSTEL Jindal Steel & Power Ltd. Steel and Steel Products
30 KOTAKBANK Kotak Mahindra Bank Ltd. Banks
31 LT Larsen & Toubro Ltd. Engineering
32 LUPIN Lupin Ltd. Pharmaceuticals
33 M&M Mahindra & Mahindra Ltd. Automobiles - 4 Wheelers
34 MARUTI Maruti Suzuki India Ltd. Automobiles - 4 Wheelers
35 NMDC NMDC Ltd. Mining
36 NTPC NTPC Ltd. Power
37 ONGC Oil & Natural Gas Corporation Ltd. Oil Exploration / Production
Please purchase PDF Split-Merge on www.verypdf.com to remove this watermark.

45
38 POWERGRID Power Grid Corporation of India
Ltd. Power
39 PNB Punjab National Bank Ltd. Banks
40 RANBAXY Ranbaxy Laboratories Ltd. Pharmaceuticals
41 RELIANCE Reliance Industries Ltd. Refineries
42 RELINFRA Reliance Infrastructure Ltd. Power
43 SESAGOA Sesa Goa Ltd. Mining
44 SBIN State Bank of India Ltd. Banks
45 SUNPHARMA Sun Pharmaceutical Industries Ltd. Pharmaceuticals
46 TCS Tata Consultancy Services Ltd. Computers - Software
47 TATAMOTORS Tata Motors Ltd. Automobiles - 4 Wheelers
48 TATAPOWER Tata Power Co. Ltd. Power
49 TATASTEEL Tata Steel Ltd. Steel and Steel Products
50 WIPRO Wipro Tech Numberlogies Ltd. Computers - Software
Sources: NSE
1.3.2 Profile of Select CNX NIFTY Companies
� ����:�������
ACC Limited (ACC) is engaged in manufacture of cement. The Company is also
engaged in the manufacture of ready mixed concrete. During the year ended December 31,
2011, the Company produced 2,01,954 metric tons of Portland Slag Cement (PSC). During

49
In 2012 consolidated revenues increased by 30% to Rs. 96.7 Billion, Net income US $ 300
Million, Diluted Earnings Per Share (EPS) increased to Rs. 83.8 Crores.
� ���:!�������:�������
It is the largest state-owned natural gas processing and distribution company
headquartered in New Delhi, India. It has six segments: Transmission services of natural gas
and Liquefied Petroleum Gas (LPG), Natural gas trading, petrochemicals, LPG and Liquid
hydrocarbons, GAILTEL and Others. The company possessing a well developed and efficient
infrastructure was established as a wholly owned company of the Government of India in
August, 1984 with 100% equity held by the Government of India. The various activities of
the Company range from Gas marketing and distribution through trunk and regional systems,
to retailing of Natural Gas to Gas processing for production and marketing of LPG, liquid
hydrocarbons and Petrochemicals. The equity pattern in the Company has also changed and
the Government today holds about 67% of the equity in the Company. In 2001, GAIL
commissioned worlds longest and India's first Cross Country LPG Transmission Pipeline
from Jamnagar to Loni. It is actively scouting for foreign blocks both exploratory or
discovery. In 2012 its revenue was US $ 7.27 Billion and Net income was US $ 654 Million.
� ���������� �������:�������
Grasim Industries Limited is a company of Aditya Birla Group. The Company is engaged
primarily in two businesses: Viscose Staple Fibre (VSF) and Cement. It also produces caustic
soda and allied chemicals and rayon grade pulp, which are used in the manufacture of VSF.
The manufacturing plants of the Company are located in India, Middle East, Sri Lanka,
Canada, Bangladesh and China. It operates in three segments: fibre and pulp, chemicals and
others. Fibre and Pulp segment includes viscose staple fibre and rayon grade pulp. Chemicals
segment includes caustic soda and allied chemicals. Others include mainly textiles. Textile
segment includes yarn. During the fiscal year ended 31st March 2012, it acquired 33.33%
interest in Aditya Group Sweden. In August 2011, it acquired Aditya Birla Power Ventures
Ltd.
� =�:��� %�, ������$����:�������(=�:)
It is an Indian provider of Information Technology (IT) services and consulting company
headquartered in Noida, Uttar Pradesh, India. It is primarily engaged in providing a range of
Please purchase PDF Split-Merge on www.verypdf.com to remove this watermark.

50
outsourcing services, business process outsourcing and infrastructure services. In November
10th, 1999 the company announced its public issue 1,42,00,000 equity shares of Rs. 4/- each .
The issue includes a Book Built Portion of 1,27,80,000 equity shares and Fixed Price Portion
of 14,20,000 equity shares. HCL Technologies is fourth largest IT Company in India and is
ranked 48 in the global list of IT services providers. HCL Technologies is one of the two
businesses – both of them separately listed in India – falling under the corporate umbrella of
HCL Enterprise with combined annual 2011 revenues of US$ 6 Billion. HCL Enterprise was
founded in 1976 and is one of India's original IT garage start ups. They have decided to vast
their features in Information Technology all over the world. During the last 20 years, HCL
has expanded its service portfolio in IT applications (custom applications for industry
solutions and package implementation), IT infrastructure management, and business process
outsourcing, while maintaining and extending in product engineering.
� =#1��:�������
Housing Development Finance Corporation Limited (HDFC Ltd.) was established in
1977 is a pioneer and leader in housing finance in India. It has assisted more than 4.4 Mllion
customers to own a home of their own, through cumulative housing loan approvals of over
Rs. 5.66 Trillion and disbursements of over Rs. 4.56 Trillion as on March 31, 2013. HDFC
has a wide network of 333 Offices. HDFC's specialist team of over 1,833 (as on 31st March,
2013) trained and experienced professionals follows a 'single-window concept' for providing
smooth and value added services at all stages. HDFC also has a robust deposits mobilisation
programme. HDFC has been able to mobilise deposits from over Rs. 15 Lakhs depositors.
Outstanding deposits grew from Rs. 1,458 Crores in March 1994 to Rs. 51,933 Crores in
March 2013. In addition, HDFC has received 'AAA' rating for its deposit products for highest
safety from both CRISIL and ICRA for nineteenth consecutive years.
� =#1��)��3�:�������
It is an Indian financial services company that was incorporated in August 1994.
HDFC Bank is the 5th or 6th largest bank in India by assets and the second largest bank by
market capitalization as of 24th February, 2012. 90,79,930 number of equity shares were
allotted to HDFC Bank on 1995 and 1,986 branches and over 5,471 ATMs, in 996 cities in
India and all branches of the bank are linked on an online real-time basis. In 2008 HDFC
bank acquired Centurion bank of Punjab taking its total branches to more than 1,000. The
Please purchase PDF Split-Merge on www.verypdf.com to remove this watermark.

51
amalgamated bank emerged with a base of about Rs.1,22,000 Crores and net advances of
about Rs.89,000 Crores. The balance sheet size of the combined entity is more than
Rs.1,63,000 Crores. As per 2012 it has revenue of US$ 6.480 Billion, profit of US$ 0977.2
Million, Total assets of US$ 70.098 Billion and Total equity of US$ 07.754 Billion. HDFC
Bank is one of the Big Four banks of India, along with: State Bank of India, ICICI Bank and
Punjab National Bank. As on May 2013, HDFC Bank has 3,062 branches and 10,743
ATMs, in 1,568 cities in India and all branches of the bank are linked on an online real-time
basis.
� =����2������:�������
Formerly Hero Honda is an Indian motorcycle and scooter manufacturer based in New
Delhi, India. Hero Honda started in 1984 as a joint venture between Hero Cycles of India and
Honda of Japan. The company is the largest two wheeler manufacturer in India. 2006 Forbes
200 Most Respected companies list has Hero Honda Motors ranked at 108. In 2010, when
Honda decided to move out of the joint venture, Hero Group bought the shares held by
Honda. Subsequently, in August 2011 the company was renamed Hero Motors with a new
corporate identity. On 4th June 2012 Hero Motors approved a proposal to merge the
investment arm of its parent-Hero Investment Pvt. Ltd. into the automaker. The decision
comes after 18 months of its split from Honda Motor. In 1984, 15 number of equity shares
subscribed for by the promoters, etc. In November 1997 1,19,99,985 number of equity shares
issued at par of which 71,99,985 shares reserved for allotment. In 2012 its Revenue was
US$ 4.27 Billion, Operating income US$ 470.07 Million and Net income Rs. 2,378.13
Crores.
� =����� ����� �������:�������
Hindalco Industries Limited (Hindalco) is an India-based company. The Company
operates in two segments: Aluminium and Copper. Aluminium consists of hydrate and
alumina, Aluminium and Aluminium products. Copper comprises of continuous cast copper
rods, copper cathode, sulphuric acid, DAP and Complexes, gold and silver. The Company’s
aluminium units across India encompass the entire gamut of operations, from bauxite mining,
alumina refining, aluminium smelting to downstream rolling, extrusions and recycling. Its
product range includes rolled products, extrusions, foils, primary aluminium ingots, billets,
wire rods and aluminium slabs. The Company’s projects include Greenfield projects and
Please purchase PDF Split-Merge on www.verypdf.com to remove this watermark.

52
Brownfield projects. Greenfield expansion projects include Mahan Aluminium Project,
Aditya Alumina and Aluminium Project, Utkal Alumina Project and the Jharkhand
Aluminium Project. Hindalco's Brownfield expansion projects include primary metal and
alumina capacities.
� =��� �����?��������:�������
Hindustan Unilever Limited is an India-based fast moving consumer goods company. The
Company operates in seven business segments. Soaps and detergents include soaps, detergent
bars, detergent powders and scourers. Personal products include products in the categories of
oral care, skin care (excluding soaps), hair care, talcum powder and color cosmetics.
Beverages include tea and coffee. Packaged foods include staples (atta, salt and bread) and
culinary products (tomato-based products, fruit-based products and soups), Ice creams and
frozen desserts. Others include Exports, Chemicals and Water business. As on 31st March,
2012 the Company had over 35 brands spanning 20 distinct categories. Effective 01st April,
2013 Aquagel Chemicals Private Limited became a subsidiary of Hindustan Unilever Ltd.
Effective 4th July 2013 Unilever PLC raised its interest to 51.55% from 36.75%, by acquiring
a 14.784% interest in Hindustan Unilever Ltd.
� �����:�������
ITC Limited operates in five business segments: Fast Moving Consumer Goods (FMCG),
Hotels, Paperboards, Paper & Packaging and Agri Business. The FMCG segment includes
Cigarettes, which consists of cigarettes, cigars and smoking mixtures and others, which
include branded packaged foods (staples, biscuits, confectionery and snack foods), garments,
educational and other stationery products, matches, agarbattis and personal care products.
The hotel segment includes hoteliering. The paperboards, paper and packaging segment
includes paperboards, paper, including specialty paper and packaging including flexibles. The
Agri business segment includes agri commodities such as soya, coffee and leaf tobacco. Its
Agri Business markets agri commodities in the export and domestic markets. Others includes
information technology services, filter rods etc. In September 2011, it acquired Russell Credit
Ltd. On 26th March 2012, it purchased entire share capital of Technico Pty Ltd.
Please purchase PDF Split-Merge on www.verypdf.com to remove this watermark.

53
� ������)��3��:�������
ICICI Bank was established in 1994 by the Industrial Credit and Investment Corporation
of India, an Indian financial institution, as a wholly owned subsidiary. The parent company
was formed in 1955 as a joint-venture of the World Bank, India's public-sector banks and
public-sector insurance companies to provide project financing to Indian industry. The bank
was initially known as the Industrial Credit and Investment Corporation of India Bank, before
it changed its name to the abbreviated ICICI Bank. The parent company was later merged
into ICICI Bank. It is the second largest bank in India by assets and third largest by market
capitalization. The Bank has a network of 2,763 branches and 9,363 ATMs in India, and has a
presence in 19 countries including India. ICICI's shareholding in ICICI Bank was reduced to
46 per cent through a public offering of shares in India in 1998, followed by an equity
offering in the form of American Depositary Receipts on the NYSE in 2000. In 2011 its
Revenue was US$ 13.812 Billion, Profit US$ 01.366 Billion, Total assets US$ 119.69 Billion
and Total equity US$ 12.401 Billion.
� �����.���� %����$����:�������
The company was started in 1981 by seven people with US$ 250. Today,

57
� ������ ����� �������:�������
It is an Indian conglomerate company headquartered in Mumbai, Maharashtra, India. The
company operates through four business segments: petrochemicals, refining, oil and gas and
other segment of the company includes textile, retail business, Special Economic Zone (SEZ)
development and telecom/broadband business. RIL is one of the largest publicly traded
companies in India by market capitalization and is the second largest company in India by
revenue after Indian Oil Corporation. It is also India's largest private sector company by
revenue and profit. The company is ranked 99th on Fortune Global 500 list of the world's
biggest corporations for the year 2012. Reliance Retail has entered into the fresh foods
market as Reliance Fresh. At present its Revenue is US$ 76.119 Billion, Net income is US$
04.116 Billion, Total assets is US$ 64.230 Billion and Total equity is US$ 33.263 Billion.
� ������ ���������� � ���:�������
Reliance Infrastructure Limited is a part of the Reliance Group. Reliance Infrastructure
companies distributes about 36 Billion units of electricity to over 30 Million consumers
across an area that spans over 1,24,300 square kilometres and includes India’s two cities,
Mumbai and Delhi. The Company generates over 940 Megawatt of electricity through its
power stations located in Maharashtra, Andhra Pradesh, Kerala, Karnataka and Goa. The
Company operates in two business segments: Electrical Energy and Engineering,
Procurement and Contracts (EPC). In the case of electrical energy, the Company operates a
500 megawatts thermal power station at Dahanu, a 220 megawatts combined cycle power
plant at Samalkot, 48 megawatts combined cycle power plant at Mormugao, a 7.59
megawatts Windfarm at Chitradurga and also purchases power from third parties and supplies
the power through the Company’s own distribution grid. It supplies power to residential,
industrial, commercial and other consumers.
� ;��������:�������
Sesa Goa Limited (Sesa Goa) is a diversified global metals and mining company. The
Company is engaged in exploration, mining and processing of iron-ore. The Company
operates in three business segments: iron ore, metallurgical coke and pig iron. The Company
is also engaged in producing pig iron and metallurgical coke. The pig iron business focuses
on the domestic Indian market, especially to foundries and steel mills in western and southern
India. As of 31st March 2012 the Company’s total reserves and resources are 374 Million
Please purchase PDF Split-Merge on www.verypdf.com to remove this watermark.

58
tons. On 2nd March 2012 it acquired 100% stake in the equity share capital of Goa Energy
Private Limited. Effective 12th August 2013 Sesa Goa Ltd (Sesa), a 55.1%-owned unit of
Vedanta Resources Plc (Vedanta) merged with Madras Aluminium Company Ltd. (Malco)
and concurrently Sesa acquired Sterlite Industries (India) Ltd. 70.5% interest in Vedanta
Aluminium Ltd. and raised its interest to 59% from 20.17% by acquiring a 38.83% interest in
Cairn India Ltd.
� ;)��!;�����)��3����������:��������
State Bank of India (SBI) is a multinational banking and financial services company
based in India. It is a government-owned corporation with its headquarters in Mumbai,
Maharashtra. SBI is India's largest bank in the country with an asset size of over Rs. 13
Trillion. Although the bank's loan book is largely skewed towards corporate (large, mid and
small) loans (50% of total advances in FY12), the retail side is also fast catching up. SBI has
a network of almost 14,270 branches and over 22,141 ATMs across the country. State Bank
of India is an India-based bank. As of 31st March 2012 the Bank had a network of 20,193
branches, including 5,096 branches of its five associate banks. In addition to banking, the
Company, through its various subsidiaries, provides a range of financial services, which
include life insurance, merchant banking, mutual funds, credit card, factoring, security
trading, pension fund management, custodial services, general insurance and primary
dealership in the money market. Its segments include Treasury, which includes investment
portfolio and trading in foreign exchange contracts and derivative contracts;
Corporate/Wholesale Banking, which comprises lending activities of Corporate Accounts
Group, Mid Corporate Accounts Group and Stressed Assets Management Group; Retail
Banking, which comprises of branches in National Banking Group, which includes personal
banking activities including lending activities to corporate customers and Other Banking
Business.
� ; ��&%���� � �� ������ �������:�������
Sun Pharmaceutical Industries Limited is an international specialty pharmacy
company. The Company manufactures and markets pharmaceutical formulations as branded
generics, as well as generics in India, the United States and several other markets across the
world. The Company’s business is divided into four segments: Indian Branded Generics, US
Generics, International Branded Generics (IBG) and Active Pharmaceutical Ingredients
Please purchase PDF Split-Merge on www.verypdf.com to remove this watermark.

59
(API). Its brands are prescribed in chronic therapy areas like cardiology, psychiatry,
neurology, gastroenterology, diabetology and respiratory. It makes specialty APIs, including
peptides, steroids, hormones and anticancers. APIs and Dosage forms are made at 20 plants
across India, Israel, the United States, Canada, Hungary, Brazil, Mexico and Bangladesh. Its
API products include Acamprosate Calcium, Alendronate Sodium, Amifostinetrihydrate,
Budensonide and Carvedilol. In September 2010, it acquired Taro Pharmaceutical Industries
Ltd.
� �����2������:�������
Tata Motors Limited is an automobile company. Through its other subsidiary, the
Company is engaged in providing engineering and automotive solutions, construction
equipment manufacturing, automotive vehicle components manufacturing and supply chain
activities, machine tools and factory automation solutions, high-precision tooling and plastic
and electronic components for automotive and computer applications and automotive
retailing and service operations. It operates in two segments: automotive operations and all
other operations. Its automotive operations include all activities relating to development,
design, manufacture, assembly and sale of vehicles, including financing thereof, as well as
sale of related parts and accessories. Its other operations business segment includes
Information Technology (IT) services and machine tools and factory automation solutions.
During the fiscal year ended 31st March 2012 (fiscal 2012) the Company sold 12,69,483
vehicles.
� �����&�B�����������
Tata Power Company Limited is an integrated power company. The Company operates in
two segments: power, which is engaged in the generation, transmission and distribution of
electricity, and others, which is engaged in the defense electronics, project
contracts/infrastructure management services, coal bed methane and property development.
During the fiscal year ended 31st March 2012, the Company’s wind farms in Mumbai
operations generated 232 mega units (MUs). As of 31st March 2012 Company’s installed
wind power capacity outside Mumbai operations was Samana, Gujarat with an installed
capacity of 50 megawatts; Gadag, Karnataka with an installed capacity of 50 megawatts;
Nivede, Maharashtra with a installed capacity of 21 megawatts, and Poolavadi, Tamil Nadu
Please purchase PDF Split-Merge on www.verypdf.com to remove this watermark.

60
with a installed capacity of 99 megawatts. On 30th June 2012 the Company purchased 51%
interest in Tata BP Solar India Limited from BP Alternative Energy Holdings Limited.
� ��������� ���� .�;���� ���:�������!��;��
It is an Indian Multinational Information Technology (IT) services, business solutions and
Outsourcing Services Company headquartered in Mumbai, Maharashtra. TCS is a subsidiary
of the Tata Group and is listed on the Bombay Stock Exchange and the National Stock
Exchange of India. It is one of India's most valuable companies and is one of the five largest
India-based IT services firms. Tata Consultancy Services was founded in 1968. One of its
first contracts was to provide punched card services to sister company TISCO (now Tata
Steel). TCS and its subsidiaries provide a wide range of information technology-related
products and services including application development; business process outsourcing;
capacity planning; consulting; enterprise software; hardware sizing; payment processing;
software management; and technology education services. As of 31st March 2012, TCS had
183 offices across 43 countries and 117 delivery canters across 21 countries. At the same date
TCS had a total of 58 subsidiary companies. At present its Revenue US$ 10.17 Billion and
Profit US$ 2.2 Billion. The Company has been awarded a multi-million-dollar contract to
develop a software system, which will make insurance information from the General
Organisation of Social Insurance, Saudi Arabia.
� 8������� %�, ������$����:������
The company was incorporated on 29th December 1945 at Mumbai. It is an Indian
multinational provider of Information Technology (IT) services, consulting and outsourcing
services. It is headquartered in Bangalore, Karnataka, India. The company operates in four
segments: IT products and services, Consumer care and lighting, Healthcare and
Infrastructure engineering. Wipro Technologies, the global IT business of Wipro Limited is a
leading Information Technology, consulting and outsourcing company with a comprehensive
portfolio of services and an organization wide commitment to sustainability and innovation.
The IT Products segment sells a range of Wipro personal desktop computers, Wipro servers
and Wipro notebooks. It is also a value added reseller of desktops, servers, notebooks, storage
products, networking solutions and packaged software for international brands. It also entered
into a definitive agreement to acquire Oki Techno Centre Singapore Pvt Ltd (OTCS) and
signed an R&D partnership contract with Nokia Siemens Networks in Germany. At present
Please purchase PDF Split-Merge on www.verypdf.com to remove this watermark.

61
its Revenue US$ 7.30 Billion, Operating income US$ 1.25 Billion, Profit US$ 1.09 Billion,
Total assets US$ 89.55 Billion and Total equity US$ 5.60 Billion.
1.4 Conclusion
The introduction chapter of this study discloses the framework of Stock market
volatility, Economic policies, Performance of Indian Capital market pre and post financial
sector reforms and the profile of CNX Nifty companies. Thus the Indian Capital Market is in
transition. There has been a revolutionary change over a period of time. This chapter is
helping to understand about the operational and systematic risk management parameters,
settlement system, disclosures, accounting standards, modeling and forecasting volatility,
capital markets, CNX Nifty companies and it will help the investors and researchers to get
fundamental information.
�
�
�
� �
Please purchase PDF Split-Merge on www.verypdf.com to remove this watermark.