Embed Size (px)
Citation preview
8/4/2019 Volatility Stock Markets
http://slidepdf.com/reader/full/volatility-stock-markets 1/18
Recent Volatility in Stock Markets in India and Foreign InstitutionalInvestors
Parthapratim Pal
Section 1. Introduction
After the first few phases of polling of the general election in India, there was a sudden and
sharp increase in stock market volatility in this country. Apparently, the prospect of a non-BJP
government in the center made the big players in the stock market nervous about the
continuation of the ongoing reform measures in India. Largely owing to selling pressures from
foreign institutional investors (FIIs), the Bombay Stock Exchange Sensitivity Index (Sensex)
declined from about the 5,900 on 22nd
April to around 4,500 on May 18th. On 17
thMay, it
registered a record 800 point decline, which is the steepest fall in the 130-year-old history of
the stock exchange, before recovering to close 564 points lower. To calm these investors, senior
Congress leaders had to issue statements reaffirming their faith in the market oriented ‘reform’
measures. Even though the verdict of the general election was seen as a mandate against the
neo-liberal economic policies pursued by the outgoing government, the upheavals of the stock
markets managed to influence the new government’s policies even before the new ministry was
formed.
The apparent ease in which the stock market and institutional investors managed to influence
policymaking created a debate in India. In the financial media there was a view that the decline
of the Sensex happened because major ‘market’ players was wary about the political stability of
the new regime and they did not approve of the policy statements made by some of the leaders
of the United Progressive Alliance. These investors showed their disapproval and lack of
confidence in the new government by withdrawing from the market. However, many analysts
suspected that it was an attempt by financial rentiers, particularly foreign institutional investor s,
to overrule the anti-reform verdict delivered in the election and nudge policy makers towards
adopting neo-liberal policies which essentially suit these investors.
Given this controversy, this paper aims to take a detailed look at the stock market and the
behavior of different investor groups, especially the FIIs, in India for the period March 2004 to
June 2004. The objective of the paper is also to investigate how the withdrawal of foreign
portfolio capital in the post election phase has affected the price and equity holding pattern of
different Sensex companies. This will help us understand the dynamics of the stock market
crash in the post election period. This paper is organized in the following manner. Section 2
looks at the movement of the Sensex and measures its volatility in the recent months, section 3
investigates the pattern of foreign portfolio investment and its influence on the Sensex, section
1
8/4/2019 Volatility Stock Markets
http://slidepdf.com/reader/full/volatility-stock-markets 2/18
4 looks at the change in shareholding pattern of Sensex companies and section 5 concludes the
study.
Section 2. Movement of Sensex and Volatility in the Stock Market
To recapitulate the events, the general election was held in four phases-the dates of polls being
20th
April, 26th
April, 5th
May and 10th
May. The counting started on 13th
May and because of
use of electronic voting machines, most results were declared on that day. However, the exit
polls conducted by the media started to give an indication of a non-NDA government from the
second phase of polling. If one looks closely at the behaviour of the Sensex during this period,
it shows that the downward movement of the Sensex started around 23rd April, that is between
the first and second phase of polling and kept declining till the middle of May. The behaviour
of the foreign portfolio investors matched the behaviour of Sensex during this period. Net FII
investment in the Indian capital markets started fluctuating sharply from 23 April and from 30th
April it turned negative. Net FII investment in the Indian stock market continued to be negative
till the middle of May. During this period, the Sensex and net FII investment showed very high
degree of correlation. For the period 23rd
April to 17th
May, the correlation between daily net
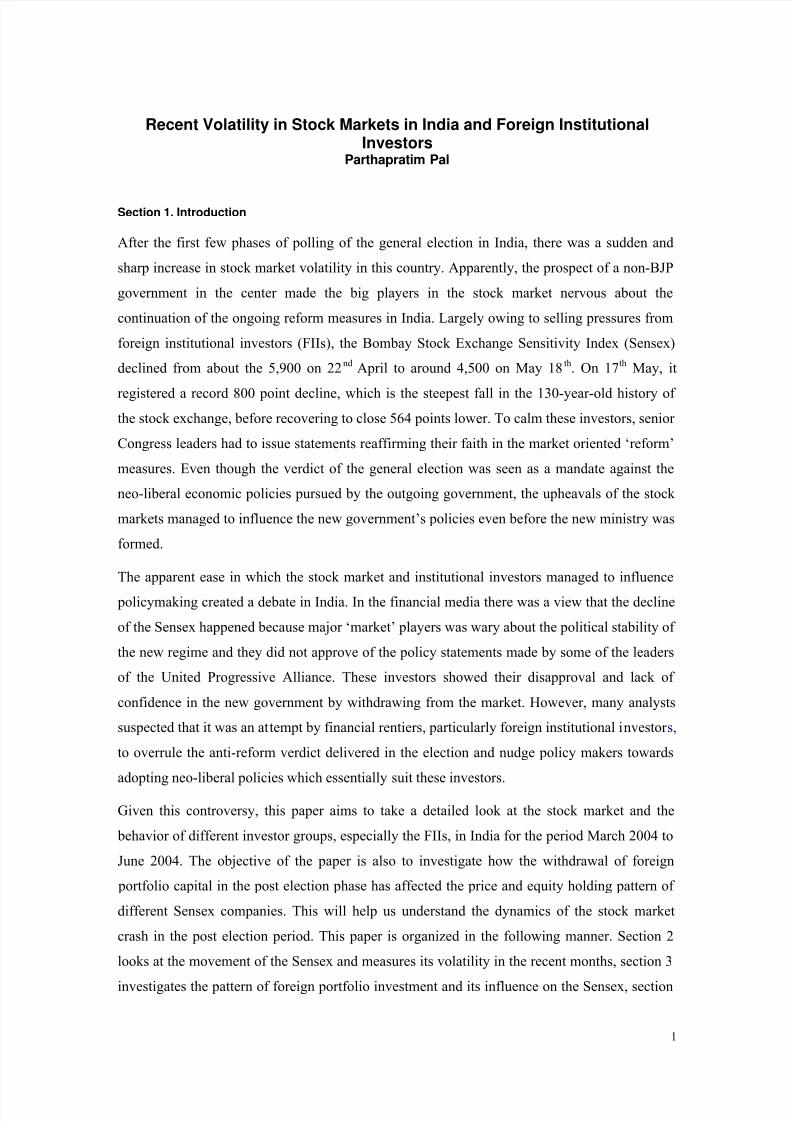
FII equity investment and the Sensex was as high as 0.70. Figure 1 shows daily movements of
Sensex and Net FII investment in India during the months of April, May and June. A somewhat
different trend is observed from 18th
May to the end of that month. The Sensex started a
recovery from 18th May and the declining trend of net FII investment also reversed from that
day.
Figure 1. Movement of Sensex and Net FII Investment in India
4,000
4,200
4,400
4,600
4,800
5,000
5,200
5,400
5,600
5,800
6,000
2 -A pr
7 -A pr
1 2 -A pr
1 7 -A pr
2 2 -A pr
2 7 -A pr
2 -M a y
7 -M a y
1 2 -M a y
1 7 -M a y
2 2 -M a y
2 7 -M a y
1 - J un
6 - J un
1 1 - J un
1 6 - J un
2 1 - J un
2 6 - J un
S e n s e x
-800
-600
-400
-200
0
200
400
600
800
1000
1200
N e t F I I I n v e s t m e n t
Sensex Net FII Investment (in Rs Cr)
Source: Sensex data from BSE website (www.bseindia.com), FII investment data from SEBI website
(www.sebi.co.in)
2
8/4/2019 Volatility Stock Markets
http://slidepdf.com/reader/full/volatility-stock-markets 3/18
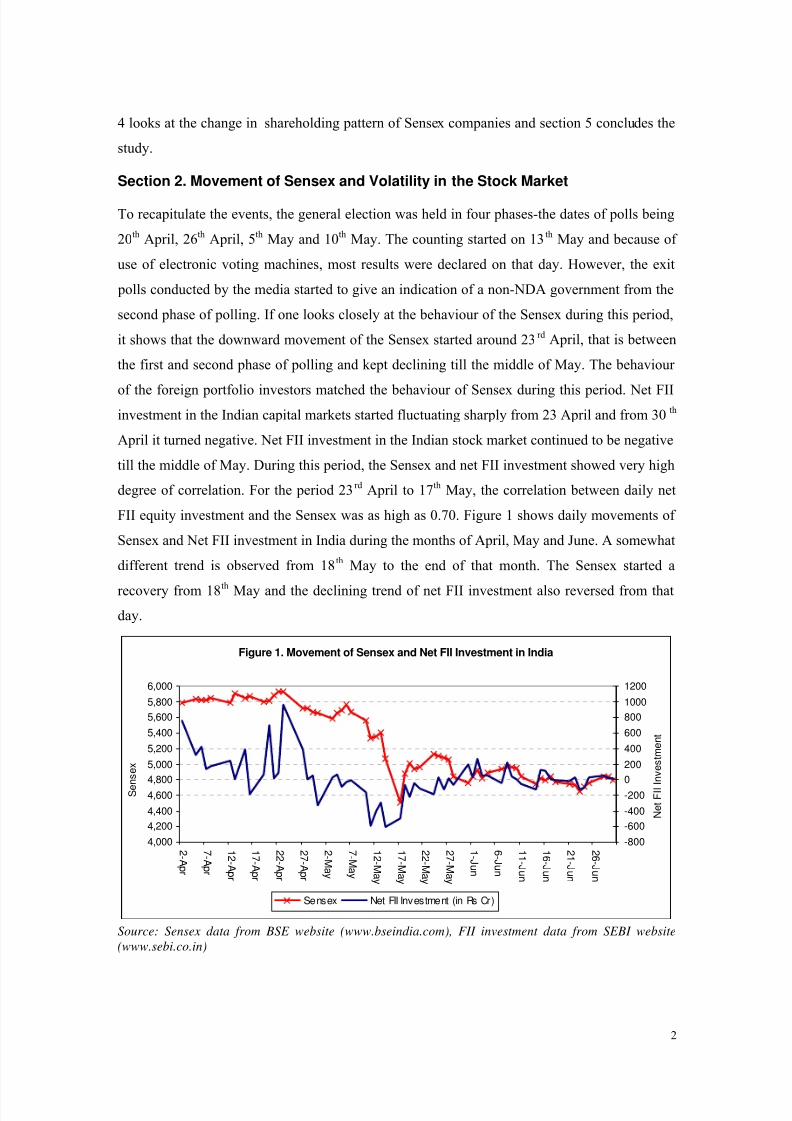
The churnings of stock prices led to a sharp rise in stock market volatility in May. To measure
how much the volatility increased during that month, the following two methods of estimating
inter and intra day stock market volatility is used here. These measures are suggested in a
recent SEBI Publication on volatility by Raju and Ghosh (2004).
The first formula measures inter day volatility by computing standard deviation of daily returns
on stock prices. In this method, the formula used for calculating volatility is
σ =2*)()1/1( r r n t −− ∑ where… r t = ln(I t /I t-1)
I t is the closing value of the stock market index at time t,
ln is natural logarithm
The second formula uses intra day High and lows of stock market prices and estimate intra-day
volatility. The following formula is used in this case:
σ =2
)/(log(/1 t t L H nk where H t and Lt are intra day high and low prices,
and following Parkinson (1980), k is taken as 0.601
Daily Sensex data are used for estimation of volatility. Data are taken from the Bombay Stock
exchange website (www.bseindia.com)
Calculations show that both inter and intra day volatility of BSE Sensex followed similar trend
during 2004. From January to April, both intra and inter day volatilities of Sensex were on a
decline and were below the 1.5 mark. Suddenly in May there was a spike in volatility and bothinter and intra day volatility almost doubled for that month. However, after May, volatility has
again subsided and has settled down to levels observed during the earlier part of the year
(Figure 2).
Figure 2. Volatility of BSE Sensex in 2004
0
0.5
1
1.5
2
2.5
3
3.5
4
4.5
Jan-04 Feb-04 Mar-04 Apr-04 May-04 Jun-04 Jul-04 Aug-04
Intra-day High-low volatility Standard Deviation of Daily Returns
Source: author’s calculation from daily Sensex data
3
8/4/2019 Volatility Stock Markets
http://slidepdf.com/reader/full/volatility-stock-markets 4/18
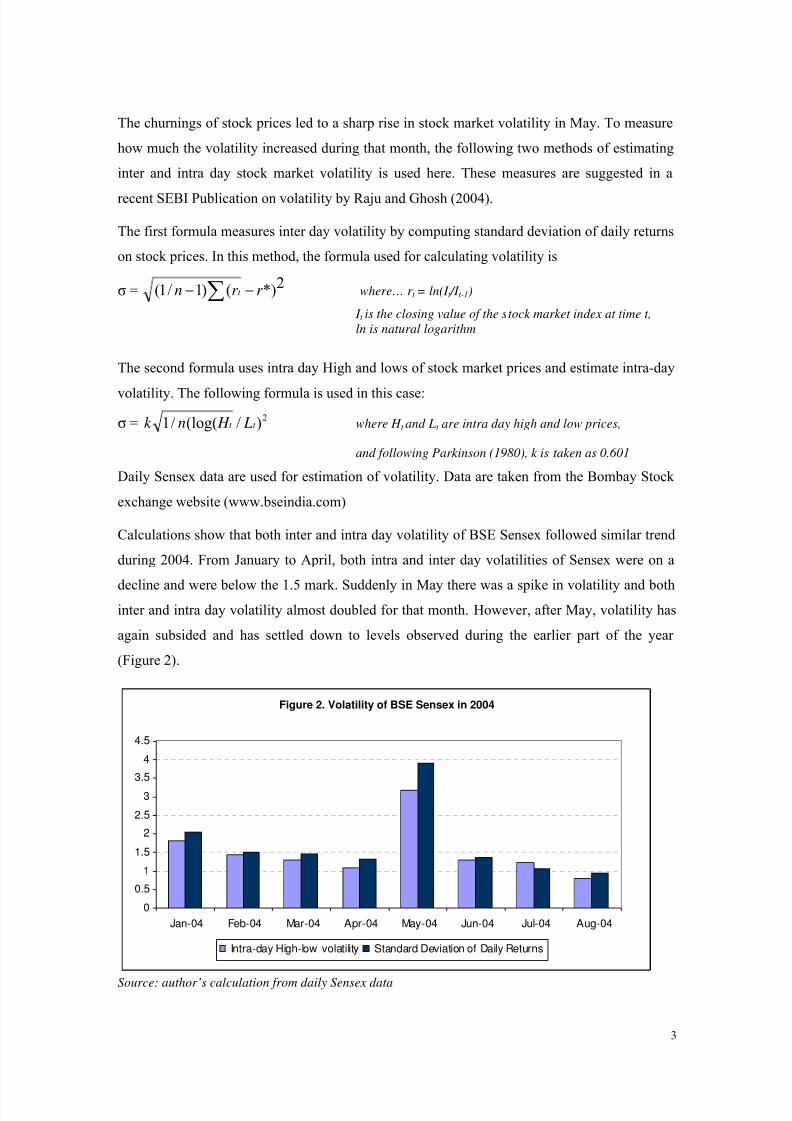
The level of volatility observed during May is unusually high even in the context of historical
stock market data. Figure 3 shows that average intra and inter-day volatility in the Indian stock
market for the period 1992-2003. From the figure it can be seen that annual stock market
volatility in India has been low and since 2000 there has been a steady decline of volatility in
India. However, it should be noted that though the average level of volatility has been low,
periodic high volatility in Indian stock market is not unprecedented as bouts of sudden stock
market volatility had occurred in the past. Interestingly, in most cases of high stock market
volatility, subsequent investigations have revealed the presence of price manipulation and
irregularity in the stock market.
Figure 3. Annual Inter and Intra-day Volatility of Sensex
0.00
0.50
1.00
1.50
2.00
2.50
3.00
3.50
4.00
4.50
1992 1993 1994 1995 1996 1997 1998 1999 2000 2001 2002 2003
Inter-day Volatility High-low volatil ity
Source: Raju and Ghosh (2004)
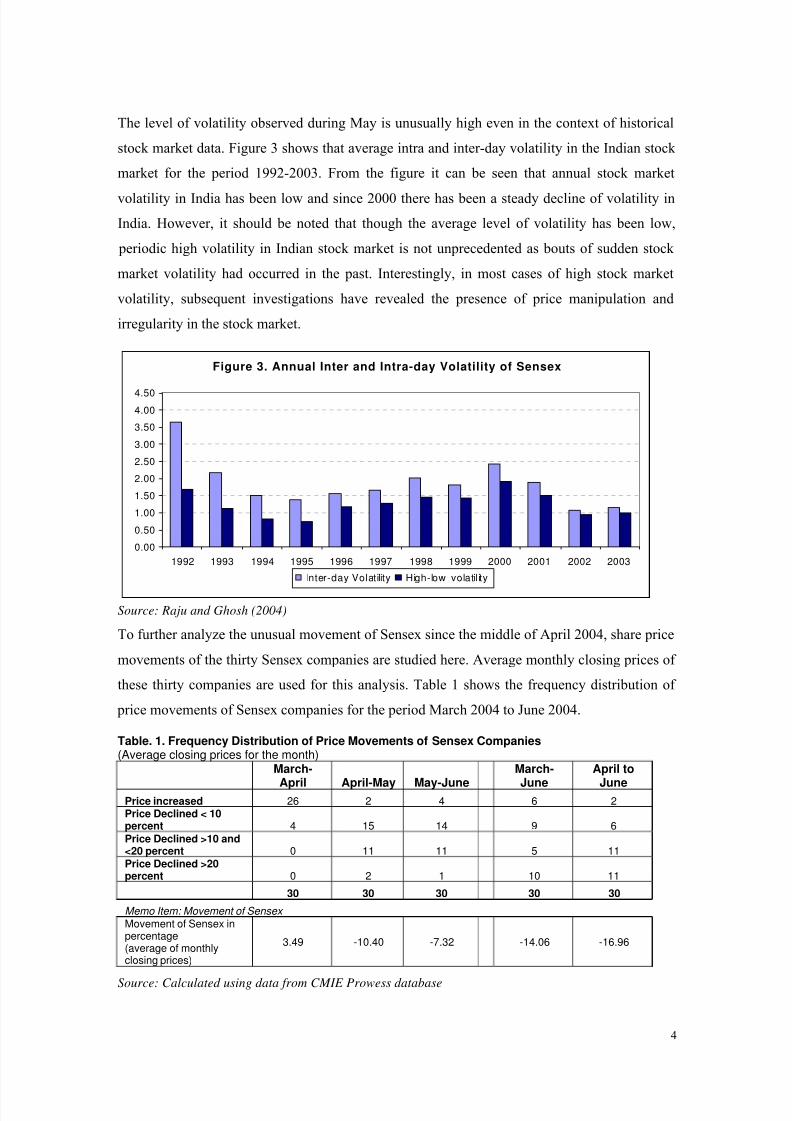
To further analyze the unusual movement of Sensex since the middle of April 2004, share price
movements of the thirty Sensex companies are studied here. Average monthly closing prices of
these thirty companies are used for this analysis. Table 1 shows the frequency distribution of
price movements of Sensex companies for the period March 2004 to June 2004.
Table. 1. Frequency Distribution of Price Movements of Sensex Companies(Average closing prices for the month)
March-
April April-May May-June
March-
June
April to
JunePrice increased 26 2 4 6 2Price Declined < 10percent 4 15 14 9 6
Price Declined >10 and<20 percent 0 11 11 5 11Price Declined >20percent 0 2 1 10 11
30 30 30 30 30
Memo Item: Movement of Sensex Movement of Sensex inpercentage(average of monthlyclosing prices)
3.49 -10.40 -7.32 -14.06 -16.96
Source: Calculated using data from CMIE Prowess database
4
8/4/2019 Volatility Stock Markets
http://slidepdf.com/reader/full/volatility-stock-markets 5/18
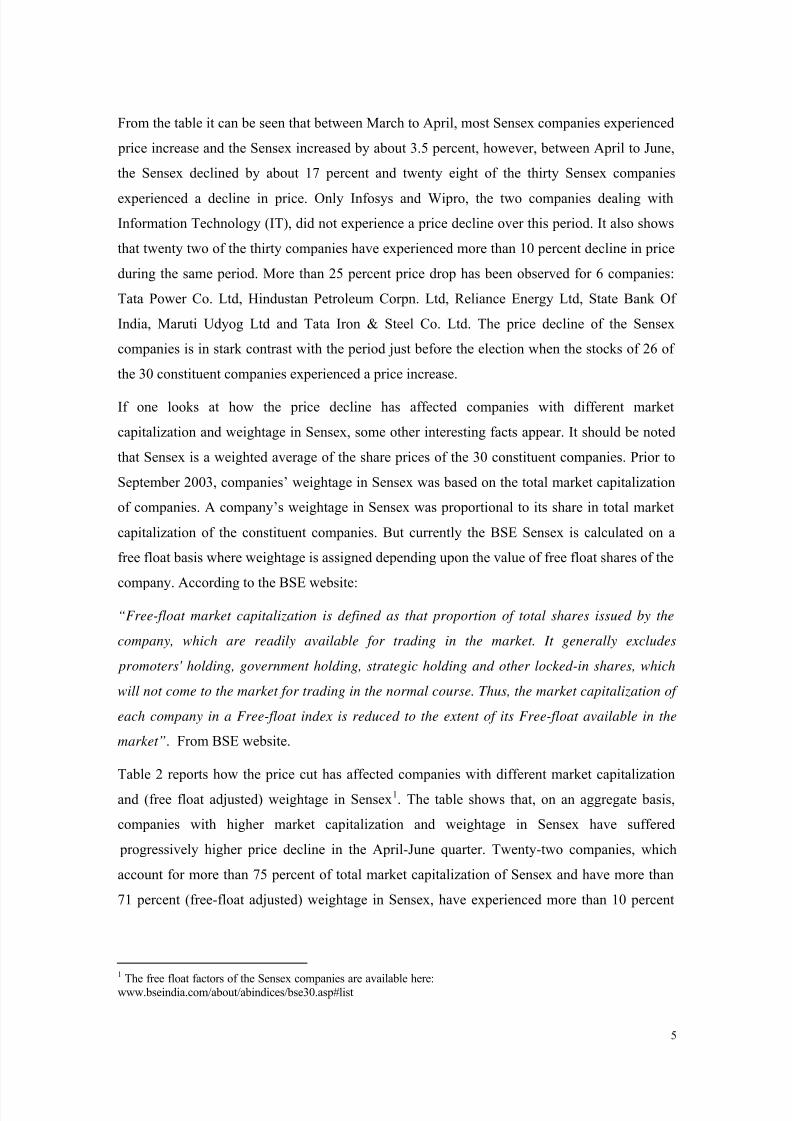
From the table it can be seen that between March to April, most Sensex companies experienced
price increase and the Sensex increased by about 3.5 percent, however, between April to June,
the Sensex declined by about 17 percent and twenty eight of the thirty Sensex companies
experienced a decline in price. Only Infosys and Wipro, the two companies dealing with
Information Technology (IT), did not experience a price decline over this period. It also shows
that twenty two of the thirty companies have experienced more than 10 percent decline in price
during the same period. More than 25 percent price drop has been observed for 6 companies:
Tata Power Co. Ltd, Hindustan Petroleum Corpn. Ltd, Reliance Energy Ltd, State Bank Of
India, Maruti Udyog Ltd and Tata Iron & Steel Co. Ltd. The price decline of the Sensex
companies is in stark contrast with the period just before the election when the stocks of 26 of
the 30 constituent companies experienced a price increase.
If one looks at how the price decline has affected companies with different market
capitalization and weightage in Sensex, some other interesting facts appear. It should be noted
that Sensex is a weighted average of the share prices of the 30 constituent companies. Prior to
September 2003, companies’ weightage in Sensex was based on the total market capitalization
of companies. A company’s weightage in Sensex was proportional to its share in total market
capitalization of the constituent companies. But currently the BSE Sensex is calculated on a
free float basis where weightage is assigned depending upon the value of free float shares of the
company. According to the BSE website:
“Free-float market capitalization is defined as that proportion of total shares issued by the
company, which are readily available for trading in the market. It generally excludes
promoters' holding, government holding, strategic holding and other locked-in shares, which
will not come to the market for trading in the normal course. Thus, the market capitalization of
each company in a Free-float index is reduced to the extent of its Free-float available in the
market”. From BSE website.
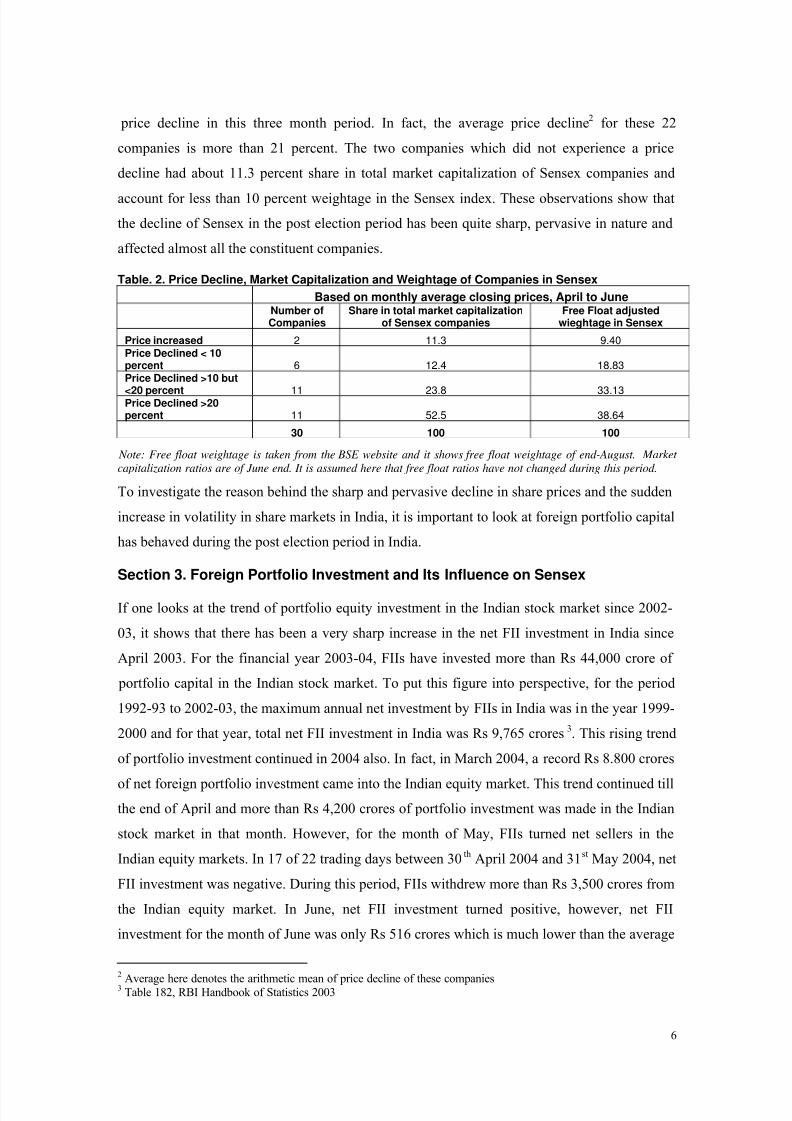
Table 2 reports how the price cut has affected companies with different market capitalization
and (free float adjusted) weightage in Sensex1. The table shows that, on an aggregate basis,
companies with higher market capitalization and weightage in Sensex have suffered
progressively higher price decline in the April-June quarter. Twenty-two companies, which
account for more than 75 percent of total market capitalization of Sensex and have more than
71 percent (free-float adjusted) weightage in Sensex, have experienced more than 10 percent
1
The free float factors of the Sensex companies are available here:www.bseindia.com/about/abindices/bse30.asp#list
5
8/4/2019 Volatility Stock Markets
http://slidepdf.com/reader/full/volatility-stock-markets 6/18
price decline in this three month period. In fact, the average price decline2
for these 22
companies is more than 21 percent. The two companies which did not experience a price
decline had about 11.3 percent share in total market capitalization of Sensex companies and
account for less than 10 percent weightage in the Sensex index. These observations show that
the decline of Sensex in the post election period has been quite sharp, pervasive in nature and
affected almost all the constituent companies.
Table. 2. Price Decline, Market Capitalization and Weightage of Companies in Sensex
Based on monthly average closing prices, April to JuneNumber ofCompanies
Share in total market capitalizationof Sensex companies
Free Float adjustedwieghtage in Sensex
Price increased 2 11.3 9.40Price Declined < 10percent 6 12.4 18.83Price Declined >10 but
<20 percent 11 23.8 33.13Price Declined >20percent 11 52.5 38.64
30 100 100
Note: Free float weightage is taken from the BSE website and it shows free float weightage of end-August. Market
capitalization ratios are of June end. It is assumed here that free float ratios have not changed during this period.
To investigate the reason behind the sharp and pervasive decline in share prices and the sudden
increase in volatility in share markets in India, it is important to look at foreign portfolio capital
has behaved during the post election period in India.
Section 3. Foreign Portfolio Investment and Its Influence on Sensex
If one looks at the trend of portfolio equity investment in the Indian stock market since 2002-
03, it shows that there has been a very sharp increase in the net FII investment in India since
April 2003. For the financial year 2003-04, FIIs have invested more than Rs 44,000 crore of
portfolio capital in the Indian stock market. To put this figure into perspective, for the period
1992-93 to 2002-03, the maximum annual net investment by FIIs in India was in the year 1999-
2000 and for that year, total net FII investment in India was Rs 9,765 crores3. This rising trend
of portfolio investment continued in 2004 also. In fact, in March 2004, a record Rs 8.800 crores
of net foreign portfolio investment came into the Indian equity market. This trend continued till
the end of April and more than Rs 4,200 crores of portfolio investment was made in the Indian
stock market in that month. However, for the month of May, FIIs turned net sellers in the
Indian equity markets. In 17 of 22 trading days between 30th
April 2004 and 31st
May 2004, net
FII investment was negative. During this period, FIIs withdrew more than Rs 3,500 crores from
the Indian equity market. In June, net FII investment turned positive, however, net FII
investment for the month of June was only Rs 516 crores which is much lower than the average
2
Average here denotes the arithmetic mean of price decline of these companies3 Table 182, RBI Handbook of Statistics 2003
6

8/4/2019 Volatility Stock Markets
http://slidepdf.com/reader/full/volatility-stock-markets 7/18
monthly net FII investment of around Rs 14,485 crores experienced during the first quarter of
the year.
The reversal of net portfolio capital inflow during the post election period reduced the stock of
foreign portfolio investment from Rs 109,513 crores at the end of April to Rs 106,873 crores at
the end of June, which is a decline of about 2.4 percent. However, if one looks at the data on a
quarterly basis, it shows that during the second quarter of 2004, that is, between March and
June, the stock of FII investment has actually increased by about 1.5 percent (Figure 4 and 5).
But during the same period, the Sensex witnessed a 14 percent decline.
Monthly Net FII Equity Investment in India (April 2002 to July 2004)
Figure 4. Monthly Inflow of Net FII Equity Investm ent
-4000
-2000
0
2000
4000
6000
8000
10000
A pr - 0 2
J un- 0 2
A u g- 0 2
O c t - 0 2
D e c - 0 2
F e b - 0 3
A pr - 0 3
J un- 0 3
A u g- 0 3
O c t - 0 3
D e c - 0 3
F e b - 0 4
A pr - 0 4
J un- 0 4
i n R s C r o r e s
Figure 5. Monthly Stock of Net FII Equity Investm ent
0
20000
40000
60000
80000
100000
120000
A pr - 0 2
J un- 0 2
A u g- 0 2
O c t - 0 2
D e c - 0 2
F e b - 0 3
A pr - 0 3
J un- 0 3
A u g- 0 3
O c t - 0 3
D e c - 0 3
F e b - 0 4
A pr - 0 4
J un- 0 4
i n R s C r o r e s
Source: FII investment data from SEBI website (www.sebi.co.in) and RBI Handbook of Statistics 2003
The movement of the Sensex and net foreign portfolio investment highlights the importance of
FIIs at the margin. It can be seen from the graph (Figure 5) that in the context of the total stock
of FII investment in India, the decline observed during the month of May is not very high. But
even a temporary reversal of FII flows for a few days managed to create panic in the stock
market which triggered the stock market crash.
7
8/4/2019 Volatility Stock Markets
http://slidepdf.com/reader/full/volatility-stock-markets 8/18
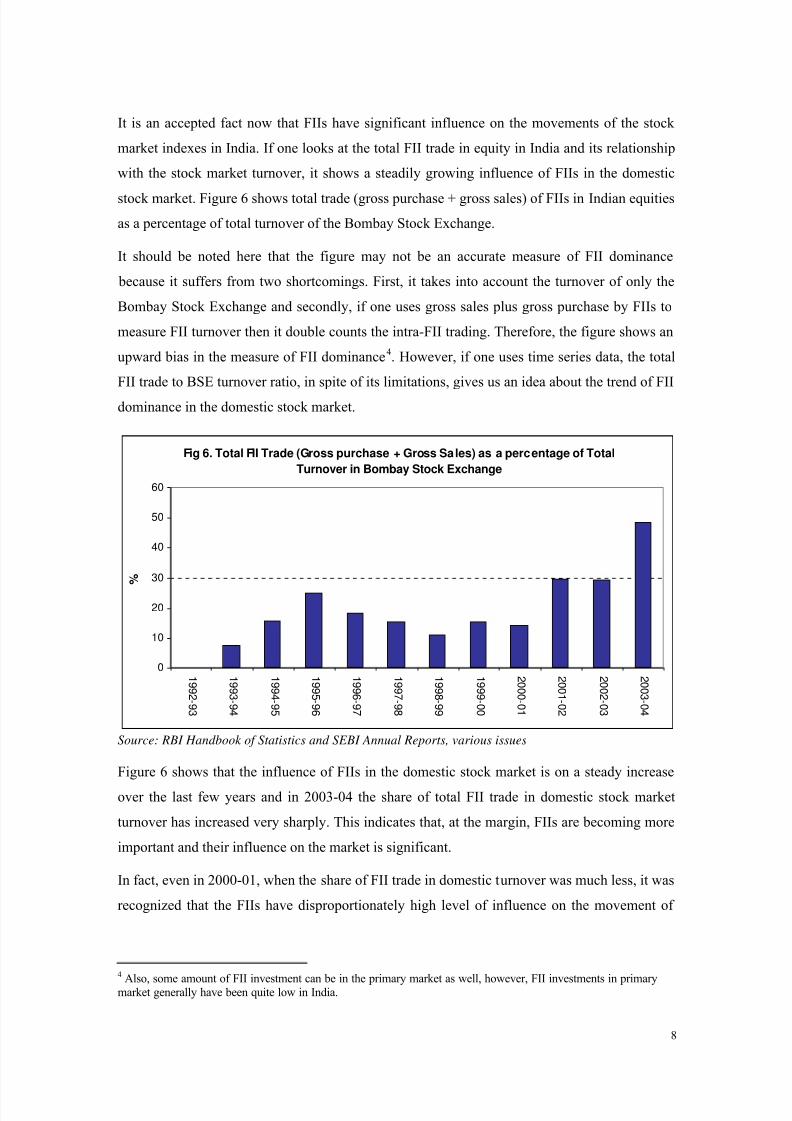
It is an accepted fact now that FIIs have significant influence on the movements of the stock
market indexes in India. If one looks at the total FII trade in equity in India and its relationship
with the stock market turnover, it shows a steadily growing influence of FIIs in the domestic
stock market. Figure 6 shows total trade (gross purchase + gross sales) of FIIs in Indian equities
as a percentage of total turnover of the Bombay Stock Exchange.
It should be noted here that the figure may not be an accurate measure of FII dominance
because it suffers from two shortcomings. First, it takes into account the turnover of only the
Bombay Stock Exchange and secondly, if one uses gross sales plus gross purchase by FIIs to
measure FII turnover then it double counts the intra-FII trading. Therefore, the figure shows an
upward bias in the measure of FII dominance4. However, if one uses time series data, the total
FII trade to BSE turnover ratio, in spite of its limitations, gives us an idea about the trend of FII
dominance in the domestic stock market.
Fig 6. Total FII Trade (Gross purchase + Gross Sales) as a percentage of Total
Turnover in Bombay Stock Exchange
0
10
20
30
40
50
60
1 9 9 2 - 9 3
1 9 9 3 - 9 4
1 9 9 4 - 9 5
1 9 9 5 - 9 6
1 9 9 6 - 9 7
1 9 9 7 - 9 8
1 9 9 8 - 9 9
1 9 9 9 - 0 0
2 0 0 0 - 0 1
2 0 0 1 - 0 2
2 0 0 2 - 0 3
2 0 0 3 - 0 4
%
Source: RBI Handbook of Statistics and SEBI Annual Reports, various issues
Figure 6 shows that the influence of FIIs in the domestic stock market is on a steady increase
over the last few years and in 2003-04 the share of total FII trade in domestic stock market
turnover has increased very sharply. This indicates that, at the margin, FIIs are becoming more
important and their influence on the market is significant.
In fact, even in 2000-01, when the share of FII trade in domestic turnover was much less, it was
recognized that the FIIs have disproportionately high level of influence on the movement of
4
Also, some amount of FII investment can be in the primary market as well, however, FII investments in primarymarket generally have been quite low in India.
8
8/4/2019 Volatility Stock Markets
http://slidepdf.com/reader/full/volatility-stock-markets 9/18
stock indices in India. The 2001 edition of National Stock Exchange’s annual publication,
Indian Stock Market Review says:
“Though the volume of trades done by FIIs is not very high as compared to other market
participants, they are the driving force in determination of market sentiments and price trends.
This is so because they do only delivery-based trades and they are perceived to be infallible in
their assessment of the market.” Pg. 125
Apart from the psychological
factors mentioned in NSE
(2001), the influence of FIIs
on the movement of Sensex
will also become clear if one
looks at the shareholding
pattern of the 30 companies
that constitute the index.
Shareholding data is available
on a quarterly basis from the
CMIE Prowess database and
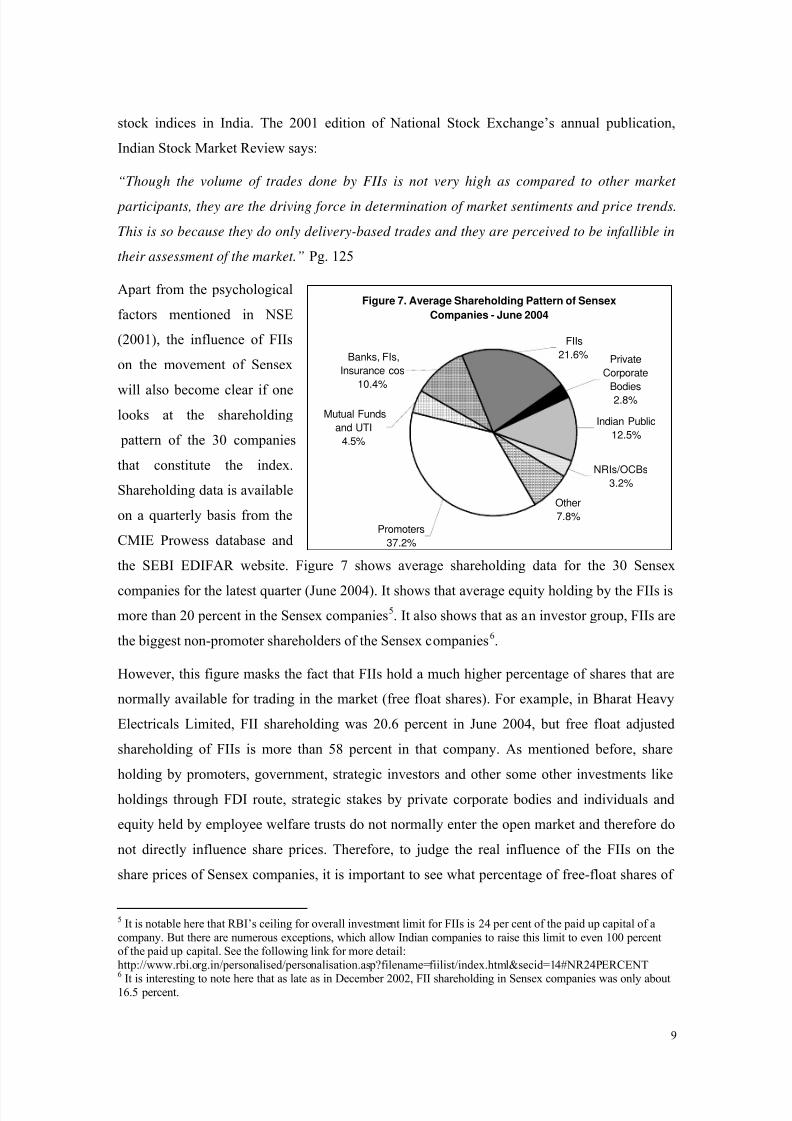
the SEBI EDIFAR website. Figure 7 shows average shareholding data for the 30 Sensex
companies for the latest quarter (June 2004). It shows that average equity holding by the FIIs is
more than 20 percent in the Sensex companies5. It also shows that as an investor group, FIIs are
the biggest non-promoter shareholders of the Sensex companies6.
Figure 7. Average Shareholding Pattern of Sensex
Companies - June 2004
Other
7.8%
Private
Corporate
Bodies
2.8%
Indian Public
12.5%
Promoters
37.2%
Mutual Funds
and UTI
4.5%
NRIs/OCBs
3.2%
FIIs
21.6%Banks, FIs,
Insurance cos
10.4%
However, this figure masks the fact that FIIs hold a much higher percentage of shares that are
normally available for trading in the market (free float shares). For example, in Bharat Heavy
Electricals Limited, FII shareholding was 20.6 percent in June 2004, but free float adjusted
shareholding of FIIs is more than 58 percent in that company. As mentioned before, share
holding by promoters, government, strategic investors and other some other investments like
holdings through FDI route, strategic stakes by private corporate bodies and individuals and
equity held by employee welfare trusts do not normally enter the open market and therefore do
not directly influence share prices. Therefore, to judge the real influence of the FIIs on the
share prices of Sensex companies, it is important to see what percentage of free-float shares of
5 It is notable here that RBI’s ceiling for overall investment limit for FIIs is 24 per cent of the paid up capital of a
company. But there are numerous exceptions, which allow Indian companies to raise this limit to even 100 percentof the paid up capital. See the following link for more detail:
http://www.rbi.org.in/personalised/personalisation.asp?filename=fiilist/index.html&secid=14#NR24PERCENT6
It is interesting to note here that as late as in December 2002, FII shareholding in Sensex companies was only about16.5 percent.
9
8/4/2019 Volatility Stock Markets
http://slidepdf.com/reader/full/volatility-stock-markets 10/18
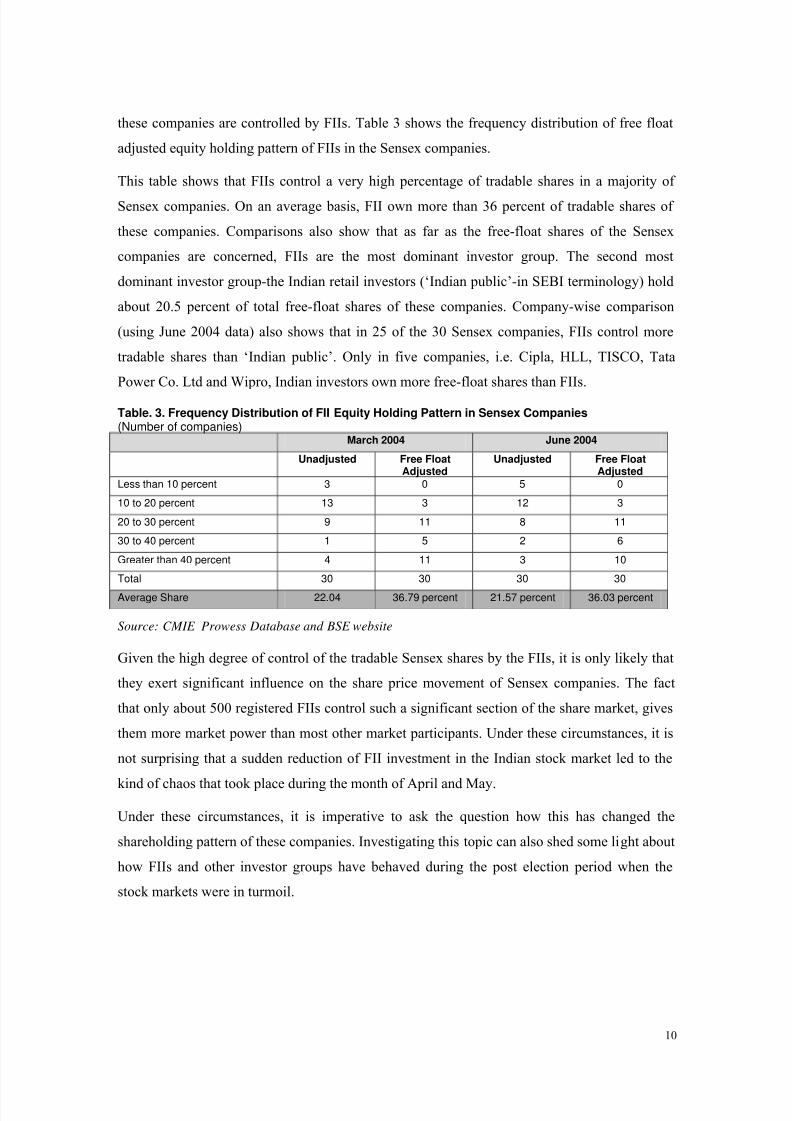
these companies are controlled by FIIs. Table 3 shows the frequency distribution of free float
adjusted equity holding pattern of FIIs in the Sensex companies.
This table shows that FIIs control a very high percentage of tradable shares in a majority of
Sensex companies. On an average basis, FII own more than 36 percent of tradable shares of
these companies. Comparisons also show that as far as the free-float shares of the Sensex
companies are concerned, FIIs are the most dominant investor group. The second most
dominant investor group-the Indian retail investors (‘Indian public’-in SEBI terminology) hold
about 20.5 percent of total free-float shares of these companies. Company-wise comparison
(using June 2004 data) also shows that in 25 of the 30 Sensex companies, FIIs control more
tradable shares than ‘Indian public’. Only in five companies, i.e. Cipla, HLL, TISCO, Tata
Power Co. Ltd and Wipro, Indian investors own more free-float shares than FIIs.
Table. 3. Frequency Distribution of FII Equity Holding Pattern in Sensex Companies (Number of companies)
March 2004 June 2004
Unadjusted Free FloatAdjusted
Unadjusted Free FloatAdjusted
Less than 10 percent 3 0 5 0
10 to 20 percent 13 3 12 3
20 to 30 percent 9 11 8 11
30 to 40 percent 1 5 2 6
Greater than 40 percent 4 11 3 10
Total 30 30 30 30
Average Share 22.04 36.79 percent 21.57 percent 36.03 percent
Source: CMIE Prowess Database and BSE website
Given the high degree of control of the tradable Sensex shares by the FIIs, it is only likely that
they exert significant influence on the share price movement of Sensex companies. The fact
that only about 500 registered FIIs control such a significant section of the share market, gives
them more market power than most other market participants. Under these circumstances, it is
not surprising that a sudden reduction of FII investment in the Indian stock market led to the
kind of chaos that took place during the month of April and May.
Under these circumstances, it is imperative to ask the question how this has changed the
shareholding pattern of these companies. Investigating this topic can also shed some light about
how FIIs and other investor groups have behaved during the post election period when the
stock markets were in turmoil.
10
8/4/2019 Volatility Stock Markets
http://slidepdf.com/reader/full/volatility-stock-markets 11/18
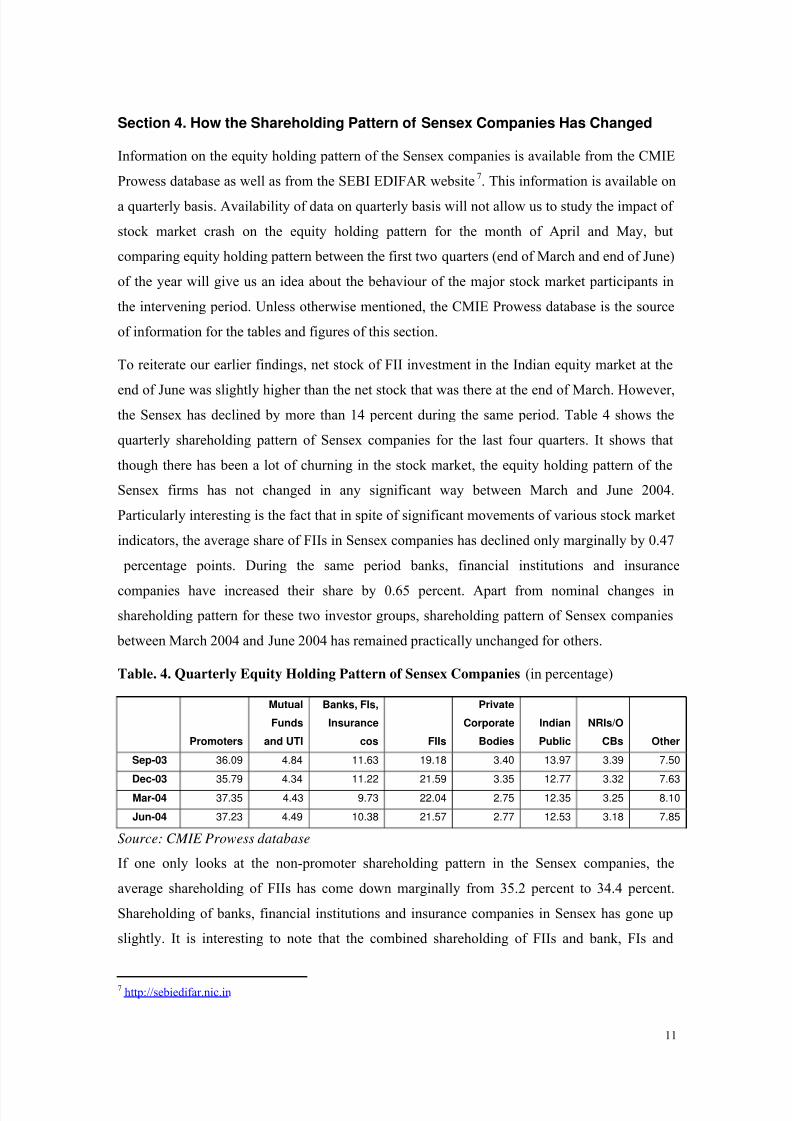
Section 4. How the Shareholding Pattern of Sensex Companies Has Changed
Information on the equity holding pattern of the Sensex companies is available from the CMIE
Prowess database as well as from the SEBI EDIFAR website7. This information is available on
a quarterly basis. Availability of data on quarterly basis will not allow us to study the impact of
stock market crash on the equity holding pattern for the month of April and May, but
comparing equity holding pattern between the first two quarters (end of March and end of June)
of the year will give us an idea about the behaviour of the major stock market participants in
the intervening period. Unless otherwise mentioned, the CMIE Prowess database is the source
of information for the tables and figures of this section.
To reiterate our earlier findings, net stock of FII investment in the Indian equity market at the
end of June was slightly higher than the net stock that was there at the end of March. However,
the Sensex has declined by more than 14 percent during the same period. Table 4 shows the
quarterly shareholding pattern of Sensex companies for the last four quarters. It shows that
though there has been a lot of churning in the stock market, the equity holding pattern of the
Sensex firms has not changed in any significant way between March and June 2004.
Particularly interesting is the fact that in spite of significant movements of various stock market
indicators, the average share of FIIs in Sensex companies has declined only marginally by 0.47
percentage points. During the same period banks, financial institutions and insurance
companies have increased their share by 0.65 percent. Apart from nominal changes in
shareholding pattern for these two investor groups, shareholding pattern of Sensex companies
between March 2004 and June 2004 has remained practically unchanged for others.
Table. 4. Quarterly Equity Holding Pattern of Sensex Companies (in percentage)
Promoters
Mutual
Funds
and UTI
Banks, FIs,
Insurance
cos FIIs
Private
Corporate
Bodies
Indian
Public
NRIs/O
CBs Other
Sep-03 36.09 4.84 11.63 19.18 3.40 13.97 3.39 7.50
Dec-03 35.79 4.34 11.22 21.59 3.35 12.77 3.32 7.63
Mar-04 37.35 4.43 9.73 22.04 2.75 12.35 3.25 8.10
Jun-04 37.23 4.49 10.38 21.57 2.77 12.53 3.18 7.85
Source: CMIE Prowess database
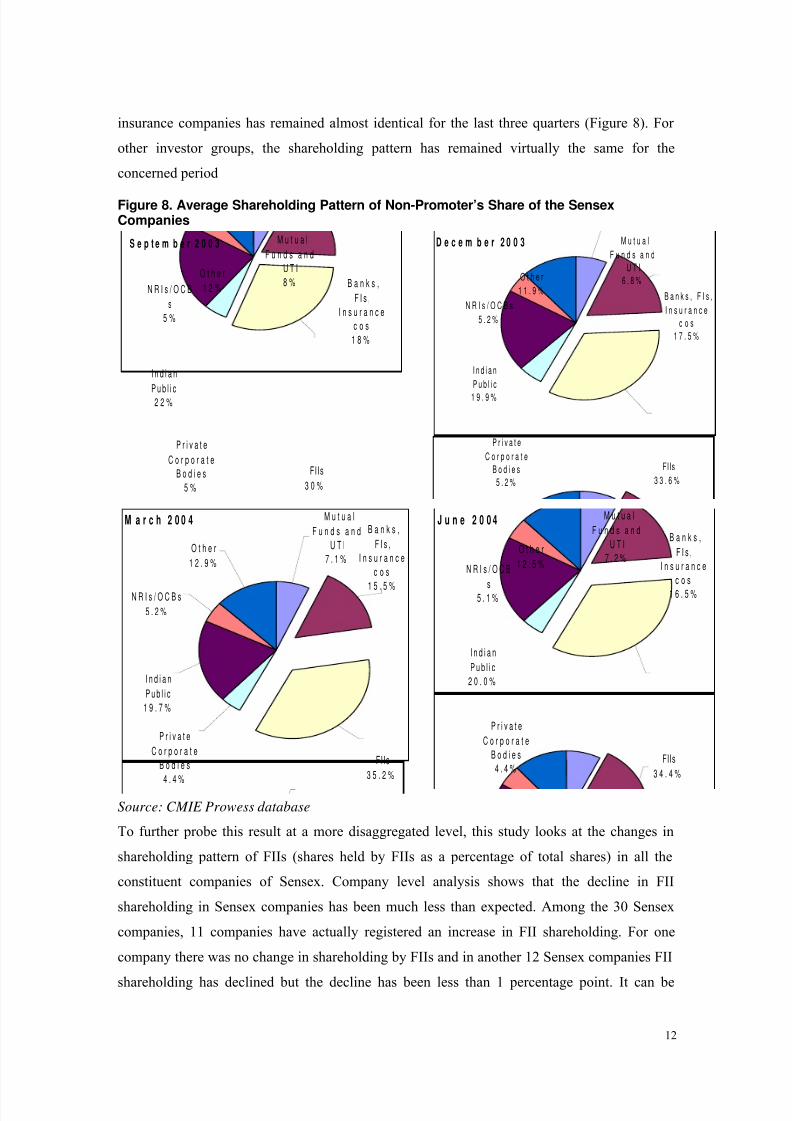
If one only looks at the non-promoter shareholding pattern in the Sensex companies, the
average shareholding of FIIs has come down marginally from 35.2 percent to 34.4 percent.
Shareholding of banks, financial institutions and insurance companies in Sensex has gone up
slightly. It is interesting to note that the combined shareholding of FIIs and bank, FIs and
7 http://sebiedifar.nic.in
11
8/4/2019 Volatility Stock Markets
http://slidepdf.com/reader/full/volatility-stock-markets 12/18
insurance companies has remained almost identical for the last three quarters (Figure 8). For
other investor groups, the shareholding pattern has remained virtually the same for the
concerned period
Figure 8. Average Shareholding Pattern of Non-Promoter’s Share of the SensexCompanies
S e p t e m b e r 2 0 0 3 M u t u a l
F u n d s a n d
U T I
8 %
P r i v a t e
C o r p o r a t e
B o d i e s
5 %
I n d i a n
P u b l i c2 2 %
N R I s / O C B
s
5 %
O t h e r
1 2 %
FIIs
3 0 %
B a n k s ,
F I s ,
I n s u r a n c e
c o s
1 8 %
D e c e m b e r 2 0 0 3
P r i v a t e
C o r p o r a t e
B o d i e s
5 . 2 %
I n d i a n
P u b l i c
1 9 . 9 %
N R I s / O C B s
5 . 2 %
O t h e r
1 1 . 9 %
FIIs
3 3 . 6 %
B a n k s , F I s ,
I n s u r a n c e
c o s
1 7 . 5 %
M u t u a l
F u n d s a n d
U T I
6 . 8 %
M a r c h 2 0 0 4
P r i v a t e
C o r p o r a t e
B o d i e s
4 . 4 %
I n d i a n
P u b l i c
1 9 . 7 %
N R I s / O C B s
5 . 2 %
O t h e r
1 2 . 9 %
M u t u a l
F u n d s a n d
U T I
7 . 1 %
B a n k s ,
F I s ,
I n s u r a n c e
c o s
1 5 . 5 %
FIIs
3 5 . 2 %
J u n e 2 0 0 4 M u t u a l
F u n d s a n d
U T I
7 . 2 %
B a n k s ,
F I s ,
I n s u r a n c e
c o s
1 6 . 5 %
P r i v a t e
C o r p o r a t e
B o d i e s
4 . 4 %
I n d i a n
P u b l i c
2 0 . 0 %
N R I s / O C B
s5 . 1 %
O t h e r
1 2 . 5 %
FIIs
3 4 . 4 %
Source: CMIE Prowess database
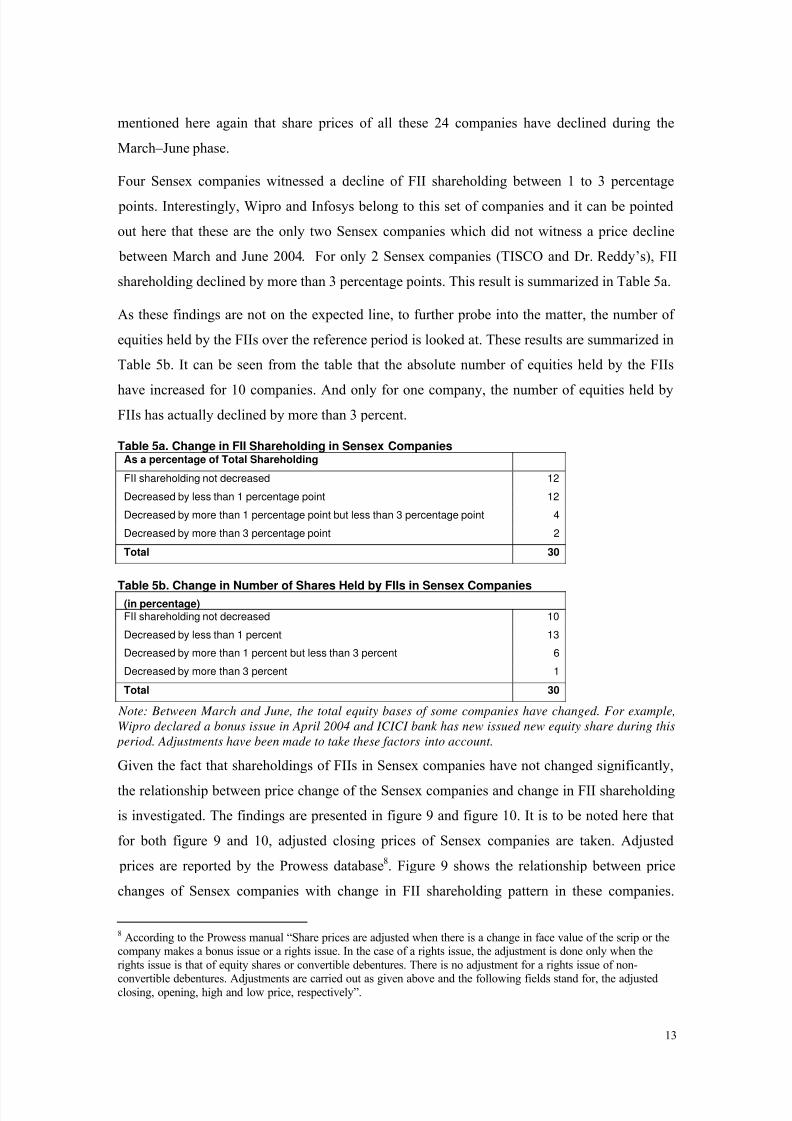
To further probe this result at a more disaggregated level, this study looks at the changes in
shareholding pattern of FIIs (shares held by FIIs as a percentage of total shares) in all the
constituent companies of Sensex. Company level analysis shows that the decline in FII
shareholding in Sensex companies has been much less than expected. Among the 30 Sensex
companies, 11 companies have actually registered an increase in FII shareholding. For one
company there was no change in shareholding by FIIs and in another 12 Sensex companies FII
shareholding has declined but the decline has been less than 1 percentage point. It can be
12
8/4/2019 Volatility Stock Markets
http://slidepdf.com/reader/full/volatility-stock-markets 13/18
mentioned here again that share prices of all these 24 companies have declined during the
March–June phase.
Four Sensex companies witnessed a decline of FII shareholding between 1 to 3 percentage
points. Interestingly, Wipro and Infosys belong to this set of companies and it can be pointed
out here that these are the only two Sensex companies which did not witness a price decline
between March and June 2004. For only 2 Sensex companies (TISCO and Dr. Reddy’s), FII
shareholding declined by more than 3 percentage points. This result is summarized in Table 5a.
As these findings are not on the expected line, to further probe into the matter, the number of
equities held by the FIIs over the reference period is looked at. These results are summarized in
Table 5b. It can be seen from the table that the absolute number of equities held by the FIIs
have increased for 10 companies. And only for one company, the number of equities held by
FIIs has actually declined by more than 3 percent.
Table 5a. Change in FII Shareholding in Sensex Companies As a percentage of Total Shareholding
FII shareholding not decreased 12
Decreased by less than 1 percentage point 12
Decreased by more than 1 percentage point but less than 3 percentage point 4
Decreased by more than 3 percentage point 2
Total 30
Table 5b. Change in Number of Shares Held by FIIs in Sensex Companies(in percentage)FII shareholding not decreased 10
Decreased by less than 1 percent 13
Decreased by more than 1 percent but less than 3 percent 6
Decreased by more than 3 percent 1
Total 30
Note: Between March and June, the total equity bases of some companies have changed. For example,
Wipro declared a bonus issue in April 2004 and ICICI bank has new issued new equity share during this
period. Adjustments have been made to take these factors into account.
Given the fact that shareholdings of FIIs in Sensex companies have not changed significantly,
the relationship between price change of the Sensex companies and change in FII shareholding
is investigated. The findings are presented in figure 9 and figure 10. It is to be noted here that
for both figure 9 and 10, adjusted closing prices of Sensex companies are taken. Adjusted
prices are reported by the Prowess database8. Figure 9 shows the relationship between price
changes of Sensex companies with change in FII shareholding pattern in these companies.
8 According to the Prowess manual “Share prices are adjusted when there is a change in face value of the scrip or thecompany makes a bonus issue or a rights issue. In the case of a rights issue, the adjustment is done only when the
rights issue is that of equity shares or convertible debentures. There is no adjustment for a rights issue of non-
convertible debentures. Adjustments are carried out as given above and the following fields stand for, the adjustedclosing, opening, high and low price, respectively”.
13
8/4/2019 Volatility Stock Markets
http://slidepdf.com/reader/full/volatility-stock-markets 14/18
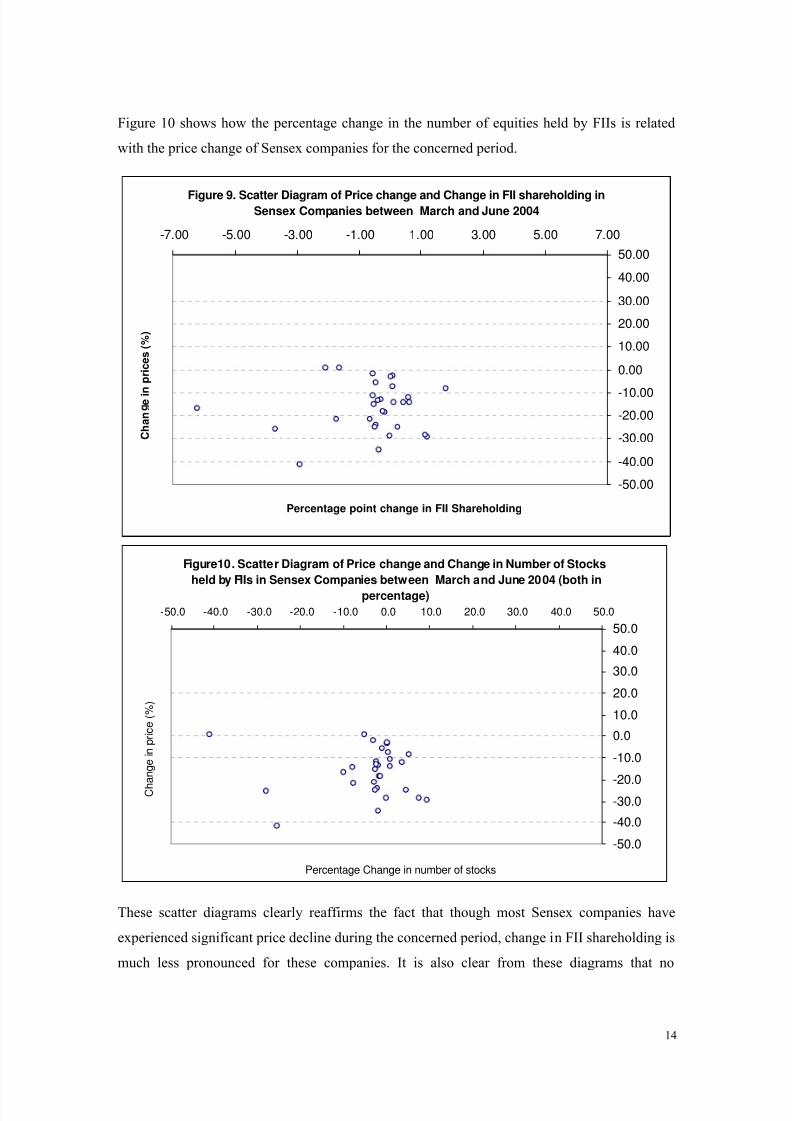
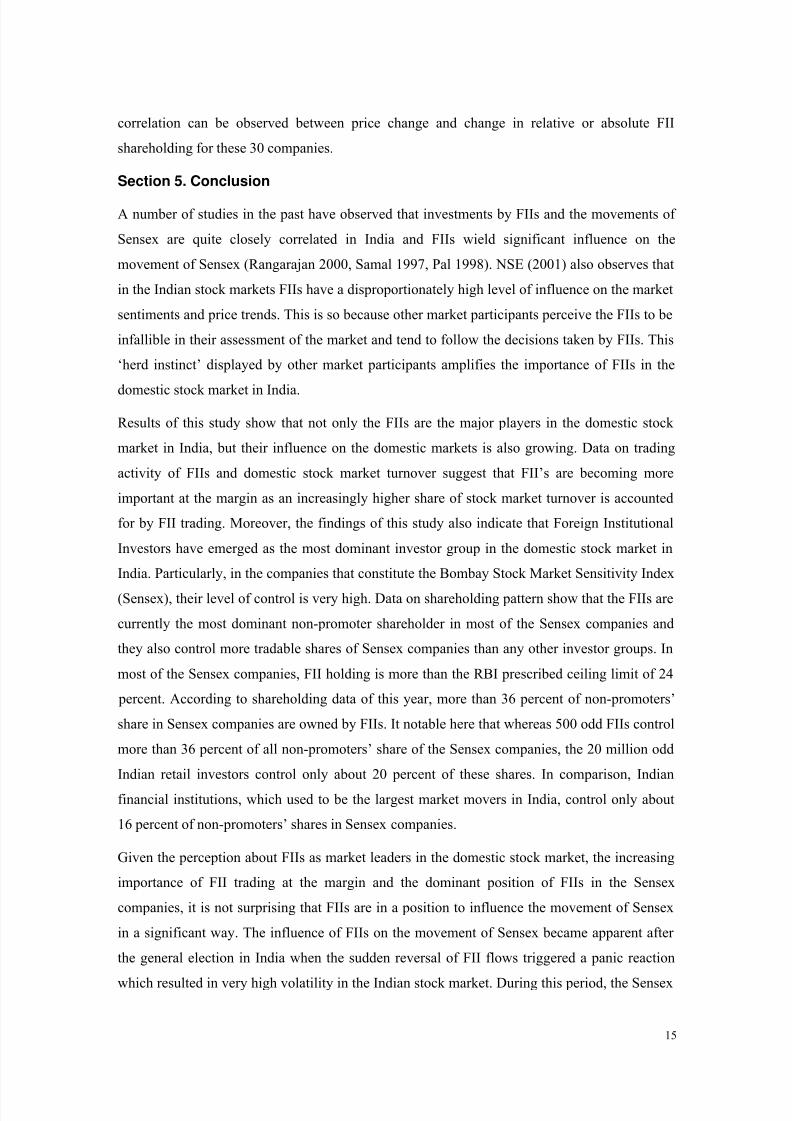
Figure 10 shows how the percentage change in the number of equities held by FIIs is related
with the price change of Sensex companies for the concerned period.
Figure 9. Scatter Diagram of Price change and Change in FII shareholding inSensex Companies between March and June 2004
-50.00
-40.00
-30.00
-20.00
-10.00
0.00
10.00
20.00
30.00
40.00
50.00
-7.00 -5.00 -3.00 -1.00 1.00 3.00 5.00 7.00
Percentage point change in FII Shareholding
C h a n
e i n
p r i c e s ( % )
Figure10. Scatter Diagram of Price change and Change in Number of Stocks
held by FIIs in Sensex Companies between March and June 2004 (both in
percentage)
-50.0
-40.0
-30.0-20.0
-10.0
0.0
10.0
20.0
30.0
40.0
50.0
-50.0 -40.0 -30.0 -20.0 -10.0 0.0 10.0 20.0 30.0 40.0 50.0
Percentage Change in number of stocks
C h
a n g e i n p r i c e ( % )
These scatter diagrams clearly reaffirms the fact that though most Sensex companies have
experienced significant price decline during the concerned period, change in FII shareholding is
much less pronounced for these companies. It is also clear from these diagrams that no
14
8/4/2019 Volatility Stock Markets
http://slidepdf.com/reader/full/volatility-stock-markets 15/18
correlation can be observed between price change and change in relative or absolute FII
shareholding for these 30 companies.
Section 5. Conclusion
A number of studies in the past have observed that investments by FIIs and the movements of
Sensex are quite closely correlated in India and FIIs wield significant influence on the
movement of Sensex (Rangarajan 2000, Samal 1997, Pal 1998). NSE (2001) also observes that
in the Indian stock markets FIIs have a disproportionately high level of influence on the market
sentiments and price trends. This is so because other market participants perceive the FIIs to be
infallible in their assessment of the market and tend to follow the decisions taken by FIIs. This
‘herd instinct’ displayed by other market participants amplifies the importance of FIIs in the
domestic stock market in India.
Results of this study show that not only the FIIs are the major players in the domestic stock
market in India, but their influence on the domestic markets is also growing. Data on trading
activity of FIIs and domestic stock market turnover suggest that FII’s are becoming more
important at the margin as an increasingly higher share of stock market turnover is accounted
for by FII trading. Moreover, the findings of this study also indicate that Foreign Institutional
Investors have emerged as the most dominant investor group in the domestic stock market in
India. Particularly, in the companies that constitute the Bombay Stock Market Sensitivity Index
(Sensex), their level of control is very high. Data on shareholding pattern show that the FIIs are
currently the most dominant non-promoter shareholder in most of the Sensex companies and
they also control more tradable shares of Sensex companies than any other investor groups. In
most of the Sensex companies, FII holding is more than the RBI prescribed ceiling limit of 24
percent. According to shareholding data of this year, more than 36 percent of non-promoters’
share in Sensex companies are owned by FIIs. It notable here that whereas 500 odd FIIs control
more than 36 percent of all non-promoters’ share of the Sensex companies, the 20 million odd
Indian retail investors control only about 20 percent of these shares. In comparison, Indian
financial institutions, which used to be the largest market movers in India, control only about
16 percent of non-promoters’ shares in Sensex companies.
Given the perception about FIIs as market leaders in the domestic stock market, the increasing
importance of FII trading at the margin and the dominant position of FIIs in the Sensex
companies, it is not surprising that FIIs are in a position to influence the movement of Sensex
in a significant way. The influence of FIIs on the movement of Sensex became apparent after
the general election in India when the sudden reversal of FII flows triggered a panic reaction
which resulted in very high volatility in the Indian stock market. During this period, the Sensex
15
8/4/2019 Volatility Stock Markets
http://slidepdf.com/reader/full/volatility-stock-markets 16/18
experienced its worst single-day decline in its history and in the three month period between
April to June 2004, it declined by about 17 percent. And it all started because of the selling
pressure exerted by the FIIs after the post election phase when they became less confident
about ‘the continuation of reform process in India’. However, when we look at the shareholding
pattern of FIIs in the Sensex companies, we see that the shareholding pattern of FIIs have
remained relatively unchanged between March and June 2004.
To explain the anomaly, one can argue that after the elections FIIs were concerned about the
continuation of reform process in India and started withdrawing their investments. This led to
the stock market crash and prices of shares tumbled. However, once the assurance about the
continuation of reform process was given, FIIs started buying back the shares they sold earlier.
Taking advantage of the stock market crash, they managed to regain their portfolio at a much
cheaper price. If this chain of events is true then it shows that the FIIs have come out as the
clear winner in the post-election turmoil of the stock market. Not only have they gained
financially out of the situation, but they have also managed to influence policy making in this
country. The pressure exerted by FIIs also allowed them to get some fiscal sops in the recent
budget. It needs to be reiterated here that there has been no change in the macroeconomic
fundamentals faced by the country before and after the volatile period in the stock market.
It needs to be remembered that in India, almost all previous experiences with high phases of
stock market volatility have been associated with some form of irregularities and corruption.
Given the frequent occurrences of scams and irregularities in the Indian stock market, the
likelihood of market manipulation cannot be totally ruled out. The manner in which record FII
investments build up the stock market during the first quarter of the year and the way the stock
market was brought down, strengthens this apprehension. It also needs to be considered here
that FIIs have emerged as the major market drivers of Sensex companies and, in the past, there
have been instances where the nexus between FIIs and big brokers of the BSE was found to be
involved in price manipulations in the BSE.
The whole process also highlights another disturbing feature. During the post election period,
the sudden volatility in the stock market and the subsequent decline of Sensex was almost
treated as a national emergency in India by the financial media and to a certain extent, by the
incoming UPA government. It is very difficult to understand why the government feels so
concerned about speculative investors and the movements in Sensex. Most studies have shown
that Sensex is neither a good barometer of economic fundamentals it is nor an indicator of
16
8/4/2019 Volatility Stock Markets
http://slidepdf.com/reader/full/volatility-stock-markets 17/18
future growth prospects of the economy9. Moreover, this study also shows that even sharp
changes in Sensex do not necessarily indicate a significant alteration of actual shareholding
pattern of different investor groups even in the Sensex companies. As far as the real economy is
concerned, the stock market has a very limited role to play. In India, for the year 2002-03, new
capital issues by non-government public limited companies raised a combined capital of Rs
1,878 crores from ordinary shares, preference share and debentures. This amount is only 0.33
percent of gross domestic capital formation of the economy and about 1.6 percent of gross
domestic capital formation by private corporate sector for that year. This is not surprising
because even in developed stock markets like USA, the stock market has not been a significant
source of finance for new investments. Also, stock markets mobilize a very small fraction of
household financial saving in India. As the recent RBI Handbook of Statistics shows,
investment in shares and debentures10 and units of UTI account for only 1.37 percent of total
household financial savings for the year 2003-04. In comparison, bank deposits account for
about 42.8 percent of household financial savings for the same year. Under these
circumstances, it is not clear why so much importance is given to the stock market and portfolio
investors by policymakers in India. It is high time to realize that in spite of the impression
given by the financial media, movements of stock markets and Sensex do not necessarily imply
any fundamental changes in the economy and these movements affect a very small minority of
the country’s population. It will be unfortunate if movements of speculative capital and the
resultant stock market gyrations are allowed to influence macro-economic policymaking in
India.
References:
Centre for Monitoring Indian Economy (CMIE): PROWESS Database.
Chandrasekhar, C. P. (2004): “The Markets vs. The People: A tale of two mandates” -http://www.macroscan.org/the/finance/may04/fin170504Markets_vs.htm
Ghosh, Jayati (2004): “The Stock Market and the Real Economy”-www.macroscan.org/the/finance/may04/fin170504Stock_Market.htm
NSE (2001): Indian Securities Market: A Review, Volume IV, 2001, National Stock Exchange, Mumbai.
Pal, Parthapratim (1998): “Foreign Portfolio Investment in Indian Equity Markets: Has the Economy
Benefited?” Economic and Political Weekly, Vol. 33, No. 11, March 14.
Pethe, Abhay and Ajit Karnik (2000): “Do Indian Stock Markets Matter? Stock Market Indices andMacro-economic Variables” Economic and Political Weekly, January 29.
9 See Pethe and Karnik (2000), Ghosh (2004)10
Includes investment in shares and debentures of credit/non-credit societies, public sector bonds and investment inmutual funds (other than UTI)
17

8/4/2019 Volatility Stock Markets
http://slidepdf.com/reader/full/volatility-stock-markets 18/18
Raju, M.T and Ghosh, Anirban (2004): “Stock Market Volatility – An International Comparison”-Working
paper series no. 8, Securities and Exchange Board of India, April 2004.
RBI: Handbook of Statistics on Indian Economy, Reserve Bank of India, Mumbai, various issues.
Samal, Kishor C., (1997): “Emerging Equity Market in India: Role of Foreign Institutional Investors”Economic and Political Weekly, Vol. 32, No. 42, October 18.
SEBI: Annual Report , Various Issues, Securities and Exchange Board of India, Mumbai.
Singh, Ajit and Weisse, Bruce A. (1998): “Emerging Stock Markets, Portfolio Capital Flows and Long-Term Economic Growth: Micro and Macroeconomic Perspectives”, Cambridge Discussion Papers inAccounting and Finance, AF30, University of Cambridge, March 1998.
18