Embed Size (px)
Citation preview

Siemens Industry, Inc. Siemens Power Technologies International 400 State Street • P.O. Box 1058 Schenectady, New York 12301-1058 USA Tel: +1 (518) 395-5000 • Fax: +1 (518) 346-2777 www.siemens.com/power-technologies
R108-11
Steady State System Impact Study Report for Q371 Wind Project Interconnecting to Line L-163 near Jackman Substation in New Hampshire
Prepared for
ISO-NE, Inc. Submitted by: Baldwin P. Lam, Senior Manager Octavio J. Gutierrez, Senior Staff Consultant David Lovelady, Senior Consultant Bo Gong, Senior Consultant Mounika Kurra, Consultant October 9, 2012, Revision 6 Siemens PTI Project Number: P/21-113619

Revision History
Date Rev. Description
October 9, 2012 0 Initial draft
April 6, 2012 1 Incorporated comments received from ISO-NE and Northeast Utilities
May 7, 2012 2 Incorporated L-163 South 115 kV line upgrade information
May 10, 2012 3 Incorporated comments from ISO-NE dated 5/9/2012
May 18, 2012 4 Incorporated comments from ISO-NE dated 5/15/2012
August 24, 2012 5 Incorporated comments from ISO-NE dated 8/13/2012
October 9, 2012 6 Addressed comments from NU, as per ISO-NE email dated 10/9/12

i
Siemens Energy, Inc. – Siemens Power Technologies International 59BR108-11 – Draft Steady State System Impact Study Report for Q371 Wind Project Interconnecting to Line L-163 near Jackman Substation New
Hampshire
Contents
Legal Notice .................................................................................................................. v
Section 1 – Introduction ......................................................................................... 1-1
Section 2 – Project Description ............................................................................. 2-1 2.1 Project Description and Interconnection Plan........................................................2-1 2.2 Project Data ...........................................................................................................2-3 2.3 Present Voltage Schedule at the POI ....................................................................2-7 2.4 WTG Operating Control Mode and Voltage Schedule ..........................................2-7
Section 3 – Study Methodology ............................................................................ 3-1 3.1 Introduction ............................................................................................................3-1 3.2 Criteria ...................................................................................................................3-1
3.2.1 Voltage Criteria ........................................................................................3-2 3.2.2 Thermal Criteria .......................................................................................3-2
3.3 Thermal and Voltage Analysis ...............................................................................3-2 3.3.1 Thermal Analysis .....................................................................................3-3 3.3.2 Voltage Analysis ......................................................................................3-3 3.3.3 Contingencies ..........................................................................................3-3 3.3.4 Monitored Elements .................................................................................3-3 3.3.5 Power Flow Solution Options ..................................................................3-4
Section 4 – Base Cases and Generation Dispatch ............................................. 4-1 4.1 Development of Base Cases .................................................................................4-1
4.1.1 Peak and Shoulder Load Cases..............................................................4-2 4.1.2 Minimum Load Cases ..............................................................................4-3
4.2 Project Dispatch .....................................................................................................4-4 4.3 Generation Dispatch ..............................................................................................4-4
Section 5 – N-1 Thermal and Voltage Study ........................................................ 5-1 5.1 Results for Normal Conditions (N-0) ......................................................................5-1 5.2 N-1 Thermal Results ..............................................................................................5-1

Contents
Siemens Energy, Inc. – Siemens Power Technologies International 59BR108-11 – Draft Steady State System Impact Study Report for Q371 Wind Project Interconnecting to Line L-163 near Jackman Substation New
H hi
ii
5.2.1 Peak Load pre-NEEWS Conditions ........................................................5-2 5.2.2 Shoulder Load pre-NEEWS Conditions ..................................................5-3 5.2.3 Peak Load post-NEEWS Conditions .......................................................5-7 5.2.4 Shoulder Load post-NEEWS Conditions .................................................5-8
5.3 N-1 Voltage Results ............................................................................................ 5-12
Section 6 – Greggs Series Reactor Sensitivity ................................................... 6-1 6.1 Results for Normal Conditions (N-0) ......................................................................6-1 6.2 N-1 Thermal Results ..............................................................................................6-1
6.2.1 Shoulder Load pre-NEEWS with East to West Flow Conditions ............6-1 6.2.2 Shoulder Load post-NEEWS with East to West Flow Conditions ...........6-2
6.3 N-1 Voltage Results ...............................................................................................6-4
Section 7 – Voltage Sensitivity Analysis .............................................................. 7-1
Section 8 – Line-Out Analysis (N-1-1) ................................................................... 8-1 8.1 N-1-1 Thermal Results ..........................................................................................8-1
8.1.1 381 (Northfield-Vernon) Line-Out ............................................................8-1 8.1.2 301/302 (Ludlow-Carpenter Hill-Millbury) Line-Out Case .......................8-3 8.1.3 I135N (Fitzwilliam-Monadnock-Bellows Falls) Line-Out Case ................8-5
8.2 N-1-1 Voltage Results............................................................................................8-5
Section 9 – Transfer Limit Analysis ...................................................................... 9-1
Section 10 – Short Circuit Analysis .................................................................... 10-1
Section 11 – Conclusion ....................................................................................... 11-1 11.1 N-0 Results ......................................................................................................... 11-1 11.2 N-1 Thermal Results ........................................................................................... 11-1 11.3 Greggs Series Reactor Sensitivity ...................................................................... 11-2 11.4 N-1 Voltage Results ............................................................................................ 11-2 11.5 Voltage Sensitivity Analysis ................................................................................ 11-2 11.6 N-1-1 Thermal Results ....................................................................................... 11-2 11.7 N-1-1 Voltage Results......................................................................................... 11-3 11.8 Transfer Limit Analysis ....................................................................................... 11-3 11.9 Short Circuit ........................................................................................................ 11-3
Contents
iii
Siemens Energy, Inc. – Siemens Power Technologies International 59BR108-11 – Draft Steady State System Impact Study Report for Q371 Wind Project Interconnecting to Line L-163 near Jackman Substation New
Hampshire
11.10 Final Conclusions ............................................................................................... 11-3 11.11 Interconnection Cost Estimate ............................................................................ 11-4
Appendix A – Power Flow Summaries ................................................................. A-1
Appendix B – Power Flow One-Line Diagrams ................................................... B-1
Appendix C – Contingency List ............................................................................. C-1
Appendix D – Results ............................................................................................. D-1 D.1 N-1 Thermal Results ............................................................................................. D-1 D.2 N-1 Voltage Results .............................................................................................. D-2 D.3 N-1 Thermal - Greggs Series Reactor Results..................................................... D-3 D.4 N-1 Voltage - Greggs Series Reactor Results ...................................................... D-4 D.5 N-1 Voltage – Sensitivity Results.......................................................................... D-5 D.6 N-1-1 Thermal & Voltage Results ......................................................................... D-6
Appendix E – Project IDEV ..................................................................................... E-1

v
Siemens Energy, Inc. – Siemens Power Technologies International 59BR108-11 – Draft Steady State System Impact Study Report for Q371 Wind Project Interconnecting to Line L-163 near Jackman Substation New
Hampshire
Legal Notice This document was prepared by Siemens Energy, Inc., Siemens Power Technologies International (Consultant), on behalf of ISO-NE with the intention of meeting the requirements of the ISO New England Transmission, Market and Services Tariff. None of Consultants, ISO-NE, nor their parent corporations or affiliates, nor any person acting in their behalf (a) makes any warranty, expressed or implied, with respect to the use of any information or methods disclosed in this document or (b) assumes any liability with respect to the use of any information or methods disclosed in this document, in either case except as set out in the aforementioned Tariff. None of Consultants or ISO-NE assumes any responsibility for any damages incurred by any entities other than those named in this Study.

Legal Notice
Siemens Energy, Inc. – Siemens Power Technologies International 59BR108-11 – Draft Steady State System Impact Study Report for Q371 Wind Project Interconnecting to Line L-163 near Jackman Substation New
H hi
vi
This page intentionally left blank.

1-1
Siemens Energy, Inc. – Siemens Power Technologies International 59BR108-11 – Draft Steady State System Impact Study Report for Q371 Wind Project Interconnecting to Line L-163 near Jackman Substation New
Hampshire
Executive Summary Siemens Energy, Inc., Siemens Power Technologies International (Siemens PTI) has conducted a Steady State System Impact Study (“Study”) of Project Q371 (“the Project”) under the ISO New England (ISO-NE) Network Capability Interconnections Standard as specified in Schedule 22 of the ISO New England Tariff, PP5-6, Scope of Study for System Impact Studies under the Generation Interconnection Procedures and PP3 and the Reliability Standards for the New England Area Bulk Power Supply System, dated March 2010, on behalf of ISO-NE.
Project Description
The Project consists of eleven (11) Acciona 3.0 MW (AW3000) wind turbine generators (WTG’s) and the associated collector system. The maximum aggregated gross output of the WTG’s will be 33 MW. The Project net output at the point of interconnection (POI) is, approximately, 32 MW, once the losses in the collector system have been subtracted. The Project service load is negligible.
The proposed commercial operation date for this Project is December of 2013.
The Project will interconnect to the Public Service of New Hampshire (PSNH) system in the Town of Antrim in New Hampshire at a new 115 kV Switching Station with a
configuration, tapping the L 163 line about 6.5 miles southwards of the Jackman 115 kV Substation.
Scenarios Studied
Steady state N-1 contingency analysis was performed on peak, shoulder and minimum load conditions with all lines in service. The peak and shoulder load conditions were studied with high West to East and East to West New England interface flows, each case was also studied both with and without NEEWS (New England East West Solution) & Pittsfield/Greenfield projects modeled, to be known hereafter as “pre-NEEWS” and “post-NEEWS”, respectively.
A steady state N-1 sensitivity study with the 115 kV Greggs series reactor in service was studied. A voltage sensitivity study was also performed.
Three line-out scenarios (N-1-1) for pre and post-NEEWS conditions were studied as follows:
The loss of the 345 kV Vernon to Northfield 381 line for shoulder load conditions with East to West flows.
The loss of the 345 kV Ludlow-Carpenter Hill-Millbury 301/302 line for shoulder load conditions with East to West flows.
The loss of the 115 kV Fitzwilliam to Monadnock to Bellows Falls three terminal I135N line for minimum load conditions.
The short circuit study was performed by PSNH, the Transmission Owner.
Executive Summary
Siemens Energy, Inc. – Siemens Power Technologies International 59BR108-11 – Draft Steady State System Impact Study Report for Q371 Wind Project Interconnecting to Line L-163 near Jackman Substation New
H hi
1-2
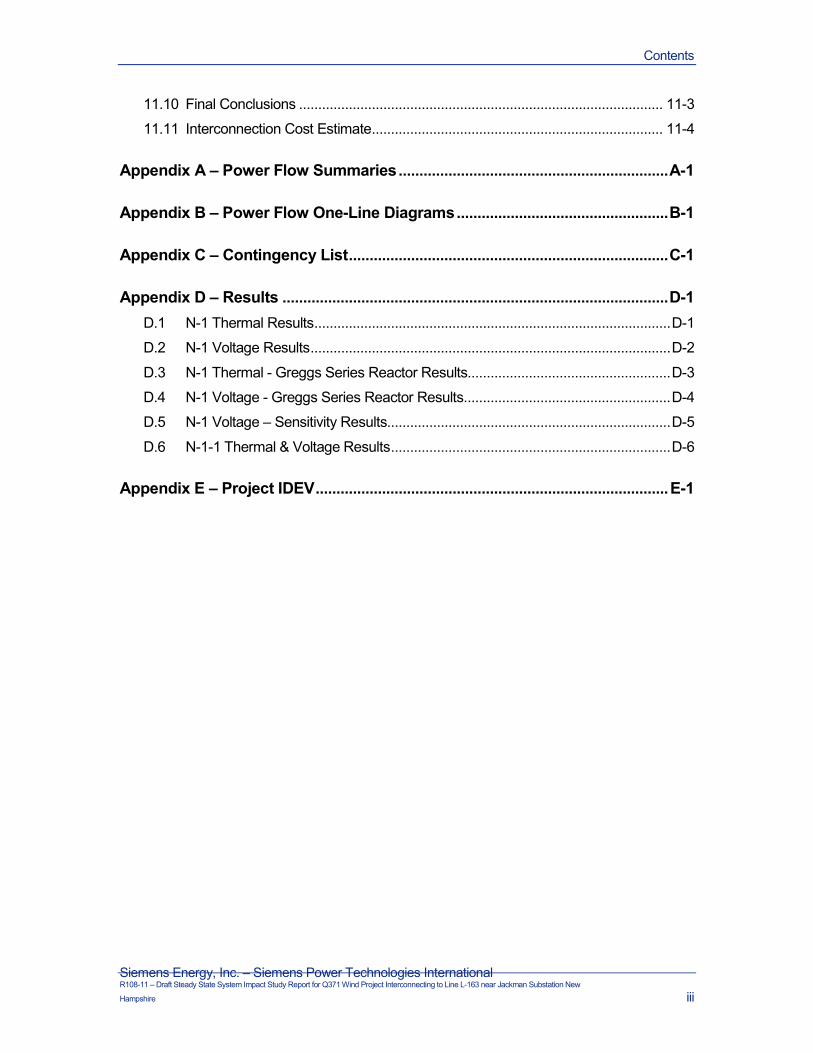
The Study results are summarized below:
N-0 Results
No thermal or voltage violations caused by the Project were found during pre-contingency conditions.
N-1 Thermal Results
N-1 thermal analysis was performed for peak and shoulder load conditions. The thermal results are summarized below:
Peak Load – Pre-NEEWS Conditions – East to West Flows
The Q345 POI to Ashland 115 kV section of the E-115 line overloads for the
s part of prior queued project “Q345”, this portion of the E-115 line will be upgraded to an LTE rating of Therefore the Q371 Project is not required to upgrade this line. The E115 line upgrade’s in-service date is December 2013, while the in-service date of the Q345 project is October 2012; the Q345 project’s output may be limited under certain scenarios until this line upgrade is complete.
Shoulder Load – Pre-NEEWS and Post-NEEWS Conditions – East to West Flows
Q371 POI to Keene 115 kV section of the L-163 line overloads for several contingencies with the highest loading caused by
the fact that an overload was found
indicated the need for a transfer limit analysis to be performed. The results of this analysis can be found in the “Transfer Limit Analysis” section.
Greggs Series Reactor Sensitivity
Switching the Greggs 115 kV series reactor in service was studied to ensure that the addition of the Project did not adversely impact the system in this state.
For this study the Greggs 115 kV by-pass switch is opened forcing the current to flow through the series reactor. Both pre-NEEWS and post-NEEWS shoulder load conditions with East to West flows were tested for N-1 contingencies and monitored for any thermal and voltage impacts.
The results show that the Project does not adversely impact system operation, that is, no thermal overloads and voltage violations were found.

Executive Summary
1-3
Siemens Energy, Inc. – Siemens Power Technologies International 59BR108-11 – Draft Steady State System Impact Study Report for Q371 Wind Project Interconnecting to Line L-163 near Jackman Substation New
Hampshire
N-1 Voltage Results
No adverse voltage impact caused by the Project on the New England bulk power system was found.
However, for all conditions studied, post-contingency high voltages up to were seen in simulation at the Project’s WTG 12.0 kV terminals and within the 34.5 kV collector system and for post-NEEWS conditions with East to West flows low voltages occur below
within the Project. This is due to the WTG’s reaching their reactive power limits of +/-1.2 Mvar trying to maintain the scheduled voltage at the POI, for contingencies that cause either low or high voltages on the 115 kV system.
In reality the reactive power output limits reduce for voltages above or below the 0.95 – 1.05 per unit range, thereby limiting such extreme voltages.
Voltage Sensitivity Analysis
This sensitivity test was performed to ensure that, with terminal voltages outside of their 0.95-1.05 per unit range, the turbines could still provide sufficient reactive power to avoid any voltage violations on the transmission system. Therefore, for this sensitivity analysis, reactive power limits of +/- 0.3 Mvar (considered conservative) were set for each WTG.
The results shown that with limited reactive power limits, no voltage violations on the New England bulk power system occur. However, the Project may not be able to hold its voltage schedule with the reactive power limits reduced.
N-1-1 Thermal Results
Shoulder Load East to West Flows
For the pre-NEEEWS conditions with the 381 (Northfield-Vernon) line-out, area generation reduction following the line-out situation will prevent any thermal overloads occurring following a possible second contingency. For the post-NEEWS conditions less area generation reduction is required.
For the pre-NEEEWS conditions with the 301/302 (Ludlow-Carpenter Hill-Millbury) line-out, area generation reduction following the line-out situation will prevent any thermal overloads occurring following a possible second contingency. For the post-NEEWS conditions less area generation is required.
Minimum Load
No thermal overloads were found for the I135N (Fitzwilliam-Monadnock-Bellows Falls) line-out case.
N-1-1 Voltage Results
For all N-1-1 line-out scenario’s studied the reduced reactive power output of +/- 0.3 Mvar (considered conservative) were set for each WTG.

Executive Summary
Siemens Energy, Inc. – Siemens Power Technologies International 59BR108-11 – Draft Steady State System Impact Study Report for Q371 Wind Project Interconnecting to Line L-163 near Jackman Substation New
H hi
1-4
No adverse voltage impact caused by the Project was found with or without NEEWS for any of the line-out scenarios studied.
Transfer Limit Analysis
The analysis was performed to determine whether the Project degrades transfer capability on the New England East-West interface. Both pre-NEEWS and post-NEEWS cases were tested, and transfer limits were evaluated both with the Greggs series reactor bypassed and inserted.
In the pre-NEEWS/ Pittsfield-Greenfield system, the Project does degrade transfer capability on the East-West interface by approximately This degradation does not appear in the post-NEEWS/Pittsfield-Greenfield system, where pre- and post-Project transfer limits are essentially equal.
Short Circuit
The addition of the 33MW wind powered facility will not cause any PSNH Transmission breakers to become overdutied or exceed 80% of their current rating.
Final Conclusions
For pre-NEEWS/Pittsfield-Greenfield conditions, due to the thermal overload on the portion of the L163 line between the Point of Interconnection and Keene and the impact to the East-West transfer limits, this portion of the L163 115 kV line will need to be upgraded to a minimum LTE rating of This upgrade is not required, however, because this impact is addressed by the Pittsfield-Greenfield project. In the event that the Project wishes to connect before the Pittsfield-Greenfield project is energized, without upgrading the L163S line, the Project may be subject to additional operational restrictions to address this overload on a day-to-day basis, as described in the ISO New England Transmission, Markets, and Services Tariff, section II, schedule 22, article 5.9.
The estimated in-service date for the Project is December 2013; if the Project does not elect to upgrade the Line L163 and elects to rely on the Pittsfield-Greenfield Project to mitigate the overload of Line L163 and impacts to thermal limits on transfers across the East-West Interface, then the project can interconnect in 2013 as planned. However, until the Pittsfield-Greenfield Project is constructed, the Project may be restricted in real-time operations to mitigate the potential overload of Line L163 and impacts to thermal transfer limits. If for reasons beyond NU’s control (e.g. siting and regulatory approval) the Pittsfield-Greenfield Project is cancelled, the Project will be held responsible to upgrade the section of Line L163 from the Project’s Point of Interconnection to the Keene substation.
The steady state and short circuit analyses performed show that the Project, along with the proposed thermal solutions, will not have a steady state adverse impact on the reliability or operating characteristics of the power system.

Executive Summary
1-5
Siemens Energy, Inc. – Siemens Power Technologies International 59BR108-11 – Draft Steady State System Impact Study Report for Q371 Wind Project Interconnecting to Line L-163 near Jackman Substation New
Hampshire
Interconnection Cost Estimate
NU's non-binding good faith estimate to interconnect Antrim Wind to the Public Service of New Hampshire (PSNH) system in the Town of Antrim, NH ranges between -50% $6.34 million to 200% $38 million. This estimate is based on constructing a configuration, looping into the L163 line about 6.5 miles southwards of the Jackman 115-kV Substation.
NU's non-binding good faith estimate to uprate the L163 line for the Q371 interconnect is in the order of magnitude -50% $6.6 million to +200% $40 million.
The section of line between the POI and Keene substation requires uprate, this is approximately 19 miles in length. The scope of work will allow the line to be operated at a summer LTE temperature of 140C, resulting in a new summer LTE rating of The uprate does not affect the impedance of the 115 kV conductors.

1-1
Siemens Energy, Inc. – Siemens Power Technologies International 59BR108-11 – Draft Steady State System Impact Study Report for Q371 Wind Project Interconnecting to Line L-163 near Jackman Substation New
Hampshire
Section
1 Introduction Siemens Energy, Inc., Siemens Power Technologies International (Siemens PTI) has conducted a Steady State System Impact Study (“Study”) of Project Q371 (“the Project”) under the ISO New England (ISO-NE) Network Capability Interconnections Standard as specified in Schedule 22 of the ISO New England Tariff, PP5-6, Scope of Study for System Impact Studies under the Generation Interconnection Procedures and PP3 and the Reliability Standards for the New England Area Bulk Power Supply System, dated March 2010, on behalf of ISO-NE.
This document presents the Steady State Study Report.
The Project consists of eleven (11) Acciona 3.0 MW (AW3000) wind turbine generators (WTG’s) and the associated collector system. The maximum aggregated gross output of the WTG’s will be 33 MW. The Project net output at the point of interconnection (POI) is, approximately, 32 MW, once the losses in the collector system have been subtracted. The Project service load is negligible.
The proposed commercial operation date for this Project is December of 2013.
The Project will interconnect to the Public Service of New Hampshire (PSNH) system in the Town of Antrim in New Hampshire at a new 115 kV Switching Station with a
configuration, tapping the L-163 line about 6.5 miles southwards of the Jackman 115 kV Substation.
Steady state N-1 contingency analysis was performed on peak, shoulder and minimum load conditions with all lines in service. The peak and shoulder load conditions were studied with high West to East and East to West New England interface flows, each case was also studied both with and without NEEWS (New England East West Solution) & Pittsfield/Greenfield projects modeled, to be known hereafter as “pre-NEEWS” and “post-NEEWS”, respectively.
A steady state N-1 sensitivity study with the 115 kV Greggs series reactor in service was studied. A voltage sensitivity study was also performed.
Three line-out scenarios (N-1-1) for pre and post-NEEWS conditions were studied as follows:
The loss of the 345 kV Vernon to Northfield 381 line for shoulder load conditions with East to West flows.
The loss of the 345 kV Ludlow-Carpenter Hill-Millbury 301/302 line for shoulder load conditions with East to West flows.

Introduction
Siemens Energy, Inc. – Siemens Power Technologies International 59BR108-11 – Draft Steady State System Impact Study Report for Q371 Wind Project Interconnecting to Line L-163 near Jackman Substation New
H hi
1-2
The loss of the 115 kV Fitzwilliam to Monadnock to Bellows Falls three terminal
I135N line for minimum load conditions.
The analysis of transfer limit impacts due to the Project interconnection was conducted by ISO-NE.
The short circuit study was performed by PSNH, the Transmission Owner.

2-1
Siemens Energy, Inc. – Siemens Power Technologies International 59BR108-11 – Draft Steady State System Impact Study Report for Q371 Wind Project Interconnecting to Line L-163 near Jackman Substation New
Hampshire
Section
2 Project Description
2.1 Project Description and Interconnection Plan The Project consists of 11 Acciona 3.0 MW wind turbine generators (WTG’s) with a maximum aggregated gross output of 33 MW. The Project net output at the point of interconnection (POI) is, approximately, 32 MW, once the losses in the collector system have been subtracted. The service load is negligible. Each WTG will be connected to the 34.5 kV underground collector system via its own 12.0/34.5 kV generator step-up transformer (GSU). A single 34.5 kV overhead line will carry the power from the underground wind turbine cables to the Project’s Collector Substation where a 24 MVA 34.5/115 kV transformer will step up the voltage and connect to the Point of Interconnection (POI) at a new 115 kV
Switching Station on the L-163 line between Keene and Jackman 115 kV Substations.
The Developer provided a detailed layout showing the individual wind turbine generators and feeders. As such, the entire wind farm was explicitly modeled for the steady-state study, including each WTG, GSU, underground feeder cable and the overhead line.
For illustration purposes only, Figure 2-1 shows a simplified one-line diagram of the power system in the vicinity of the Project.
The IDEV to incorporate the Project to the PSS®E version 30 database is included in Appendix E.

Project Description
Siemens Energy, Inc. – Siemens Power Technologies International 59BR108-11 – Draft Steady State System Impact Study Report for Q371 Wind Project Interconnecting to Line L-163 near Jackman Substation New
H hi
2-2
Figure 2-1. Project Interconnection and buses nearby the Project

Project Description
2-3
Siemens Energy, Inc. – Siemens Power Technologies International 59BR108-11 – Draft Steady State System Impact Study Report for Q371 Wind Project Interconnecting to Line L-163 near Jackman Substation New
Hampshire
Figure 2-2 below illustrates the approximate geographical location of the Project and the transmission lines in the area of interest.
Figure 2-2. Project Geographical Location in New Hampshire
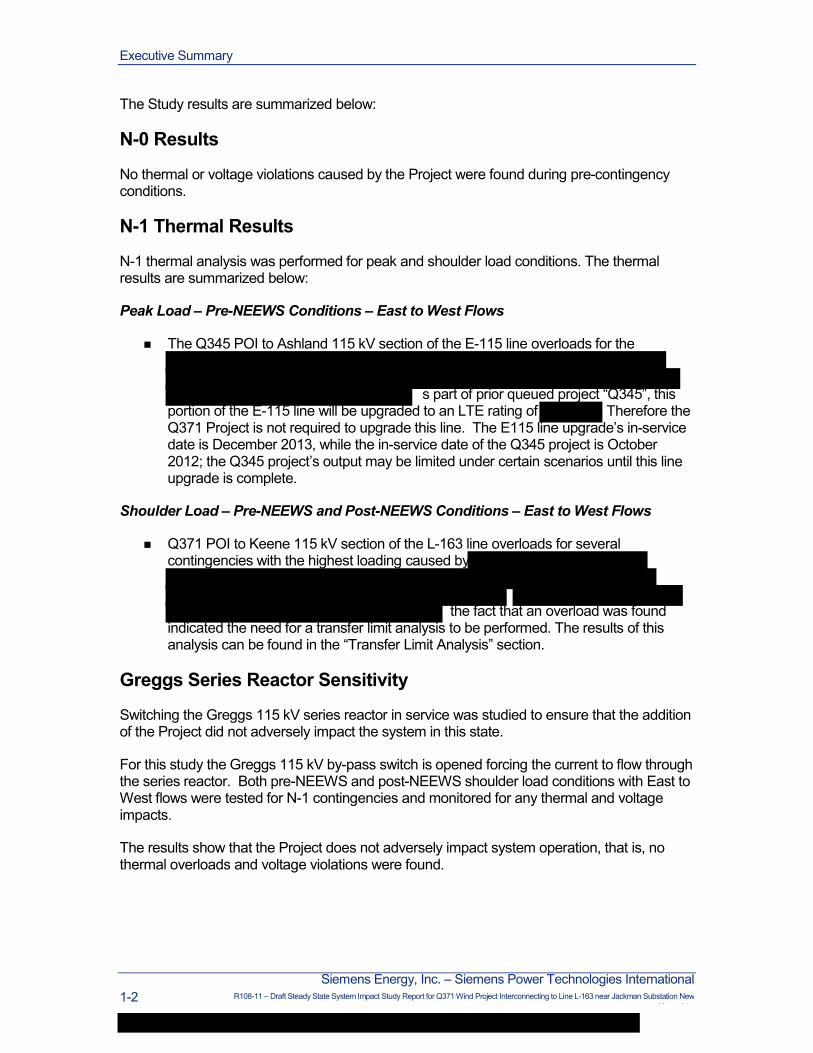
2.2 Project Data The Project data for each wind turbine generator and the corresponding GSU are shown in Table 2-1 and Table 2-2, respectively.
Project Q371
Project Description
Siemens Energy, Inc. – Siemens Power Technologies International 59BR108-11 – Draft Steady State System Impact Study Report for Q371 Wind Project Interconnecting to Line L-163 near Jackman Substation New
H hi
2-4
Table 2-1. Wind Turbine Generator (WTG) Data
Generator Type Doubly fed induction generator
Ratings of each Wind Turbine Generator 3.23 MVA, 12,000 V
Gross Output of each wind generator 3.0 MW
Exporting Reactive Power Limit at 3.0 MW output 1 1.2 Mvar (0.928 power factor)
Importing Reactive Power Limit at 3.0 MW output 1 -1.2 Mvar (0.928 power factor)
Station Service Load When the WTG’s are online, the service load is negligible.
1 – For each wind turbine, measured at the 12 kV terminals, for voltages between 0.95 – 1.05 Per unit.
Table 2-2. Wind Turbine GSU Transformer Data
Nameplate ratings (self cooled/maximum) 3.4/3.4 MVA
Voltage ratio, generator side/system side 12.0/34.5 kV
Winding connections, low voltage/high voltage Wye grounded/Delta
Available Tap positions (set to center tap for study) 5 steps, each +/- 2.5% of nominal
Impedance, Z1 (on self cooled MVA rating) 6.0%, X/R = 8.0
Impedance, Z0 (on self cooled MVA rating) 6.0%, X/R = 8.0
Figure 2-3 and Figure 2-4 below show the Acciona WTG reactive power output for varying conditions. Both figures were obtained from the Acciona “AW-3000 Electrical Characteristic - DG200032-F” document provided by the Developer.

Project Description
2-5
Siemens Energy, Inc. – Siemens Power Technologies International 59BR108-11 – Draft Steady State System Impact Study Report for Q371 Wind Project Interconnecting to Line L-163 near Jackman Substation New
Hampshire
Figure 2-3. WTG Rated Active (P) vs Reactive Power (Q) Curve
Figure 2-4 below shows the reactive power output limits of each turbine reduces significantly for terminal voltages outside of the 0.95 – 1.05 per unit range.

Project Description
Siemens Energy, Inc. – Siemens Power Technologies International 59BR108-11 – Draft Steady State System Impact Study Report for Q371 Wind Project Interconnecting to Line L-163 near Jackman Substation New
H hi
2-6
Figure 2-4. WTG Reactive Power (Q) vs Terminal Voltage (U) at Full Rated Active Power Output
The parameters of the main transformer are shown in Table 2-3 below.
Table 2-3. Main Transformer at Collector Station
Nameplate ratings (self cooled/maximum) 30/50 MVA
Voltages, High/Low voltage/Tertiary 115/34.5/13.2 kV
Winding connections, High/Low/Tertiary Wye grounded/Wye grounded/Delta
Available Tap positions (set to center tap for study) 5 steps, each +/- 2.5% of nominal
Impedance Z1 (% on self cooled MVA rating) 9.0 %, X/R = 26
Impedance Z0 (% on self cooled MVA rating) 9.0 %, X/R = 26
Table 2-4 below shows the parameters of the 34.5 kV overhead line that will connect the WTG strings to the 34.5 kV Project Collector Substation, based on values calculated by the project Developer.

Project Description
2-7
Siemens Energy, Inc. – Siemens Power Technologies International 59BR108-11 – Draft Steady State System Impact Study Report for Q371 Wind Project Interconnecting to Line L-163 near Jackman Substation New
Hampshire
Table 2-4. 34.5 kV Overhead Line Feeder Data
Length (feet)
Positive Sequence – Ohms Zero Sequence –Ohms
R Xl Xc (MOhms)
R Xl
4,500 0.1185 0.5185 0.16548 0.2765 1.356
2.3 Present Voltage Schedule at the POI Currently there is no specific voltage schedule at the POI as it is a new Switching Station on the L-163 line.
2.4 WTG Operating Control Mode and Voltage Schedule The reactive power exchanged with the power system can be controlled in real time by means of the power converter within the limits defined above. This control may be local for constant reactive power or power factor operation, or remote. The remote control allows the implementation at plant-wide level of different reactive controls, most commonly:
Field bus voltage control, to balance the field bus voltage and therefore the machine voltages. The voltage at the POI would be controlled according to a set point. This voltage is periodically sampled to determine whether the POI voltage is different from the set point, and if so, sends command signals to the turbines via SCADA to adjust their reactive power.
Remote voltage control. In this mode, the reactive power set point to be generated by the wind farm comes directly from remote controls of system operators.
Scheduled power factor. The power factor of the turbines is changed periodically during the day according a scheduled program usually established by the electric grid operator.
Field bus voltage control was selected by the Developer and as such was modeled for this Study.
Currently there is no specific voltage schedule at the POI as it is a new Switching Station on the L-163 line. However, to be consistent with local pre-Project voltages, the reactive power output of the WTG’s will adjust to maintain a scheduled voltage of
Table 2-5 below shows the voltage schedule maintained at the Project POI for all Study conditions.
Table 2-5 Project POI Scheduled Voltage
Voltage Schedule
Scheduled Voltage at the POI

Project Description
Siemens Energy, Inc. – Siemens Power Technologies International 59BR108-11 – Draft Steady State System Impact Study Report for Q371 Wind Project Interconnecting to Line L-163 near Jackman Substation New
H hi
2-8
As confirmed by the WTG manufacturers Acciona, the field bus voltage control method can react to system voltage excursions at the POI by adjusting the reactive power output of each WTG within 2 seconds and can be considered similar in operation to a synchronous machine (for the steady-state time period). As such the reactive power output of the WTG’s was initially modeled to move within the reactive limits of -1.2 to 1.2 Mvar during pre and post-contingency conditions to maintain the scheduled voltage at the POI.
For the Study, the total reactive power output required to maintain scheduled voltage at the POI is divided equally among each of the eleven WTG’s.

3-1
Siemens Energy, Inc. – Siemens Power Technologies International 59BR108-11 – Draft Steady State System Impact Study Report for Q371 Wind Project Interconnecting to Line L-163 near Jackman Substation New
Hampshire
Section
3 Study Methodology
3.1 Introduction The Study was performed under the ISO New England (ISO-NE) Open Access Transmission Tariff (“Tariff”) Schedule 22-Standard Large Generator Interconnection Procedures (“LGIP”), and in accordance with:
Northeast Power Coordinating Council (NPCC) Document A-2 “Basic Criteria for Design and Operation of Interconnected Power Systems”.
Interconnection Procedures contained in Schedule 22 of the Tariff.
ISO-NE Planning Procedure No. 3, “Reliability Standards for the New England Area Bulk Power System” (June 2009).
ISO-NE Planning Procedure No. 5-3, “Guidelines for Conducting and Evaluating Proposed Plan Application Analyses”.
ISO-NE Planning Procedure 5-6 (PP5-6), “Network Capability Interconnection Standard (“NCIS”)”.
ISO-NE Operating Documents.
Transmission Reliability Standards for Northeast Utilities (May 2008).
Pursuant to Schedule 22, the Study was performed as a Steady State System Impact Study. The Study includes the identification of:
Any thermal overload of any transmission facility or system voltage limit violations resulting from the Project.
Any circuit breaker or other facility short circuit capability limit that are exceeded as a result of the Project, as determined from a short circuit study conducted by Northeast Utilities.
3.2 Criteria The analysis was performed for steady state N-0 normal conditions and N-1 contingency conditions with all lines in service, for both pre-Project and post-Project cases, to identify thermal and voltage problems that may be attributed to the Project.

Study Methodology
Siemens Energy, Inc. – Siemens Power Technologies International 59BR108-11 – Draft Steady State System Impact Study Report for Q371 Wind Project Interconnecting to Line L-163 near Jackman Substation New
H hi
3-2
Line-out conditions (N-1-1) were also studied. Any thermal and voltage violations were addressed by performing system adjustments i.e. generation re-dispatches, PAR adjustments, capacitor re-dispatches etc. These adjustments are recorded in this Study report.
3.2.1 Voltage Criteria Table 3-1 shows the voltage criteria that were applied in the Study.
Table 3-1. Normal and Emergency Voltage Criteria
VOLTAGE LEVEL BUS VOLTAGE LIMITS -% of Nominal
Pre-contingency Post-contingency
230 kV and above 98 to 105% 95 to 105%
69 kV and 115 kV 95 to 105% 95 to 105%
Project WTG terminals and 34.5 kV collector system
95 to 108% 95 to 108%
3.2.2 Thermal Criteria Table 3-2 shows the thermal criteria that were applied in the study.
Table 3-2. Thermal Criteria
SYSTEM CONDITION MAXIMUM ALLOWABLE FACILITY LOADING
Pre-contingency Normal rating
Post-contingency Long Time Emergency Rating (LTE)
3.3 Thermal and Voltage Analysis Power flow cases were tested for both thermal and voltage violations. The AC contingency analysis function of Siemens PTI’s PSS®E Version 32 was used to compare the steady state performance of the New England interconnected system, with and without the proposed Project. Version 32 was used as it can handle larger number of contingency events compared to previous versions.

Study Methodology
3-3
Siemens Energy, Inc. – Siemens Power Technologies International 59BR108-11 – Draft Steady State System Impact Study Report for Q371 Wind Project Interconnecting to Line L-163 near Jackman Substation New
Hampshire
If the system steady state performance did not meet the study criteria, transmission reinforcement options (e.g. line upgrades, shunt compensation, etc) were recommended.
The Project is not required to upgrade the system to resolve violations for line-out conditions (N-1-1). N-1-1 testing was performed only to examine the potential impacts of line-out scenarios on the Project’s operation.
3.3.1 Thermal Analysis The pre-Project power flow base cases were adjusted to ensure there were no relevant pre-Project N-1 or N-0 overloads. During the contingency analysis, the loading of any monitored element found to be higher than 95% of LTE rating was reported.
3.3.2 Voltage Analysis The pre-Project load flow base cases were adjusted to ensure there were no relevant pre-project voltage criteria violations. During the contingency analysis, the voltage of any monitored bus found to be outside the range of the post-contingency criteria was reported.
3.3.3 Contingencies The list of contingencies considered in the study is presented in Appendix C. The following types of contingencies were tested:
345 kV and 230 kV single line contingencies
115 kV single line contingencies
345 kV, 230 kV and 115 kV multiple element contingencies
Autotransformer contingencies
Loss of generation
Additional contingencies created by the Project were tested with the Project in-service. These include the loss of the entire Project, the loss of wind power with remaining Project elements in-service, and new contingencies created by the addition of the new 115 kV Switching Station at the POI.
3.3.4 Monitored Elements The Project will be located in Facilities rated at 69 kV and above in the zones listed in Table 3-3 were monitored for possible thermal and voltage criteria violations.

Study Methodology
Siemens Energy, Inc. – Siemens Power Technologies International 59BR108-11 – Draft Steady State System Impact Study Report for Q371 Wind Project Interconnecting to Line L-163 near Jackman Substation New
H hi
3-4
Table 3-3. Monitored Zones
Zone No. Zone Name
3.3.5 Power Flow Solution Options The ACCC activity of Siemens PTI PSS®E software was used. The pre-contingency and post-contingency solution options that were used in the Study are summarized in Table 3-4 below.
Table 3-4. Power Flow Solution Options
Case Transformer Taps
Phase Shifters DC Taps Switchable Shunts
Area Interchange
Control
Pre-Contingency 2
Stepping Regulating Regulating Regulating Disabled
Post-Contingency 2
Stepping 1 Locked at pre-contingency setting
Locked at pre-contingency setting
Enable continuous, disable discrete
Disabled
1 - The taps on the Fitzwilliam autotransformer were locked for post-contingency conditions to ensure any potential 115 kV voltage violations were not masked by changing taps.
2- For pre-contingency and post-contingency conditions, the reactive power limits of generators were observed and applied immediately at the start of the power flow solution.

4-1
Siemens Energy, Inc. – Siemens Power Technologies International 59BR108-11 – Draft Steady State System Impact Study Report for Q371 Wind Project Interconnecting to Line L-163 near Jackman Substation New
Hampshire
Section
4 Base Cases and Generation Dispatch ISO-NE provided 6-digit power flow base cases representing 2013 peak, shoulder and minimum load conditions. The New England loads represented in the cases match the 2011 CELT forecast load levels for 2013. Additionally, generating units in New England were represented with the most updated maximum power outputs at 50°F.
4.1 Development of Base Cases Power flow cases representing 2013 peak, shoulder and minimum load conditions were used in the Study. The peak load represents, approximately, the 2013 summer peak 90/10 load of the CELT 2011 forecast; the shoulder load is calculated as the 75% of the summer 50/50 peak load and the minimum load has a total New England load of 8500 MW.
Table 4-1 below, shows the New England (NE) loads and the transmission losses in the peak, shoulder and minimum load post-Project base cases that were considered in the Study.
The load levels include station service, non-CELT and 100% passive demand response loads (zero active demand response is modeled).
Table 4-1. NE Load and Losses for 2013 (MW)
Load Losses Total
Peak 30,106 783 30,890
Shoulder 21,288 629 21,918
Minimum 9,839 206 10,045
The following approved projects and their associated upgrades were assumed in service and modeled in all base cases provided by ISO-NE:
Closing of the Y138 line from White Lake 115 kV Substation to Saco Valley 115 kV Substation.
115 kV capacitors at Beebe and White Lake substations.
Monadnock transmission project.
Base Cases and Generation Dispatch
Siemens Energy, Inc. – Siemens Power Technologies International 59BR108-11 – Draft Steady State System Impact Study Report for Q371 Wind Project Interconnecting to Line L-163 near Jackman Substation New
H hi
4-2
Q166 Granite Wind project (99 MW) interconnecting on the W179 line.
Q172 wind project (40 MW) interconnecting in Vermont on the St. Johnsbury-Irasburg line.
Q197 wind project (50 MW), named Record Hill in the power flow cases, interconnecting in Maine to the Rumford 115 kV Substation.
Southern Loop transmission project, including the Vernon and Newfane substations and a second 345 kV line between Vernon and Coolidge.
Q251 Laidlaw Berlin Biomass project (65.9 MW) plus associated line rating upgrades of the following 115 kV lines caused by the project: O154 line (Paris-Lost Nation 115 kV) upgraded to D142 line (Lost Nation to Whitefield 115 kV) upgraded to and S136 line (Whitefield to Berlin 115 kV) upgraded to
Q290 wind project (18 MW), interconnecting in Maine to the Woodstock 115 kV Substation.
Q291 Merrimack G2 up-rate to the following ratings: gross output 354 MW, gross over-excited gross under-excited with a service station load of
Q323 wind project up-rate of former project Q290 to 20 MW (increase of 2 MW) in Maine.
Lyndonville reliability project, that adds a Substation, a 115/34.5 kV transformer and two 12.5 Mvar capacitors. The project taps the St Johnsbury to Sheffield 115 kV line in Vermont.
Q345 Wind Project (24 MW) interconnecting between Beebe River and Ashland Tap on the E-115 115 kV line in New Hampshire. As the Project is currently being studied, in this analysis, it is modeled as an equivalent generator and without any project upgrades.
4.1.1 Peak and Shoulder Load Cases The base cases for this project originated from ISO-NE’s MOD (Model On Demand) system, and reflect the latest system topology and ratings as of the beginning of the study. The following changes were made to the peak and shoulder load cases originally provided by ISO-NE:
All Nuclear units in ISO-NE turned online and set to pmax for peak and shoulder load conditions, with the exception of the East to West stressed cases where Vermont Yankee nuclear generating unit is offline to stress the associated flows.
All Northfield and Bearswamp pumped hydro units were set to generating mode in all peak load conditions and for West to East flow shoulder load conditions. For East to West flow shoulder conditions, the units are set to pumping mode.

Base Cases and Generation Dispatch
4-3
Siemens Energy, Inc. – Siemens Power Technologies International 59BR108-11 – Draft Steady State System Impact Study Report for Q371 Wind Project Interconnecting to Line L-163 near Jackman Substation New
Hampshire
Pmax and Pgen values were corrected for multiple generating units in ISO-NE using
data provided by ISO-NE on 5/24/2011 (originally for project Q297).
Generation dispatches across the ISO-NE area were adjusted to stress the interface flows to maximum limits i.e. Orrington-South ~ etc.
Saco PAR set to (previously ), Bliss PAR set to (previously ) and Phase II HVDC set to total in the peak case, total
in the shoulder case and total in the minimum load case, this is to match the configurations used for previous studies in this area.
Removed project Q229 Biomass (29 MW) from all cases, as this project has since withdrawn. No upgrades are associated with this project.
Prior queued project Q368 (18 MW) interconnecting to the Monadnock 34.5 kV distribution bus. As this project is currently being studied, in this analysis, it is modeled as an equivalent generator and without any project upgrades.
Alexandria generating unit Pgen and Pmax in New Hampshire changed from 0 MW to 17.0 MW in all cases.
Turned offline two of the four modeled Granite synchronous condensers and set the remaining two units to a reactive power output of This is to match previous configurations used for previous studies in this area.
Prior queued project wind project Q311 (63 MW) interconnecting to the 46 kV Lowell Substation in Vermont is modeled explicitly in all cases.
Merrimack and Comerford shunt reactors and capacitors adjusted to ensure reasonable reactive power output from nearby generating units.
For pre-NEEWS conditions, the A127 and B128 115 kV transmission lines in MA were set to “out of service” to match current operation.
For post-NEEWS conditions, the A127 and B128 115 kV transmission lines in MA were upgraded.
The Amherst to Fitzwilliam 345 kV line rating was updated to to replace a temporary rating reduction which will be mitigated
before the Project’s in-service date.
Generation dispatch changes in northern NH, NH Seacoast and southern Maine were made to secure the cases including: Whitelake Jet, Comerford, Moore, generation in the Berlin loop, Schiller, Granite Ridge, Yarmouth and Westbrook. In some cases these changes resulted in several interface flows below their target limits.
4.1.2 Minimum Load Cases To look at the worst-case scenario with respect to high voltage violations, the minimum load case was configured to minimize inter- and intra-area transfers to unload 345 kV lines and

Base Cases and Generation Dispatch
Siemens Energy, Inc. – Siemens Power Technologies International 59BR108-11 – Draft Steady State System Impact Study Report for Q371 Wind Project Interconnecting to Line L-163 near Jackman Substation New
H hi
4-4
eliminate reactive losses as much as possible. Specifically, the
interfaces were set as close to 0 MW as possible given the generation available.
4.2 Project Dispatch Table 4-2 and Table 4-3 show the Project dispatches for West to East and East to West flows, respectively.
Table 4-2. Project Dispatch (MW) for West to East flows
Unit Pre-Project Case Post-Project Case
Project Queue #371 (net) 0 32
Bellows Falls 49 16.33 (1 of 3 units online)
Table 4-3. Project Dispatch (MW) for East to West flows
Unit Pre-Project Case Post-Project Case
Project Queue #371 (net) 0 32
Merrimack G1 122.03 90.03
4.3 Generation Dispatch The generation dispatch and interface flows in ISO-NE can be found in Table 4-4 below for all cases studied. “OOS” refers to a generating unit being “Out Of Service”.
Complete power flow case summaries can be found in Appendix A.
Table 4-4. Generation Dispatch (MW) and Interface Flows (MW) for the Pre-Project Cases

Base Cases and Generation Dispatch
4-5
Siemens Energy, Inc. – Siemens Power Technologies International 59BR108-11 – Draft Steady State System Impact Study Report for Q371 Wind Project Interconnecting to Line L-163 near Jackman Substation New
Hampshire
Base Cases and Generation Dispatch
Siemens Energy, Inc. – Siemens Power Technologies International 59BR108-11 – Draft Steady State System Impact Study Report for Q371 Wind Project Interconnecting to Line L-163 near Jackman Substation New
H hi
4-6

Base Cases and Generation Dispatch
4-7
Siemens Energy, Inc. – Siemens Power Technologies International 59BR108-11 – Draft Steady State System Impact Study Report for Q371 Wind Project Interconnecting to Line L-163 near Jackman Substation New
Hampshire

5-1
Siemens Energy, Inc. – Siemens Power Technologies International 59BR108-11 – Draft Steady State System Impact Study Report for Q371 Wind Project Interconnecting to Line L-163 near Jackman Substation New
Hampshire
Section
5 N-1 Thermal and Voltage Study Thermal and voltage analyses with all lines in service (N-1 analysis) were performed to determine the thermal and voltage impacts of the Project on the performance of the power system. The peak, shoulder and minimum load scenarios described in Section 4 were evaluated with and without the Project. The minimum load scenario was included to identify any overvoltage condition caused by the Project.
Post-contingency loadings and voltages obtained for post-Project conditions were compared with the corresponding results obtained for pre-Project conditions to identify significant impacts due to the Project.
The study was performed assuming the Littleton 115-kV Reconfiguration project is in-service. This project has ISO-NE PPA approval. Therefore, contingencies associated with this project were considered.
5.1 Results for Normal Conditions (N-0) No thermal or voltage adverse impacts were found with all lines in service and all bus voltages within the 34.5 kV collector and WTG terminals are within 0.95 – 1.05 per unit criteria.
Table 5-1 documents the active and reactive power from the Project at the POI. The maximum reactive power imported by the Project at the POI is approximately
Table 5-1. MW and Mvar Injection from the Project at the POI
5.2 N-1 Thermal Results N-1 thermal analysis was performed for peak and shoulder load conditions. Complete N-1 thermal results are included in Appendix D.1.
The results discussed in this section are for the worst thermal violation for a given element. Loadings are expressed in percent of the LTE and where appropriate, STE ratings.

N-1 Thermal and Voltage Study
Siemens Energy, Inc. – Siemens Power Technologies International 59BR108-11 – Draft Steady State System Impact Study Report for Q371 Wind Project Interconnecting to Line L-163 near Jackman Substation New
H hi
5-2
several 345 kV lines show pre-Project thermal overloads above LTE rating. However, as the Project’s impact is less than 0.5% on these lines, these overloads can be ignored.
The results are discussed below:
5.2.1 Peak Load pre-NEEWS Conditions Table 5-2 and Table 5-3 show the thermal results for East to West flows and West to East flows, respectively.
As shown in Table 5-2 below, the only thermal overload caused by the Project was found on the Q345 POI to Ashland 115 kV section of the E-115 line for the
The Project causes a loading of
As part of prior queued project “Q345”, this portion of the E-115 line will be upgraded to an LTE rating of Therefore the Q371 Project is not required to upgrade this line. The E115 line upgrade’s in-service date is December 2013, while the in-service date of the Q345 project is October 2012; the Q345 project’s output may be limited under certain scenarios until this line upgrade is complete.
Table 5-2. Thermal Results - 2013 Peak Load, Pre-NEEWS, East to West flows

N-1 Thermal and Voltage Study
5-3
Siemens Energy, Inc. – Siemens Power Technologies International 59BR108-11 – Draft Steady State System Impact Study Report for Q371 Wind Project Interconnecting to Line L-163 near Jackman Substation New
Hampshire
Table 5-3. Thermal Results - 2013 Peak Load, Pre-NEEWS, West to East flows
5.2.2 Shoulder Load pre-NEEWS Conditions Table 5-4 and Table 5-5 show the thermal results for East to West flows and West to East flows, respectively.
As shown in Table 5-4 below the only thermal overload caused by the Project was found on the Q371 POI to Keene 115 kV section of the L-163 line for several contingencies with the highest loading caused by The Project causes a loading of

N-1 Thermal and Voltage Study
Siemens Energy, Inc. – Siemens Power Technologies International 59BR108-11 – Draft Steady State System Impact Study Report for Q371 Wind Project Interconnecting to Line L-163 near Jackman Substation New
H hi
5-4
Section 9 describes the transfer limit analysis performed for these conditions to determine the Projects impact on existing transfer limits.
Table 5-4. Thermal Results - 2013 Shoulder Load, Pre-NEEWS, East to West flows

N-1 Thermal and Voltage Study
5-5
Siemens Energy, Inc. – Siemens Power Technologies International 59BR108-11 – Draft Steady State System Impact Study Report for Q371 Wind Project Interconnecting to Line L-163 near Jackman Substation New
Hampshire

N-1 Thermal and Voltage Study
Siemens Energy, Inc. – Siemens Power Technologies International 59BR108-11 – Draft Steady State System Impact Study Report for Q371 Wind Project Interconnecting to Line L-163 near Jackman Substation New
H hi
5-6
Table 5-5. Thermal Results - 2013 Shoulder Load, Pre-NEEWS, West to East flows

N-1 Thermal and Voltage Study
5-7
Siemens Energy, Inc. – Siemens Power Technologies International 59BR108-11 – Draft Steady State System Impact Study Report for Q371 Wind Project Interconnecting to Line L-163 near Jackman Substation New
Hampshire
5.2.3 Peak Load post-NEEWS Conditions Table 5-6 and Table 5-7 show the thermal results for East to West flows and West to East flows, respectively.
For both flow directions the results show the Project has no significant impact.
Table 5-6. Thermal Results - 2013 Peak Load, Post-NEEWS, East to West flows

N-1 Thermal and Voltage Study
Siemens Energy, Inc. – Siemens Power Technologies International 59BR108-11 – Draft Steady State System Impact Study Report for Q371 Wind Project Interconnecting to Line L-163 near Jackman Substation New
H hi
5-8
Table 5-7. Thermal Results - 2013 Peak Load, Post-NEEWS, West to East flows
5.2.4 Shoulder Load post-NEEWS Conditions Table 5-8 and Table 5-9 show the thermal results for East to West flows and West to East flows, respectively.

N-1 Thermal and Voltage Study
5-9
Siemens Energy, Inc. – Siemens Power Technologies International 59BR108-11 – Draft Steady State System Impact Study Report for Q371 Wind Project Interconnecting to Line L-163 near Jackman Substation New
Hampshire
As shown in Table 5-8 below, the only thermal overload caused by the Project was found on the Q371 POI to Keene 115 kV section of the L-163 line in New Hampshire for several contingencies with the highest loading caused by
Section 9 describes the transfer limit analysis performed for these conditions to determine the Projects impact on existing transfer limits.
Table 5-8. Thermal Results - 2013 Shoulder Load, Post-NEEWS, East to West flows

N-1 Thermal and Voltage Study
Siemens Energy, Inc. – Siemens Power Technologies International 59BR108-11 – Draft Steady State System Impact Study Report for Q371 Wind Project Interconnecting to Line L-163 near Jackman Substation New
H hi
5-10

N-1 Thermal and Voltage Study
5-11
Siemens Energy, Inc. – Siemens Power Technologies International 59BR108-11 – Draft Steady State System Impact Study Report for Q371 Wind Project Interconnecting to Line L-163 near Jackman Substation New
Hampshire
Table 5-9. Thermal Results - 2013 Shoulder Load, Post-NEEWS, West to East flows

N-1 Thermal and Voltage Study
Siemens Energy, Inc. – Siemens Power Technologies International 59BR108-11 – Draft Steady State System Impact Study Report for Q371 Wind Project Interconnecting to Line L-163 near Jackman Substation New
H hi
5-12
5.3 N-1 Voltage Results N-1 voltage analysis was performed for peak, shoulder and minimum load conditions. The results are discussed in this section.
As the N-1 voltage results are too large to show in the body of this report, the complete results are included in Appendix D.2.
All voltage violations shown in the results are considered pre-existing, in several cases the pre-existing voltage violations are a result of having all switched shunt capacitors and reactors locked post-contingency, whereas in reality many of these devices in New Hampshire have the capability to switch automatically to resolve the violations. Most importantly, the Project has less than 0.5% impact on all monitored bus voltages. Therefore no adverse voltage impact caused by the Project on the New England bulk power system was found.
Table 5-10 below, provides an example of the local pre-existing voltage violations and the Project’s impact, which in some cases alleviates the high voltages.

N-1 Thermal and Voltage Study
5-13
Siemens Energy, Inc. – Siemens Power Technologies International 59BR108-11 – Draft Steady State System Impact Study Report for Q371 Wind Project Interconnecting to Line L-163 near Jackman Substation New
Hampshire
Table 5-10. Voltage Results – Peak Load, Post-NEEWS, East to West

N-1 Thermal and Voltage Study
Siemens Energy, Inc. – Siemens Power Technologies International 59BR108-11 – Draft Steady State System Impact Study Report for Q371 Wind Project Interconnecting to Line L-163 near Jackman Substation New
H hi
5-14
However, for all conditions studied, post-contingency high voltages above 1.08 per unit occur at the Project’s WTG 12.0 kV terminals and within the 34.5 kV collector system. This is due to the WTG’s reaching their reactive power exporting limits trying to maintain the scheduled voltage at the POI, for contingencies that cause low voltages on the 115 kV system. The highest voltages of up to 1.1 per unit at the WTG terminals occur for post-NEEWS conditions with West to East flows for several contingencies, as shown below in Table 5-11 for the worst cases.
However, in reality the reactive power output limits reduce for voltages above or below the 0.95 – 1.05 per unit range, thereby limiting such extreme high voltages.
Table 5-11. Voltage Results - Post-NEEWS, West to East Flow, Project WTG 12.0 kV Terminal Post-Contingency Voltages
For post-NEEWS conditions with East to West flows, low voltages occur at several WTG 12.0 kV terminals for several contingencies that cause high voltages on the 115 kV system. This is due to the WTG’s reaching their reactive power importing limits trying to maintain the scheduled voltage at the POI.
Table 5-12 shows the voltages found for the worst cases.
Table 5-12. Voltage Results - Post-NEEWS, East to West Flow, Project WTG 12.0 kV Terminal Post-Contingency Voltages
Section 7 (Voltage Sensitivity Results) – discusses the issues and resolutions to the voltage problems shown in Table 5-11 and Table 5-12 above.

6-1
Siemens Energy, Inc. – Siemens Power Technologies International 59BR108-11 – Draft Steady State System Impact Study Report for Q371 Wind Project Interconnecting to Line L-163 near Jackman Substation New
Hampshire
Section
6 Greggs Series Reactor Sensitivity Switching the Greggs 115 kV series reactor in service was studied to ensure that the addition of the Project did not adversely impact the system in this state.
For this study, the Greggs 115 kV by-pass switch is opened forcing the current to flow through the series reactor. Both pre-NEEWS and post-NEEWS shoulder load conditions were tested for N-1 contingencies and monitored for any thermal and voltage impacts with same the conditions described previously in sections 3 and 4.
6.1 Results for Normal Conditions (N-0) No thermal or voltage adverse impacts were found with all lines in service.
6.2 N-1 Thermal Results N-1 thermal analysis was performed for pre-NEEWS and Post-NEEWS shoulder load conditions with East to West flows. Complete N-1 thermal results are included in Appendix D.3.
The results are discussed below:
6.2.1 Shoulder Load pre-NEEWS with East to West Flow Conditions Table 6-1, below, shows the thermal results for the shoulder load pre-NEEWS case with East-West flow conditions and the Greggs reactor in service. With the Greggs series reactor in service no thermal overloads occur.
Table 6-1. Thermal Results - Shoulder Load, Pre-NEEWS, East to West flows – Greggs Series Reactor In-Service

Greggs Series Reactor Sensitivity
Siemens Energy, Inc. – Siemens Power Technologies International 59BR108-11 – Draft Steady State System Impact Study Report for Q371 Wind Project Interconnecting to Line L-163 near Jackman Substation New
H hi
6-2
6.2.2 Shoulder Load post-NEEWS with East to West Flow Conditions Table 6-2, below, shows the thermal results for the shoulder load post-NEEWS case with East-West flow conditions and the Greggs reactor in service. With the Greggs series reactor in service no thermal overloads occur.

Greggs Series Reactor Sensitivity
6-3
Siemens Energy, Inc. – Siemens Power Technologies International 59BR108-11 – Draft Steady State System Impact Study Report for Q371 Wind Project Interconnecting to Line L-163 near Jackman Substation New
Hampshire
Table 6-2. Thermal Results - Shoulder Load, Post-NEEWS, East to West flows – Greggs Series
Reactor In-Service
Greggs Series Reactor Sensitivity
Siemens Energy, Inc. – Siemens Power Technologies International 59BR108-11 – Draft Steady State System Impact Study Report for Q371 Wind Project Interconnecting to Line L-163 near Jackman Substation New
H hi
6-4
6.3 N-1 Voltage Results N-1 voltage analysis was performed for pre-NEEWS and Post-NEEWS shoulder load conditions with East to West flows to see if switching in-service the 115 kV Greggs series reactor caused any low voltage problems.
Complete N-1 voltage results are included in Appendix D.4.
No adverse voltage impact caused by the Project with the 115 kV Greggs series reactor in-service was found.

7-1
Siemens Energy, Inc. – Siemens Power Technologies International 59BR108-11 – Draft Steady State System Impact Study Report for Q371 Wind Project Interconnecting to Line L-163 near Jackman Substation New
Hampshire
Section
7 Voltage Sensitivity Analysis As described previously in Section 5.3, high and low post-contingency voltages were found at the Project’s WTG 12.0 kV terminals and within the 34.5 kV collector system. According to Figure 7-1 (also shown in Figure 2-4), the reactive power output capability is reduced for voltages outside the 0.95 – 1.05 per unit range. However, during the N-1 voltage analysis in Section 5.3, the reactive limits modeled remained at +/- 1.2 Mvar for post-contingency conditions. Due to the high collector system impedances between the WTG’s and the POI, the WTG’s reactive power output essentially reaches saturation for certain contingencies and will therefore reach a maximum terminal voltage and reactive power output limit before the design limit of +/-1.2 Mvar can be reached. As such, a sensitivity analysis was performed to ensure that even with reduced reactive power limits of +/- 0.3 Mvar (considered conservative) the Project causes no voltage violations on the New England bulk power system.
Figure 7-1. WTG Reactive Power (Q) vs Terminal Voltage (U) at Full Rated Active Power Output, taken from “AW-3000 Electrical Characteristic - DG200032-F”

Voltage Sensitivity Analysis
Siemens Energy, Inc. – Siemens Power Technologies International 59BR108-11 – Draft Steady State System Impact Study Report for Q371 Wind Project Interconnecting to Line L-163 near Jackman Substation New
H hi
7-2
.
For the sensitivity analysis a “low area voltages” case and a “high area voltages” case were simulated, to ensure the Project can be operated at a range of acceptable voltages. The results below, show the Project causes no adverse voltage impact to the transmission system whilst voltages within the Project’s collector system and at the WTGs terminals remain within criteria.
Table 7-1 below describes the scenarios, contingencies and case setup to perform the voltage sensitivity analysis.
Table 7-1. Voltage Sensitivity Analysis Procedure
“115 kV High-voltage” case “115 kV Low-voltage” case
Cases to test
Contingencies to test
Jackman capacitors Online Offline
Chestnut Hill capacitors Online (as much as possible without causing high voltages) Offline
Fitzwilliam transformer taps Fitzwilliam 115 kV voltage at pre-contingency
Fitzwilliam 115 kV voltage at pre-contingency
Q371 project voltage schedule Controlling 115 kV bus to kV Controlling 115 kV bus to kV
As the complete results are too large to show in the body of the report, they are given in Appendix D.5. However, Table 7-2 below, provides an example of the local voltages and the Project’s impact, which in some cases alleviates the high voltages.
Table 7-2. Shoulder Load, Post-NEEWS, East to West Flows
The voltage sensitivity results are shown in Table 7-3 and Table 7-4 for the same buses and contingencies shown in the previous voltage analysis (Table 5-11 and Table 5-12).
The results in Table 7-3 show that with the WTG reactive power limits set to +/- 0.3 Mvar the voltages at G2 WTG terminal are less than 1.08 per unit.

Voltage Sensitivity Analysis
7-3
Siemens Energy, Inc. – Siemens Power Technologies International 59BR108-11 – Draft Steady State System Impact Study Report for Q371 Wind Project Interconnecting to Line L-163 near Jackman Substation New
Hampshire
No adverse voltage impact caused by the Project with the reduced reactive power limits was found.
Table 7-3. Low Voltage Case, Project WTG 12.0 kV Terminal Post-Contingency Voltages
The results in Table 7-4 show that with the WTG reactive power limits set to +/- 0.3 Mvar, the voltages at G3 WTG terminal are higher than 0.95 per unit.
No adverse voltage impact caused by the Project with the reduced reactive power limits was found.
Table 7-4. High Voltage Case, Project WTG 12.0 kV Terminal Post-Contingency Voltages

8-1
Siemens Energy, Inc. – Siemens Power Technologies International 59BR108-11 – Draft Steady State System Impact Study Report for Q371 Wind Project Interconnecting to Line L-163 near Jackman Substation New
Hampshire
Section
8 Line-Out Analysis (N-1-1) The impact of the Project was tested under N-1-1 conditions for three different initial contingencies. The Project will not be required to upgrade the system to operate to its full capacity under these conditions; the intent of this analysis is only to document the restrictions to which the Project may be subjected under various line-out scenarios.
For each line-out case the complete set of N-1 contingencies were analyzed with the same study methodology described in Section 3.
All thermal and voltage N-1-1 results can be found in Appendix D.6.
Shoulder Load
As the N-1 analysis results shown, the shoulder load with East to West flow conditions was the most limiting case. As such the pre and post NEEEWS shoulder load conditions with East to West flows was studied with the following line out conditions:
381 345 kV line (Northfield-Vernon)
301/302 345 kV line (Ludlow-Carpenter Hill-Millbury)
For each shoulder load case the 115 kV Greggs series reactor is in-service
Minimum Load
Pre and post-NEEWS conditions were studied for the I135N (Fitzwilliam-Monadnock-Bellows Falls) line-out case.
8.1 N-1-1 Thermal Results
8.1.1 381 (Northfield-Vernon) Line-Out Pre-NEEWS
No base case thermal violations were found above the normal line ratings.
Table 8-1 below shows several thermal overloads occurred on the Scobie to Lawrence Rd and the Lawrence Rd to Sandy Pond 345 kV lines (section 326) above the LTE ratings for
The 326 line has an SPS that trips Newington G1 generation, however this unit is offline. By turning all
Line-Out Analysis (N-1-1)
Siemens Energy, Inc. – Siemens Power Technologies International 59BR108-11 – Draft Steady State System Impact Study Report for Q371 Wind Project Interconnecting to Line L-163 near Jackman Substation New
H hi
8-2
Granite Ridge and Schiller generation units offline following the first contingency the overload can be mitigated in the event of the second contingency occurring.
The thermal overload on the Pemigewasset to Webster 115 kV line (section A-111) for can be
mitigated by backing down generation at prior queued wind project “Q345” by following the first contingency.
For all thermal overloads described above the Project has minimal impact.
Table 8-1. N-1-1 Thermal Results – Shoulder Load, Pre-NEEWS, East to West Flows, 381 Line-Out
Post-NEEWS
No base case thermal violations were found above the normal line ratings.
Table 8-2 below shows thermal overloads occur on the Q345 POI to Ashland 115 kV line (E-115 South) and the Pemigewasset to Webster 115 kV line (section A-111) for
Both thermal overloads can be resolved by backing down generation at prior queued wind project “Q345” by following the first contingency.

Line-Out Analysis (N-1-1)
8-3
Siemens Energy, Inc. – Siemens Power Technologies International 59BR108-11 – Draft Steady State System Impact Study Report for Q371 Wind Project Interconnecting to Line L-163 near Jackman Substation New
Hampshire
For all thermal overloads described above the Project has minimal impact.
Table 8-2. N-1-1 Thermal Results – Shoulder Load, Post-NEEWS, East to West Flows, 381 Line-Out
8.1.2 301/302 (Ludlow-Carpenter Hill-Millbury) Line-Out Case Pre-NEEWS
No base case thermal violations were found above the normal line ratings.
Table 8-3 below shows thermal overloads occur on the Keene to Monadnock 115 kV line (T-198) and the Keene to the Project POI 115 kV line (L-163 South) for
The first thermal overload can be resolved by backing down generation at Bellows falls by following the first contingency and the second thermal overload by turning all Project WTG’s offline following the first contingency.
Table 8-3. N-1-1 Thermal Results – Shoulder Load, Pre-NEEWS, East to West Flows, 301 Line-Out

Line-Out Analysis (N-1-1)
Siemens Energy, Inc. – Siemens Power Technologies International 59BR108-11 – Draft Steady State System Impact Study Report for Q371 Wind Project Interconnecting to Line L-163 near Jackman Substation New
H hi
8-4
Post-NEEWS
No base case thermal violations were found above the normal line ratings.
Table 8-4 below shows a thermal overload occurs on the Keene to the Project POI 115 kV line (L-163 South) for
The thermal overload can be resolved by turning all Project WTG’s offline following the first contingency.
Table 8-4. N-1-1 Thermal Results – Shoulder Load, Post-NEEWS, East to West Flows, 301 Line-Out

Line-Out Analysis (N-1-1)
8-5
Siemens Energy, Inc. – Siemens Power Technologies International 59BR108-11 – Draft Steady State System Impact Study Report for Q371 Wind Project Interconnecting to Line L-163 near Jackman Substation New
Hampshire
8.1.3 I135N (Fitzwilliam-Monadnock-Bellows Falls) Line-Out Case No thermal violations were found with or without NEEWS.
8.2 N-1-1 Voltage Results Similarly as previously described in Section 5.3 some voltage violations are shown in the results, however they are considered pre-existing,
No adverse voltage impact caused by the Project was found with or without NEEWS for any of the line-out scenarios studied.

9-1
Siemens Energy, Inc. – Siemens Power Technologies International 59BR108-11 – Draft Steady State System Impact Study Report for Q371 Wind Project Interconnecting to Line L-163 near Jackman Substation New
Hampshire
Section
9 Transfer Limit Analysis

Queue Position 371 Transfer Limit Analysis
Executive Summary
As part of the steady-state System Impact Study for Queue Position 371 (“the Project”) (interconnecting to the 115 kV PSNH L163 line between Jackman and Keene, New Hampshire), an analysis of transfer limit impacts was conducted. The intent of this analysis is to determine whether the Project degrades transfer capability across the New England East-West Interface. The analysis determined that the Project does degrade transfer capability across the interface in the pre-NEEWS/Pittsfield-Greenfield system, but has no impact after NEEWS and the Pittsfield-Greenfield project are in service. As a result, the project would be required to upgrade the “L163S” line, between its Point of Interconnection (POI) and Keene. This upgrade is not required, however, because this impact is addressed by the Pittsfield-Greenfield project. In the event that the Project wishes to connect before the Pittsfield-Greenfield project is energized, without upgrading the L163S line, the Project may be subject to additional operational restrictions to address this overload on a day-to-day basis, as described in the ISO New England Transmission, Markets, and Services Tariff, section II, schedule 22, article 5.9.
Introduction
According to ISO New England Planning Procedure 5-6 and Schedule 22 of Section II of the ISO New England Transmission, Markets, and Services Tariff, a new generator must “… interconnect in a manner that avoids any significant adverse effect on the reliability, stability, and operability of the New England Transmission System, including protecting against the degradation of transfer capability for interfaces affected by the Generating Facility.” The analysis contained in this section of the report is intended to evaluate Queue Position 371’s impact on transfer capability across affected interfaces. The Project has proposed to interconnect to Public Service of New Hampshire (PSNH)’s L163 line, between Jackman and Keene, New Hampshire. This line is one of the components of both the New England East-West and New England West-East Interfaces. The steady-state contingency analysis, as described in earlier sections of the System Impact Study, examined both East-West and West-East transfer conditions. However, as seen in the results of that analysis, East-West transfers at shoulder load conditions tended to be the only conditions under which constraints relevant to the project’s interconnection were identified. As a result, only East-West transfer conditions, at shoulder load conditions, were analyzed in this transfer limit analysis.
Transfer Limit Analysis Procedure
Comparison of Pre- and Post-Project Transfer Capability
The goal of this analysis was to examine the effects of the Project on East-West transfer limits. As such, under a number of different system conditions (as described below), East-West power flows
Queue Position 371 Transfer Limit Analysis Page 1 of 5
2012 ISO New England Inc.

were increased in a pre-Project case until flows are limited by a transmission line or transformer rating. Typically, the limit was due to a post-contingency flow exceeding a transmission element’s Long-Term Emergency (LTE) rating. However, it is also possible that a pre-contingency flow could exceed an element’s Normal rating. This analysis was then repeated in a post-Project case. Comparison of the pre-Project and post-Project transfer limits indicated whether the Project degrades transfer capability across the East-West interface. As with the steady-state contingency analysis, under East-West transfer conditions, the Project was dispatched against the Merrimack G1 unit, which is the existing generator with the greatest impact on east-west flows on the L163 line. The transfer limit analysis performed here only examines thermal conditions;
All analysis was performed in PSS® MUST, version 10.1. Please note that, for the purposes of this analysis, the Project was assumed to be on the eastern side of the East-West interface; in other words, the L163S line was assumed to be part of the interface, and not the L163N.
Cases Analyzed
The cases analyzed were taken directly from the steady-state analysis, as described earlier in the System Impact Study. As with the steady-state thermal contingency analysis, cases were analyzed both with and without two major projects which will impact flows in southwestern New Hampshire and across the East-West interface: the New England East-West Solution (NEEWS), and the Pittsfield-Greenfield Project in western Massachusetts. The full list of contingencies analyzed in the steady-state analysis was used to test post-contingency flows. A number of contingencies outside of New Hampshire, which tend to impact flows across the East-West interface, were also added to the list. These additional contingencies can be found in Table 1 below.
Table 1: Additional Contingencies Tested in Transfer Limit Analysis
Queue Position 371 Transfer Limit Analysis Page 2 of 5
2012 ISO New England Inc.

Transfer Conditions Examined
Because the East-West interface is a very large interface, including electrically distant transmission lines across the entire New England region, three different transfer conditions were tested. While each transfer condition increased New England East-West power flows, they did so in different ways, by stressing different parts of the East-West interface. The first transfer condition tested, the “Northern” condition, increased generation in southeastern New Hampshire (with high levels of flow from Maine into New Hampshire) and northeastern Massachusetts. On the receiving end of the transfer, generation on the other side of the East-West interface, in western Massachusetts, was decreased. A “Southern” condition was also tested, with generation in southeastern Massachusetts increased, and generation in Connecticut decreased. Finally, a transfer was tested with a “Distributed” mix of generation on each side of the interface, mixing the “Northern” and “Southern” generation sets roughly equally.
Utilization of the Greggs Series Reactor
At the Greggs substation, a series reactor can be manually switched into service or bypassed by system operators. This reactor increases the impedance, and thus decreases power flows, on the 115 kV transmission path between Greggs and Keene. The L163 line, onto which the Project has proposed to connect, is a part of this path.
Transfer Limit Analysis Results
Pre-NEEWS/Pittsfield-Greenfield Transfer Limit Analysis Results
The results of the transfer limit analysis for the pre-NEEWS/Pittsfield-Greenfield cases can be found in Table 2.
Table 2: Pre-NEEWS/Pittsfield-Greenfield Transfer Limit Analysis Results
Queue Position 371 Transfer Limit Analysis Page 3 of 5
2012 ISO New England Inc.
In the “Northern” East-West transfer condition, the pre-NEEWS/Pittsfield-Greenfield transfer analysis shows that the Project degrades transfer capability by approximately

The “Southern” and “Distributed” transfer conditions do not show the L163 line as a limiting element, in cases either with or without the Project in service. With the reactor bypassed, a reduction in transfer capability is caused by the addition of the Project.
Because a degradation in transfer capability was seen in the pre-NEEWS/Pittsfield-Greenfield case, the Project will be responsible for an upgrade of the L163S line between the Point of Interconnection and Keene if it interconnects before the in-service-date of NEEWS and the Pittsfield/Greenfield project. Currently, the LTE rating of this line is The transfer analysis showed that, for the “Northern” transfer, East-West transfers have approximately a transfer distribution factor onto the L163S line; in other words, of every additional megawatt transferred across the East-West interface will flow on the L163S line. Knowing this, the required rating of the upgraded line can be found by multiplying the required increase in transfer limits ( the difference between the pre- and post-project transfer limits) by the transfer distribution factor ( ) to obtain a required increase in line ratings. Thus, the upgraded L163S line must have an LTE rating of at least
Post-NEEWS/Pittsfield-Greenfield Transfer Limit Analysis Results
The results of the transfer limit analysis for the pre-NEEWS/Pittsfield-Greenfield cases can be found in Table 3.
Table 3: Post-NEEWS/Pittsfield-Greenfield Transfer Limit Analysis Results
In the post-NEEWS/Pittsfield-Greenfield system, the Project does not degrade transfer capability, regardless of the transfer condition studied. The only impact to the interface concerns the use of the Greggs series reactor.
As a result, if the project only interconnects to the post-NEEWS/Pittsfield-Greenfield system, it will not be required to upgrade the L163S line.
Queue Position 371 Transfer Limit Analysis Page 4 of 5
2012 ISO New England Inc.
Queue Position 371 Transfer Limit Analysis Page 5 of 5
2012 ISO New England Inc.
Conclusion
The analysis contained in this section was performed to determine whether the Queue Position 371 project degrades transfer capability on the New England East-West interface. Both pre-NEEWS/Pittsfield-Greenfield and post-NEEWS/Pittsfield-Greenfield cases were tested, and transfer limits were evaluated both with the Greggs series reactor bypassed and inserted. In the pre-NEEWS/Pittsfield-Greenfield system, the Project does degrade transfer capability on the East-West interface by approximately This degradation does not appear in the post-NEEWS/Pittsfield Greenfield system, where pre- and post-project transfer limits are essentially equal.
As a result of this analysis, the Project will have two options to meet the Minimum Interconnection Standard under Schedule 22 of Section II of the ISO New England Transmission, Markets, and Services Tariff. The first is to upgrade the L163S line, between the Project’s Point of Interconnection and Keene, to an LTE rating of at least This upgrade is not required, however, because this impact is addressed by the Pittsfield-Greenfield project. In the event that the Project wishes to connect before the Pittsfield-Greenfield project is energized, without upgrading the L163S line, the Project may be subject to additional operational restrictions to address this overload on a day-to-day basis, as described in the ISO New England Transmission, Markets, and Services Tariff, section II, schedule 22, article 5.9. By connecting only to the post-NEEWS/Pittsfield-Greenfield system, the Project would not degrade transfer capability on the East-West interface.

10-1
Siemens Energy, Inc. – Siemens Power Technologies International 59BR108-11 – Draft Steady State System Impact Study Report for Q371 Wind Project Interconnecting to Line L-163 near Jackman Substation New
Hampshire
Section
10 Short Circuit Analysis The short circuit analysis was performed by PSNH, the Transmission Owner. The short circuit report is provided below.

Project Queue 371
Short Circuit & PSNH Circuit Breaker Duty Study
Introduction Short circuit studies and Breaker Ratings studies were performed to determine the effect of the 33MW wind powered facility ISO-NE Queue #371, on the PSNH transmission system. The short circuit levels and adequacy of the existing PSNH circuit breakers were examined as part of the study. The program used for the analysis was ASPEN OneLiner short circuit program. Summary The addition of the 33MW wind powered facility will not cause any PSNH Transmission breakers to become overdutied or exceed 80% of their current rating. For all breaker rating studies, a pre-fault voltage of 1.05pu is used. Study Models The following ASPEN OneLiner cases were used for this study: Pre-Queue 371.olr: This base case represents the present transmission system along with the following proposed generation and projects: South Southern Loop (aka Coolidge Connector) Project Western Massachusetts Transmission Reinforcements (NEEWS) Long Island Replacement Cable Norwalk-Glenbrook Cables Haddam 345/115-kV autotransformer Barbour Hill 345/115-kV autotransformer Killingly 345/115-kV autotransformer Northern Reliability Interconnect Project (NRI) Heywood Road – ME Maguire Road – ME Y138 Closing – ME Rumford-Woodstock-Kimball Road – ME Rumford Falls Hydro Interconnection – ME Hancock County & Downeast – ME Keene Road Autotransformer – ME Monadnock Project Bethel-Norwalk Project Middletown-Norwalk Transmission Project Post-Queue 371.olr: This case includes everything from the Pre-Queue 371 case as well as the 33MW wind powered facility, ISO-NE Queue 371 connected to the L163 line between Keene S/S and Jackman S/S.
A. J. Locklear Page 1 03/20/2012

Study Results
1. PSNH Base Case Breaker Duty (Pre-Queue 371)
A. J. Locklear Page 2 02/07/2012

Flags: W1 – BREAKER INTERRUPTING DUTY EXCEEDS 80% OF RATING W2 – BREAKER MOMENTARY (CLOSE-AND-LATCH) CURRENT DUTY EXCEEDS 80% OF RATING
2. PSNH Post - Queue 371 Breaker Duty
After introducing the 33MW wind powered facility on the L163 line, no additional PSNH breakers become overdutied or exceed 80% of their current rating.
A. J. Locklear Page 3 02/07/2012

W1 – BREAKER INTERRUPTING DUTY EXCEEDS 80% OF RATING W2 – BREAKER MOMENTARY (CLOSE-AND-LATCH) CURRENT DUTY EXCEEDS 80% OF RATING
3. Fault Current Level Changes with Addition of Queue 371
A. J. Locklear Page 4 02/07/2012

A. J. Locklear Page 5 02/07/2012
Substations that experienced an increase in fault current of more than 10% can be seen below in red.

11-1
Siemens Energy, Inc. – Siemens Power Technologies International 59BR108-11 – Draft Steady State System Impact Study Report for Q371 Wind Project Interconnecting to Line L-163 near Jackman Substation New
Hampshire
Section
11 Conclusion Thermal and voltage analyses were performed to determine the thermal and voltage impacts of the Project on the performance of the power system. Peak, shoulder and minimum load scenarios were evaluated with and without the Project. The minimum load scenario was included to identify any overvoltage condition caused by the Project.
The Study results are summarized below:
11.1 N-0 Results No thermal or voltage violations caused by the Project were found during pre-contingency conditions.
11.2 N-1 Thermal Results N-1 thermal analysis was performed for peak and shoulder load conditions. The thermal results are summarized below:
Peak Load – Pre-NEEWS Conditions – East to West Flows
The Q345 POI to Ashland 115 kV section of the E-115 line overloads for the
The Project causes a loading of As part of prior queued project “Q345”, this
portion of the E-115 line will be upgraded to an LTE rating of Therefore the Q371 Project is not required to upgrade this line. The E115 line upgrade’s in-service date is December 2013, while the in-service date of the Q345 project is October 2012; the Q345 project’s output may be limited under certain scenarios until this line upgrade is complete.
Shoulder Load – Pre-NEEWS and Post-NEEWS Conditions – East to West Flows
Q371 POI to Keene 115 kV section of the L-163 line overloads for several contingencies with the highest loading caused by
The Project causes a loading of
the fact that an overload was found indicated the need for a transfer limit analysis to be performed. The results of this analysis can be found in the “Transfer Limit Analysis” section.
Conclusion
Siemens Energy, Inc. – Siemens Power Technologies International 59BR108-11 – Draft Steady State System Impact Study Report for Q371 Wind Project Interconnecting to Line L-163 near Jackman Substation New
H hi
11-2
11.3 Greggs Series Reactor Sensitivity Switching the Greggs 115 kV series reactor in service was studied to ensure that the addition of the Project did not adversely impact the system in this state.
For this study the Greggs 115 kV by-pass switch is opened forcing the current to flow through the series reactor. Both pre-NEEWS and post-NEEWS shoulder load conditions with East to West flows were tested for N-1 contingencies and monitored for any thermal and voltage impacts.
The results show that the Project does not adversely impact system operation; no thermal overloads occur, and no voltage violations were found.
11.4 N-1 Voltage Results No adverse voltage impact caused by the Project on the New England bulk power system was found.
However, for all conditions studied, post-contingency high voltages up to were seen in simulation at the Project’s WTG 12.0 kV terminals and within the 34.5 kV collector system and ow voltages occur below
within the Project. This is due to the WTG’s reaching their reactive power limits of +/-1.2 Mvar trying to maintain the scheduled voltage at the POI, for contingencies that cause either low or high voltages on the 115 kV system.
In reality the reactive power output limits reduce for voltages above or below the 0.95 – 1.05 per unit range, thereby limiting such extreme voltages.
11.5 Voltage Sensitivity Analysis This sensitivity test was performed to ensure that, with terminal voltages outside of their 0.95-1.05 per unit range, the turbines could still provide sufficient reactive power to avoid any voltage violations on the transmission system. Therefore, for this sensitivity analysis, reactive power limits of +/- 0.3 Mvar (considered conservative) were set for each WTG.
The results shown that with limited reactive power limits, no voltage violations on the New England bulk power system occur. However, the Project may not be able to hold its voltage schedule with the reactive power limits reduced.
11.6 N-1-1 Thermal Results Shoulder Load East to West Flows
For the pre-NEEEWS conditions with the 381 (Northfield-Vernon) line-out, area generation reduction following the line-out situation will prevent any thermal overloads occurring following a possible second contingency. For the post-NEEWS conditions less area generation reduction is required.

Conclusion
11-3
Siemens Energy, Inc. – Siemens Power Technologies International 59BR108-11 – Draft Steady State System Impact Study Report for Q371 Wind Project Interconnecting to Line L-163 near Jackman Substation New
Hampshire
For the pre-NEEEWS conditions with the 301/302 (Ludlow-Carpenter Hill-Millbury) line-out, area generation reduction following the line-out situation will prevent any thermal overloads occurring following a possible second contingency. For the post-NEEWS conditions less area generation is required.
Minimum Load
No thermal overloads were found for the I135N (Fitzwilliam-Monadnock-Bellows Falls) line-out case.
11.7 N-1-1 Voltage Results For all N-1-1 line-out scenario’s studied the reduced reactive power output of +/- 0.3 Mvar (considered conservative) were set for each WTG.
No adverse voltage impact caused by the Project was found with or without NEEWS for any of the line-out scenarios studied.
11.8 Transfer Limit Analysis The analysis was performed to determine whether the Project degrades transfer capability on the New England East-West interface. Both pre-NEEWS and post-NEEWS cases were tested, and transfer limits were evaluated both with the Greggs series reactor bypassed and inserted.
In the pre-NEEWS/Pittsfield-Greenfield system, the Project does degrade transfer capability on the East-West interface by approximately This degradation does not appear in the post-NEEWS/Pittsfield-Greenfield system, where pre- and post-Project transfer limits are essentially equal.
11.9 Short Circuit The addition of the 33MW wind powered facility will not cause any PSNH Transmission breakers to become overdutied or exceed 80% of their current rating.
11.10 Final Conclusions For pre-NEEWS/Pittsfield-Greenfield conditions, due to the thermal overload on the portion of the L163 line between the Point of Interconnection and Keene and the impact to the East-West transfer limits, this portion of the L163 115 kV line will need to be upgraded to a minimum LTE rating of This upgrade is not required, however, because this impact is addressed by the Pittsfield-Greenfield project. In the event that the Project wishes to connect before the Pittsfield-Greenfield project is energized, without upgrading the L163S line, the Project may be subject to additional operational restrictions to address this overload on a day-to-day basis, as described in the ISO New England Transmission, Markets, and Services Tariff, section II, schedule 22, article 5.9.

Conclusion
Siemens Energy, Inc. – Siemens Power Technologies International 59BR108-11 – Draft Steady State System Impact Study Report for Q371 Wind Project Interconnecting to Line L-163 near Jackman Substation New
H hi
11-4
The estimated in-service date for the Project is December 2013; if the Project does not elect to upgrade the Line L163 and elects to rely on the Pittsfield-Greenfield Project to mitigate the overload of Line L163 and impacts to thermal limits on transfers across the East-West Interface, then the project can interconnect in 2013 as planned. However, until the Pittsfield-Greenfield Project is constructed, the Project may be restricted in real-time operations to mitigate the potential overload of Line L163 and impacts to thermal transfer limits. If for reasons beyond NU’s control (e.g. siting and regulatory approval) the Pittsfield-Greenfield Project is cancelled, the Project will be held responsible to upgrade the section of Line L163 from the Project’s Point of Interconnection to the Keene substation.
The steady state and short circuit analyses performed show that the Project, along with the proposed thermal solutions, will not have a steady state adverse impact on the reliability or operating characteristics of the power system.
11.11 Interconnection Cost Estimate NU's non-binding good faith estimate to interconnect Antrim Wind to the Public Service of New Hampshire (PSNH) system in the Town of Antrim, NH ranges between -50% $6.34 million to 200% $38 million. This estimate is based on constructing a configuration, looping into the L163 line about 6.5 miles southwards of the Jackman 115-kV Substation.
NU's non-binding good faith estimate to uprate the L163 line for the Q371 interconnect is in the order of magnitude -50% $6.6 million to +200% $40 million.
The section of line between the POI and Keene substation requires uprate, this is approximately 19 miles in length. The scope of work will allow the line to be operated at a summer LTE temperature of 140C, resulting in a new summer LTE rating of The uprate does not affect the impedance of the 115 kV conductors.

A-1
Siemens Energy, Inc. – Siemens Power Technologies International 59BR108-11 – Draft Steady State System Impact Study Report for Q371 Wind Project Interconnecting to Line L-163 near Jackman Substation New
Hampshire
Appendix
A Power Flow Summaries

B-1
Siemens Energy, Inc. – Siemens Power Technologies International 59BR108-11 – Draft Steady State System Impact Study Report for Q371 Wind Project Interconnecting to Line L-163 near Jackman Substation New
Hampshire
Appendix
B Power Flow One-Line Diagrams

C-1
Siemens Energy, Inc. – Siemens Power Technologies International 59BR108-11 – Draft Steady State System Impact Study Report for Q371 Wind Project Interconnecting to Line L-163 near Jackman Substation New
Hampshire
Appendix
C Contingency List

D-1
Siemens Energy, Inc. – Siemens Power Technologies International 59BR108-11 – Draft Steady State System Impact Study Report for Q371 Wind Project Interconnecting to Line L-163 near Jackman Substation New
Hampshire
Appendix
D Results
D.1 N-1 Thermal Results
Appendix D
Siemens Energy, Inc. – Siemens Power Technologies International 59BR108-11 – Draft Steady State System Impact Study Report for Q371 Wind Project Interconnecting to Line L-163 near Jackman Substation New
H hi
D-2
D.2 N-1 Voltage Results

Appendix D
D-3
Siemens Energy, Inc. – Siemens Power Technologies International 59BR108-11 – Draft Steady State System Impact Study Report for Q371 Wind Project Interconnecting to Line L-163 near Jackman Substation New
Hampshire
D.3 N-1 Thermal - Greggs Series Reactor Results

Appendix D
Siemens Energy, Inc. – Siemens Power Technologies International 59BR108-11 – Draft Steady State System Impact Study Report for Q371 Wind Project Interconnecting to Line L-163 near Jackman Substation New
H hi
D-4
D.4 N-1 Voltage - Greggs Series Reactor Results
Appendix D
D-5
Siemens Energy, Inc. – Siemens Power Technologies International 59BR108-11 – Draft Steady State System Impact Study Report for Q371 Wind Project Interconnecting to Line L-163 near Jackman Substation New
Hampshire
D.5 N-1 Voltage – Sensitivity Results

Appendix D
Siemens Energy, Inc. – Siemens Power Technologies International 59BR108-11 – Draft Steady State System Impact Study Report for Q371 Wind Project Interconnecting to Line L-163 near Jackman Substation New
H hi
D-6
D.6 N-1-1 Thermal & Voltage Results

E-1
Siemens Energy, Inc. – Siemens Power Technologies International 59BR108-11 – Draft Steady State System Impact Study Report for Q371 Wind Project Interconnecting to Line L-163 near Jackman Substation New
Hampshire
Appendix
E Project IDEV

Appendix E
Siemens Energy, Inc. – Siemens Power Technologies International 59BR108-11 – Draft Steady State System Impact Study Report for Q371 Wind Project Interconnecting to Line L-163 near Jackman Substation New
H hi
E-2

Appendix E
E-3
Siemens Energy, Inc. – Siemens Power Technologies International 59BR108-11 – Draft Steady State System Impact Study Report for Q371 Wind Project Interconnecting to Line L-163 near Jackman Substation New
Hampshire

Siemens Industry, Inc. Siemens Power Technologies International 400 State Street • P.O. Box 1058 Schenectady, New York 12301-1058 USA Tel: +1 (518) 395-5000 • Fax: +1 (518) 346-2777
www.siemens.com/power-technologies