Embed Size (px)
Citation preview
Statistics music venues
usefulness and necessity of collecting data
How? What? Why? do we collect?
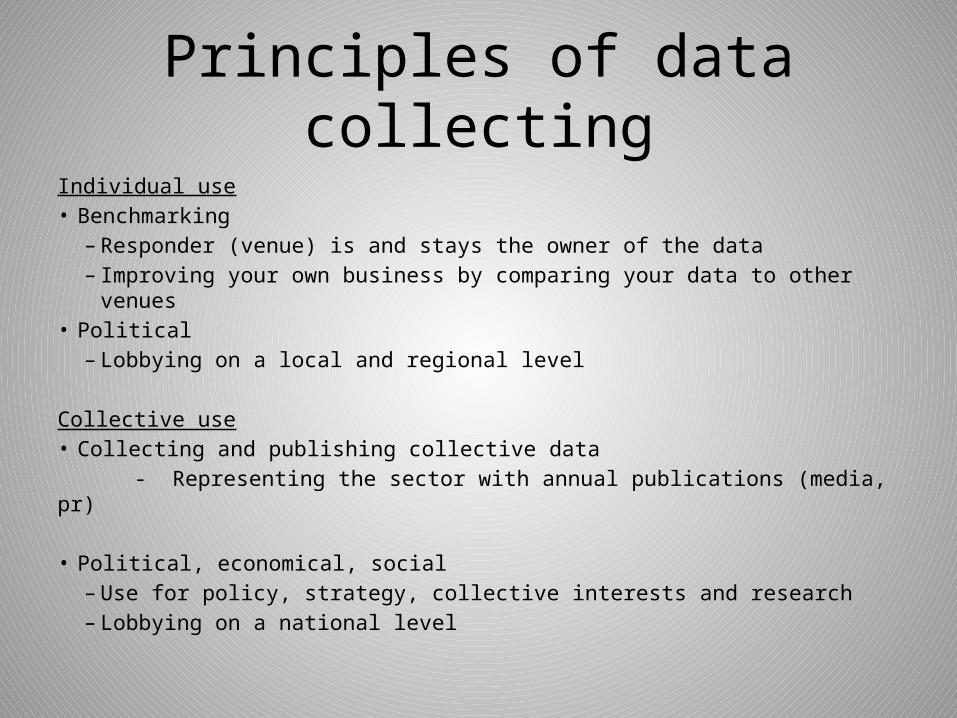
Principles of data collectingIndividual use• Benchmarking
– Responder (venue) is and stays the owner of the data– Improving your own business by comparing your data to other venues
• Political– Lobbying on a local and regional level
Collective use• Collecting and publishing collective data - Representing the sector with annual publications (media, pr)
• Political, economical, social– Use for policy, strategy, collective interests and research – Lobbying on a national level
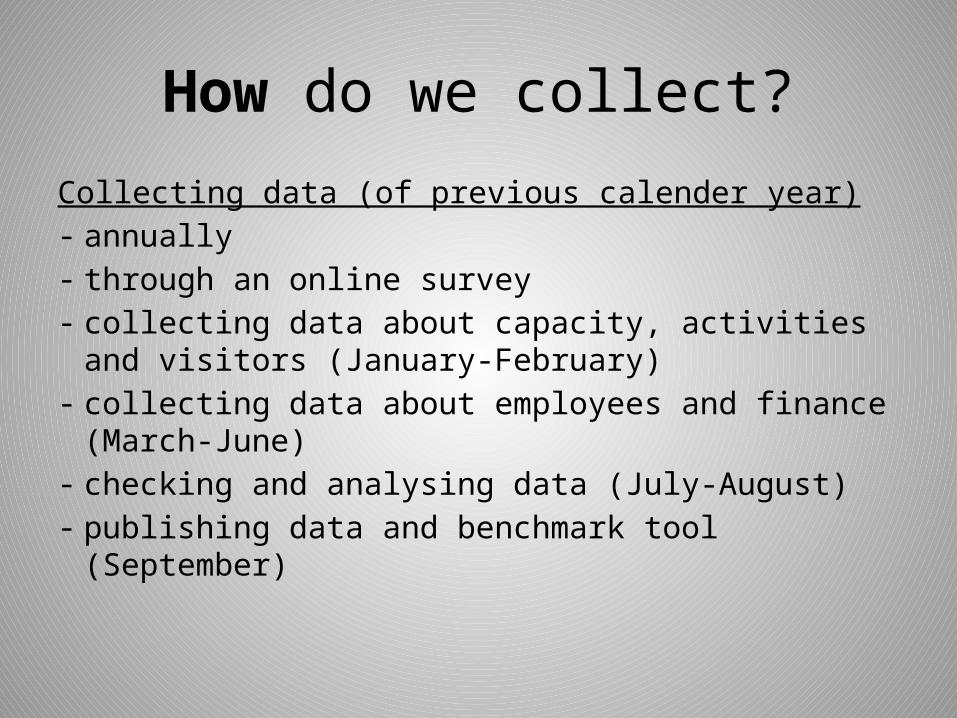
How do we collect?
Collecting data (of previous calender year)- annually- through an online survey- collecting data about capacity, activities and
visitors (January-February)- collecting data about employees and finance
(March-June)- checking and analysing data (July-August)- publishing data and benchmark tool (September)
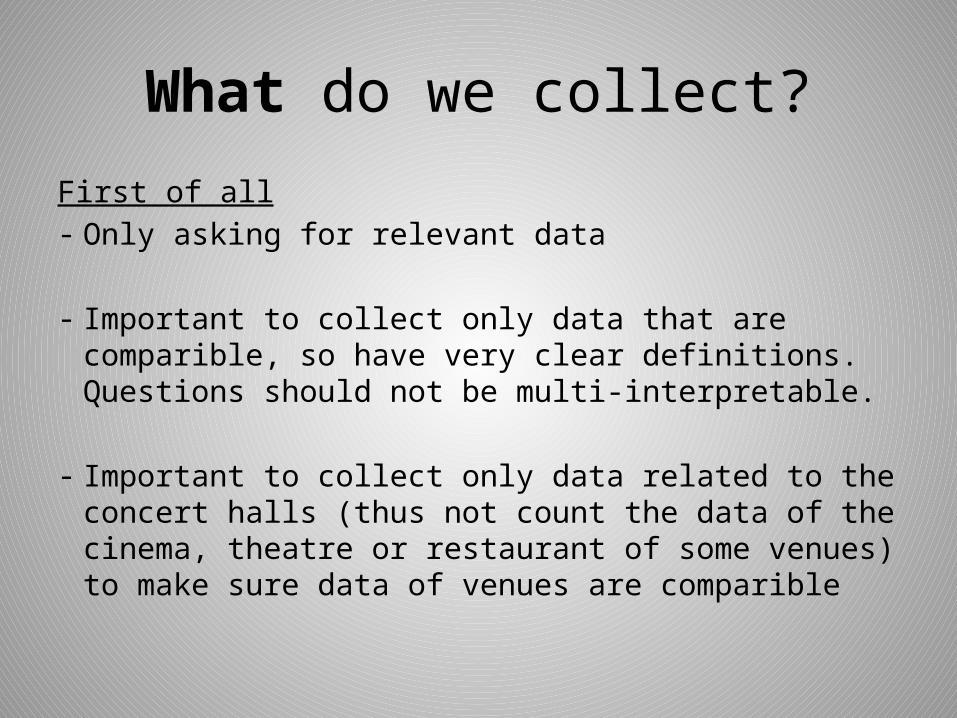
What do we collect?
First of all- Only asking for relevant data
- Important to collect only data that are comparible, so have very clear definitions. Questions should not be multi-interpretable.
- Important to collect only data related to the concert halls (thus not count the data of the cinema, theatre or restaurant of some venues) to make sure data of venues are comparible
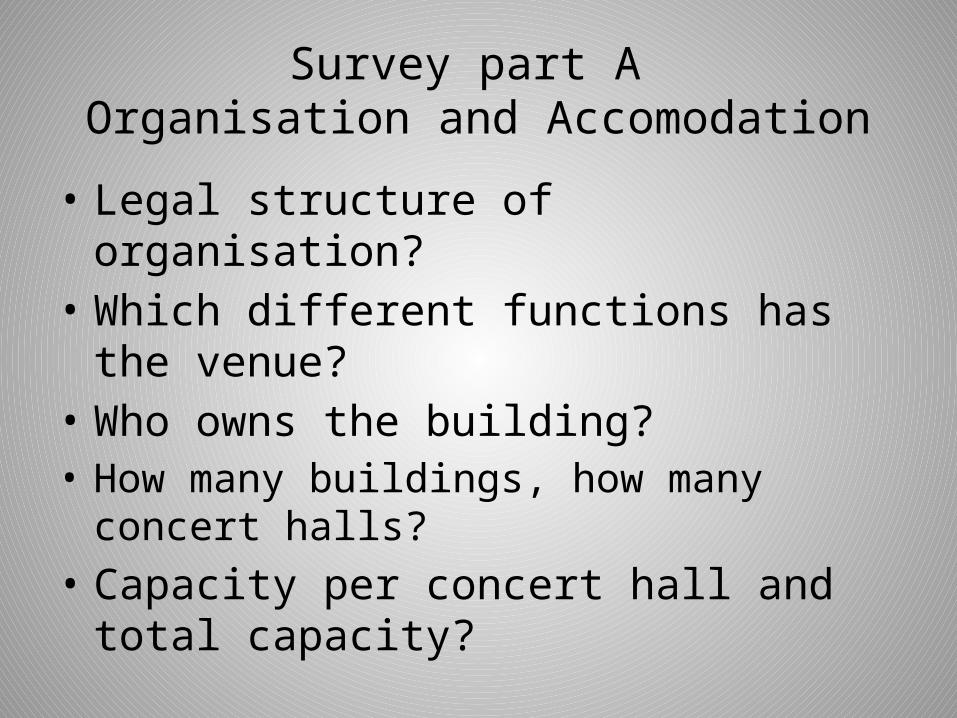
Survey part A Organisation and Accomodation
• Legal structure of organisation?• Which different functions has the venue?• Who owns the building?• How many buildings, how many concert halls?• Capacity per concert hall and total capacity?
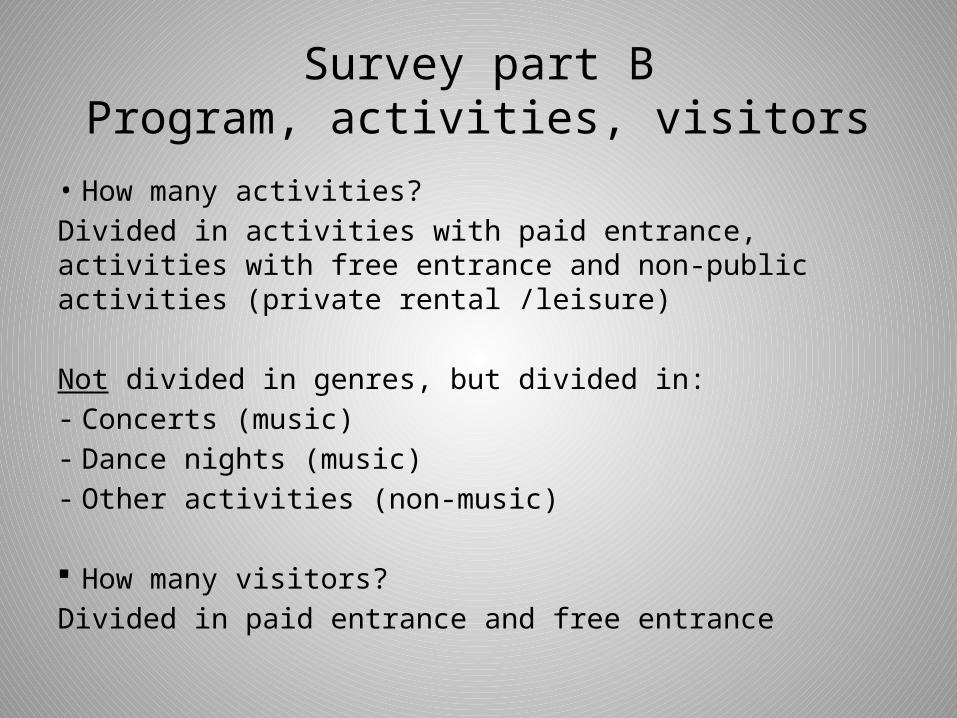
Survey part BProgram, activities, visitors
• How many activities?Divided in activities with paid entrance, activities with free entrance and non-public activities (private rental /leisure)
Not divided in genres, but divided in:- Concerts (music)- Dance nights (music)- Other activities (non-music)
How many visitors?Divided in paid entrance and free entrance
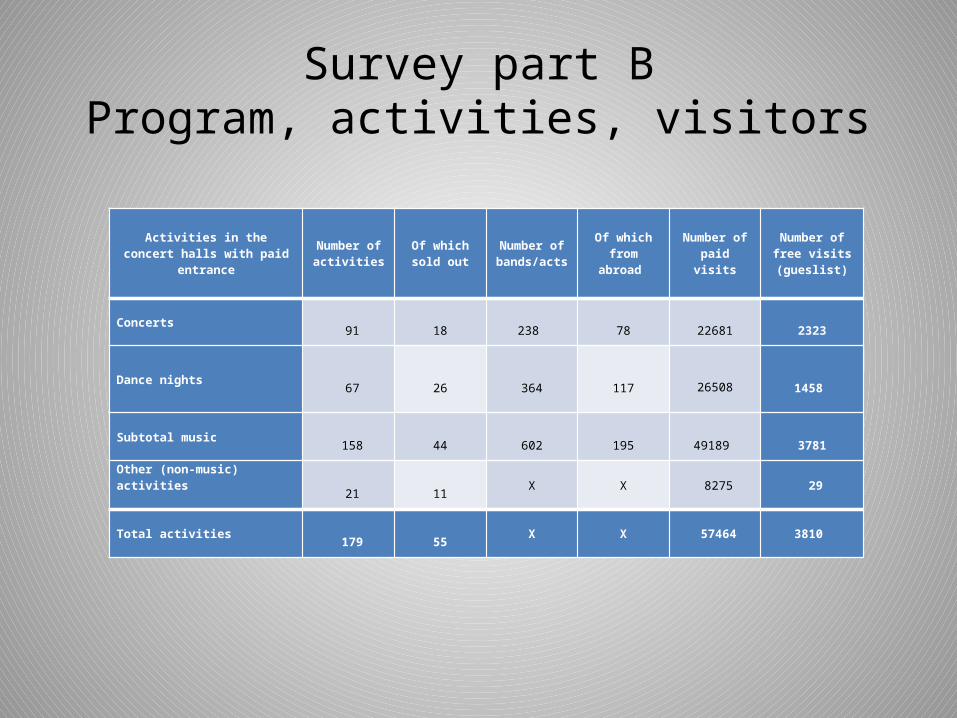
Survey part BProgram, activities, visitors
Activities in the concert halls with paid entrance
Number of activities
Of which sold out
Number ofbands/acts
Of which from abroad
Number of paid visits
Number of free visits
(gueslist)
Concerts 91
18 238
78
22681
2323
Dance nights 67
26
364
117 26508 1458
Subtotal music 158
44
602
195 49189
3781
Other (non-music) activities
21
11 X X 8275 29
Total activities 179 55 X X 57464 3810
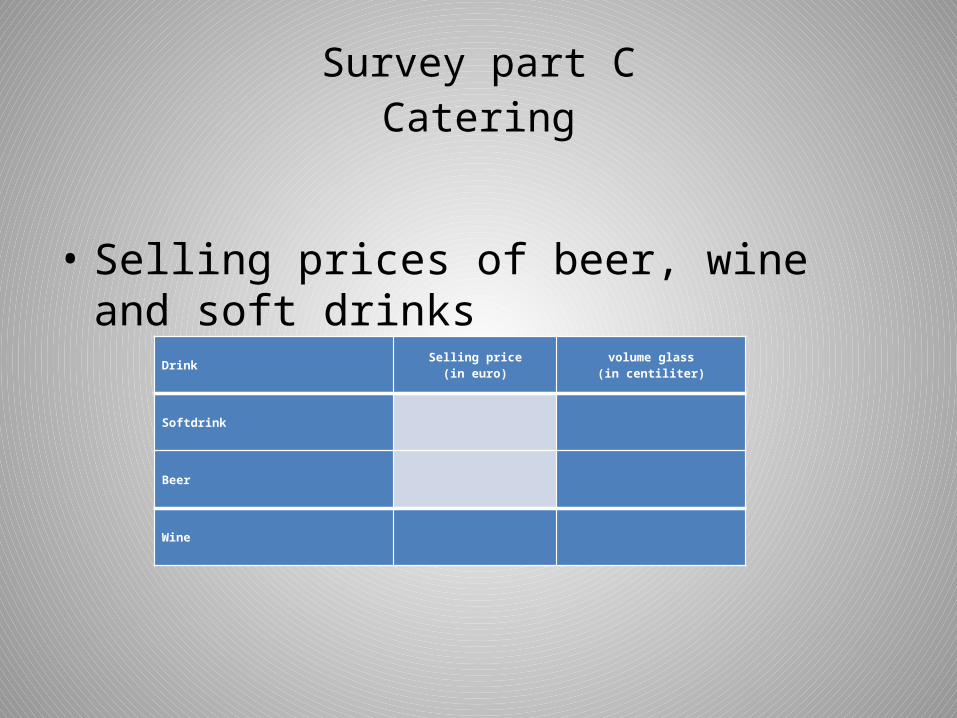
Survey part CCatering
• Selling prices of beer, wine and soft drinks
Drink Selling price(in euro)
volume glass(in centiliter)
Softdrink
Beer
Wine
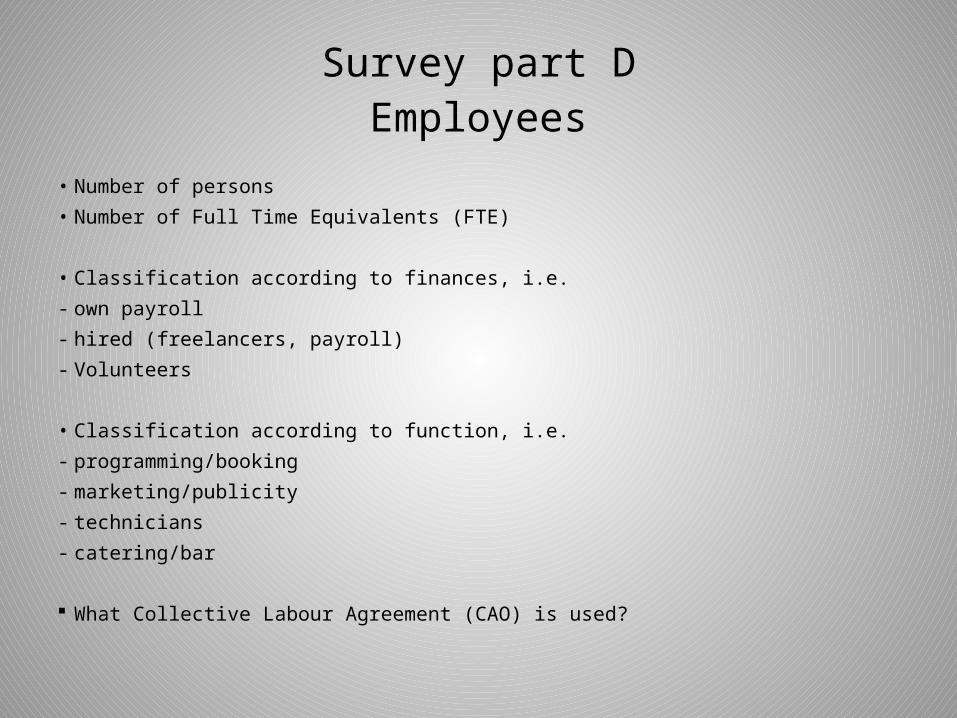
Survey part DEmployees
• Number of persons• Number of Full Time Equivalents (FTE)
• Classification according to finances, i.e.- own payroll- hired (freelancers, payroll) - Volunteers
• Classification according to function, i.e.- programming/booking- marketing/publicity- technicians- catering/bar
What Collective Labour Agreement (CAO) is used?
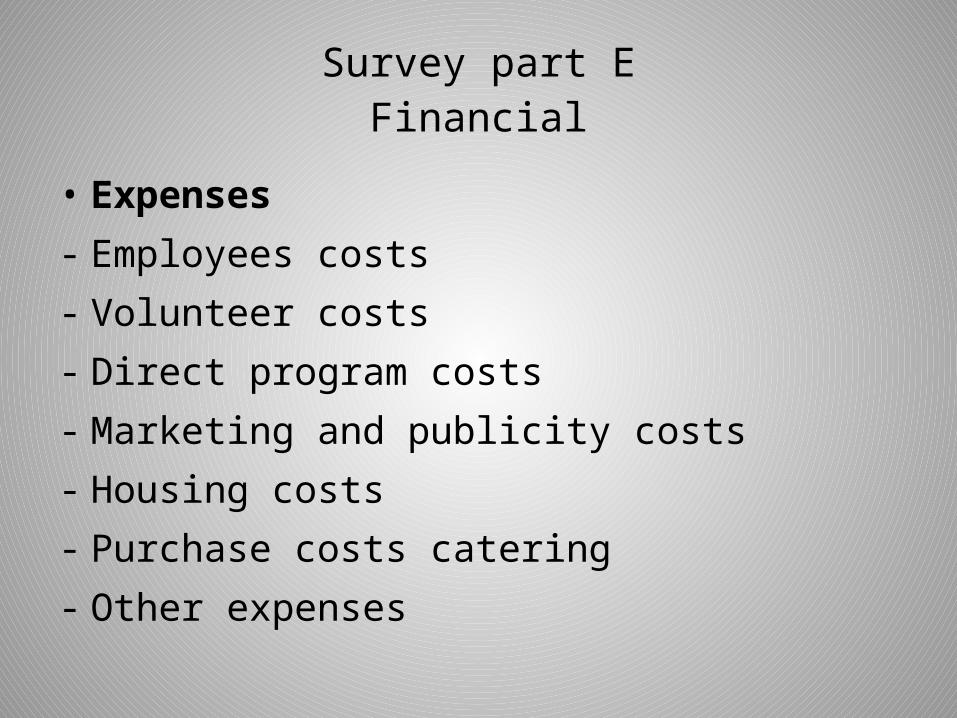
Survey part EFinancial
• Expenses- Employees costs- Volunteer costs- Direct program costs- Marketing and publicity costs- Housing costs- Purchase costs catering- Other expenses
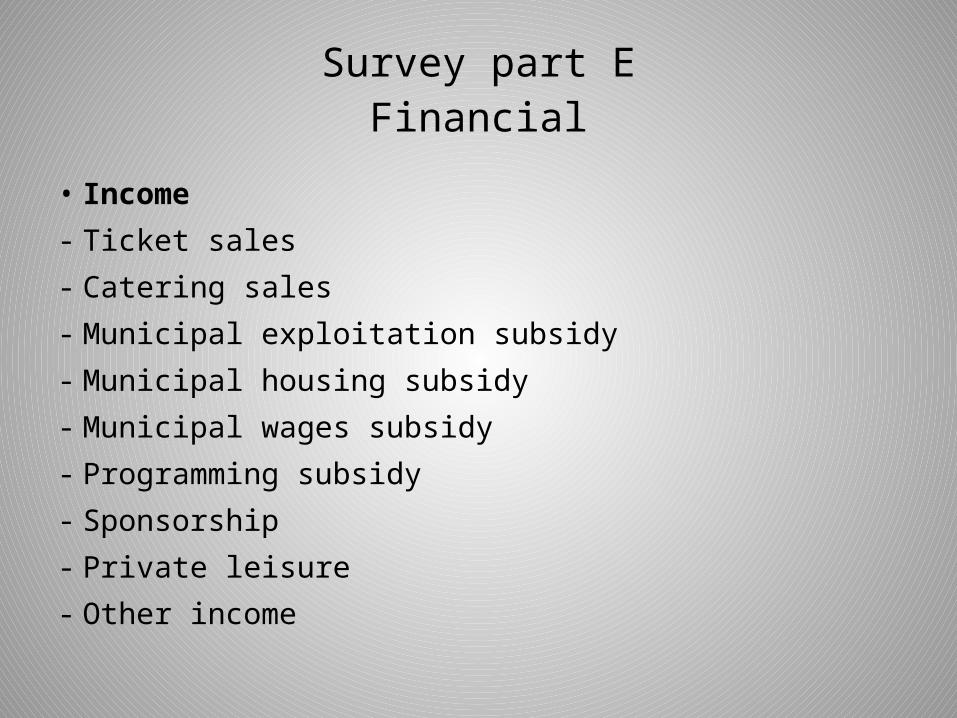
Survey part EFinancial
• Income- Ticket sales- Catering sales- Municipal exploitation subsidy- Municipal housing subsidy- Municipal wages subsidy- Programming subsidy- Sponsorship- Private leisure- Other income
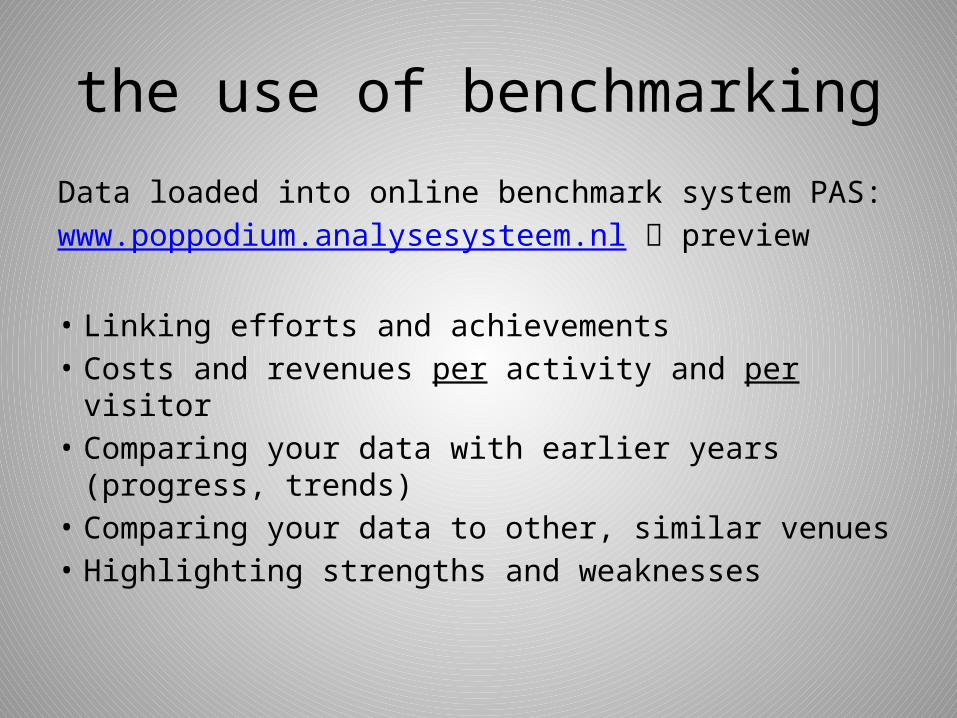
the use of benchmarking
Data loaded into online benchmark system PAS:www.poppodium.analysesysteem.nl preview
• Linking efforts and achievements• Costs and revenues per activity and per visitor• Comparing your data with earlier years (progress,
trends)• Comparing your data to other, similar venues• Highlighting strengths and weaknesses
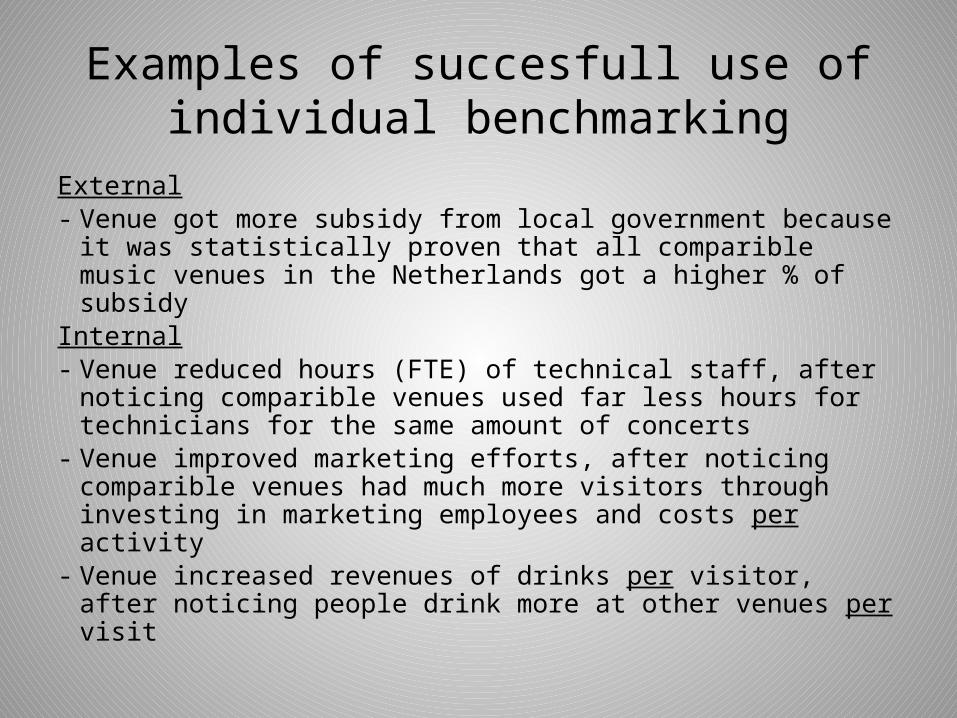
Examples of succesfull use of individual benchmarking
External- Venue got more subsidy from local government because it
was statistically proven that all comparible music venues in the Netherlands got a higher % of subsidy
Internal- Venue reduced hours (FTE) of technical staff, after noticing
comparible venues used far less hours for technicians for the same amount of concerts
- Venue improved marketing efforts, after noticing comparible venues had much more visitors through investing in marketing employees and costs per activity
- Venue increased revenues of drinks per visitor, after noticing people drink more at other venues per visit

Principles of data collectingIndividual use• Benchmarking
– Responder (venue) is and stays the owner of the data– Improving your own business by comparing your data to other venues
• Political– Lobbying on a local and regional level
Collective use• Collecting and publishing collective data - Representing the sector with annual publications (media, pr)
• Political, economical, social– Use for policy, strategy, collective interests and research – Lobbying on a national level
Collective data
Annual publication ‘Music venues in figures’
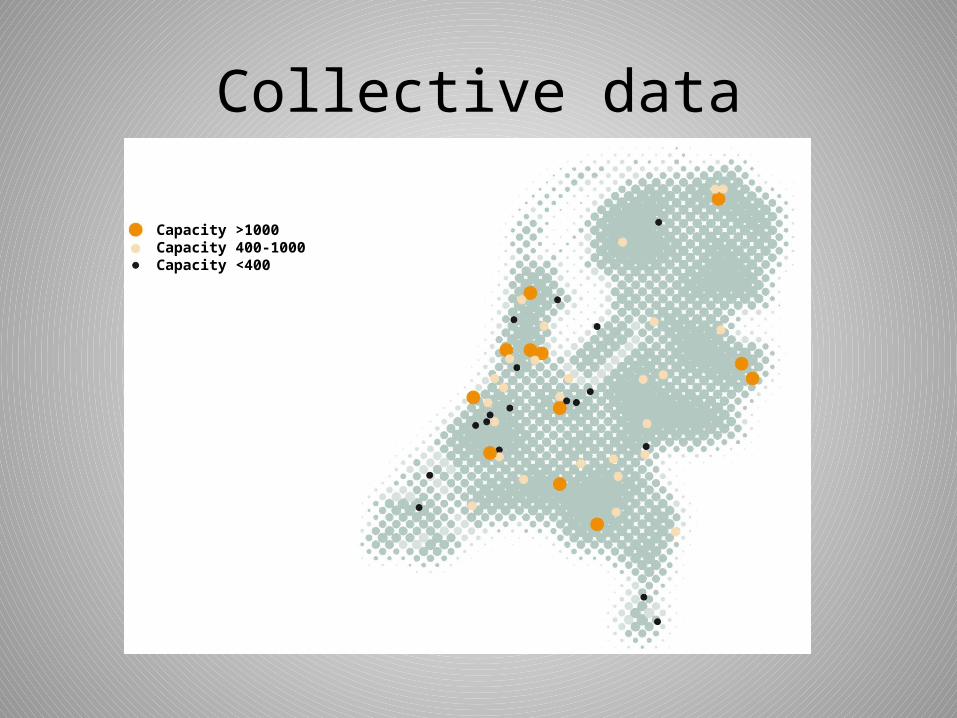
Collective data
Capacity >1000Capacity 400-1000Capacity <400
Collective data
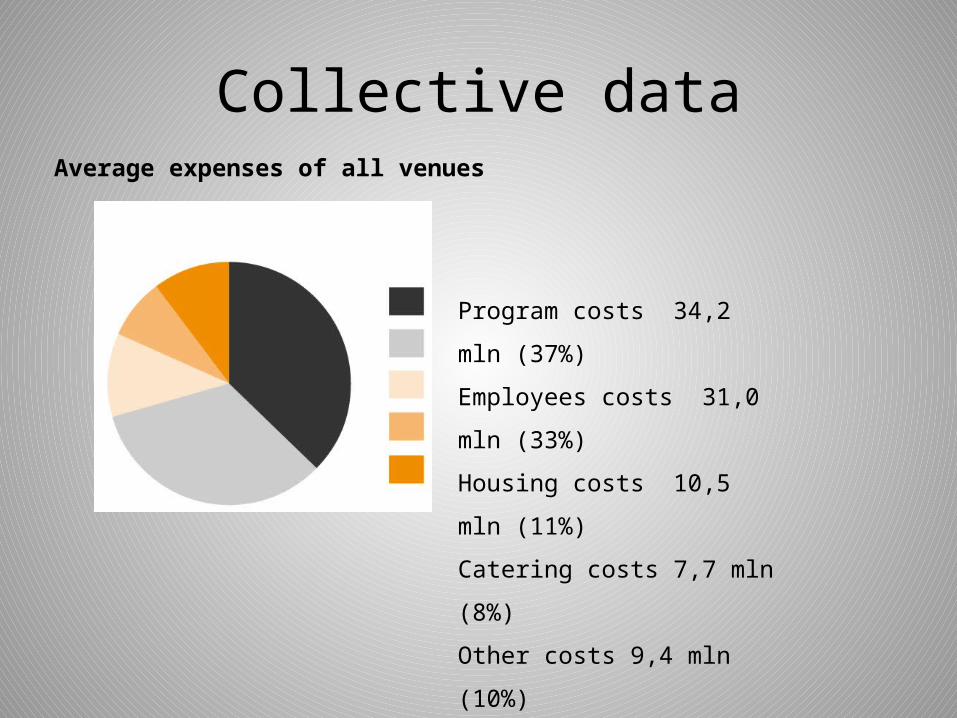
Program costs 34,2 mln (37%)
Employees costs 31,0 mln (33%)
Housing costs 10,5 mln (11%)
Catering costs 7,7 mln (8%)
Other costs 9,4 mln (10%)
Average expenses of all venues
Collective data
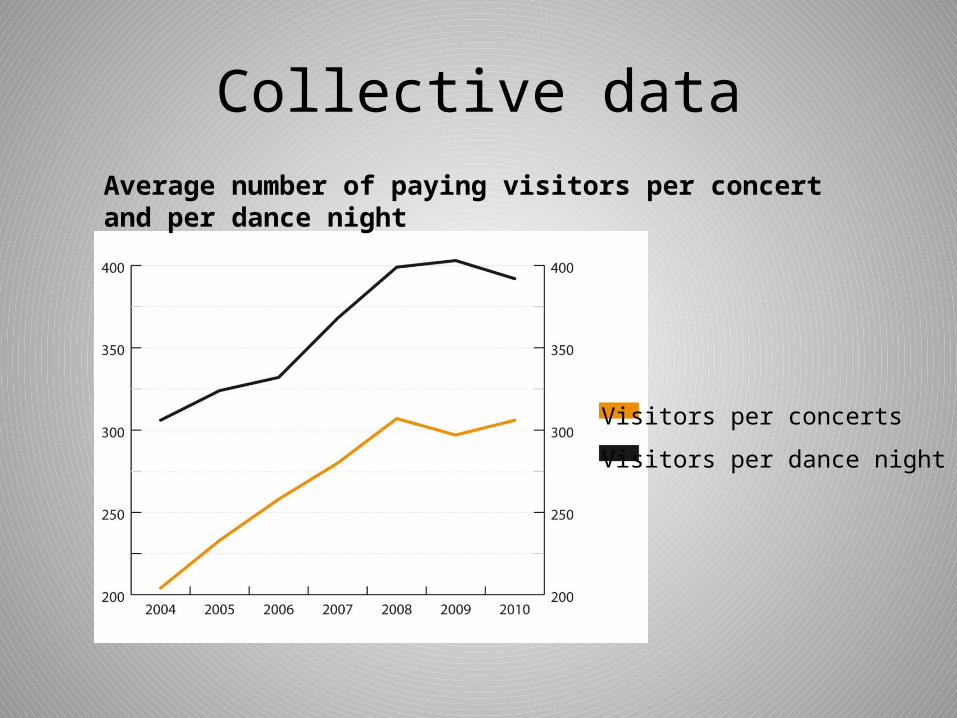
Visitors per concerts
Visitors per dance night
Average number of paying visitors per concert and per dance night
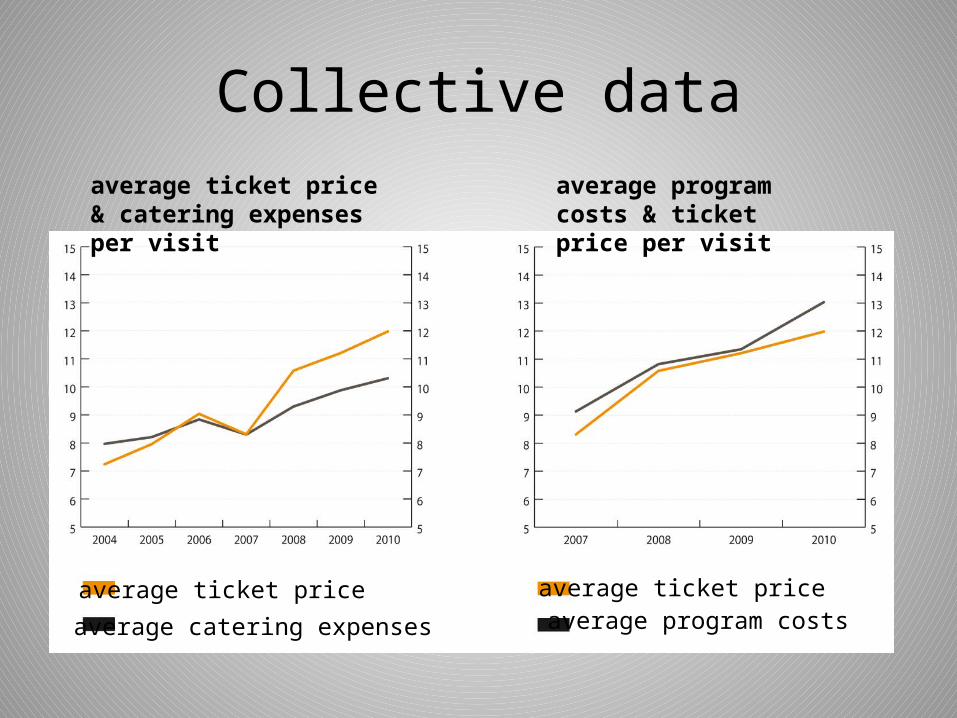
Collective dataaverage ticket price & catering expenses per visit
average program costs & ticket price per visit
average ticket price
average catering expenses
average ticket priceaverage program costs
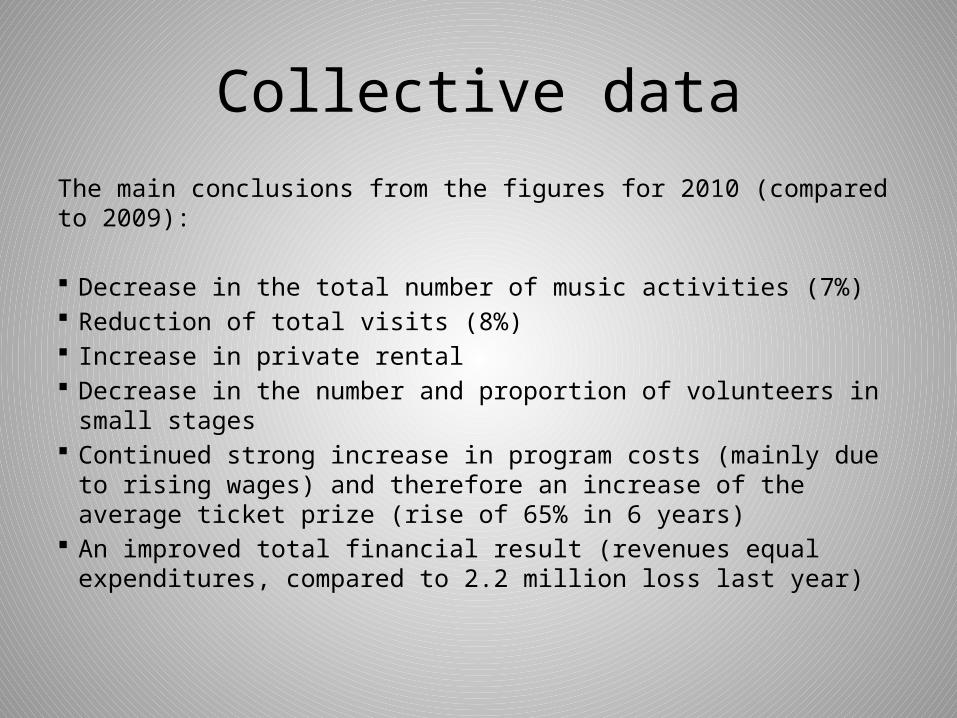
Collective dataThe main conclusions from the figures for 2010 (compared to 2009):
Decrease in the total number of music activities (7%) Reduction of total visits (8%) Increase in private rental Decrease in the number and proportion of volunteers in small stages Continued strong increase in program costs (mainly due to rising
wages) and therefore an increase of the average ticket prize (rise of 65% in 6 years)
An improved total financial result (revenues equal expenditures, compared to 2.2 million loss last year)
Collective data
• Annual publication ‘Music venues in figures’• Delivering data to ´Central Buro of Statistics´
(CBS) in the Netherlands• Delivering data to ‘Ministry of Culture’• Delivering data to ´Atlas for Municipalities´ in
the Netherlands• Delivering (some specific) data to National Tax
Authorities
Summary
• Better insight in your own organisation• Benchmark with other similar venues and improve• Trends and developments visible to participate on• Lobby instrument on a local, regional and national
level• Increasing attention from media and government• Tool for the industry association to determine policy
and strategy and set priorities• Facts instead of speculations and indications• Knowledge is power!

Any questions?