Embed Size (px)
Citation preview
Running Head: GRAPHIC ORGANIZER USEFULNESS IN SCIENCE 1
The Usefulness of Graphic Organizers in Enhancing Science Learning
Kristina Condidorio
St. John Fisher College
GRAPHIC ORGANIZER USEFULNESS IN SCIENCE 2
Abstract
The purpose of this study was to investigate how graphic organizers can be used to
further learning in science class. Graphic organizers facilitate learning in content areas by
providing clear visualizations of ideas and facilitating student reflection. Research was
conducted in a sixth grade science class with 25 students during a weather unit, and it was found
that in using graphic organizers in science class, students were successful in using the open-
endedness of graphic organizers to gain a more thorough understanding of concepts. In utilizing
literacy strategies like graphic organizers in the content areas, student learning and independence
is increased and they are more prepared to practice these skills independently throughout life.
GRAPHIC ORGANIZER USEFULNESS IN SCIENCE 3
The Usefulness of Graphic Organizers in Improving Science Learning
A successful language user utilizes language for a variety of purposes—knowledge
acquisition and communication among others. One indication of a successful language user is
the ability to utilize literacy skills across content areas. Likewise, an unsuccessful language user
struggles to understand information in content areas. Often teachers see students who are not
practicing literacy strategies that could assist the student in approaching new and foreign topics
such as those found in a science class. While teaching students about heat energy in the
atmosphere, students explored the ways that energy reaches Earth from the sun as well as ways
that heat energy can be transferred between objects. As they were learning these concepts,
students were referring to these topics interchangeably when, in actuality, they are two separate
ideas. By organizing the information visually, students have a more concrete description of the
concepts.
Science content can seem difficult, and even intimidating, to many students. If teachers,
however, encourage students to access those valuable reading and writing strategies in other
content areas, students will find new ways to think about the given content and therefore
internalize a more thorough understanding.
By specifically examining how students use graphic organizers in science, we see the
level at which these students are able to organize thoughts and information. Additionally, when
students effectively utilize graphic organizers to manage science knowledge, they are able to
organize and reflect upon information gathered. This process ultimately leads to a more
thorough understanding of the content.
GRAPHIC ORGANIZER USEFULNESS IN SCIENCE 4
Theoretical Framework
Literacy processes are complex entities that are constantly being influenced by changes
among society. As described by Freebody and Luke, “…literacy is a multifaceted set of social
practices with a material technology, entailing code breaking, participation with the knowledge
of the text, social uses of text, and analyses/critique of the text” (1990, p. 15). These oral and
written interactions with other members of society are “multifaceted” in the sense that every
literacy event is comprehensive, complex, and unique with many factors influencing its
effectiveness (Kucer, 2005). Because of the complexity of each literacy event, it is imperative
for students to understand how to best make use of literacy practices.
In order for students to successfully use language as they navigate various areas of their
lives, they must explore various strategies to do so. Additionally, students need to be reflective
in analyzing and choosing those strategies that work for them. The totality of literacy acquisition
evolves as a child constantly observes communication among others (Goodman, 2001; Kucer,
2005). With this, the child tries out language for him or herself, making necessary adjustments
throughout the process (Kucer, 2005). Still, the individual is always supported by those close to
him or her in generating meanings through literacy events (Goodman, 2001; Kucer, 2005).
Specifically, as a child begins to use language as he or she has observed, the child is compared to
a scientist in that he or she gathers information about oral and written language, generates
language rules and practices (or hypotheses) for each language form, tests those rules, and alters
the language practices accordingly (Kucer, 2005). Gee (2001) describes this process to be
acquisition (taking in something new subconsciously without formal teaching), as opposed to
learning (taking in something new consciously with teaching). So much is acquired during these
experiences that it is important for teachers to provide opportunities for this exploration and
GRAPHIC ORGANIZER USEFULNESS IN SCIENCE 5
construction (for example, workshop settings), and also to not be so quick to correct children the
first time around—guide them through figuring out language strategies in order to foster
meaningful experiences (Gee, 2001; Goodman, 2001; Kucer, 2005).
While a learner’s efforts are significant, Kucer (2005) states that often, while children are
acquiring the skills associated with literacy use, the process may seem like it is progressing in an
unnatural fashion full of advances and regressions. In examining the child as a scientist,
however, it is simply that the child is constantly making adjustments to his or her language
practices. In acquiring language behaviors in this organic fashion, children are truly learning and
internalizing language practices. To hone these independent learning skills across the content
areas, we need to provide opportunities for students to practice literacy skills. In using graphic
organizers in the content areas, students are given a balance of structure and independence that is
supportive of their learning.
Research Question
If literacy is understood to be a social practice through which children acquire knowledge
and graphic organizers are seen to support literacy learning by scaffolding learning experiences,
then it is important to ask the question In what ways do graphic organizers support student
learning of science concepts? In order to better understand how students use literacy strategies
in content areas, students’ uses of various graphic organizers in science class will be evaluated.
Through this process, it will be determined how students are using graphic organizers to increase
comprehension and what factors contribute to a higher level of comprehension.
GRAPHIC ORGANIZER USEFULNESS IN SCIENCE 6
Synthesis of Literature
What is a Graphic Organizer?
Simply stated, a graphic organizer is a “visual representation of knowledge” regarding a
certain concept (Bromley, Irwin-DeVitis, & Modlo, 1999). More specifically, graphic organizers
are arranged in a way that best shows the interrelatedness of pieces of information presented
(Horton, Lovitt, & Bergerud, 1990). When choosing a graphic organizer, it is essential to
consider the learning outcome for the concepts being taught; in doing so, the graphic organizer
will help the learner understand the material. Graphic organizers have been sorted into four
categories according to the interrelatedness of information to be presented in a particular graphic
organizer (Ermis, 2008; Struble, 2007). These categories include conceptual, hierarchical,
cyclical, and sequential.
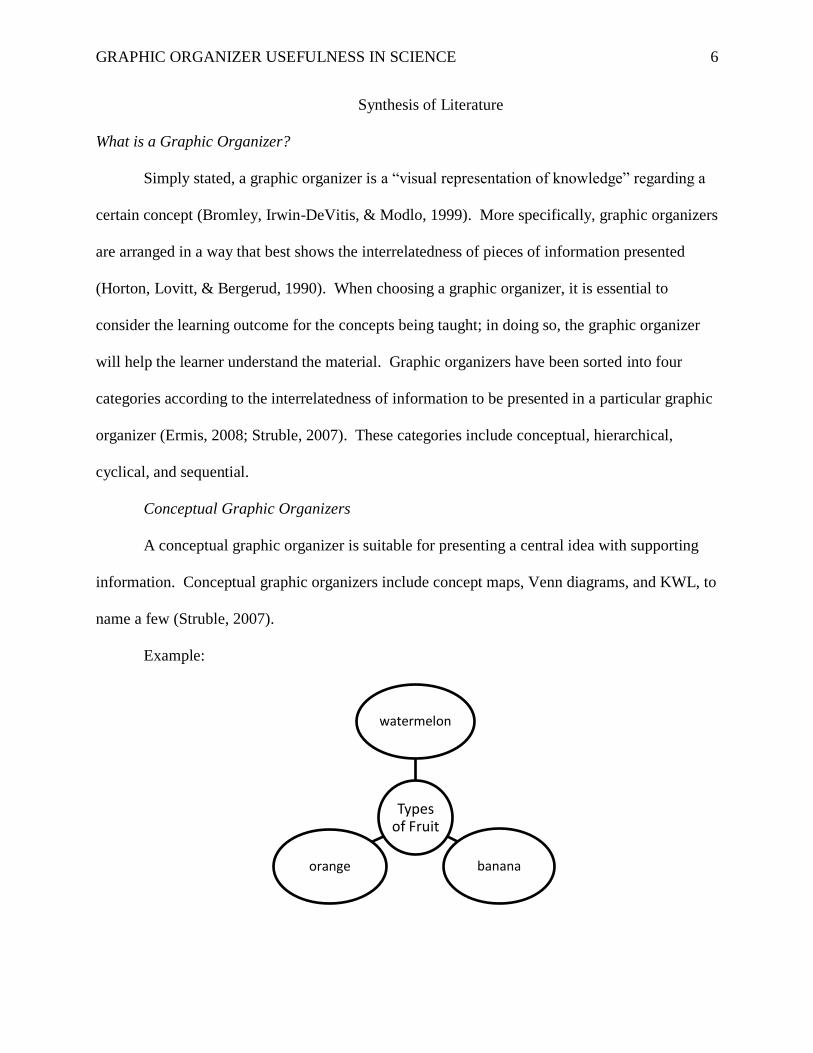
Conceptual Graphic Organizers
A conceptual graphic organizer is suitable for presenting a central idea with supporting
information. Conceptual graphic organizers include concept maps, Venn diagrams, and KWL, to
name a few (Struble, 2007).
Example:
Types of Fruit
watermelon
bananaorange
GRAPHIC ORGANIZER USEFULNESS IN SCIENCE 7
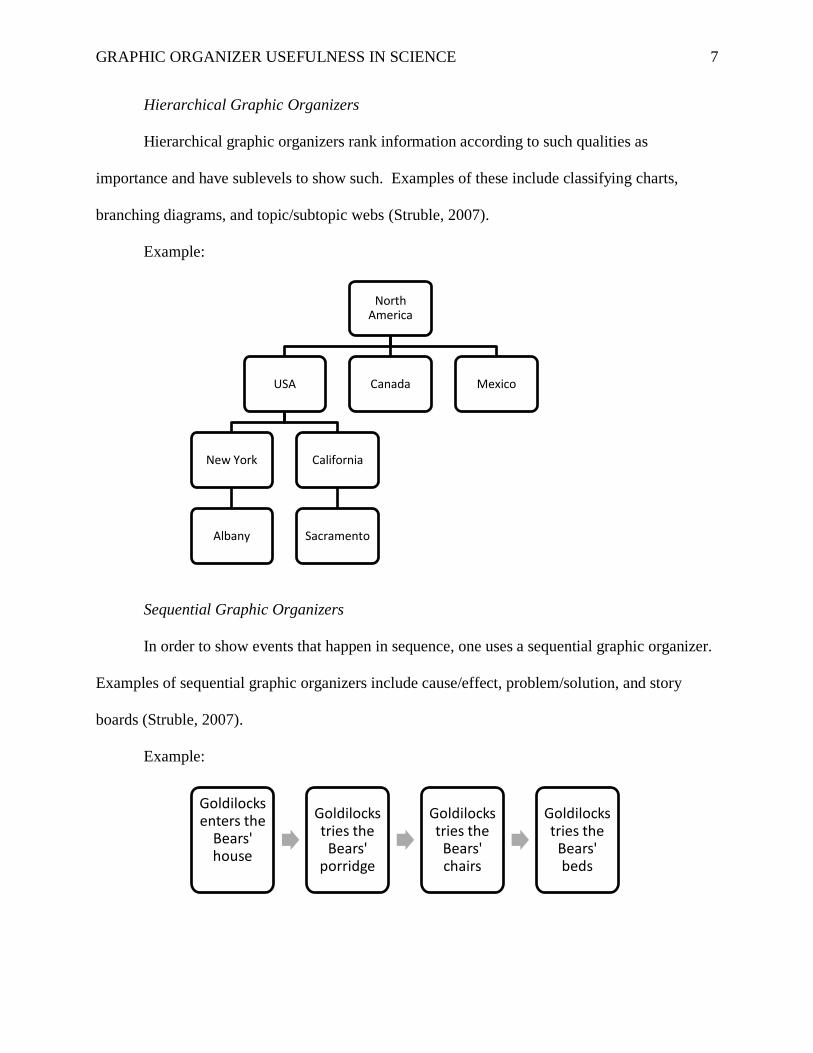
Hierarchical Graphic Organizers
Hierarchical graphic organizers rank information according to such qualities as
importance and have sublevels to show such. Examples of these include classifying charts,
branching diagrams, and topic/subtopic webs (Struble, 2007).
Example:
Sequential Graphic Organizers
In order to show events that happen in sequence, one uses a sequential graphic organizer.
Examples of sequential graphic organizers include cause/effect, problem/solution, and story
boards (Struble, 2007).
Example:
Goldilocks enters the
Bears' house
Goldilocks tries the
Bears' porridge
Goldilocks tries the
Bears' chairs
Goldilocks tries the
Bears' beds
North America
USA
New York
Albany
California
Sacramento
Canada Mexico
GRAPHIC ORGANIZER USEFULNESS IN SCIENCE 8
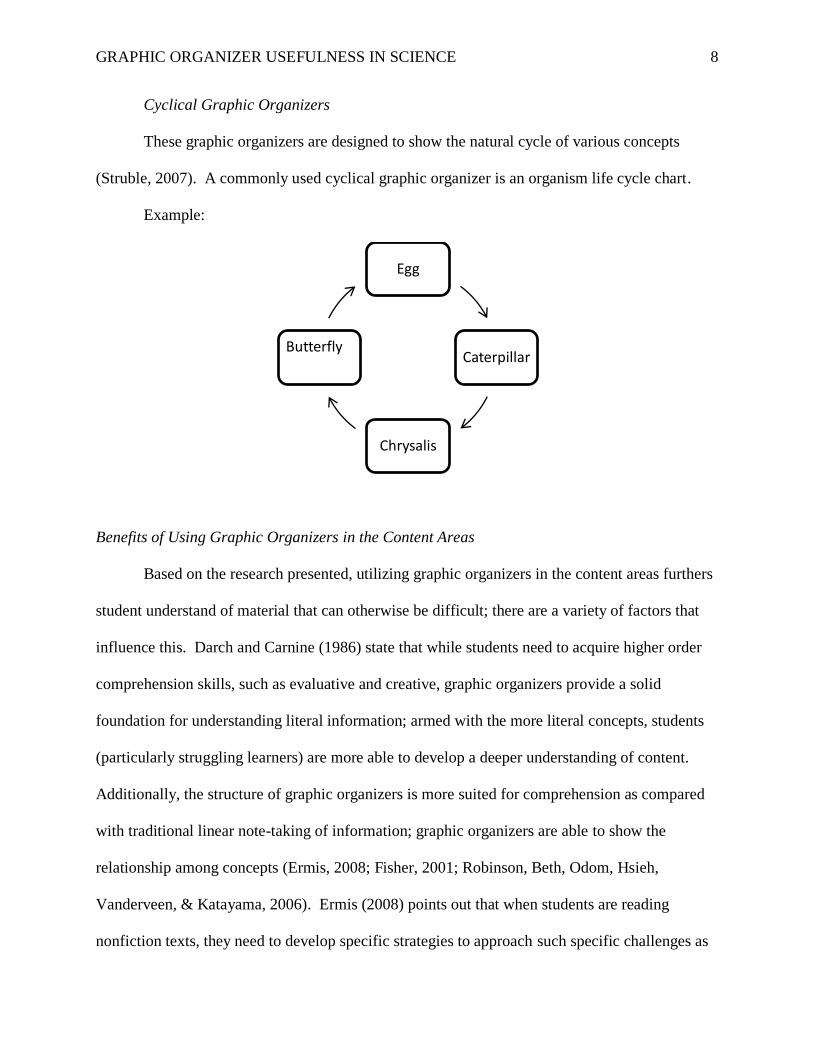
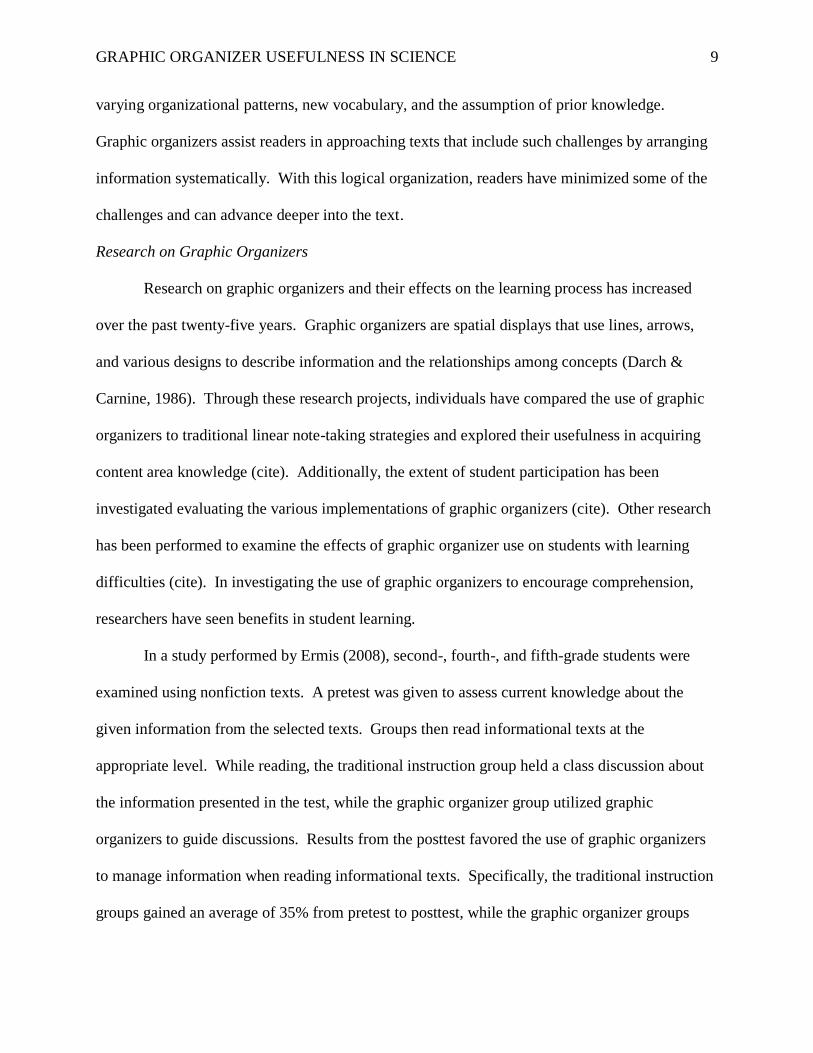
Cyclical Graphic Organizers
These graphic organizers are designed to show the natural cycle of various concepts
(Struble, 2007). A commonly used cyclical graphic organizer is an organism life cycle chart.
Example:
Benefits of Using Graphic Organizers in the Content Areas
Based on the research presented, utilizing graphic organizers in the content areas furthers
student understand of material that can otherwise be difficult; there are a variety of factors that
influence this. Darch and Carnine (1986) state that while students need to acquire higher order
comprehension skills, such as evaluative and creative, graphic organizers provide a solid
foundation for understanding literal information; armed with the more literal concepts, students
(particularly struggling learners) are more able to develop a deeper understanding of content.
Additionally, the structure of graphic organizers is more suited for comprehension as compared
with traditional linear note-taking of information; graphic organizers are able to show the
relationship among concepts (Ermis, 2008; Fisher, 2001; Robinson, Beth, Odom, Hsieh,
Vanderveen, & Katayama, 2006). Ermis (2008) points out that when students are reading
nonfiction texts, they need to develop specific strategies to approach such specific challenges as
Egg
Caterpillar
Chrysalis
Butterfly
GRAPHIC ORGANIZER USEFULNESS IN SCIENCE 9
varying organizational patterns, new vocabulary, and the assumption of prior knowledge.
Graphic organizers assist readers in approaching texts that include such challenges by arranging
information systematically. With this logical organization, readers have minimized some of the
challenges and can advance deeper into the text.
Research on Graphic Organizers
Research on graphic organizers and their effects on the learning process has increased
over the past twenty-five years. Graphic organizers are spatial displays that use lines, arrows,
and various designs to describe information and the relationships among concepts (Darch &
Carnine, 1986). Through these research projects, individuals have compared the use of graphic
organizers to traditional linear note-taking strategies and explored their usefulness in acquiring
content area knowledge (cite). Additionally, the extent of student participation has been
investigated evaluating the various implementations of graphic organizers (cite). Other research
has been performed to examine the effects of graphic organizer use on students with learning
difficulties (cite). In investigating the use of graphic organizers to encourage comprehension,
researchers have seen benefits in student learning.
In a study performed by Ermis (2008), second-, fourth-, and fifth-grade students were
examined using nonfiction texts. A pretest was given to assess current knowledge about the
given information from the selected texts. Groups then read informational texts at the
appropriate level. While reading, the traditional instruction group held a class discussion about
the information presented in the test, while the graphic organizer group utilized graphic
organizers to guide discussions. Results from the posttest favored the use of graphic organizers
to manage information when reading informational texts. Specifically, the traditional instruction
groups gained an average of 35% from pretest to posttest, while the graphic organizer groups
GRAPHIC ORGANIZER USEFULNESS IN SCIENCE 10
gained an average of 45% from pretest to posttest. These results greatly favor the use of graphic
organizers to monitor comprehension while reading informational texts.
Similarly, Darch and Carnine (1986) focused their research on fourth-, fifth-, and sixth-
grade students with learning disabilities to examine how the use of graphic organizers impacted
their learning in social studies and science classes. In this case, graphic organizers were used to
present information to students as opposed to review information with students as similar studies
have (cite). The individuals selected for research were twenty-four students who had been
classified as learning disabled by their school districts and were assigned to resource classrooms.
The two groups were taught the same content, but in two different ways—one group was taught
the information using graphic organizers while the second group used a method that involved
reading about the content and answering questions about the information. In analyzing pretests
and posttests, students taught using graphic organizers outperformed others by scoring an
average of 86% on the posttest compared to 56% for the text study group. An additional
consideration that was measured regards the students’ attitudes toward the learning process;
students in the graphic organizer group expressed more significantly that they felt as though they
learned a lot (Darch & Carnine, 1986).
In a similar study performed by Horton, Lovitt, and Bergerud (1990), the use of graphic
organizers was investigated using secondary students in social studies and science. In this case,
the researchers examined not only students with learning disabilities, but also students in general
education. Specifically, this study compared the use of teacher-directed graphic organizers and
self-study using graphic organizers. With the teacher-directed graphic organizers, the teacher
instructed students to read a text selection then led the class as they filled in the graphic
organizer, explaining how the pieces of information corresponded to one another. The self-
GRAPHIC ORGANIZER USEFULNESS IN SCIENCE 11
study, on the other hand, involved reading a selection, studying, and filling in the graphic
organizer independently. It was clear in this study that teacher-directed implementation of
graphic organizers was more effective in facilitating understanding; for example, students with
learning disabilities scored an average of 70% on the given assessment when taught with a
teacher-directed graphic organizer compared to 20% with self-study. The students in general
education scored an average of 86% with teacher direction and 56% with self-study (Horton,
Lovitt, & Bergerud, 1990). This study reinforces the results from the previous study in proving
that the use of graphic organizers in acquiring information is beneficial, but also furthers the
research in finding that graphic organizers are more effective when taught and explained by a
teacher.
As shown in Horton, Lovitt, and Bergerud’s study, certain implementations of graphic
organizers are more effective than others. Robinson et al. (2006) explored the use of partially-
complete graphic organizers in order to promote student independence. With partial graphic
organizers, students are provided with a graphic organizer that has portions already complete in
order to guide comprehension while students fill in the remainder of the graphic organizer
independently. Because this study was performed at the undergraduate level, researchers
compared partial graphic organizer use with completed graphic organizers; students who used
partial graphic organizers performed higher on the test than those students who received a
completed graphic organizer. What is more influential are the findings that students who were
given the partial graphic organizer were more likely to independently utilize graphic organizers
by the end of the course as compared to their independent note-taking style at the beginning of
the course (Robinson et al., 2006).
GRAPHIC ORGANIZER USEFULNESS IN SCIENCE 12
While completing graphic organizers, teachers have observed a higher level of
engagement, accountability, and creativity among the students (Fisher, 2001, Gieselmann, 2008,
and Robinson et al., 2006).
A long term, and highly valuable, outcome of utilizing graphic organizers to acquire
content is that it teaches students to evaluate and classify information according to a variety of
features. With this, students are involved in a multi-step process. This involves reading and
processing content, then organizing the information by judging aspects of the information. This
skill is one that is carried over to new situations and facilitates the learning process across
various concepts (Gieselmann, 2008).
Methods
In exploring the use of graphic organizers to further comprehension of science content, a
sixth grade class was examined. This 25-student class is part of Veteran Intermediate School,
which houses 1,000 fourth, fifth, and sixth grade students. Veteran is a large suburb of
Rochester, New York. Veteran Central School District has been designated a “high performing
school district” by New York State.
The class targeted in this study includes 25 students who are 11 and 12 years old. In the
class, there are thirteen boys and twelve girls. Twenty-four students are Caucasian and one
student is African American. Two of the students have 504 plans (hearing impairment and
attention deficit hyperactivity disorder), and one student is currently be classified with an
Individualized Education Plan for a learning disability. The researcher is also the classroom
teacher, who is a long-term substitute for the classroom. The teacher is in the classroom from
late January to mid-March; data collection occurred throughout the month of February. She is in
her second year of teaching and is new to Veteran Schools this year. Additionally, the teacher is
GRAPHIC ORGANIZER USEFULNESS IN SCIENCE 13
completing her Masters degree in literacy at Saint John Fisher College. Her certification areas
are in childhood education (grades one through six), special education (grades one through six),
early childhood education (birth through grade two), and dance education (kindergarten through
grade 12).
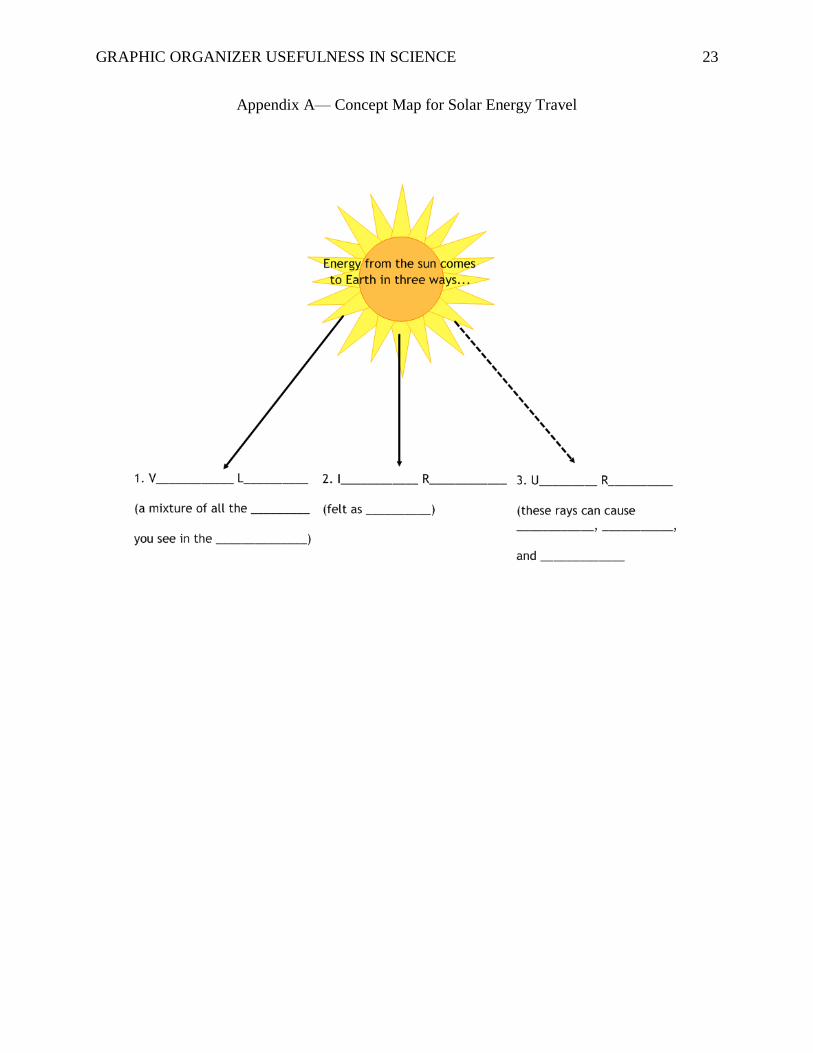
In order to examine the use of graphic organizers in science, graphic organizers were
integrated to science instruction during a weather and climate unit. Students were taught using
graphic organizers to show the interrelation of science concepts. Graphic organizers that were
used include a concept map for solar energy travel (Appendix A), a compare and contrast matrix
for heat transfer (Appendix B), a water cycle diagram (Appendix C), and a concept map for wind
types. These graphic organizers were used as teaching tools, as well as assessment tools. To
evaluate the impact that these graphic organizers had on student comprehension, the teacher used
observations and interviews. These observations were conducted each time that graphic
organizers were taught, which were four times over the course of three weeks. Observations
were made while teaching whole group science lessons by paying specific attention to student
engagement and participation with consideration to previous science lessons. With the solar
energy travel concept map and the heat transfer matrix, assessments were given to examine
student learning based on the content taught with those graphic organizers. For these
assessments, students were asked to organize content into graphic organizers, as well as use
graphic organizers to recall information learned. Finally, interviews were conducted with
students to understand their reflections on using graphic organizers (Appendix D). The
interviews were conducted in a conversation format with students presenting their reflections and
commenting on one another’s ideas.
GRAPHIC ORGANIZER USEFULNESS IN SCIENCE 14
Ensuring Trustworthiness
According to Mills (2007), researchers need to be aware of the credibility, transferability,
dependability, and confirmability of their studies. Credibility is the ability to be open-minded
about the variables that may arise during research. In order to ensure credibility in this study, I
have evaluated the use of graphic organizers from multiple perspectives including those of both
the teacher and the students. Additionally, data was collected through observation, interviews,
and student work to take into account various perspectives on graphic organizers. Transferability
is the understanding that data is specific to the situation in which it is occurring and being able to
appropriately evaluate the effects of the context of the research (Mills, 2007). The researcher
considered the data and its context specifically so that transferability was present. Mills (2007)
also describes the importance of dependability in action research. Dependability refers to the
strength of research in that the methods reinforce one another. My research was dependable in
that multiple sources of data were considered and each supported one another. Finally, the
confirmability of research is lack of bias in a study (Mills, 2007). This was achieved by
comparing and contrasting sources of data. It also was accomplished by examining the research
for subjectivity throughout the process.
Data Collection
Data collection for this study included teacher reflection, student interviews, and
gathering student work samples. Teacher reflections were recorded after teaching lessons that
involved the use of graphic organizers. Reflections alluded to the teaching process, student
receptivity, and student participation. Student interviews were also conducted; these involved
discussions with students concerning their perspectives on using graphic organizers and the
impact they had on their learning. Finally, student work was gathered and analyzed according to
GRAPHIC ORGANIZER USEFULNESS IN SCIENCE 15
the students’ abilities to use the information learned through the graphic organizers and transfer
it to other contexts.
Findings
In implementing graphic organizers in a sixth grade science class and gathering
reflections from the students who used them, four themes emerged. For each of those themes,
the greatest amount of information was gathered in my teaching observations and discussions
with students. Various observations were made regarding student participation and ownership,
idea accessibility, visual representation, and idea substitution.
Student Participation and Ownership
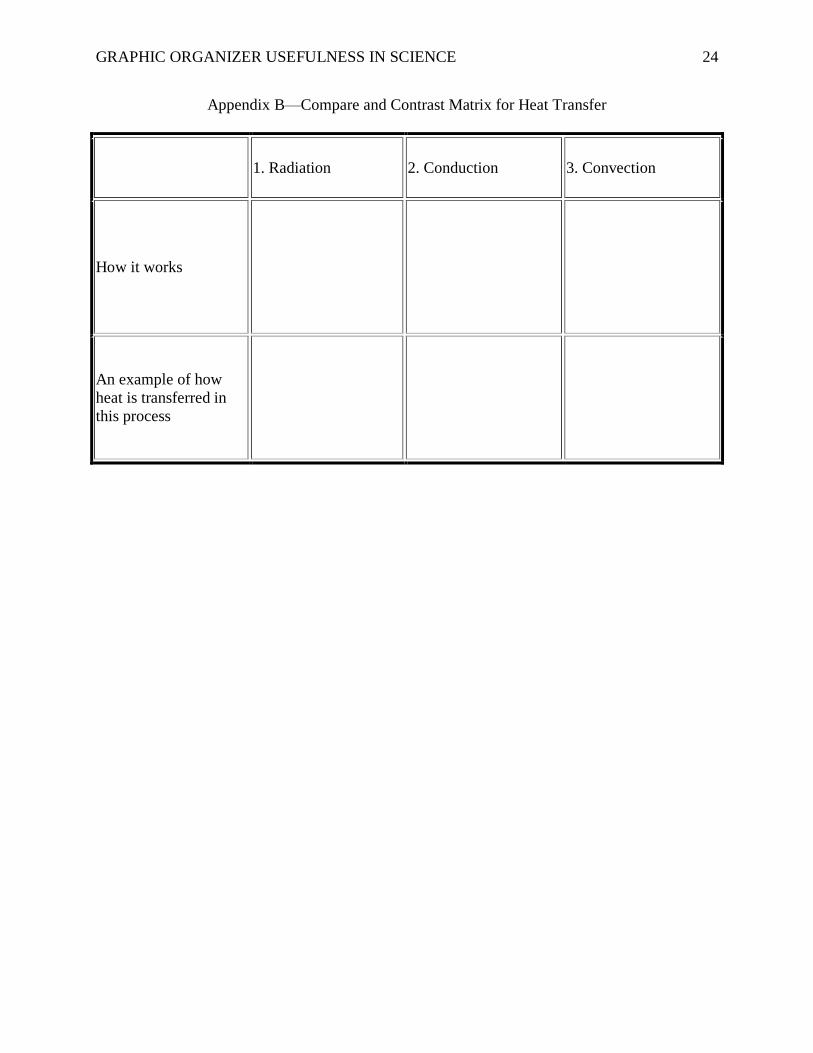
As with any class activity, participation levels among students varied greatly. Darch and
Carnine (1986) describe a benefit of graphic organizers to be the ability to address various depths
of comprehension; my research had similar findings. As evidenced by students’ graphic
organizers, particularly the heat transfer chart, the degree of student ownership varied (in this
case, “student ownership” refers to the degree to which students independently utilized the
graphic organizer to extend comprehension). For example, when students utilized a chart to
describe the three types of heat transfer and provide examples, some students restated heat
transfer examples as discussed during the whole group conversation, which demonstrates a lesser
level of ownership. Others, however, demonstrated the ability to extend and transfer knowledge
about each type of heat transfer to everyday scenarios.
This is indication as to how graphic organizers were used to address students’ varying
levels of comprehension and readiness for extension. Graphic organizers provided differentiated
material in that students were free to customize ideas to their own thought processes and
establish a solid foundation for extending knowledge. Again, for those students who were not
GRAPHIC ORGANIZER USEFULNESS IN SCIENCE 16
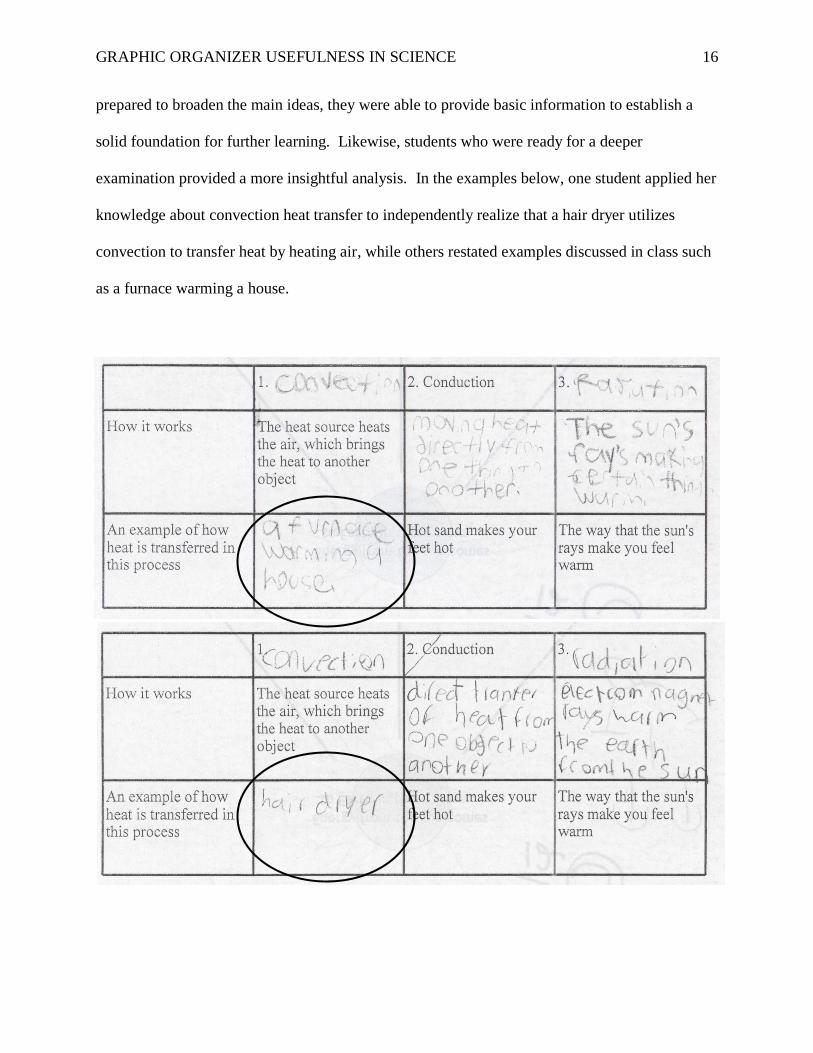
prepared to broaden the main ideas, they were able to provide basic information to establish a
solid foundation for further learning. Likewise, students who were ready for a deeper
examination provided a more insightful analysis. In the examples below, one student applied her
knowledge about convection heat transfer to independently realize that a hair dryer utilizes
convection to transfer heat by heating air, while others restated examples discussed in class such
as a furnace warming a house.
GRAPHIC ORGANIZER USEFULNESS IN SCIENCE 17
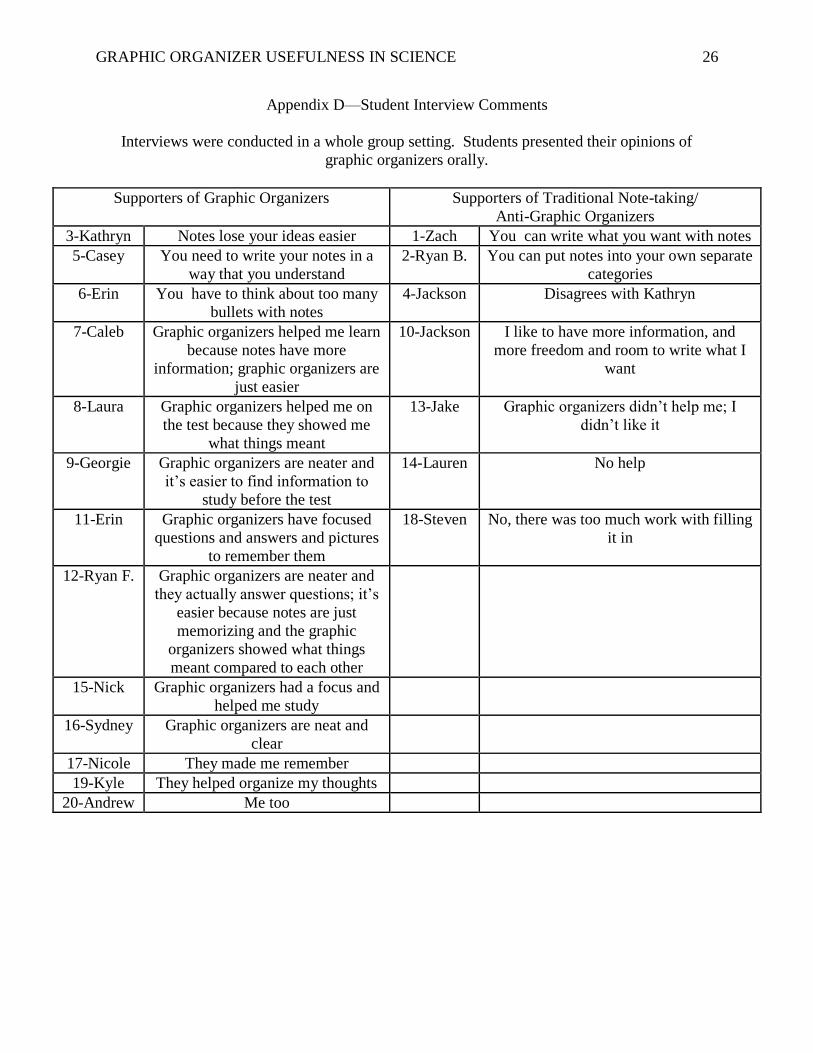
Idea Accessibility
According to student interviews (Appendix D), most students found that ideas arranged
in a graphic organizer were more easily processed when compared with “note-taking.” This
group of students refers to note-taking as using fill-in-the-blank statements and lists (not
including hierarchical outlines). Multiple students alluded to the fact that graphic organizers
allow them to neatly and clearly organize information. With this, they found that it helped them
process and retain the information more efficiently. Additionally, students pointed out that the
use of graphic organizers was effective in recalling information on tests. Specifically, some
students utilized the graphic organizers as a study tool while others referenced them to make
flashcards of the content. One student shared that “graphic organizers have a focus and helped
me study.” While I do not believe that students should see a test as a goal compared to the
ultimate learning that can occur, knowledge on tests represents a longer retention of information.
By using graphic organizers to process information, students felt as though they could retain the
information for a longer period of time when compared with note-taking.
Visual Representation
A key realization demonstrated by the students’ reflections on the use of graphic
organizers in learning science content was the visual representation of information and its
interconnectivity. Students shared that by organizing information in such a way that shows
relationships among ideas, they were able to understand the content more readily. A student
explained that “graphic organizers are neater and they actually answer questions; it’s easier
because notes are just memorizing and the graphic organizers showed what things meant
compared to each other.” This student is expressing that graphic organizers help him relate ideas
to one another because of their visual qualities.
GRAPHIC ORGANIZER USEFULNESS IN SCIENCE 18
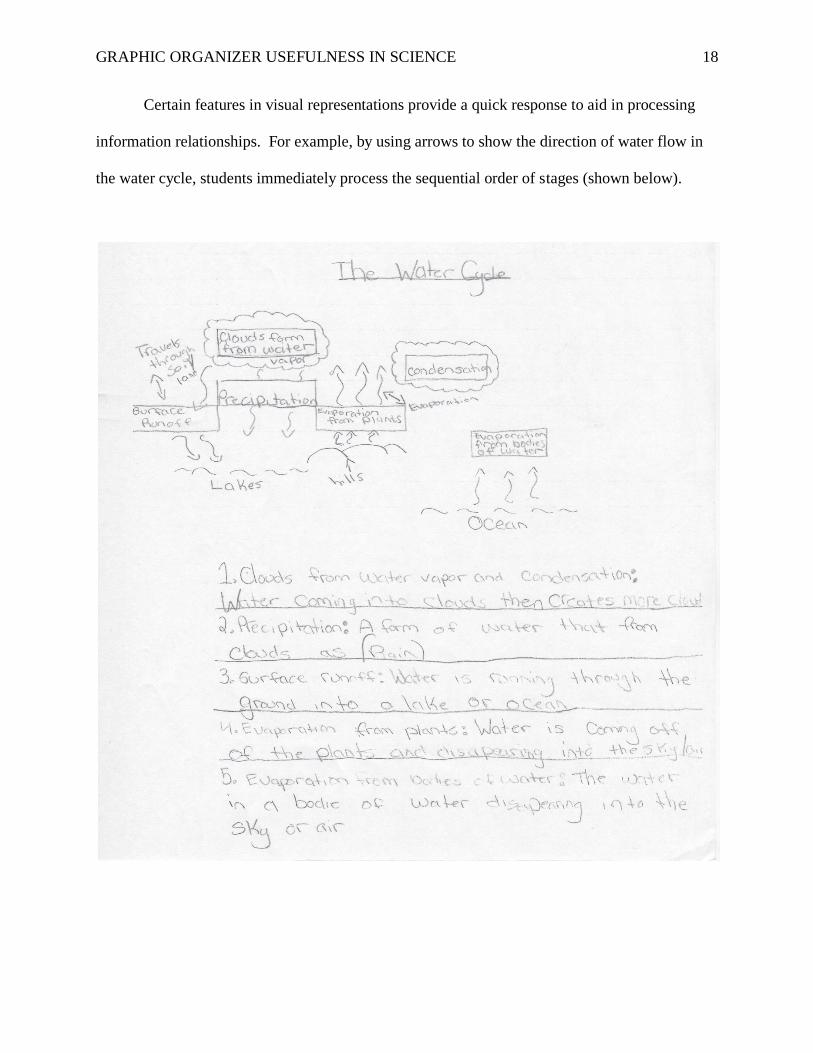
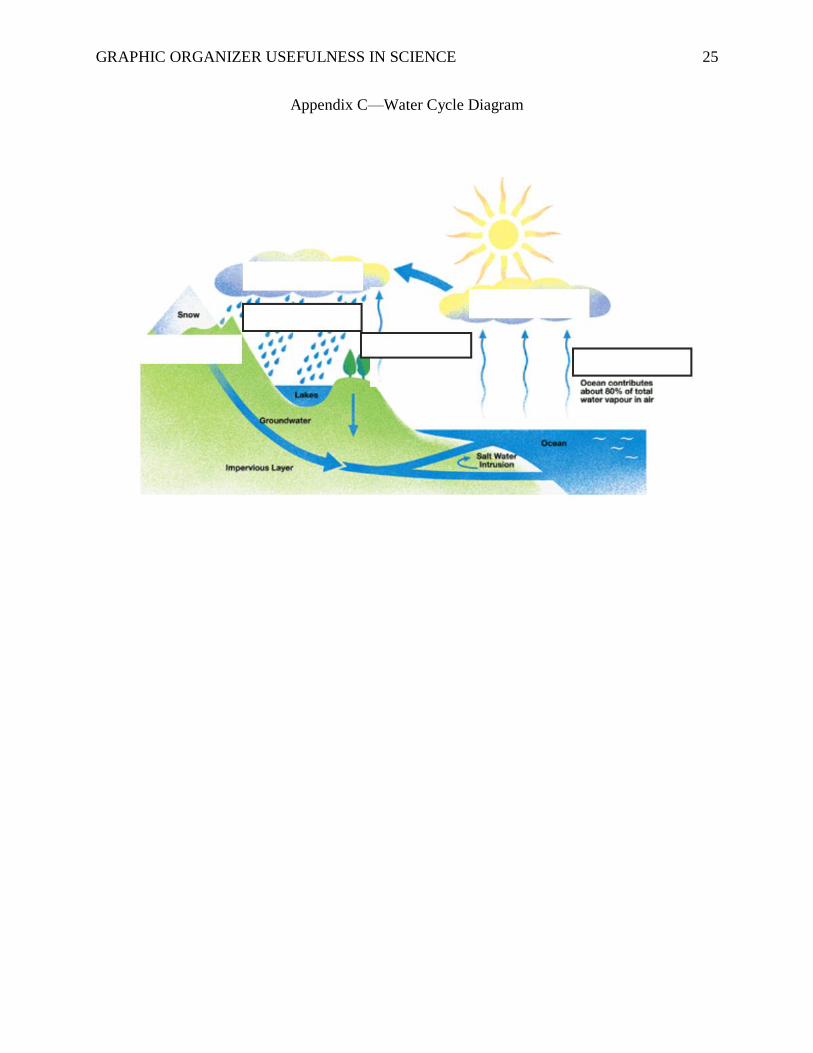
Certain features in visual representations provide a quick response to aid in processing
information relationships. For example, by using arrows to show the direction of water flow in
the water cycle, students immediately process the sequential order of stages (shown below).
GRAPHIC ORGANIZER USEFULNESS IN SCIENCE 19
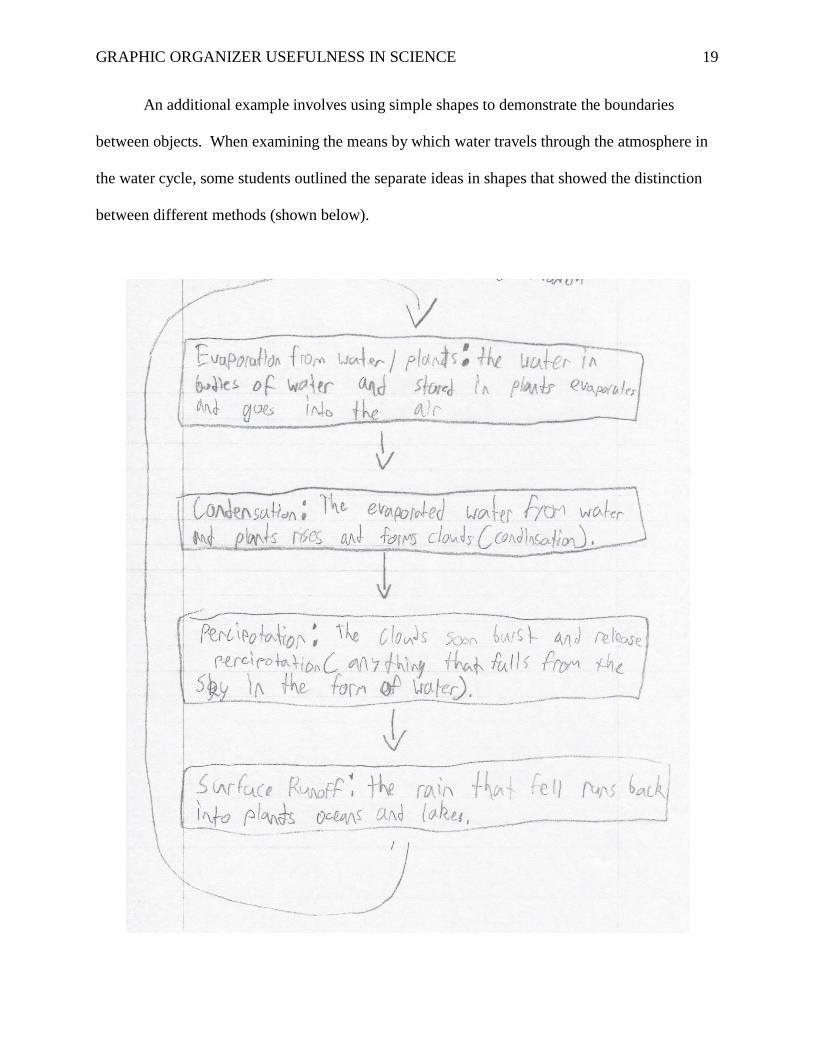
An additional example involves using simple shapes to demonstrate the boundaries
between objects. When examining the means by which water travels through the atmosphere in
the water cycle, some students outlined the separate ideas in shapes that showed the distinction
between different methods (shown below).
GRAPHIC ORGANIZER USEFULNESS IN SCIENCE 20
A final example involves demonstrating the hierarchy and categorization of ideas. In
using organizers that show the “umbrella” idea and exhibit the specificity of information,
learners can store that information more efficiently. While the effects of specific features of
graphic organizers such as outlines and arrows cannot be measured accurately by my data, my
observations suggest that they are helpful in facilitating comprehension as shared by students
when discussing the usefulness of graphic organizers. In listening to students reflect on graphic
organizer use, their statements exemplified independence in learning the ideas by saying things
like “graphic organizers helped me on the test because they showed me what things meant” and
“they made me remember.”
Idea Substitution
In using graphic organizers to facilitate student comprehension of science content, there
was one hindrance observed. During one lesson, the class examined two closely related topics—
solar energy travel and heat transfer. Solar energy travel refers to the three ways that energy
reaches Earth from the sun and heat transfer refers to how heat energy can be moved from one
substance to another. A graphic organizer was used for each—a conceptual map for solar energy
travel and a chart for heat transfer. When discussing the two areas, some students substituted
the term that refer to types of heat transfer for solar energy travel and vice versa. My reflections
accredit this to two issues. The first is that there are three types for each (heat transfer and solar
energy travel) and the second is that the topics were taught on the same day. Even though
students demonstrated difficulty deciphering these two topics in this case, I do not believe that it
can be accredited to the use of graphic organizers. However, in the future, I would teach these
topics separately to avoid confusion or even utilize a hierarchical graphic organizer to show that
heat transfer between substances occurs once energy has reached Earth.
GRAPHIC ORGANIZER USEFULNESS IN SCIENCE 21
Implications and Conclusion
Based on the information gathered through studying literature and classroom research,
graphic organizers facilitate student comprehension of science content by showing the
interrelatedness of ideas, providing visual cues to help students process the information, and
allowing students to direct their own learning by keeping graphic organizers open to
interpretation and independent thinking. In using graphic organizers as a teaching tool, teachers
can provide differentiated instruction suited for all learners’ needs as well as a format that is
easily accessible for students. While science topics may seem abstract, graphic organizers are a
tool to facilitate understanding. More than facilitating understanding, however, I found that in
using graphic organizers to learn science concepts, students took on a more reflective and
accountable role in learning the information.
In this research, I found certain choices to be significant in utilizing graphic organizers in
my sixth grade science class. First, graphic organizers are most effective when chosen carefully.
It is important to examine the various types of graphic organizers and select the one that best
matches targeted learning outcome of the specific content and your students’ learning styles.
Second, as with any lesson, provide appropriate scaffolding to support the varying needs of all
students; students need instruction and practice in using graphic organizers but also can thrive on
the open-endedness of graphic organizers. Finally, once students are ready, broaden the use of
graphic organizers; students can use them independently and teachers can use them as
assessment tools.
Students can constantly use literacy skills to further their learning. In encouraging
independence in student understanding, we can teach students to be literacy practitioners by
using literacy strategies across all content areas. Graphic organizers can be used as tools to

GRAPHIC ORGANIZER USEFULNESS IN SCIENCE 22
facilitate student understanding. In using them, teachers can help students develop effective
strategies in approaching difficult material to further lifelong learning.
GRAPHIC ORGANIZER USEFULNESS IN SCIENCE 23
Appendix A— Concept Map for Solar Energy Travel
GRAPHIC ORGANIZER USEFULNESS IN SCIENCE 24
Appendix B—Compare and Contrast Matrix for Heat Transfer
1. Radiation 2. Conduction 3. Convection
How it works
An example of how
heat is transferred in
this process
GRAPHIC ORGANIZER USEFULNESS IN SCIENCE 25
Appendix C—Water Cycle Diagram
GRAPHIC ORGANIZER USEFULNESS IN SCIENCE 26
Appendix D—Student Interview Comments
Interviews were conducted in a whole group setting. Students presented their opinions of
graphic organizers orally.
Supporters of Graphic Organizers Supporters of Traditional Note-taking/
Anti-Graphic Organizers
3-Kathryn Notes lose your ideas easier 1-Zach You can write what you want with notes
5-Casey You need to write your notes in a
way that you understand
2-Ryan B. You can put notes into your own separate
categories
6-Erin You have to think about too many
bullets with notes
4-Jackson Disagrees with Kathryn
7-Caleb Graphic organizers helped me learn
because notes have more
information; graphic organizers are
just easier
10-Jackson I like to have more information, and
more freedom and room to write what I
want
8-Laura Graphic organizers helped me on
the test because they showed me
what things meant
13-Jake Graphic organizers didn’t help me; I
didn’t like it
9-Georgie Graphic organizers are neater and
it’s easier to find information to
study before the test
14-Lauren No help
11-Erin Graphic organizers have focused
questions and answers and pictures
to remember them
18-Steven No, there was too much work with filling
it in
12-Ryan F. Graphic organizers are neater and
they actually answer questions; it’s
easier because notes are just
memorizing and the graphic
organizers showed what things
meant compared to each other
15-Nick Graphic organizers had a focus and
helped me study
16-Sydney Graphic organizers are neat and
clear
17-Nicole They made me remember
19-Kyle They helped organize my thoughts
20-Andrew Me too
GRAPHIC ORGANIZER USEFULNESS IN SCIENCE 27
References
Darch, C., & Carnine, D. (1986). Teaching content area material to learning disabled students.
Exceptional Children, 240-246.
Ermis, S. (2008). Using graphic organizers to facilitate elementary students' comprehension of
informational text. College Reading Association Yearbook , 87-102.
Fisher, A. (2001). Implementing graphic organizer notebooks: The art and science of teaching
content. The Reading Teacher , 116-120.
Freebody, P., & Luke, A. (1990). 'Literacies' programs: Debates and demands in cultural context.
Prospect, 5(3), 7-16.
Gee, J.P. (2001). Literacy, discourse, and linguistics: Introduction and what is literacy? In E.
Cushman, E.R. Kintgen, B.M. Kroll, & M. Rose (Eds.), Literacy: A critical sourcebook
(pp. 525-544). Boston, MA: Bedford/St. Martin’s.
Gieselmann, S. (2008). Graphic organizers in the social studies classroom: Effective content
integration tools for preservice teachers. Kentucky Journal of Excellence in College
Teaching and Learning , 19-30.
Goodman, Y. (2001). The development of initial literacy. In E. Cushman, E.R. Kintgen, B.M.
Kroll, & M. Rose (Eds.), Literacy: A critical sourcebook (pp. 316-324). Boston, MA:
Bedford/St. Martin’s.
Grant, K. (2009). Beyond graphic organizers: Why inspiration is a quintessential UDL tool.
Special Education Technology Practice , 28-37.
Horton, S., Lovitt, T., & Bergerud, D. (1990). The effectiveness of graphic organizers for three
classifications of secondary students in content area classes. Journal of Learning
Disabilities , 12-29.
GRAPHIC ORGANIZER USEFULNESS IN SCIENCE 28
Kucer, S. (2005). Dimensions of literacy: A conceptual base for teaching reading and writing in
school settings. Mahwah, NJ: Lawrence Erlbaum Associates, Inc., Publishers.
Martin, D.J. (2006). Elementary science methods: A constructivist approach. Belmont, CA:
Thompson Wadsworth.
Robinson, D., Beth, A., Odom, S., Hsieh, Y.-P., Vanderveen, A., & Katayama, A. (2006).
Increasing text comprehension and graphic note taking using a partial graphic organizer.
The Journal of Educational Research , 103-111.
Simmons, D., Griffin, C., & Kameenui, E. (1988). Effects of teacher-constructed pre- and post-
graphic organizer instruction on sixth-grade science students' comprehension and recall.
Journal of Educational Research , 15-21.
Struble, J. (2007). Using graphic organizers as formative assessment. Science Scope , 69-71.