Embed Size (px)
Citation preview
Stateof the
Eastside
October 2014Eastside Planning
Council
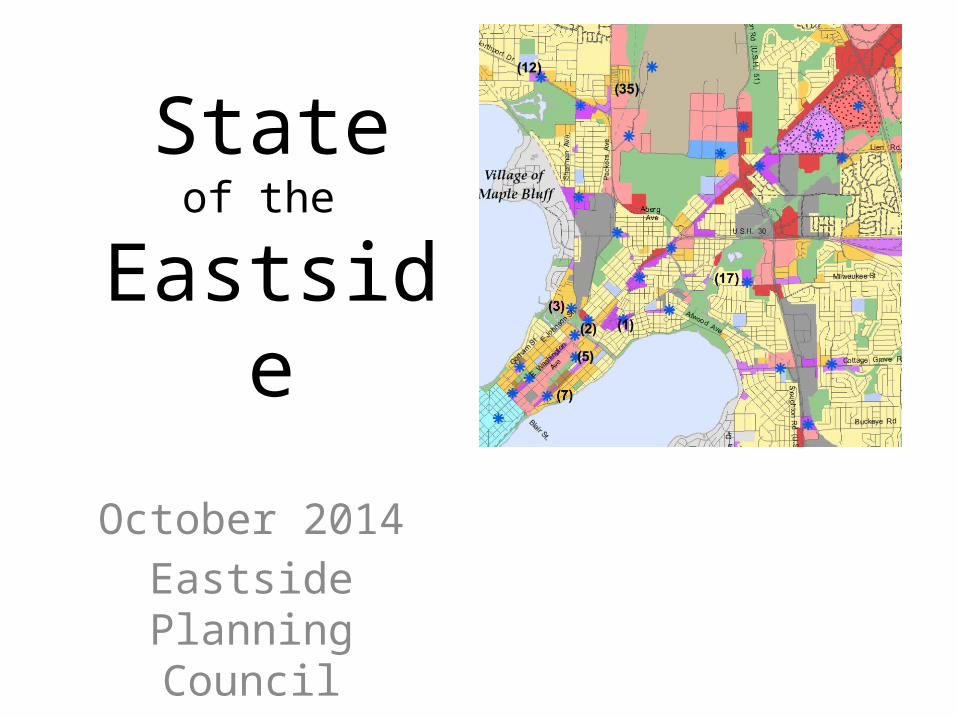
Process
• Demographic, geographic, programmatic, and economic research (secondary data)
• Five (5) public input meetings throughout the spring and summer (primary data)
• Draft release – Annual Meeting• Submittal of report – November 1• Use report as guiding document for 2015
advocacy and engagement
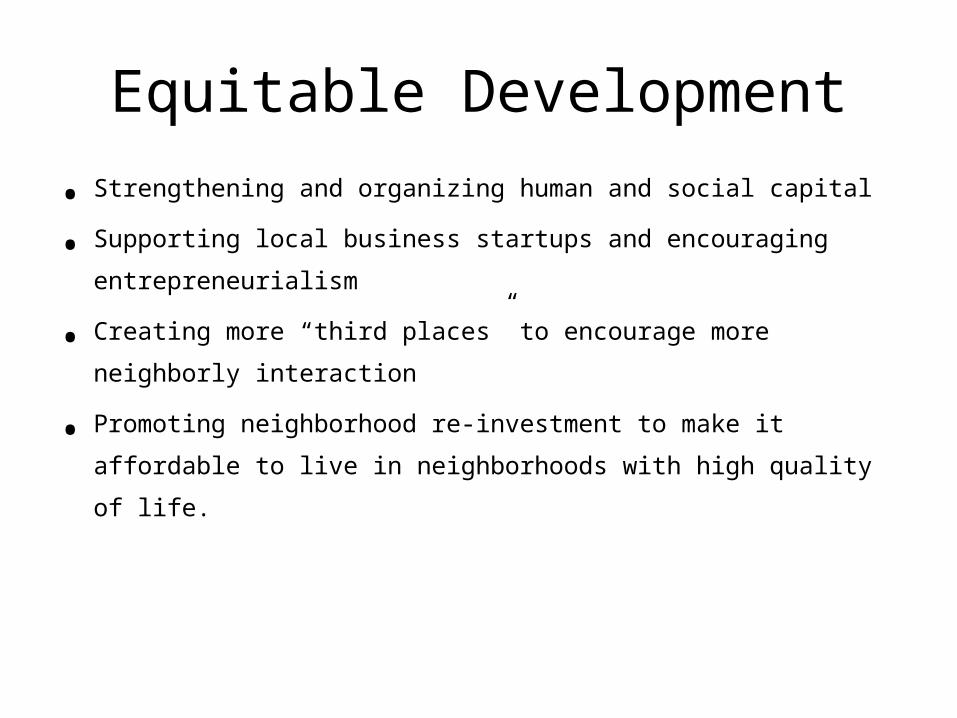
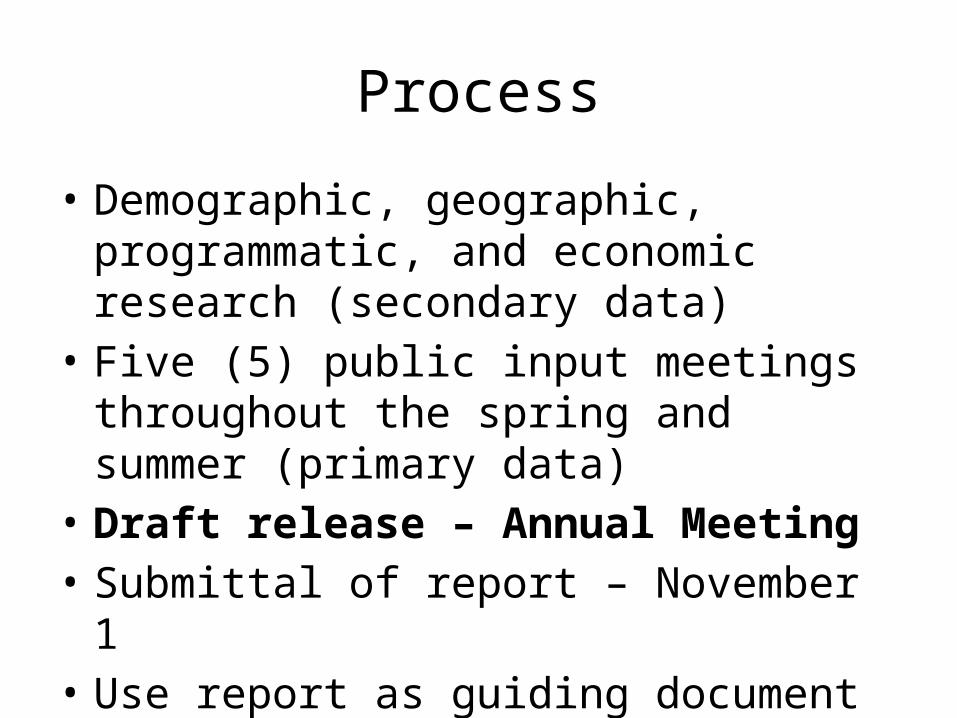
Equitable Development
• Strengthening and organizing human and social capital
• Supporting local business startups and encouraging entrepreneurialism
• Creating more “third places” to encourage more neighborly interaction
• Promoting neighborhood re-investment to make it affordable to live in
neighborhoods with high quality of life.
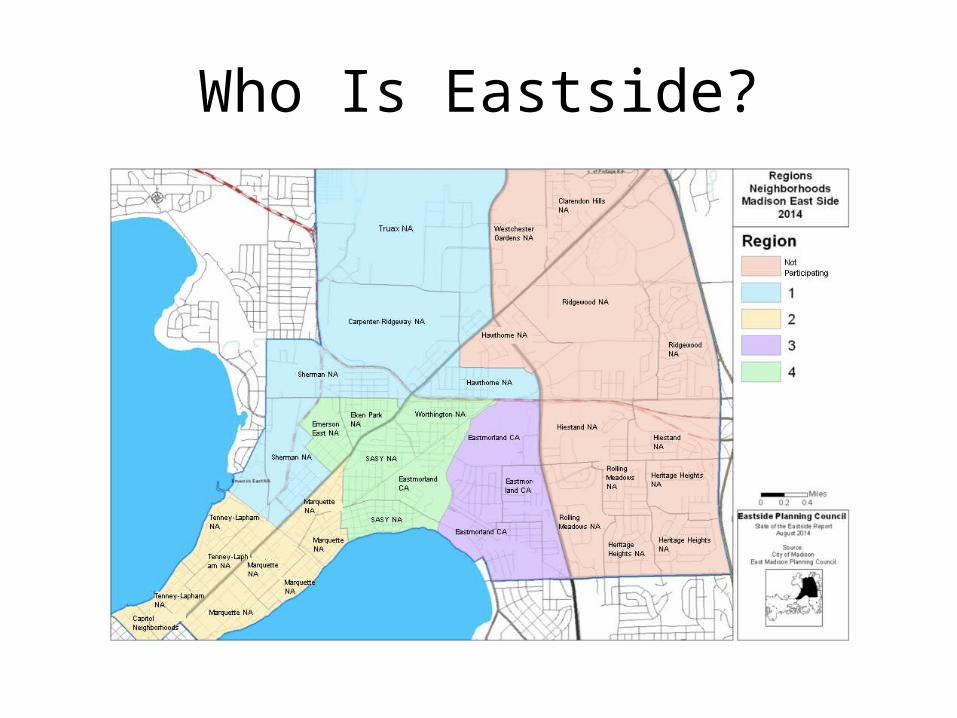
Who Is Eastside?
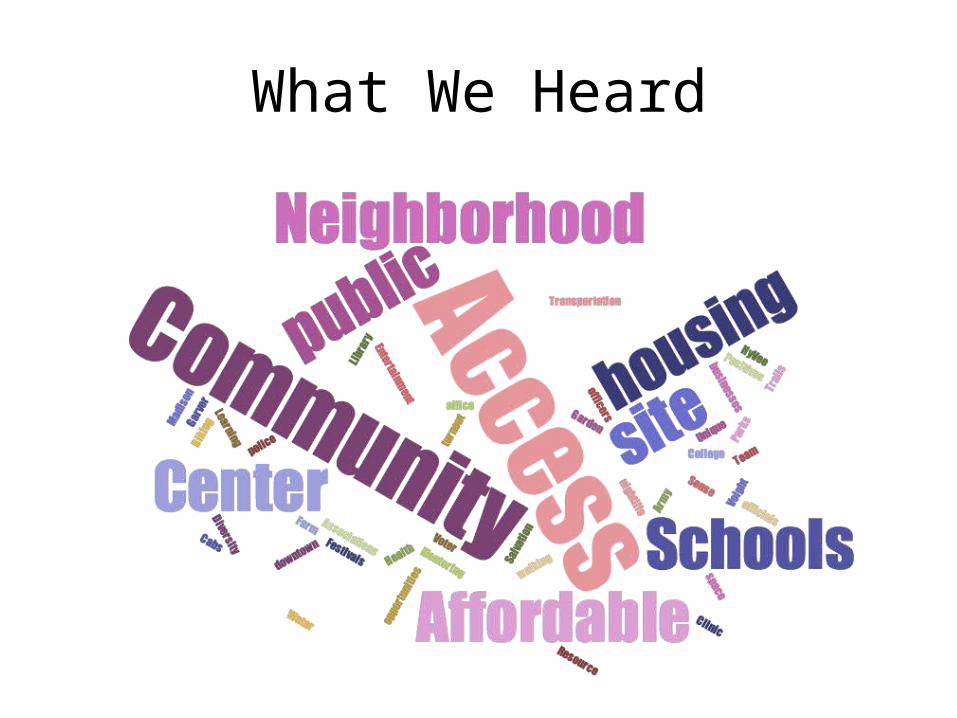
What We Heard
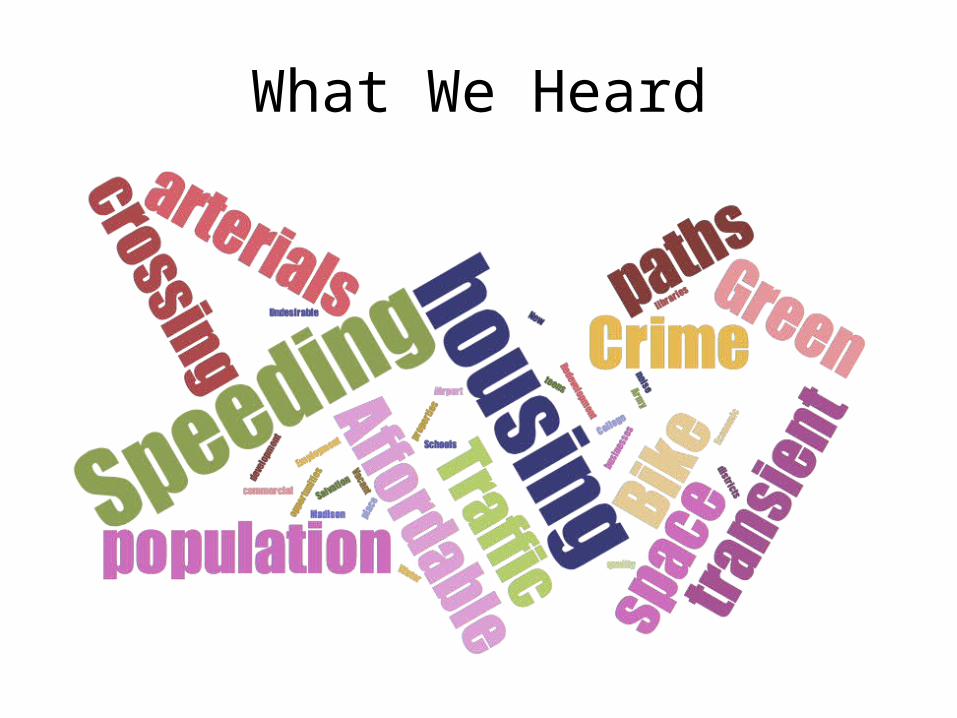
What We Heard
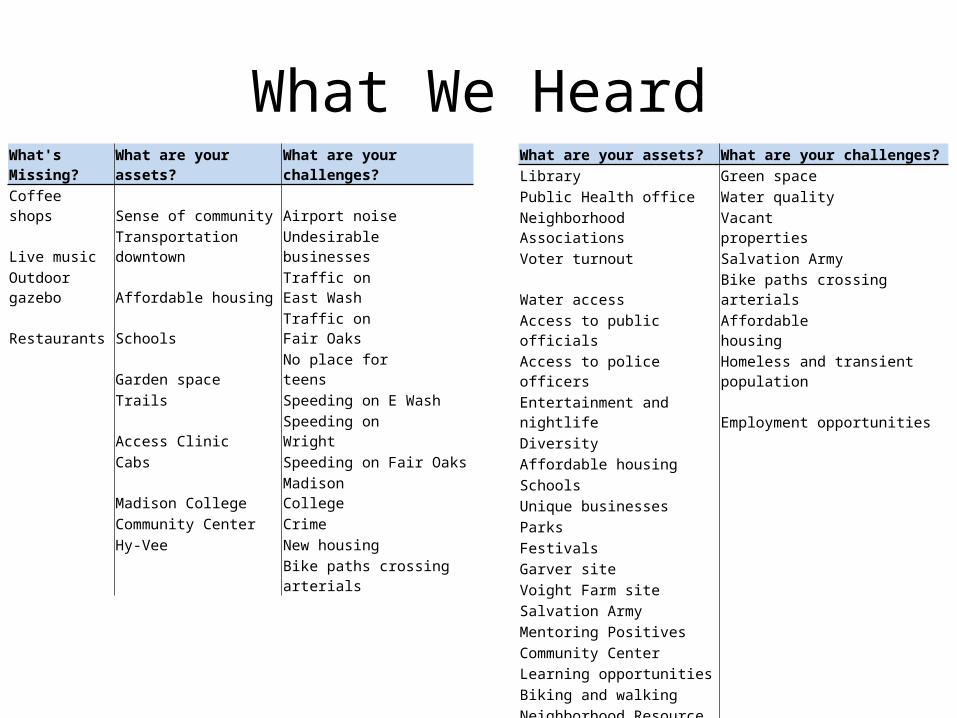
What We HeardWhat's Missing? What are your assets? What are your challenges?Coffee shops Sense of community Airport noiseLive music Transportation downtown Undesirable businessesOutdoor gazebo Affordable housing Traffic on East WashRestaurants Schools Traffic on Fair Oaks Garden space No place for teens Trails Speeding on E Wash Access Clinic Speeding on Wright Cabs Speeding on Fair Oaks Madison College Madison College Community Center Crime Hy-Vee New housing Bike paths crossing arterials
What are your assets? What are your challenges?Library Green spacePublic Health office Water qualityNeighborhood Associations Vacant propertiesVoter turnout Salvation ArmyWater access Bike paths crossing arterialsAccess to public officials Affordable housingAccess to police officers Homeless and transient populationEntertainment and nightlife Employment opportunitiesDiversityAffordable housingSchoolsUnique businessesParksFestivalsGarver siteVoight Farm siteSalvation ArmyMentoring PositivesCommunity CenterLearning opportunitiesBiking and walkingNeighborhood Resource Team
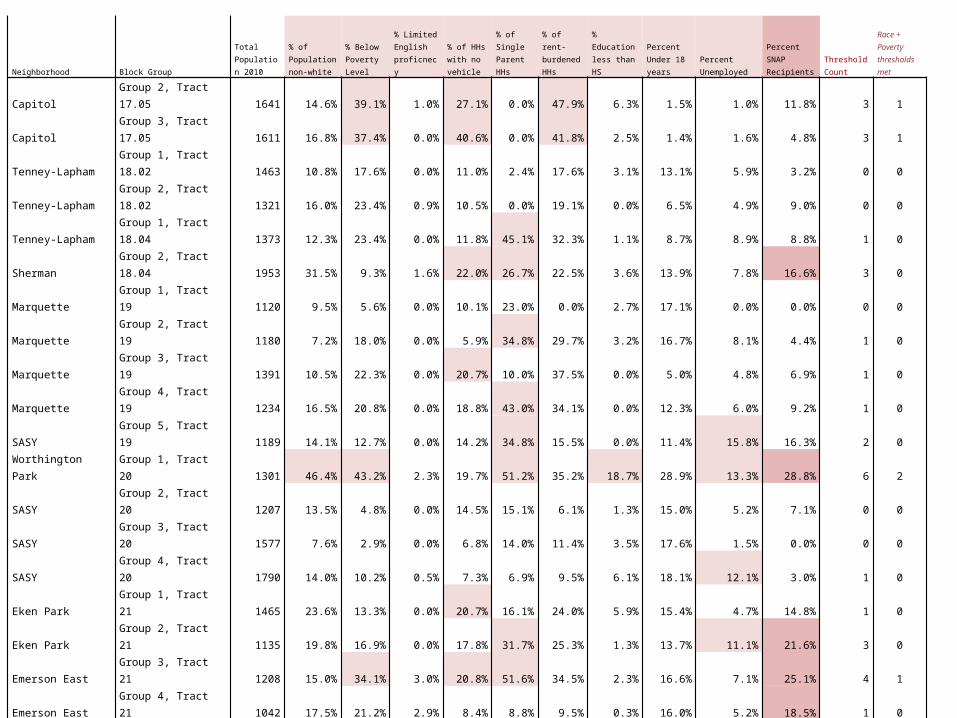
Neighborhood Block Group
Total Population 2010
% of Population non-white
% Below Poverty Level
% Limited English proficnecy
% of HHs with no vehicle
% of Single Parent HHs
% of rent-burdened HHs
% Education less than HS
Percent Under 18 years
Percent Unemployed
Percent SNAP Recipients
Threshold Count
Race + Poverty thresholds met
Capitol Group 2, Tract 17.05 1641 14.6% 39.1% 1.0% 27.1% 0.0% 47.9% 6.3% 1.5% 1.0% 11.8% 3 1Capitol Group 3, Tract 17.05 1611 16.8% 37.4% 0.0% 40.6% 0.0% 41.8% 2.5% 1.4% 1.6% 4.8% 3 1Tenney-Lapham Group 1, Tract 18.02 1463 10.8% 17.6% 0.0% 11.0% 2.4% 17.6% 3.1% 13.1% 5.9% 3.2% 0 0Tenney-Lapham Group 2, Tract 18.02 1321 16.0% 23.4% 0.9% 10.5% 0.0% 19.1% 0.0% 6.5% 4.9% 9.0% 0 0Tenney-Lapham Group 1, Tract 18.04 1373 12.3% 23.4% 0.0% 11.8% 45.1% 32.3% 1.1% 8.7% 8.9% 8.8% 1 0Sherman Group 2, Tract 18.04 1953 31.5% 9.3% 1.6% 22.0% 26.7% 22.5% 3.6% 13.9% 7.8% 16.6% 3 0Marquette Group 1, Tract 19 1120 9.5% 5.6% 0.0% 10.1% 23.0% 0.0% 2.7% 17.1% 0.0% 0.0% 0 0Marquette Group 2, Tract 19 1180 7.2% 18.0% 0.0% 5.9% 34.8% 29.7% 3.2% 16.7% 8.1% 4.4% 1 0Marquette Group 3, Tract 19 1391 10.5% 22.3% 0.0% 20.7% 10.0% 37.5% 0.0% 5.0% 4.8% 6.9% 1 0Marquette Group 4, Tract 19 1234 16.5% 20.8% 0.0% 18.8% 43.0% 34.1% 0.0% 12.3% 6.0% 9.2% 1 0SASY Group 5, Tract 19 1189 14.1% 12.7% 0.0% 14.2% 34.8% 15.5% 0.0% 11.4% 15.8% 16.3% 2 0Worthington Park Group 1, Tract 20 1301 46.4% 43.2% 2.3% 19.7% 51.2% 35.2% 18.7% 28.9% 13.3% 28.8% 6 2SASY Group 2, Tract 20 1207 13.5% 4.8% 0.0% 14.5% 15.1% 6.1% 1.3% 15.0% 5.2% 7.1% 0 0SASY Group 3, Tract 20 1577 7.6% 2.9% 0.0% 6.8% 14.0% 11.4% 3.5% 17.6% 1.5% 0.0% 0 0SASY Group 4, Tract 20 1790 14.0% 10.2% 0.5% 7.3% 6.9% 9.5% 6.1% 18.1% 12.1% 3.0% 1 0Eken Park Group 1, Tract 21 1465 23.6% 13.3% 0.0% 20.7% 16.1% 24.0% 5.9% 15.4% 4.7% 14.8% 1 0Eken Park Group 2, Tract 21 1135 19.8% 16.9% 0.0% 17.8% 31.7% 25.3% 1.3% 13.7% 11.1% 21.6% 3 0Emerson East Group 3, Tract 21 1208 15.0% 34.1% 3.0% 20.8% 51.6% 34.5% 2.3% 16.6% 7.1% 25.1% 4 1Emerson East Group 4, Tract 21 1042 17.5% 21.2% 2.9% 8.4% 8.8% 9.5% 0.3% 16.0% 5.2% 18.5% 1 0Truax Group 1, Tract 25 1009 39.8% 49.2% 4.8% 15.9% 53.8% 31.6% 11.9% 23.3% 10.6% 47.0% 5 2Carpenter-Ridgeway Group 2, Tract 25 726 37.2% 13.8% 1.2% 0.0% 0.0% 19.5% 6.8% 16.0% 11.6% 15.5% 2 1Hawthorne Group 1, Tract 26.01 1035 32.4% 22.0% 5.6% 11.9% 26.3% 0.0% 8.9% 21.5% 15.2% 22.6% 4 0Hawthorne Group 2, Tract 26.01 774 32.3% 11.2% 13.9% 22.4% 24.8% 59.9% 16.5% 18.1% 8.2% 17.3% 5 0Bluff Acres Group 1, Tract 26.02 1988 30.9% 11.3% 1.5% 7.7% 26.0% 20.8% 7.3% 18.6% 11.0% 20.1% 3 0Westchester Gardens Group 2, Tract 26.02 1640 33.7% 7.5% 0.0% 0.0% 31.2% 23.9% 0.0% 25.4% 1.9% 10.7% 2 1Westchester Gardens Group 3, Tract 26.02 1948 34.4% 9.0% 5.9% 13.6% 10.1% 18.9% 7.8% 17.8% 8.1% 6.8% 2 1Ridgewood Group 1, Tract 26.03 2828 37.7% 2.4% 8.8% 2.1% 8.5% 6.6% 9.2% 26.2% 3.5% 6.4% 2 1Burke Heights Group 2, Tract 26.03 2421 40.6% 12.5% 2.7% 9.5% 26.0% 30.7% 11.8% 22.7% 8.5% 25.7% 3 1Eastmorland Group 1, Tract 27 941 10.5% 10.0% 3.5% 0.0% 21.0% 57.4% 6.0% 16.7% 5.5% 0.0% 1 0Eastmorland Group 2, Tract 27 1148 10.4% 2.0% 0.0% 2.1% 9.3% 21.8% 2.9% 17.2% 6.2% 2.8% 0 0Eastmorland Group 3, Tract 27 1077 10.3% 10.0% 1.8% 9.4% 36.3% 40.8% 4.6% 14.9% 18.2% 3.3% 3 0Heritage Heights Group 1, Tract 30.01 1130 13.3% 0.0% 1.3% 0.0% 4.2% 12.8% 1.1% 22.4% 3.9% 6.3% 0 0Heritage Heights Group 2, Tract 30.01 1040 7.1% 6.9% 1.7% 2.6% 3.2% 0.0% 4.3% 18.5% 5.4% 3.7% 0 0Heritage Heights Group 3, Tract 30.01 1087 18.5% 2.9% 0.0% 11.4% 11.6% 38.6% 2.3% 23.6% 7.6% 9.1% 0 0Rolling Meadows Group 4, Tract 30.01 977 33.2% 7.3% 7.8% 8.1% 6.6% 27.0% 9.3% 22.2% 2.2% 4.7% 2 1Rolling Meadows Group 5, Tract 30.01 900 9.9% 3.7% 0.7% 7.4% 7.4% 0.0% 3.8% 17.7% 3.6% 9.1% 0 0Hiestand Group 1, Tract 30.02 1964 49.4% 14.6% 2.6% 10.7% 45.1% 27.5% 10.6% 28.1% 4.3% 19.2% 3 1Hiestand Group 2, Tract 30.02 1768 31.1% 24.1% 1.7% 9.9% 36.7% 29.6% 13.2% 21.2% 6.7% 19.5% 3 0
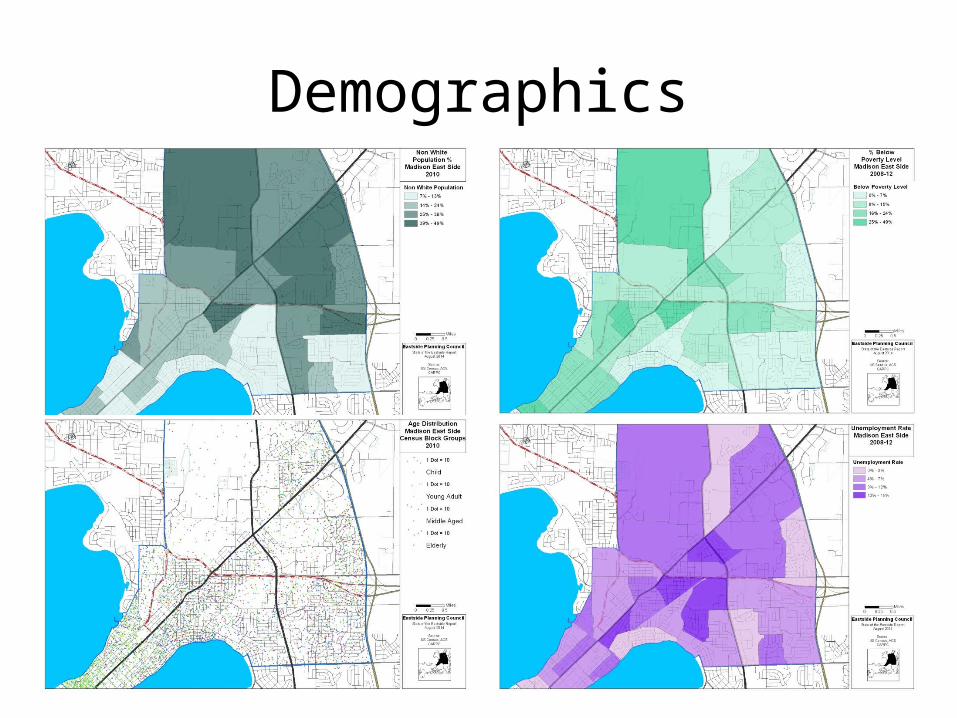
Demographics
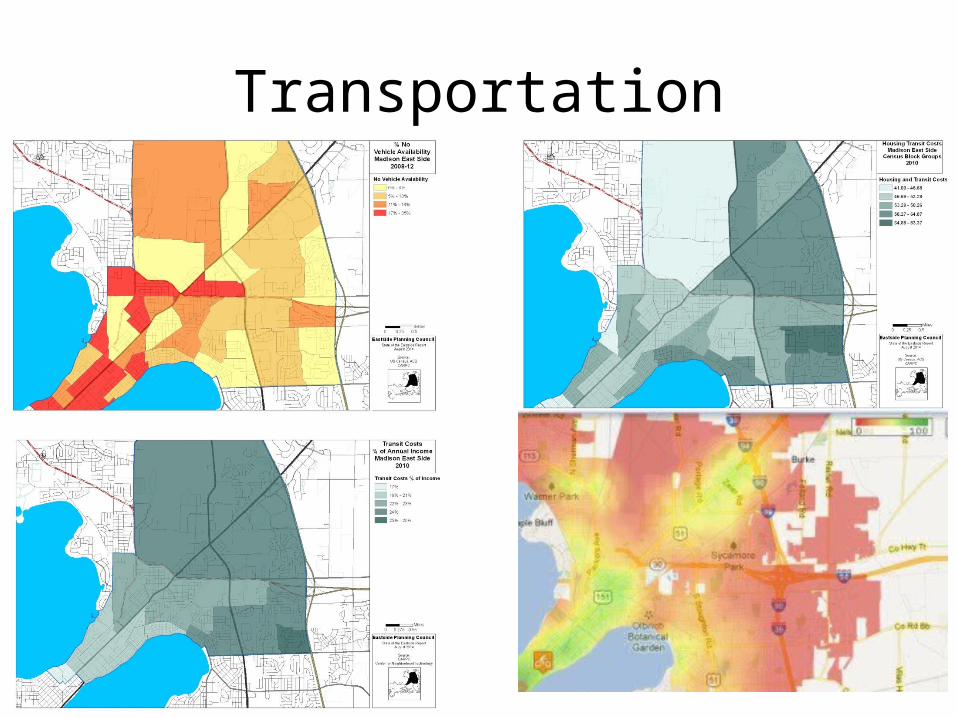
Transportation
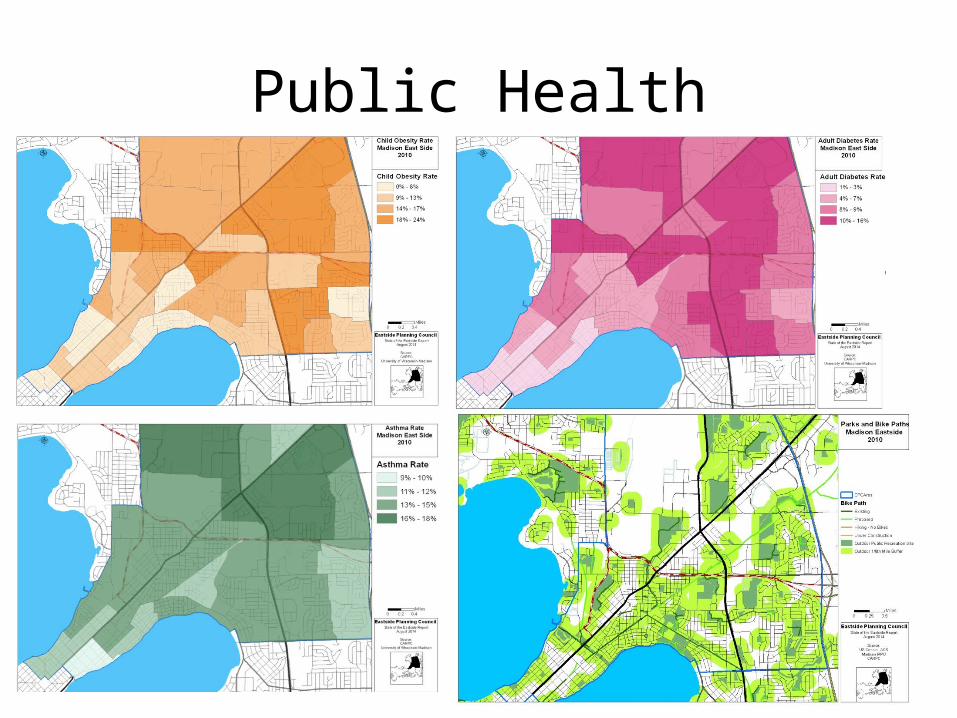
Public Health
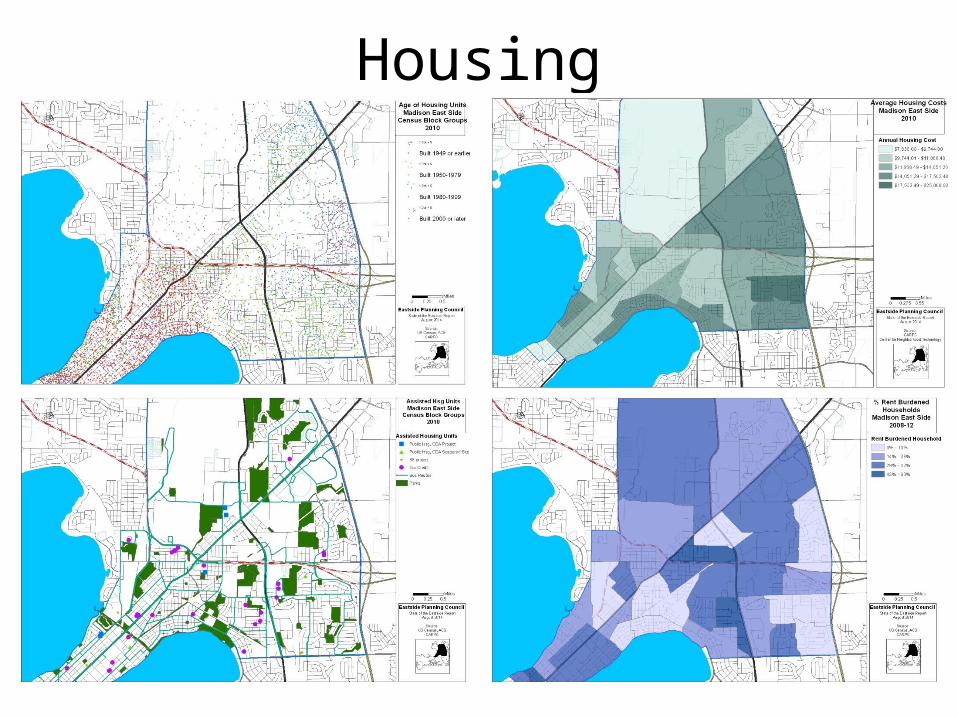
Housing
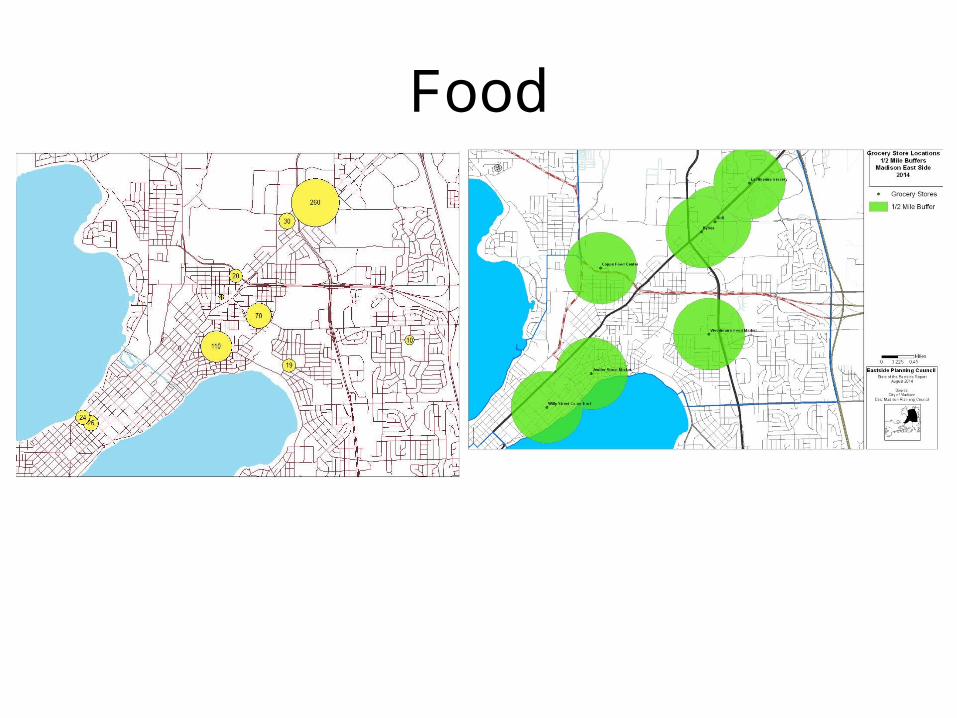
Food
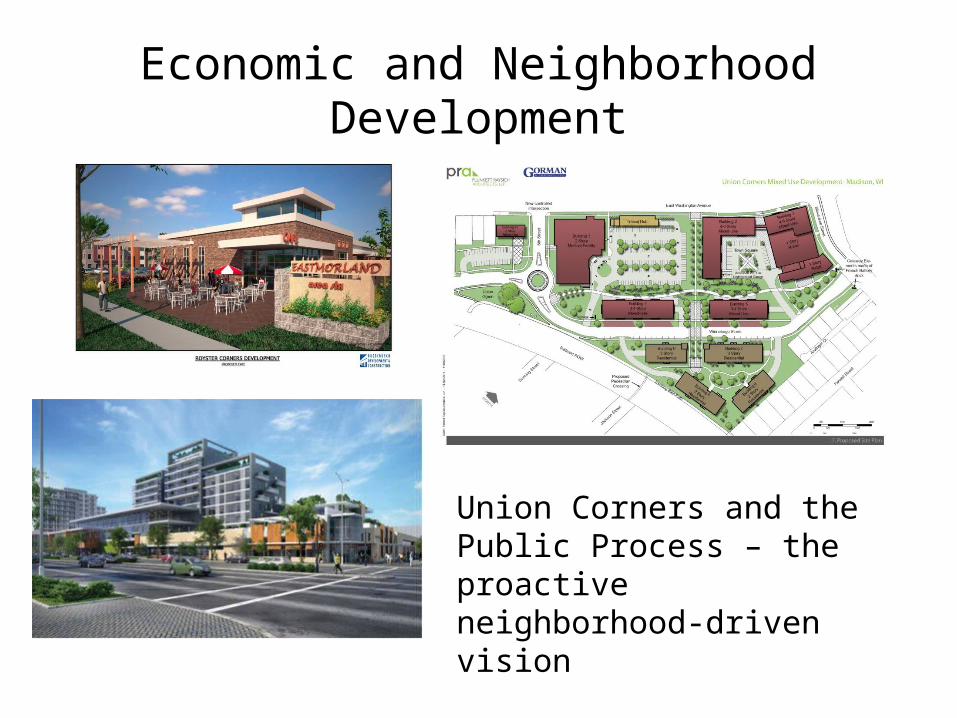
Economic and Neighborhood Development
Union Corners and the Public Process – the proactive neighborhood-driven vision
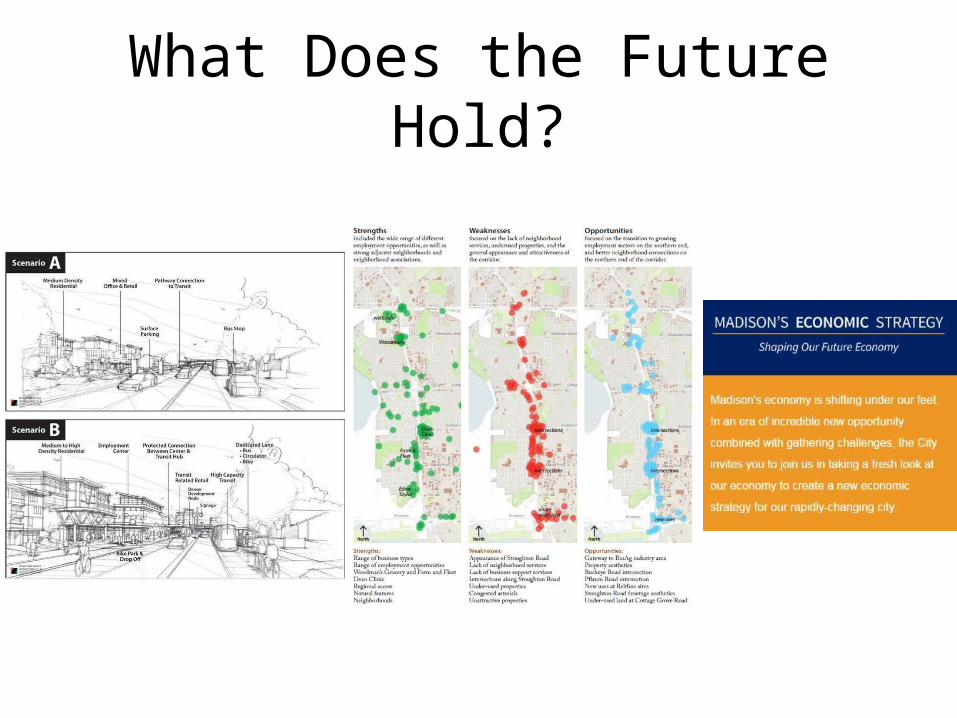
What Does the Future Hold?