Embed Size (px)
Citation preview
Spreadsheets 1.01
Tell me in your own words: What is a spreadsheet? What is their purpose? Who uses them? Where do you use them? What are some benefits of using
Spreadsheets?
Introduction to Spreadsheets
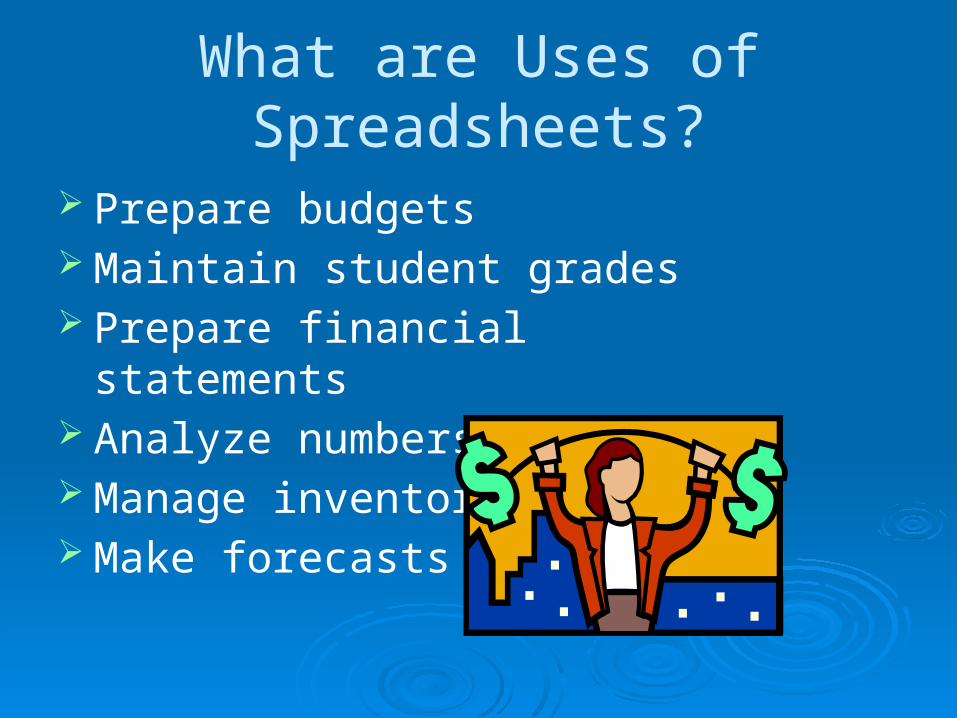
What are Uses of Spreadsheets?
Prepare budgets Maintain student grades Prepare financial statements Analyze numbers Manage inventory Make forecasts
Advantages of Spreadsheets
Forecasting and making decisions
Fast and efficient Automatically
recalculates
What-if Analysis
A spreadsheet tool used to play out different situations to determine the outcome
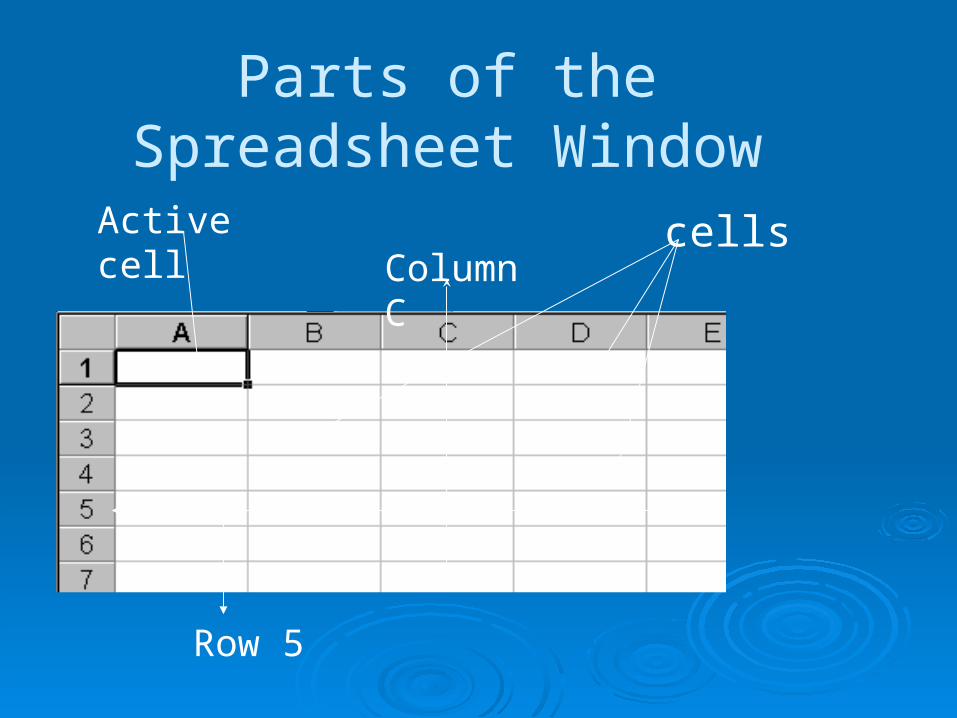
Parts of the Spreadsheet Window
Active cellColumn C
Row 5
cells
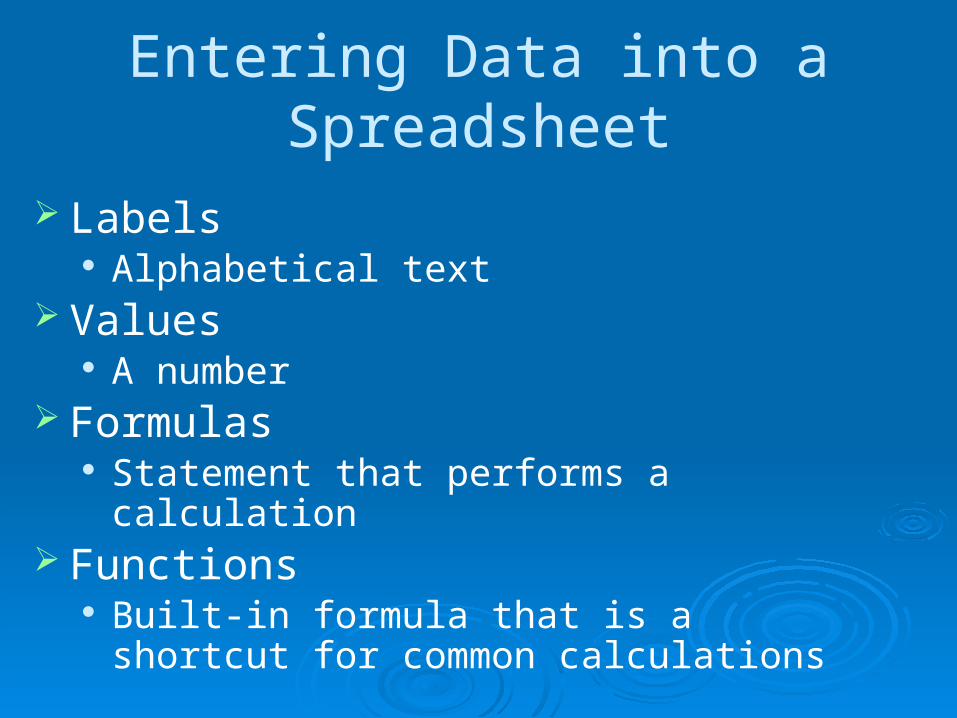
Entering Data into a Spreadsheet
Labels Alphabetical text
Values A number
Formulas Statement that performs a calculation
Functions Built-in formula that is a shortcut for
common calculations
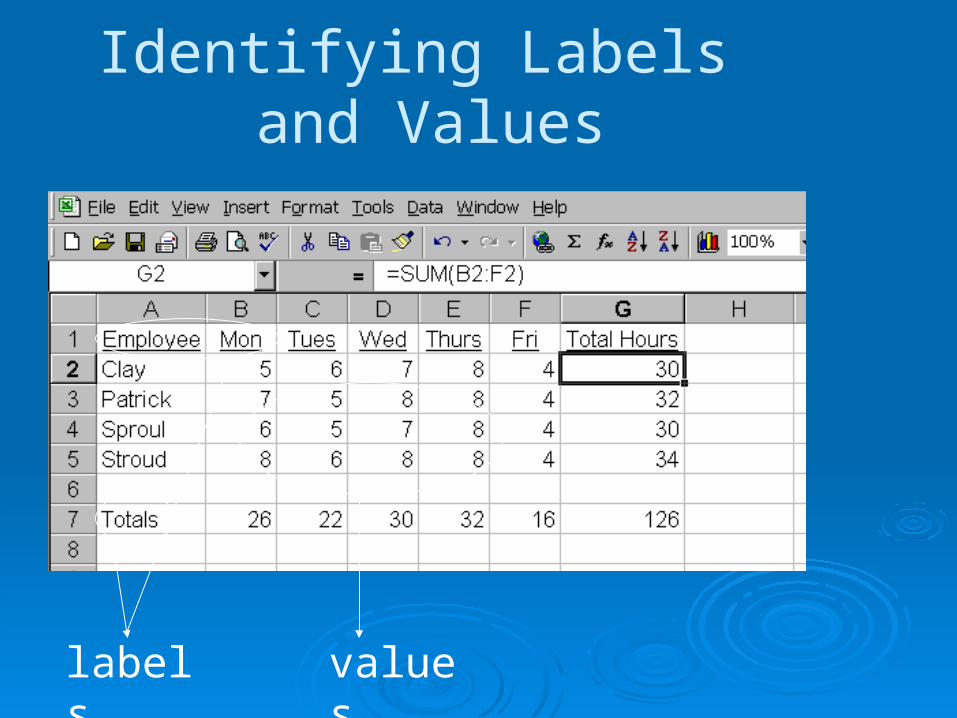
Identifying Labels and Values
labels values
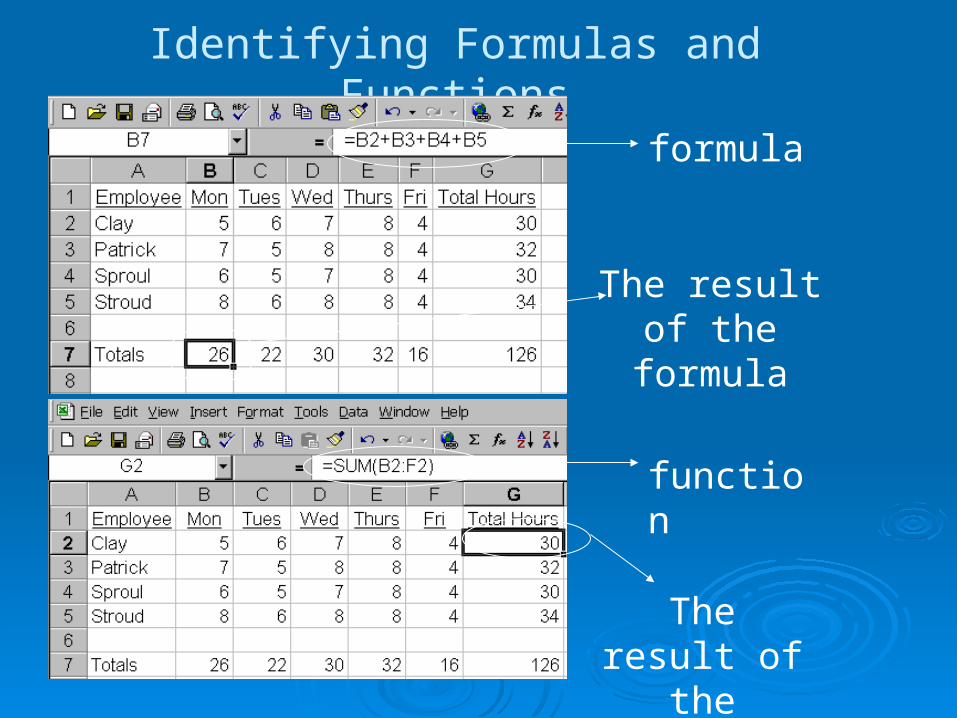
Identifying Formulas and Functions
formula
function
The result of the formula
The result of the function
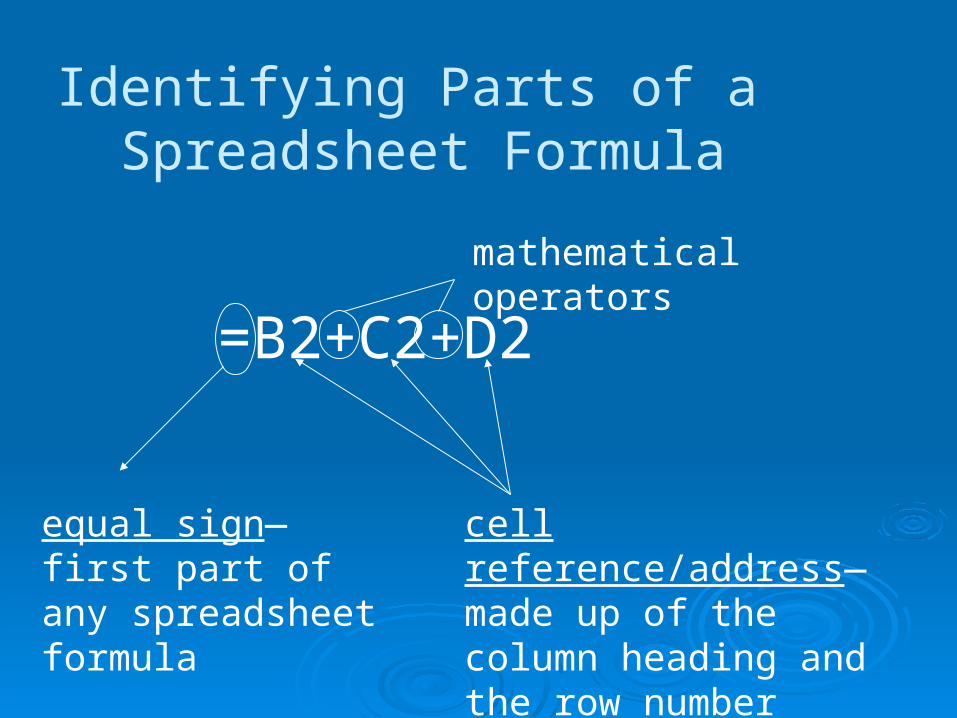
Identifying Parts of a Spreadsheet Formula
=B2+C2+D2
equal sign—first part of any spreadsheet formula
mathematical operators
cell reference/address—made up of the column heading and the row number
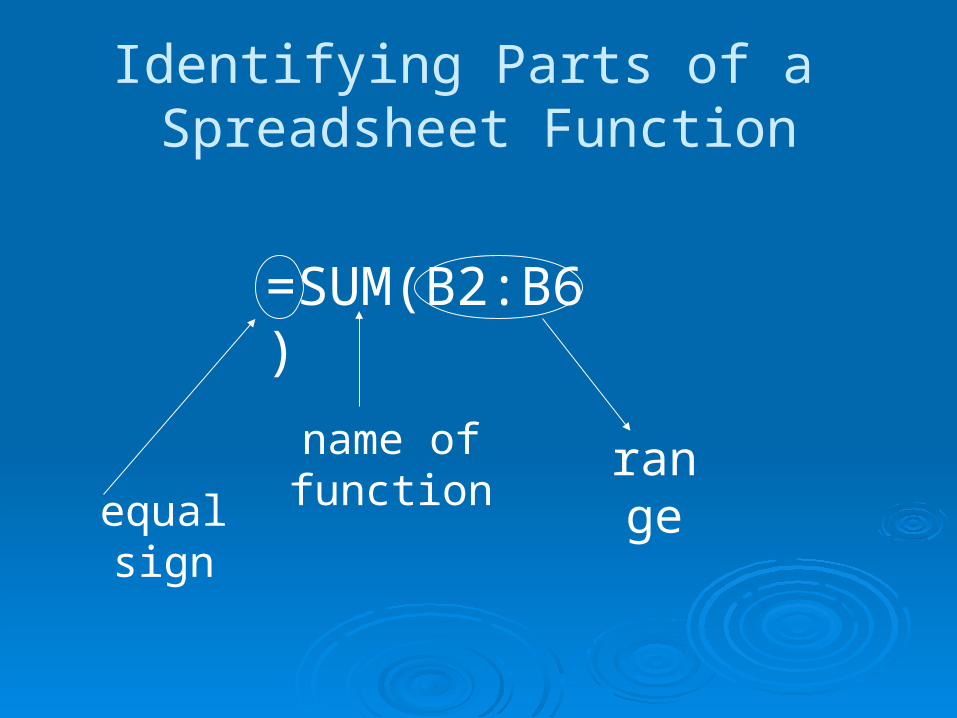
Identifying Parts of a Spreadsheet Function
=SUM(B2:B6)
equal sign
name of function
range
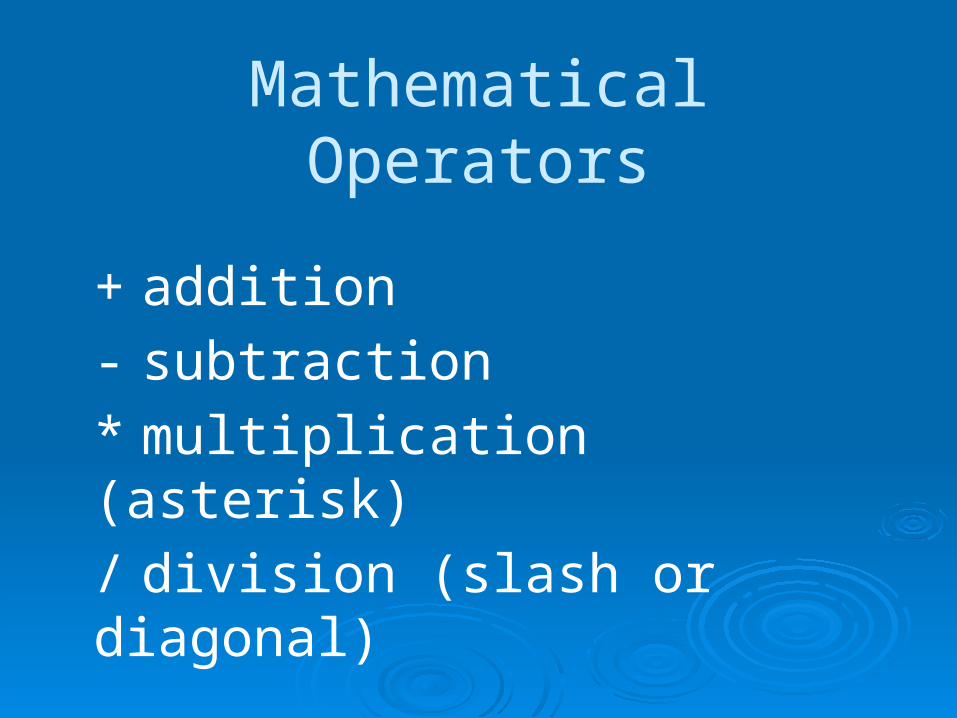
Mathematical Operators
+ addition
- subtraction
* multiplication (asterisk)
/ division (slash or diagonal)
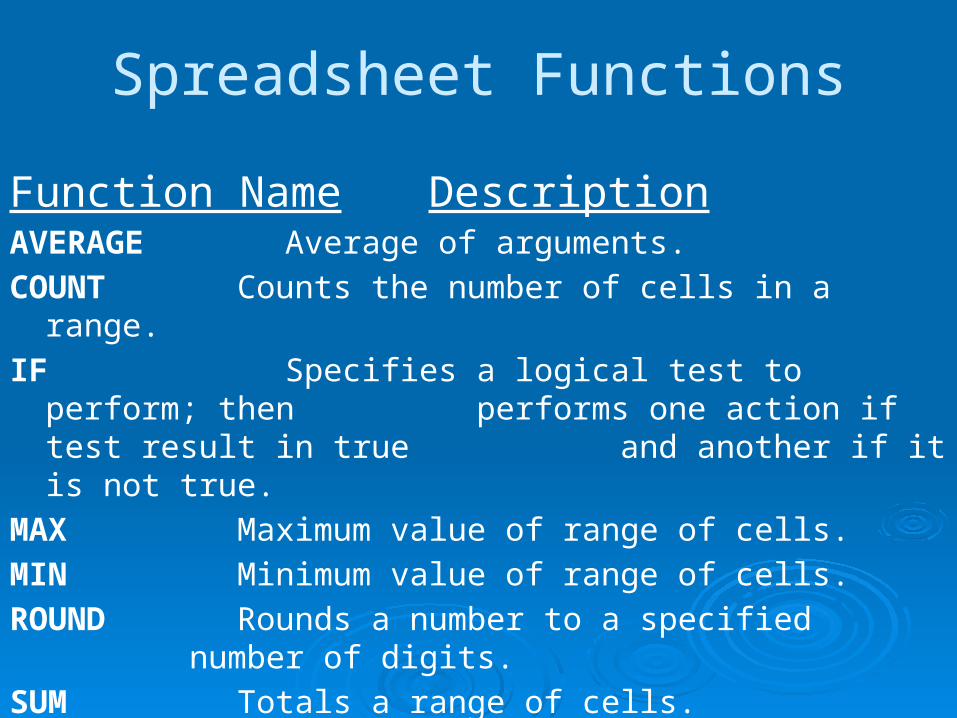
Function Name DescriptionAVERAGE Average of arguments.
COUNT Counts the number of cells in a range.
IF Specifies a logical test to perform; then performs one action if test result in true and another if it is not true.
MAX Maximum value of range of cells.
MIN Minimum value of range of cells.
ROUND Rounds a number to a specified number of digits.
SUM Totals a range of cells.
Spreadsheet Functions

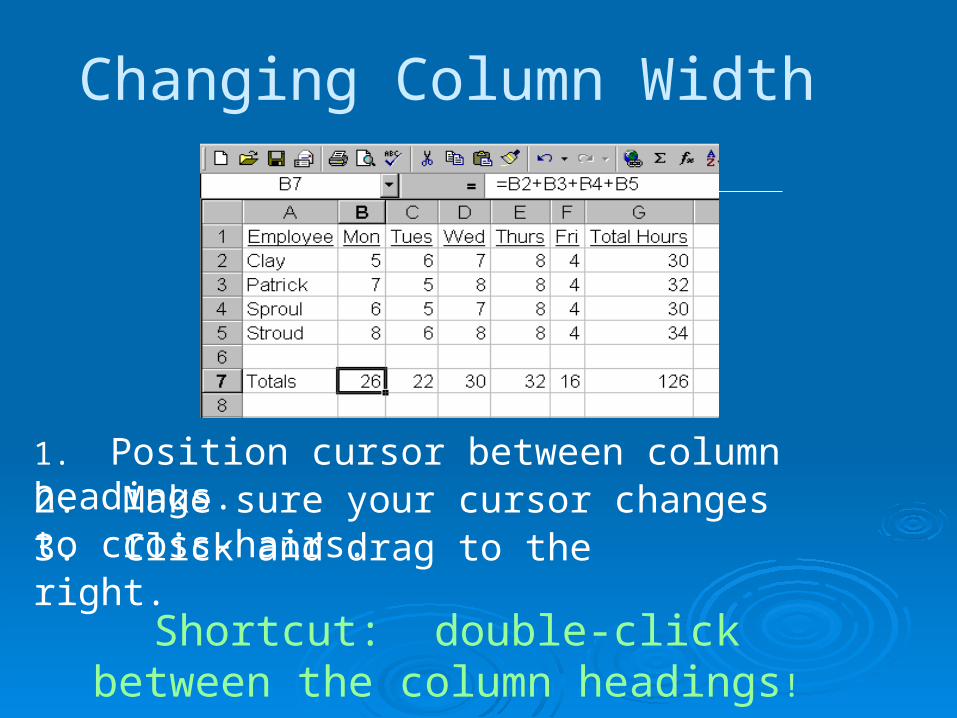
Changing Column Width
1. Position cursor between column headings.2. Make sure your cursor changes to cross-hairs.3. Click and drag to the right.
Shortcut: double-click between the column headings!
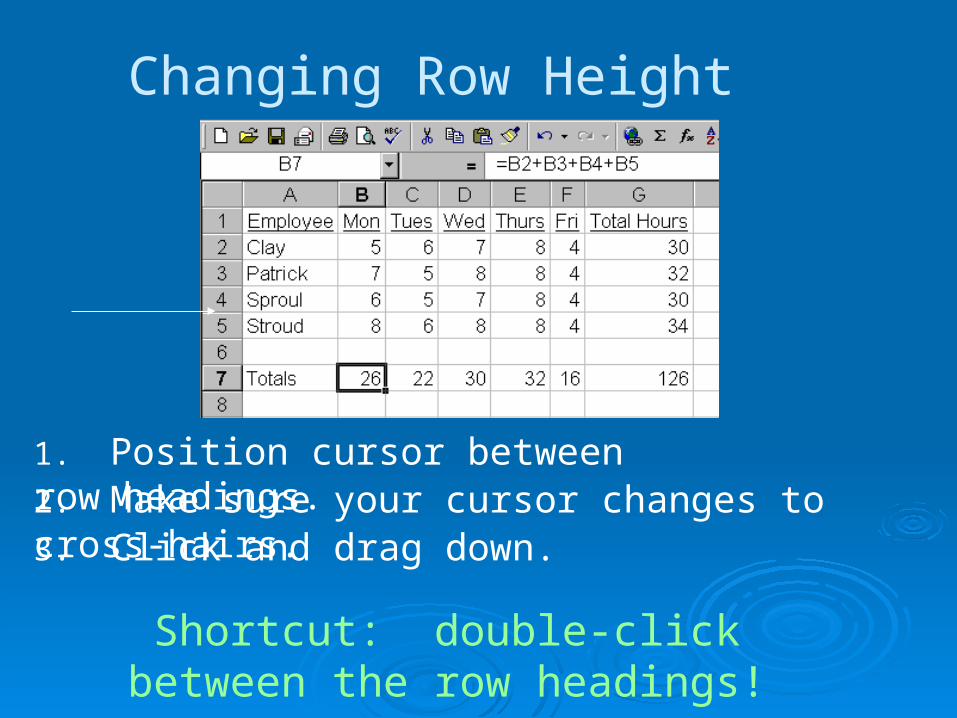
Changing Row Height
1. Position cursor between row headings.2. Make sure your cursor changes to cross-hairs.3. Click and drag down.
Shortcut: double-click between the row headings!
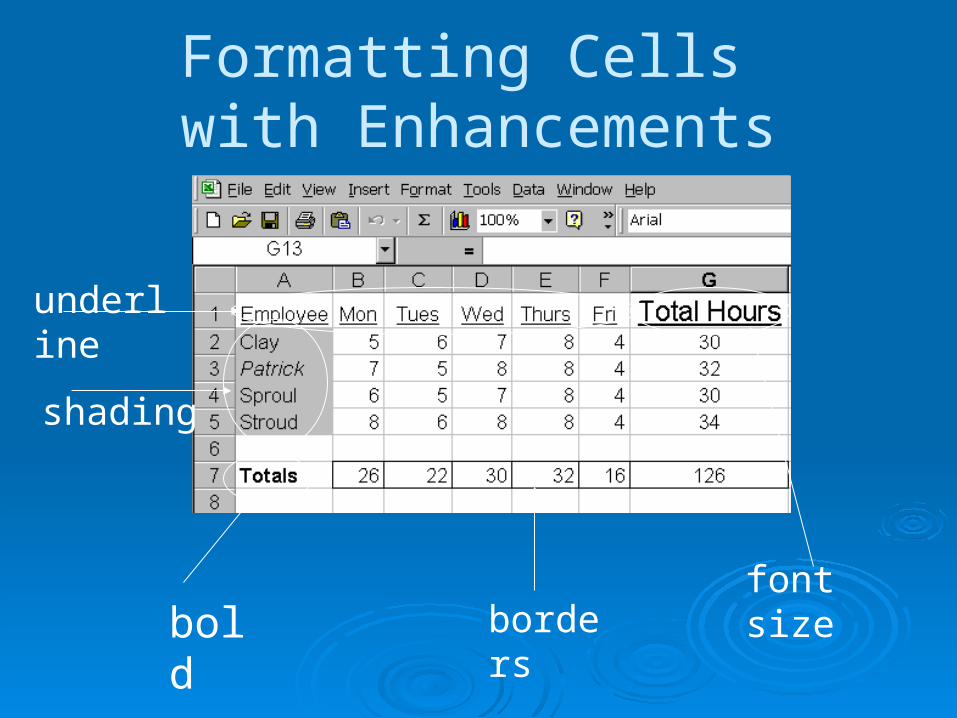
Formatting Cells with Enhancements
bold bordersfont size
shading
underline
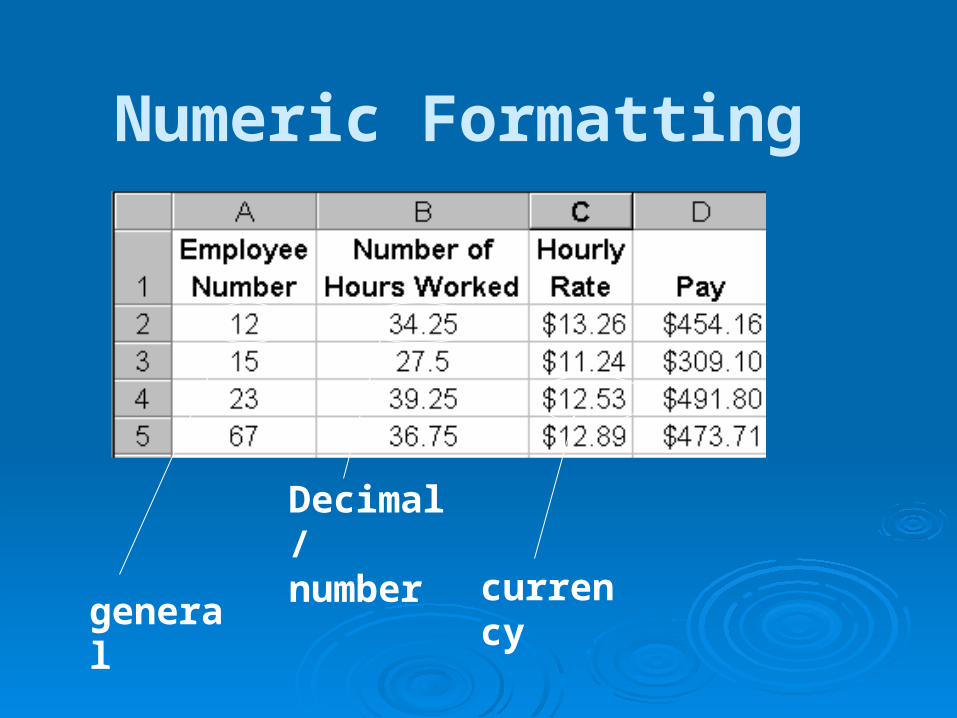
Numeric Formatting
generalcurrency
Decimal/ number
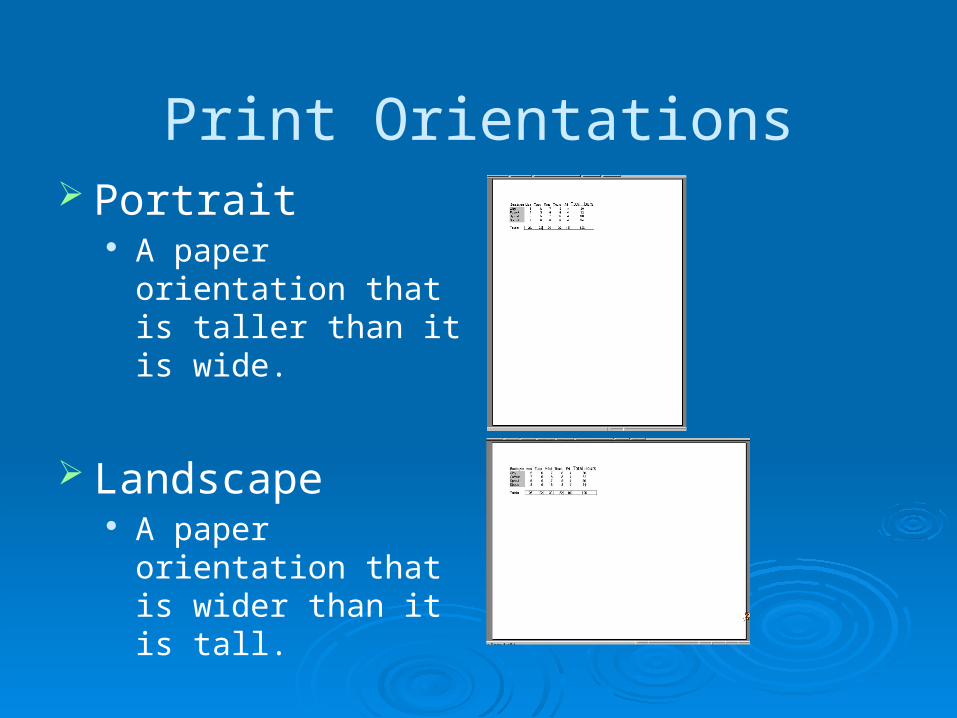
Print Orientations Portrait
A paper orientation that is taller than it is wide.
Landscape A paper orientation
that is wider than it is tall.
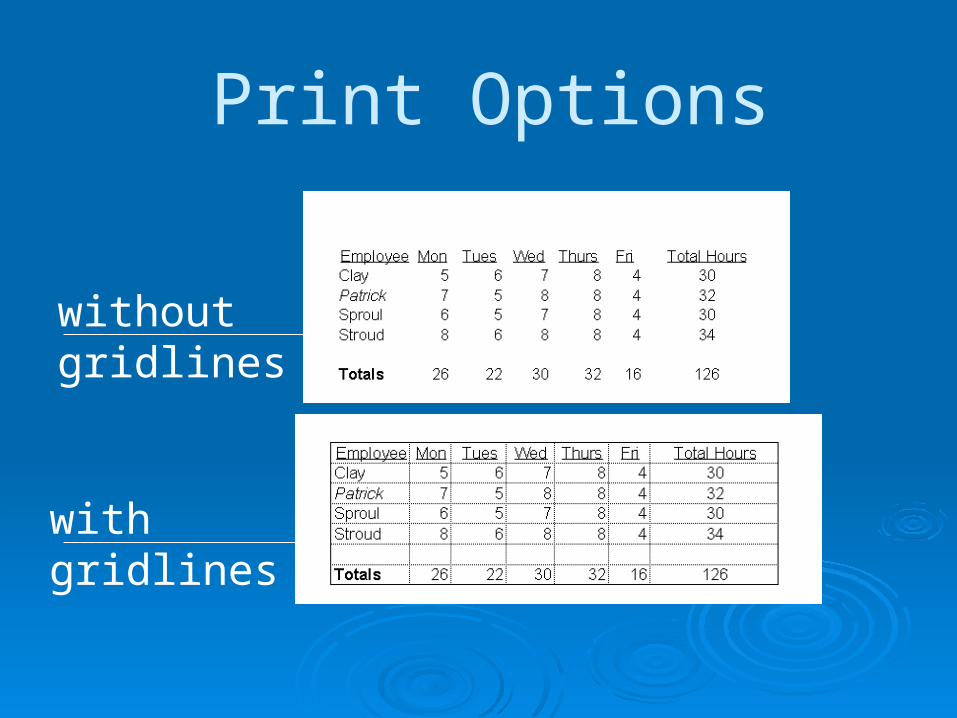
Print Options
without gridlines
with gridlines
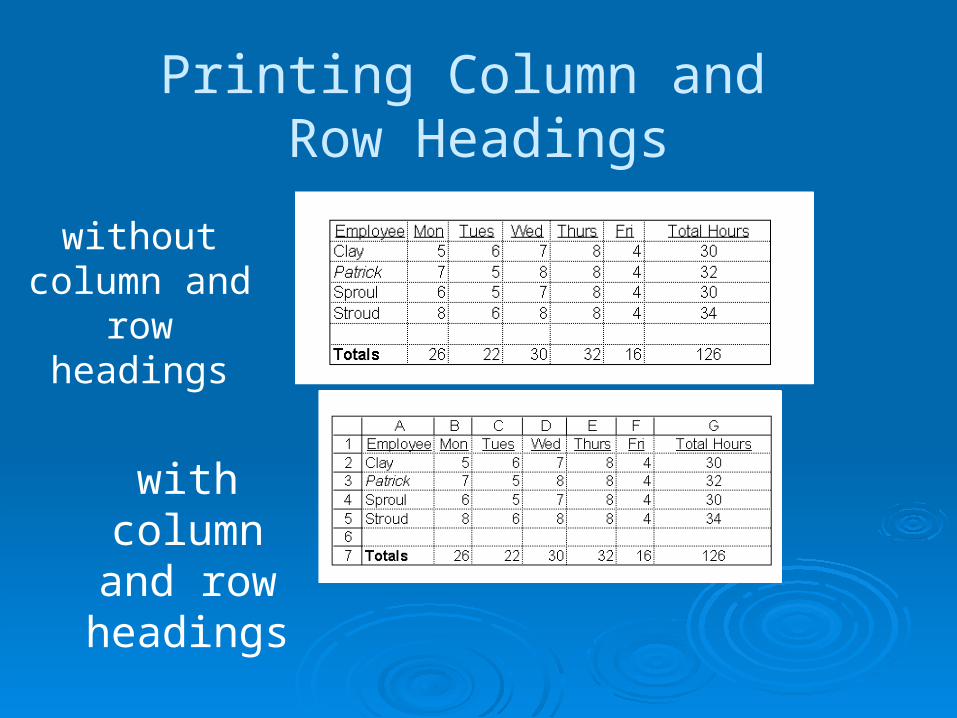
Printing Column and Row Headings
with column and row headings
without column and row headings
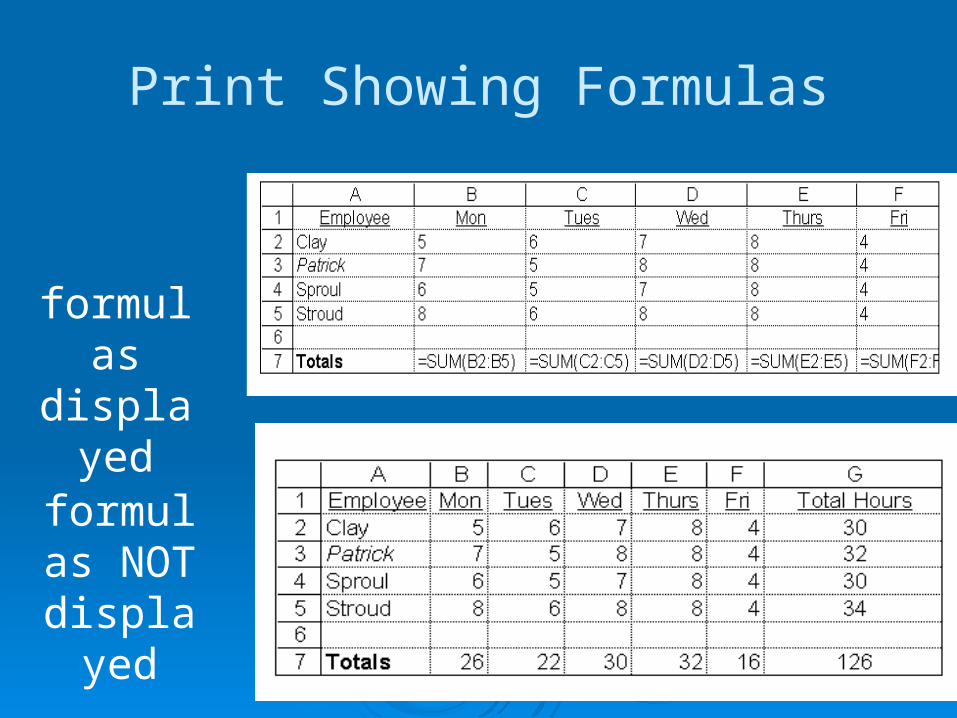
Print Showing Formulas
formulas displayed
formulas NOT
displayed
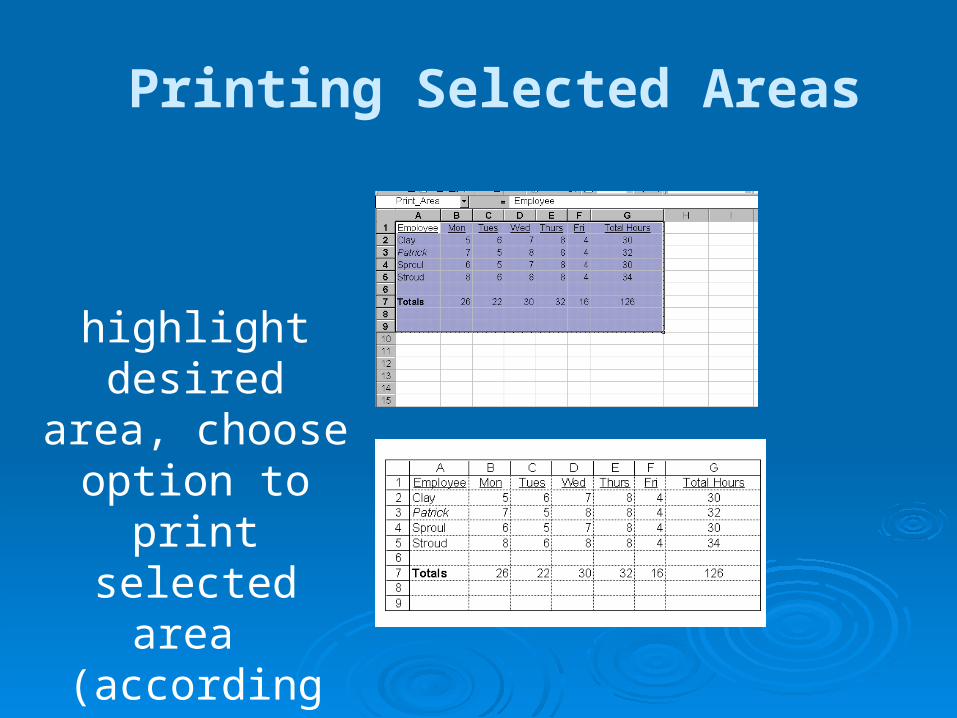
Printing Selected Areas
highlight desired area, choose
option to print selected area
(according to your software)
Relative and Absolute Referencing
Relative cells that change when they are copied
into other cells
Absolute cells that do not change regardless of
where it is copied
Graph / Chart Is a way of presenting and comparing
data in a spreadsheet
The three most commonly used are Bar graph, line graph and pie charts
Most charts have a vertical, left edge which is called the Y axis
On the bottom of the chart that run horizontally is known as the X axis
Charts Cont…
There are small black squares that surround a chart which are called handles to make the chart larger or smaller
* The small lines that mark a unit of measurement in a chart or graph is known as a tick mark.
bar graph
- Looks like rectangles, known as bars, lined up side by side
- They are used to compare the values of various items• Walmart’s prices compared to Target’s
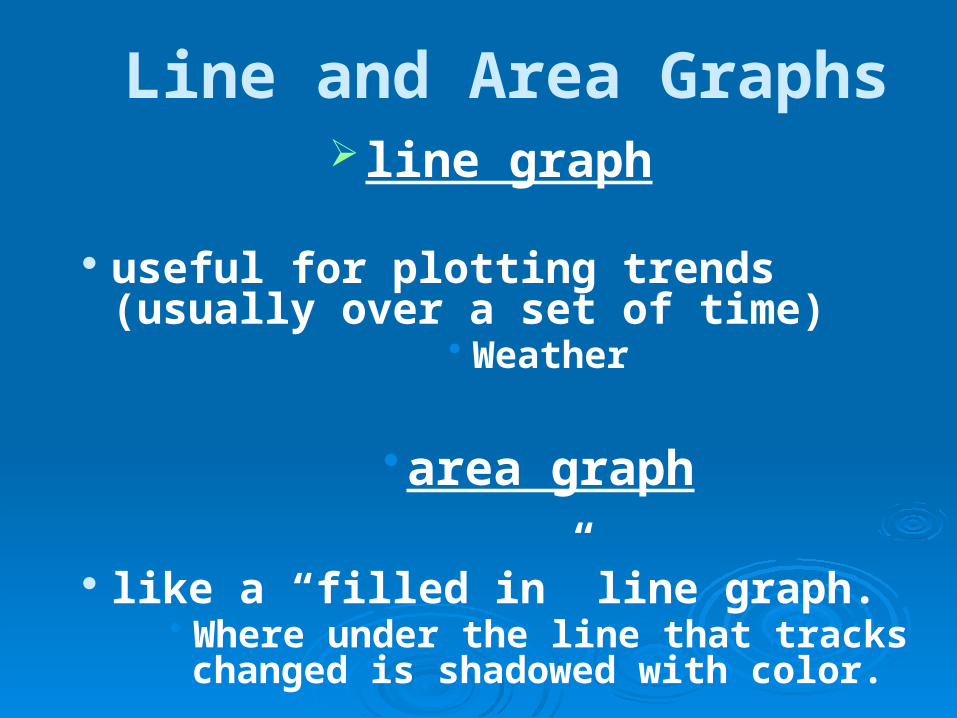
Line and Area Graphs line graph
useful for plotting trends (usually over a set of time)
• Weather
•area graph
like a “filled in” line graph. • Where under the line that tracks changed is
shadowed with color.
pie graph
used to represent the percentage of each item that contributes to the
total or whole.
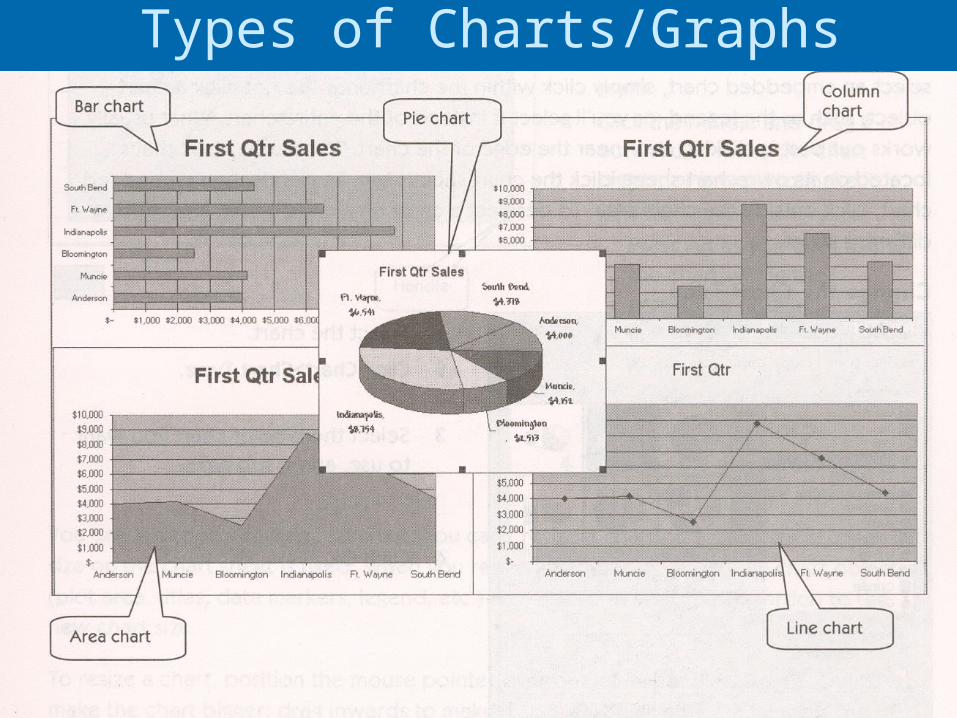
Types of Charts/Graphs