Embed Size (px)
Citation preview

Spectral Response of GaAs(Cs, NF3) Photocathodes
Teresa [email protected]
Florida Institute of Technology
August 10, 2012
ABSTRACT
In order to study the spectral response of GaAs(Cs, NF3) photocathodes, Quantum Effi-ciency was measured as a function of incident photon energy and compared with Monte Carlosimulations. Experimental data has been taken on two different photocathodes after they havebeen activated and as they are ”dying”. Monte Carlo simulations of activated GaAs have beendone with different electron affinity while the photon energy is being varied. A comparison ofexperiment and simulation is promising, although more work on the simulation is being done.
1. Introduction
Photocathodes are a subject of great interestas a source of electrons of a high brightness beam.Cornell’s Energy Recovery Linear Accelerator In-jector (ERL) is using such cathodes for its proto-type, however, the detailed physics that explainmany of the fundamental properties of photocath-odes such as Quantum Efficiency (QE)-the num-ber of electrons emitted per incident photon- , en-ergy distributions, and response time are still notwell understood. GaAs cathodes activated to neg-ative affinity with Cs and NF3 are an importantclass of photoemitters due to their intrinsic highbrightness and high QE. [1]. GaAs cathodes arebeing used because of their low Mean TransverseEnergy (MTE)- average energy perpendicular tothe surface normal. One important requirementfor making a photocathode is the vacuum in whichit is made and stored in. Without vacuum (mainlyof water vapor and Oxygen which are responsiblefor ”poisoning” of the Cesium layer) in the 10−12
Torr range, the cathode’s QE will decrease rapidly,rendering it useless. In order to keep the cathodein the best vacuum possible, all of the differentchambers where tests, growth, and activation oc-cur are connected together. This way, the cath-ode can be moved from chamber to chamber viamagnetic translator arms. A model of the vacuumchamber can be seen in Figure 1.
Fig. 1.— Illustration of the vacuum chamber usedfor both making and studying photocathodes.
1

Electrons are released from the cathode viaphotoemission. The photoemssion process can bedescribed as a three step process, illustrated inFigure 2. First, the electrons are exited from thevalence band into the conduction band. Then, theelectrons will diffuse to the surface. Finally, theycan be emitted into the vacuum [2]. In order tounderstand this process, a Monte Carlo simulationis being developed in order to track the positionand momentum of each electron from within thebulk until they are released from the surface[4].This simulation also must incorporate informationabout the surface of GaAs once it is activated.This includes band bending at the surface anda barrier at the surface-vacuum interface, amongother things. One interesting feature that can bestudied using this code is the dependence of QEon the incident photon energy. In order to do this,the simulation can be run multiple times with dif-ferent incident photon energies and correspondingabsorption lengths. This relationship can also bemeasured experimentally using a monochromatorto directly scan through different wavelengths ofincident light on the cathode while continuouslymeasuring photocurrent.
This paper will first describe the basic the-ory behind spectral response of GaAs. Then, theactivation process of two different cathodes andRHEED measurements before and after activationwill be described. Next, the experimental spectralresponse results will be presented. Finally, theMonte Carlo simulations that were performed us-ing different incident photon energies and surfacebarrier will be given, followed by the conclusion.
2. Spectral Response Theory
A theoretical idealized relationship between in-cident photon energy, hf , and QE can be de-scribed by
QE(hf) =B[1 −R(hf)]
1 + [α(hf)L]−1, (1)
which is obtained using a diffusion model of elec-trons in GaAs[3] . This equation assumes that theincident photons create a thermalized distributionof electrons and does not take into account thesurface barrier, band bending region, or scatter-ing that electrons undergo. In this formula, Ris optical reflectivity, α is the optical absorption
Fig. 2.— The three step model of photoemission[1].
2

coefficient, L is the electron diffusion length, andB is the surface escape probability. L and α areproperties of bulk GaAs while R is a property ofa GaAs surface. B, however, is a property of theparticular cathode’s surface, and hence will be de-pendent on cleaning and activation of the cathode.
3. GaAs Experimental Samples
Two different GaAs samples have been used inorder to study Spectral Response. Sample 1 isp-doped using Zinc, with a doping level between6.3x1018 and 1.9x10¹⁹ holes/cm3. The wafer wascut from a 4 inch diameter commercial GaAs crys-tal using a laser. It was then cleaned in acetoneand trichloroethylene to remove any contaminantsfrom the surface. Then, the wafer was anodized indilute phosphoric acid, creating an anodized layer50 nm thick. Just before the wafer is indium sol-dered to the puck, the anodized layer is removedusing ammonium hydroxide. Once under vacuum,the cathode was heated to about 600◦C in orderto clean off any residual Carbon contaminants andsurface oxides.
Sample 2 (G20219), was made with epitaxiallygrown GaAs under UHV. Only the top 1000 nm ofthe sample was p-doped with Carbon at a dopinglevel of 2.0x10¹⁸ holes/cm3. After it was grown,an Arsenic cap was deposited onto the surface,allowing the GaAs surface to be sealed off fromair and transported from the molecular beam epi-taxy growth lab to the cathode system. The ini-tial heating of this cathode was to 300◦C whichis when the As will evaporate off of the surface,leaving it atomically flat and clean. Activation,Reflective High Energy Electron Diffraction, andSpectral Response measurements have been takenfor both of these cathodes. We also have the ca-pabilities to perform Auger Spectroscopy and LowEnergy Electron Diffraction, but have not yet doneso at this time.
4. GaAs Activation
On its own, GaAs does not emit electrons inthe visible light range. Plain GaAs is a positiveelectron affinity material, meaning that the vac-uum level is higher than the conduction band min-imum. In order to make use of GaAs, it must firstbe activated with Cesium and either Oxygen orNitrogen Trifluoride gas. This will bring the vac-
uum level below the conduction band minimumby creating a strong field due to a dipole layerformed by a rough monolayer of Cs donating itselectrons to the p-doped bulk. This means thatan electron only needs to have enough energy toreach the valence band, and then can be releasedfrom the cathode without any extra energy. Ac-tivation of GaAs still has several aspects whichremain poorly understood.
The technique we used to activate GaAs is Yo-yo activation. A clean cathode is first sprayed withCs until the QE passes a maximum and goes downto about half of the maximum reached. Then, ei-ther O2 or NF3 is sprayed until the QE reachesanother maximum. Cs is sprayed again, and theprocess repeats until each consecutive maximumdoes not have a significant increase in QE. Figure3 shows an activation of Sample 1 with Cs andNF3 gas. The maximum QE reached in this ac-tivation was 11%, and the 1/e lifetime was about80 hours. Figure 4 shows a similar activation ofSample 2. The maximum QE reached was 4.2%,and the 1/e lifetime was about 25 hours.
5. Reflective High Energy Electron Diffrac-tion
RHEED is used to study the surface crystalstructure. It consists of shooting an electron gunat the cathode and observing the diffraction pat-tern that is created. This was done with electronsof energy 5.7 keV, and with the gun at a veryshallow angle with the surface. For an atomicallyflat surface, the RHEED pattern is expected tobe long vertical lines. When the surface is roughor oxidized, the pattern will change from lines todots.
Figure 5 shows the RHEED patterns that havebeen taken after cathode cleaning and after acti-vation of Sample 1. Between these two measure-ments, the cathode was locked in the same posi-tion, so that the RHEED pattern would be of theexact same position on the surface. Both RHEEDpatterns show the exact same spots on the surface.Figure 6 is a similar picture for Sample 2. Thecathode was not locked in the same position duringthe measurement, but the RHEED patterns showalmost the same lines in roughly the same position.These results confirm that Sample 2 has a muchflatter surface than Sample 1. These results also
3

Fig. 3.— Sample 1 activation with Cs and NF3
done on 8/1/2012.
Fig. 4.— Sample 2 activation with Cs and NF3
done on 8/5/2012.
show that before and after activation, the cathodesurface remains relatively unchanged in terms ofsurface roughness. In both RHEED patterns af-ter activation, the background light gets brighterwhile the dots and lines dim. This more diffusepattern could be attributed to scattering off of thecesium layer.
6. Spectral Response
The experimental measurement of spectral re-sponse was done using a Newport monochromator(Model #70514) which screens out all but a smallrange of wavelengths from white light created bya mercury lamp. The QE is measured continu-ously while the monochromator outputs light from350 to 1000 nm. The monochromator light beampasses through a Scitech optical chopper (Serial#5087) rotating at 1477 Hz and then a beam split-ter, allowing measurement of light power through-out the QE scan. Photocurrent is measured byindirectly measuring the current created by pho-toemission. The signal is read by a SRS lock inamplifier (Model #530) which can lock into thechopper frequency, measure the current pulses andseparate it from any background current. Both theraw photocurrent and light power is measured inLabView, and a Matlab code is used to processthe results.
As the cathode dies, its spectral response willchange. This is because as the cathode dies, itswork function that was lowered during activationwill change back to its original level. Conversely,the band gap energy of GaAs will remain the sameeven as the cathode dies. Once the affinity be-gins to become positive, even though electrons canreach the valence band, they are unable to escapebecause of the surface barrier and the QE dropsoff at a lower wavelength.
Selected spectral response curves are plotted inFigure 7 for Sample 1. These curves are taken overtime to show the spectral response as the cathodedies. Because the death of the cathode was fairlyslow, NF3 was released in the chamber to raisethe vacuum to the order of 10−7 Torr for a fewseconds, killing the cathode much more rapidly.Figure 8 is a similar set of curves for Sample 2.This cathode was not killed with NF3 because, asseen in Figure 9, the curves from Sample 2 behavelike Sample 1 after it was exposed to NF3. QE
4

Fig. 5.— Top. RHEED done on Sample 1 beforeactivation on 7/26/2012. Bottom. RHEED doneon Sample 1 after activation on 7/30/2012. (TheT shaped structure in the background of each pic-ture is the reflection of the camera stand, and isnot part of the RHEED pattern.)
Fig. 6.— Top. RHEED done on Sample 2 beforeactivation on 8/3/2012. Bottom. RHEED doneon Sample 2 after activation on 8/6/2012.
5

in both of these cases drops off at a wavelengthmuch lower than that corresponding to the bandgap, meaning that the affinity is more positive.
These spectral response curves have also beencompared to the theoretical model given in Equa-tion 1. Because this model does not take into ac-count things such as band bending, scattering, anda barrier, the curve given is oversimplified. Figure10 shows that the theory only matches experimen-tal data near the band gap, and only for cathodesthat have reached negative affinity. If the cathodehas a positive affinity, the theory does not explainthe experimental data at all.
7. Monte Carlo Simulations
Since the exact mechanism of electron release incathodes is still unknown, a Matlab code is beingdeveloped in order to simulate the flow of electronsduring photoemission[4]. This code uses placeselectrons within the bulk as a exponential decayfrom the surface according to the laser penetrationdepth. Then, by using Monte Carlo simulations,these electrons undergo random scattering in thebulk due to impurities, phonons, and interactionswith holes. This will cause the electrons to loseenergy and eventually form a thermalized distri-bution, although they will not reach this distribu-tion before reaching the surface. The electrons aretracked on their way through the bulk to the sur-face where a band bending region is simulated byan electric field. Both the conduction band min-imum and the valance band maximum will benddownward, so that the Fermi Level of GaAs willbe located at one third of the band gap. The sur-face barrier height is the difference between theconduction band minimum after bending and thevacuum level[4].
However, before the electrons can escape, thereis also a higher triangular shaped barrier that theymust tunnel through[3]. This barrier was added inthe form of a set of finite rectangular barriers withheights that can adjust to form downward steps.The maximum barrier height and number of stepsare defined by the user, and the steps will go fromthe maximum to the vacuum level. For these sim-ulations the maximum barrier height is defined tobe 0.28 eV above the surface barrier, and the num-ber of steps was set to one, leaving just a rectan-gular barrier[3]. Different surface barrier heights
Fig. 7.— Experimental spectral response curvestaken for Sample 1 on 8/1-2/2012. First killingrefers to an unknown cause of bad vacuum in-side the chamber which caused the cathode to dierapidly without the release of NF3.
Fig. 8.— Experimental spectral response curvestaken for Sample 2 on 8/5-6/2012.
6
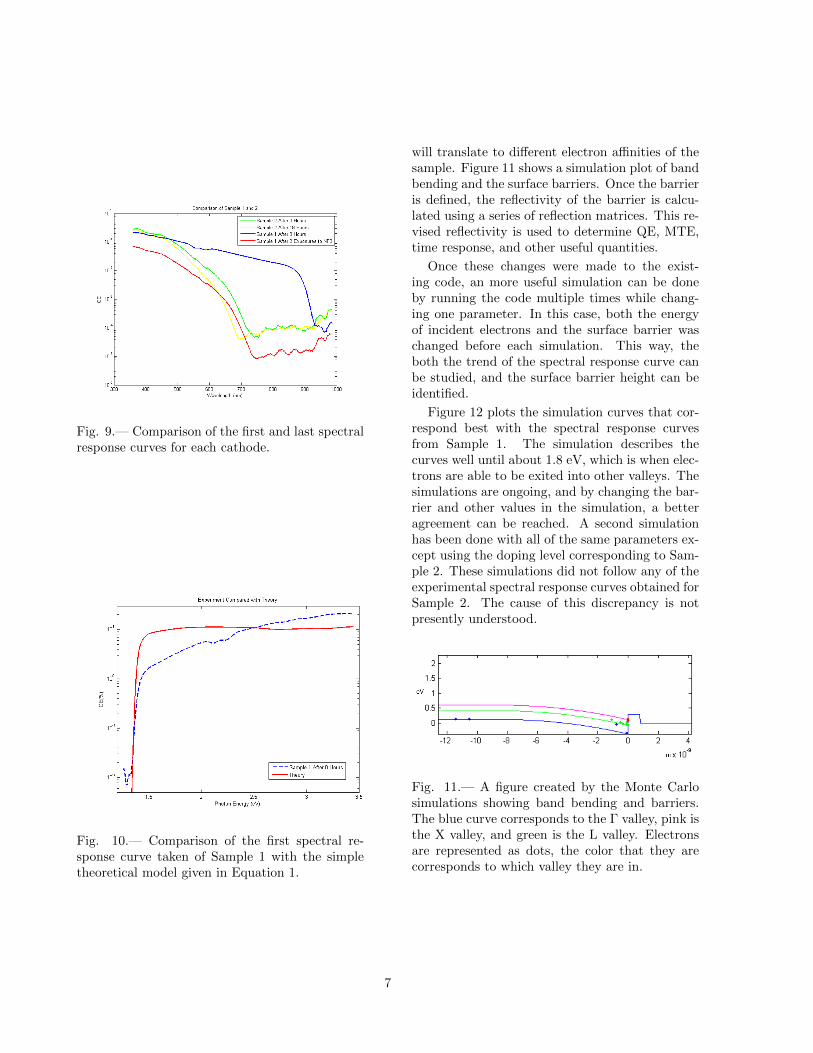
Fig. 9.— Comparison of the first and last spectralresponse curves for each cathode.
Fig. 10.— Comparison of the first spectral re-sponse curve taken of Sample 1 with the simpletheoretical model given in Equation 1.
will translate to different electron affinities of thesample. Figure 11 shows a simulation plot of bandbending and the surface barriers. Once the barrieris defined, the reflectivity of the barrier is calcu-lated using a series of reflection matrices. This re-vised reflectivity is used to determine QE, MTE,time response, and other useful quantities.
Once these changes were made to the exist-ing code, an more useful simulation can be doneby running the code multiple times while chang-ing one parameter. In this case, both the energyof incident electrons and the surface barrier waschanged before each simulation. This way, theboth the trend of the spectral response curve canbe studied, and the surface barrier height can beidentified.
Figure 12 plots the simulation curves that cor-respond best with the spectral response curvesfrom Sample 1. The simulation describes thecurves well until about 1.8 eV, which is when elec-trons are able to be exited into other valleys. Thesimulations are ongoing, and by changing the bar-rier and other values in the simulation, a betteragreement can be reached. A second simulationhas been done with all of the same parameters ex-cept using the doping level corresponding to Sam-ple 2. These simulations did not follow any of theexperimental spectral response curves obtained forSample 2. The cause of this discrepancy is notpresently understood.
Fig. 11.— A figure created by the Monte Carlosimulations showing band bending and barriers.The blue curve corresponds to the Γ valley, pink isthe X valley, and green is the L valley. Electronsare represented as dots, the color that they arecorresponds to which valley they are in.
7

8. Conclusions
During this project, two p-doped GaAs(Cs,NF3) photocathodes have been successfully ac-tivated using the Yo-yo activation procedure.RHEED has also been performed on both cathodesbefore and after activation. RHEED on Sample1 indicated that the surface of the cathode wasrough both before and after activation, althoughthe background of the pattern taken after activa-tion was brighter. This could mean that the Cslayer causes more scattering. The RHEED pat-tern for Sample 2 contained lines, meaning thatit was flatter than Sample 1, and also showed asimilar background brightness increase.
Through the spectral response investigation ofthese two photocathodes, a rough method for iden-tifying the affinity of a cathode has been made.When a cathode has reached negative or near neg-ative affinity, the band gap of the cathode canclearly be identified as a sharp drop in quan-tum efficiency on a log scale. Cathodes that areat positive affinity will have a slower drop at amuch smaller incident photon wavelength. Usingthis approximation, the evolution of Sample 1’sspectral response curves indicate that the cathodewas at or near negative affinity soon after activa-tion, and as time progressed (as the cathode died)reached positive affinity. However, these simula-tions do not fit the experimental data with inci-dent photons above 1.8 eV. From the spectral re-sponse curves for Sample 2, it is clear that thisactivation did not bring the cathode to negativeaffinity. Using the Monte Carlo simulations, anaffinity can be assigned to these spectral responsecurves.Investigations to find the cause for this dis-crepancy are still ongoing.
9. Acknowledgments
I would like to thank my advisors, SiddharthKarkare, Dr. Luca Cultrera, and Dr. IvanBazarov, for proposing and helping me completemy project. I would also like to thank every-one else in the ERL group including Eric, Tobey,Adam, Dr. Bill Schaff, and Dr. Xianghong Liufor their help. Finally, I would like to thank theCornell Accelerator Physics Staff for running theREU program. This project was supported by theNSF REU grant.
10. References
[1] Photocathode Wiki, photocathodes.chess.
cornell.edu/wiki/Cathode theory
[2] W. E. Spicer, SLAC-PUB-6306 (1993)
[3] D. G. Fisher. J. Appl Phys., Vol. 43,
No.9, September 1972
[4] S. Karkare, Photoemission Characteristics
of GaAs(Cs,F) Photocathodes using Monte
Carlo Simulations (Unpublished)
8
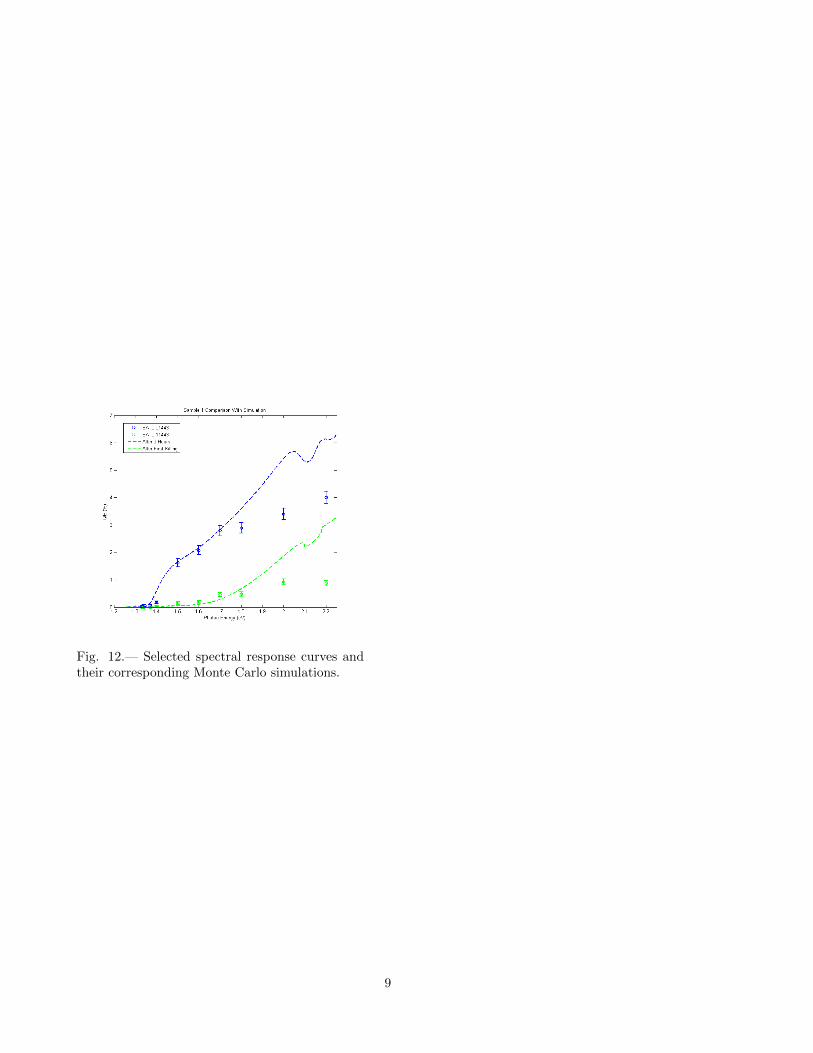
Fig. 12.— Selected spectral response curves andtheir corresponding Monte Carlo simulations.
9