Embed Size (px)
Citation preview

ARTICLE IN PRESS
0168-9002/$ - se
doi:10.1016/j.ni
�CorrespondiE-mail addre
motta@mpi-hd
Nuclear Instruments and Methods in Physics Research A 539 (2005) 217–235
www.elsevier.com/locate/nima
Optical properties of bialkali photocathodes
D. Motta�, S. Schonert
Max-Planck-Institut fur Kernphysik, Saupfercheckweg 1, 69117 Heidelberg, Germany
Received 6 September 2004; accepted 7 October 2004
Available online 10 November 2004
Abstract
The optical properties of the ‘‘bialkali’’ KCsSb and RbCsSb photomultiplier cathodes have been experimentally
investigated in the visible range. The measurements carried out include the absolute reflectance at near-normal
incidence, the polarization-dependent relative reflectance at various angles and the change in polarization upon
reflection from the photocathode. These experimental inputs have been combined with a theoretical model to determine
the complex refractive index of the photocathodes in the wavelength range (380 nm, 680 nm) and their thickness. As a
result of this work, we derive a model which predicts the fraction of light impinging on a photomultiplier tube that is
reflected, absorbed or transmitted, as a function of wavelength and angle, and dependent on the medium to which the
photomultiplier is coupled.
r 2004 Elsevier B.V. All rights reserved.
PACS: 85.60.Ha; 78.20.Ci; 78.66.�w
Keywords: Photomultiplier tubes; Bialkali photocathodes; Optical properties
1. Introduction
Photomultiplier tubes (PMTs) with bialkaliphotocathodes are widely used in astrophysics,nuclear and particle physics. In many cases, theonly optical property of a PMT of interest for thedesign of an experiment is its spectral sensitivity,i.e., the fraction of photons converted into
e front matter r 2004 Elsevier B.V. All rights reserve
ma.2004.10.009
ng author.
sses: [email protected],
.mpg.de (D. Motta).
detected photoelectrons as a function of thewavelength (Fig. 1). Recent developments inparticle physics, especially in neutrino physics,have led to the construction or proposal of severalmulti-ton up to megaton detectors, in which theinteractions are detected either via Cherenkov lightin water (or ice) or via scintillation light fromorganic liquid scintillators [1–6]. Data analysis inthese experiments is based on the comparison withthe predictions of Monte Carlo simulations, whichtypically do not include a detailed description oflight interaction with the PMTs.
d.

ARTICLE IN PRESS
Wavelength (nm)250 300 350 400 450 500 550 600 650 700
QE
0
0.05
0.1
0.15
0.2
0.25
0.3
0.35
standard bialkali
green-enhancedbialkali
Fig. 1. Typical spectral response of blue-sensitive and green-
enhanced bialkali photocathodes. The ordinate gives the
probability for a photon to produce a photoelectron. The
curves are usually measured by illuminating the PMT at the
center in air, at normal incidence. The cut-off at �310nm is due
to the absorption by the PMT glass window.
D. Motta, S. Schonert / Nuclear Instruments and Methods in Physics Research A 539 (2005) 217–235218
Three processes are possible for a photonimpinging on a PMT:
(1)
Absorption in the photocathode, with prob-ability Aðl; yÞ(2)
Reflection from the PMT window or photo-cathode, with probability Rðl; yÞ(3)
Transmission inside the PMT, with probabilityTðl; yÞ ¼ 1� Aðl; yÞ � Rðl; yÞIn case of absorption, a photoelectron is produced,which has a certain probability to escape the layertowards the interior of the PMT, to be acceleratedto the first dynode and start an avalanche, resultingin a detectable signal. It is convenient to express theprobability that a photon contributes to a signal asthe product of two probabilities:
QEðl; yÞ ¼ Aðl; yÞ � PconvðlÞ (1)
where Aðl; yÞ is the probability that the photon isabsorbed in the photocathode, which is a functionof the wavelength l and the incidence angle y; andPconv is the conversion factor for such absorption toresult in an avalanche. Pconv depends on l (due tothe different kinetic energy transferred to thephotoelectron in the absorption process), and—not included in Eq. (1)—on the location of thephoton absorption on the PMT surface and theoperating high voltage. Pconv is here assumedindependent of y; as demonstrated in [7].
The probability QEðl; yÞ is the Quantum Effi-
ciency. In Fig. 1 the typical QE spectra are shownfor two of the most commonly used photo-cathodes: the blue-sensitive bialkali (KCsSb) andthe green-enhanced bialkali (RbCsSb). The curvesare usually measured in air for light impinging atnear normal incidence (y � 0Þ:For most applications the information in Fig. 1
is sufficient, since it characterizes the PMTdetection efficiency for ‘‘standard’’ operations.However, the physics of light interaction with thePMT is more complex. First, the QE is not only afunction of l; but also of y; second, in manydetectors the PMTs are typically coupled to mediawith n41; and not to air; last, the probabilitiesRðl; yÞ and Tðl; yÞ are not implicit in Eq. (1).A precise knowledge of the photocathode
optical properties would allow the functionsQEðl; yÞ; Rðl; yÞ and Tðl; yÞ to be predicted for aPMT in contact with any medium. In spite of thegreat importance of this issue for detector-model-ing, surprisingly very little is documented in theliterature. A major breakthrough was accom-plished by Moorhead and Tanner [8] (hereafterreferred to as M&T), who measured the opticalconstants of a KCsSb bialkali photocathode in anEMI 9124B PMT at the wavelength of l ¼
442 nm; for implementation in the MC simulationof the SNO experiment [5]. The method they usedgave them the ability to break the ambiguity in theoptical constants typical of this kind of determina-tions. In their work M&T also tried to deduce thewavelength dependence of the photocathode re-fractive index, by reinterpreting and reanalyzingearlier measurements at few other wavelengths inthe visible spectrum reported in [9]. Later on, Langused M&T’s technique to check their measure-ments on the same photocathode and to extend theinvestigation to several other photocathodes [10],including the RbCsSb. Lay subsequently exploitedthe same technique to study the performance ofseveral Hamamatsu R1408 PMTs used in SNO [7].However, all of the above measurements werelimited to the single wavelength l ¼ 442 nm:The objective of this work was to extend the
existing measurements on the KCsSb and RbCsSbphotocathodes by covering the whole visible spec-trum and consequently to predict the interaction

ARTICLE IN PRESS
D. Motta, S. Schonert / Nuclear Instruments and Methods in Physics Research A 539 (2005) 217–235 219
of visible light with bialkali PMTs in any experi-mental condition. The two investigated photo-cathodes are the most usual choice in particlephysics. The former is suitable for the detection ofCherenkov light and scintillation light fromprimary fluors, the latter ensures good blue-greensensitivity and matches better the emission spectraof secondary fluors (wavelength-shifters) in three-component organic scintillator mixtures.The original motivation for this work was to
study the impact on the solar neutrino Yb-LENSexperiment [11–13] of light reflections from PMTs.The signature of a ne interaction with the targetnuclide 176Yb is a delayed e� � g coincidence withlife time t ¼ 50 ns: A modular design is envisaged,with Yb dissolved in an organic liquid scintillator.In the investigated detector concept, a fraction ofthe primary scintillation light reflects off the PMTsand is eventually detected at a later time, with adelay given by the time of propagation througha module. This delay is of the order of �30 ns for atypical module length of �4m; hence PMTs-reflected light falls in the time-windosssw of then-signature. Consequently, reflections contributeto increase the probability that single eventsare misidentified as correlated double events, i.e.,ne-candidates [14].More in general, the study of light reflections
from the PMTs is of concern in all detectors wherethis reflected light can cause a delayed signal. Forexample, in Borexino (and similarly in Kam-LAND) reflections weaken the a� b discrimina-tion power, which is based on the fact that theexcitation of organic scintillators from a-particlescreate a larger fraction of late light compared tothe excitation from electrons [1].Another application of the optical model of
PMTs is the prediction of the angular dependenceof the QE, for a PMT operated in air as well as inliquid.
2. Theory and methodology
2.1. Introduction
The photocathode of a PMT is a thin layer of amulti-alkali semiconducting alloy, which is evapo-
rated onto the back side of the glass windowduring production. Light impinging on a photo-cathode is in part reflected, in part absorbed and inpart transmitted. The photocathode thickness is acompromise aiming at maximizing the probabilitythat a photon results in a signal: if the layer is toothin, little light can be absorbed; if it is too thick,the resulting photoelectrons cannot efficientlyescape from the photocathode.The description of such systems is covered by
the optics of thin absorbing films, a wide field onwhich a very rich literature exists (see e.g., thetextbook [15]). The theoretical model merges theoptical description of an absorbing material,through its complex refractive index, and theoptics of thin layers, where the wave fronts ofdifferent orders of reflection are added coherentlyto determine the resulting reflected wave ampli-tude. Assuming that the surface of a photocathodeis sufficiently regular and uniform that the modelof thin films is applicable, then the functionsAðl; yÞ; Rðl; yÞ; Tðl; yÞ are predictable, once thethree parameters of the problem are known: realand imaginary part of the refractive index, n� ¼
n þ ik (i imaginary unit, both n and k function ofthe wavelength) and thickness d of the layer. Thechallenge is to invert the results of opticalmeasurements performed under certain specificconditions (angle of incidence, polarization, re-fractive index of the medium coupled to the PMT)in order to infer the constants n, k and d. This canbe done by fitting the experimental results with theoptical model of the photocathode, with n, k and d
as free parameters.Unfortunately the problem has often a high
degeneracy: for a single measurement (for exampleabsolute reflectance at a certain incidence angle)there exist infinite solutions for (n; k; d) thatreproduce the data. For each considered wave-length at least three independent measurementsare needed, but this is often still insufficient toguarantee the convergence to a unique solution.Several techniques have been developed for the
study of thin solid films (see Refs. [15,16] for areview). However, the photocathode of a PMT is achallenging sample. It cannot be directly studied,because it is not chemically stable when exposedto air. Therefore some optical observables, like

ARTICLE IN PRESS
D. Motta, S. Schonert / Nuclear Instruments and Methods in Physics Research A 539 (2005) 217–235220
reflectance from the photocathode side and itstransmittance, cannot be measured. Furthermore,polarization analysis of the light reflected off thephotocathode can be disturbed by the birefrin-gence that is induced on the glass window by themechanical stress due to the pressure difference(the interior of the PMT is under vacuum). Thelimitations due to these experimental difficultiesare discussed in Sections 3 and 5.
2.2. The model
Dealing with light reflection from a PMT, fourregions can be defined, each characterized by itsown refractive index: the medium where the lightoriginates, with n1; the PMT glass envelope, withn2; the photocathode, with n�
3 ¼ nph þ ikph; andthe vacuum inside the PMT, with n4 ¼ 1: Theamplitudes of the reflected and transmitted wavesat the interface glass-photocathode (n2–n
�3) are
given by the following formulas (see e.g., Ref. [17]for a derivation):
aRðl; yÞ ¼ r23 þt23t32r34 expð�2idÞ1þ r23r34 expð�2idÞ
aT ðl; yÞ ¼t23t34 expð�idÞ
1þ r23r34 expð�2idÞ(2)
where
rij ¼ni cosðyiðjÞÞ � nj cosðyjðiÞÞ
ni cosðyiðjÞÞ þ nj cosðyjðiÞÞ
tij ¼2ni cosðyiÞ
ni cosðyiðjÞÞ þ nj cosðyjðiÞÞ
d ¼2pdn�
3
lcosðy3Þ: (3)
In Eq. (3), nl is the refractive index of the lthregion, yk the angle of the propagating light beamwith respect to the normal in the same region. Thisis calculated using Snell’s law starting from theangle of incidence on the PMT window, y1 y:All functions and variables in Eqs. (2) and (3) arecomplex and the imaginary part of n1; n2 and n4 isset to 0. Eq. (2) holds for both light polarizations,perpendicular and parallel relative to the photo-cathode plane (defined as s and p waves, respec-
tively), provided that the definitions for rij and tij
are changed by swapping the i and j indices asindicated in Eq. (3) (the formulas with first indicesapply to the p-wave).Eq. (2) can be used to predict the total
reflectance of the PMT by adding the Fresnelreflection at the medium-to-window interface(n1–n2) to the reflectance from the photocathode:
Rtotðl; yÞ ¼ 12½Rtots ðl; yÞ þ Rtotp ðl; yÞ�
Rtots;p ðl; yÞ ¼ Fs;p þRs;pð1� F s;pÞ
2
1� F s;pRs;p
Rs;pðl; yÞ ¼ jas;pR j2 (4)
where the quantities:
Fsðl; yÞ ¼sinðy1 � y2Þsinðy1 þ y2Þ
� �2
Fpðl; yÞ ¼tanðy1 � y2Þtanðy1 þ y2Þ
� �2(5)
represent the Fresnel reflection coefficients at theinterface with the PMT window (see Ref. [17]).Similarly for the transmittance:
T totðl; yÞ ¼ 12½T tot
s ðl; yÞ þ T totp ðl; yÞ�
T tots;p ðl; yÞ ¼
Ts;pð1� Fs;pÞ
1� Fs;pRs;p
Ts;pðl; yÞ ¼n4 cosðy4Þn2 cosðy2Þ
jas;pT j2: (6)
The last optical function, absorption, is deducedfrom Eqs. (4) and (6), by using the identity:
Aðl; yÞ ¼ 1� Rðl; yÞ � Tðl; yÞ: (7)
2.3. Experimental approaches
2.3.1. Preliminary remarks
As a consequence of Snell’s law, the angle atwhich a ray of light with a given incidence angleemerges after crossing a series of parallel layersdepends only on the refractive index of the firstand last medium. If n1 ’ 1 (PMT in air) there is nocritical angle for total internal reflection. The part

ARTICLE IN PRESS
D. Motta, S. Schonert / Nuclear Instruments and Methods in Physics Research A 539 (2005) 217–235 221
of the PMT reflectance due to the direct Fresnelcontribution of the window is trivial. In a largeregion of the (n; k; d) parameter space the photo-cathode reflectance1 for both polarizations (givenby Eqs. (4) after subtraction of the windowcontribution F s;p) is nearly constant for yt60�
and then drops to zero (simply because the Fresnelreflection at the window rapidly increases to 100%for y approaching 90�; so that less light can refractand reach the photocathode). Therefore, reflec-tance measurements in air, even at different angles,provide a weak constraint on the solution of thefit, as pointed out by M&T in Ref. [8].On the other hand, if n141 (for example PMT
in water or scintillator), then there is a criticalangle yc above which no light can be transmitted.In this case the photocathode reflectance shows aplateau until yc and then a peculiar shape, verydifferent for parallel and perpendicular polariza-tions. The optical model of the photocathodeshows that, in this case, the free parameters(n; k; d) are strongly constrained by the angulardependence of the reflectance, in particular by theshape around yc:The different behavior of a PMT in air and in a
n � 1:5 medium is illustrated with an example inFig. 2.
2.3.2. Previous measurements
Based on the above observations, M&T havebuilt an experimental set-up to measure thephotocathode reflectance as a function of theangle of incidence for a PMT immersed in water,at the wavelength of l ¼ 442 nm; provided by aHe–Cd laser. With this technique they were able toestablish unambiguously the three optical con-stants of the KCsSb bialkali photocathode theyinvestigated: n ¼ 2:7� 0:1; k ¼ 1:5� 0:1; d ¼
ð23� 2Þnm [8]. The result was obtained by fittingthe data with the same optical model summarizedin Eqs. (2) to (5). The goodness of the best fit wassufficient to demonstrate that the assumed theore-
1Here and throughout this paper we call photocathode
reflectance the fraction of the light incident on the PMT that
is reflected by the photocathode alone; PMT reflectance the
fraction of the light that is reflected by the PMT as a whole,
including the photocathode reflectance and the Fresnel reflec-
tion at the window.
tical model is an acceptable description of thephotocathode. Later on Lang and Lay measuredseveral PMTs equipped with the KCsSb photo-cathode at the same wavelength and found thatthe above parameters are quite typical, thoughPMT-to-PMT deviations may be larger than thestatistical error [7,10].
2.3.3. This work
Our aim was to perform a spectroscopicinvestigation of the optical properties of bialkaliphotocathodes, covering the whole visible spec-trum. For this purpose we used optical instrumen-tation designed to operate in air and our strategywas to break the degeneracy discussed earlier bymaking a global fit to a set of independentmeasurements. This kind of approach is quite‘‘standard’’ in the study of thin solid films, asdiscussed in Ref. [16]. The optical constantsmeasured at l ¼ 442 nm by M&T, Lang and Laygive a further constraint to break the residualambiguities. For a photocathode of a PMT, lightreflected from the glass window side is the onlyaccessible observable. In addition to reflectancedeterminations, we also performed ellipsometric
measurements.Ellipsometry (see Ref. [16]) is based on the
measurement of the change in the polarizationstate of light upon reflection off a plane surface.An ellipsometer consists of a polarizer and ananalyzer: light is linearly polarized, sent to asample and finally the reflected beam is analyzed.In general the reflection changes the polarizationfrom linear to elliptic, in a way that depends on thethree optical constants (n; k; d). Any linear polar-ization can be thought of as the superposition inphase of two orthogonal components. The frameof reference is chosen relative to the sample plane,which defines the parallel p-wave, and the perpen-dicular s-wave. The reflection off a surface changesthe relative intensity ratio between p and s wavesand introduces a phase delay. This change can beexpressed by the ratio of the complex reflectionamplitudes, which translates to an angle and aphase:
apR
asR
¼ tanC eiD (8)

ARTICLE IN PRESS
θ (deg)
θ (deg) θ (deg)
θ (deg)
0 10 20 30 40 50 60 70 80 90
% in
cid
ent
ligh
t
10
20
30
40
50
60
70
80
90
100
Absorbance
Transmittance
Reflectance
0 10 20 30 40 50 60 70 80 90
Ph
oto
cath
od
e R
efle
ctan
ce (
%)
10
20
30
40
50
60
70
80
90
100
unpolarized
p-wav
e
s-wav
e
0 10 20 30 40 50 60 70 80 90
% in
cid
ent
ligh
t
10
20
30
40
50
60
70
80
90
100
Absorbance
Transmittance
Reflectance
0 10 20 30 40 50 60 70 80 90
Ph
oto
cath
od
e R
efle
ctan
ce (
%)
5
10
15
20
25
unpol.
p-wave
s-wave
Fig. 2. Top left: predictions for the photocathode absorption, reflectance and transmittance, assuming the following parametrization:
n1 ¼ 1:5 (scintillator), n2 ¼ 1:51 (glass), n3 ¼ 2:7þ 1:5i (photocathode), n4 ¼ 1 (vacuum); d ¼ 20 nm; l ¼ 442nm: Top right:
reflectance for unpolarized light, s and p waves for the same case. Bottom left: predictions for the same parameters, but PMT in air:
n1 ¼ 1: Bottom right: reflectance for unpolarized light, s and p waves for the same case. In all the plots the ordinates are given in
percent of the incident light, and the first order Fresnel reflection from the glass is not included (for this reason the sum A þ R þ T
drops to zero, for y ! 90�).
D. Motta, S. Schonert / Nuclear Instruments and Methods in Physics Research A 539 (2005) 217–235222
where the amplitudes apR and as
R are given by thefirst row of Eq. (2). The angle C and the phase Dare the two parameters measured by ellipsometry.Ellipsometry is one of the most sensitive
methods for the analysis of thin films and hasthe advantage over conventional reflectometry tobe independent of absolute determinations, wheresystematics are difficult to control. To our knowl-edge, this technique has been applied here for thefirst time to the study of PMT photocathodes.
3. Optical measurements of photocathodes
Two 1:500 PMTs from ETL (Electron TubesLimited) have been investigated, 9102B and9902B, the former equipped with a blue-sensitive
KCsSb bialkali photocathode, the second with agreen-enhanced RbCsSb bialkali photocathode.Both PMTs have a plano–plano window. Themeasurements performed are:
(1)
Absolute reflectance for unpolarized light aty ¼ 7� in the wavelength range (250–700 nm)(2)
Relative reflectance for p and s polarizations aty ¼ 45�; 55�; 65� in the wavelength range(400–700 nm)(3)
Ellipsometric measurement of ðC;DÞ in thewavelength range (420–740 nm)For the cases 2 and 3, the lower limit of theprobed wavelength range is the shortest allowed bythe instrument or the adopted measurementprocedure, as will be explained in the nextsections. The upper limit is arbitrarily chosen, well

ARTICLE IN PRESS
D. Motta, S. Schonert / Nuclear Instruments and Methods in Physics Research A 539 (2005) 217–235 223
above the cut-off of the PMT sensitivity (seeFig. 1).
3.1. Absolute reflectance at a fixed angle
3.1.1. Experimental technique
The PMT absolute reflectance has been mea-sured in air, at near normal incidence (y ¼ 7�),with a V–W accessory of a UV/Visible VarianCary 400 spectrophotometer. The V–W technique(Fig. 3 and relevant caption) allows the measure-ment of the absolute specular reflectance of a flatsample without the use of any reference mirror. Aprecision of ��1% is attainable (instrumentspecification).
3.1.2. Results and discussion
At the V–W level of accuracy, the fluctuationswithin our sample PMTs due to inhomogeneitiesof the photocathode are the dominant uncertainty.Consequently, we report in Fig. 4 the averagespectra from several measurements of both PMTs(relative deviations of � 10% are observed).It is remarkable that both PMTs show a � 20%
reflectance in the visible region. The same rangehas also been measured by us in other bialkaliPMTs and seems to be typical of all the bialkali
M1 M2
Reference
M3
M1 M2
M3
Sample
Fig. 3. Schematic diagram of the V–W technique applied to
measure the absolute reflectance of our sample PMTs. The light
intensity with the apparatus in the ‘‘Sample’’ configuration (IS)
is compared to the one measured in the ‘‘Reference’’ config-
uration (IR). The mirrors M1 and M2 are in a fixed position,
while the mirror M3 can be moved as shown in the right side of
the figure. The sample to measure is located exactly half way
between the two slots for M3. The optical length is the same in
the two configurations, as well as the reflectance at the mirrors
M1, M2 and M3. The only difference is that light in the right-
side configuration must reflect twice on the sample. Thus: R ¼ffiffiffiffiffiffiffiffiffiffiffiffiIS=IR
p: The result is an average of the sample reflectance in
the two illuminated spots. In the V–W accessory of the Varian
Cary 400 spectrophotometer the angle of incidence on the
sample is 7� and the instrument is designed to operate in air.
PMTs [10]. Moreover, we found that the spectralshape of the reflectance is reproduced in otherPMTs equipped with the same kind of photo-cathodes.
3.2. Relative reflectance at variable angles
3.2.1. Experimental technique
The reflectance of the test PMTs has also beeninvestigated with a VASRA accessory (VariableAngle Specular Reflectance Accessory) of ourVarian Cary 400 spectrophotometer. The VASRAallows to measure the specular reflectance of asample in the interval 20�pyp70�: Unlike theV–W accessory, the VASRA has no self-referen-cing capabilities, therefore any measurement needsto be referenced to a calibrated standard.In order to correct for the instrument spectral
baseline, we have referenced the VASRA with theresponse to a VM2000 [18] reflector sample, whichwe have measured to have a nearly flat (at �1%)reflectance spectrum at near normal incidence,with typical R � 98%–99%2 [14]. The measure-ments were limited to lX400 nm; because theVM2000 used as reference has reflectance cut-offat l � 390 nm: A polarizer is employed to selectthe p and s waves before reflection from thesample, and a depolarizer is mounted at the end ofthe optical path to avoid biases related to thesensitivity of the spectrophotometer light sensor tothe polarization state of the outgoing light.Three angles of incidence are considered for the
final analysis: y ¼ 45�; 55�; 65�: This angularrange is chosen because the strongest constraintsin the determination of the photocathode opticalparameters are expected from measurements athigh angles of incidence. Furthermore, the threeselected angles are around the Brewster’s angle forFresnel reflection off the glass, so that the PMT
2This implies an absolute error of t2%; which is howeverinsignificant, since the absolute scale of the measurement will be
left free (see next paragraph). The only significant systematic
error implicit in this procedure is related to the wavelength
dependence of the VM2000 reflectance. At near-normal
incidence, we found Rmax � Rmin ’ 2% in the wavelength range
used for the analysis [14]. Independent measurements at l ¼
430nm reported in the same reference give an indication that
R\98% at all incidence angles.

ARTICLE IN PRESS
Wavelength (nm)250 300 350 400 450 500 550 600 650 700
Ref
lect
ance
(%
)
0
5
10
15
20
25
30
35
KCsSb
RbCsSb
Fig. 4. Average PMT absolute reflectance spectra of an ETL
9102B (blue solid curve) and an ETL 9902B (green dashed
curve). The former has a blue-sensitive KCsSb bialkali
photocathode, the latter a RbCsSb green-enhanced bialkali
photocathode. The reflectance is the sum of the Fresnel
component from the glass window and the dominant photo-
cathode contribution. The short-wavelength cut-off is in both
cases due to the absorption from the glass.
3The process of photocathode growth through evaporation
can lead to some inhomogeneities in the layer thickness. This is
for example observed and studied in Refs. [7,10].
D. Motta, S. Schonert / Nuclear Instruments and Methods in Physics Research A 539 (2005) 217–235224
reflectance of the parallel polarization is largelydominated by the photocathode contribution.
3.2.2. Results and discussion
Fig. 5 displays the average reflectance spectra,where the mean values of a set of X4 repeatedscans are shown. We found that the shape of thecurves are very reproducible, however the absolutescale of the measurement is not (relative deviationsof up to �20% are observed). The reason is thatthe alignment of the VASRA sample holder canchange slightly for different scans, resulting in avariation of the collection efficiency for thereflected light. For this reason, the VASRAmeasurement will be used for spectral shape dataonly, while the absolute normalization of all curvesis considered as a free parameter of the fit function(to be discussed in Section 4).
3.3. Ellipsometric measurements
3.3.1. Experimental technique
The ellipsometric measurements have beenperformed with a M-44 Vis J.A. Woollam spectralellipsometer. The instrument allows the simulta-neous measurement of 44 discrete wavelengths in
the range (419–742 nm). The angle of incidence onthe sample was y ¼ 60:75� � 0:01�; measured byellipsometry itself on a reference SiO2 film. Lightwas linearly polarized and the polarization state oflight upon reflection was analyzed by decomposingthe elliptical polarization into the parameters Cand D of Eq. (8). The thickness of the PMT glasswindow was sufficient to allow a clear separationof the beams reflected off the glass and thephotocathode, so that it was possible to selectonly the latter light to the analyzer. This selectionfacilitates the succeeding interpretation of data.For both PMTs three ellipsometric scans havebeen performed, corresponding to the illuminationof different spots of the photocathode.
3.3.2. Results and discussion
The results are shown in Fig. 6. It can be seenthat for the PMT ETL 9102B the three scans of theCðlÞ function are in excellent agreement with eachother, while the DðlÞ spectra measured in differentpositions are similar, but shifted by nearlyconstant phases. This is likely to be an artifactintroduced by stress-birefringence of the PMTglass window. This stress is different in differentpositions, and this can explain the observed phaseshifts in the three measurements of DðlÞ: Differ-ences are also observed in the CðlÞ scans of theETL 9902B PMT. It is likely that this effect is dueto a inhomogeneous photocathode thickness.3
4. Data analysis
In Section 2.1 the equations describing theoptical model of a thin absorbing film have beenintroduced and in Section 3 all the opticalmeasurements performed on two sample PMTshave been reported. The purpose of data analysisis to combine theory and experiments to derive theunknowns of the problems. Those unknowns are:
(1)
The photocathode refractive index, n�ðlÞ ¼nðlÞ þ ikðlÞ(2)
The photocathode thickness, d
ARTICLE IN PRESS
Wavelength (nm)400 450 500 550 600 650 700
PM
T R
efle
ctan
ce (
%)
0
5
10
15
20
25
30
= 45θ = 55θ = 65θ
P-Wave ETL9102
Wavelength (nm)400 450 500 550 600 650 700
PM
T R
efle
ctan
ce (
%)
0
10
20
30
40
50
60
S-Wave ETL9102
Wavelength (nm)400 450 500 550 600 650 700
PM
T R
efle
ctan
ce (
%)
0
5
10
15
20
25
30
P-Wave ETL9902
Wavelength (nm)400 450 500 550 600 650 700
PM
T R
efle
ctan
ce (
%)
0
10
20
30
40
50
60
S-Wave ETL9902
Fig. 5. Reflectance spectra of the PMTs ETL 9102B (top) and ETL 9902B (bottom) for parallel (left) and perpendicular (right)
polarized light, recorded with a Varian Cary400 spectrophotometer by using the VASRA accessory. Ordinates are given in percent of
the incident light, but the uncertainty in the absolute normalization of the measurements is large (see text). The three shown spectra per
PMT and polarization state correspond to different angles of incidence: y ¼ 45� (red), 551(green dashed), 651(blue dot–dashed).
D. Motta, S. Schonert / Nuclear Instruments and Methods in Physics Research A 539 (2005) 217–235 225
For simplicity, it will be assumed that the glassrefractive index is a known function:
nglass ¼ 1:472þ 3760=l2: (9)
Eq. (9) is the Cauchy dispersion law with thetypical parameters of the borosilicate glass em-ployed for the PMT envelope.4
4The refractive index of the borosilicate glass is measured by
many manufacturers to be in the range 1:48tnt1:50 in thevisible spectrum. Eq. (9) gives nð380nmÞ ’ 1:50; nð680nmÞ ’
1:48 and nð442nmÞ ’ 1:49: The latter value has been directlymeasured by M&T [8]. It has been also verified that fixing
nglass ¼ c; where c is any constant in the above range, leads to
similar results in the analysis.
We have written a computer program imple-menting Eqs. (2)–(5), which is used to perform aglobal fit to the experimental data based on a leastsquare minimization. The program uses thepackage MINUIT of the CERN software librariesto perform such minimization. The global para-meter d is easily implemented, while real andimaginary part of the photocathode refractiveindex are continuous functions of the wavelength.They are implemented in the global fit as a table ofparameters at discrete wavelengths, from 380 to680 nm with steps of 15 nm, and then interpolatedat each data-point wavelength by using a cubicspline function. As mentioned in Section 3, someof our measurements suffer from systematics

ARTICLE IN PRESS
Wavelength (nm)
450 500 550 600 650 700
(d
eg)
Ψ
20
25
30
35
40
45
Wavelength (nm)
450 500 550 600 650 700
(d
eg)
∆
134
136
138
140
142
144
146
148
150
152
154
Wavelength (nm)
450 500 550 600 650 700
(d
eg)
Ψ
25
30
35
40
45
Wavelength (nm)
450 500 550 600 650 700
(d
eg)
∆
140
145
150
155
160
Fig. 6. Ellipsometric measurements on a ETL 9102B (top) and a ETL 9902B (bottom) PMT. The graphics show the wavelength
spectra of the C and D functions. The three curves in each frame correspond to different illuminated spots on the PMTs (red solid:center; green dashed and blue dashed–dotted: close to the edge, at � 90� from each other). The plots refer to the measurement of the
light reflected from the back-plane of the PMT window, where the photocathode layer is situated. The instrument was set at an
ellipsometric angle of y ¼ 60:75�:
D. Motta, S. Schonert / Nuclear Instruments and Methods in Physics Research A 539 (2005) 217–235226
implying a partial loss of information. This forcesthe introduction of new free parameters in the fit:
(1)
5I
avai
420
400
opti
wav
Six normalization factors for the VASRA reflec-tance measurements, expressing the systematicuncertainty in the absolute scale of the scans
(2)
One constant phase-shift for the average Dellipsometric spectrum, accounting for theeffect of the glass birefringenceThe fit is performed in the wavelength range(380 nm, 680 nm).5
n the interval (380 nm, 400 nm) only the V–W data is
lable. In (400 nm, 420 nm) V–W plus VASRA. Above
nm the full data-set. The degeneracy in the (380 nm,
nm) interval is broken by requiring the continuity of the
cal functions (the photocathode thickness is common to all
elengths).
The function FCN minimized by MINUIT isexpressed as the sum of four contributions: FCN ¼
FCNV�W þ FCNVASRA þ FCNC þ FCND: Eachone, FCNl ; is defined as:
FCNlðpjÞ ¼1
n
Xn
i¼1
yli � mlðli; pjÞ
h i2(10)
where yli is the value of the lth optical measurementat the wavelength li and mlðli; pjÞ is theprediction of the theoretical model, for aparticular choice of the parameters set fpjg:Eq. (10) is normalized to the total numberof data-points n to have each measurementcontribute the same statistical weight in theglobal fit.

ARTICLE IN PRESS
D. Motta, S. Schonert / Nuclear Instruments and Methods in Physics Research A 539 (2005) 217–235 227
5. Results
5.1. Preliminary remarks and analysis strategy
The inversion of our experimental data by usingthe described fitting procedure does not lead to aunique solution. We find that our measurementsare sufficient to constrain the spectral shape of theoptical constants, however there are strong corre-lations in the fit between n, k and d, so that theFCN function does not show a well-definedminimum. The reason is that our measurementsare not really ‘‘orthogonal’’ and because of thesystematics discussed in Section 3, the VASRAand ellipsometric data provide only partial in-formation. Furthermore, measurements in air giveweaker constraints than measurements in higherrefractive index media, as the model is highlydegenerate in the optical parameters for this case(see Section 2.3).The values of the photocathode complex refrac-
tive index measured by M&T, Lang and Lay atl ¼ 442 nm provide the missing constraint to breakthe residual degeneracy at all wavelengths. In fact,solutions can be found consistent with thoseprevious determinations, however provided that theellipsometric CðlÞ data are corrected by introducinga free angular shift. Since the physical meaning ofsuch a parameter is less clear than for the case of theexpected phase-shift of the DðlÞ function, in thispaper we present an analysis of our data in whichCðlÞ is not included in the global fit. The consistencyof the CðlÞ spectrum with the other data and theoptical model is discussed in the next section.The analysis for the KCsSb photocathode is
carried out by requiring the solution to beconsistent with the optical constants measured byM&T at 442 nm, and later confirmed by Lang andLay. This means that we fix n ¼ 2:7� 0:2; k ¼
1:5� 0:2 at l ¼ 440 nm (the closest wavelength to442 nm in our parameters table). The onlypublished measurements on RbCsSb photo-cathodes using the M&T technique are reportedin Ref. [10]. A large scatter is observed, howeverthe two samples manufactured by ETL andexpected to be very similar to our ETL 9902Bgive consistent results. We therefore fix the opticalconstants at l ¼ 440 nm to the average value of
these PMTs: n ¼ 2:5� 0:2; k ¼ 1:35� 0:1: Foreither photocathode the quoted errors are ��2s:Fixing the optical constants at the given
wavelength in the global fit (where the CðlÞ scanis excluded) breaks the degeneracy and leads tounique solutions for the photocathode thickness d
and the spectra nðlÞ and kðlÞ: The uncertaintyassociated with the error of the optical param-eters at 440 nm is accounted for by calculating an‘‘upper’’ solution with fixed ðn; kÞKCsSb ¼ ð2:9; 1:7Þand ðn; kÞRbCsSb ¼ ð2:7; 1:45Þ; and a ‘‘lower’’ solu-tion for ðn; kÞ ¼ ð2:5; 1:3ÞKCsSb and ðn; kÞRbCsSb ¼ð2:3; 1:25Þ: The band between these two solutionsdefines our 2s confidence interval for real andimaginary part of the complex refractive index atall wavelengths, and as well for the photocathodethickness. This choice of estimating the errors isjustified by the fact that in M&T’s and Lang’s fit todata, as well as in ours, n and k are stronglycorrelated. We estimate that the additional un-certainty coming from the fit of our data is smallcompared to the one associated with the error ofthe fixed optical parameters.
5.2. KCsSb bialkali photocathode
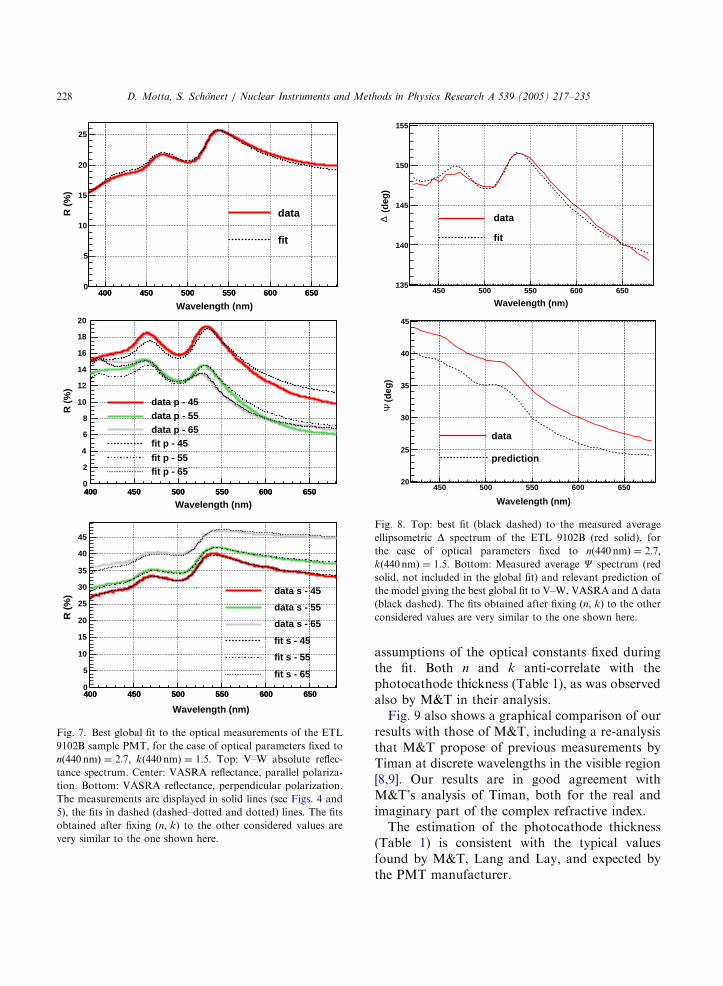
An example of global fit to the optical measure-ments performed on the PMT ETL 9102B isshown in Figs. 7 and 8, while Fig. 9 shows the bestfit solutions for the complex refractive index andthe 2s allowed bands. In Table 1 the otherparameters of the fit are reported.Fig. 8 also shows the prediction of the best fit
model for the CðlÞ ellipsometric function, not usedfor the global fit. It is remarkable that thepredicted spectral shape is in excellent agreementwith the measurement. Data and model simplydiffer by a constant angular shift, which isprobably due to an unimplemented systematiceffect related to the glass birefringence. Anadditional free offset might be introduced toinclude the CðlÞ data in the global fit. Howeverthe figure shows that this information wouldsimply be redundant.The results in Fig. 9 show that the spectral shape
of the real and imaginary part of the photocathoderefractive index is well constrained by thedata, while the absolute scale depends on the
ARTICLE IN PRESS
400 450 500 550 600 650
Wavelength (nm)
400 450 500 550 600 650
R (
%)
0
5
10
15
20
25
30
35
40
45
data s - 45
data s - 55
data s - 65
fit s - 45
fit s - 55
fit s - 65
400 450 500 550 600 650
Wavelength (nm)400 450 500 550 600 650
R (
%)
0
2
4
6
8
10
12
14
16
18
20
data p - 45data p - 55data p - 65fit p - 45
fit p - 55fit p - 65
400 450 500 550 600 650
Wavelength (nm)400 450 500 550 600 650
R (
%)
0
5
10
15
20
25
data
fit
Fig. 7. Best global fit to the optical measurements of the ETL
9102B sample PMT, for the case of optical parameters fixed to
nð440nmÞ ¼ 2:7; kð440nmÞ ¼ 1:5: Top: V–W absolute reflec-
tance spectrum. Center: VASRA reflectance, parallel polariza-
tion. Bottom: VASRA reflectance, perpendicular polarization.
The measurements are displayed in solid lines (see Figs. 4 and
5), the fits in dashed (dashed–dotted and dotted) lines. The fits
obtained after fixing ðn; kÞ to the other considered values are
very similar to the one shown here.
Wavelength (nm)450 500 550 600 650
(d
eg)
135
140
145
150
155
data
fit
Wavelength (nm)
450 500 550 600 650
(d
eg)
20
25
30
35
40
45
data
prediction
∆Ψ
Fig. 8. Top: best fit (black dashed) to the measured average
ellipsometric D spectrum of the ETL 9102B (red solid), for
the case of optical parameters fixed to nð440nmÞ ¼ 2:7;kð440nmÞ ¼ 1:5: Bottom: Measured average C spectrum (red
solid, not included in the global fit) and relevant prediction of
the model giving the best global fit to V–W, VASRA and D data(black dashed). The fits obtained after fixing ðn; kÞ to the other
considered values are very similar to the one shown here.
D. Motta, S. Schonert / Nuclear Instruments and Methods in Physics Research A 539 (2005) 217–235228
assumptions of the optical constants fixed duringthe fit. Both n and k anti-correlate with thephotocathode thickness (Table 1), as was observedalso by M&T in their analysis.Fig. 9 also shows a graphical comparison of our
results with those of M&T, including a re-analysisthat M&T propose of previous measurements byTiman at discrete wavelengths in the visible region[8,9]. Our results are in good agreement withM&T’s analysis of Timan, both for the real andimaginary part of the complex refractive index.The estimation of the photocathode thickness
(Table 1) is consistent with the typical valuesfound by M&T, Lang and Lay, and expected bythe PMT manufacturer.

ARTICLE IN PRESS
Table 1
Best fit photocathode thickness, VASRA normalization factors (scale factors for the model to fit data) and D phase shift for the ETL9102B sample
d (nm) VASRA normalization factors D-shift (deg)
p � 45� p � 55� p � 65� s � 45� s � 55� s � 65�
Central solution 20.0 1.09 1.00 0.97 1.18 1.09 1.04 �9.5
‘‘Upper’’ solution 16.5 1.05 0.94 0.90 1.19 1.10 1.04 �11.0
‘‘Lower’’ solution 25.0 1.14 1.09 1.10 1.17 1.08 1.03 �7.9
Wavelength (nm)400 450 500 550 600 650
Ref
ract
ive
Ind
ex (
real
par
t)
1
1.5
2
2.5
3
3.5
4
Wavelength (nm)400 450 500 550 600 650
Ref
ract
ive
Ind
ex (
imag
inar
y p
art)
0
0.5
1
1.5
2
2.5
Fig. 9. Best fit spectra and 2s allowed bands for real (left) and imaginary (right) part of the complex refractive index of a KCsSbphotocathode. The solid curves correspond to the global fit constrained by fixing n and k to M&T’s best values at l ¼ 440nm: n ¼ 2:7;k ¼ 1:5: The dashed and dotted curves are the results of the fit after fixing the optical constants at the above wavelength 2s away fromM&T’s best value. The markers show M&T’s analysis of their own data at l ¼ 442nm and their re-analysis of previous measurements
from Timan [8,9]. Error bars are �1s:
D. Motta, S. Schonert / Nuclear Instruments and Methods in Physics Research A 539 (2005) 217–235 229
5.3. RbCsSb bialkali photocathode
We have carried out a similar analysis for theoptical measurements on the PMT ETL 9902B(RbCsSb bialkali). The estimated real and complexpart of the refractive index as a function of thewavelength are plotted in Fig. 10.The solutions show similar features to the case
of the KCsSb: the spectral shapes are wellconstrained by data and shifting the values at440 nm fixed during the fit produces a correspond-ing shift of the entire spectra, which is com-pensated by an anti-correlated change in thephotocathode thickness (Table 2).
6. Discussion and applications
In the previous section it has been shown thatour measurements, in conjunction with M&T’s
(KCsSb) and Lang’s (RbCsSb) at l ¼ 442 nm; leadto unique solutions for the optical constants of theinvestigated photocathodes in the full visiblerange. In the following sections we report theoptical performances of bialkali PMTs predictedby our model for some specific cases. We also tryto probe the degree of predictability of our modeland to evaluate the uncertainties originating fromthe ambiguity left in the problem. In all thecalculations it will be assumed that light impingingon the PMT is unpolarized.It should be noted that even with a precise
determination of the photocathode optical para-meters in one PMT, the problem of predicting thebehavior of any other similar PMT would stillremain to some extent indeterminate, because thethickness of the photocathode can vary up to afactor �2 from one PMT to another, as shown byLang. Therefore we point out that the predictionsand relevant uncertainties presented in the next

ARTICLE IN PRESS
Table 2
Best fit photocathode thickness, VASRA normalization factors (scale factors for the model to fit data) and D phase shift for the ETL9902B sample
d (nm) VASRA normalization factors D-shift (deg)
p � 45� p � 55� p � 65� s � 45� s � 55� s � 65�
Central solution 23.4 1.17 1.07 0.98 1.40 1.25 1.13 �11.2
‘‘Upper’’ solution 19.4 1.14 1.03 0.93 1.41 1.25 1.13 �12.3
‘‘Lower’’ solution 29.0 1.21 1.14 1.07 1.40 1.24 1.12 �9.9
Wavelength (nm)400 450 500 550 600 650
Ref
ract
ive
Ind
ex (
Rea
l Par
t)
0
0.5
1
1.5
2
2.5
3
3.5
4
Wavelength (nm)
400 450 500 550 600 650
Ref
ract
ive
Ind
ex (
imag
inar
y p
art)
0
0.2
0.4
0.6
0.8
1
1.2
1.4
1.6
Fig. 10. Best fit spectra and 2s allowed bands for real (left) and imaginary (right) part of the complex refractive index of a RbCsSbphotocathode. The solid curves correspond to the global fit constrained by fixing n and k to Lang’s best values at l ¼ 440nm: n ¼ 2:5;k ¼ 1:35: The dashed and dotted curves are the results of the fit after fixing the optical constants at the above wavelength 2s away fromLang’s best value.
D. Motta, S. Schonert / Nuclear Instruments and Methods in Physics Research A 539 (2005) 217–235230
sections refer specifically to the two measuredsample PMTs. The model can be extended to anygeneric KCsSb and RbCsSb PMT, however with asomewhat larger uncertainty. We do not discusshere the effect of the dependence of the PMToptical properties on the photocathode thickness.This issue is examined in [8,7].Several cases may be considered as for the
coupling of the PMT to the medium where thelight originates. We will focus on the case of aKCsSb PMT optically coupled to a scintillator.For simplicity, it will be assumed nmedium ¼ 1:48 atall wavelength, so that the medium refractive indexis slightly lower than that of the PMT windowglass at all wavelengths in the visible.
6.1. Wavelength dependence of the reflectance
Fig. 11 reports the wavelength dependence ofthe PMT reflectance at various angles, calculated
for our sample ETL 9102B in (or coupled to) amedium with n ¼ 1:48:At near normal incidence the spectrum is very
similar to the one measured in air (cf. Fig. 3) anddoes not change much until y approaches yc(’ 42�Þ: Above the critical angle the spectrumbehaves differently, with higher reflectance atlonger wavelengths: since transmission is sup-pressed for y4yc and absorption decreases withl (to discuss in Section 6.4, cf. Fig. 16), thereflectance must necessarily compensate, to pre-serve A þ R þ T ¼ 1:The predictions for the RbCsSb photocathode
are qualitatively very similar. The only visibledifference is that the main features of the spectra(peaks below yc; slope change above) appear�40 nm shifted to longer wavelengths, coherentlywith all the optical measurements.In Fig. 12 it is shown how the indetermination in
our model affects the predictions: for yoyc all the

ARTICLE IN PRESS
Wavelength (nm)400 450 500 550 600 650
PM
T R
efle
ctan
ce (
%)
0
10
20
30
40
50
60
70
80
= 85θ
= 60θ
= 45θ
= 40θ
= 5θ
Fig. 11. PMT reflectance as a function of the wavelength at
some angles of incidence, calculated for the sample ETL 9102B
in a medium with n ¼ 1:48; choosing the central solution shownin Fig. 9.
Wavelength (nm)400 450 500 550 600 650
PM
T R
efle
ctan
ce (
%)
0
10
20
30
40
50
60
70
80upper solution
lower solution
= 45θ
= 60θ
= 5θ
Fig. 12. Comparison between the PMT reflectance spectra
(ETL 9102B) calculated using the ‘‘upper’’ (dashed–dotted) and
‘‘lower’’ (dashed) solutions of Fig. 9 and the corresponding
thickness in Table 1. The two curves for y ¼ 5� are not
distinguishable in the figure.
D. Motta, S. Schonert / Nuclear Instruments and Methods in Physics Research A 539 (2005) 217–235 231
solutions in the allowed bands give nearly the sameresults, whereas at higher angles some differencesare observed. This is related to the fact that theoptics of a PMT in liquid below the critical angledoes not differ very much from that of a PMT inair (after taking into account the Fresnel reflectionfrom the glass). The selected solutions are thosethat fit best the measurements in air, consequentlythey also make very similar predictions for a PMTin liquid at yoyc: On the other hand, also abovethe critical angle the difference in the predictionsof the allowed solutions is o10%:
6.2. Angular dependence of reflectance and
absorption
In Fig. 13 the angular dependence of the PMTreflectance and effective absorption6 is shown for
6The effective absorption includes also the fraction of
transmitted light that is back reflected onto the photocathode
by the aluminized internal surface of the PMT, and is eventually
absorbed. For simplicity we do not simulate the optics inside
the PMT and assume that on average a fraction �0:7 of thetransmitted light (T) hits the photocathode again. The
probability for absorption is given by the same optical model
described in Section 2.1, simply by exchanging the order of the
refractive indices, going from vacuum to scintillator. Absorp-
tion from the photocathode side is a very flat function of y:Using the central solution model for the PMT ETL 9102B, we
find: Að410nmÞ � 0:44;Að440nmÞ � 0:41;Að500nmÞ � 0:35;Að560nmÞ � 0:22: These values are multiplied by 0:7T and
four representative wavelengths. In all cases thereflectance has a plateau below yc; then a sharppeak at the critical angle, followed by an extendedangular region where R has similar or highervalues than at near normal incidence; last R has afast increase to 100% for y ! 90�: Similarly theeffective absorption has a flat angular dependencefor yoyc; a dip at the critical angle, followed bya broad peak and it then drops to zero, sinceA þ R ¼ 100% (T ¼ 0 for y4yc). At differentwavelengths the branching between reflection andabsorption changes, as well as the shape of thepeak around the critical angle.In Fig. 14 the impact on RðyÞ of the uncertainty
of the optical parameters is studied, for the PMTETL 9102B at l ¼ 425 nm: It is again found thatall the allowed solutions give the same predictionsfor yoyc; whereas they differ slightly from eachother at larger angles of incidence. The strongestdepartures (t20%) are observed in a narrowangular range around yc and for 65�tyt80�:The analysis of the RbCsSb photocathode leads
to very similar predictions. In case nmedium4nglass
(footnote continued)
added to the absorption from the scintillator side to obtain the
effective absorption function. The effect of this correction is to
increase absorption below the critical angle, resulting in a
higher QE. As a by-product, the PMT efficiency has a more
uniform angular dependence.

ARTICLE IN PRESS
(deg)θ0 10 20 30 40 50 60 70 80 90
PM
T R
efle
ctan
ce (
%)
0
10
20
30
40
50
60
70
80
90
100 = 410 nmλ = 440 nmλ = 500 nmλ = 560 nmλ
(deg)θ0 10 20 30 40 50 60 70 80 90
PM
T E
ffec
tive
Ab
sorp
tio
n (
%)
0
10
20
30
40
50
60
70
80
90
100
Fig. 13. Predicted angular dependence of reflectance and effective absorption (see footnote 6 for the definition), for the investigated
ETL 9102B PMT in optical contact with a scintillator (n ¼ 1:48), at four representative wavelengths.
Wavelength (nm)0 10 20 30 40 50 60 70 80 90
PM
T R
efle
ctan
ce (
%)
0
10
20
30
40
50
60
70
80
90 upper solution
lower solution
Fig. 14. Reflectance calculated for the investigated PMT ETL
9102B operating in optical contact with a scintillator (n ¼ 1:48),at the wavelength l ¼ 425nm: The predictions for the limit‘‘upper’’ and ‘‘lower’’ solutions of the allowed bands are shown.
D. Motta, S. Schonert / Nuclear Instruments and Methods in Physics Research A 539 (2005) 217–235232
the same qualitative features are observed, how-ever, the reflectance (absorption) goes to 100%(0%) below 90�; corresponding to the conditionfor total internal reflection at the medium–glassinterface.
6.3. Angular dependence of the quantum efficiency
Assuming that the conversion factor PconvðlÞ inEq. (1) does not depend on y (see Ref. [7]), theangular dependence of the PMT QE is the same asthat of the effective absorption. As a consequence,the efficiency of a PMT can be predicted for any yand l by rescaling the calculated effective ab-sorption at y with PconvðlÞ; given by the ratioQEðlÞ=AðlÞ at near-normal incidence. As anexample, in Fig. 15 the predicted QEðyÞ is plotted,for the ETL 9102B in scintillator and air, at thewavelength of 410 nm. The curves are calculatedby rescaling the effective absorption in such a waythat the QE in air at normal incidence is 27%. It isobserved that both curves have a plateau, extend-ing up to y ’ 40� in scintillator and y ’ 50� in air.The QE in liquid is expected to be slightly higherthan in air, because of the Fresnel reflection at thewindow. As in Fig. 13, PMTs in liquids have apeak sensitivity in the range 45�tyt75�: On theother hand, PMTs in air lose sensitivity above
�50�; because the Fresnel reflection from the glasswindow increases.
6.4. Qualitative understanding of the PMT
sensitivity
In this section we show that the model isalso able to explain qualitative features of the

ARTICLE IN PRESS
(deg)θ0 10 20 30 40 50 60 70 80 90
QE
(%
)
0
5
10
15
20
25
30
35
40
PMT in scintillator
PMT in air
Fig. 15. Predicted angular dependence of the QE, for the case
of the ETL9102B PMT in scintillator (n ¼ 1:48; black dashed-dotted curve) and in air (n ’ 1; red dashed curve). The opticalparameters corresponding to l ¼ 410nm are used and the
plotted curves are obtained by rescaling the effective absorp-
tion, assuming QEð410nmÞ ¼ 27% in air, for y ¼ 0�:
Wavelength (nm)
400 450 500 550 600 650
Ab
sorp
tio
n (
% in
cid
ent
ligh
t)
0
10
20
30
40
50
60
Fig. 16. Photocathode absorption calculated for PMTs in air
and light impinging with y ¼ 5�: The blue-solid curve refers tothe ETL 9102B sample, the green-dashed to the ETL 9902B.
The central solutions in Figs. 9 and 10 and Tables 1 and 2 are
chosen.
D. Motta, S. Schonert / Nuclear Instruments and Methods in Physics Research A 539 (2005) 217–235 233
wavelength dependence of the PMT QE. The latteris related to the photocathode absorption,7 asexpressed in Eq. (1). Fig. 16 shows the wavelengthdependence of the absorption, deduced from ourmodel (central solutions) for PMTs in air at nearnormal incidence. The figure shows that the green-enhanced bialkali photocathode has a plateau ofmaximum absorption extending further into the‘‘green’’ visible region, compared to the blue-sensitive bialkali. Absorption is largely determinedby the imaginary part of the refractive index, sothat the features of the calculated spectra reflectthe shape of the kðlÞ functions in Figs. 9 and 10.There it is also found that the imaginary part ofthe RbCsSb refractive index peaks at longerwavelengths compared to KCsSb.We note that the correct prediction of the
sensitivity of the two photocathodes, though onlyqualitative, is nontrivial, because it is basedexclusively on the study of the reflected light.However, the calculated absorption spectra are indisagreement with the reported QE (see Fig. 1),especially in the tail, where the QE drops to zero,while the model predicts only a factor of �3reduction. This may be explained by postulating
7For this qualitative discussion we use the simple absorption,
instead of the effective absorption.
that the conversion factor PconvðlÞ in Eq. (1)vanishes at long wavelengths: photoelectrons areindeed produced, but with insufficient kineticenergy to escape the photocathode. Lay alsocomes to the same conclusion in Ref. [7].
7. Conclusions
We have investigated the optical properties inthe visible range of two test ETL PMTs, 9102Band 9902B, equipped with a ‘‘blue-sensitive’’KCsSb and a ‘‘green-enhanced’’ RbCsSb bialkaliphotocathode, respectively. This study includes thespectroscopic measurement of the absolute reflec-tance at near normal incidence, of the polariza-tion-dependent relative reflectance at variableangles, and of the change in the light polarizationupon reflection off the photocathode. We havefitted the experimental data with a model based onthe optics of thin films to determine the photo-cathode thickness and its wavelength-dependentcomplex refractive index. Degenerate solutionsappeared, however the fit converges to a uniquesolution once the complex refractive index of thephotocathode is fixed at a single wavelength, forexample to the value determined by other authorsat l ¼ 442 nm: Based on this observation, we

ARTICLE IN PRESS
Table 3
We report the best fit refractive indices for the two photo-
cathodes, from 380nm to 680 nm in 15 nm steps, as imple-
mented in the minimization code
KCsSb RbCsSb
l (nm) n k n k
380 1.92 1.69 2.07 1.22
395 2.18 1.69 2.22 1.17
410 2.38 1.71 2.30 1.21
425 2.61 1.53 2.40 1.27
440 2.70 1.50 2.50 1.35
455 2.87 1.44 2.63 1.40
470 3.00 1.34 2.81 1.41
485 3.00 1.11 2.99 1.37
500 3.00 1.06 3.16 1.21
515 3.09 1.05 3.22 1.04
530 3.26 0.86 3.21 0.90
545 3.20 0.63 3.23 0.86
560 3.12 0.53 3.32 0.76
575 3.06 0.46 3.39 0.59
590 3.01 0.42 3.28 0.46
605 2.98 0.38 3.22 0.43
620 2.96 0.37 3.18 0.40
D. Motta, S. Schonert / Nuclear Instruments and Methods in Physics Research A 539 (2005) 217–235234
could predict the optical properties of both PMTsin the wavelength region (380 nm, 680 nm), and forany angle of incidence and coupling. As anexample, we have studied in detail the case of aKCsSb PMT coupled to a scintillator. The modelpredicts that the reflectance as a function of theangle of incidence on the PMT is nearly constantfor 0�oyt40�; with values of R � 15–25%,depending on the wavelength. It was shown thatin this angular range the predictions of the modelare very robust, since they are strongly constrainedby the direct measurement of the PMT reflectance.Above the critical angle (y\42�) the degeneracy isbroken and the uncertainty of the model islarger. However, also in this case quantitativepredictions are made, at the level of t10%precision (2s). As another application of thisstudy, through the calculated angular dependenceof the photocathode absorption, the quantumefficiency of a PMT, normally measured in airfor near-normal illumination, can be predicted forany angle and coupling. For the case of PMT inscintillator, we found that the PMT hasnearly constant sensitivity for yoyc; a �20%higher efficiency for 45�tyt75� and a vanishingefficiency for y ! 90�; where the PMT reflectancegoes to 100%. The sensitivity of a PMT in air isexpected to have a plateau for yt50�andthen to decrease monotonically down to 0%for y ! 90�; due to the Fresnel reflection at theglass window.The description of light interaction with the
bialkali PMTs reported in this paper covers mostof the experimental conditions in which thesedevices are used. Therefore this model is suitablefor implementation in photon-tracing MonteCarlo codes, through formulas 2–7, the inputoptical parameters nðlÞ; kðlÞ shown in Figs. 9 and10 and listed in Appendix A, and the typicalphotocathode thickness reported in Tables 1and 2.
635 2.95 0.35 3.15 0.38
650 2.95 0.34 3.14 0.37
665 2.95 0.34 3.14 0.37
680 2.96 0.33 3.13 0.35
The central solutions are shown, which correspond to a fixed
n ¼ 2:70 and k ¼ 1:50 for the KCsSb photocathode, and n ¼
2:50 and k ¼ 1:35 for RbCsSb, at 440 nm. The relevant best fitthicknesses are 20.0 nm and 23.4 nm, respectively.
Acknowledgements
We would like to acknowledge the helpfulsupport of Ron Stubberfield from ETL forproviding the test PMT samples and many useful
documentation. We thank Dr. M.E. Moorhead forhelpful discussions. We are in debt with Prof.Grunze of the Institute for applied physicalchemistry of the University of Heidelberg for theuse of the ellipsometer, and with Dr. ThimoBastuck for the precious assistance in the ellipso-metric measurements. We thank Dr. F. Dalnoki-Veress for careful reading of the manuscript andhelpful suggestions.
Appendix A
Table 3 shows the best fit refractive indices forthe two photocathodes.

ARTICLE IN PRESS
D. Motta, S. Schonert / Nuclear Instruments and Methods in Physics Research A 539 (2005) 217–235 235
References
[1] G. Alimonti, et al., Astrop. Phys. 16 (2002) 205.
[2] F. Ardellier, et al., Double-Chooz collaboration, Letter of
Intent for Double-CHOOZ: a Search for the Mixing Angle
Theta13, hep-ex/0405032.
[3] K. Eguchi, et al., Phys. Rev. Lett. 90 (2003) 021802.
[4] M. Nakahata, et al., Nucl. Instr. and Meth. A 421 (1999)
113.
[5] J. Boger, et al., Nucl. Instr. and Meth. A 449 (2000) 72.
[6] For other projects see e.g., Proceedings of the Neutrino
2004 conference, Paris, June 14–19 2004, Nucl. Phys. B
(Proc. Suppl.), in press. URL: http://neutrino2004.
in2p3.fr/.
[7] M.D. Lay, Nucl. Instr. and Meth. A 383 (1996) 485;
M.D. Lay, M.J. Lyon, Nucl. Instr. and Meth. A 383 (1996)
495.
[8] M.E. Moorhead, Reflectors in Cherenkov Detectors,
Ph.D. Thesis, University of Oxford (1992); M.E. Moor-
head, N.W. Tanner, Nucl. Instr. and Meth. A 378 (1996)
162.
[9] H. Timan, Revue Technique Thomson-CSF, 8 (1976).
[10] T. Lang, Photocathode characterisation, Thorn EMI
research report X.2818/1A (1993).
[11] R.S. Raghavan, Phys. Rev. Lett. 78 (1997) 3618.
[12] S. Schonert for the LENS collaboration, Proceedings of
the 30th International Conference on High Energy Physics,
vol. II, 975, World Scientific, Singapore, 2000.
[13] C. Buck, et al., Nucl. Phys. B (Proc. Suppl.) 118 (2003)
450.
[14] D. Motta, Feasibility Analysis and Prototype Measure-
ments of a Novel Approach for the Real-Time Spectro-
scopy of Low Energy Solar Neutrinos, Dissertation,
University of Heidelberg, 2004.
[15] O.S. Heavens, Optical Properties of Thin Solid Films,
Dover Publication, New York, 1991.
[16] H.G. Tompkins, W.A. McGahan, Spectroscopic Ellipso-
metry and Reflectometry, a user guide, Wiley, New York,
1999.
[17] M. Born, E. Wolf, Principle of Optics, Pergamon Press,
Oxford, 1964.
[18] M.F. Weber, et al., Science 287 (2000) 2451.