Embed Size (px)
Citation preview

Spatial and Social Inequities in HIV Testing Utilization in the Context of Rapid Scale-up of HIV/AIDS Services in Rural Mozambique
Jing Yao1, §, Victor Agadjanian2, Alan T. Murray3
1Centre for GeoInformatics, School of Geography and Geosciences, University of St Andrews, St Andrews, Fife, KY16 9AL, Scotland, UK
2Center for Population Dynamics, T. Denny Sanford School of Social and Family Dynamics, Arizona State University, Tempe, AZ 85287, USA
3GeoDa Center for Geospatial Analysis and Computation, School of Geographical Sciences and Urban Planning, Arizona State University, Tempe, AZ 85287, USA
Abstract: The massive scale-up of HIV counseling, testing, and treatment services in resource-limited sub-Saharan settings with high HIV prevalence has significant implications for the course of the HIV/AIDS epidemic. It also offers important broader policy lessons for improving access to critical health services. Applying GIS-based methods and multilevel regression analysis to unique longitudinal three-wave survey data from rural Mozambique, this study investigates the impact of a rapid expansion of HIV-related services on access to and utilization of HIV testing. The results illustrate the declining importance of spatial barriers to utilization of HIV testing services as these services expanded. In addition, the expansion of HIV-related services decreased the spatial variability of HIV testing among the survey respondents. At the same time, some important non-spatial variation, such as that in educational level, persisted despite the expansion of services. These results illustrate the process and consequences of health service diffusion.
Keywords: Health care, Access, Utilization, GIS, HIV/AIDS
§ Corresponding author: Tel.: +44-1334-464026 Fax: +44 01334 463949 Postal address: School of Geography & Geosciences, Irvine Building, University of St Andrews, North Street, St Andrews, KY16 9AL, Fife, Scotland, UK Email addresses: JY: [email protected], VA: [email protected], AM: [email protected].

1
Spatial and Social Inequities in HIV Testing Utilization in the Context of Rapid Scale-up of HIV/AIDS Services in Rural Mozambique
Abstract: The massive scale-up of HIV counseling, testing, and treatment services in resource-limited sub-Saharan settings with high HIV prevalence has significant implications for the course of the HIV/AIDS epidemic. It also offers important broader policy lessons for improving access to critical health services. Applying GIS-based methods and multilevel regression analysis to unique longitudinal three-wave survey data from rural Mozambique, this study investigates the impact of a rapid expansion of HIV-related services on access to and utilization of HIV testing. The results illustrate the declining importance of spatial barriers to utilization of HIV testing services as these services expanded. In addition, the expansion of HIV-related services decreased the spatial variability of HIV testing among the survey respondents. At the same time, some important non-spatial variation, such as that in educational level, persisted despite the expansion of services. These results illustrate the process and consequences of health service diffusion.
Keywords: Health care, Access, Utilization, GIS, HIV/AIDS

2
Introduction
Public health faces great challenges in the developing world, especially in resource-limited sub-Saharan countries which are deficient in health care resources and experience serious health problems, such as high child mortality, maternal morbidity and mortality, endemic respiratory and diarrheal diseases, and high prevalence of HIV/AIDS. With the aid of international donors, various programs are being implemented in sub-Saharan Africa in order to decrease disease incidence rates and ultimately enhance health and well-being. A correct evaluation of the effects of current programs can provide valuable insights for future decision-making in health policies and resource allocation. An effective way to evaluate the impact of a health program expansion is to assess the utilization of related health services. Among many factors, access to healthcare systems has long been considered critical for health service utilization decisions (Higgs, 2009). Hence, it is important to better understand the relationship between access to health services and utilization of those services in order to monitor and foster ongoing improvements in the health sector.
Given the geographic context inherent to public health, recent years have seen an increasing interest in the geographic and spatial aspects of healthcare systems, resulting in broad application of geographical information systems (GIS) and associated spatial analysis techniques in health related research (Ricketts, 2003; Rushton, 2003; Cromley and McLafferty, 2011). Powerful mapping capabilities of GIS can help visualize geographic information in a straightforward way. In addition, spatial data analysis techniques allow exploration of health data from a geographic perspective, assessing potential space-time patterns, correlations and outliers that can facilitate subsequent hypothesis formulation and testing (Anselin et al., 2006; Murray, 2010). Such exploratory investigation can then inform confirmatory analysis involving formal statistical tests to detect potential covariates in relation to disease clusters or any observed spatial–temporal patterns.
Using GIS-based approaches, we investigate the impact of an expansion of HIV/AIDS services on changes in access to and utilization of HIV testing during a five-year period between 2006 and 2011 in rural areas of southern Mozambique, where HIV prevalence among adults aged 15-49 is estimated at around 25% (Ministry of Health, 2010). HIV testing is chosen in this research as an example of critical sexual and reproductive health (SRH) services for rural populations in resource-limited settings. HIV testing also exemplifies health services that are being deployed in a comparatively short period of time in response to a major health challenge. The expansion of HIV testing and other HIV/AIDS-related services is relatively recent in Mozambique (Agadjanian et al., 2011). Thus, voluntary counseling and testing (VCT) and prevention of mother-to-child transmission (PMTCT) were not available until 2001 (Pfeiffer et al., 2010). The national deployment of antiretroviral treatment was initiated only in 2004 (Audet et al., 2010). In

3
recent years, these services have been expanded rapidly with funding from foreign governments as well as international organizations. In 2006, only 281 health care units provided HIV counseling and testing in Mozambique, a country of some 22 million inhabitants (Ministry of Health, 2006: 4); by 2009, this number grew to 359 (National AIDS Council, 2010: 47). HIV testing has become a routine part of prenatal care, but it is also widely available outside of it.
The gradual HIV testing expansion and its influences on access to and utilization of novel healthcare can be construed in terms of health service diffusion. This understanding can be theoretically guided by the interdisciplinary literature on diffusion of innovation (Brown, 1981; Feldman, 1994; Wejnert, 2002; Rogers, 2003; Webber et al., 2006). Usually, the process begins with a diffusion strategy aiming at propagating an innovation (e.g. new services, products and techniques) and ends with adoption of the innovation by the target population (Brown, 1981). In the study, we apply this theoretical perspective to investigate changes in access to and utilization of HIV testing in the dynamic process of health service expansion/diffusion. The remainder of the paper is organized as follows. The next section reviews the relevant research on health service access and utilization, highlighting the significance of integrating GIS in such research, and links that research to the scholarship on the diffusion of innovations. This review is followed by a description of the data and study area. Then, the methods employed are detailed and analysis results are presented. We conclude with a discussion of the findings and of their implications.
Background
It has long been recognized that access to health services is critical for health care utilization (Aday and Andersen, 1974; Gulliford and Morgan, 2003; Cromley and McLafferty, 2011). However, access is a nebulous concept and can be defined in many ways depending on perspective (Gulliford et al., 2002; Guagliardo, 2004). Generally, access is perceived as the ease of entry to the health care system (Aday and Andersen, 1974). In geography, this includes physical barriers that hinder the acquisition of health services (Wang, 2012). As more geographically referenced data that can be efficiently processed in a GIS environment have become available, distance-based measures have been increasingly utilized to assess geographic access in health related research (Nemet and Bailey, 2000; Lovett et al., 2002; Higgs, 2004). Many studies employing such measures have found that distance is a vital indicator of healthcare use, especially in rural areas (Tanser et al., 2006; Yao et al., 2012, 2013) and for particularly vulnerable groups such as the elderly (Nemet and Bailey, 2000; Djukpen, 2012).
Utilization of health services is a direct determinant of health and well-being, usually manifested in health outcomes (Cromley and McLafferty, 2011). It should be noted that even if sufficient health resources and reasonable proximity to health facilities are

4
ensured, actual health care use may or may not occur (Mooney, 1983). For example, people are usually assumed to visit the nearest service; however, this is not necessarily the case and actual utilization depends on personal and service-related characteristics as well as contextual factors (McLafferty, 2003). From this perspective, service utilization is generally perceived as realized access to the healthcare system, and as a result is considered a validating indicator of potential access measures (Aday and Andersen, 1974). As a result, the goal of health programs is to improve the utilization of health services while recognizing that access is a critical concern.
Considering the spatial nature of a healthcare system, GIS has become an invaluable part of spatial analysis of both access to and utilization of services (Gulliford and Morgan, 2003; Higgs, 2004, 2009; Cromley and McLafferty, 2011). A range of GIS-based techniques have been applied. Thus, desktop mapping of health outcomes has a long history in medical geography. An example of early work is the map of London’s 1854 cholera outbreak by John Snow. GIS routines such as network analysis are widely utilized to derive distance-based access measures (Lovett et al., 2002; Rosero-Bixby, 2004). This has been used to delineate the service catchment area for health facilities (Tanser et al., 2001). Exploratory spatial data analysis (ESDA) provides a set of powerful tools for gaining insights into spatio-temporal patterns of disease clusters (Djukpen, 2012), as well as seeking potential environmental and socio-economic contributing factors (Anselin et al., 2006). Further, spatial modeling using confirmatory testing is helpful in identifying determinants of access and health care use (Field and Briggs, 2001; Tanser et al., 2006; Yao et al., 2012). All of these methods can be carried out under different spatial scales to identify an appropriate representation framework for the underlying research context. For instance, Langford and Higgs (2006) studied the implications of different spatial representations of population for healthcare access measurement. Moreover, GIS based approaches can help us to understand the spatial patterns of diffusion of new health services.
The focus of this paper is on access to and utilization of HIV testing. The rapid deployment of HIV/AIDS services in sub-Saharan and other resources-limited settings affected by the pandemic can be seen as an example of diffusion of healthcare innovations. As the innovation diffusion perspective would posit, widening access to HIV/AIDS services should lead to increased utilization of those services. Given the growing availability of spatial data and advances in spatial analysis techniques, as well as worldwide concern about the challenges posed by HIV/AIDS to public health, it is not surprising that GIS is increasingly adopted to support analysis of HIV-related outcomes (Kandwal et al., 2009; Cuadros et al., 2013). For example, Tanser et al. (2000) found that geographic access is a vital determinant of HIV heterogeneity in rural South Africa. Busgeeth and Rivett (2004) developed a spatial information system to better manage and utilize HIV/AIDS data. Similar work has also been carried out by Geanuracos et al.

5
(2007). Fulcher and Kaukinen (2005) analyzed the spatial distribution of HIV service providers in Toronto neighborhoods using mapping and visualization. Nevertheless, there are still few GIS-based studies addressing the impact of HIV/AIDS prevention, testing, and treatment programs on access and utilization of corresponding services. This study helps fill this important gap by focusing on the impact of the expansion of HIV/AIDS services in a high-prevalence rural sub-Saharan setting. Specifically, we employ spatial analysis and regression techniques to demonstrate the declining importance of geographic access to HIV testing services for HIV testing utilization over the course of a rapid diffusion of these services.
Methods
Data and study area
The data used in this study were collected through three waves of a longitudinal survey conducted in 2006, 2009 and 2011, respectively, in rural areas of four districts (Chibuto, Chókwè, Guijà and Mandlakaze) of Gaza province in southern Mozambique. The study site covers an area of approximately 5900 square miles and had a total population of about 625,000 according to the 2007 National Population Census. At the time of the first and second survey waves, there were 53 primary health clinics in this area; by the last wave, that number increased to 57. Mozambique is located in the “AIDS belt,” and among all of the country’s provinces the HIV prevalence rate is the highest in Gaza province, 25% of adults aged 15-49, not least because of massive labor migration directed mainly toward neighboring South Africa (Ministry of Health, 2010). Given the very high levels of HIV prevalence, the deployment of HIV counseling, testing, and treatment services has been a top priority of local health authorities. All HIV services, including testing, have been provided completely free of charge in all public health clinics (the only type of health facilities available to rural residents). HIV testing has been integrated into prenatal care on the opt-out basis and is also done when HIV infection is suspected symptomatically or on request.
All the three waves of the survey were carried out in 56 villages of the four districts (14 villages per district). In 2006, within each village, about 30 women in union were selected from village rosters through probability sampling. The 2006 sample consisted of 1680 women. In the subsequent waves, attempts were made to re-interview the same women; the women who died or could not be interviewed for various reasons were replaced with a refreshment sample. In this analysis, we use data for women who were interviewed in all three waves (N=1025). The residence of each respondent is described by geographic point data recorded as latitude and longitude. The survey collected a variety of information such as respondents’ age, educational level, and marital status, household economic characteristics, and reproductive health and HIV/AIDS related information, as well as some community-level features including the cost of public

6
transportation from the village to the closest town, and the degree difficulty of getting to the community during the rainy season. Figure 1 shows the locations of the respondents’ residences and health clinics; the graph illustrates the rapid spread of HIV testing services during the observation period: the number of clinics offering HIV testing increased from 5 in 2006 to 32 in 2009 to 49 in 2011.
Figure 1 about here
The outcome used in this study is whether or not a respondent had an HIV test (1 if yes, 0 if otherwise). The specific definitions of this outcome vary slightly across the three waves. Thus in 2006, when HIV testing was not as common, respondents were asked if they had ever had an HIV test. As testing became more widespread and regular, in 2009 and 2011, more detailed testing history was collected. For these two waves the outcome is “whether or not the respondent was tested in two years preceding the survey.” This approach allows us to better account for the expansion of HIV services and to capture corresponding changes in utilization of these services.
Methods of analysis
This study employs GIS, descriptive statistics, spatial pattern analysis, and confirmatory analysis using multilevel regression. These methods are used as part of an ESDA framework. GIS is used for spatial information management as well as geographic measure derivation. Descriptive statistics are employed to outline individual characteristics and summarize healthcare access and utilization measures. Spatial pattern analysis is used to examine changes in the spatial distribution of access and HIV testing service utilization during the five years of observation (2006-2009). Multilevel regression analysis then investigates the possible covariates, especially geographic access, of HIV testing.
First, we use basic statistics to describe changes in HIV testing service availability and geographic access to these services. Given the distance effect on health service utilization and the fact that people in rural areas are more likely to visit the closest health facility (Haynes, 2003), Euclidean distance from a residence to the nearest clinic providing HIV testing is used as a proxy for geographic access. In general, Euclidean distance has been shown to be an adequate measure of spatial access in rural sub-Saharan Africa (Tanser et al., 2006; Yao et al., 2012) and to be negatively associated with receiving an HIV test in particular (Leibowitz and Taylor, 2007; Thornton, 2008). The number of nearby clinics offering HIV testing is used as an indicator of availability of HIV services. Specifically, the 10km and 20km radii are utilized in evaluating proximity to health services, where clinics within this distance threshold are counted for each respondent.
Beyond descriptive statistics, spatial pattern of HIV testing service utilization is explored using more encompassing ESDA approaches. A general discussion of ESDA can be

7
found in Anselin et al. (2006). Because respondents are naturally grouped into villages/communities, aggregate data at the community level are initially mapped to provide an intuitive impression of spatial disparities in utilization of HIV testing services in the population of the study area. Spatial inequity is further investigated by formal specification based on spatial cluster analysis techniques. In medical geography, a cluster typically indicates a group of the population with significantly higher or lower disease rates than expected (Jacquez, 2008; Cromley and McLafferty, 2011). In this study, a cluster is a group of respondents with high/low rate of HIV testing. Specifically, the spatial scan statistic is used to detect the high/low rate clusters, employing a window with variable size to scan the entire population in order to find significant local clusters using a log-likelihood ratio test (Waller and Gotway, 2004). The Bernoulli probability model (Kulldorff, 1997) is used here because the outcome (tested/not tested) is binary in nature.
Then, multilevel multivariate logistic regression is used to examine the impact of geographic access, as well as other covariates, on the probability of having been tested for HIV. The advantages of multilevel models are that they take into account the hierarchical nature of the survey sample. Such models have been widely adopted in health research, and are sometimes referred to as nested models, mixed models, random effects models, or hierarchical linear models (Goldstein, 2011). In this study, a two-level (individual and village) random-intercept logistic regression model is employed to account for effects caused by clustering of respondents within villages. The intercept in the model is allowed to vary randomly across villages. Separate models are fitted for each wave of the data to see whether the expansion of HIV testing services that was taking place in the period under observation might be associated with declining importance of geographic access. In the model for the 2006 sample, the outcome variable is “whether or not ever tested for HIV”; in the models for 2009 and 2011, the outcome variable is “whether or not tested for HIV in the past two years.”
The main covariate of interest is geographic distance from a respondent’s residence to the nearest clinic offering HIV testing in the year of the survey. It should be noted that the geographic access for the 2009 and 2011 samples could be overestimated because the HIV testing behavior represented by the outcome variable could occur before the survey year when the additional services were not available yet. Also, since the relationship between distance and healthcare utilization may not be linear, in this analysis distance is not defined continuously and instead is classified into three categories—less than 10km, 10-20km, and more than 20km— to account for the nature of distance distribution as well as the perception of healthcare accessibility by local residents. The models also include a community-level covariate “difficulty of getting to the village during the wet season.” It is derived from the community survey data and includes three levels: 1. Community is easily accessible with any type of vehicle; 2. Community is easily accessible only with a four-wheel drive vehicle; 3. Community is not easily accessible even with a four-wheel

8
drive vehicle. This measure reflects community accessibility and therefore complements the Euclidean distance between respondents’ residences and clinics offering HIV testing.
The models control for several non-spatial variables, including personal characteristics such as age, education level (number of years of schooling), whether in a polygynous or monogamous marriage, number of children ever born, and the household possession index (derived on the basis of reported household possessions, such as radio, bicycle, motorcycle, and automobile, and ranging from one to four with increasing wealth). In addition, for the analysis of the 2009 and 2011 data, whether a respondent had been tested more than two years before the survey is also included to account for previous experience with regard to HIV testing: it is highly likely that women tested before will get tested again.
The above analyses are carried out using a variety of packages. The geographic measures are derived using commercial GIS software, ArcGIS 10.0 (ESRI, Redlands, CA). Spatial cluster detection is performed using SaTScan§. The multilevel analysis is carried out using the R software.**
Results
Basic descriptive statistics of the three survey samples are presented in Table 1. The mean age of respondents is 28 (2006), 31 (2009) and 33 (2011), respectively. The educational level of the surveyed women is quite low: the average number years of schooling is around 2.8; it does not change across waves illustrating that all education is received prior to marriage. The average number of children was 2.8 in 2006, 3.8 in 2009, and 4.4 in 2011. With regard to the marital status, most respondents are in monogamous union. The mean household material possession score was 2.1 for all the three years (2006, 2009, and 2011).
Table 1 about here
Table 1 illustrates the rapid expansion of HIV testing: whereas in 2006 17.6% of respondents had been tested for HIV at least once, in 2009 and 2011 these figures were 55.4% and 78.3%, respectively. Further, the proportion of women having been tested in the last two years had increased from 44.7% in 2009 to 58.5% in 2011. The scale-up of HIV/AIDS services is also reflected in the number of nearby clinics offering HIV testing. Table 1 shows that 84.2% women lived within 10km of clinics offering such services in 2011, about four times that the percentage in 2006. Moreover, about 85.0% of women surveyed in 2011 had at least two clinics offering HIV testing within 20km from their residences compared to only 18.0% in 2006. As indicated in Table 1, a major expansion
§ http://www.satscan.org/ ** http://www.r-project.org/

9
of HIV testing services occurred during 2006-2009, while the increase in geographic access to such services between 2009 and 2011 was less substantial. For example, 49.0% women had to travel more than 20km to get tested for HIV in 2006, while this number decreased to about 9.6% by 2009, further dropping to 2.9% in 2011.
As an indicator of potential geographic access to HIV testing services, the distance to the nearest clinic providing HIV testing for the three survey waves is presented in Table 2. Compared to 2006, the decrease in minimum distance by 2009 is about 0.188km (from 0.430km to 0.242km), while the changes in the maximum, median and mean distances are 60.679km, 13.228km and 15.511km, respectively. In contrast, the differences between 2009 and 2011 are more modest. For example, the mean distance to the nearest clinic offering HIV testing declined from 7.898km to 6.021km, a decrease of 1.877km. This is not surprising given that there were only five clinics offering HIV testing in 2006 and this number grew to 32 by 2009, and 49 by 2011. That is, testing services became available in more than 60% of local clinics by 2009 and about 86% by 2011. In general, it is apparent that distance as a barrier to HIV testing greatly declined during the five years under observation. In addition, within each of the three waves, although there is little difference in terms of minimum and maximum traveling distances, on average the women who had been tested lived closer to a health clinic offering these services than those who had not been tested.
Table 2 about here
Similar conclusions can also be reached from Figure 2 which describes the distance distribution in the three survey years. In 2006, about half of respondents needed to travel more than 20km to get an HIV test and about 25% needed to travel more than 30km. In contrast, the distance to the closest clinic offering HIV testing was much smaller in 2009 and 2011. The declines in mean distance to the nearest clinics are statistically significant (p-value < 0.01) as suggested by the Wilcoxon signed-rank test. For example, about 80% of women had access to HIV testing within 12km (2009) or 9km (2011) of their residences. Only about 10% (2009) and 3% (2011) of respondents needed to go beyond 20km to get tested for HIV, substantially less than 50% in 2006.
Figure 2 about here
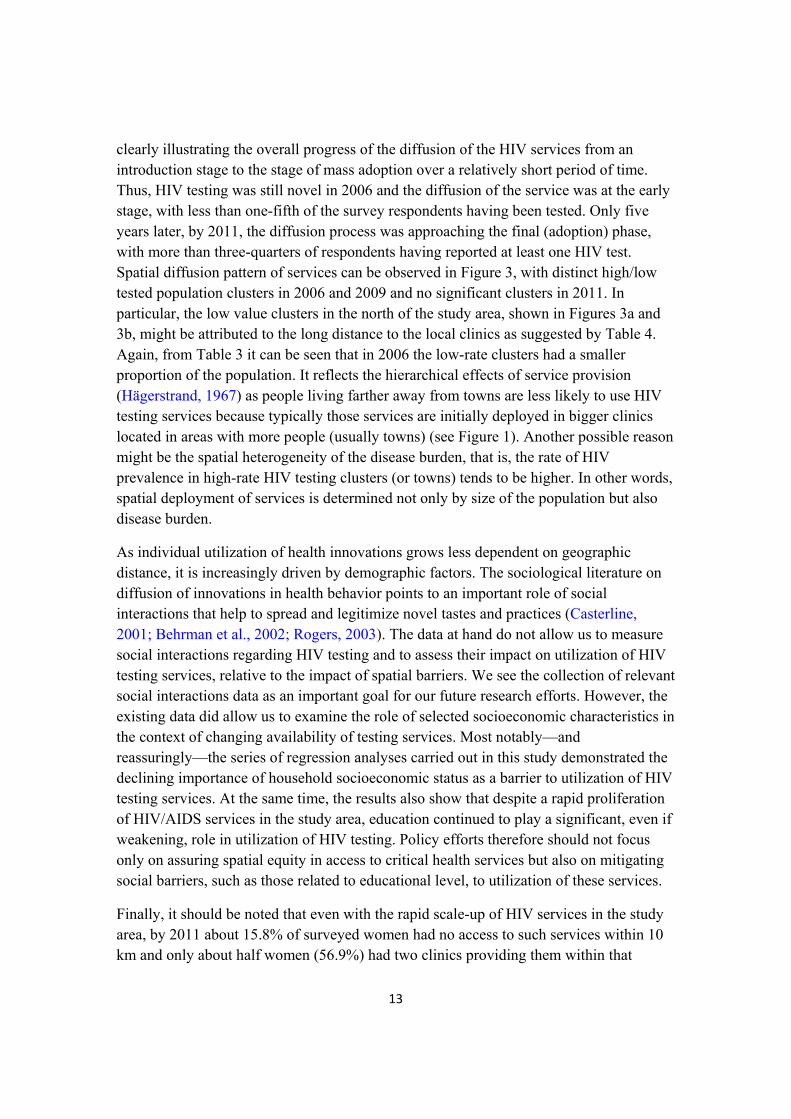
Again, as expected, increased access to testing services was associated with an increase in actual utilization of those services. The spatial variation of the outcome “had an HIV test in the two years before the survey” (“ever had an HIV test,” for the 2006 wave) across the study area is described in Figure 3. Differently sized circles reflect the share of village sample that has been tested for HIV. In Figure 3a, corresponding to the 2006 wave, most villages having relatively high testing rates are located in the southeast and southwest (the more economically developed and densely populated part of the study

10
area), except one outlier in the south. Few women in other villages, especially the five villages in the north, had been tested. In Figure 3b (2009), most communities in the south still have higher testing rates and only a few have a very low proportion (e.g., <-1.5 std. dev.) of those tested in the past two years. On the whole, the differences among communities in 2009 are not as large as in 2006. In general, the spatial distribution of HIV testing service use in 2011 is similar as that in 2009, with villages having higher testing rates in the southwest and southeast. However, compared to the pattern in 2006 and 2009, the most significant change in HIV testing service utilization is that the tested population in the northern five villages had greatly increased by 2011.
Figure 3 about here
To further explore the spatial pattern of HIV testing service utilization, spatial clusters with significantly high or low testing rates based individual-level data are examined using a spatial scan statistic. Given the fact the study area is largely rural and the population is sparsely located, particularly in the north, 50km (about one fourth of the width of the study area) was used as the maximum size of the searching window to ensure potential clusters can be identified. The analysis results are also shown in Figure 3, with red circles indicating high testing rate clusters and blue circles indicating low testing rate clusters (p-value < 0.01). The associated statistics are summarized in Table 3. As can be seen, the number and location of clusters vary between the 2006 and 2009 waves. The former, described in Figure 3a, has three clusters, with one high-rate cluster (with 30.9% tested women compared to the expected value of 17.6%) and one low-rate cluster (with 0.0% tested) in the southwest of the study area, and another low-rate cluster in the north (with 3.8% tested). In the latter, again three clusters are identified (Figure 3b). The northern villages are still within a low-rate cluster (with 40.9% tested women compared to the expected value of 44.7%), while the high-rate cluster (with 88.9% tested) moves to the southeast, possibly in response to several newly deployed testing services. The other low-rate cluster (with 16.3% tested) is still in the southwest but with a smaller size. In contrast to the patterns in 2006 and 2009, no significant cluster can be found in 2011. This reflects the fact that 86% clinics were offering HIV testing by 2011, compared to 9% in 2006 and 60% in 2009. In particular, the five villages in the north were served by four clinics with HIV testing services by 2011.
Table 3 about here
The relationship between the utilization of HIV testing and distance to clinic and other factors is investigated using multilevel logistic regression analysis. The odds ratios (OR) and associated 95% confidence intervals (CI) from the model predicting the probability of having been tested for HIV are presented in Table 4. The results show that distance to a clinic offering HIV testing has a similarly negative effect on the likelihood of having been tested for HIV in the first two waves of the survey. However, in both waves, the

11
difference between women in the reference category, i.e., those living less than 10km from a clinic offering HIV testing, and women residing 10-20km from such clinics is modest and not statistically significant. In comparison, in both waves, the difference between women residing within the 10km of HIV testing clinics and those who have to travel more than 20km to reach a clinic with HIV testing services is much larger and statistically significant at p<.05. For example, in 2006, compared to those traveling less than 10km, women traveling more than 20 km had a 57% decrease in the odds of lifetime HIV testing (OR = 0.43, 95% CI: 0.24, 0.77); three years later the corresponding decrease in odds is smaller, 45% (OR = 0.55, 95% CI: 0.31, 0.99), but is still statistically significant. However, in the model for the third survey year, the corresponding parameter estimate becomes much smaller, and loses statistical significance. Interestingly, the estimate for the differences between the reference category and the next distance category is larger than in the previous two models but it is not statistically significant. A similar pattern emerges with respect to the difficulty of getting to the village during the rainy season: it is negatively associated with the probability of having been tested in 2006 and 2009 (with the magnitude of the effect declining between the two waves), but its effect completely disappears by the third wave.
Table 4 about here
The decline in the importance of geographic access stands in contrast with consistent significance of individual demographic characteristics such as age and number of children ever born throughout the observation period. The positive effect of education is also statistically significant in all three years even though its magnitude declines noticeably between the first and second waves. The effect of household wealth is also positive in all the three waves of the survey (albeit only marginally significant in 2006 and 2011). In contrast, the effect of marriage type (polygynous or not) is not significant in all the three waves. Finally, previous HIV testing experience has a positive impact on the likelihood of HIV testing in the two years preceding the survey in both the 2009 and 2011 models, pointing to the importance of learned experience in acquisition of critical health care services.
Discussion and conclusions
Geographic separation has long been considered a vital determinant of access to healthcare as well as of spatial inequities in health outcomes, especially in resource-limited settings. Although it is often assumed in the public health literature and practice that improvement in access to vital health services in such settings lead to increases in utilization of these services, rigorous tests of this assumption are rare. In this study, we used unique longitudinal data from a setting with a rapidly changing service provision landscape to conduct such a rigorous test using the deployment of HIV testing services in rural Mozambique as an example. Our study provides an illustration of the utility of

12
spatial analysis for assessing the impact of a continuing expansion of critical health care delivery such as HIV testing and treatment services. Paired with multivariate regression, GIS and related spatial analysis techniques are invaluable tools for a better understanding of evolving spatial patterns of access to health care as well as of the impact of changes in access on health service utilization.
The results of the presented spatial and regression analyses suggest that with the rapid spread of HIV testing services in the study area both access to these services and their utilization greatly improved over the observation span. In parallel, spatial inequities decreased substantially. Thus, high/low rates clusters only existed in 2006 and 2009 but disappeared by 2011 as shown in Figure 3. Figure 3 also illustrates that the implementation of spatially targeted prevention interventions reflects the distribution of the population at higher risk of HIV infection. Specifically, given the low-rate cluster in the north in 2006 (see Figure 3a), two clinics were equipped with HIV testing services during 2006-2009, but the low-rate cluster still existed in 2009 implying insufficient supply of such services. Meanwhile, more services were deployed in the south, and as a result the low-rate cluster in the south in 2006 (see Figure 3a) became smaller in 2009 (see Figure 3b). With the continuing expansion of HIV testing services throughout the study area, there were eventually no significant inequities in HIV testing by 2011.
A decreased importance of distance is also suggested by the results of the regression analysis (Table 4), particularly for women living very far (>20 km) from HIV-related services. Further, when analyzed in conjunction with non-spatial factors in a multiple regression framework, the significant difference in the probability of having been HIV tested among women in various distance categories, while noticeable at the low level of deployment of those services, disappeared as the services expanded. What is interesting here is that the most dramatic expansion of HIV testing services occurred between 2006 and 2009, while the geographic access has similar effect for women in different distance categories for those two years. It is tempting to speculate about a possible threshold effect in the diffusion of these novel health services. However, the limitations of our data caution against such speculations. Thus it is important to keep in mind that women who were interviewed in 2009, by our definition, had been exposed to the possibility of HIV testing during the preceding two years and therefore faced the array of services that were available during that period rather than at the time of interview. In comparison, the exposure of the 2011 sample to HIV testing, by definition, started around 2009, i.e., when HIV testing services had already become widespread. In addition, this result could be related to possible improvement in access to the local clinics (e.g., better roads and cheaper transportation), which is actually reflected in the non-significance of the parameter "difficulty to get to community in rainy season" in the last survey wave.
Although with our data we cannot capture reliably the effects of the pace of the spread of HIV testing, our results contribute to the scholarship on health service diffusion by
13
clearly illustrating the overall progress of the diffusion of the HIV services from an introduction stage to the stage of mass adoption over a relatively short period of time. Thus, HIV testing was still novel in 2006 and the diffusion of the service was at the early stage, with less than one-fifth of the survey respondents having been tested. Only five years later, by 2011, the diffusion process was approaching the final (adoption) phase, with more than three-quarters of respondents having reported at least one HIV test. Spatial diffusion pattern of services can be observed in Figure 3, with distinct high/low tested population clusters in 2006 and 2009 and no significant clusters in 2011. In particular, the low value clusters in the north of the study area, shown in Figures 3a and 3b, might be attributed to the long distance to the local clinics as suggested by Table 4. Again, from Table 3 it can be seen that in 2006 the low-rate clusters had a smaller proportion of the population. It reflects the hierarchical effects of service provision (Hägerstrand, 1967) as people living farther away from towns are less likely to use HIV testing services because typically those services are initially deployed in bigger clinics located in areas with more people (usually towns) (see Figure 1). Another possible reason might be the spatial heterogeneity of the disease burden, that is, the rate of HIV prevalence in high-rate HIV testing clusters (or towns) tends to be higher. In other words, spatial deployment of services is determined not only by size of the population but also disease burden.
As individual utilization of health innovations grows less dependent on geographic distance, it is increasingly driven by demographic factors. The sociological literature on diffusion of innovations in health behavior points to an important role of social interactions that help to spread and legitimize novel tastes and practices (Casterline, 2001; Behrman et al., 2002; Rogers, 2003). The data at hand do not allow us to measure social interactions regarding HIV testing and to assess their impact on utilization of HIV testing services, relative to the impact of spatial barriers. We see the collection of relevant social interactions data as an important goal for our future research efforts. However, the existing data did allow us to examine the role of selected socioeconomic characteristics in the context of changing availability of testing services. Most notably—and reassuringly—the series of regression analyses carried out in this study demonstrated the declining importance of household socioeconomic status as a barrier to utilization of HIV testing services. At the same time, the results also show that despite a rapid proliferation of HIV/AIDS services in the study area, education continued to play a significant, even if weakening, role in utilization of HIV testing. Policy efforts therefore should not focus only on assuring spatial equity in access to critical health services but also on mitigating social barriers, such as those related to educational level, to utilization of these services.
Finally, it should be noted that even with the rapid scale-up of HIV services in the study area, by 2011 about 15.8% of surveyed women had no access to such services within 10 km and only about half women (56.9%) had two clinics providing them within that

14
radius. Even though HIV testing and treatment in Mozambique, as in other similar settings (Askew and Berer, 2003; Myer et al., 2005; Cooper et al., 2009) has been integrated with broader sexual and reproductive health services and HIV testing has increasingly become a routine component of prenatal care, about 21.7% of the 2011 respondents had never been tested for HIV. Moreover, the utilization of HIV testing services is much lower among men and among women who are not reproductively active and therefore do not undergo prenatal care. The needs of the underserved segments of the population must be taken into account in the continuing deployment of these services. Also, importantly the rapid spread of HIV/AIDS testing and treatment services that the study area saw during the period under observation was taking places in the existing health clinics. Once all these facilities have been equipped with HIV/AIDS-related services, further expansion of these services would require massive investment in building new health facilities or deploying costly mobile clinics. These remaining multiple challenges notwithstanding, the results of our study provide valuable guidance for future improvements of critical HIV service deployment in resource-limited sub-Saharan settings.
Acknowledgments
We thank the support of the Eunice Kennedy Shriver National Institute of Child Health & Human Development (Grants #R21HD048257; R01HD058365; R01HD058365-03S1).
References
Aday, L.A. and Andersen R. 1974. A framework for the study of access to medical care. Health Services Research 9(3): 208–220.
Agadjanian, V., Arnaldo, C., and Cau, B. 2011. Health costs of wealth gains: labor migration and perceptions of HIV/AIDS risks in Mozambique. Social Forces 89(4): 1097-1117.
Anselin, L., Syabri, I., and Kho, Y. 2006. GeoDa: an introduction to spatial data analysis. Geographical Analysis 38: 5-22.
Askew, I. and Berer, M. 2003. The contribution of sexual and reproductive health services to the fight against HIV/AIDS: a review. Reproductive Health Matters 11(22), 51–73.
Audet, C.M., Burlison, J., Moon, T.D., Sidat, M., and Vergara, A.E. 2010. Sociocultural and epidemiological aspects of HIV/AIDS in Mozambique. BMC International Health and Human Rights 10(15): 1-10.

15
Behrman, J.R., Kohler, H.P., and Watkins, S.C. 2002. Social networks and changes in contraceptive use over time: evidence from a longitudinal study in rural Kenya. Demography 39(4): 713-738.
Brown, L. A. 1981. Innovation Diffusion: A new perspective. New York: Methuen.
Busgeeth, K. and Rivett, U. 2004. The use of a spatial information system in the management of HIV/AIDS in South Africa. International Journal of Health Geographics 3:13.
Casterline, J. (Ed.). 2001. Diffusion processes and fertility transition: Selected perspectives. National Academy Press; Washington, D.C.
Cooper, D., Moodley, J., Zweigenthal, G., Bekker, L.G., Shah, I., et al. 2009. Fertility intentions and reproductive health care needs of people living with HIV in Cape Town, South Africa: implications for integrating reproductive health and HIV care services. AIDS and Behaviour 13: Suppl 138–46.
Cromley, E.K. and McLafferty, S. 2011. GIS and Public Health. 2nd edition. New York: Guilford Press.
Cuadros, D.F., Awad, S.F., and Abu-Raddad, L.J. 2013. Mapping HIV clustering: a strategy for identifying populations at high risk of HIV infection in sub-Saharan Africa. International Journal of Health Geographics 12: 28.
Djukpen, R.O. 2012. Mapping the HIV/AIDS epidemic in Nigeria using exploratory spatial data analysis. GeoJournal 77: 555–569.
Feldman, M.P. 1994.The Geography of Innovation. Kluwer Academic Publishers, Boston.
Field, K.S. and Briggs, D.J. 2001. Socio-economic and locational determinants of accessibility and utilization of primary health-care. Health and Social Care in the Community 9(5): 294–308.
Fulcher, C. and Kaukinen, C. 2005. Mapping and visualizing the location HIV service providers: an exploratory spatial analysis of Toronto neighborhoods. AIDS Care 17(3): 386-396.
Geanuracos, C.G., Cunningham, S.D., Weiss, G., Forte, D., Henry Reid, L.M. and Ellen, J.M. 2007. Use of geographic information systems for planning HIV prevention interventions for high-risk youths. American Journal of Public Health 97:1974–1981.
Goldstein, H. 2011. Multilevel Statistical Models. 4th edition. Wiley-Blackwell; Chichester.

16
Guagliardo, M. 2004. Spatial accessibility of primary care: concepts, methods and challenges. International Journal of Health Geographics 3(3):1–13.
Gulliford, M., Figueroa-Munoz, J., Morgan, M., Hughes, D., Gibson, B., Beech, R., and Hudson, M. 2002. What does ‘access to health care’ mean? Journal of Health Services Research and Policy 7(3): 186–188.
Gulliford, M. and Morgan, M. 2003. Access to Health Care, Routledge, London.
Hägerstrand, T. 1967. Innovation Diffusion as a Spatial Process. Chicago: University of Chicago Press.
Haynes, R. 2003. Geographical access to health care. In M. Gulliford, & M. Morgan (Eds.), Access to Health Care (pp. 13–35). London: Routledge.
Higgs, G. 2004. A Literature Review of the Use of GIS-Based Measures of Access to Health Care Services. Health Services and Outcomes Research Methodology: 5(2): 119–139.
Higgs, G. 2009. The role of GIS for health utilization studies: literature review. Health Services and Outcomes Research Methodology 9(2): 84-99.
Jacquez, G.M. 2008. Spatial cluster analysis. In Fotheringham S. and Wilson J., (Eds.), The Handbook of Geographic Information Science, 2008, Blackwell Publishing, 395-416 (Chapter 22).
Kandwal, R., Garg, P.K., Garg, R.D. 2009. Health GIS and HIV/AIDS studies: perspective and retrospective. Journal of Biomedical Informatics 42: 748–755.
Kulldorff, M. 1997. A spatial scan statistic. Communications in Statistics: Theory and Methods, 26, 1487-1496.
Langford, M. and Higgs, G. 2006. Measuring potential access to primary healthcare services: the influence of alternative spatial representations of population, The Professional Geographer 58(3): 294-306.
Leibowitz, A.A., & Taylor, S.L. 2007. Distance to public test sites and HIV testing. Medical Care Research and Review 64(5): 568-584.
Lovett, A., Haynes, R., Sunnenberg, G., and Gale, S. 2002. Car travel time and accessibility by bus to general practitioner services: a study using patient registers and GIS. Social Science & Medicine 55: 97–111.

17
Myer, L., Rabkin, M., Abrams, E.J., Rosenfield, A., and El-Sadr, W.M. 2005. Focus on women: linking HIV care and treatment with reproductive health services in the MTCT-Plus Initiative. Reproductive Health Matters 13(25):136-146.
Ministry of Health. 2006. Health counseling and testing: Annual report, 2006. Maputo, Mozambique: Ministry of Health. http://www.misau.gov.mz/pt/hiv_sida/relatorio_anual_da_informacao_do_aconselhamento_e_testagem_em_saude (in Portuguese).
Ministry of Health. 2010. Inquérito nacional de prevalência, riscos comportamentais e informação sobre o HIV e SIDA (INSIDA), 2009. Relatório final. [National Survey of HIV/AIDS prevalence, behavioural risks, and information, 2009: Final report]. Maputo, Mozambique: Ministry of Health of Mozambique.
McLafferty, S. 2003. GIS and health care. Annual Reviews of Public Health 24: 25-42.
Mooney, G.H. 1983. Equity in health care: confronting the confusion. Effective Health Care 1: 179–185.
Murray, A.T. 2010. Quantitative geography. Journal of Regional Science, 50: 143-163.
National AIDS Council. 2010. Mozambique Progress Report for United Nations General Assembly Special Session on HIV/AIDS. http://www.unaids.org/en/dataanalysis/knowyourresponse/countryprogressreports/2010countries/mozambique_2010_country_progress_report_en.pdf
Nemet, G.F., and Bailey, A.J. 2000. Distance and health care utilization among the rural elderly. Social Science & Medicine 50: 1197–208.
Pfeiffer, J., Montoya, P., Baptista, A. J., Karagianis, M., Pugas, M. D., Micek, M., et al. 2010. Integration of HIV/AIDS services into African primary health care: lessons learned for health system strengthening in Mozambique - a case study. Journal of the International AIDS Society 13(3): 1-9.
Ricketts, T.C. 2003. Geographic information systems and public health. Annual Review of Public Health 24:1-6.
Rogers, E. 2003. Diffision of Innovations. 5th edition, Free Press, New York
Rosero-Bixby, L. 2004. Spatial access to health care in costa rica and its equity: a GIS-based study. Social Science & Medicine 58(7): 1271-1284.
Rushton, G. 2003. Public health, GIS, and spatial analytic tools. Annual Review of Public Health 24: 43–56.

18
Tanser, F., Gijsbertsen, B. and Herbst, K. 2006. Modelling and understanding primary health care accessibility and utilization in rural South Africa: an exploration using a geographical information system. Social Science & Medicine 63(3): 691-705.
Tanser, F., Hosegood, V., Benzler, J., Solarsh, G. 2001. New approaches to spatially analyze primary health care usage patterns in rural South Africa. Tropical Medicine and International Health 6: 826–38.
Tanser, F., LeSueur, D., Solarsh, G and Wilkinson, D. 2000. HIV heterogeneity and proximity of homestead to roads in rural South Africa: an exploration using a geographical information system. Tropical Medicine and International Health 5: 40-46.
Thornton, R.L. 2008. The demand for, and impact of, learning HIV status. American Economic Review 98(5): 1829-1863.
Waller, L. and Gotway, C. 2004. Applied Spatial Statistics for Public Health Data. New York: John Wiley and Sons.
Wang, F. 2012. Measurement, optimization and impact of healthcare accessibility: a methodological review. Annals of the Association of American Geographers 102(5): 1104-1112.
Wejnert, B. 2002. Integrating models of diffusion of innovations: a conceptual framework. Annual Review of Sociology 28: 297-326
Webber, M., Lutz, J.M., and Brown, L.A. 2006. Classics in human geography revisited: Brown, L.A. 1981: innovation diffusion: a new perspective. London: Methuen. Progress in Human Geography 30(4): 487–494.
Yao, J., Murray, A.T., and Agadjanian, V. 2013. A geographical perspective on access to sexual and reproductive health care for women in rural Africa. Social Science & Medicine 96: 60-68.
Yao, J., Murray, A.T., Agadjanian, V., and Hayford, S.R. 2012. Geographic influences on sexual and reproductive health service utilization in rural Mozambique. Applied Geography 32(2): 601-607.

19
Figure 1 Study area and the survey sample

20
Figure 2 Distribution of distance to the nearest clinic providing HIV testing
0.0
20.0
40.0
60.0
80.0
100.0
120.0
0 20 40 60 80 100
Percent of responden
ts (%)
Shortest distance to acquire HIV testing (km)
2006
2009
2011

21
Figure 3 Spatial variation of health care utilization and clusters of HIV testing outcome
(a) 2006 survey sample

22
(b) 2009 survey sample

23
(c) 2011 survey sample

24
Table 1 Descriptive statistics for the survey samples
Variable
2006 (sample size: 1025)
2009 (sample size: 1025)
2011 (sample size: 1025)
N (Percent) Mean Median Range
(Min, Max) N (Percent) Mean Median
Range (Min, Max)
N (Percent) Mean Median Range
(Min, Max) Basic information Age 28 27 (18, 41) 31 30 (19, 51) 33 32 (21, 55) Years of education 2.8 3 (0, 11) 2.8 3 (0, 10) 2.8 3 (0, 11) Number of children 2.8 3 (0, 10) 3.8 4 (0, 13) 4.4 4 (0, 12) Household possessions index value 2.1 2 (1, 4) 2.1 2 (1, 4) 2.1 2 (1, 4) In polygynous marriage 207 (20.2) 229 (22.3) 243 (23.7) HIV testing related information Ever had an HIV test 180 (17.6) 568 (55.4) 803 (78.3) Had an HIV test in past 2 years 458 (44.7) 600 (58.5)
Number of clinics offering HIV testing within 10km
(0) 832 (81.2)
260 (25.4)
162 (15.8)
(1) 187 (18.2)
339 (33.1)
280 (27.3)
(>=2) 6 (0.6)
426 (41.6)
583 (56.9)
Number of clinics offering HIV testing within 20km
(0) 502 (49.0)
98 (9.6)
30 (2.9)
(1) 338 (33.0)
115 (11.2)
124 (12.1)
(>=2) 185 (18.0)
812 (79.2)
871 (85.0)

25
Table 2 Distance to the nearest clinic providing HIV testing (km)
min max median mean std 2006 All women 0.430 88.060 19.730 23.409 17.037 tested 0.636 86.833 15.231 17.996 11.545 not tested 0.430 88.060 20.354 24.563 17.780 2009 All women 0.242 27.381 6.502 7.898 6.431 tested 0.244 25.460 6.096 7.083 5.594 not tested 0.242 27.381 7.368 8.910 7.212 2011 All women 0.148 25.319 5.585 6.021 5.123 tested 0.148 25.319 5.595 6.010 5.017 not tested 0.184 24.658 5.502 6.060 5.490

26
Table 3 Summary of the spatial clusters
Year Type of cluster
Size of cluster
(km)
Proportion of population
within cluster
Prevalence of HIV testing within
cluster
Relative risk
2006 high-rate 21.487 14.8% 30.9% 2.03
2006 low-rate 12.592 7.3% 0.0% 0
2006 low-rate 46.060 12.9% 3.8% 0.19
2009 high-rate 10.575 4.4% 88.9% 1.65
2009 low-rate 7.502 4.2% 16.3% 0.28
2009 low-rate 45.442 20.9% 40.9% 0.69

27
Table 4 Results of the multi-level logistic regression analysis of HIV testinga
Covariates
2006 (sample size: 1025)
2009 (sample size: 1025)
2011 (sample size: 1025)
Odds Ratio
95% CI of OR
Odds Ratio 95% CI of OR
Odds Ratio 95% CI of OR
(Constant) 1.23 (0.36, 4.13) 4.65* (1.74, 12.42) 7.46* (2.74, 20.30) Geographic
access Distance from residence to clinic offering HIV testing (10-20km) (ref: <=10km)
0.82 (0.46, 1.47) 0.74 (0.48, 1.13) 0.73 (0.46, 1.16)
Distance from residence to clinic offering HIV testing (>20km) (ref: <=10km)
0.43* (0.24, 0.77) 0.55* (0.31, 0.99) 0.62 (0.26, 1.48)
Difficulty to get to community in rainy season
0.47* (0.30, 0.76) 0.74+ (0.54, 1.02) 1.11 (0.82, 1.52)
Individual characteristics
Age (years) 0.95* (0.92, 0.98) 0.93* (0.90, 0.96) 0.90* (0.87, 1.92) Children ever born 1.15* (1.04, 1.28) 1.18* (1.08, 1.29) 1.37* (1.26. 1.49) Education (continuous) 1.14* (1.07, 1.22) 1.03* (0.98, 1.09) 1.12* (1.05, 1.19) In polygynous marriage (ref: monogamous union)
1.12 (0.80, 1.58) 0.80 (0.58, 1.10) 1.17 (0.84, 1.61)
Household possession index (1-4) 1.16+ (0.99, 1.34) 1.21* (1.06, 1.37) 1.13+ (0.99, 1.29) Was tested for HIV before the 24-month period preceding the survey (ref: was not tested)
1.59* (1.17, 2.15) 1.69* (1.68, 1.69)
Notes: a Ever tested in 2006; tested in last two years in 2009 and 2011; Significance levels: p<0.05: ‘*’, p<0.1: ‘+’.