Embed Size (px)
Citation preview
SOK Corporation´s 2016Financial Statements 1.1.–31.12.2016

6
2 SOK Corporation’s Financial Statements 2016
6
3SOK Corporation’s Financial Statements 2016
SOK Corporation’sFinancial Statements 2016
Executive board report on operations .......................4
Consolidated financial statements, IFRS .................10 Consolidated income statement.......................................10 Consolidated statement of financial position ...................11 Consolidated statement of cash flows ..............................12 Consolidated statement of changes in equity ...................13 Notes to the consolidated financial statements: Company information ..............................................14 Accounting policies for consolidated financial statements ...................................................14 1. Segment information ..........................................22 2. Other operating income .....................................26 3. Employee benefit expenses ..................................26 4. Depreciation and impairment .............................28 5. Other operating expenses ....................................28 6. Auditor’s fees ......................................................28 7. Financial income and expenses ...........................29 8. Financial instrument items recognised in the income statement ...............................................29 9. Income taxes .......................................................29 10. Property, plant and equipment ...........................30 11. Investment properties .........................................31 12. Intangible assets ..................................................32 13. Impairment testing .............................................33 14. Shares in associated companies and joint ventures ......................................................33 15. Non-current financial assets ................................35 16. Deferred taxes .....................................................36 17. Inventories ..........................................................36 18. Trade receivables and other current non-interest-bearing receivables ..........................37 19. Current interest-bearing receivables ....................37 20. Cash and cash equivalents ...................................37 21. Equity ................................................................37 22. Supplementary cooperative capital ......................37 23. Interest-bearing liabilities ....................................38 24. Non-interest-bearing liabilities ............................38 25. Fair values of financial assets and liabilities ..........39 26. Provisions ...........................................................43 27. Operating leases ..................................................43 28. Management of financial and commodity price risks .........................................44 29. Related party transactions ...................................52 30. Contingent liabilities ..........................................52 31. Subsidiaries and associated companies ................54 32. Events after the balance sheet date ......................55
SOK Corporation Key Ratios 2012–2016 .................56
Parent Cooperative’s Financial Statement, FAS ..............................................58 Income statement of SOK ...............................................58 Balance sheet of SOK ......................................................59 Cash flow statement of SOK ...........................................60 Notes to SOK’s financial statements ................................61
Executive Board’s proposalfor the distribution of SOK’sdistributable surplus .....................................................70
Auditor’s report ..............................................................71
Statement by the Supervisory Board .......................73
4 SOK Corporation’s Financial Statements 2016
Executive board report on operations
S Group’s retail sales excluding taxes by business area EUR million Prisma* 3 451 S-market 3 322 Sale and Alepa 978 Other supermarket trade 5 Supermarket trade total* 7 755 Hardware trade 197 Service station store and fuel sales 1 543 Department store and speciality store trade 300 Travel industry and hospitality business* 793 Automotive trade and accessories 339 Agricultural trade 76 Other 15 S Group total* 11 020
* Includes retail sales in the neighbouring regions (the Baltic countries and St Petersburg).
SAt the end of December, S Group had 1,633 outlets (1,632 in December 2015).
At the end of 2016, there were 20 regional cooperatives and seven local cooperatives.
A total of 97,028 new members joined the cooperatives partici-pating in the bonus system in 2016. The total number of co-op members was 2,292,039 at the end of the year. Co-op members were paid EUR 353 million in Bonus rewards.
S Group’s investments amounted to EUR 511 million, com-pared to EUR 558 million in 2015.
S Group's combined unconsolidated result before appropria-tions and taxes was EUR 292 million positive, whereas the re-sult was EUR 299 million in the previous year. The cooperatives’ combined result before appropriations and taxes showed a profit of EUR 269 million, whereas the result was EUR 289 million in the previous year. SOK Corporation’s result before taxes (IFRS) showed a profit of EUR 23 million, whereas it was EUR 9 mil-lion in the previous year.
Development of the operating environment
In 2016, the economic development was better than expected and the Finnish economy returned to a growth path. Growth was based on domestic demand, specifically on growth in private con-sumption, and construction sector investments. However, exports were slower than the growth in the world trade. Consumption growth was supported by the increase in households’ real income, employment development which was better than expected, and the strengthening of consumer confidence in their own economic situation and development in Finland. Retail also took a slight upward turn last year. The deregulation of opening hours at the beginning of 2016 was made use of in the supermarket trade in particular, and supermarkets succeeded in growing their net sales slightly, despite the price competition.
Finland is again on a growth path, but there is still a lot of catching up to do. In the coming years, growth is expected to re-main clearly weaker than in previous economic upturns. Exports are expected to grow moderately as demand in Finland’s export countries recovers. Nevertheless, there are political and economic uncertainties in the global economy, which may impact the devel-opment of export. However, without stronger recovery in exports and investments, balance will not be reached in the public econo-my in Finland. In 2017, growth in public consumption in Finland will be slowed down by the decrease in disposable income. This is attributable to the accelerating rate of inflation and the small agreement increases based on the Agreement on Competitiveness, among others. However, employment is expected to improve. Retail is forecast to grow moderately in the coming years. Nev-ertheless, growth depends on the development of employment.
S Group’s performance 1 January – 30 December 2016
S Group comprises the cooperatives and SOK with its subsidi-aries. S Group’s retail sales excluding taxes in 2016 were EUR 11,020 million, showing an increase of 2.0 per cent compared to the previous year.
SOK Corporation’s Financial Statements 2016 5
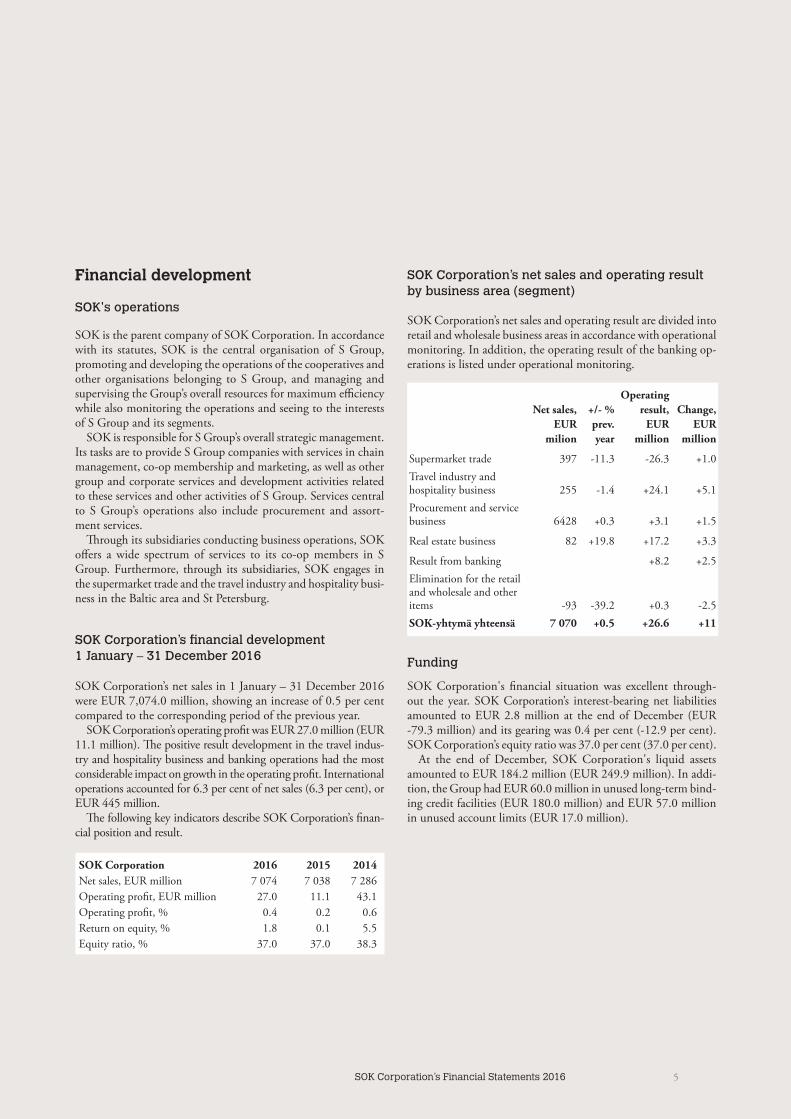
SOK Corporation’s net sales and operating result by business area (segment)
SOK Corporation’s net sales and operating result are divided into retail and wholesale business areas in accordance with operational monitoring. In addition, the operating result of the banking op-erations is listed under operational monitoring.
Net sales, EUR
milion
+/- % prev.year
Operating result,
EURmillion
Change,EUR
million
Supermarket trade 397 -11.3 -26.3 +1.0Travel industry and hospitality business 255 -1.4 +24.1 +5.1Procurement and service business 6428 +0.3 +3.1 +1.5
Real estate business 82 +19.8 +17.2 +3.3
Result from banking +8.2 +2.5Elimination for the retail and wholesale and other items -93 -39.2 +0.3 -2.5SOK-yhtymä yhteensä 7 070 +0.5 +26.6 +11
Funding
SOK Corporation's financial situation was excellent through-out the year. SOK Corporation’s interest-bearing net liabilities amounted to EUR 2.8 million at the end of December (EUR -79.3 million) and its gearing was 0.4 per cent (-12.9 per cent). SOK Corporation’s equity ratio was 37.0 per cent (37.0 per cent).
At the end of December, SOK Corporation's liquid assets amounted to EUR 184.2 million (EUR 249.9 million). In addi-tion, the Group had EUR 60.0 million in unused long-term bind-ing credit facilities (EUR 180.0 million) and EUR 57.0 million in unused account limits (EUR 17.0 million).
Financial development
SOK's operations
SOK is the parent company of SOK Corporation. In accordance with its statutes, SOK is the central organisation of S Group, promoting and developing the operations of the cooperatives and other organisations belonging to S Group, and managing and supervising the Group’s overall resources for maximum efficiency while also monitoring the operations and seeing to the interests of S Group and its segments.
SOK is responsible for S Group’s overall strategic management. Its tasks are to provide S Group companies with services in chain management, co-op membership and marketing, as well as other group and corporate services and development activities related to these services and other activities of S Group. Services central to S Group’s operations also include procurement and assort-ment services.
Through its subsidiaries conducting business operations, SOK offers a wide spectrum of services to its co-op members in S Group. Furthermore, through its subsidiaries, SOK engages in the supermarket trade and the travel industry and hospitality busi-ness in the Baltic area and St Petersburg.
SOK Corporation’s financial development 1 January – 31 December 2016
SOK Corporation’s net sales in 1 January – 31 December 2016 were EUR 7,074.0 million, showing an increase of 0.5 per cent compared to the corresponding period of the previous year.
SOK Corporation’s operating profit was EUR 27.0 million (EUR 11.1 million). The positive result development in the travel indus-try and hospitality business and banking operations had the most considerable impact on growth in the operating profit. International operations accounted for 6.3 per cent of net sales (6.3 per cent), or EUR 445 million.
The following key indicators describe SOK Corporation’s finan-cial position and result.
SOK Corporation 2016 2015 2014 Net sales, EUR million 7 074 7 038 7 286 Operating profit, EUR million 27.0 11.1 43.1 Operating profit, % 0.4 0.2 0.6 Return on equity, % 1.8 0.1 5.5 Equity ratio, % 37.0 37.0 38.3
6 SOK Corporation’s Financial Statements 2016
Investments and divestments
SOK Corporation’s non-current asset procurement, or invest-ments in fixed assets, amounted to EUR 93.1 million in the first half of the year (EUR 48.2 million). The investments were mainly related to logistics and terminal properties and information sys-tems. In addition, SOK Corporation invested in the travel indus-try and hospitality business in Finland and acquired the Radisson Blue Espoo property.
Sales of non-current assets amounted to EUR 33.9 million in the review period (EUR 24.6 million). The divestments of non-current assets consisted of sales of shares and properties, with the largest one being the final instalment related to shares in Hank-kija Oy. This instalment was recognised in accordance with the IFRS in 2013.
Personnel
SOK Corporation’s average number of personnel, converted to full-time equivalents, (active employment relationships) was 5,849 people during the financial period (2015: 7,778; 2014: 8,232).
At the end of 2016, SOK Corporation's number of personnel in active employment relationships was 6,722, of whom 1,355 (20 per cent) were employed by SOK and 5,367 (80 per cent) by the subsidiaries. The number of personnel decreased by 556 persons (8 per cent) compared to the corresponding period in the previous year. The total number of employees working abroad was 3,428 (50 per cent). The reduction in the number of person-nel during the year was attributable to employee reductions and transfers of business in SOK Corporation and subsidiaries as well as personnel changes in the neighbouring countries.
Development of the business areas
Supermarket trade
The supermarket trade includes the business operations in Esto-nia, Latvia, Lithuania and Russia. In Estonia, SOK Corporation has five Prisma stores in Tallinn, two stores in Tartu and one in Narva. In Riga, Latvia, the Group operates three Prisma stores, as one unit was closed at the end of May due to the lease expiring.
Another unit was closed in June, when issues in the building’s structure resulted in the authorities prohibiting its use. In Lithu-ania, SOK Corporation has two Prisma stores in Vilnius and two in Kaunas. In addition, it has 17 Prisma stores in St Petersburg.
Net sales from the supermarket trade totalled EUR 397 million. Compared to the previous year, the net sales decreased by 11 per cent. This was in part attributable to the closing of units in Lat-via, the exchange rate of the rouble, and tightening competition in all market areas. The operating result of the supermarket trade was EUR 1.0 million better than in the previous year. Investments made in the supermarket trade totalled EUR 1.7 million and were related to the replacement of equipment.
Travel industry and hospitality business
In 2016, SOK Corporation's travel industry and hospitality busi-ness was conducted by Sokotel Oy in Finland, AS Sokotel in Es-tonia, and OOO Sokotel in Russia.
In Finland, the travel industry and hospitality market was expe-riencing strong growth in 2016. In 2016, Sokotel Oy's net sales were EUR 210.9 million, showing a decrease of 3.1 per cent from the previous year. The decrease in net sales was due to the divest-ment of Break Sokos Hotel Caribia’s business operations in late 2015 and the renewal projects in progress. Sokotel Oy’s operating result improved considerably from the previous year, reaching a level of more than 10 per cent, mainly due to the good develop-ment of the comparable net sales in the hospitality business.
The net sales of AS Sokotel, engaging in the travel industry and hospitality business in Tallinn, increased by 3.7 per cent from the previous year, to EUR 18.5 million. The operating result of AS Sokotel was slightly weaker than in the previous year due to the increase in the cost level.
The net sales of OOO Sokotel, engaging in the travel industry and hospitality business, was EUR 25.6 million, with an increase of 11.2 per cent from the previous year. In the local currency, the net sales increased by 18.5 percent. The operating result of OOO Sokotel was clearly better than in the previous year, break-ing a new record as a result of the net sales that were better than the market.
In 2016, the investments by the travel industry and hospitality business totalled EUR 9.7 million. Of this amount, investments in Finland accounted for EUR 9.1 million, in Russia EUR 0.3 million, and in Estonia EUR 0.3 million. The investments con-sisted mainly of hotel unit renovations.

SOK Corporation’s Financial Statements 2016 7
Procurement and service business
The procurement and service business comprises procurement services for groceries and consumer goods provided by SOK’s pro-curement operations, logistics services provided by Inex Partners Oy, procurement and logistics services provided by Meira Nova Oy in the HoReCa business, and other services provided by SOK and its subsidiaries primarily for the S Group units. Net sales gen-erated by other services provided to S Group's units include chain fees and management service income.
Net sales from the procurement and service business totalled EUR 6,428.5 million, showing a year-on-year increase of 1.5 per cent in terms of comparable net sales. The operating result of the procurement and service business was slightly better than in the previous year.
In 2016, investments by the procurement and service business totalled EUR 35.6 million. The investments mainly consisted of information system acquisitions.
Real estate business
Net sales from the real estate business consist of rental and prop-erty service income from properties owned by SOK Corporation. Net sales from the real estate business were EUR 82.5 million, representing a year-on-year increase of 3.8 per cent in compara-ble net sales. The operating result of the real estate business was slightly better than in the previous year and showed a clear profit.
In 2016, investments by the real estate business totalled EUR 45.9 million and were mainly related to logistics and terminal properties. In addition, the Radisson Blue Espoo property was acquired.
Development of associated companies and joint ventures
Among the associated companies engaging in business operations within SOK Corporation, the most significant is S-Bank Ltd, which operates in the banking sector. S-Bank Group’s operations were centralised and its corporate structure was simplified during the first half of the year. FIM’s brokerage and custody services and
book-entry accounts were transferred to S-Bank at the beginning of March. In June, S-Bank acquired the rest of FIM Corporation’s share capital, and S-Bank’s Executive Board approved the related plan to merge FIM Corporation with S-Bank by the end of 2016.
At the end of June, S-Bank’s total funds on deposit were EUR 4,547.0 million (EUR 4,112.0), and its total lending was EUR 3,492.2 million (EUR 2,831.1 million). S-Bank Group’s capital adequacy ratio was 15.1 per cent (14.3 per cent). At the end of June, S-Bank Group’s operating result was EUR 22.3 million (EUR 16.6 million). The IRFS-adjusted result corresponding to SOK Corporation’s shareholding (37.5%) was EUR 8.2 million. A non-recurring gain from the sale of shares had a strong effect on S-Bank’s result.
A significant product launch during the first months of the year was the mobile refuelling service introduced by S-Bank and the ABC chain. The service enables customers to pay for fuel using their smart phones.
The fuel procurement company North European Oil Trade Group’s net sales were approximately EUR 4,708 million (EUR 4,300 million).
Growth in the volume of the Group’s business operation is in part attributable to the full-time operations of the Norwegian subsidiary in the 2016 financial period compared to the previ-ous financial period, when the operations in Norway began in October 2015.
SOK’s shareholding in North European Oil Trade Oy is 50.77 per cent. Due to the shared controlling interest based on the shareholding agreement, the company is treated as a joint venture using the equity method.
In addition to S-Bank and North European Oil Trade Oy, other associated companies and joint ventures of SOK Corporation in-clude Russian and Baltics Retail Properties Ky, a property fund company investing in Prisma stores in St Petersburg and the Baltic area; Finnfrost Oy, an associated company of SOK’s subsidiary Inex Partners Oy that provides frozen goods procurement and lo-gistics services; Kauppakeskus Mylly Oy in Raisio; and the inter-Nordic procurement company Coop Trading A/S.
The total impact of SOK Corporation’s associated companies and joint ventures on SOK Corporation’s result was EUR 11.8 million (EUR 8.0 million).

8 SOK Corporation’s Financial Statements 2016
Changes in the group structure
SOK acquired the real estate companies Lempäälän Terminaali and Limingan Terminaali in March. In February, SOK established the real estate company Kiinteistö Oy Pohjanmaan Terminaali. In June, SOK acquired the Espoo Radisson Blue property (Kiinteistö Oy Otapuisto). The real estate company Lohjan Karnaistenkatu 40 was divested in May. The Group purchased the minority of SOK Takaus Oy.
Management and future outlook
Management and changes in management
Taavi Heikkilä was Chairman of SOK’s Executive Board in 2016. In addition to the CEO, the Executive Board in 2016 had the following members: Managing Director Heikki Hämäläinen, Managing Director Tapio Kankaanpää, Managing Director Han-nu Krook, Managing Director Timo Mäki-Ullakko, Managing Director Matti Niemi, and Managing Director Jouko Vehmas. Managing Director Matti Niemi was the Vice-Chairman of the Executive Board.
The auditor in the financial year 2016 was KPMG Oy Ab, Authorised Public Accountants, with APA Jukka Rajala as the principal auditor.
SOK's Supervisory Board appointed the following persons to SOK's Executive Board for the one-year term beginning on 1 January 2017: Managing Director Matti Niemi (Vice-Chairman), Managing Director Heikki Hämäläinen, Managing Director Tap-io Kankaanpää, Managing Director Hannu Krook, Managing Director Timo Mäki-Ullakko and Managing Director Olli Vorm-isto. SOK's Chief Executive Officer Taavi Heikkilä was the Chair-man of the Executive Board.
SOK’s CEO is assisted by SOK’s Corporate Management Team in the management of SOK Corporation and S Group. In 2016, the Corporate Management Team consisted of Arttu Laine, Dep-uty CEO of SOK, Executive Vice President, S Group Chain Man-agement; Jari Annala, CFO, SOK Finance and Administration; Susa Nikula, Executive Vice President, SOK Human Resources; Jorma Vehviläinen, Executive Vice President, SOK Consumer Goods; and Veli-Pekka Ääri, Executive Vice President, SOK Cus-tomer Relationships, Information and Digital Services. Seppo Kuitunen, General Counsel, served as secretary to the Corporate Management Team. In addition, Sebastian Nyström, Executive Vice President, Strategy, was appointed to the Corporate Man-agement Team in January 2017.
Near-term risks and uncertainties
SOK Corporation’s risk management policy is based on S Group’s joint risk management principles. SOK Corporation’s Execu-tive Board has discussed and approved the company’s risk man-agement policy, which describes the purpose and goals of risk management, as well as key implementation methods and respon-sibilities related to risk management. Within SOK Corporation, risk management is implemented continuously and throughout the management process. Risks are reviewed in a comprehensive manner, taking into consideration strategic, financial, operative, and loss or damage risks. Through risk management procedures, SOK and its subsidiaries aim to anticipate and control risk factors that affect their ability to reach their goals, and use the potential related to risks in their business operations.
S Group’s strategic risks are reviewed by SOK’s Corporate Management Team annually and confirmed by SOK’s Executive Board. S Group’s most significant near-term risks and uncertainty factors are related to the profitability and competitiveness of the grocery trade and to ensuring the profitability of the consumer goods trade in the changing retail sector. Digitisation is providing the sector with new opportunities, and appropriate timing and targeting play a key role in making use of these opportunities. Operational efficiency is being developed through the introduc-tion of a new logistics centre for the grocery trade, as well as ma-jor information system projects. SOK supports these projects by means of active, extensive risk management. With regard to the risk factors related to changes in regulation, SOK is preparing for the implementation of the new EU data protection regulation in particular. With regard to SOK’s own business operations, the key near-term risks are related to profitability development, particu-larly in the Baltic countries and Russia.
SOK Corporation’s funding and management of finance risks are centralised within SOK’s Treasury unit. The Group has a fi-nance and funding policy confirmed by the SOK Executive Board that defines the principles of managing financing risks and the permissible maximum amounts for financing risks. In addition, numerical targets have been set for the different areas of financ-ing in order to ensure that financing is sufficient, balanced, and affordable under all circumstances. The management of financing risks is described in greater detail in the Notes to the Financial Statements.
The most significant environmental considerations and the re-lated measures are described in S Group’s Annual Report, which will be published at www.s-kanava.fi in the spring of 2017.

SOK Corporation’s Financial Statements 2016 9
Outlook for the current year
The development of the general economic situation in Finland and its neighbouring regions is a significant factor for the success of SOK Corporation's operations. The Finnish economy has re-turned to a path of growth. Private consumption and investments have increased, but growth is expected to remain modest in 2017. Despite the increase in oil prices towards the end of 2016, eco-nomic growth in Russia is also expected to be slow in the current year. However, private consumption is expected to grow slightly and consumer confidence in Russia is already better than before. In the Baltic countries, the market and the economic situation have been and will continue to be challenging. The factors men-tioned above continue to pose challenges with regard to perfor-mance in the current year.
As a result of the efficiency measures carried out and ongoing in the business operations, particularly focusing on the travel in-dustry and hospitality business and the supermarket trade, the results of SOK Corporation’s operations are expected to improve from last year's level, despite the challenging market situation. The result for the travel industry and hospitality business in Fin-land will be burdened by the investments in the network devel-opment that will be more extensive in 2017 than in the previous year. Despite the challenging outlook for the market in the Baltic countries, the overall result of the supermarket trade is expected to improve year-on-year as a result of network development and the efficiency measures.
The most significant risks in the procurement and services busi-ness in the coming years are related to the new grocery logistics centre in Sipoo. The smooth start of operations in Sipoo from June 2016 onwards and the controlled, gradual rundown of the old logistics centre in Espoo between 2016 and 2018 will have a significant effect on SOK Corporation’s procurement and ser-vices business.
Executive Board's proposal on the distribution of SOK's distributable surplus
SOK's distributable surplus is EUR 594,473,024.34, of which the surplus for the financial year is EUR 46,366,521.86. The Execu-tive Board proposes that EUR 10,321,966.00 be paid as interest on cooperative capital and that EUR 50,000.00 be transferred to the Supervisory Board's contingency fund, and that EUR 35,994,555.86 be left on the surplus account for the previous financial years.
No significant changes have occurred in SOK's financial po-sition since the end of the financial period. SOK's liquidity is good and the proposed distribution of surplus does not endanger SOK's solvency, in the view of the Executive Board.
Helsinki, 10 February 2017
SOK CORPORATION
Executive Board

10 SOK Corporation’s Financial Statements 2016
Consolidated financial statements, IFRS
Consolidated income statement, IFRS
EUR million
RevenueOther operating income
Materials and servicesEmployee benefit expensesDepreciation and impairment losses
Other operating expensesShare of results of associated companies and joint ventures (+/-)
Operating profit (-loss)Financial income and expenses (+/-)Share of results of associated companies and joint ventures (+/-)
Profit before taxes
Income taxes (+/-)Result for the financial year
Attributable to:Owners of the parentShare of non-controlling interests
Statement of other comprehensive income
EUR million
Result for the financial year Other comprehensive income:Items that may be Reclassified Subsequently to Profit andExchange differences on translating foreign operationsAvailable-for-sale financial assets Exchange differences on loans to foreign subsidiaries classified as net investmentsCashflow hedgesComprehensive income items of associated companies and joint venturesItems that will not be Reclassified to Profit and Loss Other items of comprehensive incomeOther comprehensive income for the financial year, net of taxTotal comprehensive income for the financial year
Total comprehensive income for the financial year attributable to:Owners of the parentShare of non-controlling interests
Note 1.1.–31.12.2016 1.1.–31.12.2015 7 074.0 7 038.4(2) 1.5 2.0 -6 424.7 -6 336.9(3) -214.2 -258.8(4) -61.9 -62.8 (5) -359.4 -378.5(14) 11.6 7.7 27.0 11.1(7) -4.4 -2.1(14) 0.2 0.3 22.8 9.4 (9) -11.2 -8.8 11.6 0.6 13.7 3.3 -2.1 -2.6 11.6 0.6
1.1.–31.12.2016 1.1.–31.12.2015
11.6 0.6 10.5 -2.9 2.7 3.5 -1.0 2.5 -5.4 -0.4 -0.4 18.7 -9.2 30.3 -8.6 32.4 -6.0 -2.1 -2.6 30.3 -8.6
11SOK Corporation’s Financial Statements 2016
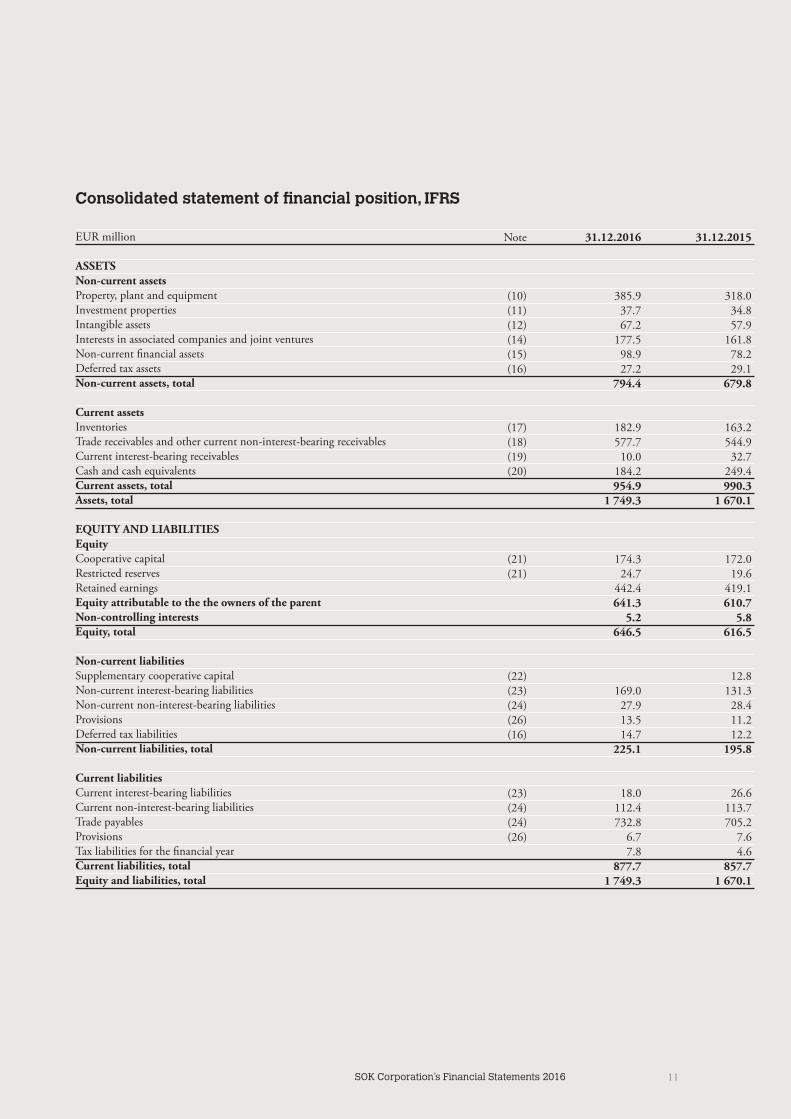
Consolidated statement of financial position, IFRS
EUR million
ASSETSNon-current assetsProperty, plant and equipmentInvestment propertiesIntangible assetsInterests in associated companies and joint venturesNon-current financial assets Deferred tax assetsNon-current assets, total
Current assetsInventoriesTrade receivables and other current non-interest-bearing receivablesCurrent interest-bearing receivablesCash and cash equivalentsCurrent assets, totalAssets, total
EQUITY AND LIABILITIESEquityCooperative capitalRestricted reservesRetained earningsEquity attributable to the the owners of the parentNon-controlling interestsEquity, total
Non-current liabilitiesSupplementary cooperative capitalNon-current interest-bearing liabilitiesNon-current non-interest-bearing liabilitiesProvisionsDeferred tax liabilitiesNon-current liabilities, total
Current liabilitiesCurrent interest-bearing liabilitiesCurrent non-interest-bearing liabilitiesTrade payablesProvisionsTax liabilities for the financial yearCurrent liabilities, totalEquity and liabilities, total
Note 31.12.2016 31.12.2015 (10) 385.9 318.0 (11) 37.7 34.8 (12) 67.2 57.9 (14) 177.5 161.8 (15) 98.9 78.2 (16) 27.2 29.1 794.4 679.8 (17) 182.9 163.2 (18) 577.7 544.9 (19) 10.0 32.7 (20) 184.2 249.4 954.9 990.3 1 749.3 1 670.1 (21) 174.3 172.0 (21) 24.7 19.6 442.4 419.1 641.3 610.7 5.2 5.8 646.5 616.5 (22) 12.8 (23) 169.0 131.3 (24) 27.9 28.4 (26) 13.5 11.2 (16) 14.7 12.2 225.1 195.8
(23) 18.0 26.6 (24) 112.4 113.7 (24) 732.8 705.2 (26) 6.7 7.6 7.8 4.6 877.7 857.7 1 749.3 1 670.1
12 SOK Corporation’s Financial Statements 2016
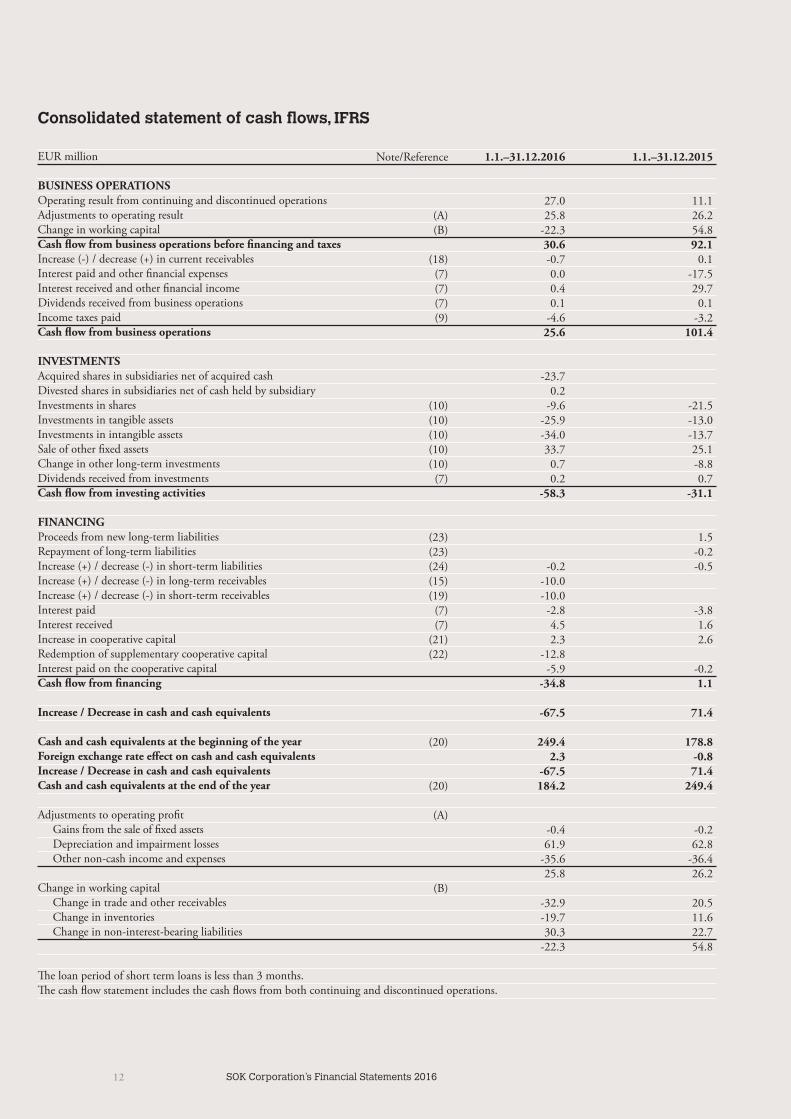
Consolidated statement of cash flows, IFRS
EUR million
BUSINESS OPERATIONS Operating result from continuing and discontinued operationsAdjustments to operating result Change in working capital Cash flow from business operations before financing and taxes Increase (-) / decrease (+) in current receivablesInterest paid and other financial expensesInterest received and other financial incomeDividends received from business operations Income taxes paid Cash flow from business operations INVESTMENTS Acquired shares in subsidiaries net of acquired cashDivested shares in subsidiaries net of cash held by subsidiaryInvestments in sharesInvestments in tangible assetsInvestments in intangible assetsSale of other fixed assetsChange in other long-term investments Dividends received from investments Cash flow from investing activities FINANCING Proceeds from new long-term liabilities Repayment of long-term liabilities Increase (+) / decrease (-) in short-term liabilities Increase (+) / decrease (-) in long-term receivablesIncrease (+) / decrease (-) in short-term receivablesInterest paidInterest receivedIncrease in cooperative capital Redemption of supplementary cooperative capital Interest paid on the cooperative capital Cash flow from financing Increase / Decrease in cash and cash equivalents Cash and cash equivalents at the beginning of the yearForeign exchange rate effect on cash and cash equivalentsIncrease / Decrease in cash and cash equivalentsCash and cash equivalents at the end of the year Adjustments to operating profit Gains from the sale of fixed assets Depreciation and impairment losses Other non-cash income and expenses Change in working capital Change in trade and other receivables Change in inventories Change in non-interest-bearing liabilities The loan period of short term loans is less than 3 months.The cash flow statement includes the cash flows from both continuing and discontinued operations.
Note/Reference 1.1.–31.12.2016 1.1.–31.12.2015
27.0 11.1 (A) 25.8 26.2 (B) -22.3 54.8 30.6 92.1 (18) -0.7 0.1 (7) 0.0 -17.5 (7) 0.4 29.7 (7) 0.1 0.1 (9) -4.6 -3.2 25.6 101.4 -23.7 0.2 (10) -9.6 -21.5 (10) -25.9 -13.0 (10) -34.0 -13.7 (10) 33.7 25.1 (10) 0.7 -8.8 (7) 0.2 0.7 -58.3 -31.1 (23) 1.5 (23) -0.2 (24) -0.2 -0.5 (15) -10.0 (19) -10.0 (7) -2.8 -3.8 (7) 4.5 1.6 (21) 2.3 2.6 (22) -12.8 -5.9 -0.2 -34.8 1.1 -67.5 71.4 (20) 249.4 178.8 2.3 -0.8 -67.5 71.4 (20) 184.2 249.4 (A) -0.4 -0.2 61.9 62.8 -35.6 -36.4 25.8 26.2 (B) -32.9 20.5 -19.7 11.6 30.3 22.7 -22.3 54.8
13SOK Corporation’s Financial Statements 2016
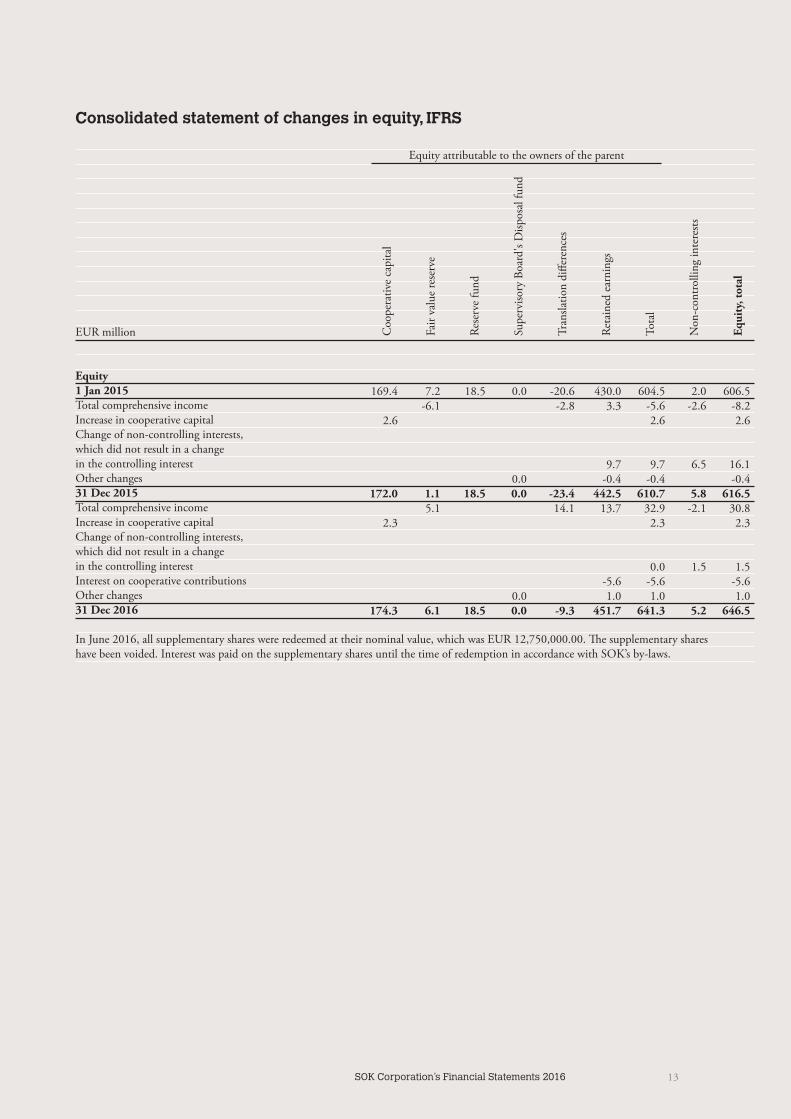
Consolidated statement of changes in equity, IFRS
EUR million
Equity1 Jan 2015Total comprehensive incomeIncrease in cooperative capitalChange of non-controlling interests, which did not result in a change in the controlling interestOther changes31 Dec 2015Total comprehensive incomeIncrease in cooperative capitalChange of non-controlling interests, which did not result in a change in the controlling interestInterest on cooperative contributionsOther changes31 Dec 2016
In June 2016, all supplementary shares were redeemed at their nominal value, which was EUR 12,750,000.00. The supplementary shareshave been voided. Interest was paid on the supplementary shares until the time of redemption in accordance with SOK’s by-laws.
Coo
pera
tive
capi
tal
Fair
valu
e re
serv
e
Rese
rve
fund
Supe
rviso
ry B
oard
's D
ispos
al fu
nd
Tran
slatio
n di
ffere
nces
Reta
ined
ear
ning
s
Tota
l
Non
-con
trolli
ng in
tere
sts
Equi
ty, t
otal
Equity attributable to the owners of the parent
169.4 7.2 18.5 0.0 -20.6 430.0 604.5 2.0 606.5 -6.1 -2.8 3.3 -5.6 -2.6 -8.2 2.6 2.6 2.6
9.7 9.7 6.5 16.1 0.0 -0.4 -0.4 -0.4 172.0 1.1 18.5 0.0 -23.4 442.5 610.7 5.8 616.5 5.1 14.1 13.7 32.9 -2.1 30.8 2.3 2.3 2.3
0.0 1.5 1.5 -5.6 -5.6 -5.6 0.0 1.0 1.0 1.0 174.3 6.1 18.5 0.0 -9.3 451.7 641.3 5.2 646.5
14 SOK Corporation’s Financial Statements 2016
Notes to the consolidated financial statements
Company information
In accordance with SOK’s Statutes, the name ‘SOK Corporation’ is used for the SOK Group. SOK Corporation comprises Suomen Osuuskauppojen Keskuskunta (SOK) and its subsidiaries. SOK is domiciled in Helsinki and its registered address is Fleminginkatu 34, 00510 Helsinki.
SOK’s purpose is to create competitive advantage for S Group’s businesses. SOK implements its operational objective by devel-oping and guiding S Group’s strategies, value chain, and chain operations in co-operation with the cooperative enterprises. SOK produces the shared, competitiveness-enhancing services S Group requires and engages in profitably growing operations in Finland and its neighbouring countries, with the aim of creating synergies and added economic value for S Group’s products.
A copy of the consolidated financial statements is available at http://www.s-kanava.fi.
Accounting policies for consolidated financial statements
Accounting basis
The consolidated financial statements have been prepared in ac-cordance with the International Financial Reporting Standards (‘IFRS’), and the IAS and IFRS standards and SIC and IFRIC interpretations in force on 31 December 2016 have been applied in preparing them. ‘International Financial Reporting Standards’ refer to the standards and interpretations thereof approved for ap-plication in the EU in accordance with the procedure stipulated in the Finnish Accounting Act and related regulations in the EU directive (EC) N:o 1606/2002.
The financial statements information is presented in millions of euro and is based on original acquisition costs unless indicated otherwise in the accounting policies below.
All figures in the tables of the financial statements have been rounded off, which is why the total of the individual figures may differ from the sum presented. The key ratios have been calculated with exact values.
S-Bank prepares its consolidated financial statements in accord-ance with the Finnish Accounting Standards (FAS). During the consolidation of S-Bank Group’s result with SOK Corporation’s consolidated financial statements (IFRS), the necessary adjust-ments to IFRS have been made, of which the most significant is the bank's goodwill amortization adjustment.
New and amended standards and interpretations adopted in the 2016 financial period
The amendments to IFRS 10 Consolidated Financial Statements, IFRS 11 Joint Arrangements, and IAS 28 Investments in Associates and Joint Ventures, as well the Annual Improvements to IFRS standards (cycles 2012–2014) adopted in 2016 have not had ma-terial effects on the consolidated financial statements.
Use of estimates
The preparation of the financial statements in compliance with IFRS calls for the making of estimates and for judgement in ap-plying accounting policies. The estimates are based on manage-ment’s best judgement on the balance sheet date, but it is possible that the actual outcome will differ from the estimates used. Any changes to estimates and assumptions are recognised in the finan-cial period during which the estimate or assumption is corrected.
The main uncertainties in respect of estimates and assumptions concerning the future that cause a risk of significant changes to the carrying values of assets and liabilities in the subsequent fi-nancial period concern the determination of the fair value of as-sets acquired in business combinations and financial instruments which are classified as level three, impairment testing, as well as deferred tax assets and provisions.
In significant reorganisations, the Corporation has used an ex-ternal advisor when evaluating the fair values of tangible and intangible assets, and comparisons with the market prices of equivalent assets have been made in the valuation of such assets.
Impairment testing is carried out annually on goodwill and possible intangible assets in progress. In addition to these, im-pairment testing is carried out on unprofitable foreign operations.
The recoverable monetary amount from the operations of a business entity subject to impairment testing is based on value in use calculations or on the fair value less expenses incurred by sales. Value in use has been calculated on the basis of forecast dis-counted cash flows. Impairment testing on goodwill is described in greater detail in Note 13, Impairment testing.
Assumptions and key uncertainties related to determining the fair value of financial instruments are described in Note 25, Fair values of financial assets and liabilities. Additional information on deferred taxes and provisions are provided in Notes 16 Deferred taxes and 26 Provisions.
SOK Corporation’s Financial Statements 2016 15
Principles of consolidation
The consolidated financial statements include the parent coop-erative and all subsidiaries in which the parent cooperative has controlling interest. Controlling interest is generated when the Corporation has the right to control the principles of the com-pany's finances and operations in order to gain benefits from its operations. In addition to Finland, the parent cooperative has subsidiaries in Russia, Estonia, Latvia, and Lithuania.
Acquired subsidiaries are consolidated using the purchase method, according to which all the identifiable assets and liabili-ties of the acquired company are measured at fair value on the date of acquisition. Goodwill is recognised in the amount by which the combined amount of the consideration given, the share of non-controlling shareholders in the acquired company and the share owned previously exceed the fair value of the acquired net assets. Costs related to the acquisition, excluding borrowing costs, are recognised as expenses.
Joint ventures in which SOK Corporation exercises shared con-trol and associated companies in which the Corporation holds 20–50 per cent of the votes and in which the Corporation has significant influence but does not exercise control have been con-solidated using the equity method. The share in accordance with the Corporation's holding of the changes recognised in other comprehensive income items has been recognised in the Corpo-ration's other comprehensive income items. If the Corporation’s share of an associate company's or joint venture’s losses exceeds the carrying amount of the investment, the investment is en-tered in the balance sheet at zero value and losses in excess of this amount are not taken into account unless the Corporation has obligations towards the associated companies or joint ventures. The share of the profits of an associated company or joint venture that has been acquired for investment purposes is presented be-low operating profit, before financial income and expenses. The profit or loss of associated companies and joint ventures serving the Corporation’s ordinary operations is, however, presented be-fore the final operating profit.
Companies acquired or established during the financial year have been consolidated from the date of acquisition or establish-ment. Divested subsidiaries as well as associated companies and joint ventures have been consolidated in the consolidated finan-cial statements up to the date on which the controlling inter-est, shared controlling interest or significant influence ends. The changes in the parent company's holding in a subsidiary which do not result in losing the controlling interest are treated as transac-tions concerning shareholders' equity.
Intra-Group transactions, receivables, liabilities, unrealised margins, and internal distribution of profits have been eliminat-ed in the consolidated financial statements. Profit or loss for the
financial period as well as the comprehensive income for the fi-nancial period have been distributed to the shareholders of the parent company and non-controlling shareholders. The share of non-controlling shareholders is presented as a separate item in the Corporation's shareholders' equity.
Mutual real-estate companies are consolidated (those assets and liabilities the shareholder is responsible for) line by line as joint operation in proportion to the Corporation’s shareholding.
Items denominated in foreign currency
The consolidated financial statements are presented in the euro, which is the functional and presentation currency of SOK Cor-poration’s parent cooperative. The figures concerning the result and financial position of foreign Group companies have been originally given in the currency of each company's operating en-vironment.
Transactions in foreign currency have been recognised at the ex-change rate on the date of the transaction. Foreign currency mon-etary items at the end of the financial year have been translated into euro at the exchange rate quoted by the European Central Bank on the closing day of the financial year and the exchange rate differences have been recognised through profit and loss. Non-monetary items have been translated at the rate on the date of the transaction.
Exchange rate differences arising from the valuation of trade receivables are recognised in revenue, and exchange rate differ-ences arising from the valuation of trade payables are recognised in expenses above the operating profit. The exchange gains and losses of receivables belonging to other financial items in the bal-ance sheet are recognised in financial income and, correspond-ingly, those belonging to other liabilities, in financial expenses.
The income statements of foreign subsidiaries are translated in-to euro at the average rate of the financial period, and the balance sheets at the rate on the balance sheet date. An exchange rate dif-ference arising from translating the income statement items and other comprehensive income items according to the average rate and translating balance sheet items according to the balance sheet date and, similarly, a translation difference due to exchange rate changes in the elimination of the subsidiaries’ acquisition cost and in shareholders' equity, have been recognised as a separate item in other comprehensive income items. When a foreign subsidiary, associated company or joint venture is divested, the cumulated translation difference is recognised as part of capital gain or loss through profit and loss.
Exchange rate differences in loans granted to foreign subsidi-aries have been treated as other comprehensive income items as far as their repayment is not probable in the foreseeable future.
16 SOK Corporation’s Financial Statements 2016
Financial assets and liabilities
Financial assets are included in the following balance sheet items: non-current financial assets, trade receivables and other current non-interest-bearing receivables, current interest-bearing receiva-bles, current investments and cash and cash equivalents.
Non-current financial assets consist of shares, capital loan re-ceivables, other long-term loan receivables and long-term trade receivables. Trade receivables and other current non-interest-bear-ing receivables, which are included in financial assets, comprise trade receivables, derivative receivables, and accrued income in re-spect of financial items. Current interest-bearing receivables com-prise short-term loan receivables and other short-term receivables. Cash and cash equivalents consist of cash in hand and very liquid receivables from credit institutions.
Financial liabilities are included in the following balance sheet items: non-current interest-bearing liabilities, non-current non-interest-bearing liabilities, current interest-bearing liabilities, cur-rent non-interest-bearing liabilities, and trade payables.
Non-current interest-bearing liabilities consist of liabilities to cooperative enterprises and others, as well as finance lease liabili-ties. Non-current, non-interest-bearing liabilities, which are in-cluded in financial liabilities, comprise the regional cooperative enterprises’ funds that have been invested in SOK Corporation’s cash-counting service. Trade payables consist of current trade pay-ables. Current interest-bearing liabilities consist of current liabili-ties to others, as well as current finance lease liabilities. Current non-interest-bearing liabilities, which are included in financial liabilities, comprise derivative liabilities as well as accruals and deferred income related to financial items.
SOK Corporation applies a settlement-date practice in recog-nising financial assets and liabilities in the balance sheet. Financial assets and liabilities that will not be later measured at fair value through profit and loss are initially measured at fair value plus the immediate acquisition costs.
Financial assets and liabilities are classified as financial assets or liabilities measured at fair value through profit and loss, available-for-sale financial assets, loans and other receivables, and other fi-nancial liabilities. Financial assets and liabilities are measured at fair value or amortised cost using the effective interest method in accordance with their classification.
The fair value of a financial instrument is determined on the basis of prices quoted in active markets or by using measurement methods that are generally applied in the markets. The fair value of interest rate swaps has been determined by discounting future cash flows to the present by using the market rates of the balance sheet date. The counterparty's quoted price has been used in the valuation of interest rate options. The fair value of currency for-wards has been calculated by measuring the forward contracts at the forward rate of the balance sheet date. Electricity derivatives are measured at the fair value by using the market quotations of
the balance sheet date. Financial assets and liabilities at fair value have been measured using average rates.
Derivative contracts in which hedge accounting is not applied are recognised in financial assets and liabilities to be measured at fair value through profit and loss. Financial assets or liabilities recognised at fair value through profit and loss are measured at the market price of the closing date. The change in fair value is entered in the income statement in such a manner that the dif-ference between the value on the balance sheet date of the finan-cial instruments recognised at fair value in the income statement and the carrying value on the previous balance sheet is entered as the income or expense for the period. If the financial instrument recognised at fair value was acquired during the financial period, the difference between the value of the financial instrument on the balance sheet date and its acquisition cost is entered as the income or expense for the period.
The changes in the fair value of derivatives have been recognised through profit or loss, with the exception of hedge accounting. Realised and non-realised gains and losses from derivative con-tracts made in order to hedge purchases and trade payables are recognised in purchases. The majority of electricity derivatives were transferred to S-Voima Oy in 2010. In connection with this, some electricity derivatives remained with SOK and were transferred to S-Voima Oy through contracts with opposite items. The electricity derivatives are measured at fair value but their net effect on earnings is zero. Realised and non-realised gains and losses of other derivatives recognised at fair value through profit or loss are recognised in financial income and financial expenses, respectively.
The items recognised in available-for-sale financial assets are debt securities and other domestic and foreign securities and par-ticipations that are not classified as financial assets at fair value through profit and loss, investments held to maturity, or loans and other receivables. Financial assets available for sale are measured at fair value. The fair value of publicly traded investments is de-fined on the basis of their market values. The change in fair value is recorded in equity in the fair value reserve through other com-prehensive income items. When the financial instrument is sold, the cumulative change in fair value cumulated in equity, together with accrued interest and capital gains or losses, is recognised in the income statement as a change in classification. Investments that are not publicly quoted are measured at cost if their fair val-ues cannot be reliably determined.
Loans and other receivables include such financial assets un-quoted on an active financial market, for which the payments are fixed or determinable and which do not belong to financial assets measured at fair value through profit and loss, financial assets held to maturity, or available-for-sale financial assets. The transaction costs of liabilities and receivables are included in the amortised acquisition cost calculated using the effective interest

SOK Corporation’s Financial Statements 2016 17
method and amortised through profit and loss for the term-to-maturity of the receivable. After the initial recognition, liabilities and receivables are measured at amortised acquisition cost using the effective interest method.
An item belonging to other financial liabilities is recognised in the balance sheet at its nominal value when its fair value at the time of its entry corresponds to the nominal value. If the debt capital received is less or more than the nominal value of the li-ability, the debt is measured at the amount that has been received for it. The amount recognised as expense or income for the finan-cial period from the difference between the nominal value of the debt and cost of debt is amortised and recognised as an increase or decrease in the cost of debt. The difference between the nominal value and cost, or a fee or other expense that is associated with the debt and is included in the interest expense related to the debt, is amortised using the effective interest method as an expense for the term-to-maturity of the debt. Other financial liabilities are measured at the amortised cost on the balance sheet date using the effective interest method.
Hedge accounting
The Group applies hedge accounting according to IFRS to some of the currency derivatives used for hedging Group goods pur-chases. In these, only the exchange rate risk is being hedged. The hedge accounting model used is cash flow hedging.
The Corporation has derivative contracts outside of hedge ac-counting which, according to the Corporation's financial policy, are effective economic hedging instruments but to which hedge accounting in accordance with the IAS 39 standard is not applied.
Impairment of financial assets
At the end of the reporting period, the Corporation assesses whether there is any objective evidence that the value of items other than those classified as financial assets at fair value through profit and loss are impaired. Objective evidence is considered to be, for example, a customer’s delay in payment, insolvency or bankruptcy, reorganisation or consolidation of debt, as well as a major change in the credit rating. If there is objective evidence of impairment, an impairment loss is recorded.
The amount of an impairment loss on financial assets recorded at amortised cost is determined as the difference between the carrying amount of the asset and the present value of estimated future cash flows from the asset, including the fair value of any collateral. The discount rate applied is the original effective inter-est rate of the receivable. The difference is recognised as an impair-ment loss in the income statement, and the accrual of interest is continued on the lowered balance at the original effective interest rate of the contract.
If the amount of an impairment loss subsequently decreases and the change can be attributed to an event that has taken place after the recognition of the impairment loss, the impairment loss is reversed through profit and loss.
When there is objective evidence of the impairment of debt se-curities or shares included in available-for-sale financial assets, the cumulative loss that was recognised in equity is recognised in the income statement as an impairment loss. The impairment loss is determined as being the difference between the carrying amount and the present value of estimated future cash flows discounted at the market yield of a similar item on the reporting date. If the fair value of notes or bonds classified as available-for-sale later increases and the increase can be objectively related to an event occurring after the impairment was recognised, the previously recognised impairment loss is reversed and recognised through profit and loss. If the fair value of a share later increases, the in-crease in value is recognised in equity through other comprehen-sive income items.
Principles of income recognition
SOK Corporation’s revenue consists of invoicing related to the cooperative enterprises’ goods procurement, joint service business operated by SOK in a centralised manner and retail by SOK’s subsidiaries. Sales to the cooperative enterprises are invoiced sales. Retail is mainly cash or credit card sales.
The sales of goods and services are included in revenue. In calculating revenue, sales gains are stated less items such as bonus discounts granted to co-op members from centralised purchases and other discounts, value added tax and foreign exchange differences on sales.
Revenue from the sales of goods is recognised when the significant risks, benefits and control related to the ownership of goods have been transferred to the buyer and it is probable that the Corporation will gain the economic benefit related to the sales. As a rule, income from the sales of goods is recognised at the moment the goods are relinquished. Income from services is recognised when the service has been rendered and gaining economic benefit from the rendered service is probable.
Government grants
Grants received from the government or another party are rec-ognised in the income statement when the costs relating to the object of the grant are recorded as an expense. Grants related to the acquisition of tangible and intangible assets are deducted from the carrying amounts of the said commodities. Such grants are recognised as income over the economic life of the asset.
18 SOK Corporation’s Financial Statements 2016
Other operating income
Items presented as other operating income are gains other than those related to the actual sales of goods and services, such as sales gains on fixed assets; capital gains on divestments; damages in-come and grants received as well as subsidies not granted for fund-ing a certain investment or for participating in a certain expense.
Employee benefit expenses
Pension plans are classified as defined-benefit and defined-con-tribution plans. Fixed premiums are paid to separate companies under defined-contribution plans without a legal or constructive obligation to make additional contributions, if the recipient can-not pay the pension benefits in question. All plans that do not fulfil these conditions are defined-benefit plans.
Payments made for defined-contribution plans are recognised as expenses in the income statement in the financial period in which they are incurred. Costs arising from defined benefit pen-sions plans are recorded as an expense for the persons’ time in employment, based on calculations made by qualified actuaries. Liabilities or receivables following from defined benefit plans are recognised in the balance sheet at the liability’s present value less the pension plan’s fair value on the closing date. Items related to re-determining the net liability of the benefit plan are recognised in other comprehensive income items for the financial period when they are generated.
Expenses based on past performance are recognised through profit and loss in the earlier of the following: when the arrange-ment is changed or reduced, or when the related reorganisation costs or expenses related to the termination of employment are recognised. Based on the duration of their employment relation-ships, personnel accumulate seniority and age benefits. A seniority and age provision is recognised in the seniority and age benefit.
Operating profit
Operating profit is generated when other operating income is added to revenue, and when purchases of materials, supplies and goods during the financial period; external services; expenses, de-preciation and amortization and possible impairments caused by employee benefits; and other operating expenses are deducted from revenue, and when the result of associated companies and joint ventures serving the Corporation's actual operations is add-ed to or deducted from it. All income statement items other than those mentioned above are presented below operating profit.
Foreign exchange differences and changes in the fair value of derivatives are included in operating profit if they arise from items connected to business operations; otherwise they are recognised in financial income and expenses.
Income taxes
Income taxes in the profit and loss statement include current taxes for the financial period, adjustments of prior year taxes, and changes in deferred taxes. The tax effect of items directly recog-nised in equity or items in the statement of comprehensive in-come is nevertheless recognised in the said items. Income tax for the period is calculated using the tax rate in effect in each country on the balance sheet date.
Deferred tax liabilities and assets are recognised on the tempo-rary differences between the carrying amount and tax base of as-sets and liabilities. No deferred tax liabilities have been calculated on goodwill to the extent that goodwill is not tax deductible. The main temporary differences arise from the differences between the carrying amounts and tax bases of property, plant and equipment, and investment properties (finance leases, depreciation difference, intra-group margins, and gains on the sale of assets), from meas-urement at fair value and from unutilised tax losses. No deferred tax liability is recognised for undistributed earnings of foreign subsidiaries if profit distribution is not probable in the foreseeable future. Deferred taxes are calculated with the tax rates in effect on the balance sheet date and, if the tax rates change, with the tax rates that have in practice been approved by the ending date of the reporting period.
The deferred tax liability is included in the consolidated balance sheet in its entirety, with the exception of the aforementioned undistributed earnings of subsidiaries, and any deferred tax as-set to the extent that it is probable that future taxable profits will be available against which the asset can be utilised, and the recognition prerequisites are assessed on each closing date of the reporting period.
Goodwill and other intangible assets
The goodwill arising from business combinations constitutes the difference between the consideration given measured at fair value and the identifiable net assets acquired, which are measured at fair value, at the time of acquisition. Goodwill is not amortised but is annually tested for impairment. Goodwill is allocated to the cash-generating units. The goodwill of associated companies and joint ventures is included in the acquisition cost of the investment.
Other intangible assets include, for example, software licences and copyrights. Other intangible assets are measured at cost and amortised over their estimated economic lives on a straight-line basis. SOK Corporation does not have such intangible assets, apart from goodwill, which have an indefinite economic life.
The depreciation periods of other intangible assets are: YearsSoftware licence fees 3–5Other intangible assets 3–10
SOK Corporation’s Financial Statements 2016 19
Property, plant and equipment
Property, plant and equipment are measured at acquisition cost less accumulated depreciation and any impairment losses.
Straight-line depreciation is recorded on property, plant, and equipment in accordance with each item’s economic life. Land areas are not depreciated.
The depreciation periods for property, plant, and equipment are: YearsBuildings 15–35Lightweight structures and equipment in buildings 5–15Office and warehouse equipment 5–10Warehouse, maintenance, and production machinery 5–10Restaurant and hotel equipment 3–10In-store equipment 3–7Motor vehicles and servers 3–5Renovations of premises 3–10
Depreciation on items of property, plant, and equipment is dis-continued when the item is classified as held for sale. Gains from the sale or decommissioning of property, plant, and equipment are recognised in other operating income or expenses.
Impairment losses
The carrying amounts of asset items belonging to property, plant, and equipment are assessed annually to determine whether there is any indication that an asset may be impaired. If any such in-dication exists, the recoverable monetary amount of the asset is determined. The recoverable amount is estimated annually on the following assets, regardless of whether there are indications of impairment or not: goodwill, intangible assets in progress, and intangible assets with an indefinite economic life. An impairment loss is recognised if the carrying amount of the asset or cash-gen-erating unit is greater than its recoverable amount. Impairment losses are recognised in the income statement.
An impairment loss on a cash-generating unit is first allocated as a reduction of the goodwill of the cash-generating unit and thereafter to reduce the carrying amounts of the unit’s other as-sets on a proportionate basis.
The recoverable amount is determined as the higher of either fair value, less costs to sell or value in use. In determining value in use, estimated future cash flows are discounted to their present value based on discount interest rates reflecting the average cost of capital before tax on the cash-generating unit.
A previously recognised impairment loss is reversed if the as-sumptions used in estimating the recoverable amount change. An impairment loss is reversed to an amount not greater than the carrying amount of the asset (less depreciation or amortisation) would have been if an impairment loss had not been recorded in previous years. An impairment loss recognised for goodwill is not reversed.
Leases
Leases that substantially transfer all the risks and rewards inciden-tal to ownership of an asset are classified within SOK Corporation as finance leases. Where assets are acquired under a finance lease, the lower of the asset’s fair value or the present value of future lease payments is recognised at the inception of the lease in property, plant, and equipment or in investment properties in the balance sheet (details of investment properties are given below) and the obligations under the lease are recognised in interest-bearing li-abilities. Lease payments are split between interest expenses and a reduction in lease liabilities. The interest expense is recognised in the income statement during the lease period so as to produce an equal rate of interest on the remaining balance of the liability. Depreciation is recognised and any impairment losses are rec-ognised on assets obtained by a finance lease. Items of property, plant, and equipment are depreciated according to the Corpora-tion’s depreciation periods, or if shorter, the lease term.
Leases where substantially all of the risks and rewards inciden-tal to ownership are borne by the lessor are classified as operating leases. Lease payments received or paid on the basis of other leases are recognised as income or expense in the income statement on a straight-line basis over the lease period.
If a finance lease arises as the result of a sale and leaseback agree-ment, any gain on the sale is recorded as a liability in the balance sheet and is recognised as income during the lease period. Any loss on the sale is immediately recorded in the income statement.
Investment property
Investment properties are properties that are in use in operations outside SOK Corporation’s mainline operations and which the Corporation primarily holds in order to obtain rental income and/or an appreciation in the asset value. Investment properties are measured at cost less accumulated depreciation and any im-pairment losses in accordance with the same principles that are applied to real estate belonging to property, plant, and equipment. Properties classified as investment properties include both owned properties and properties where the operations have been sold but the lease agreement remains with the Corporation.
The fail value of investment properties is determined through both a market-value based valuation carried out by an external property valuer and self-valuation of the yield value of the prop-erty. Rental income from investment properties is recognised in net sales. Investment properties include four spa hotels acquired through financial leasing arrangements, whose business opera-tions the Group has sold while keeping the lease agreement. The fair value of these items is not presented, as the Group does not hold the information of Holiday Club’s lease agreements and sales figures.
20 SOK Corporation’s Financial Statements 2016
Inventories
Inventories are measured at the lower of cost and net realisable value. Cost is determined using the FIFO method or the weighted average cost method, and includes all the direct expenses incurred in acquiring materials and goods. In ordinary operations, the net realisable value is the estimated selling price less the estimated cost to complete the product and the necessary selling expenses.
Cooperative interest and dividends payable
Cooperative capital interest and dividends paid by SOK Corpo-ration are recognised as a decrease in equity in the period during which the owners approved the cooperative capital interest or dividend for payment.
Cooperative capital and supplementary cooperative capital
Cooperative capital consists of the combined amount of the co-operative enterprises’ share payments to SOK Corporation. The number of each cooperative enterprise’s shares is determined based on the number of members and annual purchases in the said cooperative enterprise.
In June 2016, all supplementary shares were redeemed at their nominal value, which was EUR 12,750,000.00. The supplemen-tary shares have been voided. Interest was paid on the supple-mentary shares until the time of redemption in accordance with SOK’s by-laws.
Provisions
A provision is recognised when SOK Corporation has a legal or constructive obligation as the result of a past event, when it is probable that a payment obligation will be realised, and the amount of the obligation can be reliably estimated. Compensa-tion that can be obtained from a third party in connection with the obligation is recognised in the balance sheet as a receivable when it is certain in practice. The amounts of provisions are esti-mated on every balance sheet date and are adjusted to correspond to the best estimate on the reporting date.
Provisions can be set up for underutilised premises, warranty provisions, and restructuring of operations, for example.
Assets held for sale and discontinued operations
An asset that is part of a plan of sale or a disposal group is classified as an asset held for sale when the recoverable amount primarily comes from the sale of the asset and not from its continuous use. An asset or group of assets classified as held for sale is measured at the lower of its carrying amount or fair value less estimated selling costs. Assets held for sale and the associated liabilities are presented in the balance sheet separately from assets and liabilities connected with continuing operations from the date on which they have been classified as held for sale. Information for the year of comparison is not reclassified.
A discontinued operation is a separate, significant function that has been disposed of (or has been permanently removed from use) or is classified as held for sale. The profit or loss from discontinued operations is presented in the income statement on a separate line after the result from continuing operations. The income statement information for the year of comparison is adjusted accordingly.
Amendments to standards and interpretations published by IASB taking effect later
The Corporation will apply the standard IFRS 9 Financial In-struments as of its effective date (effective as 1 January 2018). The IFRS 9 standard will replace the current IAS 39 Financial Instruments: Recognition and Measurement. IFRS 9 comprises revised principles for the classification and valuation of financial assets and liabilities, and the rules concerning hedging have been revised. In the new standard, financial assets are valued either at amortised cost or at fair value after the initial recognition, de-pending on the business model of the company’s management of financial assets and the agreement-based cash flows of financial assets. Equity investments are recognised at fair value after the initial recognition. As for financial liabilities, the rules concerning classification and valuation remain primarily the same. The Cor-poration estimates that the implementation of the standard may have some impact on future consolidated financial statements.
The standard IRFS 15 Revenue from Contracts with Custom-ers (effective as of 1 January 2018) establishes a five-step model that will apply to recognising revenue earned from customer con-tracts; the new standard replaces the current IAS 18 and IAS 11 standards and their interpretations. Sales can be recorded over time or at a certain point in time, and the key criterion is trans-fer of control.
SOK Corporation’s Financial Statements 2016 2121
SOK Corporation engages in business where the performance obligation is usually met at the time when the customer gains control of the product; in this respect, there is no change from the earlier recognition practice, where the criteria for fulfilling the performance obligation was the transfer of risks and benefits, which remains a key indicator of the transfer of control to the customer. No significant effects have been identified with regard to the travel industry and hospitality business. In online sales, the new instructions for product returns may affect the treatment of product return liabilities. According to estimates, however, this will not have any effects.
In contracts with customers, the transaction price includes no significant variable considerations and the contracts do not con-tain significant financing components.
Due to the above, the implementation of IFRS 15 does not incur any significant euro-denominated effects on SOK Corpo-ration.
According to IFRS 15, additional costs of obtaining a cus-tomer contract and costs of fulfilling a customer contract must be recognised on the balance sheet. SOK Corporation does not have such external costs for obtaining customer contracts and its contracts with customers do not include capitalisable costs for fulfilling the contracts.
The mandatory notes, as defined in the IFRS 15, will result in an increase in the amount of information on revenues from contracts with customers presented in the notes to the financial statements. With regard to notes, not all requirements relating to the recognition of revenues and the treatment of costs of obtain-ing and fulfilling customer contracts are relevant for the Group.
IFRS 16 Leases (effective as of 1 January 2019; not EU en-dorsed) will replace the instructions currently included in IAS 17. This means significant changes, especially for lessees. IFRS 16 requires lessees to recognise a liability for the obligation to make lease payments and a right-of-use asset for most leases on their balance sheets. According to preliminary assessments, IFRS 16 will have an impact, especially on the balance sheets in con-solidated financial statements in the future. Moreover, the split of lease expenses in the consolidated financial statement into depre-ciation and interest will change the structure of the consolidated income statement.
Other standards and interpretations published and taking ef-fect later, as well as amendments to them, are not, according to a preliminary assessment, significant to the Corporation.
22 SOK Corporation’s Financial Statements 2016
1. Segment information
For reporting to top management, SOK Corporation's operations are divided into five business segments. The segments are based on business areas. In the 2015 and 2016 Financial Statements, automotive trade and accessories has been classified as discontinued operations and due to its low significance, it has been presented in the 'Internal items and other' category.
SOK Corporation's segments to be reported are
Supermarket tradeSOK Corporation carries on supermarket trade in the Baltic countries and Russia via its subsidiaries. AS Prisma Peremarket has five hypermarkets in Tallinn, one in Narva and two in Tartu. A/S Prisma Latvija has three hypermarkets in Riga. UAB Prisma LT has two hypermarket in Vilnius, the capital of Lithuania, and and two Prisma units in Kaunas. OOO Prisma has ten supermarkets and seven hypermarkets in St. Petersburg.
Tourism and hospitality businessSOK Corporation’s tourism and hospitality business is carried on by Sokotel Oy in Finland, AS Sokotel in Estonia and OOO Sokotel in Russia. SOK Corporation’s hotels operate under the brands Sokos Hotels and Radisson Blu Hotels. In Finland, Sokotel Oy operates 14 Sokos hotels and 7 Radisson Blu hotels. Visitors to Tallinn are warmly received at the Original Sokos Hotel Viru and Solo Sokos Hotel Estoria, with their wide choice of restaurants. OOO Sokotel has three Sokos Hotel chain hotels in St. Petersburg, one of which is a spa hotel.
Real estate businessThe revenue from the real estate business consists of rental and property service in-come from properties owned by SOK Corporation. SOK Property Functions sell property services to the entire S Group.
Procurement and Services BusinessInex Partners Oy offers logistics services for grocery, consumer goods and speciality goods supplied to the retail chains. Meira Nova Oy provides purchasing and logistics services for groceries supplied to locations in the HoReCa sector.
The aim of the service functions provided by SOK Corporation is to develop operational models and processes that generate the maximum added value for the S Group’s businesses. The service units develop and maintain business models that increase the competitiveness of the entire S Group, and produce cost-effective services for the S Group. The joint service functions cover all the S Group’s service functions that can be organised centrally to yield cost savings and/or a qualitative improvement in operations. BankingS-Bank’s mission is to provide competitive basic banking services for the S-Group’s customer-owners. The supermarket bank will strengthen customer loyalty whilst achieving savings in operating costs. S-Bank Group’s result SOK Corporation's share of the consolidated result of the S-Bank Group is reported as banking operations. is reported as banking operations.

23SOK Corporation’s Financial Statements 2016
Segment reporting principles within SOK Corporation and reconciliation with the IFRS financial statements
The items to be included in the reporting to SOK Corporation's top management are revenue, operating result, operational result, investments, divestments and working capital. Management reporting is based on Finnish accounting legislation and on the principles of management accounting. Each segment is reported with intra-segment items eliminated. For example, revenue from the Procurement and services business has been stated eliminating the revenue between the companies in the Procurement and services business segment. Revenue in management reporting is reconciled with the IFRS revenue for continuing operations in the accounts. Financial accounting revenue for both continuing and discontinued operations is external revenue from which all of SOK Corporation's internal items have been eliminated. The differences between management reporting and financial accounting revenue are not material.
In calculating the operating result, valuations in accordance with Finnish accounting legislation are used. The income and expenses according to the matching principle are allocated to the segment. Reconciliation of the operating result with the result before taxes from continuing operations in compliance with IFRS shows those items which fall outside the operational result. These are, among others, financial income and expenses, gains and losses on the sale of property, plant and equipment as well as non-recurring costs from discontinuing operations.
In SOK Corporation's management reporting, assets are not allocated or reported on, except for working capital.

24 SOK Corporation’s Financial Statements 2016
2016 EUR million
Revenue
Operating result
InvestmentsDivestmentsWorking capital
Reconciliation of the revenueManagement reporting revenue to be reportedEliminationsRevenue from continuing operations IFRS
Reconciliation of the resultOperating result of the segments to be reportedItems excluded from the operating result within SOK Corporation: Financial income and expenses (FAS)Operational result of the segments to be reported
Gains and losses on the sale of property, plant and equipment Other operating income and expenses Changes in provisions Valuation gains and losses on derivatives Impairment losses on tangible and intangible assets IFRS adjustmentsProfit before taxes from continuing operations IFRS
Additional data at SOK Corporation level, external income
FinlandForeignRevenue, total
Supermarket TradeTourism and Hospitality BusinessProcurement and services BusinessReal estate businessRevenue, total
Additional information at SOK Corporation level, fixed assets
FinlandForeignFixed assets, total
Supe
rmar
ket t
rade
Trav
el in
dustr
y an
d ho
spita
lity
busin
ess
Proc
urem
ent a
nd se
rvic
es b
usin
ess
Real
esta
te b
usin
ess
Bank
ing
Inte
rnal
elim
inat
ions
and
oth
er
Reta
il an
d M
anag
emen
t rep
ortin
g, to
tal
396.7 255.0 6 428.5 82.5 -92.6 7 070.2 -26.3 24.1 3.1 17.2 8.2 0.3 26.6 1.7 9.7 35.6 45.9 0.3 93.1 0.1 0.1 33.4 0.3 33.9 0.0 3.2 -22.8 -2.6 -22.2 7 070.2 3.8 7 074.0
26.6
2.2 28.8
-0.2 0.4 -8.3 0.8 -0.8 2.1 22.8
6 632.1 441.9 7 074.0
396.6 258.8 6 336.1 82.5 7 074.0
425.8 65.0 490.8
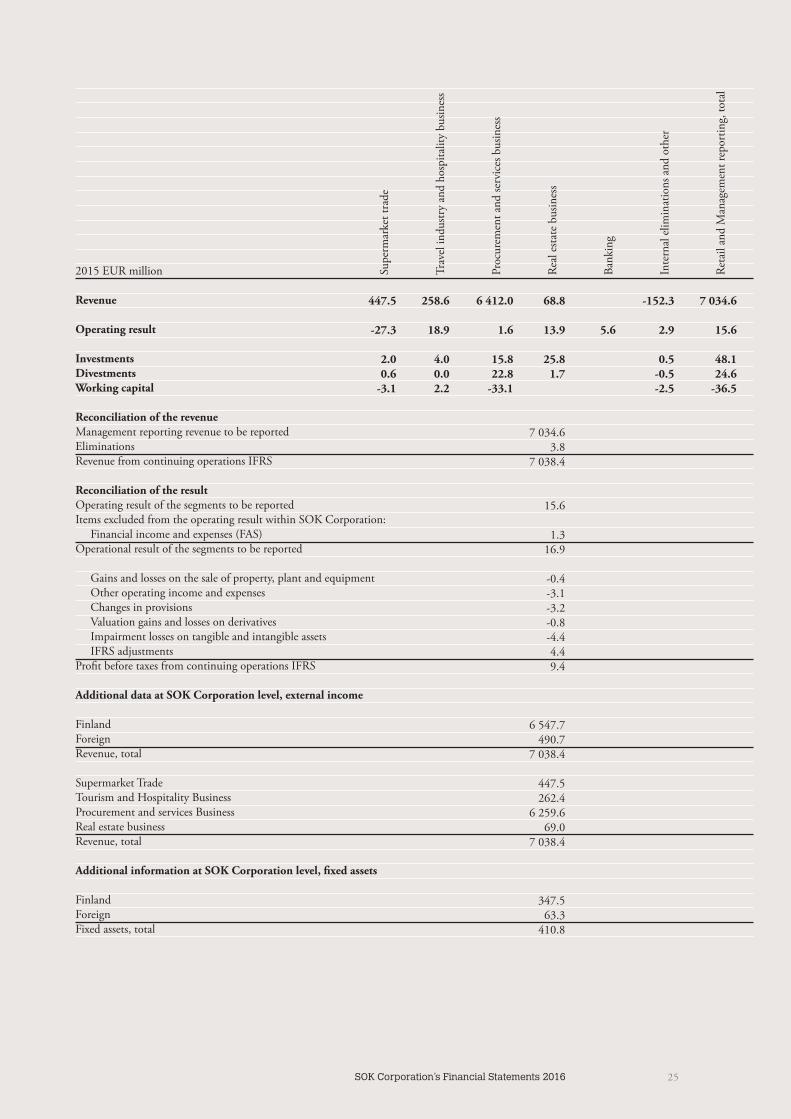
25SOK Corporation’s Financial Statements 2016
2015 EUR million
Revenue
Operating result
InvestmentsDivestmentsWorking capital
Reconciliation of the revenueManagement reporting revenue to be reportedEliminationsRevenue from continuing operations IFRS
Reconciliation of the resultOperating result of the segments to be reportedItems excluded from the operating result within SOK Corporation: Financial income and expenses (FAS)Operational result of the segments to be reported
Gains and losses on the sale of property, plant and equipment Other operating income and expenses Changes in provisions Valuation gains and losses on derivatives Impairment losses on tangible and intangible assets IFRS adjustmentsProfit before taxes from continuing operations IFRS
Additional data at SOK Corporation level, external income
FinlandForeignRevenue, total
Supermarket TradeTourism and Hospitality BusinessProcurement and services BusinessReal estate businessRevenue, total
Additional information at SOK Corporation level, fixed assets
FinlandForeignFixed assets, total
Supe
rmar
ket t
rade
Trav
el in
dustr
y an
d ho
spita
lity
busin
ess
Proc
urem
ent a
nd se
rvic
es b
usin
ess
Real
esta
te b
usin
ess
Bank
ing
Inte
rnal
elim
inat
ions
and
oth
er
Reta
il an
d M
anag
emen
t rep
ortin
g, to
tal
447.5 258.6 6 412.0 68.8 -152.3 7 034.6 -27.3 18.9 1.6 13.9 5.6 2.9 15.6 2.0 4.0 15.8 25.8 0.5 48.1 0.6 0.0 22.8 1.7 -0.5 24.6 -3.1 2.2 -33.1 -2.5 -36.5 7 034.6 3.8 7 038.4
15.6
1.3 16.9
-0.4 -3.1 -3.2 -0.8 -4.4 4.4 9.4
6 547.7 490.7 7 038.4
447.5 262.4 6 259.6 69.0 7 038.4
347.5 63.3 410.8
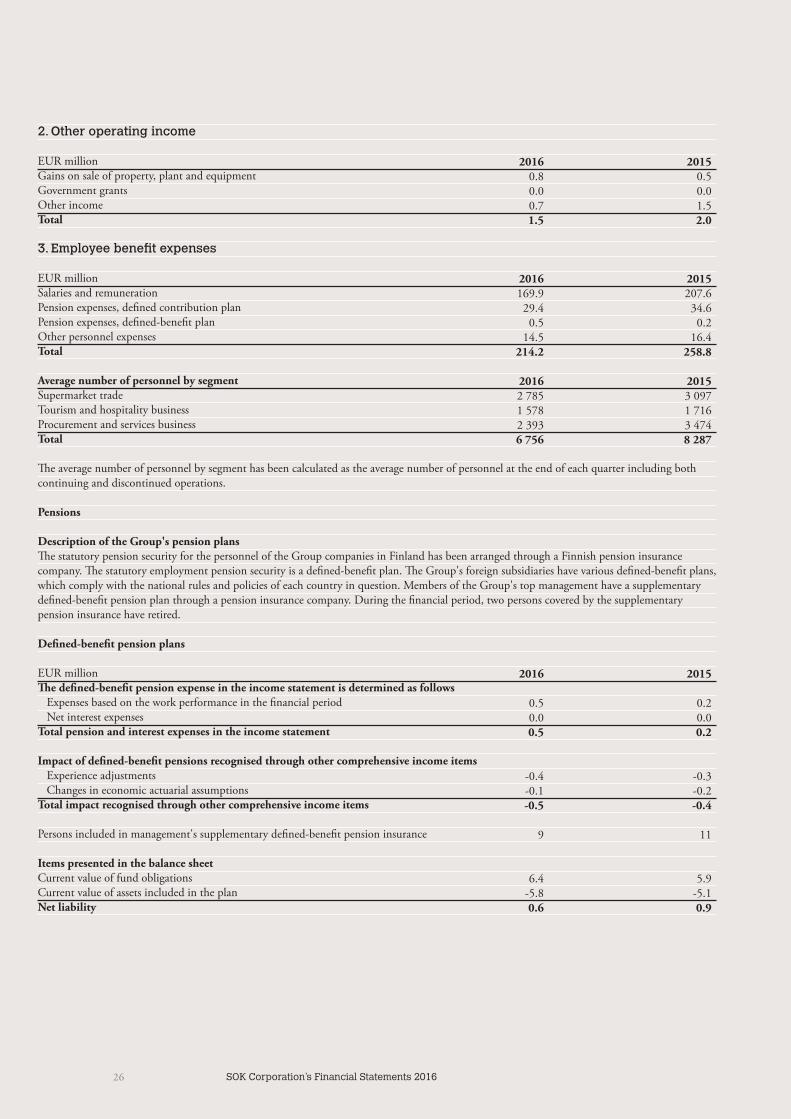
26 SOK Corporation’s Financial Statements 2016
2. Other operating income
EUR millionGains on sale of property, plant and equipmentGovernment grantsOther incomeTotal
3. Employee benefit expenses
EUR millionSalaries and remunerationPension expenses, defined contribution planPension expenses, defined-benefit planOther personnel expensesTotal
Average number of personnel by segmentSupermarket tradeTourism and hospitality businessProcurement and services businessTotal
The average number of personnel by segment has been calculated as the average number of personnel at the end of each quarter including both continuing and discontinued operations.
Pensions
Description of the Group's pension plansThe statutory pension security for the personnel of the Group companies in Finland has been arranged through a Finnish pension insurance company. The statutory employment pension security is a defined-benefit plan. The Group's foreign subsidiaries have various defined-benefit plans, which comply with the national rules and policies of each country in question. Members of the Group's top management have a supplementary defined-benefit pension plan through a pension insurance company. During the financial period, two persons covered by the supplementary pension insurance have retired.
Defined-benefit pension plans
EUR millionThe defined-benefit pension expense in the income statement is determined as follows Expenses based on the work performance in the financial period Net interest expenses Total pension and interest expenses in the income statement
Impact of defined-benefit pensions recognised through other comprehensive income items Experience adjustments Changes in economic actuarial assumptionsTotal impact recognised through other comprehensive income items
Persons included in management's supplementary defined-benefit pension insurance
Items presented in the balance sheetCurrent value of fund obligationsCurrent value of assets included in the planNet liability
2016 2015 0.8 0.5 0.0 0.0 0.7 1.5 1.5 2.0
2016 2015 169.9 207.6 29.4 34.6 0.5 0.2 14.5 16.4 214.2 258.8 2016 2015 2 785 3 097 1 578 1 716 2 393 3 474 6 756 8 287
2016 2015 0.5 0.2 0.0 0.0 0.5 0.2 -0.4 -0.3 -0.1 -0.2 -0.5 -0.4 9 11 6.4 5.9 -5.8 -5.1 0.6 0.9
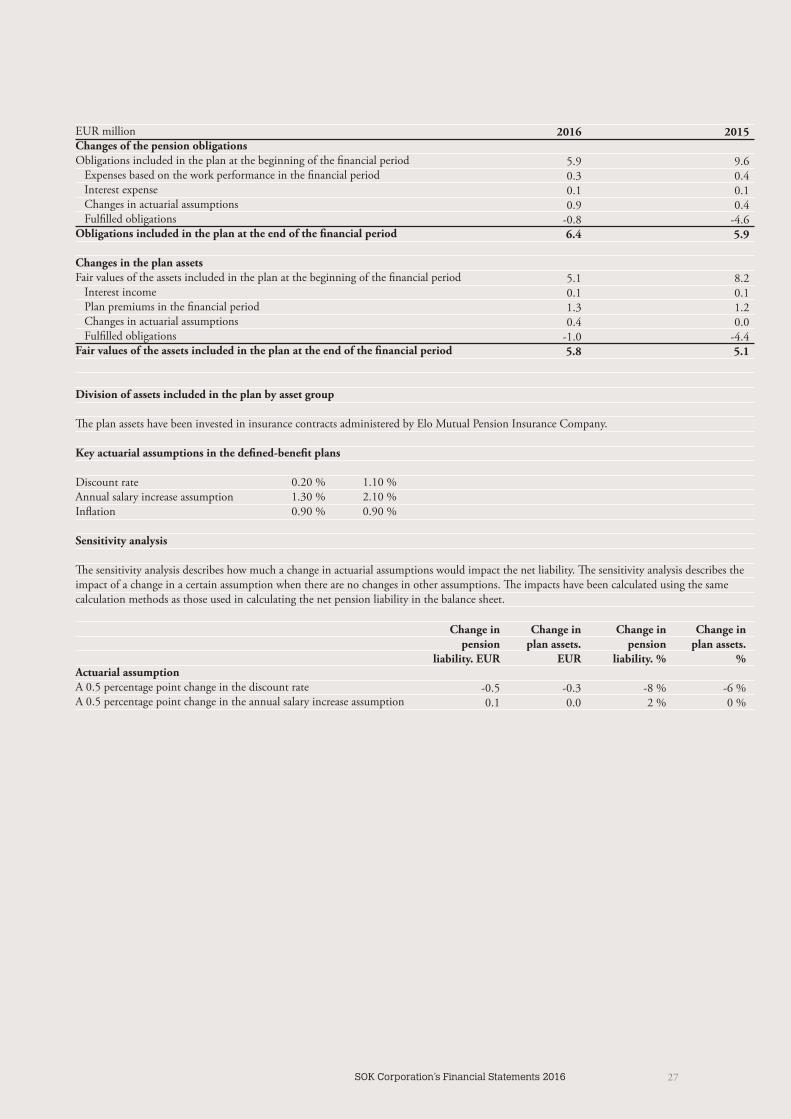
27SOK Corporation’s Financial Statements 2016
EUR millionChanges of the pension obligationsObligations included in the plan at the beginning of the financial period Expenses based on the work performance in the financial period Interest expense Changes in actuarial assumptions Fulfilled obligationsObligations included in the plan at the end of the financial period
Changes in the plan assetsFair values of the assets included in the plan at the beginning of the financial period Interest income Plan premiums in the financial period Changes in actuarial assumptions Fulfilled obligations Fair values of the assets included in the plan at the end of the financial period
Division of assets included in the plan by asset group
The plan assets have been invested in insurance contracts administered by Elo Mutual Pension Insurance Company.
Key actuarial assumptions in the defined-benefit plans
Discount rate 0.20 % 1.10 %Annual salary increase assumption 1.30 % 2.10 %Inflation 0.90 % 0.90 %
Sensitivity analysis
The sensitivity analysis describes how much a change in actuarial assumptions would impact the net liability. The sensitivity analysis describes the impact of a change in a certain assumption when there are no changes in other assumptions. The impacts have been calculated using the same calculation methods as those used in calculating the net pension liability in the balance sheet.
Actuarial assumption A 0.5 percentage point change in the discount rateA 0.5 percentage point change in the annual salary increase assumption
2016 2015 5.9 9.6 0.3 0.4 0.1 0.1 0.9 0.4 -0.8 -4.6 6.4 5.9
5.1 8.2 0.1 0.1 1.3 1.2 0.4 0.0 -1.0 -4.4 5.8 5.1
Change in Change in Change in Change in pension plan assets. pension plan assets. liability. EUR EUR liability. % % -0.5 -0.3 -8 % -6 % 0.1 0.0 2 % 0 %
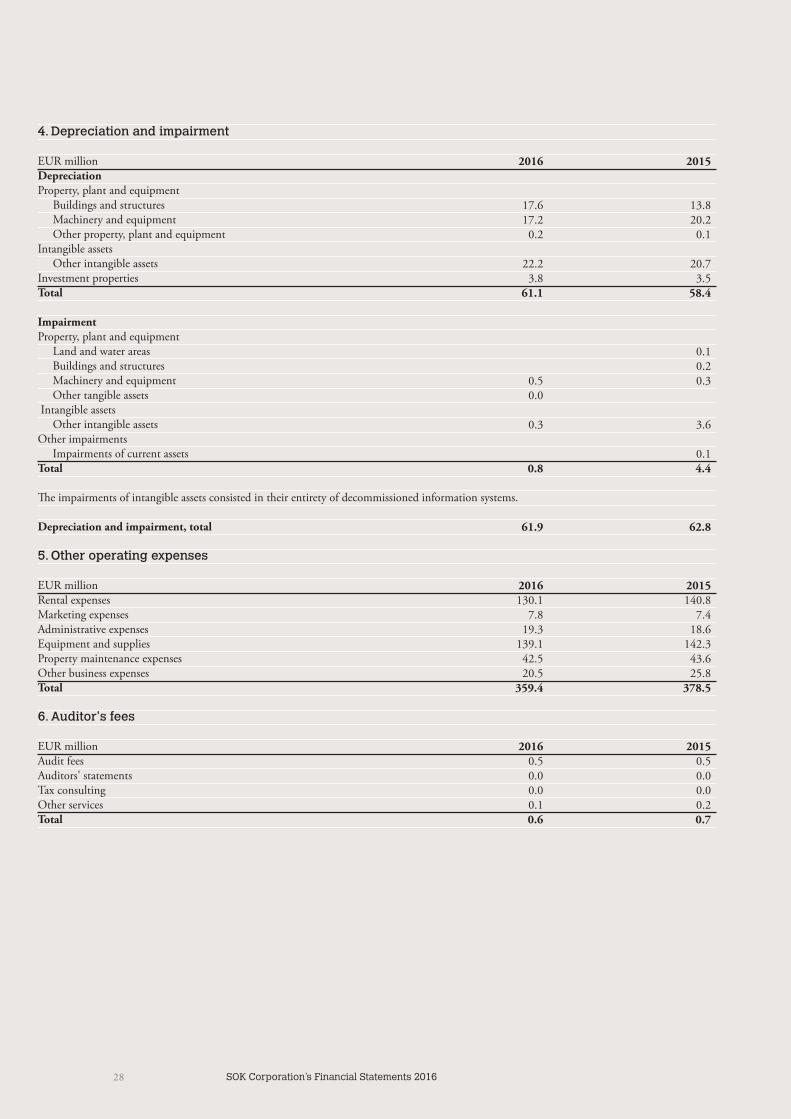
28 SOK Corporation’s Financial Statements 2016
4. Depreciation and impairment
EUR millionDepreciation Property, plant and equipment Buildings and structures Machinery and equipment Other property, plant and equipmentIntangible assets Other intangible assetsInvestment propertiesTotal
Impairment Property, plant and equipment Land and water areas Buildings and structures Machinery and equipment Other tangible assets Intangible assets Other intangible assetsOther impairments Impairments of current assetsTotal
The impairments of intangible assets consisted in their entirety of decommissioned information systems.
Depreciation and impairment, total
5. Other operating expenses
EUR millionRental expensesMarketing expensesAdministrative expensesEquipment and supplies Property maintenance expensesOther business expensesTotal
6. Auditor's fees
EUR millionAudit feesAuditors' statementsTax consultingOther servicesTotal
2016 2015 17.6 13.8 17.2 20.2 0.2 0.1 22.2 20.7 3.8 3.5 61.1 58.4 0.1 0.2 0.5 0.3 0.0 0.3 3.6 0.1 0.8 4.4 61.9 62.8 2016 2015 130.1 140.8 7.8 7.4 19.3 18.6 139.1 142.3 42.5 43.6 20.5 25.8 359.4 378.5 2016 2015 0.5 0.5 0.0 0.0 0.0 0.0 0.1 0.2 0.6 0.7
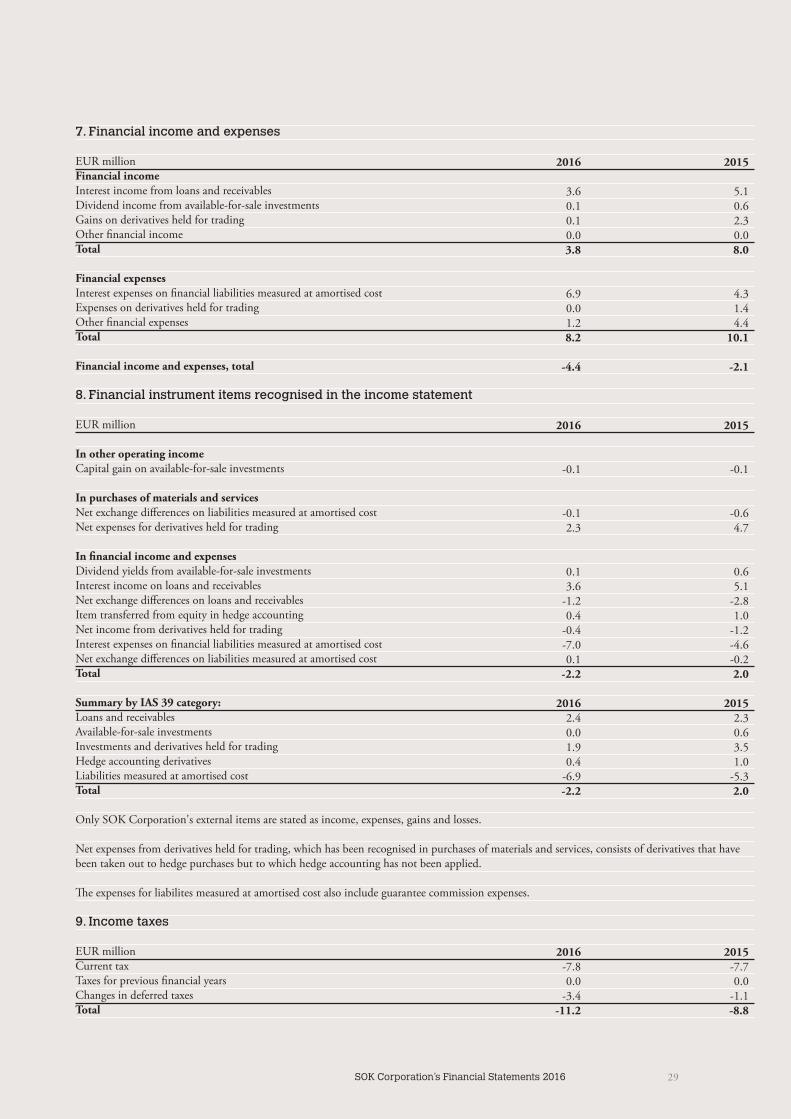
29SOK Corporation’s Financial Statements 2016
7. Financial income and expenses
EUR millionFinancial income Interest income from loans and receivablesDividend income from available-for-sale investmentsGains on derivatives held for trading Other financial incomeTotal
Financial expensesInterest expenses on financial liabilities measured at amortised cost Expenses on derivatives held for trading Other financial expensesTotal
Financial income and expenses, total
8. Financial instrument items recognised in the income statement
EUR million
In other operating incomeCapital gain on available-for-sale investments
In purchases of materials and servicesNet exchange differences on liabilities measured at amortised costNet expenses for derivatives held for trading
In financial income and expensesDividend yields from available-for-sale investmentsInterest income on loans and receivablesNet exchange differences on loans and receivablesItem transferred from equity in hedge accountingNet income from derivatives held for tradingInterest expenses on financial liabilities measured at amortised costNet exchange differences on liabilities measured at amortised costTotal
Summary by IAS 39 category:Loans and receivablesAvailable-for-sale investmentsInvestments and derivatives held for tradingHedge accounting derivativesLiabilities measured at amortised costTotal
Only SOK Corporation's external items are stated as income, expenses, gains and losses.
Net expenses from derivatives held for trading, which has been recognised in purchases of materials and services, consists of derivatives that have been taken out to hedge purchases but to which hedge accounting has not been applied.
The expenses for liabilites measured at amortised cost also include guarantee commission expenses.
9. Income taxes
EUR millionCurrent taxTaxes for previous financial yearsChanges in deferred taxesTotal
2016 2015 3.6 5.1 0.1 0.6 0.1 2.3 0.0 0.0 3.8 8.0 6.9 4.3 0.0 1.4 1.2 4.4 8.2 10.1 -4.4 -2.1
2016 2015 -0.1 -0.1 -0.1 -0.6 2.3 4.7 0.1 0.6 3.6 5.1 -1.2 -2.8 0.4 1.0 -0.4 -1.2 -7.0 -4.6 0.1 -0.2 -2.2 2.0 2016 2015 2.4 2.3 0.0 0.6 1.9 3.5 0.4 1.0 -6.9 -5.3 -2.2 2.0
2016 2015 -7.8 -7.7 0.0 0.0 -3.4 -1.1 -11.2 -8.8
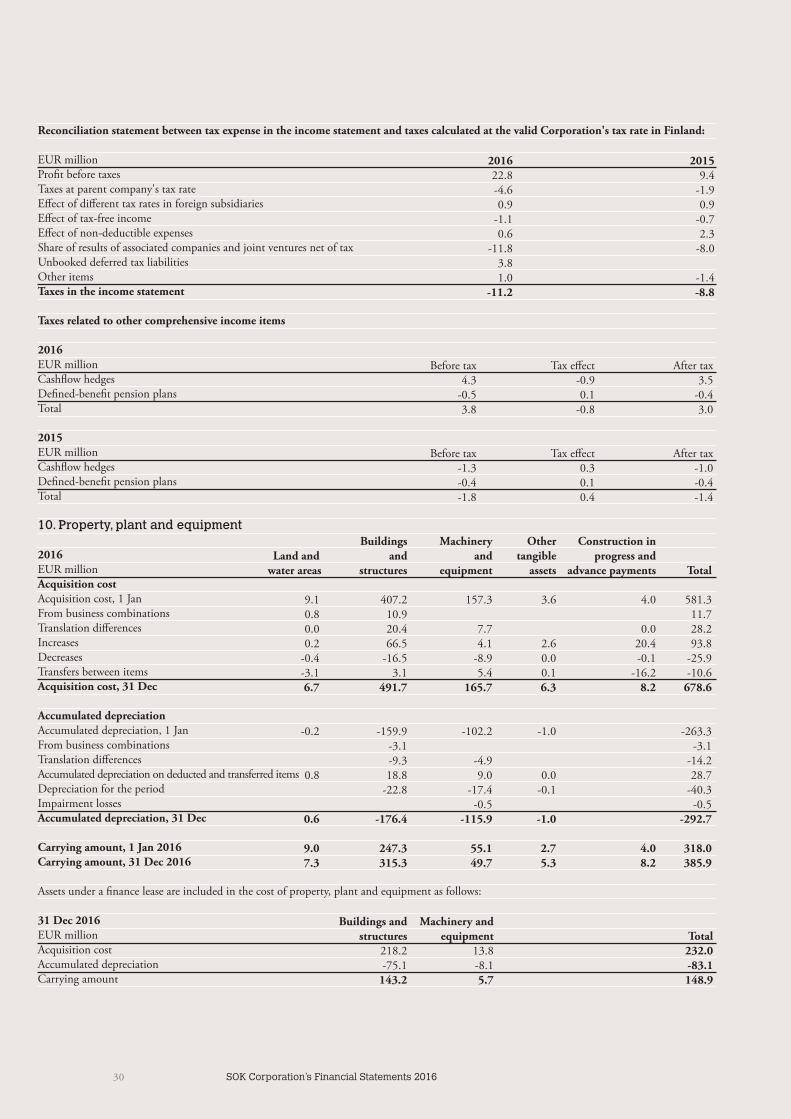
30 SOK Corporation’s Financial Statements 2016
Reconciliation statement between tax expense in the income statement and taxes calculated at the valid Corporation's tax rate in Finland:
EUR millionProfit before taxesTaxes at parent company's tax rateEffect of different tax rates in foreign subsidiariesEffect of tax-free incomeEffect of non-deductible expensesShare of results of associated companies and joint ventures net of taxUnbooked deferred tax liabilities Other itemsTaxes in the income statement
Taxes related to other comprehensive income items
2016EUR millionCashflow hedgesDefined-benefit pension plansTotal
2015EUR millionCashflow hedgesDefined-benefit pension plansTotal
10. Property, plant and equipment
2016EUR millionAcquisition costAcquisition cost, 1 Jan From business combinationsTranslation differencesIncreasesDecreases Transfers between items Acquisition cost, 31 Dec
Accumulated depreciationAccumulated depreciation, 1 JanFrom business combinationsTranslation differencesAccumulated depreciation on deducted and transferred itemsDepreciation for the periodImpairment lossesAccumulated depreciation, 31 Dec
Carrying amount, 1 Jan 2016Carrying amount, 31 Dec 2016
Assets under a finance lease are included in the cost of property, plant and equipment as follows:
31 Dec 2016EUR millionAcquisition costAccumulated depreciationCarrying amount
2016 2015 22.8 9.4 -4.6 -1.9 0.9 0.9 -1.1 -0.7 0.6 2.3 -11.8 -8.0 3.8 1.0 -1.4 -11.2 -8.8
Before tax Tax effect After tax 4.3 -0.9 3.5 -0.5 0.1 -0.4 3.8 -0.8 3.0 Before tax Tax effect After tax -1.3 0.3 -1.0 -0.4 0.1 -0.4 -1.8 0.4 -1.4
Buildings Machinery Other Construction in Land and and and tangible progress and water areas structures equipment assets advance payments Total
9.1 407.2 157.3 3.6 4.0 581.3 0.8 10.9 11.7 0.0 20.4 7.7 0.0 28.2 0.2 66.5 4.1 2.6 20.4 93.8 -0.4 -16.5 -8.9 0.0 -0.1 -25.9 -3.1 3.1 5.4 0.1 -16.2 -10.6 6.7 491.7 165.7 6.3 8.2 678.6 -0.2 -159.9 -102.2 -1.0 -263.3 -3.1 -3.1 -9.3 -4.9 -14.2 0.8 18.8 9.0 0.0 28.7 -22.8 -17.4 -0.1 -40.3 -0.5 -0.5 0.6 -176.4 -115.9 -1.0 -292.7 9.0 247.3 55.1 2.7 4.0 318.0 7.3 315.3 49.7 5.3 8.2 385.9
Buildings and Machinery and structures equipment Total 218.2 13.8 232.0 -75.1 -8.1 -83.1 143.2 5.7 148.9
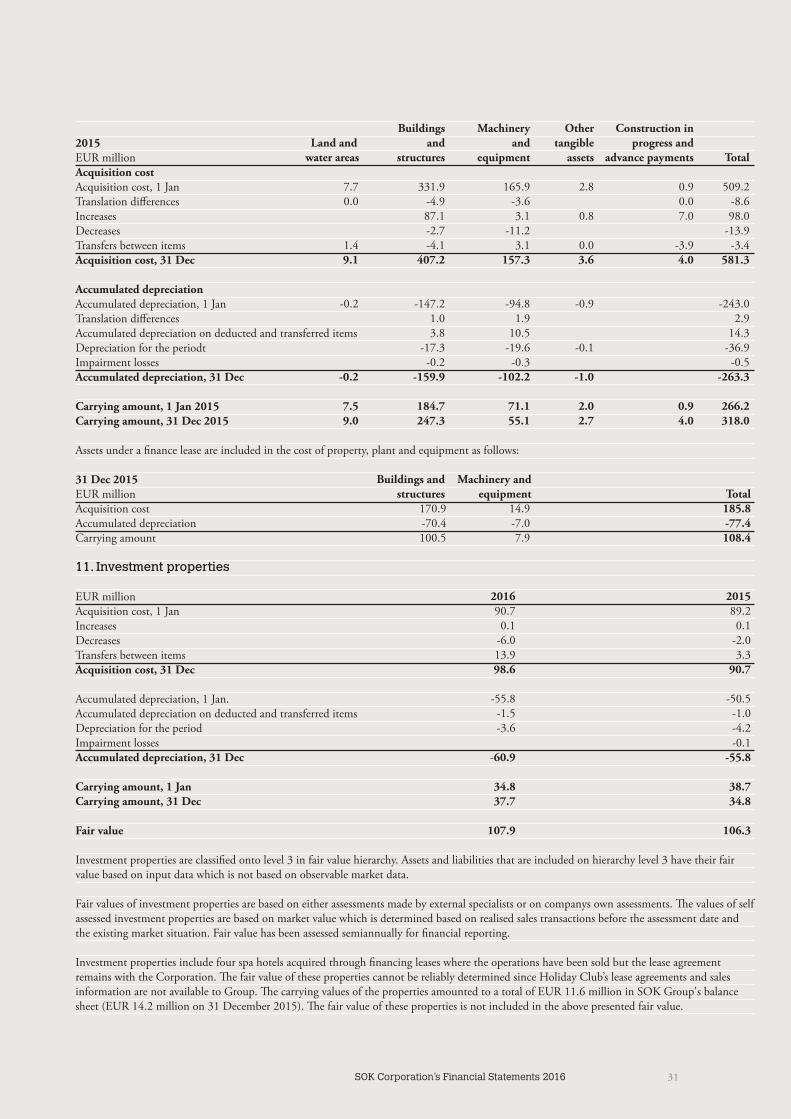
31SOK Corporation’s Financial Statements 2016
2015EUR millionAcquisition costAcquisition cost, 1 JanTranslation differencesIncreasesDecreasesTransfers between itemsAcquisition cost, 31 Dec
Accumulated depreciationAccumulated depreciation, 1 JanTranslation differencesAccumulated depreciation on deducted and transferred itemsDepreciation for the periodtImpairment lossesAccumulated depreciation, 31 Dec
Carrying amount, 1 Jan 2015Carrying amount, 31 Dec 2015
Assets under a finance lease are included in the cost of property, plant and equipment as follows:
31 Dec 2015EUR millionAcquisition costAccumulated depreciationCarrying amount
11. Investment properties
EUR millionAcquisition cost, 1 JanIncreasesDecreasesTransfers between items Acquisition cost, 31 Dec
Accumulated depreciation, 1 Jan.Accumulated depreciation on deducted and transferred itemsDepreciation for the periodImpairment lossesAccumulated depreciation, 31 Dec
Carrying amount, 1 JanCarrying amount, 31 Dec
Fair value
Investment properties are classified onto level 3 in fair value hierarchy. Assets and liabilities that are included on hierarchy level 3 have their fair value based on input data which is not based on observable market data.
Fair values of investment properties are based on either assessments made by external specialists or on companys own assessments. The values of self assessed investment properties are based on market value which is determined based on realised sales transactions before the assessment date and the existing market situation. Fair value has been assessed semiannually for financial reporting.
Investment properties include four spa hotels acquired through financing leases where the operations have been sold but the lease agreement remains with the Corporation. The fair value of these properties cannot be reliably determined since Holiday Club’s lease agreements and sales information are not available to Group. The carrying values of the properties amounted to a total of EUR 11.6 million in SOK Group's balance sheet (EUR 14.2 million on 31 December 2015). The fair value of these properties is not included in the above presented fair value.
Buildings Machinery Other Construction in Land and and and tangible progress and water areas structures equipment assets advance payments Total
7.7 331.9 165.9 2.8 0.9 509.2 0.0 -4.9 -3.6 0.0 -8.6 87.1 3.1 0.8 7.0 98.0 -2.7 -11.2 -13.9 1.4 -4.1 3.1 0.0 -3.9 -3.4 9.1 407.2 157.3 3.6 4.0 581.3 -0.2 -147.2 -94.8 -0.9 -243.0 1.0 1.9 2.9 3.8 10.5 14.3 -17.3 -19.6 -0.1 -36.9 -0.2 -0.3 -0.5 -0.2 -159.9 -102.2 -1.0 -263.3 7.5 184.7 71.1 2.0 0.9 266.2 9.0 247.3 55.1 2.7 4.0 318.0
Buildings and Machinery and structures equipment Total 170.9 14.9 185.8 -70.4 -7.0 -77.4 100.5 7.9 108.4
2016 2015 90.7 89.2 0.1 0.1 -6.0 -2.0 13.9 3.3 98.6 90.7 -55.8 -50.5 -1.5 -1.0 -3.6 -4.2 -0.1 -60.9 -55.8 34.8 38.7 37.7 34.8 107.9 106.3
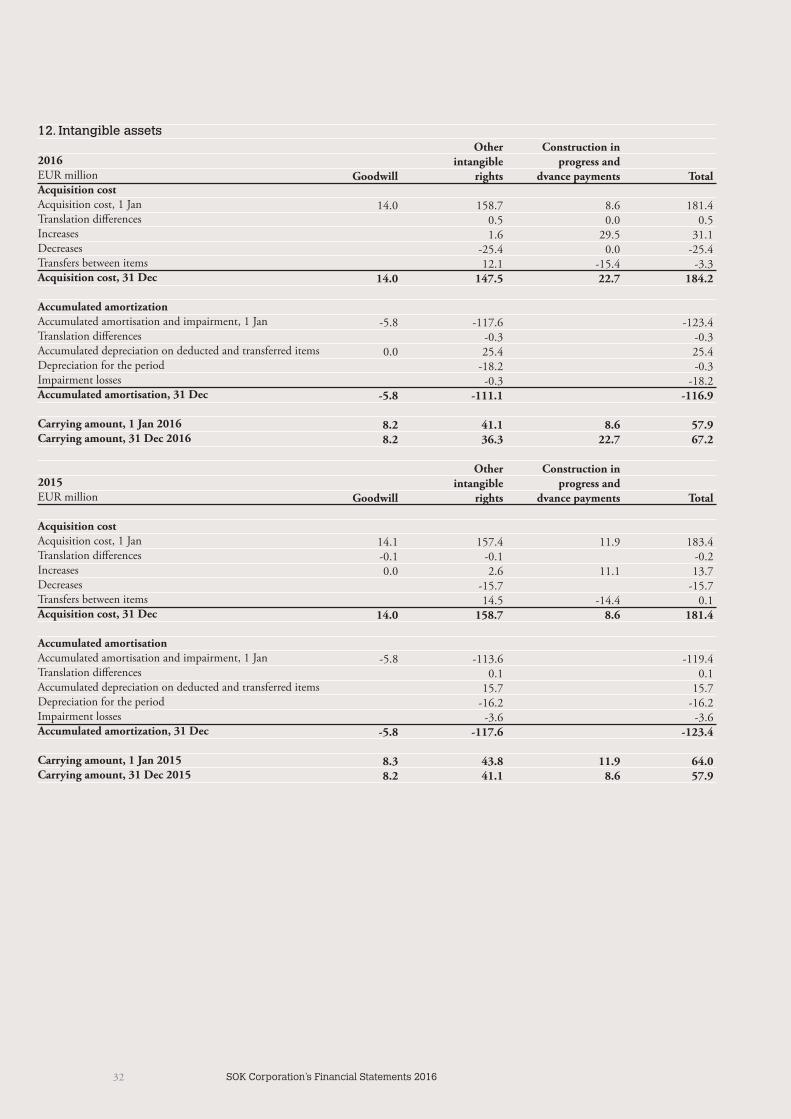
32 SOK Corporation’s Financial Statements 2016
12. Intangible assets
2016EUR millionAcquisition costAcquisition cost, 1 JanTranslation differencesIncreasesDecreasesTransfers between itemsAcquisition cost, 31 Dec
Accumulated amortizationAccumulated amortisation and impairment, 1 JanTranslation differencesAccumulated depreciation on deducted and transferred itemsDepreciation for the periodImpairment lossesAccumulated amortisation, 31 Dec
Carrying amount, 1 Jan 2016Carrying amount, 31 Dec 2016
2015EUR million
Acquisition costAcquisition cost, 1 JanTranslation differencesIncreasesDecreasesTransfers between itemsAcquisition cost, 31 Dec
Accumulated amortisationAccumulated amortisation and impairment, 1 JanTranslation differencesAccumulated depreciation on deducted and transferred itemsDepreciation for the periodImpairment lossesAccumulated amortization, 31 Dec
Carrying amount, 1 Jan 2015Carrying amount, 31 Dec 2015
Other Construction in intangible progress and Goodwill rights dvance payments Total
14.0 158.7 8.6 181.4 0.5 0.0 0.5 1.6 29.5 31.1 -25.4 0.0 -25.4 12.1 -15.4 -3.3 14.0 147.5 22.7 184.2 -5.8 -117.6 -123.4 -0.3 -0.3 0.0 25.4 25.4 -18.2 -0.3 -0.3 -18.2 -5.8 -111.1 -116.9 8.2 41.1 8.6 57.9 8.2 36.3 22.7 67.2 Other Construction in intangible progress and Goodwill rights dvance payments Total
14.1 157.4 11.9 183.4 -0.1 -0.1 -0.2 0.0 2.6 11.1 13.7 -15.7 -15.7 14.5 -14.4 0.1 14.0 158.7 8.6 181.4 -5.8 -113.6 -119.4 0.1 0.1 15.7 15.7 -16.2 -16.2 -3.6 -3.6 -5.8 -117.6 -123.4 8.3 43.8 11.9 64.0 8.2 41.1 8.6 57.9
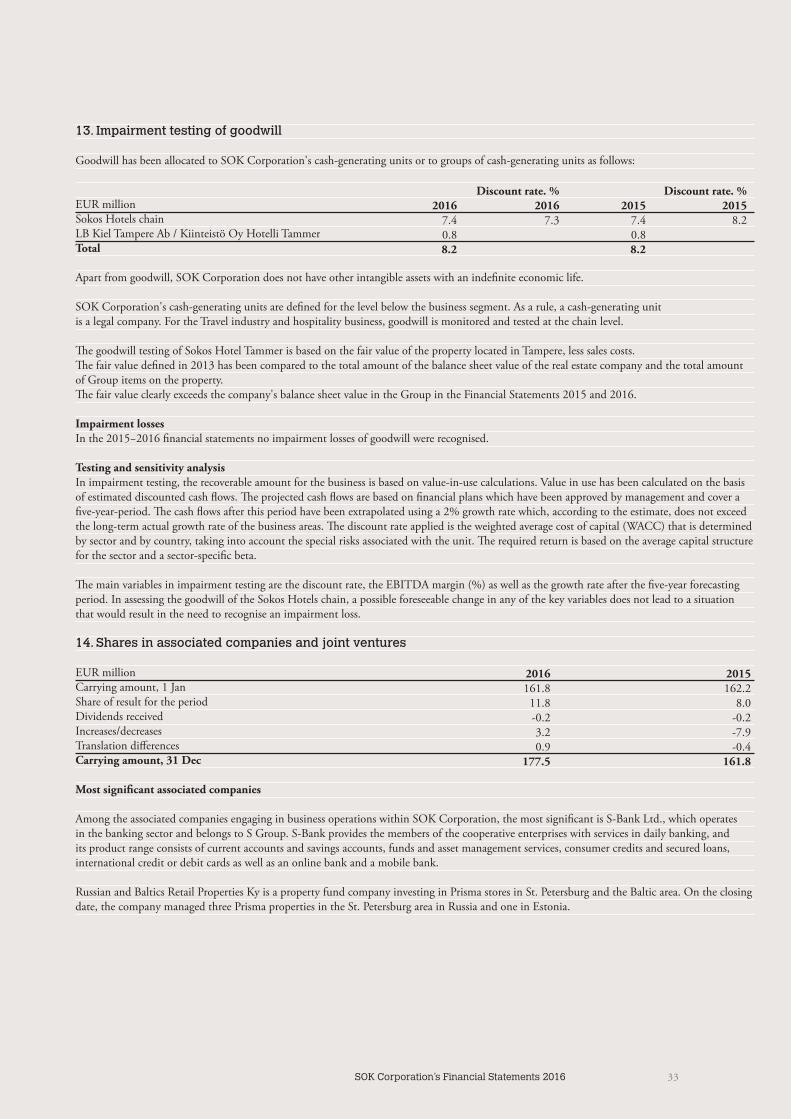
33SOK Corporation’s Financial Statements 2016
13. Impairment testing of goodwill
Goodwill has been allocated to SOK Corporation's cash-generating units or to groups of cash-generating units as follows:
EUR millionSokos Hotels chainLB Kiel Tampere Ab / Kiinteistö Oy Hotelli TammerTotal
Apart from goodwill, SOK Corporation does not have other intangible assets with an indefinite economic life.
SOK Corporation's cash-generating units are defined for the level below the business segment. As a rule, a cash-generating unitis a legal company. For the Travel industry and hospitality business, goodwill is monitored and tested at the chain level.
The goodwill testing of Sokos Hotel Tammer is based on the fair value of the property located in Tampere, less sales costs.The fair value defined in 2013 has been compared to the total amount of the balance sheet value of the real estate company and the total amount of Group items on the property.The fair value clearly exceeds the company's balance sheet value in the Group in the Financial Statements 2015 and 2016.
Impairment lossesIn the 2015−2016 financial statements no impairment losses of goodwill were recognised.
Testing and sensitivity analysisIn impairment testing, the recoverable amount for the business is based on value-in-use calculations. Value in use has been calculated on the basisof estimated discounted cash flows. The projected cash flows are based on financial plans which have been approved by management and cover afive-year-period. The cash flows after this period have been extrapolated using a 2% growth rate which, according to the estimate, does not exceedthe long-term actual growth rate of the business areas. The discount rate applied is the weighted average cost of capital (WACC) that is determinedby sector and by country, taking into account the special risks associated with the unit. The required return is based on the average capital structurefor the sector and a sector-specific beta.
The main variables in impairment testing are the discount rate, the EBITDA margin (%) as well as the growth rate after the five-year forecasting period. In assessing the goodwill of the Sokos Hotels chain, a possible foreseeable change in any of the key variables does not lead to a situation that would result in the need to recognise an impairment loss.
14. Shares in associated companies and joint ventures
EUR millionCarrying amount, 1 JanShare of result for the periodDividends receivedIncreases/decreasesTranslation differencesCarrying amount, 31 Dec
Most significant associated companies
Among the associated companies engaging in business operations within SOK Corporation, the most significant is S-Bank Ltd., which operates in the banking sector and belongs to S Group. S-Bank provides the members of the cooperative enterprises with services in daily banking, and its product range consists of current accounts and savings accounts, funds and asset management services, consumer credits and secured loans, international credit or debit cards as well as an online bank and a mobile bank.
Russian and Baltics Retail Properties Ky is a property fund company investing in Prisma stores in St. Petersburg and the Baltic area. On the closing date, the company managed three Prisma properties in the St. Petersburg area in Russia and one in Estonia.
Discount rate. % Discount rate. % 2016 2016 2015 2015 7.4 7.3 7.4 8.2 0.8 0.8 8.2 8.2
2016 2015 161.8 162.2 11.8 8.0 -0.2 -0.2 3.2 -7.9 0.9 -0.4 177.5 161.8
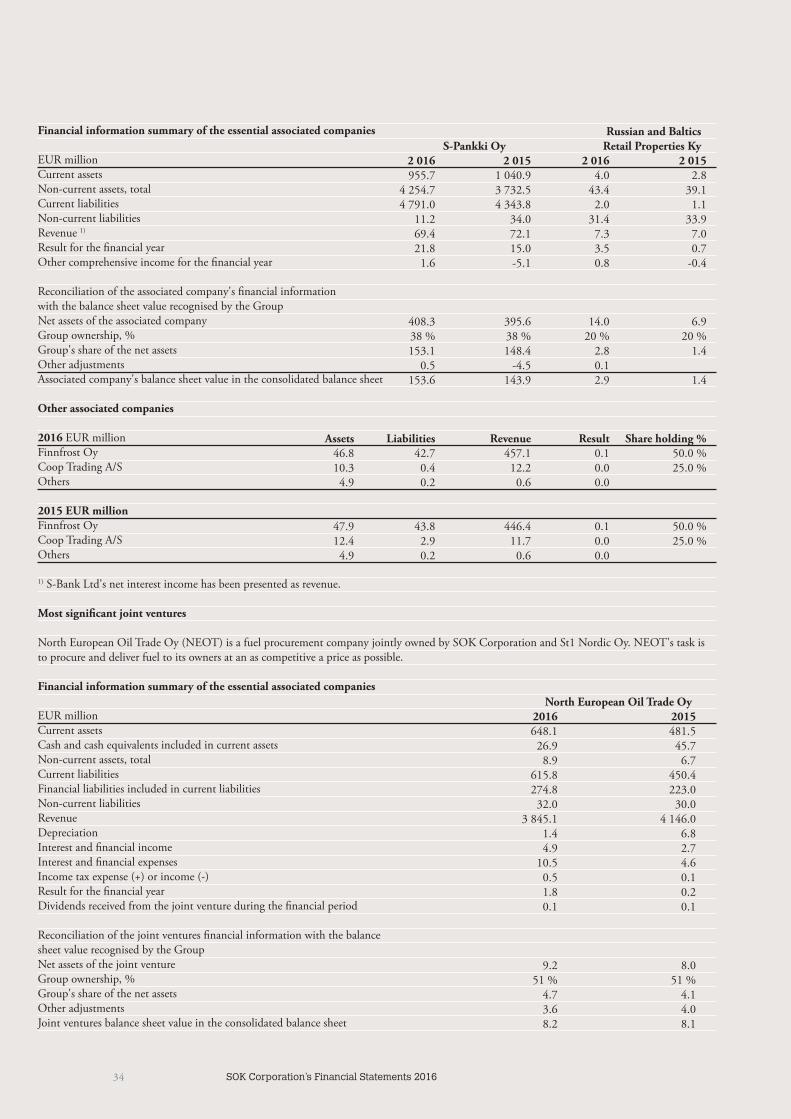
34 SOK Corporation’s Financial Statements 2016
Financial information summary of the essential associated companies
EUR millionCurrent assetsNon-current assets, totalCurrent liabilitiesNon-current liabilitiesRevenue 1)
Result for the financial yearOther comprehensive income for the financial year
Reconciliation of the associated company's financial information with the balance sheet value recognised by the GroupNet assets of the associated companyGroup ownership, %Group's share of the net assetsOther adjustmentsAssociated company's balance sheet value in the consolidated balance sheet
Other associated companies
2016 EUR millionFinnfrost OyCoop Trading A/SOthers
2015 EUR millionFinnfrost OyCoop Trading A/SOthers
1) S-Bank Ltd's net interest income has been presented as revenue.
Most significant joint ventures
North European Oil Trade Oy (NEOT) is a fuel procurement company jointly owned by SOK Corporation and St1 Nordic Oy. NEOT's task is to procure and deliver fuel to its owners at an as competitive a price as possible.
Financial information summary of the essential associated companies
EUR millionCurrent assetsCash and cash equivalents included in current assetsNon-current assets, totalCurrent liabilitiesFinancial liabilities included in current liabilitiesNon-current liabilitiesRevenueDepreciationInterest and financial incomeInterest and financial expensesIncome tax expense (+) or income (-)Result for the financial yearDividends received from the joint venture during the financial period
Reconciliation of the joint ventures financial information with the balance sheet value recognised by the GroupNet assets of the joint ventureGroup ownership, %Group's share of the net assetsOther adjustmentsJoint ventures balance sheet value in the consolidated balance sheet
Russian and Baltics S-Pankki Oy Retail Properties Ky 2 016 2 015 2 016 2 015 955.7 1 040.9 4.0 2.8 4 254.7 3 732.5 43.4 39.1 4 791.0 4 343.8 2.0 1.1 11.2 34.0 31.4 33.9 69.4 72.1 7.3 7.0 21.8 15.0 3.5 0.7 1.6 -5.1 0.8 -0.4
408.3 395.6 14.0 6.9 38 % 38 % 20 % 20 % 153.1 148.4 2.8 1.4 0.5 -4.5 0.1 153.6 143.9 2.9 1.4
Assets Liabilities Revenue Result Share holding % 46.8 42.7 457.1 0.1 50.0 % 10.3 0.4 12.2 0.0 25.0 % 4.9 0.2 0.6 0.0
47.9 43.8 446.4 0.1 50.0 % 12.4 2.9 11.7 0.0 25.0 % 4.9 0.2 0.6 0.0
North European Oil Trade Oy 2016 2015 648.1 481.5 26.9 45.7 8.9 6.7 615.8 450.4 274.8 223.0 32.0 30.0 3 845.1 4 146.0 1.4 6.8 4.9 2.7 10.5 4.6 0.5 0.1 1.8 0.2 0.1 0.1
9.2 8.0 51 % 51 % 4.7 4.1 3.6 4.0 8.2 8.1

35SOK Corporation’s Financial Statements 2016
Other joint ventures2016 EUR millionNorth European BioTech OyNorth European BioTech AbKauppakeskus Mylly Oy
Other joint ventures2015 EUR millionNorth European BioTech OyNorth European BioTech AbKauppakeskus Mylly Oy
SOK Corporation owns 50.8 per cent of North European Oil Trade Oy. SOK Corporation executes shared controlling interest in the company with ST1, based on the shareholder agreement, so the company is treated as a joint venture.
All associated companies and joint ventures of the SOK Corporation are unlisted.
S-Bank, Russian and Baltics Retail Properties and Kauppakeskus Mylly were consolidated as Groups.
15. S-Bank, Russian and Baltics Retail Properties and Kauppakeskus Mylly were consolidated as Groups.
Available-for-sale financial assets
EUR millionShares and participationsCarrying amount, 1 JanIncreasesDecreases Carrying amount, 31 Dec
Shares and participations include shares in unlisted companies. Unlisted shares are stated at cost if their fair values cannot be obtained reliably.
Loans and receivables
EUR millionReceivables from associated companiesCapital loan receivables from othersNon-current loan receivablesOther non-current receivablesLoans and other receivables total
Non-current financial assets, total
Assets Liabilities Revenue Result Share holding % 51.9 46.8 -0.4 50.0 % 12.5 11.2 1.5 0.1 50.0 % 141.5 115.7 19.1 5.4 50.0 %
31.0 28.6 -0.1 50.0 % 12.5 11.4 0.9 0.1 50.0 % 137.9 117.5 15.3 3.8 50.0 %
2016 2015 29.8 9.0 11.3 21.5 -0.1 -0.7 41.0 29.8 2016 2015 34.0 37.5 0.6 0.6 20.0 7.2 3.3 3.1 57.9 48.4 98.9 78.2
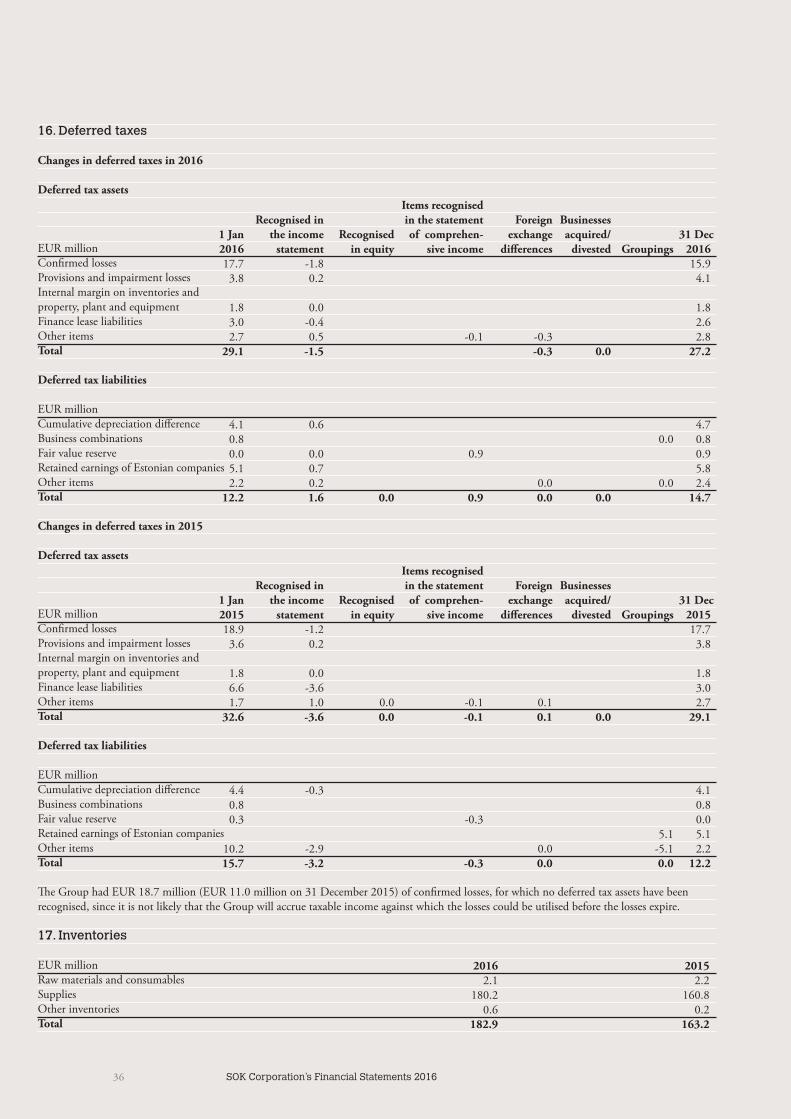
36 SOK Corporation’s Financial Statements 2016
16. Deferred taxes
Changes in deferred taxes in 2016
Deferred tax assets
EUR millionConfirmed lossesProvisions and impairment lossesInternal margin on inventories and property, plant and equipmentFinance lease liabilitiesOther itemsTotal
Deferred tax liabilities
EUR millionCumulative depreciation differenceBusiness combinationsFair value reserveRetained earnings of Estonian companiesOther itemsTotal
Changes in deferred taxes in 2015
Deferred tax assets
EUR millionConfirmed lossesProvisions and impairment lossesInternal margin on inventories and property, plant and equipmentFinance lease liabilities Other itemsTotal
Deferred tax liabilities
EUR millionCumulative depreciation differenceBusiness combinationsFair value reserveRetained earnings of Estonian companiesOther itemsTotal
The Group had EUR 18.7 million (EUR 11.0 million on 31 December 2015) of confirmed losses, for which no deferred tax assets have been recognised, since it is not likely that the Group will accrue taxable income against which the losses could be utilised before the losses expire.
17. Inventories
EUR millionRaw materials and consumablesSuppliesOther inventoriesTotal
Items recognised Recognised in in the statement Foreign Businesses 1 Jan the income Recognised of comprehen- exchange acquired/ 31 Dec 2016 statement in equity sive income differences divested Groupings 2016 17.7 -1.8 15.9 3.8 0.2 4.1
1.8 0.0 1.8 3.0 -0.4 2.6 2.7 0.5 -0.1 -0.3 2.8 29.1 -1.5 -0.3 0.0 27.2 4.1 0.6 4.7 0.8 0.0 0.8 0.0 0.0 0.9 0.9 5.1 0.7 5.8 2.2 0.2 0.0 0.0 2.4 12.2 1.6 0.0 0.9 0.0 0.0 14.7
Items recognised Recognised in in the statement Foreign Businesses 1 Jan the income Recognised of comprehen- exchange acquired/ 31 Dec 2015 statement in equity sive income differences divested Groupings 2015 18.9 -1.2 17.7 3.6 0.2 3.8
1.8 0.0 1.8 6.6 -3.6 3.0 1.7 1.0 0.0 -0.1 0.1 2.7 32.6 -3.6 0.0 -0.1 0.1 0.0 29.1 4.4 -0.3 4.1 0.8 0.8 0.3 -0.3 0.0 5.1 5.1 10.2 -2.9 0.0 -5.1 2.2 15.7 -3.2 -0.3 0.0 0.0 12.2
2016 2015 2.1 2.2 180.2 160.8 0.6 0.2 182.9 163.2
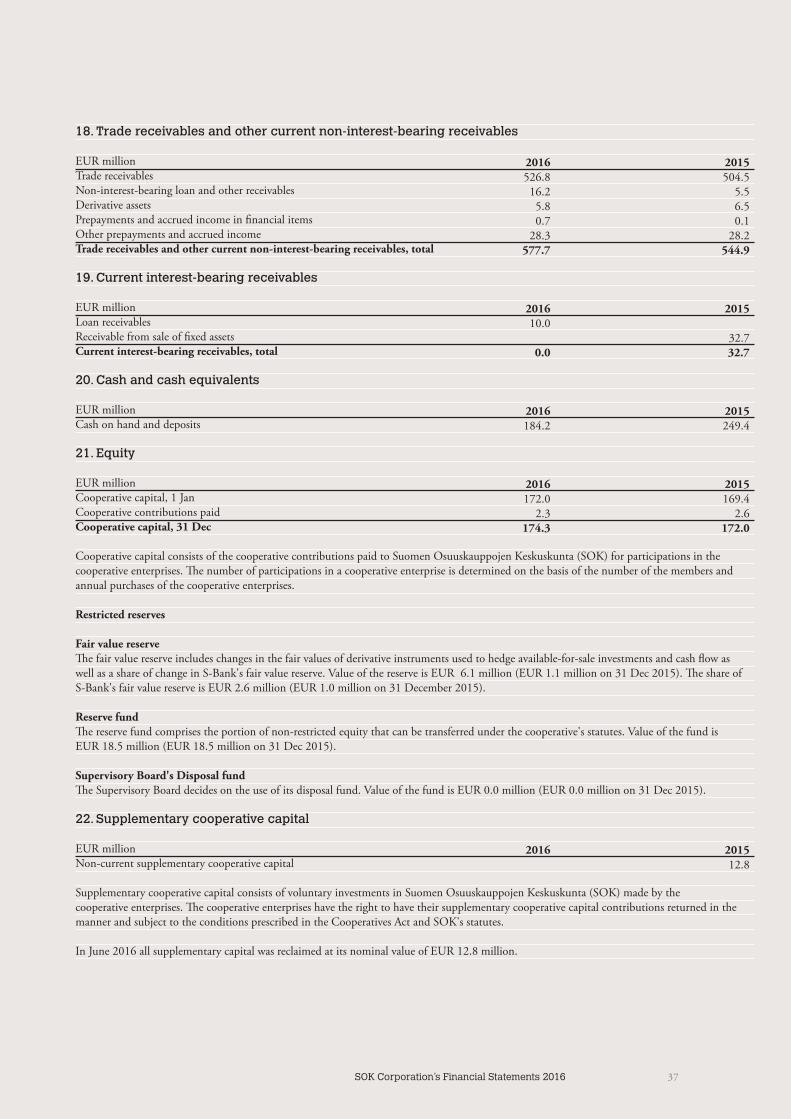
37SOK Corporation’s Financial Statements 2016
18. Trade receivables and other current non-interest-bearing receivables
EUR millionTrade receivablesNon-interest-bearing loan and other receivablesDerivative assetsPrepayments and accrued income in financial itemsOther prepayments and accrued incomeTrade receivables and other current non-interest-bearing receivables, total
19. Current interest-bearing receivables
EUR millionLoan receivablesReceivable from sale of fixed assetsCurrent interest-bearing receivables, total
20. Cash and cash equivalents
EUR millionCash on hand and deposits
21. Equity
EUR millionCooperative capital, 1 JanCooperative contributions paidCooperative capital, 31 Dec
Cooperative capital consists of the cooperative contributions paid to Suomen Osuuskauppojen Keskuskunta (SOK) for participations in the cooperative enterprises. The number of participations in a cooperative enterprise is determined on the basis of the number of the members and annual purchases of the cooperative enterprises.
Restricted reserves
Fair value reserveThe fair value reserve includes changes in the fair values of derivative instruments used to hedge available-for-sale investments and cash flow as well as a share of change in S-Bank's fair value reserve. Value of the reserve is EUR 6.1 million (EUR 1.1 million on 31 Dec 2015). The share of S-Bank's fair value reserve is EUR 2.6 million (EUR 1.0 million on 31 December 2015).
Reserve fundThe reserve fund comprises the portion of non-restricted equity that can be transferred under the cooperative's statutes. Value of the fund is EUR 18.5 million (EUR 18.5 million on 31 Dec 2015).
Supervisory Board's Disposal fundThe Supervisory Board decides on the use of its disposal fund. Value of the fund is EUR 0.0 million (EUR 0.0 million on 31 Dec 2015).
22. Supplementary cooperative capital
EUR millionNon-current supplementary cooperative capital
Supplementary cooperative capital consists of voluntary investments in Suomen Osuuskauppojen Keskuskunta (SOK) made by the cooperative enterprises. The cooperative enterprises have the right to have their supplementary cooperative capital contributions returned in the manner and subject to the conditions prescribed in the Cooperatives Act and SOK's statutes.
In June 2016 all supplementary capital was reclaimed at its nominal value of EUR 12.8 million.
2016 2015 526.8 504.5 16.2 5.5 5.8 6.5 0.7 0.1 28.3 28.2 577.7 544.9
2016 2015 10.0 32.7 0.0 32.7 2016 2015 184.2 249.4
2016 2015 172.0 169.4 2.3 2.6 174.3 172.0
2016 2015 12.8
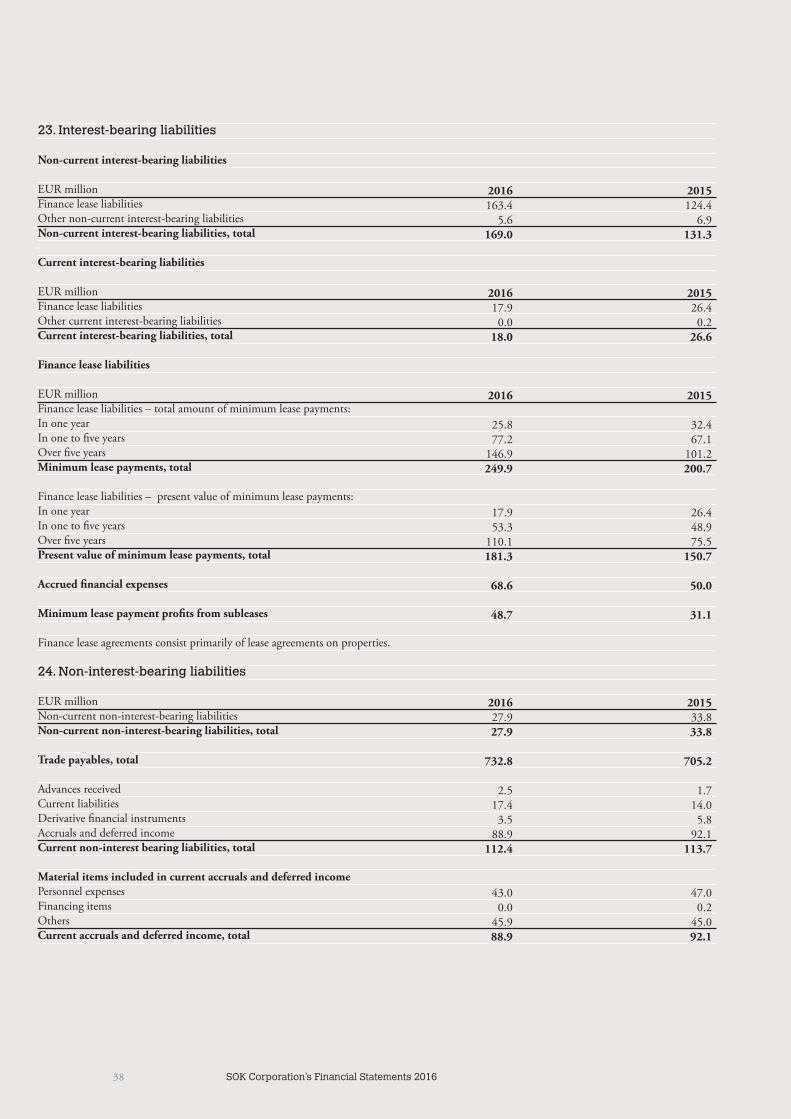
38 SOK Corporation’s Financial Statements 2016
23. Interest-bearing liabilities
Non-current interest-bearing liabilities
EUR millionFinance lease liabilitiesOther non-current interest-bearing liabilitiesNon-current interest-bearing liabilities, total
Current interest-bearing liabilities
EUR millionFinance lease liabilitiesOther current interest-bearing liabilitiesCurrent interest-bearing liabilities, total
Finance lease liabilities
EUR millionFinance lease liabilities – total amount of minimum lease payments:In one yearIn one to five yearsOver five yearsMinimum lease payments, total
Finance lease liabilities – present value of minimum lease payments:In one yearIn one to five yearsOver five yearsPresent value of minimum lease payments, total
Accrued financial expenses
Minimum lease payment profits from subleases
Finance lease agreements consist primarily of lease agreements on properties.
24. Non-interest-bearing liabilities
EUR millionNon-current non-interest-bearing liabilities Non-current non-interest-bearing liabilities, total
Trade payables, total
Advances receivedCurrent liabilitiesDerivative financial instrumentsAccruals and deferred incomeCurrent non-interest bearing liabilities, total
Material items included in current accruals and deferred incomePersonnel expensesFinancing itemsOthersCurrent accruals and deferred income, total
2016 2015 163.4 124.4 5.6 6.9 169.0 131.3
2016 2015 17.9 26.4 0.0 0.2 18.0 26.6
2016 2015 25.8 32.4 77.2 67.1 146.9 101.2 249.9 200.7 17.9 26.4 53.3 48.9 110.1 75.5 181.3 150.7 68.6 50.0 48.7 31.1
2016 2015 27.9 33.8 27.9 33.8 732.8 705.2 2.5 1.7 17.4 14.0 3.5 5.8 88.9 92.1 112.4 113.7 43.0 47.0 0.0 0.2 45.9 45.0 88.9 92.1
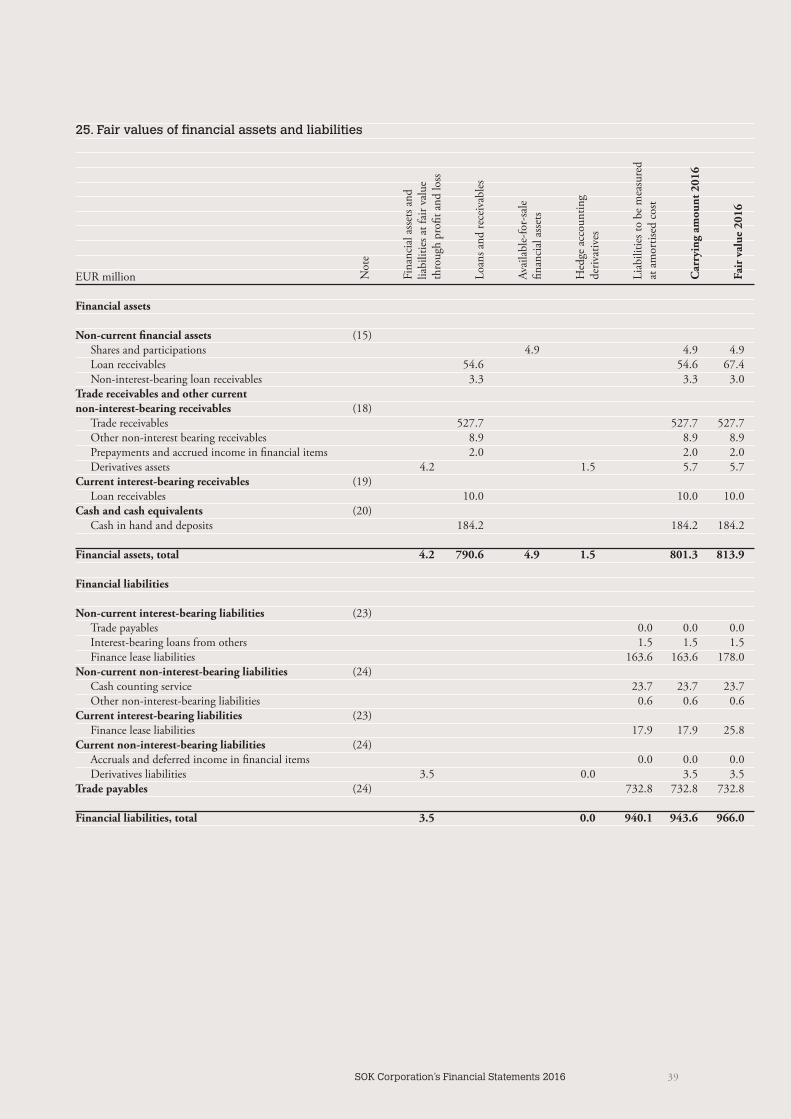
39SOK Corporation’s Financial Statements 2016
25. Fair values of financial assets and liabilities
EUR million
Financial assets
Non-current financial assets Shares and participations Loan receivables Non-interest-bearing loan receivablesTrade receivables and other current non-interest-bearing receivables Trade receivables Other non-interest bearing receivables Prepayments and accrued income in financial items Derivatives assetsCurrent interest-bearing receivables Loan receivablesCash and cash equivalents Cash in hand and deposits
Financial assets, total
Financial liabilities
Non-current interest-bearing liabilities Trade payables Interest-bearing loans from others Finance lease liabilitiesNon-current non-interest-bearing liabilities Cash counting service Other non-interest-bearing liabilitiesCurrent interest-bearing liabilities Finance lease liabilitiesCurrent non-interest-bearing liabilities Accruals and deferred income in financial items Derivatives liabilitiesTrade payables
Financial liabilities, total
Not
e
Fina
ncia
l ass
ets a
nd
liabi
litie
s at f
air v
alue
th
roug
h pr
ofit a
nd lo
ss
Loan
s and
rece
ivab
les
Avai
labl
e-fo
r-sa
le
finan
cial
ass
ets
Hed
ge a
ccou
ntin
g de
rivat
ives
Liab
ilitie
s to
be m
easu
red
at a
mor
tised
cos
t
Car
ryin
g am
ount
201
6
Fair
val
ue 2
016
(15) 4.9 4.9 4.9 54.6 54.6 67.4 3.3 3.3 3.0
(18) 527.7 527.7 527.7 8.9 8.9 8.9 2.0 2.0 2.0 4.2 1.5 5.7 5.7 (19) 10.0 10.0 10.0 (20) 184.2 184.2 184.2 4.2 790.6 4.9 1.5 801.3 813.9 (23) 0.0 0.0 0.0 1.5 1.5 1.5 163.6 163.6 178.0 (24) 23.7 23.7 23.7 0.6 0.6 0.6 (23) 17.9 17.9 25.8 (24) 0.0 0.0 0.0 3.5 0.0 3.5 3.5 (24) 732.8 732.8 732.8 3.5 0.0 940.1 943.6 966.0
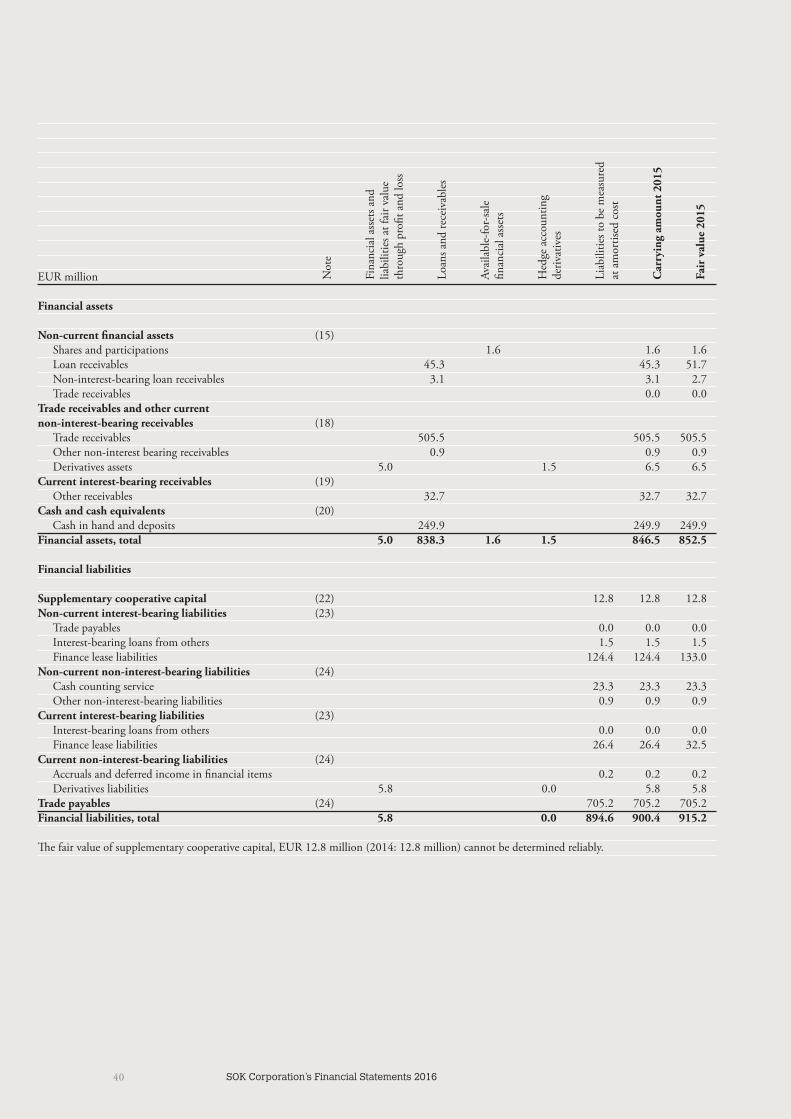
40 SOK Corporation’s Financial Statements 2016
EUR million
Financial assets
Non-current financial assets Shares and participations Loan receivables Non-interest-bearing loan receivables Trade receivablesTrade receivables and other current non-interest-bearing receivables Trade receivables Other non-interest bearing receivables Derivatives assetsCurrent interest-bearing receivables Other receivablesCash and cash equivalents Cash in hand and depositsFinancial assets, total
Financial liabilities
Supplementary cooperative capitalNon-current interest-bearing liabilities Trade payables Interest-bearing loans from others Finance lease liabilitiesNon-current non-interest-bearing liabilities Cash counting service Other non-interest-bearing liabilitiesCurrent interest-bearing liabilities Interest-bearing loans from others Finance lease liabilitiesCurrent non-interest-bearing liabilities Accruals and deferred income in financial items Derivatives liabilitiesTrade payablesFinancial liabilities, total
The fair value of supplementary cooperative capital, EUR 12.8 million (2014: 12.8 million) cannot be determined reliably.
Not
e
Fina
ncia
l ass
ets a
nd
liabi
litie
s at f
air v
alue
th
roug
h pr
ofit a
nd lo
ss
Loan
s and
rece
ivab
les
Avai
labl
e-fo
r-sa
le
finan
cial
ass
ets
Hed
ge a
ccou
ntin
g de
rivat
ives
Liab
ilitie
s to
be m
easu
red
at a
mor
tised
cos
t
Car
ryin
g am
ount
201
5
Fair
val
ue 2
015
(15) 1.6 1.6 1.6 45.3 45.3 51.7 3.1 3.1 2.7 0.0 0.0
(18) 505.5 505.5 505.5 0.9 0.9 0.9 5.0 1.5 6.5 6.5 (19) 32.7 32.7 32.7 (20) 249.9 249.9 249.9 5.0 838.3 1.6 1.5 846.5 852.5 (22) 12.8 12.8 12.8 (23) 0.0 0.0 0.0 1.5 1.5 1.5 124.4 124.4 133.0 (24) 23.3 23.3 23.3 0.9 0.9 0.9 (23) 0.0 0.0 0.0 26.4 26.4 32.5 (24) 0.2 0.2 0.2 5.8 0.0 5.8 5.8 (24) 705.2 705.2 705.2 5.8 0.0 894.6 900.4 915.2

41SOK Corporation’s Financial Statements 2016
The fair value hierarchy
EUR million
Assets measured at fair value
Non-current financial assets Shares and participations Loan receivables Non-interest-bearing loan receivablesOther current non-interest-bearing receivables Loan receivables Derivatives assetsCurrent interest-bearing receivables Loan receivablesTotal
Liabilities measured at fair value
Non-current interest-bearing liabilities Interest-bearing loans from others Finance lease liabilitiesNon-current non-interest-bearing liabilities Cash counting service Other non-interest-bearing liabilitiesCurrent interest-bearing liabilities Finance lease liabilitiesCurrent non-interest-bearing liabilities Derivatives liabilitiesTotal
The fair value hierarchy level to which an item measured at fair value has been classified in its entirety is determined based on the lowest level inputs that are significant for the entire item in question, measured at fair value. The significance of the input has been estimated in its entirety in relation to the item in question measured at fair value. The moment of transfers between different levels of the fair value hierarchy is determined by the end of the review period.
Fair values on hierarchy level 1 are based on the quoted prices of completely identical asset items or liabilities in an active market. The Group has used valuations by Nasdaq OMX Stockholm as pricing sources in determining the fair value of these instruments.
The fair values of level 2 instruments are to a significant extent based on inputs other than quoted prices included in level 1. However they are based on information that is observable for the said asset item either directly or indirectly. In determining the fair value of these instruments, the Group uses generally accepted valuation models in which the input is to a significant extent based on verifiable market information.
The fair values of level 3 instruments are based on inputs concerning the asset item or liability which is not based on verifiable market information.
The holdings in Suomen Luotto-osuuskunta cooperative are presented in level 3 due to inaccuracies in the measurement of the fair value. The fair value of the holdings, EUR 3.4 million (2015: EUR 0.1 million) is based on Suomen Luotto-osuuskunta cooperative’s preliminary plan regarding the distribution of funds in 2016. In addition to the aforementioned, level 3 also includes EUR 4.9 million of unquoted shares (2015: 1.6 million), for which the fair value cannot be determined and investment properties EUR 189.3 million (2015: 174.7 million), their fair value determined primarily by means of appraisal approach. Unquoted shares and holdings presented on level 3 were realised in 2015 at the acquisition cost of EUR 0.0 million.
Movements of items in Level 3 measured at fair value on recurring basis in the balance sheet
EUR millionOpening balance, 1 JanSales Reduction of fair value of holdings in Suomen-OsuuskuntaChanges in the fair value of assets and liabilities held for saleClosing balance, 31 Dec
Fair Value Note 2016 Level 1 Level 2 Level 3
(15) 4.9 4.9 67.4 67.4 3.0 3.0 (18) 8.9 8.9 5.7 3.4 2.3 (19) 10.0 10.0 100.0 3.4 91.7 4.9 (23) 1.5 1.5 178.0 178.0 (24) 23.7 23.7 0.6 0.6 (23) 25.8 25.8 (24) 3.5 3.4 0.1 233.1 3.4 229.7
2016 5.1 0.0 -0.7 -2.8 1.6
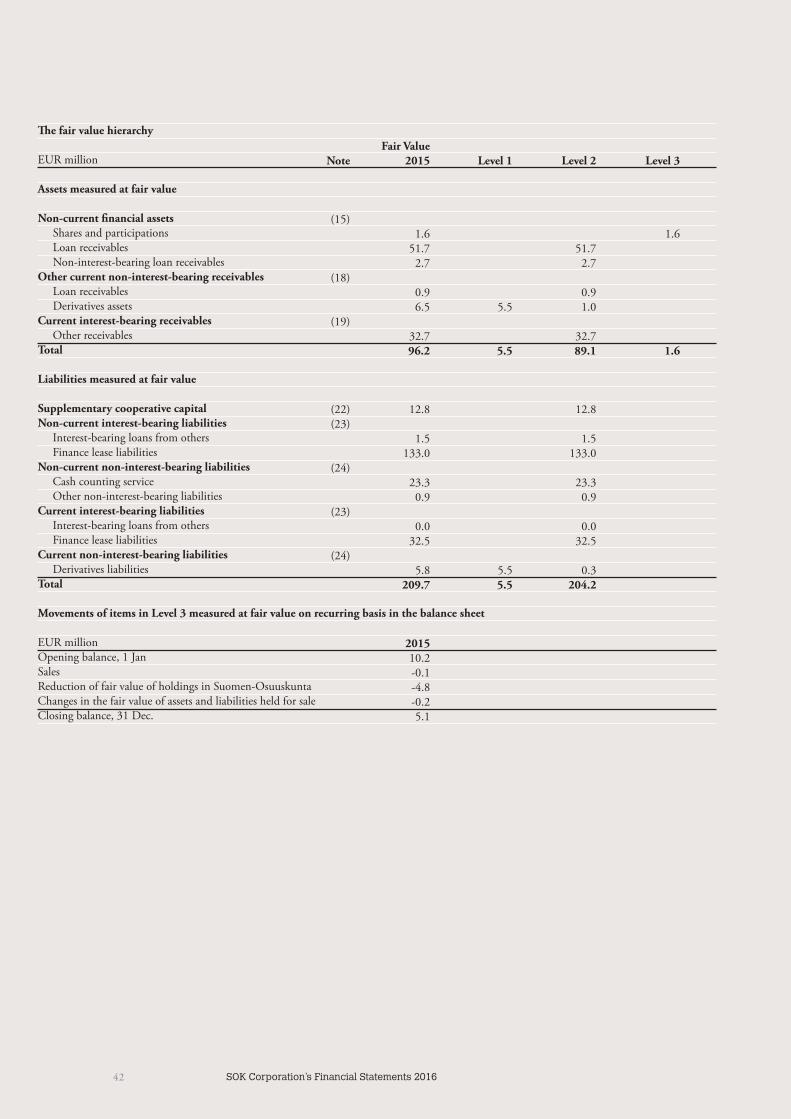
42 SOK Corporation’s Financial Statements 2016
The fair value hierarchy
EUR million
Assets measured at fair value
Non-current financial assets Shares and participations Loan receivables Non-interest-bearing loan receivablesOther current non-interest-bearing receivables Loan receivables Derivatives assetsCurrent interest-bearing receivables Other receivablesTotal
Liabilities measured at fair value
Supplementary cooperative capitalNon-current interest-bearing liabilities Interest-bearing loans from others Finance lease liabilitiesNon-current non-interest-bearing liabilities Cash counting service Other non-interest-bearing liabilitiesCurrent interest-bearing liabilities Interest-bearing loans from others Finance lease liabilitiesCurrent non-interest-bearing liabilities Derivatives liabilitiesTotal
Movements of items in Level 3 measured at fair value on recurring basis in the balance sheet
EUR millionOpening balance, 1 JanSalesReduction of fair value of holdings in Suomen-OsuuskuntaChanges in the fair value of assets and liabilities held for saleClosing balance, 31 Dec.
Fair Value Note 2015 Level 1 Level 2 Level 3
(15) 1.6 1.6 51.7 51.7 2.7 2.7 (18) 0.9 0.9 6.5 5.5 1.0 (19) 32.7 32.7 96.2 5.5 89.1 1.6 (22) 12.8 12.8 (23) 1.5 1.5 133.0 133.0 (24) 23.3 23.3 0.9 0.9 (23) 0.0 0.0 32.5 32.5 (24) 5.8 5.5 0.3 209.7 5.5 204.2
2015 10.2 -0.1 -4.8 -0.2 5.1
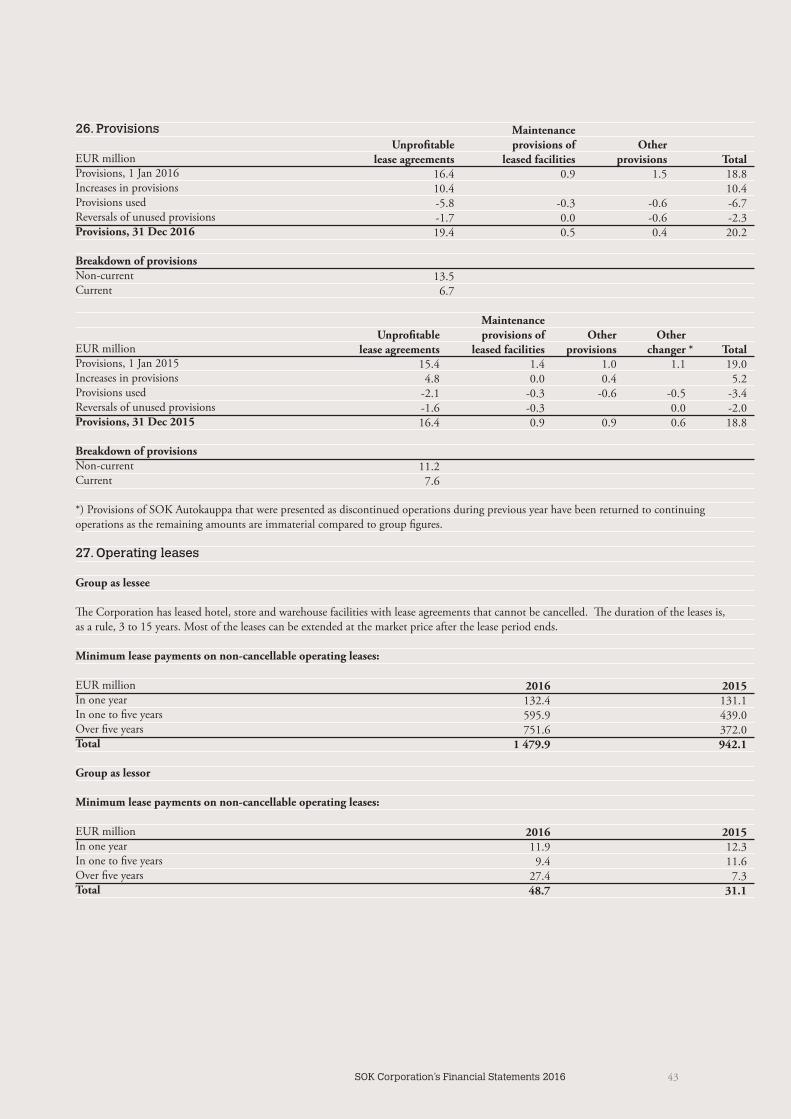
43SOK Corporation’s Financial Statements 2016
26. Provisions
EUR millionProvisions, 1 Jan 2016Increases in provisionsProvisions usedReversals of unused provisionsProvisions, 31 Dec 2016
Breakdown of provisionsNon-currentCurrent
EUR millionProvisions, 1 Jan 2015Increases in provisionsProvisions usedReversals of unused provisionsProvisions, 31 Dec 2015
Breakdown of provisionsNon-currentCurrent
*) Provisions of SOK Autokauppa that were presented as discontinued operations during previous year have been returned to continuing operations as the remaining amounts are immaterial compared to group figures.
27. Operating leases
Group as lessee
The Corporation has leased hotel, store and warehouse facilities with lease agreements that cannot be cancelled. The duration of the leases is, as a rule, 3 to 15 years. Most of the leases can be extended at the market price after the lease period ends.
Minimum lease payments on non-cancellable operating leases:
EUR millionIn one yearIn one to five yearsOver five yearsTotal
Group as lessor
Minimum lease payments on non-cancellable operating leases:
EUR millionIn one yearIn one to five yearsOver five yearsTotal
*
Maintenance Unprofitable provisions of Other lease agreements leased facilities provisions Total 16.4 0.9 1.5 18.8 10.4 10.4 -5.8 -0.3 -0.6 -6.7 -1.7 0.0 -0.6 -2.3 19.4 0.5 0.4 20.2 13.5 6.7
Maintenance Unprofitable provisions of Other Other lease agreements leased facilities provisions changer Total 15.4 1.4 1.0 1.1 19.0 4.8 0.0 0.4 5.2 -2.1 -0.3 -0.6 -0.5 -3.4 -1.6 -0.3 0.0 -2.0 16.4 0.9 0.9 0.6 18.8 11.2 7.6
2016 2015 132.4 131.1 595.9 439.0 751.6 372.0 1 479.9 942.1
2016 2015 11.9 12.3 9.4 11.6 27.4 7.3 48.7 31.1
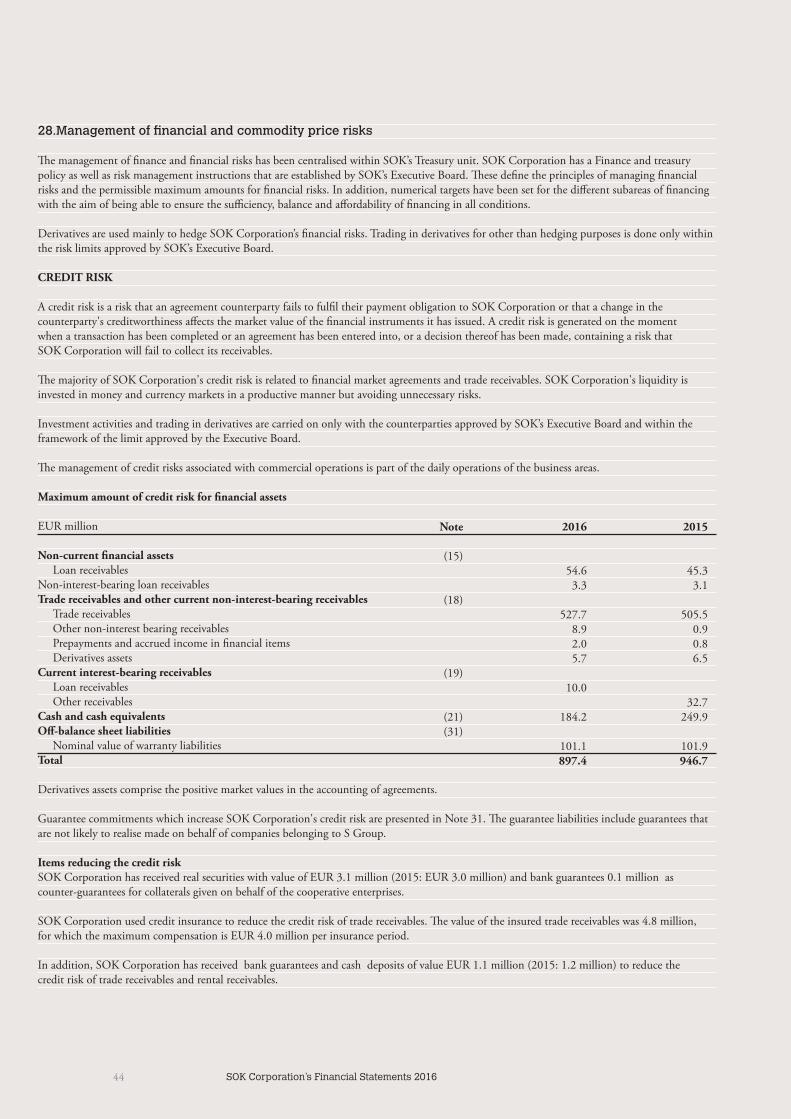
44 SOK Corporation’s Financial Statements 2016
28.Management of financial and commodity price risks
The management of finance and financial risks has been centralised within SOK’s Treasury unit. SOK Corporation has a Finance and treasury policy as well as risk management instructions that are established by SOK’s Executive Board. These define the principles of managing financial risks and the permissible maximum amounts for financial risks. In addition, numerical targets have been set for the different subareas of financing with the aim of being able to ensure the sufficiency, balance and affordability of financing in all conditions.
Derivatives are used mainly to hedge SOK Corporation’s financial risks. Trading in derivatives for other than hedging purposes is done only within the risk limits approved by SOK’s Executive Board.
CREDIT RISK
A credit risk is a risk that an agreement counterparty fails to fulfil their payment obligation to SOK Corporation or that a change in the counterparty's creditworthiness affects the market value of the financial instruments it has issued. A credit risk is generated on the moment when a transaction has been completed or an agreement has been entered into, or a decision thereof has been made, containing a risk that SOK Corporation will fail to collect its receivables.
The majority of SOK Corporation's credit risk is related to financial market agreements and trade receivables. SOK Corporation's liquidity is invested in money and currency markets in a productive manner but avoiding unnecessary risks.
Investment activities and trading in derivatives are carried on only with the counterparties approved by SOK’s Executive Board and within the framework of the limit approved by the Executive Board.
The management of credit risks associated with commercial operations is part of the daily operations of the business areas.
Maximum amount of credit risk for financial assets
EUR million
Non-current financial assets Loan receivablesNon-interest-bearing loan receivablesTrade receivables and other current non-interest-bearing receivables Trade receivables Other non-interest bearing receivables Prepayments and accrued income in financial items Derivatives assetsCurrent interest-bearing receivables Loan receivables Other receivablesCash and cash equivalentsOff-balance sheet liabilities Nominal value of warranty liabilitiesTotal
Derivatives assets comprise the positive market values in the accounting of agreements.
Guarantee commitments which increase SOK Corporation's credit risk are presented in Note 31. The guarantee liabilities include guarantees that are not likely to realise made on behalf of companies belonging to S Group.
Items reducing the credit riskSOK Corporation has received real securities with value of EUR 3.1 million (2015: EUR 3.0 million) and bank guarantees 0.1 million as counter-guarantees for collaterals given on behalf of the cooperative enterprises.
SOK Corporation used credit insurance to reduce the credit risk of trade receivables. The value of the insured trade receivables was 4.8 million, for which the maximum compensation is EUR 4.0 million per insurance period.
In addition, SOK Corporation has received bank guarantees and cash deposits of value EUR 1.1 million (2015: 1.2 million) to reduce the credit risk of trade receivables and rental receivables.
Note 2016 2015 (15) 54.6 45.3 3.3 3.1 (18) 527.7 505.5 8.9 0.9 2.0 0.8 5.7 6.5 (19) 10.0 32.7 (21) 184.2 249.9 (31) 101.1 101.9 897.4 946.7
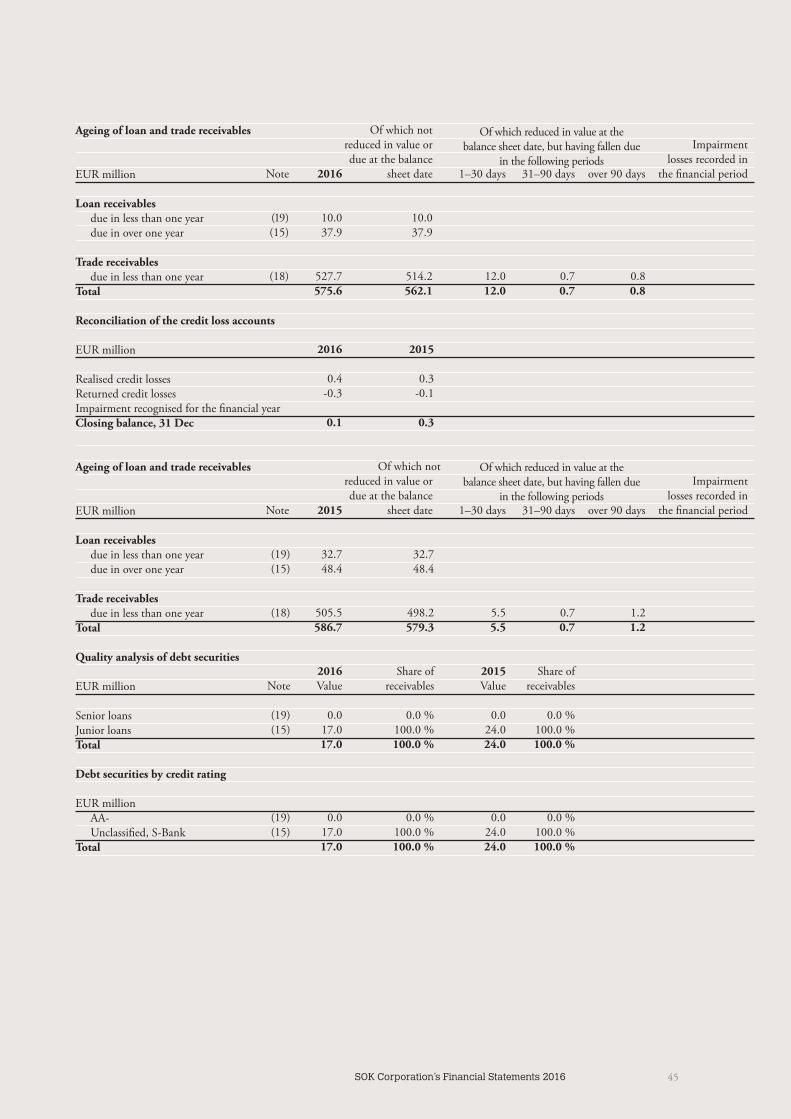
45SOK Corporation’s Financial Statements 2016
Ageing of loan and trade receivables
EUR million
Loan receivables due in less than one year due in over one year
Trade receivables due in less than one yearTotal
Reconciliation of the credit loss accounts
EUR million
Realised credit lossesReturned credit lossesImpairment recognised for the financial yearClosing balance, 31 Dec
Ageing of loan and trade receivables
EUR million
Loan receivables due in less than one year due in over one year
Trade receivables due in less than one yearTotal
Quality analysis of debt securities
EUR million
Senior loansJunior loansTotal
Debt securities by credit rating
EUR million AA- Unclassified, S-BankTotal
Of which reduced in value at the balance sheet date, but having fallen due
in the following periods
Of which reduced in value at the balance sheet date, but having fallen due
in the following periods
Of which not reduced in value or Impairment due at the balance losses recorded in Note 2016 sheet date 1–30 days 31–90 days over 90 days the financial period
(19) 10.0 10.0 (15) 37.9 37.9 (18) 527.7 514.2 12.0 0.7 0.8 575.6 562.1 12.0 0.7 0.8
2016 2015 0.4 0.3 -0.3 -0.1 0.1 0.3
Of which not reduced in value or Impairment due at the balance losses recorded in Note 2015 sheet date 1–30 days 31–90 days over 90 days the financial period
(19) 32.7 32.7 (15) 48.4 48.4 (18) 505.5 498.2 5.5 0.7 1.2 586.7 579.3 5.5 0.7 1.2
2016 Share of 2015 Share of Note Value receivables Value receivables
(19) 0.0 0.0 % 0.0 0.0 % (15) 17.0 100.0 % 24.0 100.0 % 17.0 100.0 % 24.0 100.0 %
(19) 0.0 0.0 % 0.0 0.0 % (15) 17.0 100.0 % 24.0 100.0 % 17.0 100.0 % 24.0 100.0 %
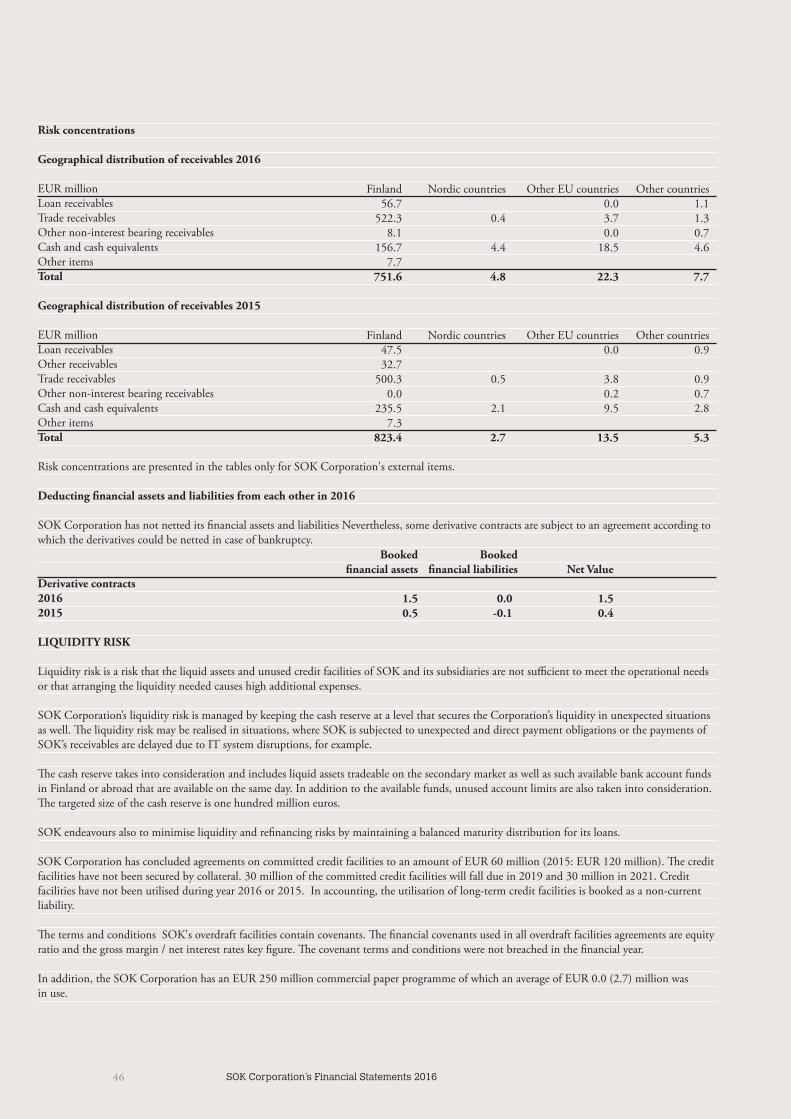
46 SOK Corporation’s Financial Statements 2016
Risk concentrations
Geographical distribution of receivables 2016
EUR millionLoan receivablesTrade receivablesOther non-interest bearing receivablesCash and cash equivalentsOther itemsTotal
Geographical distribution of receivables 2015
EUR millionLoan receivablesOther receivablesTrade receivablesOther non-interest bearing receivablesCash and cash equivalentsOther itemsTotal
Risk concentrations are presented in the tables only for SOK Corporation's external items.
Deducting financial assets and liabilities from each other in 2016
SOK Corporation has not netted its financial assets and liabilities Nevertheless, some derivative contracts are subject to an agreement according to which the derivatives could be netted in case of bankruptcy.
Derivative contracts20162015
LIQUIDITY RISK
Liquidity risk is a risk that the liquid assets and unused credit facilities of SOK and its subsidiaries are not sufficient to meet the operational needs or that arranging the liquidity needed causes high additional expenses.
SOK Corporation’s liquidity risk is managed by keeping the cash reserve at a level that secures the Corporation’s liquidity in unexpected situations as well. The liquidity risk may be realised in situations, where SOK is subjected to unexpected and direct payment obligations or the payments of SOK’s receivables are delayed due to IT system disruptions, for example.
The cash reserve takes into consideration and includes liquid assets tradeable on the secondary market as well as such available bank account funds in Finland or abroad that are available on the same day. In addition to the available funds, unused account limits are also taken into consideration. The targeted size of the cash reserve is one hundred million euros.
SOK endeavours also to minimise liquidity and refinancing risks by maintaining a balanced maturity distribution for its loans.
SOK Corporation has concluded agreements on committed credit facilities to an amount of EUR 60 million (2015: EUR 120 million). The credit facilities have not been secured by collateral. 30 million of the committed credit facilities will fall due in 2019 and 30 million in 2021. Credit facilities have not been utilised during year 2016 or 2015. In accounting, the utilisation of long-term credit facilities is booked as a non-current liability.
The terms and conditions SOK's overdraft facilities contain covenants. The financial covenants used in all overdraft facilities agreements are equity ratio and the gross margin / net interest rates key figure. The covenant terms and conditions were not breached in the financial year.
In addition, the SOK Corporation has an EUR 250 million commercial paper programme of which an average of EUR 0.0 (2.7) million was in use.
Finland Nordic countries Other EU countries Other countries 56.7 0.0 1.1 522.3 0.4 3.7 1.3 8.1 0.0 0.7 156.7 4.4 18.5 4.6 7.7 751.6 4.8 22.3 7.7 Finland Nordic countries Other EU countries Other countries 47.5 0.0 0.9 32.7 500.3 0.5 3.8 0.9 0.0 0.2 0.7 235.5 2.1 9.5 2.8 7.3 823.4 2.7 13.5 5.3
Booked Booked financial assets financial liabilities Net Value 1.5 0.0 1.5 0.5 -0.1 0.4
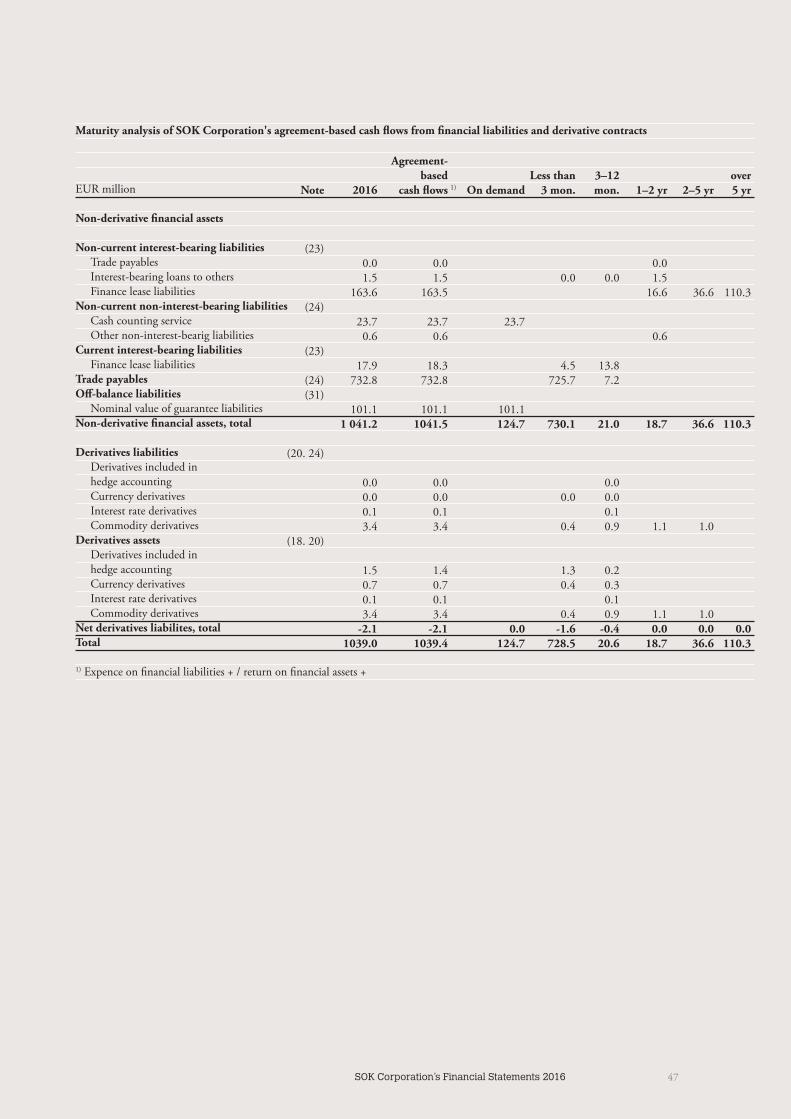
47SOK Corporation’s Financial Statements 2016
Maturity analysis of SOK Corporation's agreement-based cash flows from financial liabilities and derivative contracts
EUR million
Non-derivative financial assets
Non-current interest-bearing liabilities Trade payables Interest-bearing loans to others Finance lease liabilitiesNon-current non-interest-bearing liabilities Cash counting service Other non-interest-bearig liabilitiesCurrent interest-bearing liabilities Finance lease liabilitiesTrade payablesOff-balance liabilities Nominal value of guarantee liabilitiesNon-derivative financial assets, total
Derivatives liabilities Derivatives included in hedge accounting Currency derivatives Interest rate derivatives Commodity derivativesDerivatives assets Derivatives included in hedge accounting Currency derivatives Interest rate derivatives Commodity derivativesNet derivatives liabilites, totalTotal
1) Expence on financial liabilities + / return on financial assets +
Agreement- based Less than 3–12 over Note 2016 cash flows On demand 3 mon. mon. 1–2 yr 2–5 yr 5 yr
(23) 0.0 0.0 0.0 1.5 1.5 0.0 0.0 1.5 163.6 163.5 16.6 36.6 110.3 (24) 23.7 23.7 23.7 0.6 0.6 0.6 (23) 17.9 18.3 4.5 13.8 (24) 732.8 732.8 725.7 7.2 (31) 101.1 101.1 101.1 1 041.2 1041.5 124.7 730.1 21.0 18.7 36.6 110.3 (20. 24) 0.0 0.0 0.0 0.0 0.0 0.0 0.0 0.1 0.1 0.1 3.4 3.4 0.4 0.9 1.1 1.0 (18. 20) 1.5 1.4 1.3 0.2 0.7 0.7 0.4 0.3 0.1 0.1 0.1 3.4 3.4 0.4 0.9 1.1 1.0 -2.1 -2.1 0.0 -1.6 -0.4 0.0 0.0 0.0 1039.0 1039.4 124.7 728.5 20.6 18.7 36.6 110.3
1)
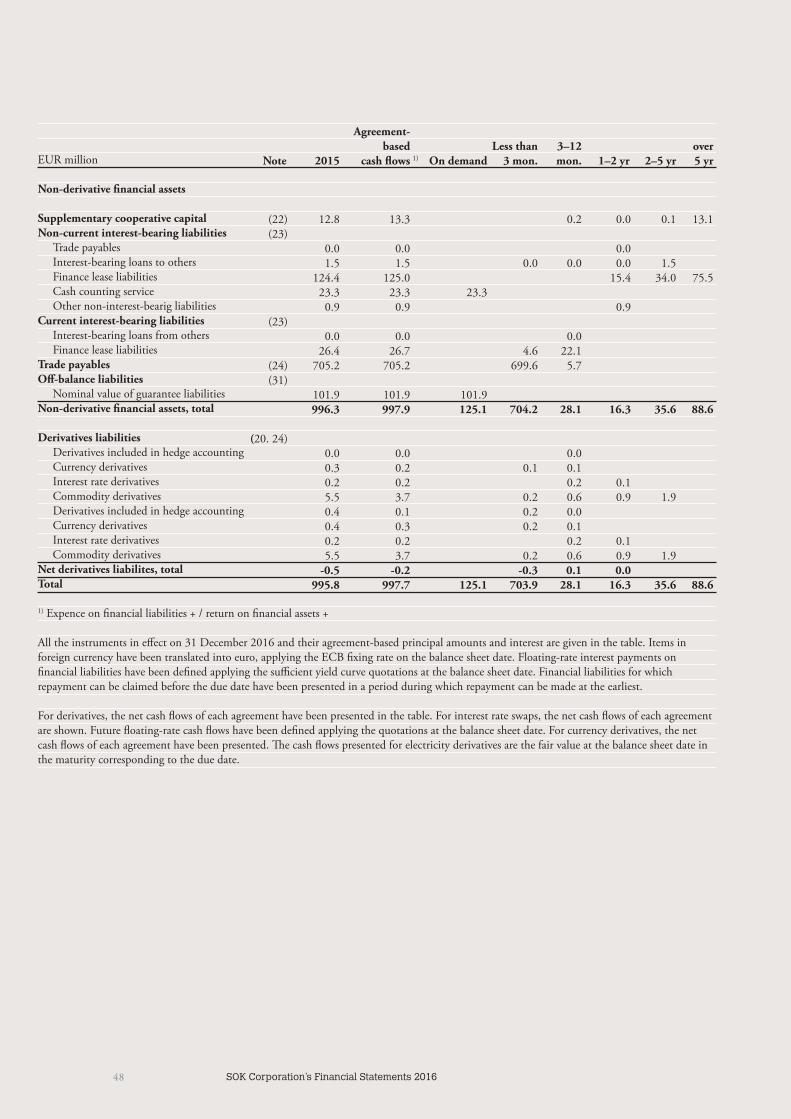
48 SOK Corporation’s Financial Statements 2016
EUR million
Non-derivative financial assets
Supplementary cooperative capitalNon-current interest-bearing liabilities Trade payables Interest-bearing loans to others Finance lease liabilities Cash counting service Other non-interest-bearig liabilitiesCurrent interest-bearing liabilities Interest-bearing loans from others Finance lease liabilitiesTrade payablesOff-balance liabilities Nominal value of guarantee liabilitiesNon-derivative financial assets, total
Derivatives liabilities Derivatives included in hedge accounting Currency derivatives Interest rate derivatives Commodity derivatives Derivatives included in hedge accounting Currency derivatives Interest rate derivatives Commodity derivativesNet derivatives liabilites, totalTotal
1) Expence on financial liabilities + / return on financial assets +
All the instruments in effect on 31 December 2016 and their agreement-based principal amounts and interest are given in the table. Items in foreign currency have been translated into euro, applying the ECB fixing rate on the balance sheet date. Floating-rate interest payments on financial liabilities have been defined applying the sufficient yield curve quotations at the balance sheet date. Financial liabilities for which repayment can be claimed before the due date have been presented in a period during which repayment can be made at the earliest.
For derivatives, the net cash flows of each agreement have been presented in the table. For interest rate swaps, the net cash flows of each agreement are shown. Future floating-rate cash flows have been defined applying the quotations at the balance sheet date. For currency derivatives, the net cash flows of each agreement have been presented. The cash flows presented for electricity derivatives are the fair value at the balance sheet date in the maturity corresponding to the due date.
Agreement- based Less than 3–12 over Note 2015 cash flows On demand 3 mon. mon. 1–2 yr 2–5 yr 5 yr
(22) 12.8 13.3 0.2 0.0 0.1 13.1 (23) 0.0 0.0 0.0 1.5 1.5 0.0 0.0 0.0 1.5 124.4 125.0 15.4 34.0 75.5 23.3 23.3 23.3 0.9 0.9 0.9 (23) 0.0 0.0 0.0 26.4 26.7 4.6 22.1 (24) 705.2 705.2 699.6 5.7 (31) 101.9 101.9 101.9 996.3 997.9 125.1 704.2 28.1 16.3 35.6 88.6
(20. 24) 0.0 0.0 0.0 0.3 0.2 0.1 0.1 0.2 0.2 0.2 0.1 5.5 3.7 0.2 0.6 0.9 1.9 0.4 0.1 0.2 0.0 0.4 0.3 0.2 0.1 0.2 0.2 0.2 0.1 5.5 3.7 0.2 0.6 0.9 1.9 -0.5 -0.2 -0.3 0.1 0.0 995.8 997.7 125.1 703.9 28.1 16.3 35.6 88.6
1)
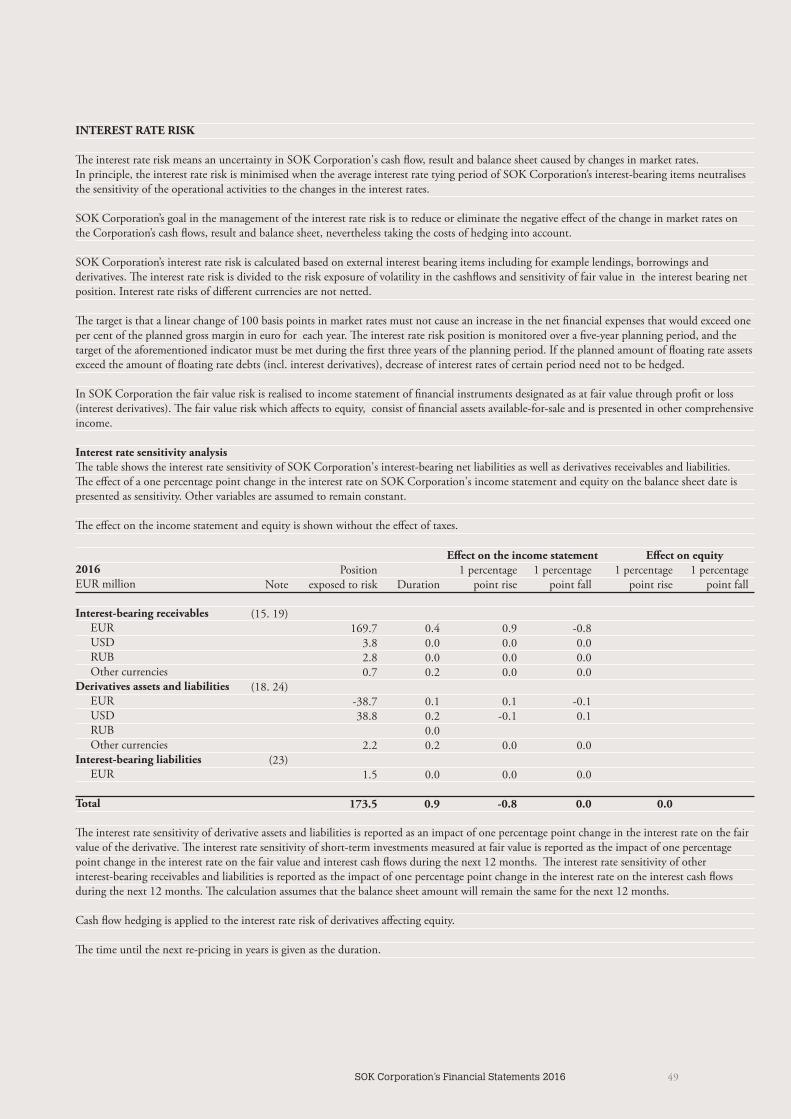
49SOK Corporation’s Financial Statements 2016
INTEREST RATE RISK
The interest rate risk means an uncertainty in SOK Corporation's cash flow, result and balance sheet caused by changes in market rates. In principle, the interest rate risk is minimised when the average interest rate tying period of SOK Corporation’s interest-bearing items neutralises the sensitivity of the operational activities to the changes in the interest rates.
SOK Corporation’s goal in the management of the interest rate risk is to reduce or eliminate the negative effect of the change in market rates on the Corporation’s cash flows, result and balance sheet, nevertheless taking the costs of hedging into account.
SOK Corporation’s interest rate risk is calculated based on external interest bearing items including for example lendings, borrowings and derivatives. The interest rate risk is divided to the risk exposure of volatility in the cashflows and sensitivity of fair value in the interest bearing net position. Interest rate risks of different currencies are not netted.
The target is that a linear change of 100 basis points in market rates must not cause an increase in the net financial expenses that would exceed one per cent of the planned gross margin in euro for each year. The interest rate risk position is monitored over a five-year planning period, and the target of the aforementioned indicator must be met during the first three years of the planning period. If the planned amount of floating rate assets exceed the amount of floating rate debts (incl. interest derivatives), decrease of interest rates of certain period need not to be hedged.
In SOK Corporation the fair value risk is realised to income statement of financial instruments designated as at fair value through profit or loss (interest derivatives). The fair value risk which affects to equity, consist of financial assets available-for-sale and is presented in other comprehensive income.
Interest rate sensitivity analysisThe table shows the interest rate sensitivity of SOK Corporation's interest-bearing net liabilities as well as derivatives receivables and liabilities. The effect of a one percentage point change in the interest rate on SOK Corporation's income statement and equity on the balance sheet date is presented as sensitivity. Other variables are assumed to remain constant.
The effect on the income statement and equity is shown without the effect of taxes.
2016EUR million
Interest-bearing receivables EUR USD RUB Other currenciesDerivatives assets and liabilities EUR USD RUB Other currenciesInterest-bearing liabilities EUR
Total
The interest rate sensitivity of derivative assets and liabilities is reported as an impact of one percentage point change in the interest rate on the fair value of the derivative. The interest rate sensitivity of short-term investments measured at fair value is reported as the impact of one percentage point change in the interest rate on the fair value and interest cash flows during the next 12 months. The interest rate sensitivity of other interest-bearing receivables and liabilities is reported as the impact of one percentage point change in the interest rate on the interest cash flows during the next 12 months. The calculation assumes that the balance sheet amount will remain the same for the next 12 months.
Cash flow hedging is applied to the interest rate risk of derivatives affecting equity.
The time until the next re-pricing in years is given as the duration.
Effect on the income statement Effect on equity Position 1 percentage 1 percentage 1 percentage 1 percentage Note exposed to risk Duration point rise point fall point rise point fall
(15. 19) 169.7 0.4 0.9 -0.8 3.8 0.0 0.0 0.0 2.8 0.0 0.0 0.0 0.7 0.2 0.0 0.0 (18. 24) -38.7 0.1 0.1 -0.1 38.8 0.2 -0.1 0.1 0.0 2.2 0.2 0.0 0.0 (23) 1.5 0.0 0.0 0.0 173.5 0.9 -0.8 0.0 0.0

50 SOK Corporation’s Financial Statements 2016
2015EUR million
Interest-bearing receivables EURDerivatives assets and liabilities EUR USD RUB Other currenciesInterest-bearing liabilities EUR
Total
Interest cash flow risk and hedge accounting
SOK Corporation applies hedge accounting to derivatives hedging highly probable future purchases. The hedge accounting model used is cash flow hedge. The purpose of hedge accounting is to hedge against the currency risk in currency-denominated purchases.
Hedge accounting is applied to derivatives which are effective for the risk being hedged and meet the conditions set for hedge accounting in the IAS 39 standard. For hedging is used only forward exchange contracts. The hedging relationship between the hedging derivative and the hedged item as well as the risk management objectives related to hedging are documented when the hedging begins.
The efficiency of the hedge is assessed at the beginning of the hedging relationship and during the hedge so that the hedge is extremely efficient throughout. A hedge is considered efficient when the change in the cash flows of the hedge instrument eliminates 80 to 125% of the change in the cash flows of the hedged agreement or position.
The efficient portion of hedging is recognised in the fair value reserve.
Fair values of the electricity derivatives used as hedge instruments
EUR million
Derivatives liabilities Forward exchange contractsTotal
Derivatives receivables Forward exchange contractsTotal
Changes recognised in Group equity from cash flow hedge
EUR million
Opening balance, 1 JanProfits and losses from valuing at fair valueAmount included in the income statementClosing balance, 31 Dec
Items recognised in equity are shown without the effect of taxes.
Changes in value recognised in equity are recognised in the income statement in the period during which the hedged cash flows are recognised in the income statement, the derivative matures or the hedge accounting prerequisites are no longer met.
Effect on the income statement Effect on equity Position 1 percentage 1 percentage 1 percentage 1 percentage Note exposed to risk Duration point rise point fall point rise point fall
(15. 19) 111.1 0.2 2.0 -2.0 (18. 24) -36.9 0.2 0.1 -0.1 30.7 0.2 -0.1 0.1 0.1 0.0 0.0 0.0 4.0 0.1 0.0 0.0 (23) 1.5 0.0 0.0 0.0 110.5 2.0 -2.0 0.0 0.0
2016 2015 0.0 0.0 0.0 0.0 1.5 0.4 1.5 0.4
2016 2015 0.4 1.0 1.4 0.4 -0.4 -1.0 1.4 0.4

51SOK Corporation’s Financial Statements 2016
CURRENCY RISK
SSOK Corporation’s revenue still comes mainly from Finland.
A currency risk means an uncertainty in SOK Corporation's cash flow, result and balance sheet caused by changes in exchange rates. The size of SOK Corporation’s and its subsidiaries' currency risk is viewed by currency. The objective is to minimise the uncertainty caused by the currency risk of an open position, nevertheless taking the hedging costs into account.
SOK Finance is in charge of the management of SOK Corporation’s currency risk in a centralised manner. SOK Corporation’s currency risk is monitored through the ALM cost centre, which depicts the entire Group’s currency risk. ALM position risk may not exceed EUR 10 million when the exchange rate changes by 10 per cent. The SOK unit or subsidiary entering into an agreement is responsible for the transaction risks. Significant transaction risks are primarily hedged with the derivatives.
Subsidiaries’ currency risk is reduced by financing the operations of the companies in the same currency as the application of funds as well as by means of derivatives. The translation risk associated with the invested equity financing in foreign subsidiaries is reduced by hedging the capitals to the extent that a 20 per cent exchange rate changes would cause a decline of more than 1.0 percentage points in SOK Corporation's equity ratio. The same applies to the holding which the companies plan to return to Finland after more than four years. The holding which the companies plan to return to Finland during the next four years is considered in full.
Currency sensitivity analysisThe currency sensitivity analysis shows the effect on SOK Corporation's profit/loss or equity of a 10% appreciation of depreciation in the euro against other currencies. Other variables are asssumed to remain constant.
The calculation includes the amount of equity in SOK's foreign subsidiaries. Its conversion into euro will have an impact on equity. The effect on the income statement and equity is shown without the effect of taxes.
2016EUR million USD RUB Other currenciesTotal
2016EUR million RUB Total
2015EUR million USD RUB Other currenciesTotal
2015EUR million RUB Total
Hedge accounting is not applied to currency derivatives hedging SOK Corporation’s equity investments.
Effect on the income statement Position exposed to risk Appreciation of the euro, 10 % Depreciation of the euro, 10 % 41.1 -4.1 4.1 -11.9 1.2 -1.2 2.4 -0.2 0.2 31.6 -3.2 3.2 Effect on equity Position exposed to risk Appreciation of the euro, 10 % Depreciation of the euro, 10 % 51.6 -5.2 5.2 51.6 -5.2 5.2
Effect on the income statement Position exposed to risk Appreciation of the euro, 10 % Depreciation of the euro, 10 % 28.6 -2.9 2.9 -12.9 1.3 -1.3 7.3 -0.7 0.7 23.0 -2.3 2.3 Effect on equity Position exposed to risk Appreciation of the euro, 10 % Depreciation of the euro, 10 % 44.4 -4.4 4.4 44.4 -4.4 4.4
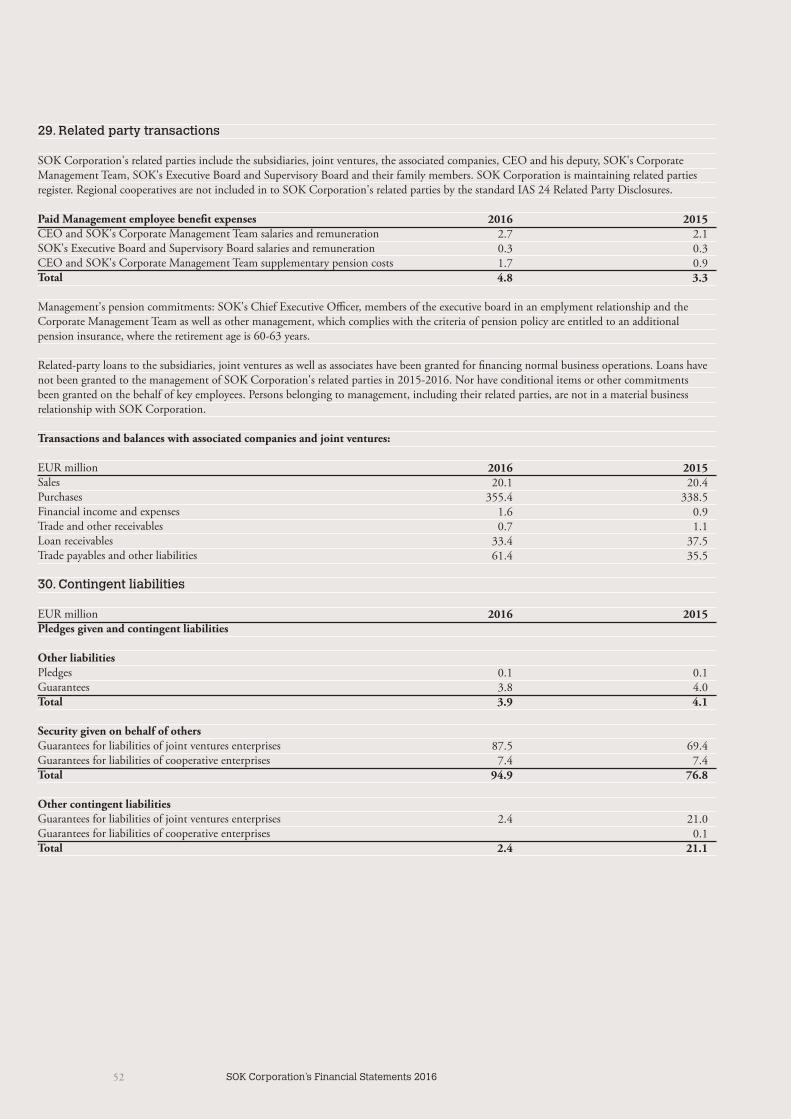
52 SOK Corporation’s Financial Statements 2016
29. Related party transactions
SOK Corporation's related parties include the subsidiaries, joint ventures, the associated companies, CEO and his deputy, SOK's Corporate Management Team, SOK's Executive Board and Supervisory Board and their family members. SOK Corporation is maintaining related parties register. Regional cooperatives are not included in to SOK Corporation's related parties by the standard IAS 24 Related Party Disclosures.
Paid Management employee benefit expensesCEO and SOK's Corporate Management Team salaries and remunerationSOK's Executive Board and Supervisory Board salaries and remunerationCEO and SOK's Corporate Management Team supplementary pension costsTotal
Management's pension commitments: SOK's Chief Executive Officer, members of the executive board in an emplyment relationship and the Corporate Management Team as well as other management, which complies with the criteria of pension policy are entitled to an additional pension insurance, where the retirement age is 60-63 years.
Related-party loans to the subsidiaries, joint ventures as well as associates have been granted for financing normal business operations. Loans have not been granted to the management of SOK Corporation's related parties in 2015-2016. Nor have conditional items or other commitments been granted on the behalf of key employees. Persons belonging to management, including their related parties, are not in a material business relationship with SOK Corporation.
Transactions and balances with associated companies and joint ventures:
EUR millionSalesPurchasesFinancial income and expensesTrade and other receivablesLoan receivablesTrade payables and other liabilities
30. Contingent liabilities
EUR millionPledges given and contingent liabilities
Other liabilitiesPledgesGuaranteesTotal
Security given on behalf of othersGuarantees for liabilities of joint ventures enterprisesGuarantees for liabilities of cooperative enterprisesTotal
Other contingent liabilitiesGuarantees for liabilities of joint ventures enterprisesGuarantees for liabilities of cooperative enterprisesTotal
2016 2015 2.7 2.1 0.3 0.3 1.7 0.9 4.8 3.3
2016 2015 20.1 20.4 355.4 338.5 1.6 0.9 0.7 1.1 33.4 37.5 61.4 35.5
2016 2015 0.1 0.1 3.8 4.0 3.9 4.1 87.5 69.4 7.4 7.4 94.9 76.8 2.4 21.0 0.1 2.4 21.1
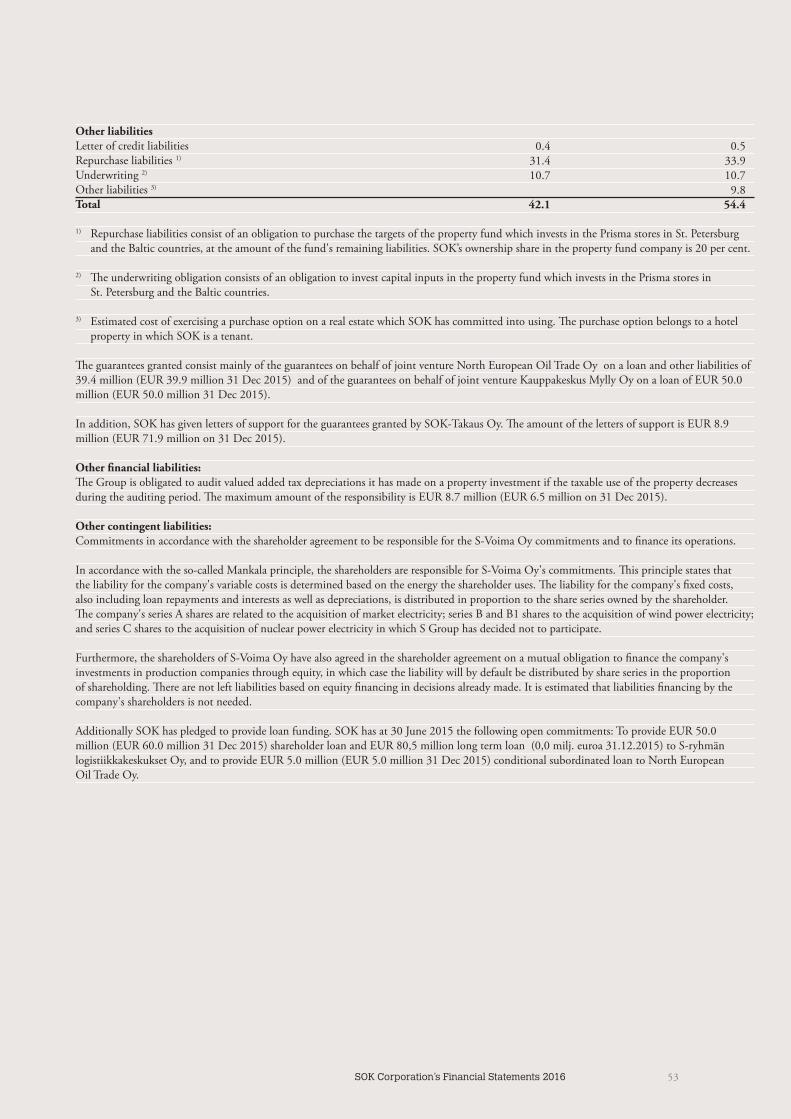
53SOK Corporation’s Financial Statements 2016
Other liabilitiesLetter of credit liabilitiesRepurchase liabilities 1)
Underwriting 2)
Other liabilities 3)
Total
1) Repurchase liabilities consist of an obligation to purchase the targets of the property fund which invests in the Prisma stores in St. Petersburg and the Baltic countries, at the amount of the fund's remaining liabilities. SOK’s ownership share in the property fund company is 20 per cent.
2) The underwriting obligation consists of an obligation to invest capital inputs in the property fund which invests in the Prisma stores in St. Petersburg and the Baltic countries.
3) Estimated cost of exercising a purchase option on a real estate which SOK has committed into using. The purchase option belongs to a hotel property in which SOK is a tenant.
The guarantees granted consist mainly of the guarantees on behalf of joint venture North European Oil Trade Oy on a loan and other liabilities of 39.4 million (EUR 39.9 million 31 Dec 2015) and of the guarantees on behalf of joint venture Kauppakeskus Mylly Oy on a loan of EUR 50.0 million (EUR 50.0 million 31 Dec 2015).
In addition, SOK has given letters of support for the guarantees granted by SOK-Takaus Oy. The amount of the letters of support is EUR 8.9 million (EUR 71.9 million on 31 Dec 2015).
Other financial liabilities:The Group is obligated to audit valued added tax depreciations it has made on a property investment if the taxable use of the property decreases during the auditing period. The maximum amount of the responsibility is EUR 8.7 million (EUR 6.5 million on 31 Dec 2015).
Other contingent liabilities:Commitments in accordance with the shareholder agreement to be responsible for the S-Voima Oy commitments and to finance its operations.
In accordance with the so-called Mankala principle, the shareholders are responsible for S-Voima Oy's commitments. This principle states that the liability for the company's variable costs is determined based on the energy the shareholder uses. The liability for the company's fixed costs, also including loan repayments and interests as well as depreciations, is distributed in proportion to the share series owned by the shareholder. The company's series A shares are related to the acquisition of market electricity; series B and B1 shares to the acquisition of wind power electricity; and series C shares to the acquisition of nuclear power electricity in which S Group has decided not to participate.
Furthermore, the shareholders of S-Voima Oy have also agreed in the shareholder agreement on a mutual obligation to finance the company's investments in production companies through equity, in which case the liability will by default be distributed by share series in the proportion of shareholding. There are not left liabilities based on equity financing in decisions already made. It is estimated that liabilities financing by the company's shareholders is not needed.
Additionally SOK has pledged to provide loan funding. SOK has at 30 June 2015 the following open commitments: To provide EUR 50.0 million (EUR 60.0 million 31 Dec 2015) shareholder loan and EUR 80,5 million long term loan (0,0 milj. euroa 31.12.2015) to S-ryhmän logistiikkakeskukset Oy, and to provide EUR 5.0 million (EUR 5.0 million 31 Dec 2015) conditional subordinated loan to North European Oil Trade Oy.
0.4 0.5 31.4 33.9 10.7 10.7 9.8 42.1 54.4

54 SOK Corporation’s Financial Statements 2016
31. Subsidiaries and associated companies
Companies owned by SOK Corporation and SOK 31.12.2016
Group companiesCommercialA/S Prisma LatvijaAS SokotelInex Partners Oy Inex Export OyJollas-Opisto Oy Meira Nova OyOOO Itis 2 OOO SOK Service Center RUSOOO Otel PlusOOO PrismaOOO SokotelPrisma Peremarket AS RB Int OyRekla OySOK-Liiketoiminta Oy Sokotel Oy SOK Autokauppa OySOK Fashion Retail OySOK Fund Management OySOK Real Estate Int OySOK Retail Int OySOK-Takaus Oy Suomen Spar Oy S-Business OyS-Verkkopalvelut OyS-Yrityspalvelu OyUAB Prisma LTUAB Viršuliškių Prekybos CentrasCommercial, 28 companies
Real-estate companies, 22 companiesTotal Group companies, 50 companies
Joint venturesKauppakeskus Mylly OyKiinteistö Oy Kuloisten KauppakeskusNorth European BioTech OyNorth European Oil Trade Oy
Total joint ventures, 4 companies
Associated companiesAsunto Oy Kauniaisten KirkkomäkiCoop Trading A/SFinnfrost OyKeskuskorttelin Huolto OyS-Pankki OyS-Asiakaspalvelu OyFIM OyjFIM PääomarahastotFIM Kiinteistö OyFIM varainhoito OyRussian and Baltics Retail Properties Ky
Total associated companies, 11 companies
SOK Corporation´s SOK Corporation´s SOK´s Country shareholding % voting rates % shareholding %
Latvia 100 100 Estonia 100 100 Finland 100 100 100 Finland 100 100 100 Finland 100 100 100 Finland 100 100 100 Russia 100 100 Russia 100 100 Russia 100 100 Russia 100 100 Russia 100 100 Estonia 100 100 Finland 100 100 100 Finland 100 100 100 Finland 100 100 100 Finland 100 100 Finland 100 100 Finland 51 51 51 Finland 100 100 100 Finland 100 100 99 Finland 100 100 Finland 100 100 100 Finland 100 100 100 Finland 100 100 100 Finland 61 61 61 Finland 100 100 100 Lithuania 100 100 Lithuania 100 100 100 Finland 50 50 50 Finland 50 50 Finland 50 50 50 Finland 51 51 51 Finland 39 39 39 Denmark 25 25 25 Finland 50 50 Finland 32 32 32 Finland 38 38 38 Finland 38 38 Finland 38 19 Finland 38 19 Finland 30 15 Finland 38 19 Finland 20 20 20
55SOK Corporation’s Financial Statements 2016
32. Events after the balance sheet date The Group does not have any essential events after the balance sheet date.
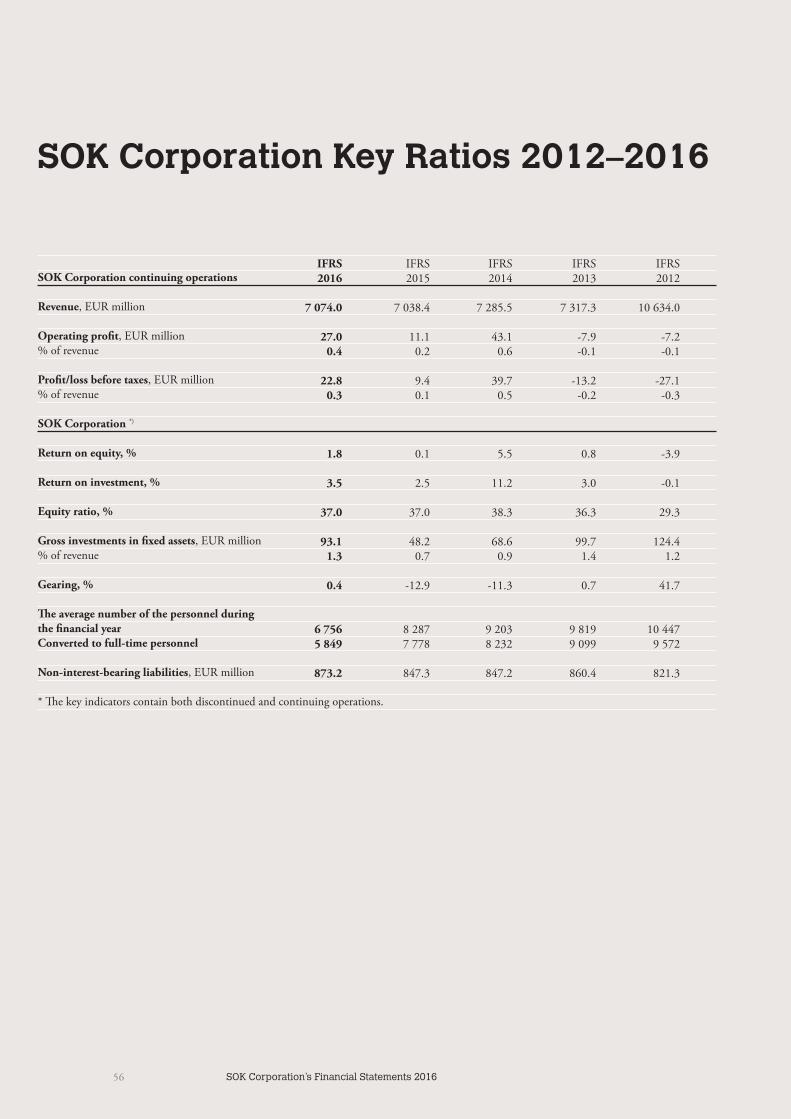
56 SOK Corporation’s Financial Statements 2016
SOK Corporation continuing operations
Revenue, EUR million
Operating profit, EUR million% of revenue
Profit/loss before taxes, EUR million% of revenue
SOK Corporation *)
Return on equity, %
Return on investment, %
Equity ratio, %
Gross investments in fixed assets, EUR million% of revenue
Gearing, %
The average number of the personnel duringthe financial yearConverted to full-time personnel
Non-interest-bearing liabilities, EUR million
* The key indicators contain both discontinued and continuing operations.
SOK Corporation Key Ratios 2012–2016
IFRS IFRS IFRS IFRS IFRS 2016 2015 2014 2013 2012
7 074.0 7 038.4 7 285.5 7 317.3 10 634.0 27.0 11.1 43.1 -7.9 -7.2 0.4 0.2 0.6 -0.1 -0.1 22.8 9.4 39.7 -13.2 -27.1 0.3 0.1 0.5 -0.2 -0.3
1.8 0.1 5.5 0.8 -3.9 3.5 2.5 11.2 3.0 -0.1 37.0 37.0 38.3 36.3 29.3 93.1 48.2 68.6 99.7 124.4 1.3 0.7 0.9 1.4 1.2 0.4 -12.9 -11.3 0.7 41.7
6 756 8 287 9 203 9 819 10 447 5 849 7 778 8 232 9 099 9 572 873.2 847.3 847.2 860.4 821.3
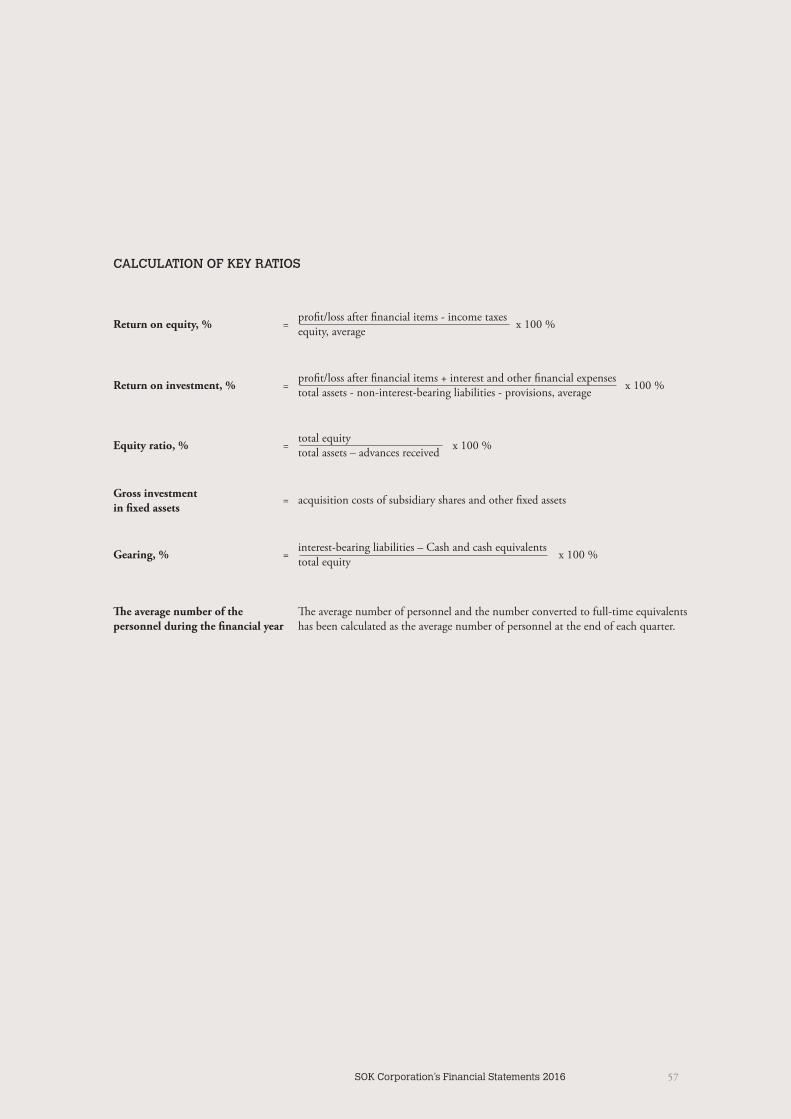
57SOK Corporation’s Financial Statements 2016
CALCULATION OF KEY RATIOS
Return on equity, % = profit/loss after financial items - income taxes x 100 % equity, average
Equity ratio, % = total equity x 100 % total assets – advances received
Gross investment = acquisition costs of subsidiary shares and other fixed assetsin fixed assets
Gearing, % = interest-bearing liabilities – Cash and cash equivalents x 100 % total equity
The average number of the The average number of personnel and the number converted to full-time equivalentspersonnel during the financial year has been calculated as the average number of personnel at the end of each quarter.
Return on investment, % = profit/loss after financial items + interest and other financial expenses x 100 % total assets - non-interest-bearing liabilities - provisions, average
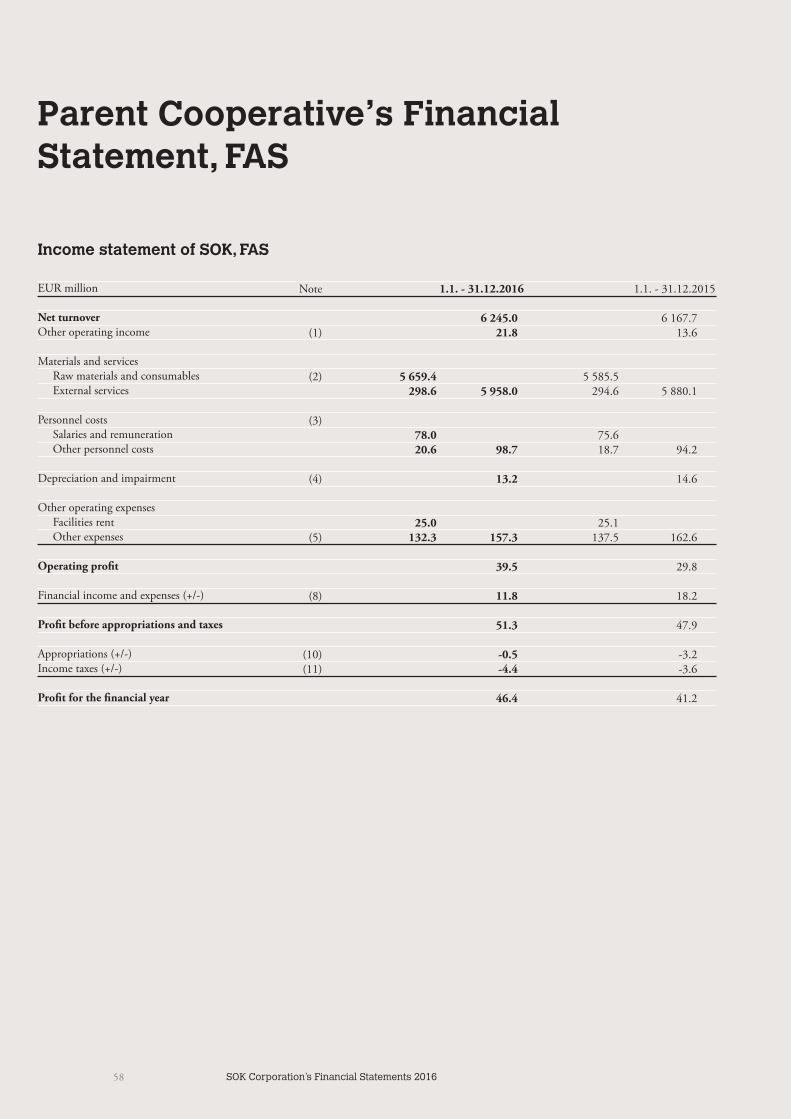
58 SOK Corporation’s Financial Statements 2016
Income statement of SOK, FAS
EUR million
Net turnoverOther operating income
Materials and services Raw materials and consumables External services
Personnel costs Salaries and remuneration Other personnel costs
Depreciation and impairment
Other operating expenses Facilities rent Other expenses
Operating profit
Financial income and expenses (+/-)
Profit before appropriations and taxes
Appropriations (+/-)Income taxes (+/-)
Profit for the financial year
Parent Cooperative’s Financial Statement, FAS
Note 1.1. - 31.12.2016 1.1. - 31.12.2015 6 245.0 6 167.7 (1) 21.8 13.6 (2) 5 659.4 5 585.5 298.6 5 958.0 294.6 5 880.1 (3) 78.0 75.6 20.6 98.7 18.7 94.2 (4) 13.2 14.6 25.0 25.1 (5) 132.3 157.3 137.5 162.6 39.5 29.8 (8) 11.8 18.2 51.3 47.9 (10) -0.5 -3.2 (11) -4.4 -3.6 46.4 41.2
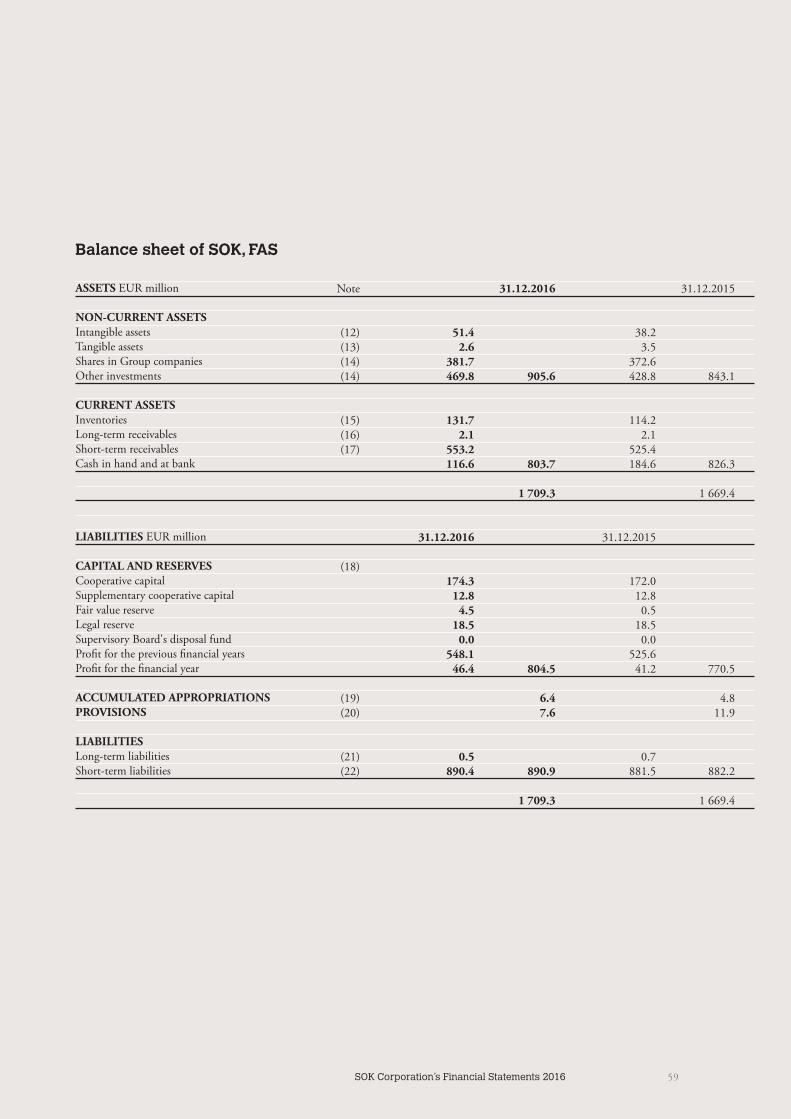
59SOK Corporation’s Financial Statements 2016
Balance sheet of SOK, FAS
ASSETS EUR million
NON-CURRENT ASSETSIntangible assetsTangible assetsShares in Group companiesOther investments
CURRENT ASSETSInventoriesLong-term receivablesShort-term receivablesCash in hand and at bank
LIABILITIES EUR million
CAPITAL AND RESERVESCooperative capitalSupplementary cooperative capitalFair value reserveLegal reserveSupervisory Board's disposal fundProfit for the previous financial yearsProfit for the financial year
ACCUMULATED APPROPRIATIONSPROVISIONS
LIABILITIESLong-term liabilities Short-term liabilities
Note 31.12.2016 31.12.2015
(12) 51.4 38.2 (13) 2.6 3.5 (14) 381.7 372.6 (14) 469.8 905.6 428.8 843.1
(15) 131.7 114.2 (16) 2.1 2.1 (17) 553.2 525.4 116.6 803.7 184.6 826.3 1 709.3 1 669.4
31.12.2016 31.12.2015 (18) 174.3 172.0 12.8 12.8 4.5 0.5 18.5 18.5 0.0 0.0 548.1 525.6 46.4 804.5 41.2 770.5
(19) 6.4 4.8 (20) 7.6 11.9 (21) 0.5 0.7 (22) 890.4 890.9 881.5 882.2 1 709.3 1 669.4
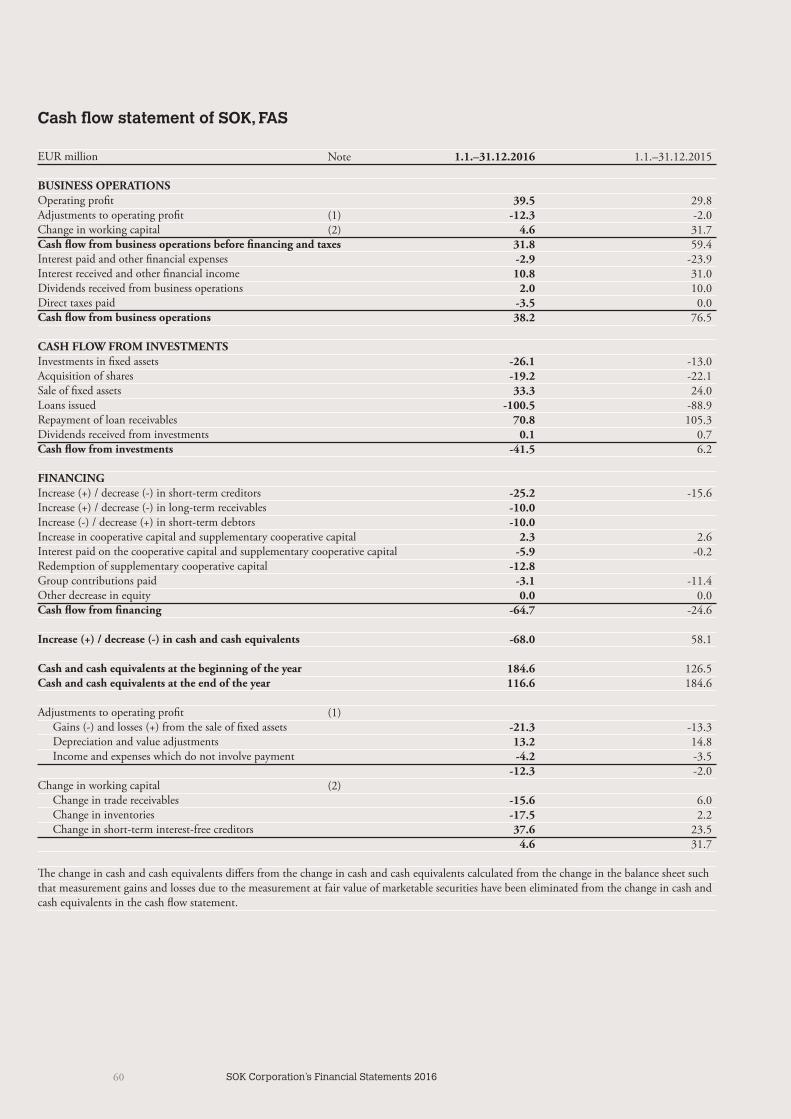
60 SOK Corporation’s Financial Statements 2016
Cash flow statement of SOK, FAS
EUR million
BUSINESS OPERATIONSOperating profitAdjustments to operating profitChange in working capitalCash flow from business operations before financing and taxesInterest paid and other financial expensesInterest received and other financial incomeDividends received from business operationsDirect taxes paidCash flow from business operations
CASH FLOW FROM INVESTMENTSInvestments in fixed assetsAcquisition of sharesSale of fixed assetsLoans issuedRepayment of loan receivablesDividends received from investmentsCash flow from investments
FINANCINGIncrease (+) / decrease (-) in short-term creditorsIncrease (+) / decrease (-) in long-term receivablesIncrease (-) / decrease (+) in short-term debtorsIncrease in cooperative capital and supplementary cooperative capitalInterest paid on the cooperative capital and supplementary cooperative capitalRedemption of supplementary cooperative capitalGroup contributions paidOther decrease in equityCash flow from financing
Increase (+) / decrease (-) in cash and cash equivalents
Cash and cash equivalents at the beginning of the yearCash and cash equivalents at the end of the year
Adjustments to operating profit Gains (-) and losses (+) from the sale of fixed assets Depreciation and value adjustments Income and expenses which do not involve payment
Change in working capital Change in trade receivables Change in inventories Change in short-term interest-free creditors
The change in cash and cash equivalents differs from the change in cash and cash equivalents calculated from the change in the balance sheet such that measurement gains and losses due to the measurement at fair value of marketable securities have been eliminated from the change in cash and cash equivalents in the cash flow statement.
Note 1.1.–31.12.2016 1.1.–31.12.2015
39.5 29.8(1) -12.3 -2.0(2) 4.6 31.7 31.8 59.4 -2.9 -23.9 10.8 31.0 2.0 10.0 -3.5 0.0 38.2 76.5 -26.1 -13.0 -19.2 -22.1 33.3 24.0 -100.5 -88.9 70.8 105.3 0.1 0.7 -41.5 6.2 -25.2 -15.6 -10.0 -10.0 2.3 2.6 -5.9 -0.2 -12.8 -3.1 -11.4 0.0 0.0 -64.7 -24.6 -68.0 58.1 184.6 126.5 116.6 184.6 (1) -21.3 -13.3 13.2 14.8 -4.2 -3.5 -12.3 -2.0(2) -15.6 6.0 -17.5 2.2 37.6 23.5 4.6 31.7
SOK Corporation’s Financial Statements 2016 61
Notes to SOK’s financial statements
Accounting policies
SOK Corporation's financial statements have been prepared in the manner required by the Finnish legislation regulating the preparation of financial statements.
Foreign currency transactions and derivative contracts
Transactions in foreign currency are recognised at the exchange rate on the transaction date. Foreign currency denominated re-ceivables and liabilities outstanding at the end of the financial period are translated into euro at the exchange rate quoted by the European Central Bank on the closing day of the financial period and the exchange rate differences are recognised through profit and loss.
Exchange rate differences arising from the translation of trade receivables are recognised in revenue, and exchange differences arising from the translation of trade payables are recognised in expenses. The exchange gains and losses of receivables belong-ing to other financial items in the balance sheet are recognised in financial income and, correspondingly, those belonging to other liabilities, in financial expenses.
Derivative contracts are used mainly for hedging, but, apart from hedging purchases of consumer goods, hedge accounting is not applied to them. In accounting, all derivatives outside of hedge ac-counting are recognised at fair value and value changes are recog-nised through profit or loss. Realised and non-realised gains and losses from derivative contracts made in order to hedge purchases and trade payables are recognised in purchases. Realised and non-realised gains and losses of other derivatives are recognised in fi-nancial income and financial expenses, respectively.
Hedge accounting is applied to some of the currency derivatives used for hedging goods purchases. In these, only the exchange rate risk is being hedged. The hedge accounting model used is cash flow hedging. The effective portion of the change caused by a change in exchange rates in the value of the hedging derivative used for hedge accounting is recognised in full in the sharehold-ers' equity fair value reserve. Realised profit and loss are recog-nised in purchases.
Bank cash pool systems
For SOK’s subsidiaries, the funds in accounts within cash pool systems are included under ‘Cash in hand and at bank’ and as other current receivables from Group companies or as other cur-rent liabilities to Group companies in SOK’s reporting.
Revenue and sales recognition principle
Sales are recognised when the goods produced are relinquished. When calculating the operating profit, the discounts given, value added tax and exchange rate differences in sales have been de-ducted from sales gains.
Other operating income
Sales gains on non-current assets, capital gains on divestment and generally regular gains generated by the operations, other than those related to the actual sales of goods and services, are recog-nised in other operating income.
Lease payments
In the income statement, lease payments of facilities are presented in facilities rent, and other lease payments are presented in other operating income.
Future expenses and losses
Future expenses and losses which have been committed to or which are likely to materialise have been recognised as expense in the appropriate expense item according to their nature. In the balance sheet, these cost provisions have been presented as manda-tory provisions or deferred income, if their accurate amount and materialisation date is known.
Income taxes
Income taxes include current taxes for the financial period and corrections to taxes for previous periods.
The income statement and balance sheet of SOK do not include deferred tax liability or receivable, but material deferred tax li-abilities or receivables have been presented in the itemisation of taxes in the Notes.
Non-current assets and depreciations
Non-current assets have been measured at the acquisition cost according to the variable costs incurred by the acquisition less depreciation according to plan.
Depreciation according to plan has been calculated in accordance with the predefined depreciation plan as straight-line depreciation of the original acquisition cost of the non-current asset. Deprecia-tion has been calculated from the beginning of the month after the asset was placed in use. Depreciation periods are based on estimated economic lives. Revaluations are not included in the balance sheet values of non-current assets.
SOK-yhtymän tilinpäätös 2016 61

62 SOK Corporation’s Financial Statements 2016
Depreciation periods according to plan are: YearsBuildings 20 to 35Lightweight structures and equipment in buildings 5 to 15Machinery and equipment 3 to 10Motor vehicles and servers 3 to 5Other tangible and intangible assets within the limits allowed by Business Taxation Act
The change in the depreciation difference is presented under Ap-propriations in the income statement. The accumulated deprecia-tion difference is presented under Accumulated appropriations in the balance sheet.
Shares and participations belonging to investments of non-cur-rent assets are measured at fair value in compliance with the al-ternative method permitted under the Accounting Act, Section 5, Article 2a, if the fair value can be reliably determined.
Inventories
Inventories are recognised on the balance sheet, using the weight-ed average price method at either the amount of the immediate cost of the purchase or the reacquisition cost or the probable sell-ing price, whichever has the lowest value.
Financial assets and liabilities
Financial instruments are recognised, using an alternative meth-od, as allowed in section 2a, Chapter 5 of the Accounting Act, at fair value in accordance with the International Financial Re-porting Standards (IFRS). Financial assets and liabilities are rec-ognised on the balance sheet, using the settlement date basis. Financial instruments are classified as financial assets or liabilities measured at fair value through profit and loss, available-for-sale fi-nancial assets, loans and receivables and other financial liabilities.
The fair value of a financial instrument is determined on the ba-sis of prices quoted in active markets or by using measurement methods that are generally applied in the markets. The fair value of interest rate swaps has been determined by discounting future cash flows to the present by using the market rates of the balance sheet date. The counterparty's quoted price has been used in the valuation of interest rate options. The fair value of currency for-wards has been calculated by measuring the forward contracts at the forward rate of the balance sheet date. Electricity derivatives are measured at the fair value by using the market quotations of the balance sheet date. Financial assets and liabilities at fair value have been measured using average rates.
Derivative contracts in which hedge accounting is not applied are recognised in financial assets and liabilities to be measured at fair value through profit and loss. Financial assets or liabilities recognised at fair value through profit and loss are measured at
the market price of the closing date. The change in fair value is entered in the income statement in such a manner that the dif-ference between the value on the balance sheet date of the finan-cial instruments recognised at fair value in the income statement and the carrying value on the previous balance sheet is entered as the income or expense for the period. If the financial instrument recognised at fair value was acquired during the financial period, the difference between the value of the financial instrument on the balance sheet date and its acquisition cost is entered as the income or expense for the period.
The items recognised in available-for-sale financial assets are debt securities and other domestic and foreign securities and participa-tions that are not classified as financial assets at fair value through profit and loss, investments held to maturity, or loans and other receivables. Financial assets available for sale are measured at fair value. The fair value of publicly traded investments is defined on the basis of their market values. The change in fair value is re-corded in equity in the fair value reserve. When the financial in-strument is sold, the cumulative change in fair value cumulated in equity, together with accrued interest and capital gains or losses, is recognised in the income statement as a change in classification. Investments that are not publicly quoted are measured at cost if their fair values cannot be reliably determined.
Loans and other receivables include such financial assets unquot-ed on an active financial market, for which the payments are fixed or determinable and which do not belong to financial assets measured at fair value through profit and loss, financial assets held to maturity, or available-for-sale financial assets. The transaction costs of liabilities and receivables are included in the amortised acquisition cost calculated using the effective interest method and amortised through profit and loss for the term-to-maturity of the receivable. After the initial recognition, liabilities and receivables are measured at amortised acquisition cost using the effective in-terest method.
An item belonging to other financial liabilities is recognised in the balance sheet at its nominal value when its fair value at the time of its entry corresponds to the nominal value. If the debt capital received is less or more than the nominal value of the liability, the debt is measured at the amount that has been received for it. The amount recognised as expense or income for the financial period from the difference between the nominal value of the debt and cost of debt is amortised and recognised as an increase or decrease in the cost of debt. The difference between the nominal value and cost, or a fee or other expense that is associated with the debt and is included in the interest expense related to the debt, is amortised using the effective interest method as an expense for the term-to-maturity of the debt. Other financial liabilities are measured at the amortised cost on the balance sheet date using the effective interest method.
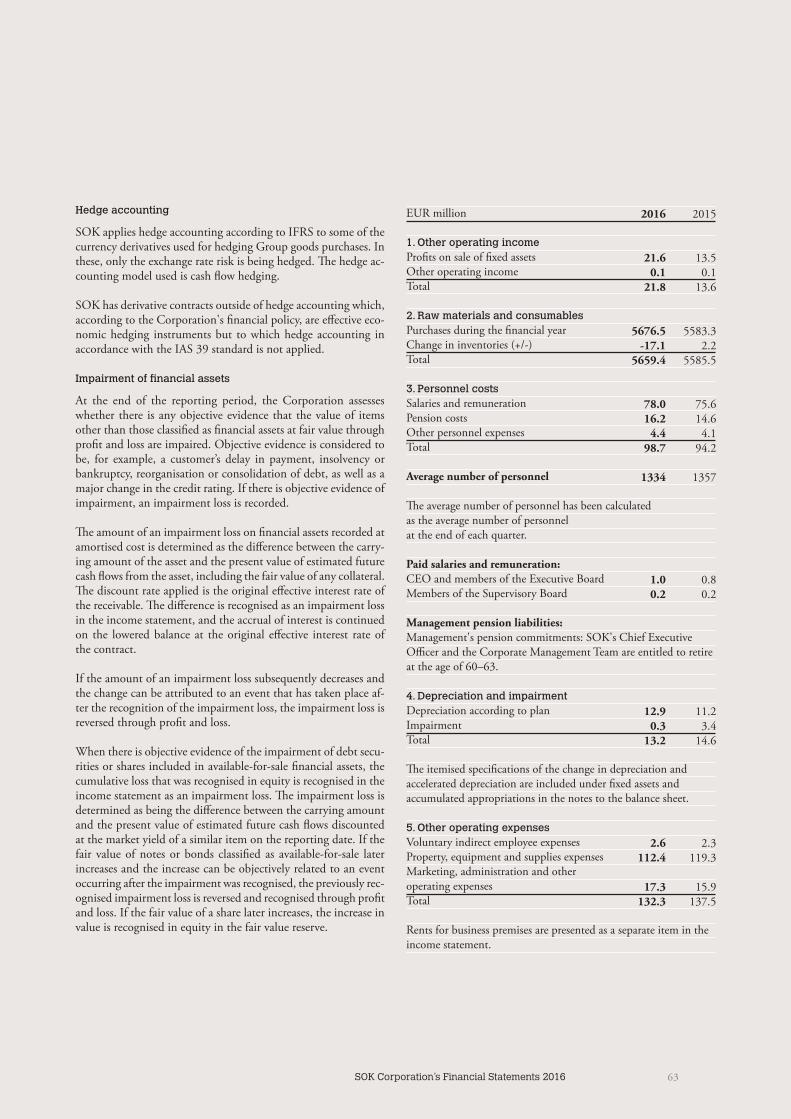
SOK Corporation’s Financial Statements 2016 63
Hedge accounting
SOK applies hedge accounting according to IFRS to some of the currency derivatives used for hedging Group goods purchases. In these, only the exchange rate risk is being hedged. The hedge ac-counting model used is cash flow hedging.
SOK has derivative contracts outside of hedge accounting which, according to the Corporation's financial policy, are effective eco-nomic hedging instruments but to which hedge accounting in accordance with the IAS 39 standard is not applied.
Impairment of financial assets
At the end of the reporting period, the Corporation assesses whether there is any objective evidence that the value of items other than those classified as financial assets at fair value through profit and loss are impaired. Objective evidence is considered to be, for example, a customer’s delay in payment, insolvency or bankruptcy, reorganisation or consolidation of debt, as well as a major change in the credit rating. If there is objective evidence of impairment, an impairment loss is recorded.
The amount of an impairment loss on financial assets recorded at amortised cost is determined as the difference between the carry-ing amount of the asset and the present value of estimated future cash flows from the asset, including the fair value of any collateral. The discount rate applied is the original effective interest rate of the receivable. The difference is recognised as an impairment loss in the income statement, and the accrual of interest is continued on the lowered balance at the original effective interest rate of the contract.
If the amount of an impairment loss subsequently decreases and the change can be attributed to an event that has taken place af-ter the recognition of the impairment loss, the impairment loss is reversed through profit and loss.
When there is objective evidence of the impairment of debt secu-rities or shares included in available-for-sale financial assets, the cumulative loss that was recognised in equity is recognised in the income statement as an impairment loss. The impairment loss is determined as being the difference between the carrying amount and the present value of estimated future cash flows discounted at the market yield of a similar item on the reporting date. If the fair value of notes or bonds classified as available-for-sale later increases and the increase can be objectively related to an event occurring after the impairment was recognised, the previously rec-ognised impairment loss is reversed and recognised through profit and loss. If the fair value of a share later increases, the increase in value is recognised in equity in the fair value reserve.
EUR million
1. Other operating incomeProfits on sale of fixed assetsOther operating incomeTotal
2. Raw materials and consumablesPurchases during the financial year Change in inventories (+/-)Total
3. Personnel costsSalaries and remunerationPension costsOther personnel expensesTotal
Average number of personnel
The average number of personnel has been calculated as the average number of personnel at the end of each quarter.
Paid salaries and remuneration:CEO and members of the Executive BoardMembers of the Supervisory Board
Management pension liabilities:Management's pension commitments: SOK's Chief Executive Officer and the Corporate Management Team are entitled to retire at the age of 60–63.
4. Depreciation and impairmentDepreciation according to planImpairmentTotal
The itemised specifications of the change in depreciation and accelerated depreciation are included under fixed assets and accumulated appropriations in the notes to the balance sheet.
5. Other operating expenses Voluntary indirect employee expensesProperty, equipment and supplies expensesMarketing, administration and other operating expensesTotal
Rents for business premises are presented as a separate item in the income statement.
2016
21.60.1
21.8
5676.5-17.1
5659.4
78.016.2
4.498.7
1334
1.00.2
12.90.3
13.2
2.6112.4
17.3132.3
2015
13.50.1
13.6
5583.32.2
5585.5
75.614.64.1
94.2
1357
0.80.2
11.23.4
14.6
2.3119.3
15.9137.5
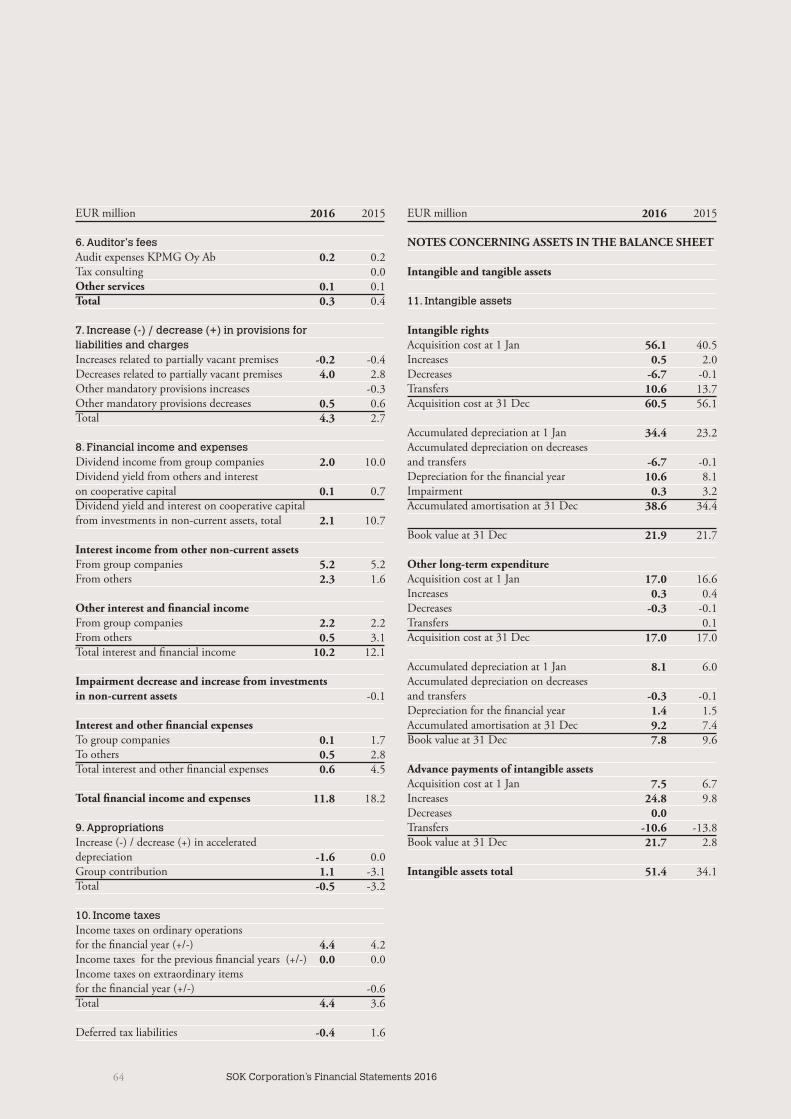
64 SOK Corporation’s Financial Statements 2016
EUR million
6. Auditor's feesAudit expenses KPMG Oy AbTax consultingOther servicesTotal
7. Increase (-) / decrease (+) in provisions for liabilities and chargesIncreases related to partially vacant premisesDecreases related to partially vacant premisesOther mandatory provisions increasesOther mandatory provisions decreasesTotal
8. Financial income and expensesDividend income from group companiesDividend yield from others and interest on cooperative capitalDividend yield and interest on cooperative capital from investments in non-current assets, total
Interest income from other non-current assetsFrom group companiesFrom others
Other interest and financial incomeFrom group companiesFrom othersTotal interest and financial income
Impairment decrease and increase from investments in non-current assets
Interest and other financial expensesTo group companiesTo othersTotal interest and other financial expenses
Total financial income and expenses
9. AppropriationsIncrease (-) / decrease (+) in accelerated depreciation Group contributionTotal
10. Income taxesIncome taxes on ordinary operationsfor the financial year (+/-)Income taxes for the previous financial years (+/-)Income taxes on extraordinary items for the financial year (+/-)Total
Deferred tax liabilities
EUR million
NOTES CONCERNING ASSETS IN THE BALANCE SHEET
Intangible and tangible assets
11. Intangible assets
Intangible rightsAcquisition cost at 1 JanIncreasesDecreasesTransfers Acquisition cost at 31 Dec
Accumulated depreciation at 1 JanAccumulated depreciation on decreases and transfersDepreciation for the financial yearImpairmentAccumulated amortisation at 31 Dec
Book value at 31 Dec
Other long-term expenditureAcquisition cost at 1 JanIncreasesDecreasesTransfers Acquisition cost at 31 Dec
Accumulated depreciation at 1 JanAccumulated depreciation on decreases and transfersDepreciation for the financial yearAccumulated amortisation at 31 DecBook value at 31 Dec
Advance payments of intangible assetsAcquisition cost at 1 JanIncreasesDecreasesTransfers Book value at 31 Dec
Intangible assets total
2016
0.2
0.10.3
-0.24.0
0.54.3
2.0
0.1
2.1
5.22.3
2.20.5
10.2
0.10.50.6
11.8
-1.61.1
-0.5
4.40.0
4.4
-0.4
2016
56.10.5
-6.710.660.5
34.4
-6.710.6
0.338.6
21.9
17.00.3
-0.3
17.0
8.1
-0.31.49.27.8
7.524.8
0.0-10.621.7
51.4
2015
0.20.00.10.4
-0.42.8
-0.30.62.7
10.0
0.7
10.7
5.21.6
2.23.1
12.1
-0.1
1.72.84.5
18.2
0.0-3.1-3.2
4.20.0
-0.63.6
1.6
2015
40.52.0
-0.113.756.1
23.2
-0.18.13.2
34.4
21.7
16.60.4
-0.10.1
17.0
6.0
-0.11.57.49.6
6.79.8
-13.82.8
34.1
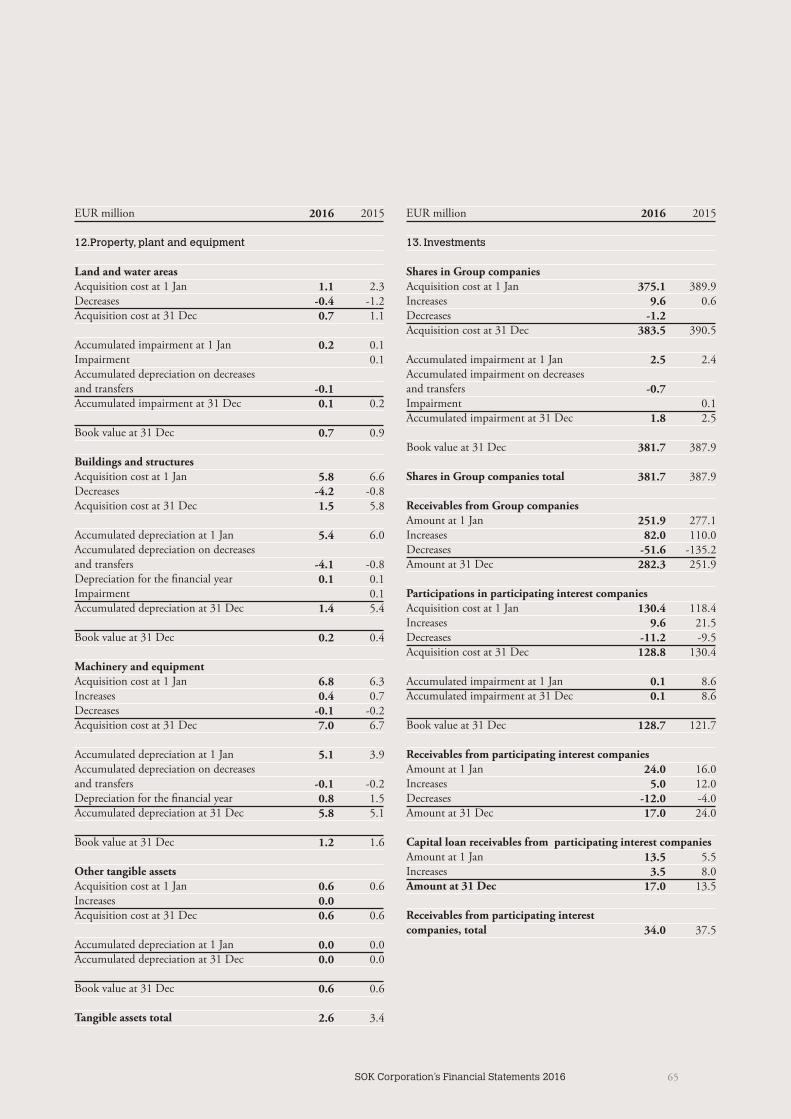
SOK Corporation’s Financial Statements 2016 65
EUR million
12.Property, plant and equipment
Land and water areasAcquisition cost at 1 JanDecreasesAcquisition cost at 31 Dec
Accumulated impairment at 1 JanImpairmentAccumulated depreciation on decreases and transfersAccumulated impairment at 31 Dec
Book value at 31 Dec
Buildings and structuresAcquisition cost at 1 JanDecreasesAcquisition cost at 31 Dec
Accumulated depreciation at 1 JanAccumulated depreciation on decreases and transfersDepreciation for the financial yearImpairment Accumulated depreciation at 31 Dec
Book value at 31 Dec
Machinery and equipmentAcquisition cost at 1 JanIncreasesDecreases Acquisition cost at 31 Dec
Accumulated depreciation at 1 JanAccumulated depreciation on decreases and transfersDepreciation for the financial yearAccumulated depreciation at 31 Dec
Book value at 31 Dec
Other tangible assetsAcquisition cost at 1 JanIncreasesAcquisition cost at 31 Dec
Accumulated depreciation at 1 JanAccumulated depreciation at 31 Dec
Book value at 31 Dec
Tangible assets total
EUR million
13. Investments
Shares in Group companiesAcquisition cost at 1 JanIncreases DecreasesAcquisition cost at 31 Dec
Accumulated impairment at 1 JanAccumulated impairment on decreases and transfersImpairment Accumulated impairment at 31 Dec
Book value at 31 Dec
Shares in Group companies total
Receivables from Group companiesAmount at 1 JanIncreasesDecreases Amount at 31 Dec
Participations in participating interest companiesAcquisition cost at 1 JanIncreasesDecreasesAcquisition cost at 31 Dec
Accumulated impairment at 1 JanAccumulated impairment at 31 Dec
Book value at 31 Dec
Receivables from participating interest companiesAmount at 1 JanIncreasesDecreasesAmount at 31 Dec
Capital loan receivables from participating interest companiesAmount at 1 JanIncreasesAmount at 31 Dec
Receivables from participating interest companies, total
2016
1.1-0.40.7
0.2
-0.10.1
0.7
5.8-4.21.5
5.4
-4.10.1
1.4
0.2
6.80.4
-0.17.0
5.1
-0.10.85.8
1.2
0.60.00.6
0.00.0
0.6
2.6
2016
375.19.6
-1.2383.5
2.5
-0.7
1.8
381.7
381.7
251.982.0
-51.6282.3
130.49.6
-11.2128.8
0.10.1
128.7
24.05.0
-12.017.0
13.53.5
17.0
34.0
2015
2.3-1.21.1
0.10.1
0.2
0.9
6.6-0.85.8
6.0
-0.80.10.15.4
0.4
6.30.7
-0.26.7
3.9
-0.21.55.1
1.6
0.6
0.6
0.00.0
0.6
3.4
2015
389.90.6
390.5
2.4
0.12.5
387.9
387.9
277.1110.0
-135.2251.9
118.421.5-9.5
130.4
8.68.6
121.7
16.012.0-4.024.0
5.58.0
13.5
37.5
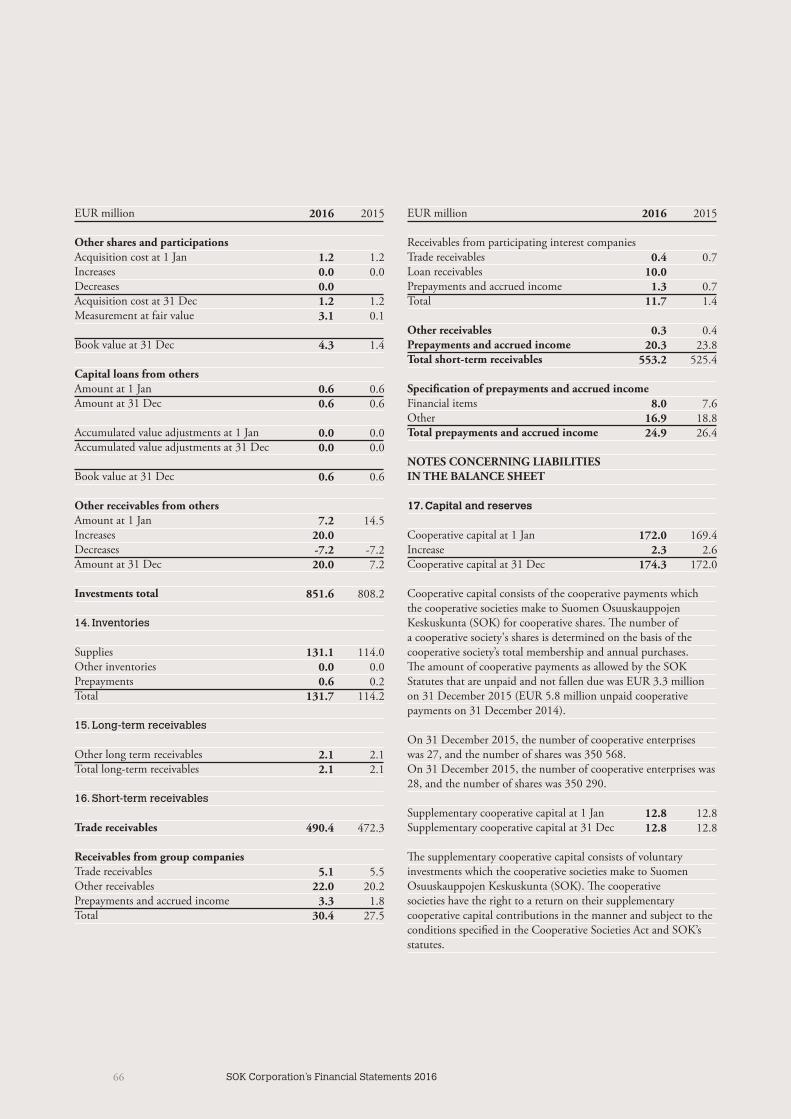
66 SOK Corporation’s Financial Statements 2016
EUR million
Other shares and participationsAcquisition cost at 1 JanIncreasesDecreases Acquisition cost at 31 DecMeasurement at fair value
Book value at 31 Dec
Capital loans from othersAmount at 1 JanAmount at 31 Dec
Accumulated value adjustments at 1 JanAccumulated value adjustments at 31 Dec
Book value at 31 Dec
Other receivables from othersAmount at 1 JanIncreasesDecreasesAmount at 31 Dec
Investments total
14. Inventories
SuppliesOther inventoriesPrepaymentsTotal
15. Long-term receivables
Other long term receivablesTotal long-term receivables
16. Short-term receivables
Trade receivables
Receivables from group companiesTrade receivablesOther receivablesPrepayments and accrued income Total
EUR million
Receivables from participating interest companiesTrade receivablesLoan receivablesPrepayments and accrued incomeTotal
Other receivablesPrepayments and accrued incomeTotal short-term receivables
Specification of prepayments and accrued incomeFinancial itemsOtherTotal prepayments and accrued income
NOTES CONCERNING LIABILITIES IN THE BALANCE SHEET
17. Capital and reserves
Cooperative capital at 1 JanIncreaseCooperative capital at 31 Dec
Cooperative capital consists of the cooperative payments which the cooperative societies make to Suomen Osuuskauppojen Keskuskunta (SOK) for cooperative shares. The number of a cooperative society's shares is determined on the basis of the cooperative society’s total membership and annual purchases. The amount of cooperative payments as allowed by the SOK Statutes that are unpaid and not fallen due was EUR 3.3 million on 31 December 2015 (EUR 5.8 million unpaid cooperative payments on 31 December 2014).
On 31 December 2015, the number of cooperative enterprises was 27, and the number of shares was 350 568. On 31 December 2015, the number of cooperative enterprises was 28, and the number of shares was 350 290.
Supplementary cooperative capital at 1 JanSupplementary cooperative capital at 31 Dec
The supplementary cooperative capital consists of voluntary investments which the cooperative societies make to Suomen Osuuskauppojen Keskuskunta (SOK). The cooperative societies have the right to a return on their supplementary cooperative capital contributions in the manner and subject to the conditions specified in the Cooperative Societies Act and SOK’s statutes.
2016
1.20.00.01.23.1
4.3
0.60.6
0.00.0
0.6
7.220.0-7.220.0
851.6
131.10.00.6
131.7
2.12.1
490.4
5.122.0
3.330.4
2016
0.410.0
1.311.7
0.320.3
553.2
8.016.924.9
172.02.3
174.3
12.812.8
2015
1.20.0
1.20.1
1.4
0.60.6
0.00.0
0.6
14.5
-7.27.2
808.2
114.00.00.2
114.2
2.12.1
472.3
5.520.21.8
27.5
2015
0.7
0.71.4
0.423.8
525.4
7.618.826.4
169.42.6
172.0
12.812.8

SOK Corporation’s Financial Statements 2016 67
EUR million
Fair value reserve at 1 JanDerivative instruments used to hedge cash flow Value change during the period Amount excluded from equity to income statementFinancial assets held for sale Value changes during the financial periodFair value reserve at 31 Dec 1)
1) Deferred taxes or tax assets are not as a rule presented in the income statements and balance sheets of SOK but only as a Note to the Financial Statements if the item is material in amount.
The valuations of derivatives in cash flow hedging relationships have been carried out by discounting future cash flows from the present value. The discounted value for cash flows other than those denominated in the euro has been converted into the euro using exchange rates quoted by the European Central Bank on the balance sheet date.
Financial assets available for sale include shares for which fair value cannot be determined.
Legal reserve at 1 JanLegal reserve at 31 Dec
Supervisory Board's disposal fund at 1 JanIncrease DecreaseSupervisory Board's disposal fund at 31 Dec
Profit for the previous financial years 1 JanTransfer to Supervisory Board's disposal fundInterest on supplementary cooperative capitalRedemption of supplementary cooperative capitalProfit for the previous financial years 31 DecProfit for the financial yearTotal capital and reserves
Distributable funds at 31 DecProfit for the previous financial years Profit for the financial yearTotal
EUR million
18. Accumulated appropriations
Accelerated depreciationIntangible rightsOther capitalised expenditureBuildings and constructionsMachinery and equipmentTotal
19. Provisions
Partially vacant premisesOther mandatory provisionsTotal
20. Long-term liabilities
Other long-term liabilitiesTotal long-term liabilities
21. Short-term liabilities
Trade payables
Liabilities to group companiesTrade payablesOther short-term liabilitiesAccruals and deferred incomeTotal
Amounts owed to participating interest companiesTrade payablesTotal
Other short-term liabilitiesAccruals and deferred incomeTotal short-term liabilities
Specification of accruals and deferred incomePersonnel costsFinancial itemsOtherTotal accruals and deferred income
2016
0.5
1.4
-0.4
3.04.5
18.518.5
0.00.10.00.0
566.8-0.1-5.9
-12.8548.1
46.4804.5
548.146.4
594.5
2016
4.73.0
-0.2-1.26.4
7.40.37.6
0.50.5
572.2
32.5146.2
6.1184.8
49.049.0
11.273.1
890.4
24.33.5
51.379.2
2015
1.5
0.4
-1.0
-0.30.5
18.518.5
0.00.10.00.0
525.8-0.1-0.2
525.641.2
770.5
525.641.2
566.8
2015
3.62.7
-0.3-1.24.8
11.20.7
11.9
0.70.7
554.7
24.7173.8
7.7206.3
40.540.5
7.472.5
881.5
22.55.8
51.980.3
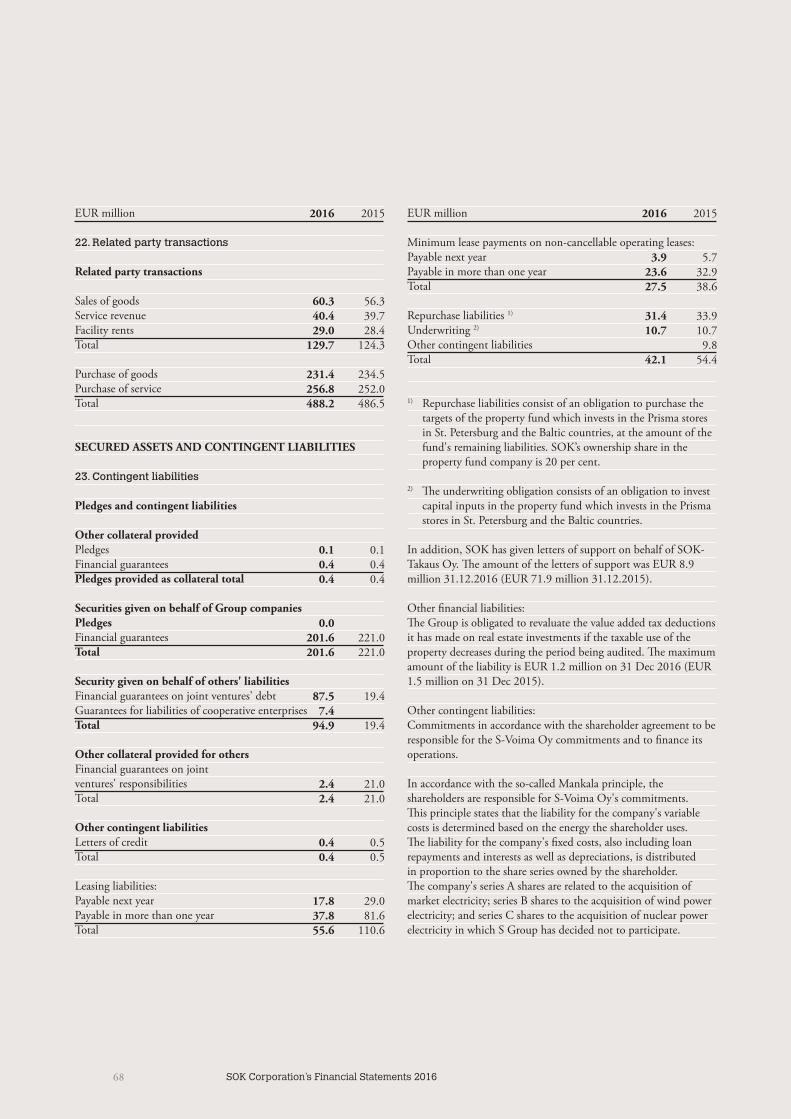
68 SOK Corporation’s Financial Statements 2016
EUR million
22. Related party transactions
Related party transactions
Sales of goodsService revenueFacility rentsTotal
Purchase of goodsPurchase of serviceTotal
SECURED ASSETS AND CONTINGENT LIABILITIES
23. Contingent liabilities
Pledges and contingent liabilities
Other collateral providedPledgesFinancial guaranteesPledges provided as collateral total
Securities given on behalf of Group companiesPledgesFinancial guaranteesTotal
Security given on behalf of others' liabilitiesFinancial guarantees on joint ventures' debtGuarantees for liabilities of cooperative enterprisesTotal
Other collateral provided for othersFinancial guarantees on joint ventures' responsibilitiesTotal
Other contingent liabilitiesLetters of creditTotal
Leasing liabilities:Payable next yearPayable in more than one yearTotal
EUR million
Minimum lease payments on non-cancellable operating leases:Payable next yearPayable in more than one yearTotal
Repurchase liabilities 1)
Underwriting 2)
Other contingent liabilitiesTotal
1) Repurchase liabilities consist of an obligation to purchase the targets of the property fund which invests in the Prisma stores in St. Petersburg and the Baltic countries, at the amount of the fund's remaining liabilities. SOK’s ownership share in the property fund company is 20 per cent.
2) The underwriting obligation consists of an obligation to invest capital inputs in the property fund which invests in the Prisma stores in St. Petersburg and the Baltic countries.
In addition, SOK has given letters of support on behalf of SOK-Takaus Oy. The amount of the letters of support was EUR 8.9 million 31.12.2016 (EUR 71.9 million 31.12.2015).
Other financial liabilities:The Group is obligated to revaluate the value added tax deductions it has made on real estate investments if the taxable use of the property decreases during the period being audited. The maximum amount of the liability is EUR 1.2 million on 31 Dec 2016 (EUR 1.5 million on 31 Dec 2015).
Other contingent liabilities:Commitments in accordance with the shareholder agreement to be responsible for the S-Voima Oy commitments and to finance its operations.
In accordance with the so-called Mankala principle, the shareholders are responsible for S-Voima Oy's commitments. This principle states that the liability for the company's variable costs is determined based on the energy the shareholder uses. The liability for the company's fixed costs, also including loan repayments and interests as well as depreciations, is distributed in proportion to the share series owned by the shareholder. The company's series A shares are related to the acquisition of market electricity; series B shares to the acquisition of wind power electricity; and series C shares to the acquisition of nuclear power electricity in which S Group has decided not to participate.
2016
60.340.429.0
129.7
231.4256.8488.2
0.10.40.4
0.0201.6201.6
87.57.4
94.9
2.42.4
0.40.4
17.837.855.6
2016
3.923.627.5
31.410.7
42.1
2015
56.339.728.4
124.3
234.5252.0486.5
0.10.40.4
221.0221.0
19.4
19.4
21.021.0
0.50.5
29.081.6
110.6
2015
5.732.938.6
33.910.79.8
54.4
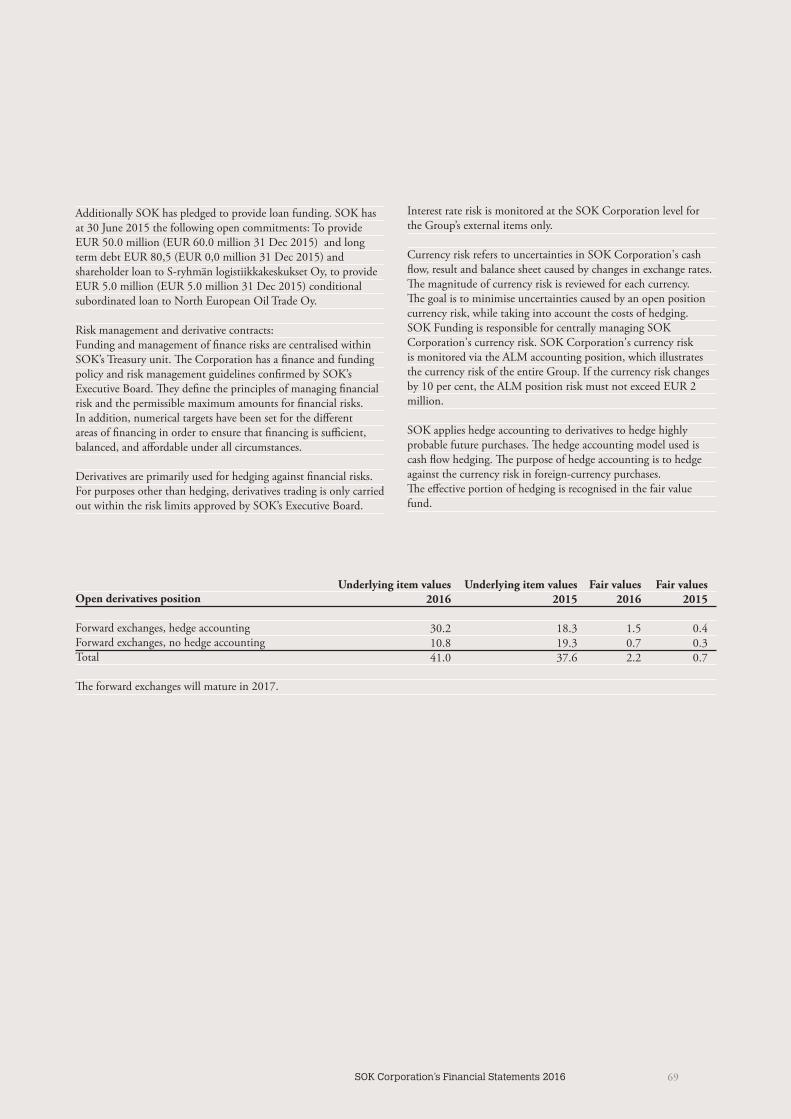
SOK Corporation’s Financial Statements 2016 69
Additionally SOK has pledged to provide loan funding. SOK has at 30 June 2015 the following open commitments: To provide EUR 50.0 million (EUR 60.0 million 31 Dec 2015) and long term debt EUR 80,5 (EUR 0,0 million 31 Dec 2015) and shareholder loan to S-ryhmän logistiikkakeskukset Oy, to provide EUR 5.0 million (EUR 5.0 million 31 Dec 2015) conditional subordinated loan to North European Oil Trade Oy.
Risk management and derivative contracts:Funding and management of finance risks are centralised within SOK’s Treasury unit. The Corporation has a finance and funding policy and risk management guidelines confirmed by SOK’s Executive Board. They define the principles of managing financial risk and the permissible maximum amounts for financial risks. In addition, numerical targets have been set for the different areas of financing in order to ensure that financing is sufficient, balanced, and affordable under all circumstances.
Derivatives are primarily used for hedging against financial risks. For purposes other than hedging, derivatives trading is only carried out within the risk limits approved by SOK’s Executive Board.
Open derivatives position
Forward exchanges, hedge accountingForward exchanges, no hedge accountingTotal
The forward exchanges will mature in 2017.
Interest rate risk is monitored at the SOK Corporation level for the Group’s external items only.
Currency risk refers to uncertainties in SOK Corporation's cash flow, result and balance sheet caused by changes in exchange rates. The magnitude of currency risk is reviewed for each currency. The goal is to minimise uncertainties caused by an open position currency risk, while taking into account the costs of hedging. SOK Funding is responsible for centrally managing SOK Corporation's currency risk. SOK Corporation's currency risk is monitored via the ALM accounting position, which illustrates the currency risk of the entire Group. If the currency risk changes by 10 per cent, the ALM position risk must not exceed EUR 2 million.
SOK applies hedge accounting to derivatives to hedge highly probable future purchases. The hedge accounting model used is cash flow hedging. The purpose of hedge accounting is to hedge against the currency risk in foreign-currency purchases. The effective portion of hedging is recognised in the fair value fund.
Underlying item values Underlying item values Fair values Fair values 2016 2015 2016 2015
30.2 18.3 1.5 0.4 10.8 19.3 0.7 0.3 41.0 37.6 2.2 0.7
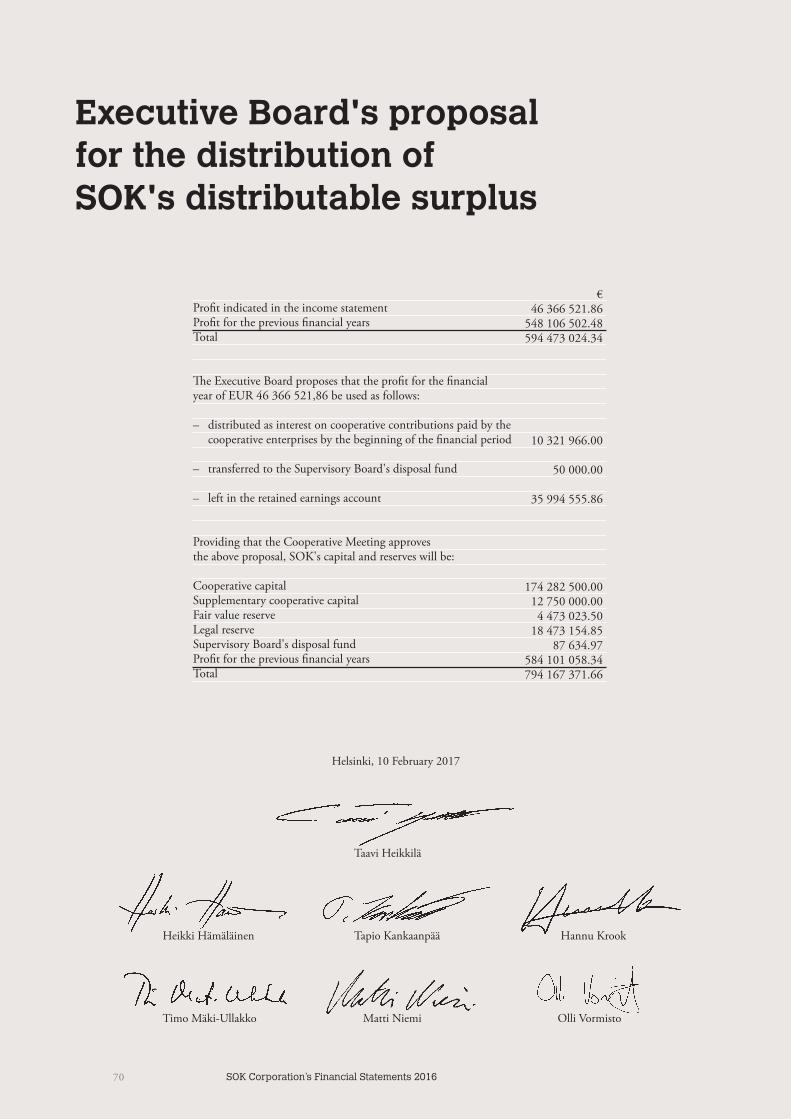
70 SOK Corporation’s Financial Statements 2016
Helsinki, 10 February 2017
Taavi Heikkilä
Heikki Hämäläinen Tapio Kankaanpää Hannu Krook
Timo Mäki-Ullakko Matti Niemi Olli Vormisto
Executive Board's proposal for the distribution of SOK's distributable surplus
Profit indicated in the income statementProfit for the previous financial yearsTotal
The Executive Board proposes that the profit for the financialyear of EUR 46 366 521,86 be used as follows:
– distributed as interest on cooperative contributions paid by the cooperative enterprises by the beginning of the financial period
– transferred to the Supervisory Board's disposal fund
– left in the retained earnings account
Providing that the Cooperative Meeting approvesthe above proposal, SOK's capital and reserves will be:
Cooperative capitalSupplementary cooperative capitalFair value reserveLegal reserveSupervisory Board's disposal fundProfit for the previous financial yearsTotal
€46 366 521.86
548 106 502.48594 473 024.34
10 321 966.00
50 000.00
35 994 555.86
174 282 500.0012 750 000.00
4 473 023.5018 473 154.85
87 634.97584 101 058.34794 167 371.66

SOK Corporation’s Financial Statements 2016 71
Auditor’s report
Executive Board's proposal for the distribution of SOK's distributable surplus
To the members of Suomen Osuuskauppojen Keskuskunta
Report on the Audit of the Financial Statements
Opinion
We have audited the financial statements of Suomen Osuuskaup-pojen Keskuskunta (business identity code 0116323-1) for the year ended 31 December, 2016. The financial statements com-prise the consolidated balance sheet, income statement, statement of comprehensive income, statement of changes in equity, state-ment of cash flows and notes, including a summary of significant accounting policies, as well as the parent cooperative’s balance sheet, income statement, statement of cash flows and notes.
In our opinion – the consolidated financial statements give a true and fair view
of the group’s financial performance, financial position and cash flows in accordance with International Financial Report-ing Standards (IFRS) as adopted by the EU
– the financial statements give a true and fair view of the parent cooperative’s financial performance and financial position in accordance with the laws and regulations governing the prepa-ration of financial statements in Finland and comply with statu-tory requirements.
Basis for Opinion
We conducted our audit in accordance with good auditing prac-tice in Finland. Our responsibilities under good auditing practice are further described in the Auditor’s Responsibilities for the Audit of the Financial Statements section of our report.
We are independent of the parent cooperative and of the group companies in accordance with the ethical requirements that are applicable in Finland and are relevant to our audit, and we have fulfilled our other ethical responsibilities in accordance with these requirements.
We believe that the audit evidence we have obtained is sufficient and appropriate to provide a basis for our opinion.
Responsibilities of the Board of Directors and the Managing Director for the Financial Statements
The Board of Directors and the Managing Director are responsi-ble for the preparation of consolidated financial statements that give a true and fair view in accordance with International Finan-cial Reporting Standards (IFRS) as adopted by the EU, and of financial statements that give a true and fair view in accordance with the laws and regulations governing the preparation of finan-cial statements in Finland and comply with statutory require-ments. The Board of Directors and the Managing Director are also responsible for such internal control as they determine is necessary to enable the preparation of financial statements that are free from material misstatement, whether due to fraud or error.
In preparing the financial statements, the Board of Directors and the Managing Director are responsible for assessing the par-ent cooperative’s and the group’s ability to continue as a going concern, disclosing, as applicable, matters relating to going con-cern and using the going concern basis of accounting. The fi-nancial statements are prepared using the going concern basis of accounting unless there is an intention to liquidate the parent co-operative or the group or cease operations, or there is no realistic alternative but to do so.
Auditor’s Responsibilities for the Audit of the Financial Statements
Our objectives are to obtain reasonable assurance on whether the financial statements as a whole are free from material misstate-ment, whether due to fraud or error, and to issue an auditor’s report that includes our opinion. Reasonable assurance is a high level of assurance, but is not a guarantee that an audit conduct-ed in accordance with good auditing practice will always detect a material misstatement when it exists. Misstatements can arise from fraud or error and are considered material if, individually or in aggregate, they could reasonably be expected to influence the economic decisions of users taken on the basis of the finan-cial statements.
As part of an audit in accordance with good auditing practice, we exercise professional judgment and maintain professional scep-ticism throughout the audit. We also: – Identify and assess the risks of material misstatement of the fi-
nancial statements, whether due to fraud or error, design and
72 SOK Corporation’s Financial Statements 2016
perform audit procedures responsive to those risks, and obtain audit evidence that is sufficient and appropriate to provide a basis for our opinion. The risk of not detecting a material misstate-ment resulting from fraud is higher than for one resulting from error, as fraud may involve collusion, forgery, intentional omis-sions, misrepresentations, or the override of internal control.
– Obtain an understanding of internal control relevant to the audit in order to design audit procedures that are appropriate in the circumstances, but not for the purpose of expressing an opinion on the effectiveness of the parent cooperative’s or the group’s internal control.
– Evaluate the appropriateness of accounting policies used and the reasonableness of accounting estimates and related disclo-sures made by management.
– Conclude on the appropriateness of the Board of Directors’ and the Managing Director’s use of the going concern basis of ac-counting and based on the audit evidence obtained, whether a material uncertainty exists related to events or conditions that may cast significant doubt on the parent cooperative’s or the group’s ability to continue as a going concern. If we conclude that a material uncertainty exists, we are required to draw at-tention in our auditor’s report to the related disclosures in the financial statements or, if such disclosures are inadequate, to modify our opinion. Our conclusions are based on the audit evidence obtained up to the date of our auditor’s report. How-ever, future events or conditions may cause the parent coopera-tive or the group to cease to continue as a going concern.
– Evaluate the overall presentation, structure and content of the financial statements, including the disclosures, and whether the financial statements represent the underlying transactions and events so that the financial statements give a true and fair view.
– Obtain sufficient appropriate audit evidence regarding the fi-nancial information of the entities or business activities within the group to express an opinion on the consolidated financial statements. We are responsible for the direction, supervision and performance of the group audit. We remain solely respon-sible for our audit opinion.We communicate with those charged with governance regard-
ing, among other matters, the planned scope and timing of the audit and significant audit findings, including any significant de-ficiencies in internal control that we identify during our audit.
Other Reporting Requirements
Other Information
The Board of Directors and the Managing Director are responsi-ble for the other information. The other information comprises information included in the report of the Board of Directors. Our opinion on the financial statements does not cover the other information.
In connection with our audit of the financial statements, our responsibility is to read the information included in the report of the Board of Directors and, in doing so, consider whether the information included in the report of the Board of Direc-tors is materially inconsistent with the financial statements or our knowledge obtained in the audit, or otherwise appears to be materially misstated. Our responsibility also includes considering whether the report of the Board of Directors has been prepared in accordance with the applicable laws and regulations.
In our opinion, the information in the report of the Board of Directors is consistent with the information in the financial state-ments and the report of the Board of Directors has been prepared in accordance with the applicable laws and regulations.
If, based on the work we have performed, we conclude that there is a material misstatement in the information included in the report of the Board of Directors, we are required to report this fact. We have nothing to report in this regard.
Helsinki, 17 March 2017
KPMG OY AB
Jukka RajalaAuthorised Public Accountant. KHT
SOK Corporation’s Financial Statements 2016 73
Statement by the Supervisory Board
According to Clause 1 of Subsection 1 of Section 13 of the SOK Corporation’s statutes, the Supervisory Board has today inspected the financial statements and consolidated financial statements prepared by the Executive Board for 2016, and has familiarised itself with the auditors report.
The Supervisory Board proposes that the cooperative meeting confirm the financial statements and the consolidated financialstatements and that the Executive Board’s proposal concerning the fiscal year’s result and equity be approved.
The following members are resigning from the Supervisory Board due to their three year term ending: Jorma Bergholm, Matti Timonen, Maija-Liisa Lindqvist, Mika Marttila, Anne Mäkelä, Pekka Ritvanen and Ilkka Ojala. The Supervisory Board proposes that the cooperative meeting choose seven new members to re-place the above mentioned for the next three years.
Helsinki, 30 March 2017
SUOMEN OSUUSKAUPPOJENKESKUSKUNTA
On behalf of the Supervisory Board
Matti Pikkarainen Seppo Kuitunen Chairman Secretary
74 SOK Corporation’s Financial Statements 2016
Suomen Osuuskauppojen Keskuskunta (SOK)Fleminginkatu 34, Helsinki, FinlandP.O.Box 1, FIN-00088 S-GROUPTel. +358 10 76 8011(0,0835 €/call + 0,1209 €/min)
www.s-kanava.fi