Embed Size (px)
Citation preview
TRANSPORTATION RESEARCH
RECORD No. 1414
Soils, Geology, and Foundations
Seginental Concrete MSE Walls, Geogrid Reinforceinents, and
Soil Nailing
A peer-reviewed publication of the Transportation Research Board
TRANSPORTATION RESEARCH BOARD NATIONAL RESEARCH COUNCIL
NATIONAL ACADEMY PRESS WASHINGTON, D.C. 1993
Transportation Research Record 1414 ISSN 0361-1981 ISBN 0-309-05562-8 Price: $23.00
Subscriber Category IHA soils, geology, and foundations
TRB Publications Staff Director of Reports and Editorial Services: Nancy A. Ackerman Associate Editor/Supervisor: Luanne Crayton Associate Editors: Naomi Kassabian, Alison G. Tobias Assistant Editors: Susan E. G. Brown, Norman Solomon Protluction Coordinator: Sharada Gilkey Office Manager: Phyllis D. Barber Senior Production Assistant: Betty L. Hawkins
Printed in the United States of America.
National Research Council. Transportation Research Board.
Sponsorship of Transportation Research Record 1414
GROUP 2-DESIGN AND CONSTRUCTION OF TRANSPORTATION FACILITIES Chairman: Charles T. Edson, Greenman Pederson
Soil Mechanics Section Chairman: Michael G. Katona, Air Force Civil Engineering
Laboratory
Committee on Foundations of Bridges and Other Sttuct~res Chairman: Joseph A. Caliendo, Utah State University Secretary: Richard P. Long, University of Connecticut Gregg Batchelder Adams, Roy H. Borden, Jean-Louis Briaud, Ronald G. Chassie, Murty S. Devata, Albert F. Dimillio, Victor Elias, Richard L. Engel, Roger Alain Frank, George G. Goble, Robert C. Houghton, Alan P. Kilian, John F. Ledbetter, Jr., Larry Lockett, James H. Long, Randolph W. Losch, William J. Lytle, Thom L. Neff, Gary M. Norris, Michael Wayne O'Neill, John L. Walkinshaw, Gdalyah Wiseman, James L. Withiam
Committee on Mechanics of Earth Masses and Layered Systems Chairman: Tien H. Wu, Ohio State University Walter R. Barker, Richard D. Barksdale, Richard J. Bathurst, Joseph A. Caliendo, Umakant Dash, Deborah J. Goodings, John S. Horvath, Mary E. Hynes, llan Juran, Glen E. Miller, Gerald P. Raymond, Harry E. Stewart, Harvey E. Wahls, John L. Walkinshaw
Committee on Geosynthetics Chairman: Robert K. Barrett, Colorado Department of Highways Tony M. Allen, Richard D. Barksdale, Richard J. Bathurst, Ryan R. Berg, Robert G. Carroll, Jr., Barry R. Christopher, Jerome A. Dimaggio, Graham R. Ford, Stephen M. Gale, Deborah J. Goodings, S. S. Dave Guram, Gary L. Hoffman, Robert D. Holtz, Robert M. Koerner, Larry Lockett, James H. Long, Verne C. McGuffey, R. Gordon McKeen, Bernard Myles, Malcolm L. Steinberg, John E. Steward, Fumio Tatsuoka, Steve L. Webster, Jonathan T. H. Wu, David C. Wyant
G. P. Jayaprakash, Transportation Research Board staff
Sponsorship is indicated by a footnote at the end of each paper. The organizational units, officers, and members are as of December 31, 1992.
Tra~sportation Research Record 1414
Contents
Foreword
Use of Segmental Wall System by Minnesota Department of Transportation James]. Hill and Ryan R. Berg
Issues Regarding Design and Specification of Segmental Block-Faced Geosynthetic Walls Tony M. Allen
Construction Considerations for Geogrid-Segmental Block Mechanically Stabilized Earth Retaining Walls
- Robert B. Anderson
Review of NCMA Segmental Retaining Wall Design Manual for Geosynthetic-Reinforced Structures Richard]. Bathurst, Michael R. Simac, and Ryan R. Berg
Laboratory Evaluation of Connection Strength of Geogrid to Segmental Concrete Units Kenneth E. Buttry, Earl S. McCullough, and Richard A. Wetzel
Connection Strength Criteria for Mechanically Stabilized Earth Walls James G. Collin and Ryan R. Berg
Internal Stability of Reinforced Soil Retaining Structures with Cohesive Backfills Y. H. Wang and M. C. Wang
Design and Construction of Two Low Retaining Wall Systems Restrained by Soil Nail Anchors Colin Alston and R. E. (Ernie) Crowe
v
1
6
12
16
26
32
38
49
Shallow Foundations on Geogrid-Reinforced Sand Maher T. Omar, Braja M. Das, Vijay K. Puri, Shing-Chung Yen, and Echol E. Cook
Ultimate Bearing Capacity of Eccentrically Loaded Strip Foundation on Geogrid-Reinforced Sand Kim Hock Khing, Braja M. Das, Vijay K. Puri, Shing-Chung Yen, and Echol E. Cook
59
65
Foreword
The 10 papers in this Record address segmental concrete wall systems, the use of geogrid for reinforcement of foundation soils, and soil nailing. The first six papers provide information on the design, construction, standards, and specifications of geosynthetic reinforced mechanically stabilized earth (MSE) retaining walls faced with segmental concrete blocks.
The next paper, by Wang and Wang, reports on performance data concerning the internal stability of retaining structures with cohesive soil backfill reinforced by polypropylene strips. The paper by Alston and Crowe presents two case histories that include information on the design, construction, and performance of low retaining wall systems that are laterally restrained by soil nail anchors. The final two papers discuss the results of laboratory model studies of strip and square foundati-0ns on geogrid-reinforced sand.
v
TRANSPORTATION RESEARCH RECORD 1414
Use of Segmental Wall System by Minnesota Department of Transportation
]AMES J. HILL AND RYAN R. BERG
Alternative wall systems are being used effectively as replacements for conventional cast-in-place concrete retaining walls. Combinations of concrete block and geogrids, and precast concrete items with cast-in-place concrete footings, have been constructed in recent years. However, guidelines for their de.sign and construction are necessary to minimize problems and obtain an aesthetically pleasing wall. Keeping the alignment of the wall straight using sound construction practices is essential. A competitively bid geogrid wall with its design and construction requirements is presented. A proprietary wall facing unit, Diamond Block, is discussed in terms of design and construction requirements. As an experimental project, the design and economy of this system was compared with the design and economy of castin-place concrete retaining walls. Results of the installation are given in the conclusion to aid designers in using the different wall systems. Recommendations are given that will lead to concise bid documents and a better final product with fewer construction problems.
Recent years have seen the use of new alternative retaining wall systems that use concrete segmental retaining wall (SRW) units. With the advent of these dry-cast segmental concrete products, new design and construction methodologies for retaining earth fills have been developed.
The wall system discussed is a mechanically stabilized earth (MSE) wall for a Minnesota Department of Transportation (MnDOT) project. Although this type of wall system has been in use elsewhere, it is new as an option on highway projects in Minnesota. The purpose of this paper is to present the design, specific materials used, and construction details of this wall system as used on this state highway project in Minnesota.
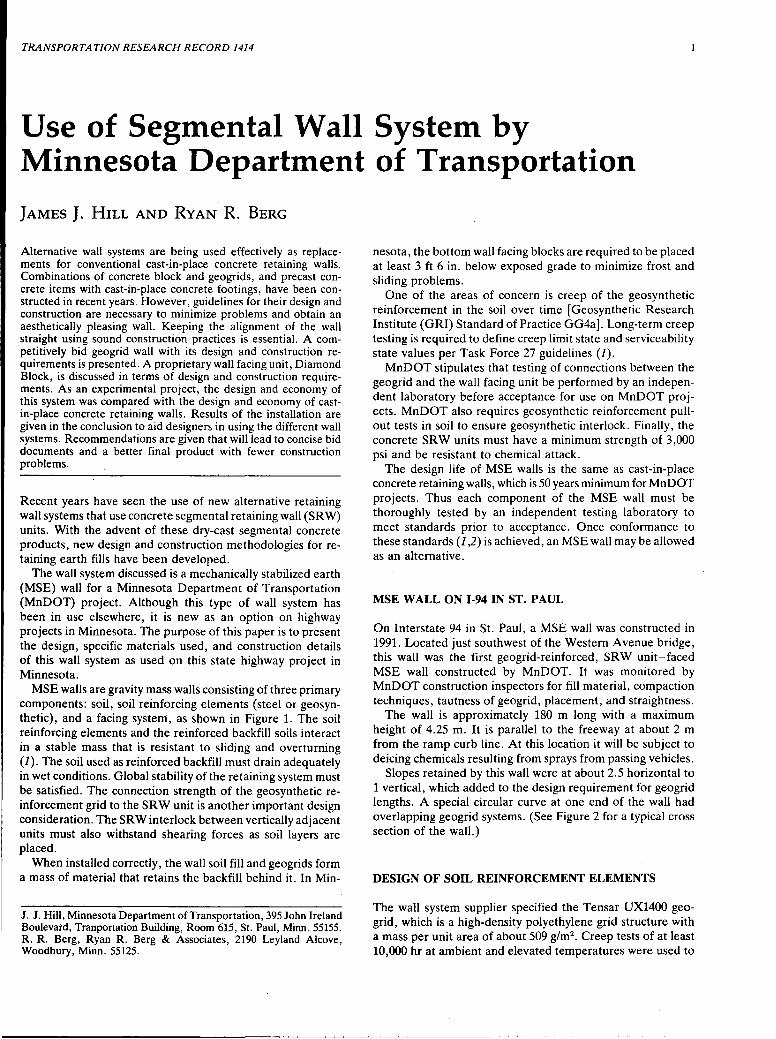
MSE walls are gravity mass walis consisting of three primary components: soil, soil reinforcing elements (steel or geosynthetic), and a facing system, as shown in Figure 1. The soil reinforcing elements and the reinforced backfill soils interact in a stable mass that is resistant to sliding and overturning (J). The soil used as reinforced backfill must drain adequately in wet conditions. Global stability of the retaining system must be satisfied. The connection strength of the geosynthetic reinforcement grid to the .SR W unit is another important design consideration. The SRW interlock between vertically adjacent units must also withstand shearing forces as soil layers are placed.
When installed correctly, the wall soil fill and geogrids form a mass of material that retains the backfill behind it. In Min-
J. J. Hill, Minnesota Department of Transportation, 395 John Ireland Boulevard, Tranportation Building, Room 615, St. Paul, Minn. 55155. R. R. Berg, Ryan R. Berg & Associates, 2190 Leyland Alcove, Woodbury, Minn. 55125.
nesota, the bottom wall facing blocks are required to be placed at least 3 ft 6 in. below exposed grade to minimize frost and sliding problems.
One of the areas of concern is creep of the geosynthetic reinforcement in the soil over time [ Geosynthetic Research Institute ( G RI) Standard of Practice GG4a]. Long-term creep testing is required to define creep limit state and serviceability state values per Task Force 27 guidelines (J).
MnDOT stipulates that testing of connections between the geogrid and the wall facing unit be performed by an independent laboratory before acceptance for use on MnDOT projects. MnDOT also requires geosynthetic reinforcement pullout tests in soil to ensure geosynthetic interlock. Finally, the concrete SRW units must have a minimum strength of 3,000 psi and be resistant to chemical attack.
The design life of MSE walls is the same as cast-in-place concrete retaining walls, which is 50 years minimum for MnDOT projects. Thus each component of the MSE wall must be thoroughly tested by an independent testing laboratory to meet standards prior to acceptance. Once conformance to these standards (J ,2) is achieved, an MSE wall may be allowed as an alternative.
MSE WALL ON 1-94 IN ST. PAUL
On Interstate 94 in St. Paul, a MSE wall was constructed in 1991. Located just southwest of the Western Avenue bridge, this wall was the first geogrid-reinforced, SRW unit-faced MSE wall constructed by MnDOT. It was monitored by MnDOT construction inspectors for fill material, compaction techniques, tautness of geogrid, placement, and straightness. . The wall is approximately 180 m long with a maximum height of 4.25 m. It is parallel to the freeway at about 2 m from the ramp curb line. At this location it will be subject to deicing chemicals resulting from sprays from passing vehicles.
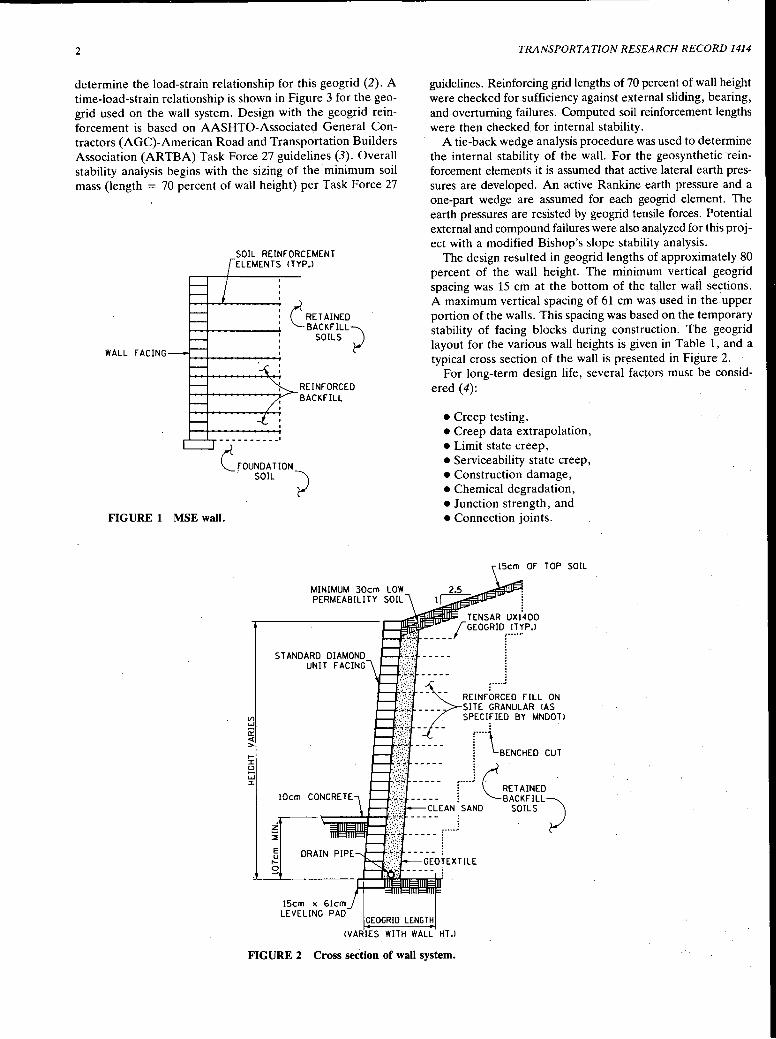
Slopes retained by this wall were at about 2.5 horizontal to 1 vertical, which added to the design requirement for geogrid lengths. A special circular curve at one end of the wall had overlapping geogrid systems. (See Figure 2 for a typical cross section of the wall.)
DESIGN OF SOIL REINFORCEMENT ELEMENTS
The wall system supplier specified the Tensar UX1400 geogrid, which is a high-density polyethylene grid structure with a mass per unit area of about 509 g/m2 • Creep tests of at least 10,000 hr at ambient and elevated temperatures were used to
2 TRANSPORTATION RESEARCH RECORD 1414
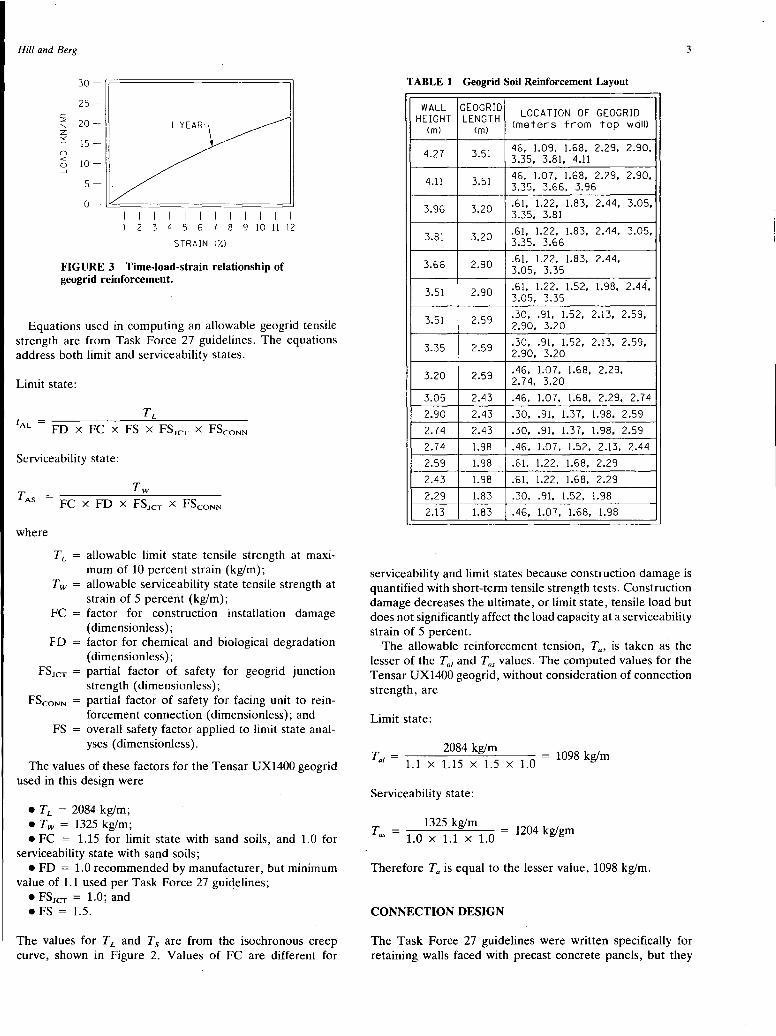
determine the load-strain relationship for this geogrid (2). A time-load-strain relationship is shown in Figure 3 for the geogrid used on the wall system. Design with the geogrid reinforcement is based on AASHTO-Associated General Contractors (AGC)-American Road and Transportation Builders Association (ARTBA) Task Force 27 guidelines (3). Overall stability analysis begins with the sizing of the· minimum soil mass (length = 70 percent of wall height) per Task Force 27
guidelines. Reinforcing grid lengths of 70 percent of wall height were checked for sufficiency against external sliding, bearing, and overturning failures. Computed soil reinforcement lengths were then checked. for internal stability.
A tie-back wedge analysis procedure was used to determine the internal stability of the wall. For the geosynthetic-reinforcement elements it is assumed that active lateral earth pressures are developed. An active Rankine earth pressure and a one-part wedge are assumed for each geogrid element. The earth pressures are resisted by geogrid tensile forces. Potential external and compound failures were also analyzed for this project with a modified Bishop's slope stability analysis.
WALL FACING
SOIL REINFORCEMENT ELEMENTS <TYP.l
r RETAINED \__BACKFILL)
SOILS ~
REINFORCED BACKFILL
The design resulted in geogrid lengths of approximately 80 percent of the wall height. The minimum vertical geogrid spacing was 15 cm at the bottom of the taller wali sections. A maximum vertical spacing of 61 cm was used in the upper portion of the walls. This spacing was based on the temporary stability of facing blocks during construction. The geogrid layout for the various wall heights is given in Table 1, and a typical cross section of the wall is presented in Figure 2.
For long-term design life, several factors must be consid-ered (4): ·
• Creep testing, •Creep data extrapolation,
(_FOUNDATION / SOIL )
• Limit state creep, • Serviceability state creep, • Construction damage, •Chemical degradation, •Junction strength, and • Connection joints. FIGURE 1 MSE wall.
VI w a= <(
> 1-:::c: 8 w :::c:
lOcm
MINIMUM 30cm LOW PERMEABILITY SOIL
TENSAR UXl.400
__ ~ __ f GEOGR!D (!P .l
TOP SOIL
:\J -}--REINF~~;ED FILL ON .:·J;_ _ _ _ _ _ SITE GRANULAR <AS .,-.:-:.: SPECIFIED BY MNDOTl
:;I,i ~~-~~ r·(·~BENCHED CUl
):~ ----- r···~ . RETAINED
};: .. _:: - - - -- l BACKFILL~ :,::::::. CLEAN SAND SOILS ~
';.~m-~R:~~~;tl--=i~:j~J ~ ~ ~ ~ ~ r-··-:.L----''-------
15cm x 6lcm LEVELING PAD
GEOGRID LENGTH
<VARIES WITH WALL HT.l
FIGURE 2 Cross section of wall system.
Hill and Berg
30 -
25-
~ 20-....... z ~ 15-0 <i: 10-0 _J
5-
0-I I I I I I I
1 2 3 4 5 6 7 8 9 10 11 12
STRAIN (/.)
FIGURE 3 Time-load-strain relationship of geogrid reinforcement.
Equations used in computing an allowable geogrid tensile strength are from Task Force 27 guidelines. The equations address both limit and serviceability states.
Limit state:
TL t =--------------AL FD x FC x FS X FSJcr X FScoNN
Serviceability state:
TAs = FC X FD X FSJcr X FScoNN
where
TL = allowable limit state tensile strength at maximum of 10 percent strain (kg/m);
T w = allowable serviceability state tensile strength at strain of 5 percent (kg/m);
FC = factor for construction installation damage (dimensionless);
FD = factor for chemical and biological degradation (dimensionless);
FSJcT = partial factor of safety for geogrid junction strength (dimensionless);
FScoNN = partial factor of safety for facing unit to reinforcement connection (dimensionless); and
FS = overall safety factor applied to limit state analyses (dimensionless).
The values of these factors for the Tensar UX1400 geogrid used in this design were
•TL = 2084 kg/m; • Tw = 1325 kg/m; • FC = 1.15 for limit state with sand soils, and 1.0 for
serviceability state with sand soils; • FD = 1.0 recommended by manufacturer, but minimum
value of 1.1 used per Task Force 27 guiqelines; • FS1cT = 1.0; and • FS = 1.5.
The values for TL and Ts are from the isochronous creep curve, shown in Figure 2. Values of FC are different for
3
TABLE 1 Geogrid Soil Reinforcement Layout
WALL GEOG RID LOCATION OF GEOGRIO HEIGHT LENGTH <meters from top wdlll Cml Cml
4.27 3.51 46, 1.09, 1.68, 2.29. 2.90, 3.35, 3.81, 4.11
4.11 3.51 46, 1.07' 1.68, 2.29, 2.90, 3.35, 3.66, 3.96
3.96 3.20 .61, 1.22, 1.83, 2.44, 3.05, 3.35, 3.81
3.81 3.20 .61, 1.22, 1.83, 2.44, 3.05, 3.35, 3.66
3.66 2.90 .61, 1.22, 1.83, 2.44, 3.05, 3.35
3.51 2.90 .61, 1.22, 1.52, 1.98, 2.44, 3.05, 3.35
3.51 2.59 .30, .91, 1.52, 2.13, 2.59, 2.90, 3.20
3.35 2.59 .30, .91, 1.52, 2.13, 2.59, 2.90, 3.20
3.20 2.59 .46, 1.07, 1.68, 2.29, 2.74, 3.20
3.05 2.43 .46, 1.07, 1.68, 2.29, 2.74
2.90 2.43 .30, .91, 1.37, 1.98, 2.59
2.74 2.43 .30, .91, 1.37, 1.98, 2.59
2.74 1.98 .46. 1.07, 1.52, 2.13. 2.44
2.59 1.98 .61, 1.22, 1.68, 2.29
2.43 1.98 .61, 1.22, 1.68, 2.29
2.29 1.83 .30, .91, 1.52, 1.98
2.13 1.83 .46, 1.07, 1.68, 1.98
serviceability and limit states because construction damage is quantified with short-term tensile strength tests. Construction damage decreases the ultimate, or limit state, tensile load but does not significantly affect the load capacity at a serviceability strain of 5 percent.
The allowable reinforcement tension, Ta, is taken as the lesser of the Tai and T as values. The computed values for the Tensar UX1400 geogrid, without consideration of connection strength, are
Limit state:
2084 kg/m TI = ------=----
a 1.1 X 1.15 X 1.5 X 1.0 1098 kg/m
Serviceability state:
T = 1325 kg/m = 1204 k I m as l.0 X 1.1 X 1.0 g g
Therefore Ta is equal to the lesser value, 1098 kg/m.
CONNECTION DESIGN
The Task Force 27 guidelines were written specifically for retaining walls faced with precast concrete panels, but they
4
can also be applied to walls faced with concrete blocks. The guidelines require that the proposed connection must be tested and capable of carrying 100 percent of the maximum design tensile load of the geosynthetic reinforcement. Thus the reinforcement design load may not be greater than the connection strength. Reinforcement load used in stability analyses is based on a maximum computed Ta but can be limited to lower values by connection strength.
The connection between the Diamond concrete block facing unit and the Tensar geogrid has been tested at the University of Wisconsin at Platteville (5). Connection strength tests were conducted at varying normal pressure, with the geogrid pulled at a displacement rate of 13 mm/min. A summary of test results from their work is given in the following table:
Normal Pressure (kglm2 )
1318 2344 3516
Connection Tensile Strength (kg/m)
580 997
1310
These relationships were used in design to factor the allowable strength of geogrids, as applicable. Typically, the connection strength does not control except for geogrid locations near the top of the wall. Full allowable strength, Ta, of the geogrid can be mobilized by the connection 1.37 m below top of wall, assuming a vertical faced wall.
WALL FACING BLOCKS
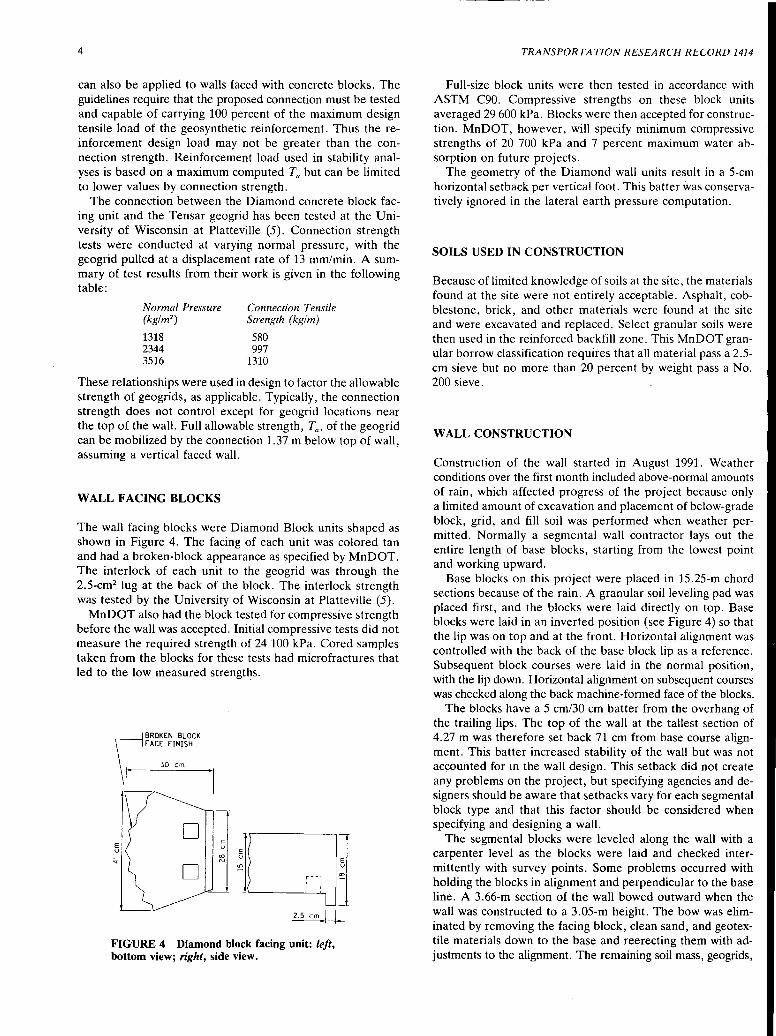
The wall facing blocks were Diamond Block units shaped as shown in Figure 4. The facing of each unit was colored tan and had a broken-block appearance as specified by MnDOT. The interlock of each unit to the geogrid was through the 2.5-cm2 lug at the back of the block. The interlock strength was tested by the University of Wisconsin at Platteville (5).
MnDOT also had the block tested for compressive strength before the wall was accepted. Initial compressive tests did not measure the required strength of 24 100 kPa. Cored samples taken from the blocks for these tests had microfractures that led to the low measured strengths.
\,
BROKEN BLOCK FACE FINISH
30 cm 1·
D E u
:;
D ~JQ~ 5
CX) N
2.5 cm / /
FIGURE 4 Diamond block facing unit: left, bottom view; right, side view.
TRANSPORTATION RESEARCH RECORD 1414
Full-size block units were then tested in accordance with ASTM C90. Compressive strengths on these block units averaged 29 600 kPa. Blocks were then accepted for construction. MnDOT, however, will specify minimum compressive strengths of 20 700 kPa and 7 percent maximum water absorption on future projects.
The geometry of the Diamond wall units result in a 5-cm horizontal setback per vertical foot. This batter was conservatively ignored in the lateral earth pressure computation.
SOILS USED IN CONSTRUCTION
Because of limited knowledge of soils at the site, the materials found at the site were not entirely acceptable. Asphalt, cobblestone, brick, and other materials were found at the site and were excavated and replaced. Select granular soils were then used in the reinforced backfill zone. This MnDOT granular borrow classification requires that all material pass a 2.5-cm sieve but no more than 20 percent by weight pass a No. 200 sieve.
WALL CONSTRUCTION
Construction of the wall started in August 1991. Weather conditions over the first month included above-normal amounts of rain, which affected progress of the project because only a limited amount of excavation and placement of below-grade block, grid, and fill soil was performed when weather permitted. Normally a segmental wall contractor lays out the entire length of base blocks, starting from the lowest point and working upward.
Base blocks on this project were placed in 15.25-m chord sections because of the rain. A granular soil leveling pad was placed first, and the blocks were laid directly on top. Base blocks were laid in an inverted position (see Figure 4) so that the lip was on top and at the front. Horizontal alignment was controlled with the back of the base block lip as a reference. Subsequent block courses were laid in the normal position, with the lip down. Horizontal alignment on subsequent courses was checked along the back machine-formed face of the blocks.
The blocks have a 5 cm/30 cm batter from the overhang of the trailing lips. The top of the wall at the tallest section of 4.27 m was therefore set back 71 cm from base course alignment. This batter increased stability of the wall but was not accounted for in the wall design. This setback did not create any problems on the project, but specifying agencies and designers should be aware that setbacks vary for each segmental block type and that this factor should be considered when specifying and designing a wall.
The segmental blocks were leveled along the wall with a carpenter level as the blocks were laid and checked intermittently with survey points. Some problems occurred with holding the blocks in alignment and perpendicular to the base line. A 3.66-m section of the wall bowed outward when the wall was constructed to a 3.05-m height. The bow was eliminated by removing the facing block, clean sand, and geotextile materials down to the base and reerecting them with adjustments to the alignment. The remaining soil mass, geogrids,
Hill and Berg
and soil fill stood vertically for 2 days without any problems as this reconstruction was completed.
The cause of this bowing problem was not conclusively established. Possible causes were the wet construction, the facing block's being erected slightly off level (not perpendicular to wall alignment), and the bowing's not being noticeable until a height of 3.05 m was reached. Erection procedures of fill placement, geogrid tension, and soil compaction may also have been causes, even though these procedures were held fairly constant. The wall drain detail was also a possible problem. A 37-cm width of pearock was placed behind the blocks, with a MnDOT Type 2 geotexile separating the rock from the wall fill soil. This rock was rounded and uniform and provided only a relatively small amount of shear resistance to hold the blocks in place. Finally, the wall was built in sections rather than continuously, which did not allow good alignment procedures.
MnDOT paid for reconstruction of the portion of wall that bulged outward, as tolerances were not set forth in the specifications. Acceptable tolerances were then set for the remaining wall erection, and the use of the pearock material was discontinued. The geotexile was placed directly against the segmental block face and a cleaner sand (less than 8 percent passing No. 200 sieve) placed for a 37-cm vertical width behind the geotextile. The. changes helped achieve a uniform wall alignment, but three subsequent wall sections still had to be rebuilt.
The wall and grading subcontractors and prime contractor disagreed over who was responsible for placing the _sloped portion of the soil fill section and to what compaction standards it needed to be constructed. The designer raised concerns that the sloped soil section on top of the reinforced mass was a necessary part of the wall system used in the stability analyses. The problem was resolved, and a 3:1 sloped fill section was constructed in accord~nce with wall fill compaction requirements.
Some soil spilled over the top of wall and was deposited on exposed horizontal portions of the segmental blocks during construction. The suppliers and contractors agreed to clean the face of the wall, after sodding and seeding was completed above the wall, even though this was not strictly required by specifications.
CONCLUSIONS
On the basis of experiences with this alternative retaining wall, the following conclusions are recommended for future MnDOT projects:
• Soil borings should be performed along the proposed wall alignment to determine the type of soils, water level, and
5
such. These borings should be given on the contract plan for use by contractors and suppliers.
• Reinforced backfill soils of select granular material with less than 15 percent passing the No. 200 sieve should be used, per AASHTO recommendations.
• Wall fill zone should be defined a~ shown in Figure 2 to ensure proper soil masses and compaction.
• Only SR W systems approved by the contracting agency should be listed as alternatives in the contract. Certification of facing unit and geogrid properties to meet the requirements of the designer or agency is necessary in advance of contract letting.
• Horizontal and vertical alignment tolerances need to be defined in the specifications: 1 cm in 1 m, both vertically and horizontally, is recommended.
• Specification requirements for compression and moisture absorption for wall SRW units should be set on a project basis.
• Design of segmental block walls shall be based on AASHTO Task Force 27 guidelines and AASHTO Interim Specifications for Highway Walls.
• Measurement and payment on these walls should be based on square meter of vertical wall face, yet unit cost of reinforcement and drains should be required on bid forms to provide a basis of cost change for any substantial post-award changes.
•Final acceptance criteria include provisions for cleaning the wall face, because erection procedures result in soil deposits on the SRW units.
REFERENCES
1. Design Guidelines for Use of Extensible Reinforcements (Geosynthetic) for Mechanically Stabilized Earth Walls in Permanent Applications. Task Force 27, AASHTO-AGC-ARTBA Committee on Materials, AASHTO, Washington, D.C., 1990.
2. Berg, R. R., D. G. Larson, and V. L. Barron. Specification, Design and Construction of the 1-94 Segmental Block Wall. Presented at 40th Annual Geotechnical Conference, University of Minnesota, 1992.
3. Standard Specifications for Highway Bridges, 14th ed with Interim Specifications. AASHTO, Washington, D.C., 1991.
4. Berg, R. R., V. E. Chavery-Curtis, and C. H. Watson. Critical Failure Planes in Analysis of Reinforced Slopes. Proc., Geosynthetics '89 Conference, San Diego, Calif., Feb. 1989.
5. Buttry, K., E. McCullough, and R. Wetzell. Testing of Diamond Block Retaining Wall System. Final report. Department of Civil Engineering, University of Wisconsin-Platteville, Platteville, Oct. 1990.
Publication of this paper sponsored by Committee on Geosynthetics.
6 TRANSPORTATION RESEARCH RECORD 1414
Issues Regarding Design and Specification of Segmental Block-Faced Geosynthetic Walls
TONY M. ALLEN
Many facing block and geosynthetic reinforcement choices are available to the designer of segmental block-faced geosynthetic walls. Because of the newness and rapid growth of this industry, technology development has lagged behind implementation, leaving the designer without the all of the tools necessary for wall design and material selection. The key issues that must be addressed to properly design and specify a segmental block-faced geosynthetic wall are discussed, including selection of block size and geometry, selection and spacing of geosynthetic reinforcement, selection of design parameters (including wall face connection strength), the effect of seismic loads on the wall system, and wall specification. Research is recommended for poorly defined aspects of segmental block-faced geosynthetic wall design.
Segmental block-faced geosynthetic walls have rapidly found a niche in the wall construction industry since their introduction in the mid-1980s, largely because of their costeffectiveness and aesthetically pleasing appearance. Rapid growth has resulted in many companies that supply blocks of various sizes, shapes, and colors. The many options can leave a designer bewildered, since these blocks can be combined with a variety of reinforcement geosynthetics.
Are all blocks appropriate for use with all geosynthetics? What are the design issues and parameters that must be considered? What methods are appropriate for determining the design parameters? The engineer must ask such questions if a safe, cost-effective wall design is to be obtained.
Once the wall design is completed, construction specifications must be developed: Should wall facing blocks and geosynthetic reinforcement be specified generically, or must some or all of the wall components be specified from an approved list of products? What testing standards are available for specification of concrete block and geosynthetic properties? The engineer must also ask such questions to ensure that the design matches what is actually constructed.
This paper gives the designer an understanding of the key issues that must be addressed if a wall is to be properly designed and constructed; the paper is not a state-of-the-art design summary for these wall systems. Design procedures for geosynthetic walls can be found in other works (1-4, and the paper by Bathurst et al. in this Record). Currently, the minimum dimensions and stability of the segmental facing blocks are not specifically designed in practice because of a lack of facing design procedures ( 5).
Washington State Department of Transportation, HQ Materials Laboratory, P.O. Box 167, Olympia, Wash. 98504.
DESIGN ISSUES
These wall systems consist of three main components: the concrete block facing, the geosynthetic reinforcement, and the soil backfill. This discussion focuses on the manufactured components of the wall-that is, the facing and geosynthetic reinforcement. The soil is discussed only in terms of its effect on the other two main wall components.
Segmental Facing Blocks
The variables that affect facing block selection and design include block geometry, manner in which the blocks fit together, block material properties, and aesthetics. Facing stiffness, stability, and constructability are affected by these variables. ,
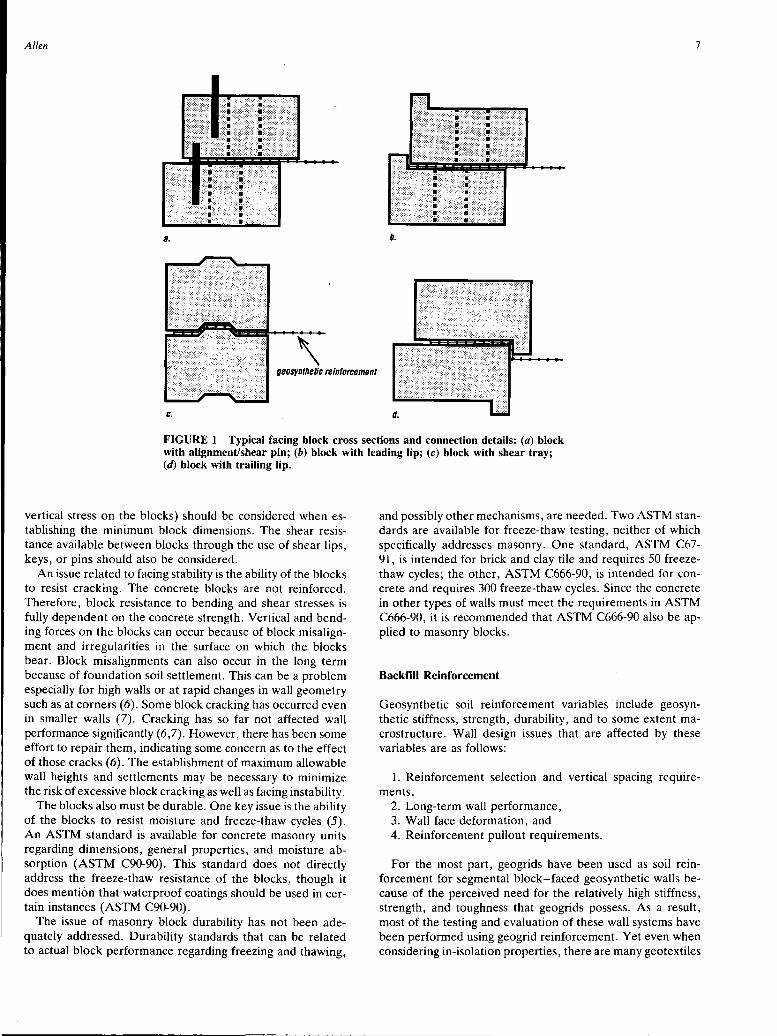
The masonry facing blocks are unreinforced concrete. They have various shapes and sizes, as shown in Figure 1. The various shapes accommodate different block and geosynthetic connection details and a variety in aesthetics. The blocks are typically 100 to 760 mm (4 to 30 in.) in height and 200 to 760 mm (8 to 30 in.) in width. Figure 1 also shows how the geosynthetic reinforcement is connected to the facing blocks.
The largest block types tend to provide the stiffest and most stable face, whereas the smaller block types tend to provide the most flexible and least stable face. The facing should not be so slender that the face bulges or buckles between reinforcement layers or topples above the top reinforcing layer. Hence, it is not desirable to use the smallest blocks available to form the facing for large walls, say, 9 to 12 m (30 to 40 ft) in height. Certainly, some large walls have been built using one of the larger facing blocks available (6). Such examples do not prove that smaller blocks or blocks with different geometries can also be used successfully for large walls, or that they have a desirable factor of safety for stability (i.e., maybe the factor of safety is just over 1.0).
Design procedures do not exist that allow the designer to determine directly the minimum dimensions and block geometry required to ensure facing stability between reinforcement layers. Indirectly, minimum block sizes are established to prevent geosynthetic reinforcement pullout from the facing blocks. This minimum block size may also be adequate for facing stability. The establishment of a minimum }?lock size to ensure facing stability is recommended.
The vertical spacing of .soil reinforcement, how well the blocks fit together, and the wall height (i.e., the maximum
Allen 7
a. b.
\ 11eosynthetic reinforcement
c. d.
FIGURE 1 Typical facing block cross sections and connection details: (a) block with alignment/shear pin; (b) block with leading lip; (c) block with shear tray; (d) block with trailing lip.
vertical stress on the blocks) should be considered when establishing the minimum block dimensions. The shear resistance available between blocks through the use of shear lips, keys, or pins should also be considered.
An issue related to facing stability is the ability of the blocks to resist cracking. The concrete blocks are not reinforced. Therefore, block resistance to bending and shear stresses is fully dependent on the concrete strength. Vertical and bending forces on the blocks can occur because of block misalignment and irregularities in the surface on which the blocks bear. Block misalignments can also occur in the long term because of foundation soil settlement. This can be a problem especially for high walls or at rapid changes in wall geometry such as at corners ( 6). Some block cracking has occurred even in smaller walls (7). Cracking has so far not affected wall performance significantly (6,7). However, there has been some effort to repair them, indicating some concern as to the effect of those cracks ( 6). The establishment of maximum allowable wall heights and settlements may be necessary to minimize the risk of excessive block cracking as well as facing instability.
The blocks also must be durable. One key issue is the ability of the blocks to resist moisture and freeze-thaw cycles (5). An ASTM standard is available for concrete masonry units regarding dimensions, general properties, and moisture absorption (ASTM C90-90). This standard does not directly address the freeze-thaw resistance of the blocks, though it does mention that waterproof coatings should be used in certain instances (ASTM C90-90).
The issue of masonry block durability has not been adequately addressed. Durability standards that can be related to actual block performance regarding freezing and thawing,
and possibly other mechanisms, are needed. Two ASTM standards are available for freeze-thaw testing, neither of which specifically addresses masonry. One standard, ASTM C67-91, is intended for brick and clay tile and requires 50 freezethaw cycles; the other, ASTM C666-90, is intended for concrete and requires 300 freeze-thaw cycles. Since the concrete in other types of walls must meet the requirements in ASTM C666-90, it is recommended that ASTM C666-90 also be applied to masonry blocks.
Backfill Reinforcement
Geosynthetic soil reinforcement variables ·include geosynthetic stiffness, strength, durability, and to some extent macrostructure. Wall design issues that are affected by these variables are as follows:
1. Reinforcement selection and vertical spacing require-ments,
2. Long-term wall performance, 3. Wall face deformation, and 4. Reinforcement pullout requirements.
For the most part, geogrids have been used as soil reinforcement for segmental block-faced geosynthetic walls because of the perceived need for the relatively high stiffness, strength, and toughness that geogrids possess. As a result, most of the testing and evaluation of these wall systems have been performed using geogrid reinforcement. Yet even when considering in-isolation properties, there are many geotextiles
8
available that possess comparable stiffness, strength, and toughness.
Therefore geotextile reinforcement should be considered for use with segmental block facing. The testing performed on the geogrid reinforcements for segmental block walls needs to be extended to geotextile reinforcement. Such testing includes long-term creep strength and durability characteristics and the strength of the facing connection with the reinforcement.
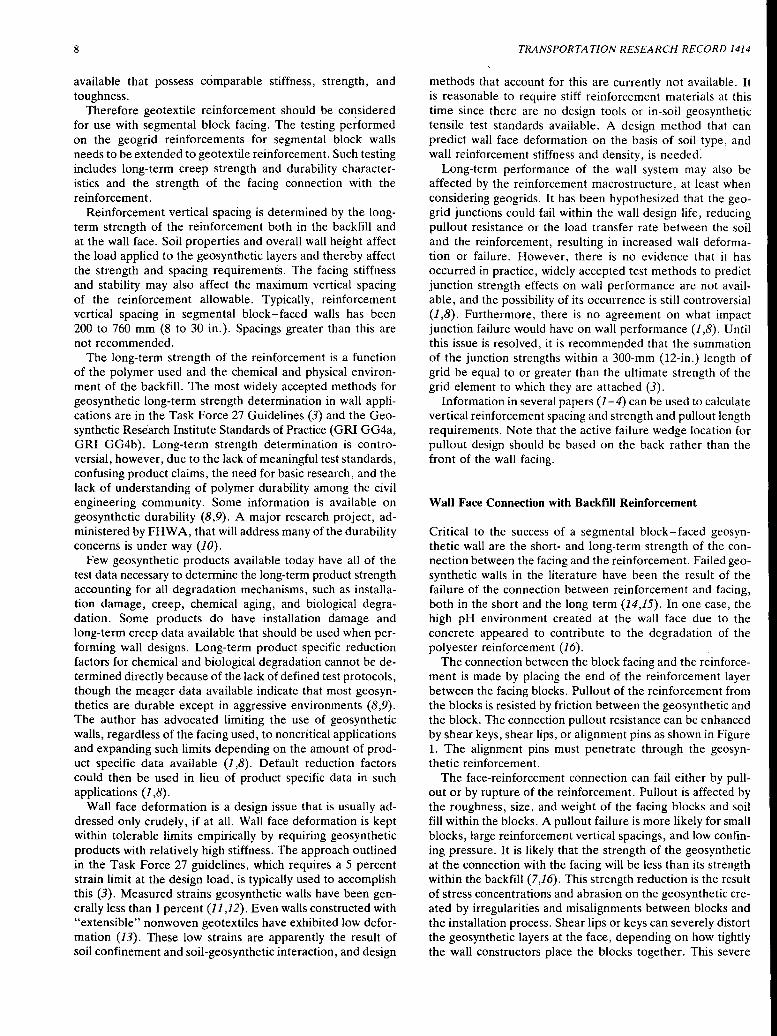
Reinforcement vertical spacing is determined by the longterm strength of the reinforcement both in the backfill and at the wall face. Soil properties and overall wall height affect the load applied to the geosynthetic layers and thereby affect the strength and spacing requirements. The facing stiffness and stability may also affect the maximum vertical spacing of the reinforcement allowable. Typically, reinforcement vertical spacing in segmental block-faced walls has been 200 to 760 mm (8 to 30 in.). Spacings greater than this are not recommended.
The long-term strength of the reinforcement is a function of the polymer used and the chemical and physical environment of the backfill. The most widely accepted methods for geosynthetic long-term strength determination in wall applications are in the Task Force 27 Guidelines (3) and the Geosynthetic Research Institute Standards of Practice (GRI GG4a, GRI GG4b). Long-term strength determination is controversial, however, due to the lack of meaningful test standards, confusing product claims, the need for basic research, and the lack of understanding of polymer durability among the civil engineering community. Some information is available on geosynthetic durability (8,9). A major research project, administered by FHWA, that will address many of the durability concerns is under way (10).
Few geosynthetic products available today have all of the test data necessary to determine the long-term product strength accounting for all degradation mechanisms, such as installation damage, creep, chemical aging, and biological degradation. Some products do have installation damage and long-term creep data available that should be used when performing wall designs. Long-term product specific reduction factors for chemical and biological degradation cannot be determined directly because of the lack of defined test protocols, though the meager data available indicate that most geosynthetics are durable except in aggressive environments (8,9). The author has advocated limiting the use of geosynthetic walls, regardless of the facing used, to noncritical applications and expanding such limits depending on the amount of product specific data available (1,8). Default reduction factors could then be used in lieu of product specific data in such applications (1,8).
Wall face deformation is a design issue that is usually addressed only crudely, if at all. Wall face deformation is kept within tolerable limits empirically by requiring geosynthetic products with relatively high stiffness. The approach outlined in the Task Force 27 guidelines, which requires a 5 percent strain limit at the design load, is typically used to accomplish this (3). Measured strains geosynthetic walls have been generally less than 1 percent (11,12). Even walls constructed with "extensible" nonwoven geotextiles have exhibited low deformation (13). These low strains are apparently the result of soil confinement and soil-geosynthetic interaction, and design
TRANSPORTATION RESEARCH RECORD 1414
methods that account for this are currently not available. It is reasonable to require stiff reinforcement materials at this time since there are no design tools or in-soil geosynthetic tensile test standards available. A design method that can predict wall face deformation on the basis of soil type, and wall reinforcement stiffness and density, is needed:
Long-term performance of the wall system may also be affected by the reinforcement macrostructure, at least when considering geogrids. It has been hypothesized that the geogrid junctions could fail within the wall design life, reducing pullout resistance or the load transfer rate between the soil and the reinforcement, resulting in increased wall deformation or failure. However, there is no evidence that it has occurred in practice, widely accepted test methods to predict junction strength effects on wall performance are not available, and the possibility of its occurrence is still controversial (1,8). Furthermore, there is no agreement on what impact junction failure would have on wall performance (1,8). Until this issue is resolved, it is recommended that the summation of the junction strengths within a 300-mm (12-in.) length of grid be equal to or greater than the ultimate strength of the grid element to which they are attached (3).
Information in several papers (1-4) can be used to calculate vertical reinforcement spacing and strength and pullout length requirements. Note that the active failure wedge location for pullout design should be based on the back rather than the front of the wall facing.
Wall Face Connection with Backfill Reinforcement
Critical to the success of a segmental block-faced geosynthetic wall are the short- and long-term strength of the connection between the facing and the reinforcement. Failed geosynthetic walls in the literature have been the result of the failure of the connection between reinforcement and facing, both in the short and the long term (14,15). In one case, the high pH environment created at the wall face due to the concrete appeared to contribute to the degradation of the polyester reinforcement (16).
The connection between the block facing and the reinforcement is made by placing the end of the reinforcement layer between the facing blocks. Pullout of the reinforcement from the blocks is resisted by friction between the geosynthetic and the block. The connection pullout resistance can be enhanced by shear keys, shear lips, or alignment pins as shown in Figure 1. The alignment pins must penetrate through the geosynthetic reinforcement.
The face-reinforcement connection can fail either by pullout or by rupture of the reinforcement. Pullout is affected by the roughness, size, and weight of the facing blocks and soil fill within the blocks. A pullout failure is more likely for small blocks, large reinforcement vertical spacings, and low confining pressure. It is likely that the strength of the geosynthetic at the connection with the facing will be less than its strength within the backfill (7,16). This strength reduction is the result of stress concentrations and abrasion on the geosynthetic created by irregularities and misalignments between blocks and the installation process. Shear lips or keys can severely distort the geosynthetic layers at the face, depending on how tightly the wall constructors place the blocks together. This severe
Allen
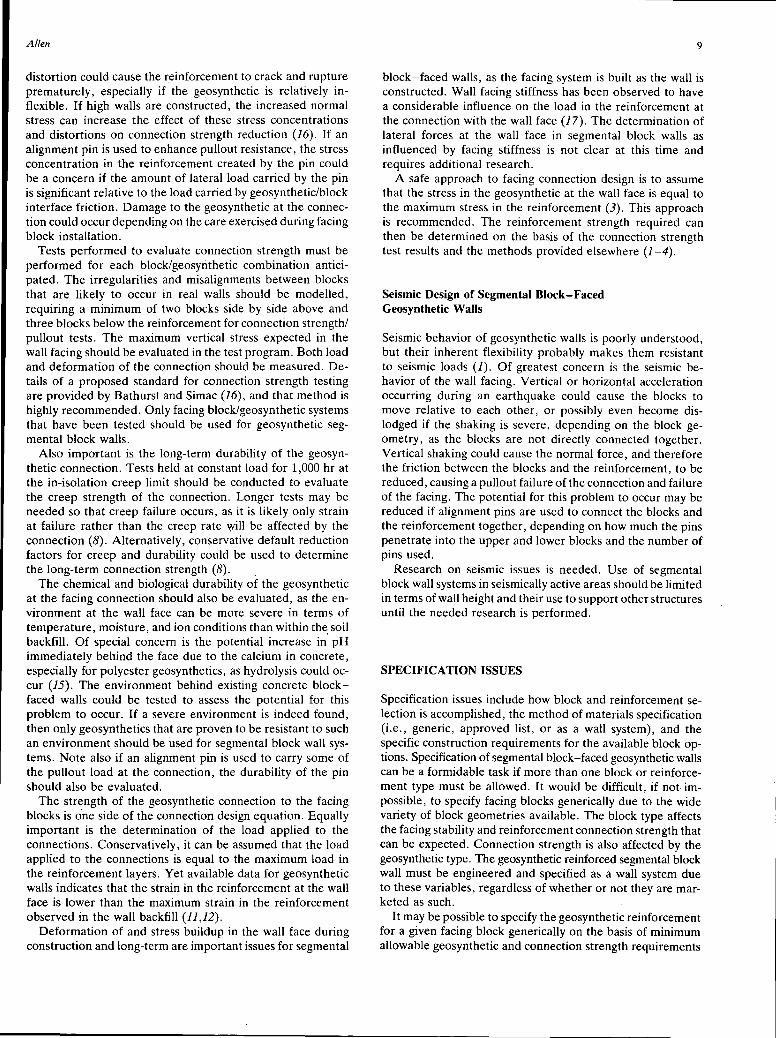
distortion could cause the reinforcement to crack and rupture prematurely, especially if the geosynthetic is relatively inflexible. If high walls are constructed, the increased normal stress can increase the effect of these stress concentrations and distortions on connection strength reduction (16). If an alignment pin is used to enhance pullout resistance, the stress concentration in the reinforcement created by the pin could be a concern if the amount of lateral load carried by the pin is significant relative to the load carried by geosynthetic/block interface friction. Damage to the geosynthetic at the connection could occur depending on the care exercised during facing block installation.
Tests performed to evaluate connection strength must be performed for each block/geosynthetic combination anticipated. The irregularities and misalignments between blocks that are likely to occur in real walls should be modelled, requiring a minimum of two blocks side by side above and three blocks below the reinforcement for connection strength/ pullout tests. The maximum vertical stress expected in the wall facing should be evaluated in the test program. Both load and deformation of the connection should be measured. Details of a proposed standard for connection strength testing are provided by Bathurst and Simac (16), and that method is highly recommended. Only facing block/geosynthetic systems that have been tested should be used for geosynthetic segmental block walls.
Also important is the long-term durability of the geosynthetic connection. Tests held at constant load for 1,000 hr at the in-isolation creep limit should be conducted to evaluate the creep strength of the connection. Longer tests may be needed so that creep failure occurs, as it is likely only strain at failure rather than the creep rate '¥ill be affected by the connection (8). Alternatively, conservative default reduction factors for creep and durability could be used to determine the long-term connection strength (8). _
The chemical and biological durability of the geosynthetic at the facing connection should also be evaluated, as the environment at the wall face can be more severe in terms of temperature, moisture, and ion conditions than within th~ soil backfill. Of special concern is the potential increase in pH immediately behind the face due to the calcium in concrete, especially for polyester geosynthetics, as hydrolysis could occur (15). The environment behind existing concrete blockfaced walls could be tested to assess the potential for this problem to occur. If a severe environment is indeed found, then only geosynthetics that are proven to be resistant to such an environment should be used for segmental block wall systems. Note also if an alignment pin is used to carry some of the pullout load at the connection, the durability of the pin should also be evaluated.
The strength of the geosynthetic connection to the facing blocks is one side of the connection design equation. Equally important is the determination of the load applied to the connections. Conservatively, it can be assumed that the load applied to the connections is equal to the maximum load in the reinforcement layers. Yet available data for geosynthetic walls indicates that the strain in the reinforcement at the wall face is lower than the maximum strain in the reinforcement observed in the wall backfill (11,12).
Deformation of and stress buildup in the wall face during construction and long-term are important issues for segmental
9
block-faced walls, as the facing system is built as the wall is constructed. Wall facing stiffness has been observed to have a considerable influence on the load in the reinforcement at the connection with the wall face (17). The determination of lateral forces at the wall face in segmental block walls as influenced by facing stiffness is not clear at this time and requires additional research.
A safe approach to facing connection design is to assume that the stress in the geosynthetic at the wall face is equal to the maximum stress in the reinforcement (3). This approach is recommended. The reinforcement strength required can then be determined on the basis of the connection strength test results and .the methods provided elsewhere (1-4).
Seismic Design of Segmental Block-Faced Geosynthetic Walls
Seismic behavior of geosynthetic walls is poorly understood, but their inherent flexibility probably makes them resistant to seismic loads (1). Of greatest concern is the seismic behavior of the wall facing. Vertical or horizontal acceleration occurring during an earthquake could cause the blocks to move relative to each other, or possibly even become dislodged if the shaking is severe, depending on the block geometry, as the blocks are not directly connected together. Vertical shaking could cause the normal force, and therefore the friction between the blocks and the reinforcement, to be reduced, causing a pullout failure of the connection and failure of the facing. The potential for this problem to occur may be reduced if alignment pins are used to connect the blocks and the reinforcement together, depending on how much the pins penetrate into the upper and lower blocks and the number of pins used.
Research on seismic issues is needed. Use of segmental block wall systems in seismically active areas should be limited in terms of wall height and their use to support other structures until the needed research is performed.
SPECIFICATION ISSUES
Specification issues include how block and reinforcement selection is accomplished, the method of materials specification (i.e., generic, approved list, or as a wall system), and the specific construction requirements for the available block options. Specification of segmental block-faced geosynthetic walls can be a formidable task if more than one block or reinforcement type must be allowed. It would be difficult, if not- impossible, to specify facing blocks generically due to the wide variety of block geometries available. The block type affects the facing stability and reinforcement connection strength that can be expected. Connection strength is also affected by the geosynthetic type. The geosynthetic reinforced segmental block wall must be engineered and specified as a wall system due to these variables, regardless of whether or not they are marketed as such.
It may be possible to specify the geosynthetic reinforcement for a given facing block generically on the basis of minimum allowable geosynthetic and connection strength requirements
10
once test standards are available. The contractor could then make appropriate selections. Since the needed test standards are not available, an approved list approach for both the facing block and geosynthetic reinforcement is currently more appropriate. It is also appropriate to specify the facing block and reinforcement as a wall system, and competitively bid the wall system with other wall systems, provided the block and geosynthetic manufacturer have a cooperative agreement to do this.
Properties and test results for the facing, geosynthetic, and the connection between the two must be obtained for products placed on an approved list or used in an approved wall system. The wall designer may also require proof of previous successful use of the facing or wall system. Each product or wall system that is found to be acceptable is added to the approved list. Until testing standards regarding facing connection strength and geosynthetic durability are available, the specifications need to list which geosynthetic products are acceptable for use with which preapproved segmental facing block.
A summary of the information needed to evaluate the acceptability of a given segmental block is as follows:
1. Block dimensions, geometry, and weight; 2. Details of how the blocks fit together; 3. Shear strength of alignment pins, shear lips, and the like; 4. Compressive strength of the blocks; 5. Freeze-thaw resistance and moisture absorption char
acteristics of the blocks; and 6. Long-term durability test results of any alignment pins
or other connectors used.
A summary of the information needed to evaluate the acceptability of the geosynthetic reinforcements proposed for use is as follows:
1. Geosynthetic macrostructure and polymer(s) used, 2. Ultimate tensile strength, 3. Product specific installation strength loss test data ap
propriate for the site conditions expected, 4. Product specific 10,000-hr creep test data at multiple load
levels and temperatures extrapolated to the design life of the wall, and
5. Product-specific chemical and biological degradation data that can be used to estimate long-term strength losses during the wall design life for the wall environment.
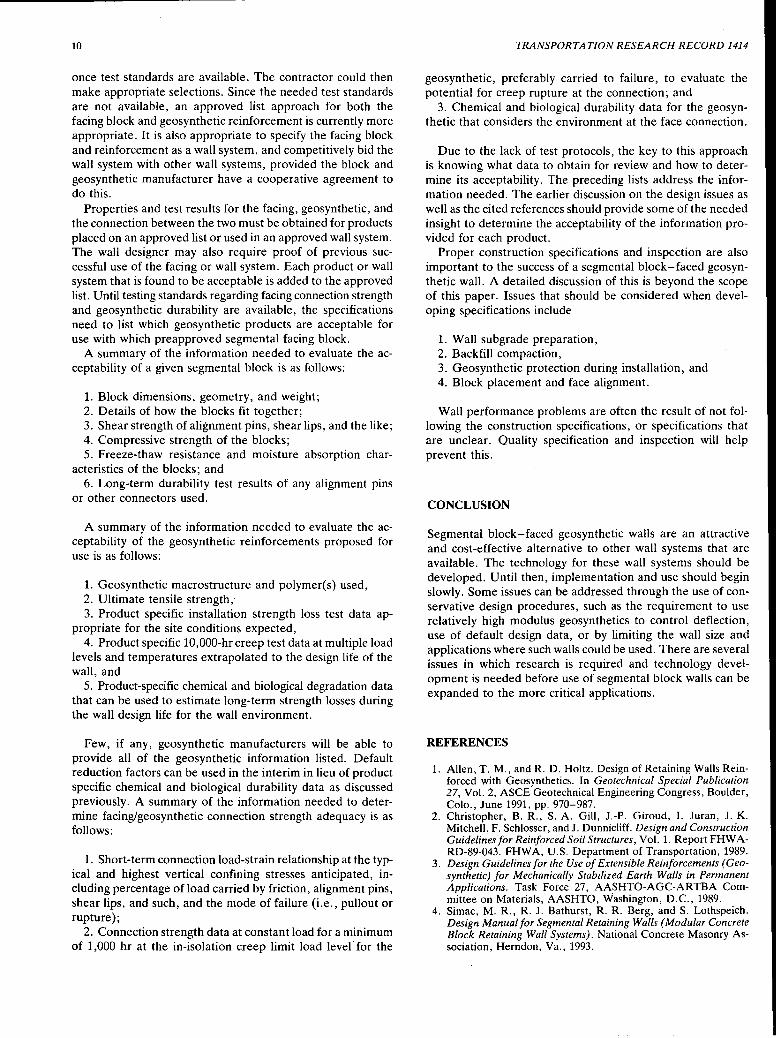
Few, if any, geosynthetic manufacturers will be able to provide all of the geosynthetic information listed. Default reduction factors can be used in the interim in lieu of product specific chemical and biological durability data as discussed previously. A summary of the information needed to determine facing/geosynthetic connection strength adequacy is as follows:
1. Short-term connection load-strain relationship at the typical and highest vertical confining stresses anticipated, including percentage of load carried by friction, alignment pins, shear lips, and such, and the mode of failure (i.e., pullout or rupture);
2. Connection strength data at constant load for a minimum of 1,000 hr at the in-isolation creep limit load level'for the
TRANSPORTATION RESEARCH RECORD 1414
geosynthetic, preferably carried to failure, to evaluate the potentiaf for creep rupture at the connection; and
3. Chemical and biological durability data for the geosynthetic that considers the environment at the face connection.
Due to the lack of test protocols, the key to this approach is knowing what data to obtain for review and how to determine its acceptability. The preceding lists address the information needed. The earlier discussion on the design issues as well as the cited references should provide some of the needed insight to determine the acceptability of the information provided for each product.
Proper construction specifications and inspection are also important to the success of a segmental block-faced geosynthetic wall. A detailed discussion of this is beyond the scope of this paper. Issues that should be considered when developing specifications include
1. Wall subgrade preparation, 2. Backfill compaction, 3. Geosynthetic protection during installation, and 4. Block placement and face alignment.
Wall performance problems are often the result of not following the construction specifications, or specifications that are unclear. Quality specification and inspection will help prevent this.
CONCLUSION
Segmental block-faced geosynthetic walls are an attractive and cost-effective alternative to other wall systems that are available. The technology for these wall systems should be developed. Until then, implementation and use should begin slowly. Some issues can be addressed through the use of conservative design procedures, such as the requirement to use relatively high modulus geosynthetics to control deflection, use of default design data, or by limiting the wall size and ,applications where such walls could be used. There are several issues in which research is required and technology development is needed before use of segmental block walls can be expanded to the more critical applications.
REFERENCES
1. Allen, T. M., and R. D. Holtz. Design of Retaining Walls Reinforced with Geosynthetics. In Geotechnical Special Publication 27, Vol. 2, ASCE Geotechnical Engineering Congress, Boulder, Colo., June 1991, pp. 970-987.
2. Christopher, B. R., S. A. Gill, J.-P. Giroud, I. Juran, J. K. Mitchell, F. Schlosser, and J. Dunnicliff. Design and Construction Guidelines for Reinforced Soil Structures, Vol. 1. Report FHW ARD-89-043. FHWA, U.S. Department of Transportation, 1989.
3. Design Guidelines for the Use of Extensible Reinforcements (Geosynthetic) for Mechanically Stabilized Earth Walls in Permanent Applications. Task Force 27, AASHTO-AGC-ARTBA Committee on Materials, AASHTO, Washington, D.C., 1989.
4. Simac, M. R., R. J. Bathurst, R. R. Berg, and S. Lothspeich. Design Manual for Segmental Retaining Walls (Modular Concrete Block Retaining Wall Systems). National Concrete Masonry Association, Herndon, Va., 1993.
Allen
5. Berg, R. R. The Technique of Building Highway Retaining Walls. Geotechnical Fabrics Report, Vol. 9, No. 5, July-Aug. 1991, pp. 38-43.
6. Anderson, R. B., F. N. Boyd, and L. Shaw. Modular BlockFaced Polymer Geogrid Reinforced Soil Walls, U.S. Postal Service Combined Carrier Facility. Proc., Geosynthetics '91 Conference, Vol. 2, Atlanta, Ga., Feb. 1991, pp. 889-902.
7. Kliethermes, J. C., K. Buttry, E. McCullough, and R. Wetzel. Modular Concrete Retaining Wall and Geogrid Reinforcement Performance and Laboratory Modeling. Proc., Geosynthetics '91 Conference, Vol. 2, Atlanta, Ga., Feb. 1991, pp. 951-964.
8. Allen, T. M. Determination of the Long-Term Tensile Strength of Geosynthetics: A State-of-the-Art Review. Proc., Geosynthetics '91 Conference, Vol. 1, Atlanta, Ga., Feb. 1991, pp. 351-379.
9. Elias, V. Durability/Corrosion of Soil Reinforced Structures. Report FHWA-RD-89-186. FHWA, U.S. Department of Transportation, 1990.
10. Fettig, D. R. A Team Player-On the Industry's Side. Geotechnical Fabrics Report, April 1991, pp. 22-23.
11. Allen, T. M., B. R. Christopher, and R. D. Holtz. Performance of a 12.6 m High Geotextile Wall in Seattle, Washington. Proc., International Symposium on Geosynthetic-Reinforced Soil Retaining Walls, Denver, Colo., Aug. 1991.
12. Simac, M. R., B. R. Christopher, and C. Bonczkiewicz. Instrumented Field Performance of a 6 m Geogrid Soil Wall. Proc.,
11
4th International Conference on Geotextiles, Geomembranes, and Related Products, The Hague, The Netherlands, 1990, pp. 53-59.
13. Bell, J. R., R. K. Barrett, and A. C. Ruckman. Geotextile EarthReinforced Retaining Wall Tests: Glenwood Canyon, Colorado. In Transportation Research Record 916, TRB, National Research Council, Washington, D.C., 1983, pp. 59-69.
14. Richardson, G. N., and L. H. Behr. Geotextile-Reinforced Wall: Failure and Remedy. Geotechnical Fabrics Report, Vol. 6, No. 4, 1988, pp. 14-18.
15. Leclercq, B., M. Schaeffner, P. Delmas, J. C. Blivet, and Y. Matichard. Durability of Geotextiles: Pragmatic Approach Used in France. Proc., 4th International Conference on Geotextiles, Geomembranes, and Related Products, The Hague, The Netherlands, 1990, pp. 679-684.
16. Bathurst, R. J., and M. R. Simac. Laboratory Testing of Modular Masonry Concrete Block-Geogrid Facing Connections. Presented at ASTM Symposium of Geosynthetic Soil Reinforcement Testing, San Antonio, Tex., Jan. 1993.
17. Nakamura, K., Y. Tamura, F. Tatsuoka, K. Iwasaki, and H. Yamauchi. Roles of Facings in Reinforcing Steep Clay Slopes with a Nonwoven Geotextile. Proc., International Symposium on Theory and Practice of Earth Reinforcement, Fukuoka, Japan, Oct. 1988, pp. 553-558.
Publication of this paper sponsored by Committee on Geosynthetics.
12 TRANSPORTATION RESEARCH RECORD 1414
Construction Considerations for Geogrid-Segmental Block Mechanically Stabilized Earth Retaining Walls
ROBERT B. ANDERSON
The appearance of geogrid segmental block-faced mechanicall.y stabilized earth retaining walls is often a primary reason for theu use. Poor construction practice can negate this benefit. Poor control of wall alignment and batter or cracked facing units detract from the aesthetic appeal of these walls. Problems with alignment and cracked facing units are infrequent and of little importance to structural integrity, yet they may be perceived as symbols of instability or failure of the walls. Some common causes of these problems and their solutions are discussed.
The use of geogrid mechanically stabilized earth (MSE) retaining walls using segmental concrete block facing units has grown rapidly since their introduction in the mid-1980s. Initially developed as landscaping walls, segmental block walls had an aesthetic appeal and economy that brought their quick acceptance in the commercial market where walls from 10 to 30 ft high are often required. Their application is now accepted by public agencies, including state departments of transportation.
Geogrid MSE walls use polymer geogrids to reinforce a structural backfill and dry-cast segmental units as facing. The face units typically range between 4 and 12 in. in height, 8 and 18 in. in width, and 8 and 24 in. in depth. Units weigh up to about 100 lb. The units are dry-stacked, and the geogrid is placed between some courses as required for internal stability of the MSE mass and for connection of the facing to the stabilized mass. The various facing systems have different block geometries that allow or require a range of alignment characteristics including batter angles, curves, and corners. The texture and color for the face of the various face units also differ. A fractured, or split, face is popular for its aesthetics.
Aesthetic appeal is often a prime consideration in the selection of a segmental block wall over a conventional MSE wall using precast panels or a cast-in-place concrete wall. This appeal can be diminished by poor construction quality, two results of which are discussed in this paper: variable wall face alignment and cracking of the facing units. These problems generally have not affected the structural stability and performance of either the segmental block-faced walls that are the principle subject of this paper or the conventional precast panel-faced MSE walls with steel or polymer reinforcement that can experience similar problems. The problems have, however, concerned those who perceive a wall face with less-
Tensar Earth Technologies, Inc., 1008 Sandy Lane Drive, Alpharetta, Ga. 30202.
than-perfect alignment or with cracked units as a wall that is failing. This perception of failure can be very important, particularly in high-visibility situations.
WALL FACE ALIGNMENT
A properly aligned wall will have level blocks set on horizontal courses that are stacked vertically or have uniform setbacks between courses. Each unit face will be in the same plane for straight sections of wall or in the same cylindrical or conical surface for curved sections, within the tolerance specified in the design (typically 15 to 20 mm).
The geogrid reinforcement can affect face alignment. If the geogrids are not well connected to the facing units, the units can move under lateral earth pressures or construction loads. If the geogrids are not uniformly pulled taut to preclude wrinkles, the facing units may move to take up the slack. The
·combination of variations in the geogrid geometry and thickness and the shape of the facing units may result in nonuniform support and tilting of facing units. Shims are used to prevent tilting.
The first key to proper alignment is construction of the leveling pad. For concrete leveling pads generally used in highway projects, the forms must be accurately placed and surface finished to a smooth and flat plane. Changes in elevation must equal the height of the masonry unit or the height of the masonry unit plus the thickness of geogrid material where reinforcement layers terminate at the step.
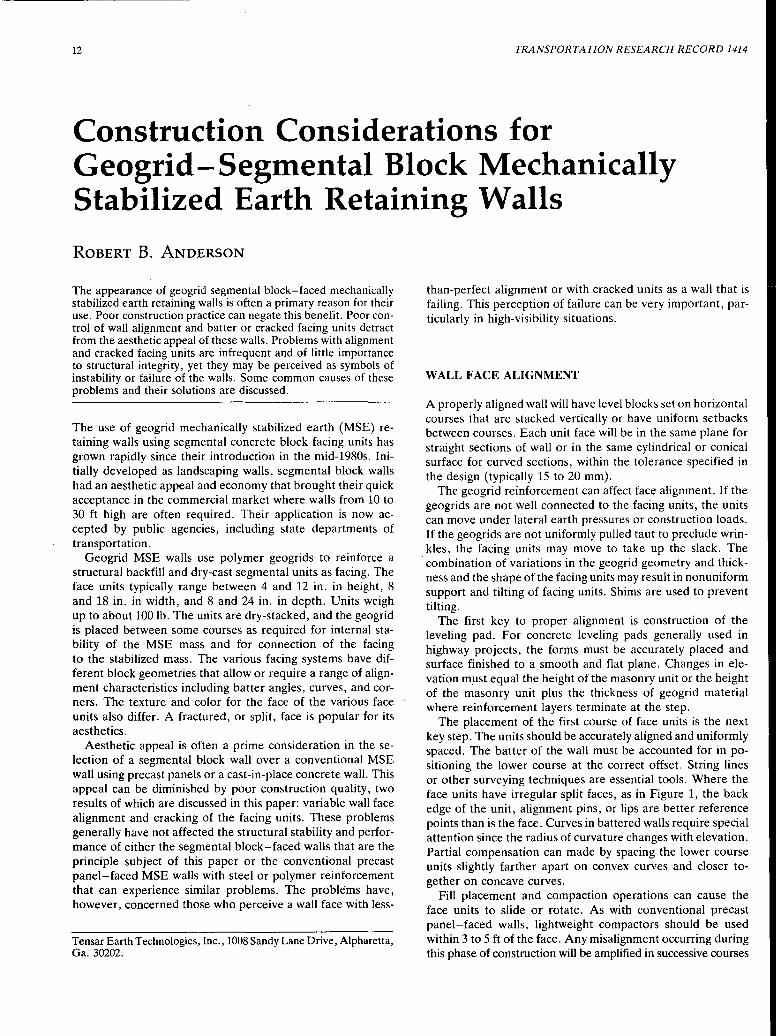
The placement of the first course of face units is the next key step. The units should be accurately aligned and uniformly spaced. The batter of the wall must be accounted for in positioning the lower course at the correct offset. String lines or other surveying techniques are essential tools. Where the face units have irregular split faces, as in Figure 1, the back edge of the unit, alignment pins, or lips are better reference points than is the face. Curves in battered walls require special attention since the radius of curvature changes with elevation. Partial compensation can made by spacing the lower course units slightly farther apart on convex curves and closer together on concave curves.
Fill placement and compaction operations can cause the face units to slide or rotate. As with conventional precast panel-faced walls, lightweight compactors should be used within 3 to 5 ft of the face. Any misalignment occurring during this phase of construction will be amplified in successive courses
Anderson
FIGURE 1 Face unit alignment.
if not immediately corrected or compensated for during placement of the next course.
Attempts to compact saturated fill can cause wall face movement. Compaction energy increases pore water pressures within the fill, which reduces the strength of the fill and redistributes tension stresses in the geogrid. Fill material should be placed at water contents within 2 percent of optimum.
Placement of the subsequent face unit courses is aided by the alignment features of the various segmental block systems: pins, tongue, and groove interlocks, or lips. These features aid but do not ensure proper alignment. Slight manufacturing variations in block geometry can alter the horizontal position and tilt of the next course. Any misalignment of the lower course will not be corrected automatically by the alignment feature of the system. Unless the alignment of each course is checked individually and minor misalignments are corrected or compensated for immediately, the misalignments tend to grow.
Curved sections of high, battered walls may require that the facing units be cut to allow for the changing radius of curvature and length of face. If not cut, batter can be lost on concave walls and the wall will "budge out" at the top or the standard overlap of each course will change as the curve is dev~loped. High walls having short radii should be designed to be vertical where possible. If they must have a batter, the face units can be cut to fit, forming a neat vertical construction joint.
Inadequate drainage can be an especially serious problem for any type of wall. Poor drainage has resulted in significant wall face movement and, in some cases, complete failure. MSE walls are not normally designed for hydrostatic pressures in or behind the reinforced soil mass. When the soil becomes saturated, the external and internal driving forces increase while both the frictional strength of the reinforced fill and the interaction strength between fill and geogrid decrease. The result can be movement of the entire reinforced mass or movement within the reinforced mass.
An internal drainage system should be a part of the MSE design unless the reinforced fill is very free draining. The system should be capable of preventing the development of hydrostatic pressure behind the MSE wall mass and development of excess pore water pressure within the reinforced
13
fill. The prism of drainage material traditionally placed immediately behind the facing units is not sufficient where backfill is not free draining. The drainage material should be placed behind the reinforcement so that the water is intercepted before it reaches the reinforced zone.
Internal drainage systems should be designed not only for the postconstruction conditions when surface water is well controlled (e.g., by pavement), but also for anticipated conditions during construction as well. Problems can develop during construction because of inadequate control of surface runoff. Surface water ponded on, or behind, the MSE wall can exceed the capacity of the internal drainage system. It is obviously also very important that the contractor controls surface water to prevent saturation of the MSE mass as prescribed in the specifications.
FLEXURAL CRACKING OF FACE UNITS
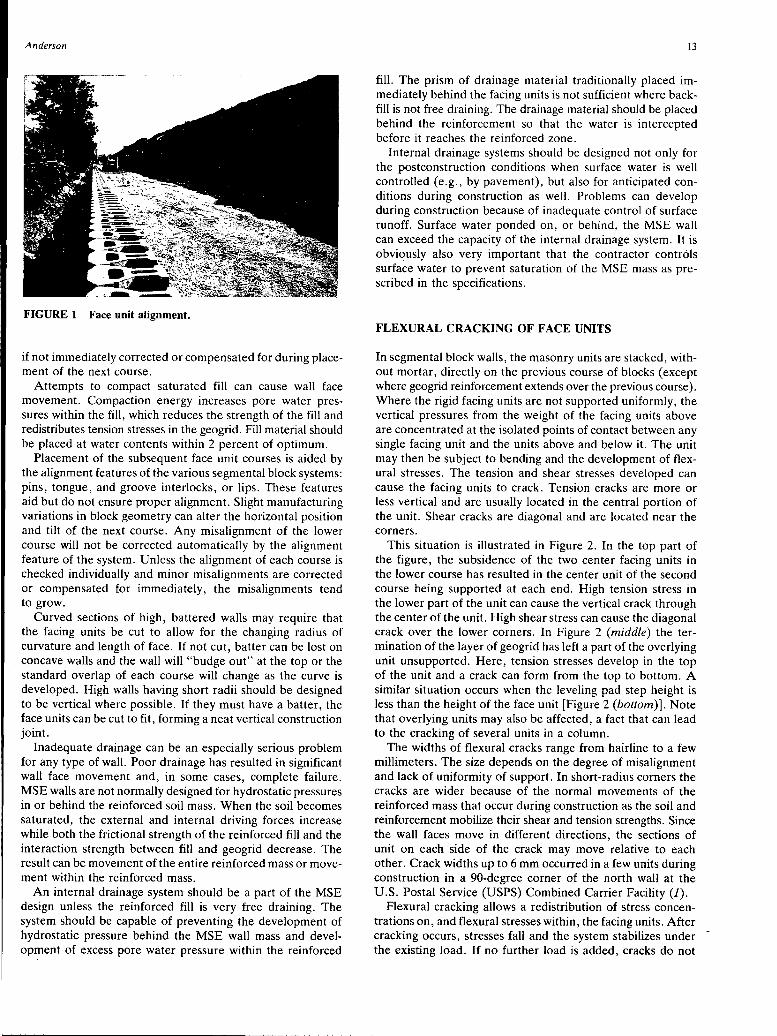
In segmental block walls, the masonry units are stacked, without mortar, directly on the previous course of blocks (except where geogrid reinforcement extends over the previous course). Where the rigid facing units are not supported uniformly, the vertical pressures from the weight of the facing units above are concentrated at the isolated points of contact between any single facing unit and the units above and below it. The unit may then be subject to bending and the development of flexural stresses. The tension and shear stresses developed can cause the facing units to crack. Tension cracks are more or less vertical and are usually located in the central portion of the unit. Shear cracks are diagonal and are located near the corners.
This situation is illustrated in Figure 2. In the top part of the figure, the subsidence of the two center facing units in the lower course has resulted in the center unit of the second course being supported at each end. High tension stress in the lower part of the unit can cause the vertical crack through the center of the unit. High shear stress can cause the diagonal crack over the lower corners. In Figure 2 (middle) the termination of the layer of geogrid has left a part of the overlying unit unsupported. Here, tension stresses develop in the top of the unit and a crack can form from the top to bottom. A similar situation occurs when the leveling pad step height is less than the height of the face unit [Figure 2 (bottom)]. Note that overlying units may also be affected, a fact that can lead to the cracking of several units in a column.
The widths of flexural cracks range from hairline to a few millimeters. The size depends on the degree of misalignment and lack of uniformity of support. In short-radius corners the cracks are wider because of the normal movements of the reinforced mass that occur during construction as the soil and reinforcement mobilize their shear and tension strengths. Since the wall faces move in different directions, the sections of unit on each side of the crack may move relative to each other. Crack widths up to 6 mm occurred in a few units during construction in a 90-degree corner of the north wall at the U.S. Postal Service (USPS) Combined Carrier Facility (1).
Flexural cracking allows a redistribution of stress concentrations on, and flexural stresses within, the facing units. After cracking occurs, stresses fall and the system stabilizes under -the existing load. If no further load is added, cracks do not
14
Shear Crack
FIGURE 2 Flexural cracking causes and effects: top, nonplanar support; middle, geogrid termination; bottom, leveling pad step.
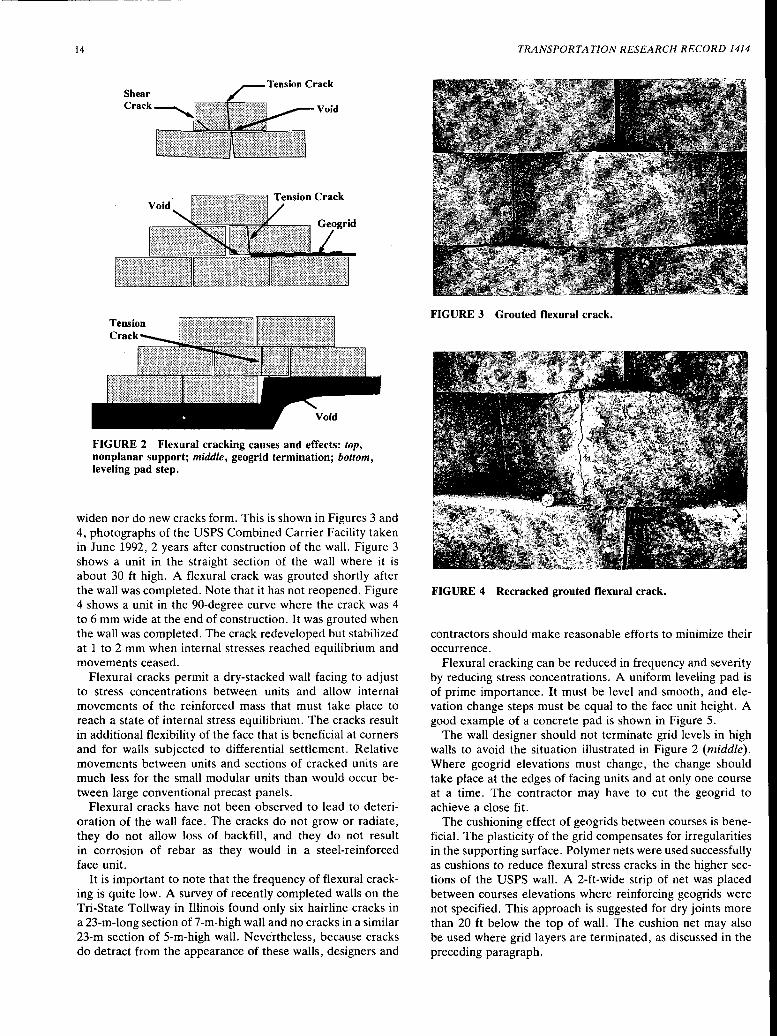
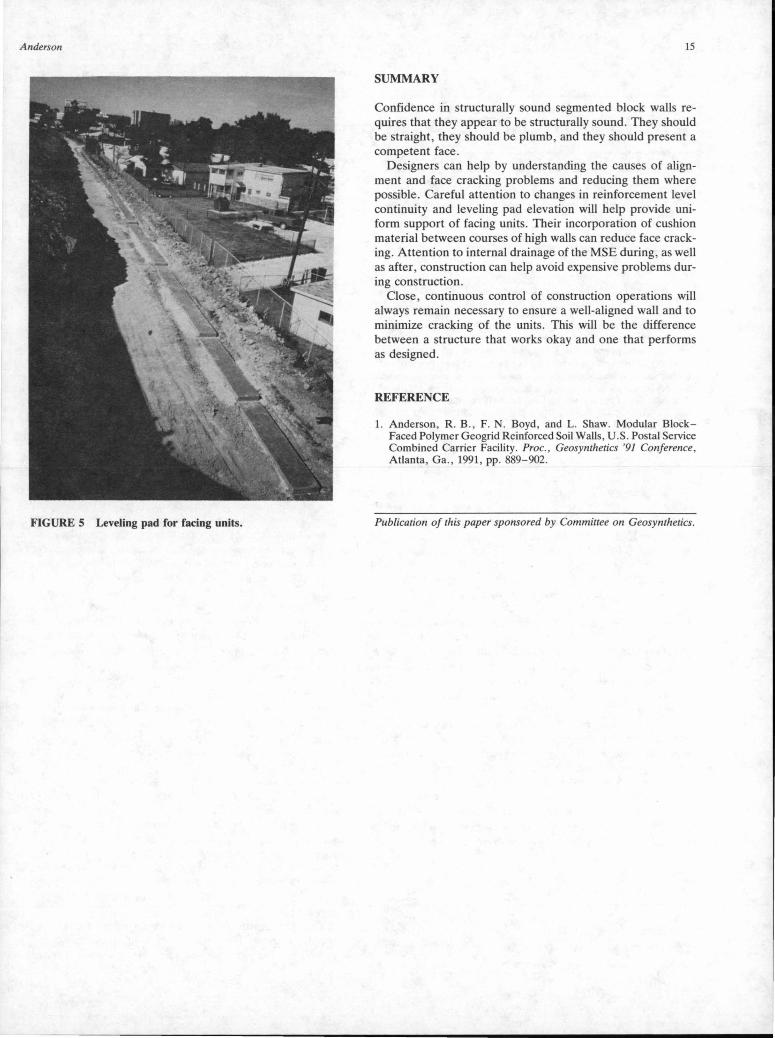
widen nor do new cracks form. This is shown in Figures 3 and 4, photographs of the USPS Combined Carrier Facility taken in June 1992, 2 years after construction of the wall. Figure 3 shows a unit in the straight section of the wall where it is about 30 ft high. A flexural crack was grouted shortly after the wall was completed. Note that it has not reopened. Figure 4 shows a unit in the 90-degree curve where the crack was 4 to 6 mm wide at the end of construction. It was grouted when the wall was completed. The crack redeveloped but stabilized at 1 to 2 mm when internal stresses reached equilibrium and movements ceased.
Flexural cracks permit a dry-stacked wall facing to adjust to stress concentrations between units and allow internal movements of the reinforced mass that must take- place to reach a state of internal stress equilibrium. The cracks result in additional flexibility of the face that is beneficial at corners and for walls subjected to differential settlement. Relative movements between units and sections of cracked units are much less for the small modular units than would occur between large conventional precast panels.
Flexural cracks have not been observed to lead to deterioration of the wall face. The cracks do not grow or radiate, they do not allow loss of backfill, and they do not result in corrosion of rebar as they would in a steel-reinforced face unit.
It is important to note that the frequency of flexural cracking is quite low. A survey of recently completed walls on the Tri-State Tollway in Illinois found only six hairline cracks in a 23-m-long section of 7-m-high wall and no cracks in a similar 23-m section of 5-m-high wall. Nevertheless, because cracks do detract from the appearance of these walls, designers and
TRANSPORTATION RESEARCH RECORD 1414
FIGURE 3 Grouted flexural crack.
FIGURE 4 Recracked grouted flexural crack.
contractors should make reasonable efforts to minimize their occurrence.
Flexural cracking can be reduced in frequency and severity by reducing stress concentrations. A uniform leveling pad is of prime importance. It must be level and smooth, and elevation change steps must be equal to the face unit height. A good example of a concrete pad is shown in Figure 5.
The wall designer should not terminate grid levels in high walls to avoid the situation illustrated in Figure 2 (middle). Where geogrid elevations must change, the change should take place at the edges of facing units and at only one course at a time. The contractor may have to cut the geogrid to achieve a close fit.
The cushioning effect of geogrids between courses is beneficial. The plasticity of the grid compensates for irregularities in the supporting surface. Polymer nets were used successfully as cushions to reduce flexural stress cracks in the higher sections of the USPS wall. A 2-ft-wide strip of net was placed between courses elevations where reinforcing geogrids were not specified. This approach is suggested for dry joints more than 20 ft below the top of wall. The cushion net may also be used where grid layers are terminated, as discussed in the preceding paragraph.
Anderson
FIGURE 5 Leveling pad for facing units.
15
SUMMARY
Confidence in structurally sound segmented block walls requires that they appear to be structurally sound. They should be straight, they should be plumb, and they should present a competent face.
Designers can help by understanding the causes of alignment and face cracking problems and reducing them where possible. Careful attention to changes in reinforcement level continuity and leveling pad elevation will help provide uniform support of facing units. Their incorporation of cushion material between courses of high walls can reduce face cracking. Attention to internal drainage of the MSE during, as well as after, construction can help avoid expensive problems during construction.
Close, continuous control of construction operations will always remain necessary to ensure a well-aligned wall and to minimize cracking of the units. This will be the difference between a structure that works okay and one that performs as designed.
REFERENCE
1. Anderson, R. B. , F. N. Boyd, and L. Shaw. Modular BlockFaced Polymer Geogrid Reinforced Soil Walls , U .S. Postal Service Combined Carrier Facility. Proc., Geosynthetics '91 Conference , Atlanta, Ga. , 1991, pp. 889-902.
Publication of this paper sponsored by Committee on Geosynthetics.
16 TRANSPORTATION RESEARCH RECORD 1414
Review of NCMA Segmental Retaining Wall Design Manual for GeosyntheticReinf orced Structures
RICHARD J. BATHURST, MICHAEL R. SIMAC, AND RYAN R. BERG
The National Concrete Masonry Association (NCMA) recently introduced a design manual for the analysis, design, and construction of geosynthetic-reinforced soil retaining walls that use dry-stacked masonry concrete units as the facing system. Important features of the manual are addressed, including methods of analysis, interpretation of long-term design strength of the geosynthetic reinforcement, selection of factors of safety, partial materials factors, and proposed test methods that address stability aspects of the facing system. Differences between current FHW A and AASHTO guidelines and the NCMA manual are discussed, and deficiencies in these earlier standards with respect to mortarless masonry wall systems are identified.
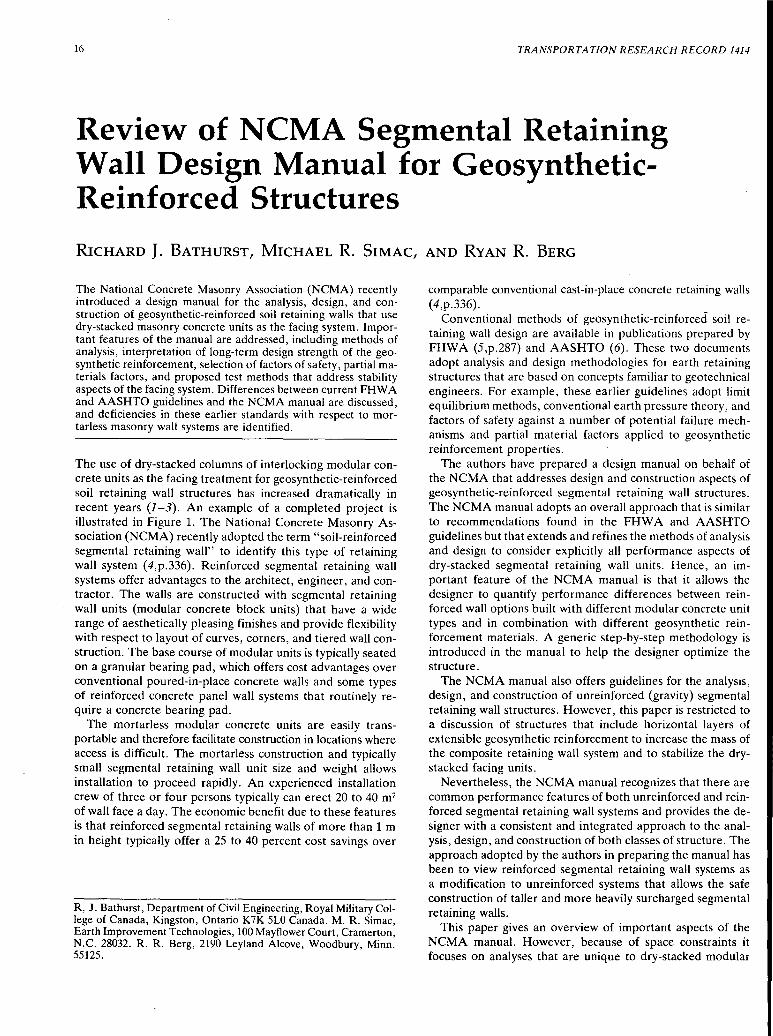
The use of dry-stacked columns of interlocking modular concrete units as the facing treatment for geosynthetic-reinforced soil retaining wall structures has increased dramatically in recent years (1-3). An example of a completed project is illustrated in Figure 1. The National Concrete Masonry Association (NCMA) recently adopted the term "soil-reinforced segmental retaining wall" to identify this type of retaining wall system (4,p.336). Reinforced segmental retaining wall systems offer advantages to the architect, engineer, and contractor. The walls are constructed with segmental retaining wall units (modular concrete block units) that have a wide range of aesthetically pleasing finishes and provide flexibility with respect to layout of curves, corners, and tiered wall construction. The base course of modular units is typically seated on a granular bearing pad, which offers cost advantages over conventional poured-in-place concrete walls and some types of reinforced concrete panel wall systems that routinely require a concrete bearing pad.
The mortarless modular concrete units are easily transportable and therefore facilitate construction in locations where access is difficult. The mortarless construction and typically small segmental retaining wall unit size and weight allows installation to proceed rapidly. An experienced installation crew of three or four persons typically can erect 20 to 40 m2
of wall face a day. The economic benefit due to these features is that reinforced segmental retaining walls of more than 1 m in height typically offer a 25 to 40 percent cost savings over
R, J. Bathurst, Department of Civil Engineering, Royal Military College of Canada, Kingston, Ontario K7K 5LO Canada. M. R. Simac, Earth Improvement Technologies, 100 Mayflower Court, Cramerton, N.C. 28032. R. R. Berg, 2190 Leyland Alcove, Woodbury, Minn. 55125.
comparable conventional cast-in-place concrete retaining walls (4,p.336).
Conventional methods of geosynthetic-reinforced soil retaining wall design are available in publications prepared by FHWA (5,p.287) and AASHTO (6). These two documents adopt analysis and design methodologies for earth retaining structures that are based on concepts familiar to geotechnical engineers. For example, these earlier guidelines adopt limit equilibrium methods, conventional earth pressure theory, and factors of safety against a number of potential failure mechanisms and partial material factors applied to geosynthetic reinforcement properties.
The authors have prepared a design manual on behalf of the NCMA that addresses design and construction aspects of geosynthetic-reinforced segmental retaining wall structures. The NCMA manual adopts an overall approach that is similar to recommendations found in the FHW A and AASHTO guidelines but that extends and refines the methods of analysis and design to consider explicitly all performance aspects of dry-stacked segmental retaining wall units. Hence, an important feature of the NCMA manual is that it allows the designer to quantify performance differences between reinforced wall options built with different modular concrete unit types and in combination with different geosynthetic reinforcement materials. A generic step-by-step methodology is introduced in the manual to help the designer optimize the structure.
The NCMA manual also offers guidelines for the analysis, design, and construction of unreinforced (gravity) segmental retaining wall structures. However, this paper is restricted to a discussion of structures that include horizontal layers of extensible geosynthetic reinforcement to increase the mass of the composite retaining wall system and to stabilize the drystacked facing units.
Nevertheless, the NCMA manual recognizes that there are common performance features of both unreinforced and reinforced segmental retaining wall systems and provides the designer with a consistent and integrated approach to the analysis, design, and construction of both classes of structure. The approach adopted by the authors in preparing the manual has been to view reinforced segmental retaining wall systems as a modification to unreinforced systems that allows the safe construction of taller and more heavily surcharged segmental retaining walls.
This paper gives an overview of important aspects of the NCMA manual. However, because of space constraints it focuses on analyses that are unique to dry-stacked modular
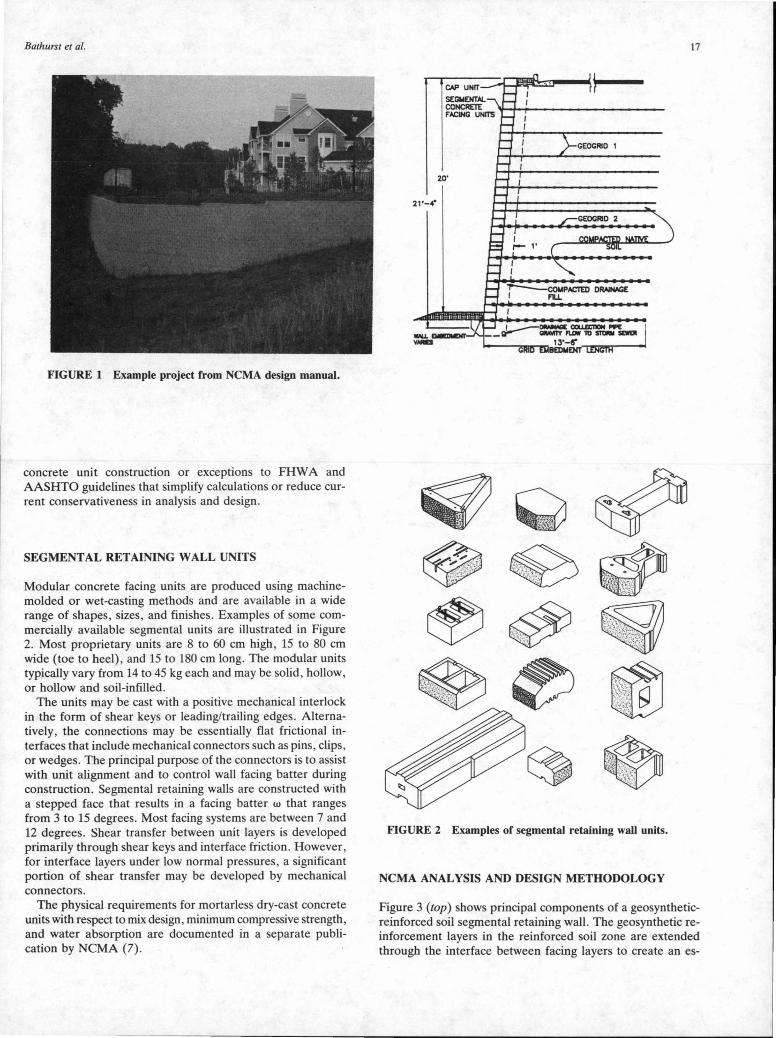
Bathurst et al.
FIGURE 1 Example project from NCMA design manual.
concrete unit construction or exceptions to FHW A and AASHTO guidelines that simplify calculations or reduce current conservativeness in analysis and design .
SEGMENTAL RETAINING WALL UNITS
Modular concrete facing units are produced using machinemolded or wet-casting methods and are available in a wide range of shapes , sizes, and finishes. Examples of some commercially available segmental units are illustrated in Figure 2. Most proprietary units are 8 to 60 cm high , 15 to 80 cm wide (toe to heel) , and 15 to 180 cm long. The modular units typically vary from 14 to 45 kg each and may be solid , hollow, or hollow and soil-infilled.
The units may be cast with a positive mechanical interlock in the form of shear keys or leading/trailing edges. Alternatively, the connections may be essentially flat frictional interfaces that include mechanical connectors such as pins, clips , or wedges. The principal purpose of the connectors is to assist with unit alignment and to control wall facing batter during construction. Segmental retaining walls are constructed with a stepped face that results in a facing batter w that ranges from 3 to 15 degrees. Most facing systems are between 7 and 12 degrees. Shear transfer between unit layers is developed primarily through shear keys and interface friction . However, for interface layers under low normal pressures, a significant portion of shear transfer may be developed by mechanical connectors.
The physical requirements for mortarless dry-cast concrete units with respect to mix design, minimum compressive strength, and water absorption are documented in a separate publication by NCMA (7).
17
FIGURE 2 Examples of segmental retaining wall units.
NCMA ANALYSIS AND DESIGN METHODOLOGY
Figure 3 (top) shows principal components of a geosyntheticreinforced soil segmental retaining wall. The geosynthetic reinforcement layers in the reinforced soil zone are extended through the interface between facing layers to create an es-
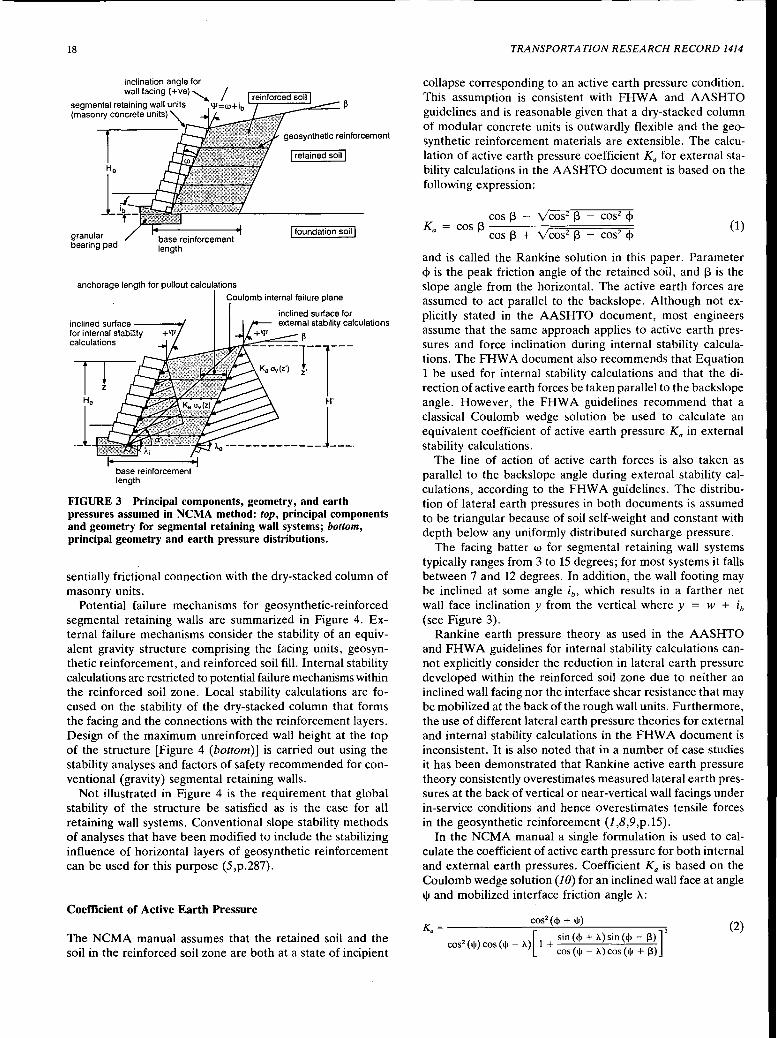
18
inclination angle for wall facing ( +ve) "'-. /
segmental retaining wall units W=w+ib (masonry concrete units)
granular bearing pad
anchorage length for pullout calculations
geosynthetic reinforcement
I retained soil I
l foundation soil I
Coulomb internal failure plane
inclined surface -----./ for internal stability calculations
base reinforcement length
inclined surface for external stability calculations
FIGURE 3 Principal components, geometry, and earth pressures assumed in NCMA method: top, principal components and geometry for segmental retaining wall systems; bottom, principal geometry and earth pressure distributions.
sentially frictional connection with the dry-stacked column of masonry units.
Potential failure mechanisms for geosynthetic-reinforced segmental retaining walls are summarized in Figure 4. External failure mechanisms consider the stability of an equivalent gravity structure comprising the facing units, geosynthetic reinforcement, and reinforced soil fill. Internal stability calculations are restricted to potential failure mechanisms within the reinforced soil zone. Local stability calculations are focused on the stability of the dry-stacked column that forms the facing and the connections with the reinforcement layers. Design of the maximum unreinforced wall height at the top of the structure (Figure 4 (bottom)] is carried out using the stability analyses and factors of safety recommended for conventional (gravity) segmental retaining walls.
Not illustrated in Figure 4 is the requirement that global stability of the structure be satisfied as is the case for all retaining wall systems. Conventional slope stability methods of analyses that have been modified to include the stabilizing influence of horizontal layers of geosynthetic reinforcement can be used for this purpose (5 ,p.287).
Coefficient of Active Earth Pressure
The NCMA manual assumes that the retained soil and the soil in the reinforced soil zone are both at a state of incipient
TRANSPORTATION RESEARCH RECORD 1414
collapse corresponding to an active earth pressure condition. This assumption is consistent with FHW A and AASHTO guidelines and is reasonable given that a dry-stacked column of modular concrete units is outwardly flexible and the geosynthetic reinforcement materials are extensible. The calculation of active earth pressure coefficient Ka for external stability calculations in the AASHTO document is based on the following expression:
cos f3 - V cos2 f3 cos2 <P Ka = cos f3 -----;=::;=::::====;:::::::::
cos f3 + v' cos2 f3 cos2 <P (1)
and is called the Rankine solution in this paper. Parameter <P is the peak friction angle of the retained soil, and f3 is the slope angle from the horizontal. The active earth forces are assumed to act parallel to the backslope. Although not explicitly stated in the AASHTO document, most engineers assume that the same approach applies to active earth pressures and force inclination during internal stability calculations. The FHW A document also recommends that Equation 1 be used for internal stability calculations and that the direction of active earth forces be taken parallel to the backslope angle. However, the FHW A guidelines recommend that a classical Coulomb wedge solution be used to calculate an equivalent coefficient of active earth pressure Ka in external stability calculations.
The line of action of active earth forces is also taken as parallel to the backslope angle during external stability calculations, according to the FHWA guidelines. The distribution of lateral earth pressures in both documents is assumed to be triangular because of soil self-weight and constant with depth below any uniformly distributed surcharge pressure.
The facing batter w for segmental retaining wall systems typically ranges from 3 to 15 degrees; for most systems it falls between 7 and 12 degrees. In addition, the wall footing may be inclined at some angle ib, which results in a farther net wall face inclination y from the vertical where y = w + ib (see Figure 3).
Rankine earth pressure theory as used in the AASHTO and FHW A guidelines for internal stability calculations cannot explicitly consider the reduction in lateral earth pressure developed within the reinforced soil zone due to neither an inclined wall facing nor the interface shear resistance that may be mobilized at the back of the rough wall units. Furthermore, the use of different lateral earth pressure theories for external and internal stability calculations in the FHW A document is inconsistent. It is also noted that in a number of case studies it has been demonstrated that Rankine active earth pressure theory consistently overestimates measured lateral earth pressures at the back of vertical or near-vertical wall facings under in-service conditions and hence overestimates tensile forces in the geosynthetic reinforcement (1,8,9,p.15).
In the NCMA manual a single formulation is used to. calculate the coefficient of active earth pressure for both internal and external earth pressures. Coefficient Ka is based on the Coulomb wedge solution (JO) for an inclined wall face at angle "' and mobilized interface friction angle A.:
cos2 (<1> + "1) K = 2
a 2 ( ) ( ) [ 1 sin ( <!> + A) sin ( <!> - 13) J cos "1 cos ljs - A + -~--------cos (ljs - A.)cos(ljs + 13)
(2)
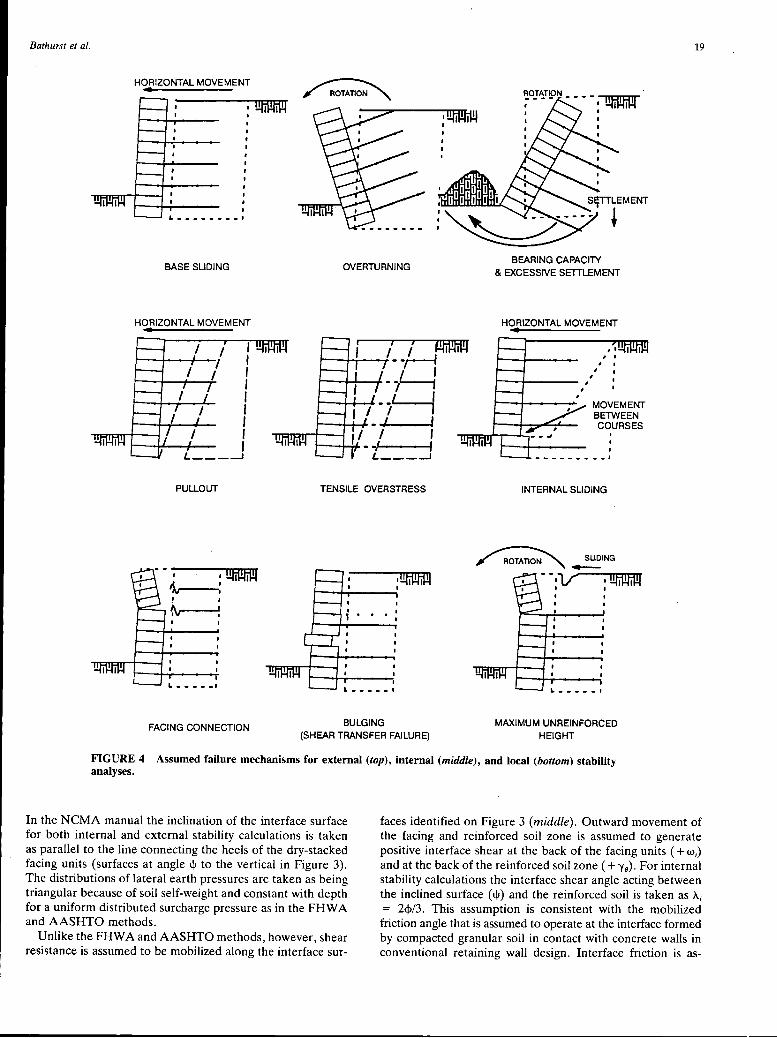
Bathurst et al.
HORIZONTAL MOVEMENT
I L!ffl!hlQ
L ••••••••
~O}~Tl£>N - - - - I !Jffl!ffl!I I
I
19
BASE SLIDING OVERTURNING BEARING CAPACITY
& EXCESSIVE SETTLEMENT
/ i J1fflJh14 r--+-o- - -j--1
r--.f-1----1- - H I I
I
I I -i I
t--_..,~ .. - I I MOVEMENT BETWEEN COURSES
I I r----.i--. - / I '
' I
L----' ---------· PULLOUT TENSILE OVERSTRESS INTERNAL SLIDING
I L!ffl!hlQ I ·!!ffl!li1!1
I
~~ING --·V I !!ffl!li1!1
I I
FACING CONNECTION BULGING MAXIMUM UNREINFORCED HEIGHT (SHEAR TRANSFER FAILURE)
FIGURE 4 Assumed failure mechanisms for external (top), internal (middle), and local (bottom) stability analyses.
In the NCMA manual the inclination of the interface surface for both internal and external stability calculations is taken as parallel to the line connecting the heels of the dry-stacked facing units (surfaces at angle ljJ to the vertical in Figure 3). The distributions of lateral earth pressures are taken as being triangular because of soil self-weight and constant with depth for a uniform distributed surcharge pressure as in the FHW A and AASHTO methods.
Unlike the FHW A and AASHTO methods, however, shear resistance is assumed to be mobilized along the interface sur-
faces identified on Figure 3 (middle). Outward movement of the facing and reinforced soil zone is assumed to generate positive interface shear at the back of the facing units ( + w;) and at the back of the reinforced soil zone ( + -y9). For internal stability calculations the interface shear angle acting between the inclined surface ( ljJ) and the reinforced soil is taken as A; = 2<!>/3. This assumption is consistent with the mobilized friction angle that is assumed to operate at the interface formed by compacted granular soil in contact with concrete walls in conventional retaining wall design. Interface friction is as-
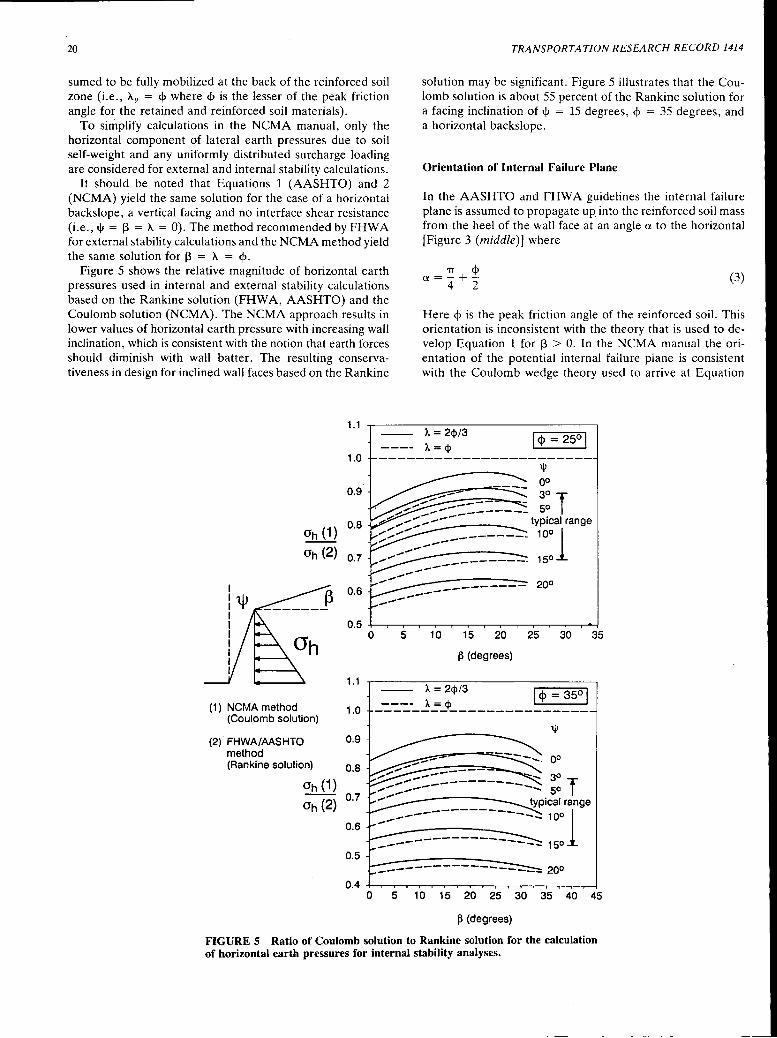
20
sumed to be fully mobilized at the back of the reinforced soil zone (i.e., A.0 = <!> where <!> is the lesser of the peak friction angle for the retained and reinforced soil materials).
To simplify calculations in the NCMA manual, only the horizontal component of lateral earth pressures due to soil self-weight and any uniformly distributed surcharge loading are considered for external and internal stability calculations.
It should be noted that Equations 1 (AASHTO) and 2 (NCMA) yield the same solution for the case of a horizontal backslope, a vertical facing and no interface shear resistance (i.e., ljJ = 13 =A.= 0). The method recommended by FHWA for external stability calculations and the NCMA method yield the same solution for 13 = A. = <J>.
Figure 5 shows the relative magnitude of horizontal earth pressures used in internal and external stability calculations based on the Rankine solution (FHWA, AASHTO) and the Coulomb solution (NCMA). The NCMA approach results in lower values of horizontal earth pressure with increasing wall inclination, which is consistent with the notion that earth forces should diminish with wall batter. The resulting conservativeness in design for inclined wall faces based on the Rankine
TRANSPORTATION RESEARCH RECORD 1414
solution may be significant. Figure 5 illustrates that the Coulomb solution is about 55 percent of the Rankine solution for a facing inclination of ljJ = 15 degrees, <!> = 35 degrees, and a horizontal backslope.
Orientation of Internal Failure Plane
In the AASHTO and FHW A guidelines the internal failure plane is assumed to propagate up into the reinforced soil mass from the heel of the wall face at an angle a to the horizontal [Figure 3 (middle)] where
'1T <!> a=-+-4 2
(3)
Here <!> is the peak friction angle of the reinforced soil. This orientation is inconsistent with the theory that is used to develop Equation 1 for 13 > 0. In the NCMA manual the orientation of the potential internal failure plane is consistent with the Coulomb wedge theory used to arrive at Equation
1.1 -- l..=2<1>/3
---- I..= <I> 1.0 ------------------------
ah (1) ah (2)
(1) NCMA method (Coulomb solution)
(2) FHWA/AASHTO method (Rankine solution)
ah (1)
0.9
0.8
0.7
0.6
0.5
1.1
1.0
0.9
0.8
ah (2) o.7
0.6
0.5
0 5 10 15 20 25 30 35
~(degrees)
-----~;~~~-------~-=~~~-'IP
00
0 5 10 15 20 25 30 35 40 45
~(degrees)
FIGURES Ratio of Coulomb solution to Rankine solution for the calculation of horizontal earth pressures for internal stability analyses.
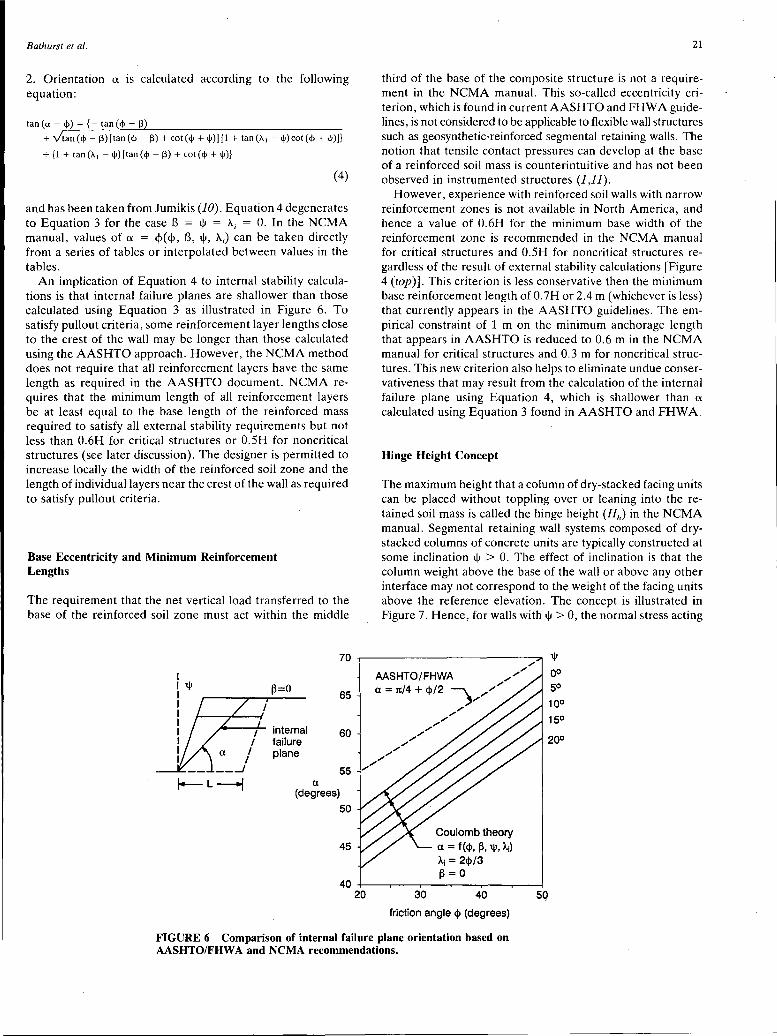
Bathurst et al.
2. Orientation a is calculated according to the following equation:
tan(a - <f>) = {- tan(<f>-13)
+ Vtan (<!> - 13) [tan (<f> - 13) +cot(<!>+ tji)][l +tan (X. 1 - tjl) cot (<f> + tjl)]}
+ {1 + tan(X. 1 -tjl)[tan(<f>-13) +cot(<!>+ tjl)}
(4)
and has been taken from Jumikis (10). Equation 4 degenerates to Equation 3 for the case B = iV = A; = 0. In the NCMA manual, values of a = <f>(<f>, B, iV, A;) can be taken directly from a series of tables or interpolated between values in the tables.
An implication of Equation 4 to internal stability calculations is that internal failure planes are shallower than those calculated using Equation 3 as illustrated in Figure 6. To satisfy pullout criteria, some reinforcement layer lengths close to the crest of the wall may be longer than those calculated using the AASHTO approach. However, the NCMA method does not require that all reinforcement layers have the same length as required in the AASHTO document. NCMA requires that the minimum length of all reinforcement layers be at least equal to the base length of the reinforced mass required to satisfy all external stability requirements but not less than 0.6H for critical structures or 0.5H for noncritical structures (see later discussion). The designer is permitted to increase locally the width of the reinforced soil zone and the length of individual layers near the crest of the wall as required to satisfy pullout criteria.
Base Eccentricity and Minimum Reinforcement Lengths
The requirement that the net vertical load transferred to the base of the reinforced soil zone must act within the middle
---1- internal I failure I plane
I ---'
'4--- L --.j a (degrees)
50
45
21
third of the base of the composite structure is not a requirement in the NCMA manual. This so-called eccentricity criterion, which is found in current AASHTO and FHW A guidelines, is not considered to be applicable to flexible wall structures such as geosynthetic-reinforced segmental retaining walls. The notion that tensile contact pressures can develop at the base of a reinforced soil mass is counterintuitive and has not been observed in instrumented structures (1,11).
However, experience with reinforced soil walls with narrow reinforcement zones is not available in North America, and hence a value of 0.6H for the minimum base width of the reinforcement zone is recommended in the NCMA manual for critical structures and 0.5H for noncritical structures regardless of the result of external stability calculations [Figure 4 (top)]. This criterion is less conservative then the minimum base reinforcement length of0.7H or 2.4 m (whichever is less) that currently appears in the AASHTO guidelines. The empirical constraint of 1 m on the minimum anchorage length that appears in AASHTO is reduced to 0.6 min the NCMA manual for critical structures and 0.3 m for noncritical structures. This new criterion also helps to eliminate undue conservativeness that may result from the calculation of the internal failure plane using Equation 4, which is shallower than a calculated using Equation 3 found in AASHTO and FHW A.
Hinge Height Concept
The maximum height that a column of dry-stacked facing units can be placed without toppling over or leaning into the retained soil mass is called the hinge height (Hh) in the NCMA manual. Segmental retaining wall systems composed of drystacked columns of concrete units are typically constructed at some inclination iV > 0. The effect of inclination is that the column weight above the base of the wall or above any other interface may not correspond to the weight of the facing units above the reference elevation. The concept is illustrated in Figure 7. Hence, for walls with iV > 0, the normal stress acting
Coulomb theory a = f (<j>, ~. 11J, Ai) Ai= 2<j>/3 ~=O
111
oo 50
10°
15°
20°
40 +-~-.-~--.-~~.--~~~--.-~--1 20 30 40 5Q
friction angle <j> (degrees)
FIGURE 6 Comparison of internal failure plane orientation based on AASHTO/FHW A and NCMA recommendations.
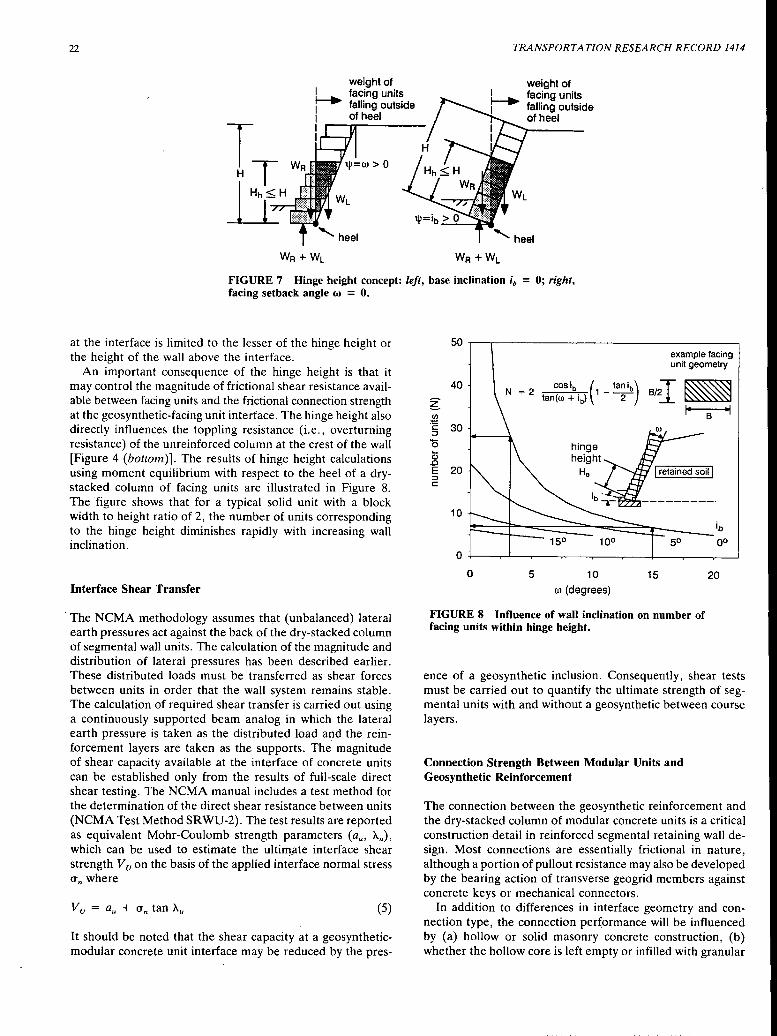
22
weight of facing units falling outside of heel
TRANSPORTATION RESEARCH RECORD 1414
weight of facing units falling outside of heel
FIGURE 7 Hinge height concept: left, base inclination ib = O; right, facing setback angle w = 0.
at the interface is limited to the lesser of the hinge height or the height of the wall above the interface.
An important consequence of the hinge height is that it may control the magnitude of frictional shear resistance available between facing units and the frictional connection strength at the geosynthetic-facing unit interface. The hinge height also directly influences the toppling resistance (i.e., overturning resistance) of the unreinforced column at the crest of the wall [Figure 4 (bottom)]. The results of hinge height calculations using moment equilibrium with respect to the heel of a drystacked column of facing units are illustrated in Figure 8. The figure shows that for a typical solid unit with a block width to height ratio of 2, the number of units corresponding to the hinge height diminishes rapidly with increasing wall inclination.
Interface Shear Transfer
·The NCMA methodology assumes that (unbalanced) lateral earth pressures act against the back of the dry-stacked column of segmental wall units. The calculation of the magnitude and distribution of lateral pressures has been described earlier. These distributed loads must be transferred as shear forces between units in order that the wall system remains stable. The calculation of required shear transfer is carried out using a continuously supported beam analog in which the lateral earth pressure is taken as the distributed load and the reinforcement layers are taken as the supports. The magnitude of shear capacity available at the interface of concrete units can be established only from the results of full-scale direct shear testing. The NCMA manual includes a test method for the determination of the direct shear resistance between units (NCMA Test Method SRWU-2). The test results are reported as equivalent Mohr-Coulomb strength parameters (au, A.u), which can be used to estimate the ultirl}_ate interface shear strength Vu on the basis of the applied interface normal stress O"n where
(5)
It should be noted that the shear capacity at a geosyntheticmodular concrete unit interface may be reduced by the pres-
50 example facing unit geometry
40
~ N _ cosib ( tanib) -2 1 ---
tan{w + ib) 2
~ ·c: 30 ::I
0 Ci5 .0 E 20 ::I c:
10
0
0 5 10 15
c.o (degrees)
FIGURE 8 Influence of wall inclination on number of facing units within hinge height.
20
ence of a geosynthetic inclusion. Consequently, shear tests must be carried out to quantify the ultimate strength of segmental units with and without a geosynthetic between course layers.
Connection Strength Between Modular Units and Geosynthetic Reinforcement
The connection between the geosynthetic reinforcement and the dry-stacked column of modular concrete units is a critical construction detail in reinforced segmental retaining wall design. Most connections are essentially frictional in nature, although a portion of pullout resistance may also be developed by the bearing action of transverse geogrid members against concrete keys or mechanical connectors.
In addition to differences in interface geometry and connection type, the connection performance will be influenced by (a) hollow or solid masonry concrete construction, (b) whether the hollow core is left empty or infilled with granular
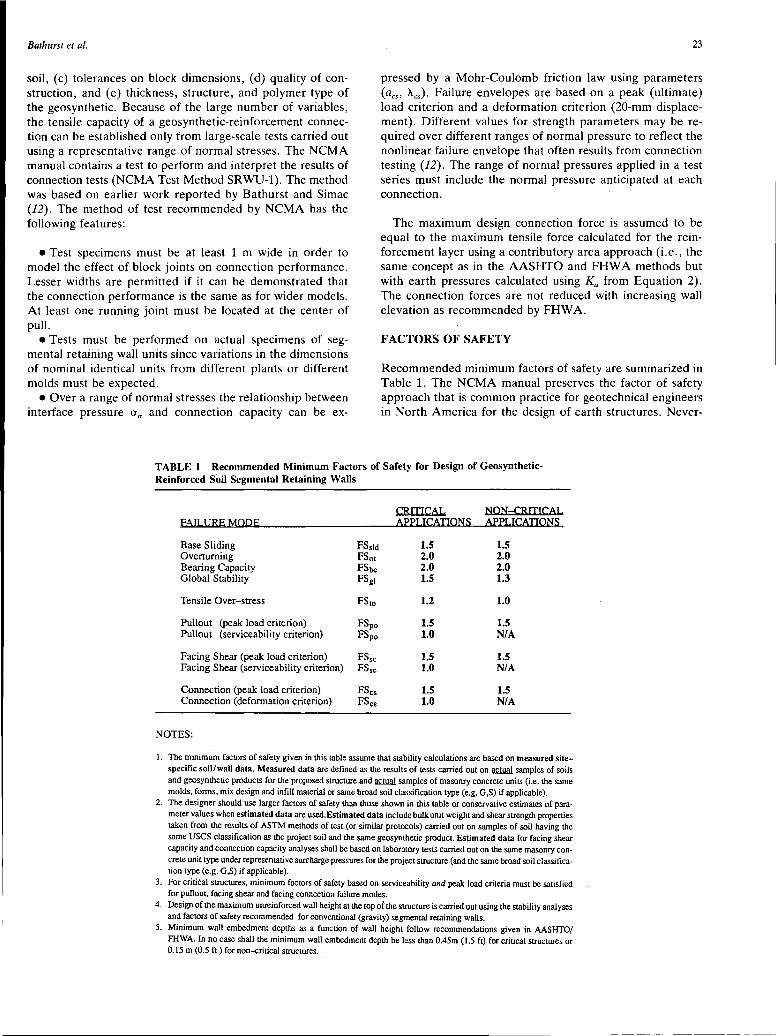
Bathurst et al.
soil, (c) tolerances on block dimensions, (d) quality of construction, and (e) thickness, structure, and polymer type of the geosynthetic. Because of the large number of variables, the tensile capacity of a geosynthetic-reinforcement connection can be established only from large-scale tests carried out using a representative range of normal stresses. The NCMA manual contains a test to perform and interpret the results of connection tests (NCMA Test Method SRWU-1). The method was based on earlier work reported by Bathurst and Simac (12). The method of test recommended by NCMA has the following features:
• Test specimens must be at least 1 m wide in order to model the effect of block joints on connection performance. Lesser widths are permitted if it can be demonstrated that the connection performance is the same as for wider models. At least one running joint must be located at the center of pull.
• Tests must be performed on actual specimens of segmental retaining wall units since variations in the dimensions of nominal identical units from different plants or different molds must be expected.
• Over a range of normal stresses the relationship between interface pressure crn and connection capacity can be ex-
23
pressed by a Mohr-Coulomb friction law using parameters (aw A.cs). Failure envelopes are based on a peak (ultimate) load criterion and a deformation criterion (20-mm displacement). Different values for strength parameters may be required over different ranges of normal pressure to reflect the nonlinear failure envelope that often results from connection testing (12). The range of normal pressures applied in a test series must include the normal pressure anticipated at each connection.
The maximum design connection force is assumed to be equal to the maximum tensile force calculated for the reinforcement layer using a contributory area approach (i.e., the same concept as in the AASHTO and FHW A methods but with earth pressures calculated using Ka from Equation 2). The connection forces are not reduced with increasing wall elevation as recommended by FHW A.
FACTORS OF SAFETY
Recommended minimum factors of safety are summarized in Table 1. The NCMA manual preserves the factor of safety approach that is common practice for geotechnical engineers in North America for the design of earth structures. Never-
TABLE 1 Recommended Minimum Factors of Safety for Design of GeosyntheticReinforced Soil Segmental Retaining Walls
FAILURE MODE
Base Sliding Overturning Bearing Capacity Global Stability
Tensile Over-stress
Pullout (peak load criterion) Pullout (serviceability criterion)
Facing Shear (peak load criterion) Facing Shear (serviceability criterion)
Connection (peak load criterion) Connection (deformation criterion)
NOTES:
FSsJd FSot FSbc FS81
FSto
FSpo FSpo
FSsc FSsc
FScs FScs
CRIDCAL APPLICATIONS
1.5 2.0 2.0 1.5
1.2
1.5 1.0
1.5 1.0
1.5 1.0
NON=CRIDCAL APPLICATIONS
1.5 2.0 2.0 1.3
1.0
1.5 NIA
1.5 NIA
1.5 NIA
1. The minimum factors of safety given in this table assume that stability calculations are based on measured sitespecific soil/wall data. Measured data are defined as the results of tests carried out on~ samples of soils and geosynthetic products for the proposed structure and ~ samples of masonry concrete units (i.e. the same molds, forms, mix design and infill material or same broad soil classification type (e.g. G,S) if applicable).
2. The designer should use larger factors of safety than those shown in this table or conservative estimates of parameter values when estimated data are used. Estimated data include bulk unit weight and shear strength properties taken from the results of ASTM methods of test (or similar protocols) carried out on samples of soil having the same USCS classification as the project soil and the same geosynthetic product. Estimated data for facing shear capacity and connection capacity analyses shall be based on laboratory tests carried out on the same masonry concrete unit type under representative surcharge pressures for the project structure (and the same broad soil classification type (e.g. G,S) if applicable).
3. For critical structures, minimum factors of safety based on serviceabiiity and peak load criteria must be satisfied for pullout, facing shear and facing connection failure modes.
4. Design of the maximum unreinforced wall height at the top of the structure is carried out using the stability analyses and factors of safety recommended for conventional (gravity) segmental retaining walls.
5. Minimum wall embedmenl depths as a function of wall height follow recommendations given in AASHTO/ FHWA. In no case shall the minimum wall embedmelil depth be less than 0.45m (1.5 fl) for critical structures or 0.15 m (0.5 ft) for non-critical structures.
24
theless, the NCMA manual introduces recommended minimum factors of safety for failure mechanisms not previously addressed (e.g., interface shear failure and connection failure). In addition, the manual distinguishes in some cases between minimum recommended factors of safety on the basis of whether a structure is critical or noncritical. A noncritical structure in NCMA manual terminology is "a structure in which loss of life would not occur as a result of wall failure nor would failure result in significant property damage or loss of necessary function of adjacent services or structures." A critical structure is clearly the converse. Permanent structures are usually considered critical structures and are designed for a life of 75 to 100 years. Similarly, transportation-related structures would normally be considered critical structures.
The footnotes to Table 1 explain that the factors of safety listed are minimum values. The recommended minimum factors of safety should be used only if design parameters are taken from laboratory tests using materials identical to those proposed in the field. The designer should adjust factors of safety upward when design parameters are estimated from laboratory tests carried out on similar materials.
Factors of safety in the table for external modes of failure, tensile overstress, and pullout in noncritical structures using measured data are consistent with FHW A recommendations.
LONG-TERM DESIGN STRENGTH OF GEOSYNTHETIC REINFORCEMENT
The long-term design strength (L TDS) of the geosynthetic reinforcement is viewed by some as the most important single parameter in geosynthetic-reinforced soil wall design. However, its calculation is often a source of unease with many designers because of questions about durability, construction damage, and creep.
In the NCMA design manual two approaches are available to the designer for calculating the L TDS for a candidate reinforcement: Methods A and B. Space constraints in this paper prevent a complete description of the methods, but the reader is referred to the NCMA manual for a complete description. A brief statement of the two methods follows.
Method A
Method A has been adapted from a recent publication by FHWA for the design, analysis, and construction of reinforced earth slopes and embankments on firm foundations (13 ,p.98). This document is a consensus geosynthetics manufacturing industry standard that is based on the AASHTO ( 6) and FHW A (5 ,p.287) guidelines referenced earlier in the paper arid selected Geosynthetic Research Institute (GRI) standards (14). The modification relates to the introduction of an overall factor of safety for uncertainties as proposed by AASHTO for reinforced soil retaining wall design.
Method B
Method B was developed by the authors to provide a comprehensive treatment of the calculation of long-term design
TRANSPORTATION RESEARCH RECORD 1414
load for geosynthetics in soil reinforcement applications. Method B borrows heavily from the work of Jewell and Greenwood (15) and is similar to European practice for the calculation of L TDS. The principal difference between the two approaches is that Method B decouples the factor of safety against overall uncertainty from the calculation of L TDS. In addition, specific calculation steps are contained in Method B that allow the designer to estimate LTDS from productspecific creep data using a common framework that is independent of the geosynthetic product type.
Method B in the NCMA manual recommends that L TDS be related to a maximum load, T1im' which is the estimated maximum in-isolation, constant load that will just prevent the cumulative elastic and plastic strain in the reinforcement from exceeding a maximum strain value over the design life of the structure. In no case is the design maximum strain value allowed to be greater than 10 percent. The definition adopted in this manual is similar to the serviceability state criterion that appears in the current AASHTO guidelines.
The L TDS is calculated as
LTDS FC x FD x FB
(6)
where
FC = partial material factor for construction site installa-tion damage,
FD partial material factor for chemical degradation, and FB partial material factor for biological degradation.
The definition of LTDS in the NCMA manual differs from AASHTO and GRI Standards of Practice GG4 and GTI by restricting all uncertainties in the calculation of LTDS to factors related directly to the long-term strength of the geosynthetic reinforcement under in-service conditions. A so-called overall factor of safety is not included in Equation 6 because this overall uncertainty is independent of the presence of the geosynthetic reinforcement in the structure. The philosophy adopted in the NCMA manual is that the degree of uncertainty in soil properties should be accounted for by basing the selection of factors of safety on estimated values or site-specific data as noted in Table 1. Uncertainty in external loading is best treated by using conservative estimates of parameters that contribute to destabilizing forces.
CONCLUDING REMARKS
This paper has summarized the most important features of the NCMA design manual for analysis and design of
· geosynthetic-reinforced soil retaining walls that use dry-stacked masonry concrete units as the facing system. The emphasis in the manual has been to present the designer with a comprehensive and rational approach to the design and analysis of modular masonry wall systems. The methodology is sufficiently detailed to allow the designer to quantify the influence of candidate facing units on the stability of otherwise identical geosynthetic-reinforced soil walls. This feature is not available in current FHW A and AASHTO guidelines. Finally, it should be noted that the manual also includes an integrated design and analysis approach for conventional (gravity) structures
Bathurst et al.
that use unreinforced backfills and contains construction guidelines and sample material specifications.
ACKNOWLEDGMENTS
The authors would like to acknowledge the contribution of Steven E. Lothspeich of Earth Improvement Technologies to· the successful completion of the NCMA manual and Robert Thomas at NCMA, who offered many helpful suggestions. The authors are also grateful to R. G. Karpurarpu at Royal Military College who prepared a number of the figures in the paper.
REFERENCES
1. Simac, M. R., B. R. Christopher, and C. Bonczkiewicz. Instrumented Field Performance of a 6 m Geogrid Wall. Proc., 4th International Conference on Geotextiles, Geomembranes and Related Products, The Hague, The Netherlands, 1990.
2. Berg, R. R. The Technique of Building Highway Retaining Walls. Geotechnical Fabrics Report, Vol. 9, No. 5, July-Aug. 1991, pp. 38-43.
3. Simac, M. R., R. J. Bathurst, and R. A. Goodrun. Design and Analysis of Three Reinforced Soil Retaining Walls. Proc., Geosynthetics '91 Conference, Vol. 2, Atlanta, Ga., 1991, pp. 781-789.
4. Simac, M. R., R. J. Bathurst, R. R. Berg, and S. E. Lothspeich. Design Manual for Segmental Retaining Walls (Modular Concrete Block Retaining Wall Systems). National Concrete Masonry Association, Herndon, Va., 1993.
25
5. Christopher, B. R., S. A. Gill, J.-P. Giroud, I. Juran, F. Schlosser, J. K. Mitchell, and J. Dunnicliff. Design and Construction Guidelines for Reinforced Soil Structures, Vol. 1. Report FHW ARD-89-043. FHWA, U.S. Department of Transportation, 1989.
6. Standard Specifications for Highway Bridges, 15th ed. AASHTO, Washington, D.C., 1992.
7. Specification for Segmental Retaining Wall Units. TEK SOA. National Concrete Masonry Association, Herndon, Va., 1991.
8. Berg, R. R., R. Bonaparte, P. Anderson, and V. E. Chourey. Design, Construction and Performance of Two Geogrid-Reinforced Soil Retaining Walls. Proc., 3rd International Conference on Geotexti/es, Vienna, Austria, 1986, pp. 401-406.
9. Bathurst, R. J., and M. R. Simac. Review of Three Instrumented Geogrid Reinforced Soil Retaining Walls. Proc., Geosynthetics: Design and Performance, Vancouver, British Columbia, Canada, 1991.
10. Jumikis, A. R. Soil Mechanics. D. Van Nostrand Company Inc., Princeton, N.J., 1962.
11. Bathurst, R. J., D. J. Benjamin, and P. M. Jarrett. An Instrumented Geogrid Reinforced Soil Wall. Proc., 12th International Conference on Soil Mechanics and Foundation Engineering, Rio de Janeiro, Brazil, Aug. 1989, pp. 1223-1226.
12. Bathurst, R. J. and M. R. Simac. Laboratory Testing of Modular Masonry Concrete Block-Geogrid Facing Connections. Presented at ASTM Symposium of Geosynthetic Soil Reinforcement Testing, San Antonio, Tex., Jan. 1993.
13. Berg, R. R. Guidelines for Design, Specification, and Contracting of Geosynthetic Mechanically Stabilized Earth Slopes on Firm Foundations. FHWA, U.S. Department of Transportation, 1992.
14. Geotechnical Research Institute Standards. Geotechnical Research Institute, Drexel University, Philadelphia, Pa., Jan. 1992.
15. Jewell, R. A., and J. H. Greenwood. Long-Term Strength and Safety in Steep Slopes Reinforced by Polymer Materials. Geotextiles and Geomembranes, Vol. 7, 1988, pp. 81-118.
Publication of this paper sponsored by Committee on Foundations of Bridges and Other Structures.
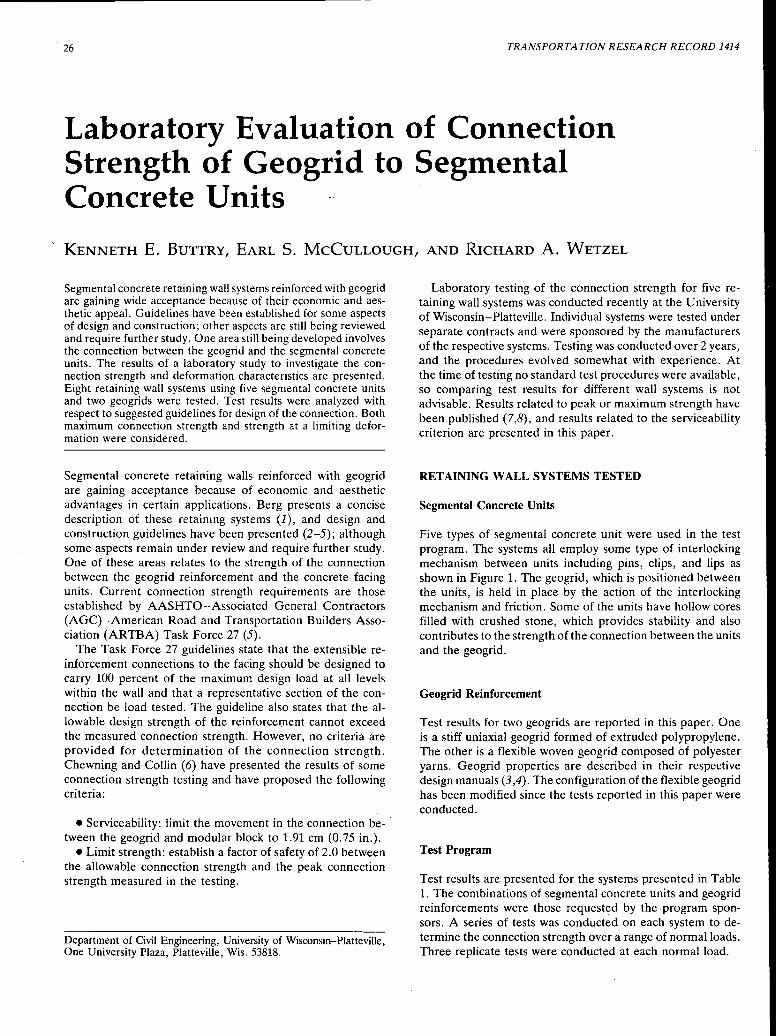
26 TRANSPORTATION RESEARCH RECORD 1414
Laboratory Evaluation of Connection Strength of Geogrid to Segmental Concrete Units
, KENNETH E. BUTTRY, EARL S. McCULLOUGH, AND RICHARD A. WETZEL
Segmental concrete retaining wall systems reinforced with geogrid are gaining wide acceptance because of their economic and aesthetic appeal. Guidelines have been established for some aspects of design and construction; other aspects are still being reviewed and require further study. One area still being developed involves the connection between the geogrid and the segmental concrete units. The results of a laboratory study to investigate the connection strength and deformation characteristics are presented. Eight retaining wall systems using five segmental concrete units and two geogrids were tested. Test results were analyzed with respect to suggested guidelines for design of the connection. Both maximum connection strength and strength at a limiting deformation were considered.
Segmental concrete retaining walls reinforced with geogrid are gaining acceptance because of economic and aesthetic advantages in certain applications. Berg presents a concise description of these retaining systems (J), and design and construction guidelines have been presented (2-5); although some aspects remain under review and require further study. One of these areas relates to the strength of the connection between the geogrid reinforcement and the concrete facing units. Current connection strength requirements are those established by AASHTO-Associated General Contractors (AGC)-American Road and Transportation Builders Association (ARTBA) Task Force 27 (5).
The Task Force 27 guidelines state that the extensible reinforcement connections to the facing should be designed to carry 100 percent of the maximum design load at all levels within the wall and that a representative section of the connection be load tested. The guideline also states that the allowable design strength of the reinforcei::nent cannot exceed the measured connection strength. However, no criteria are provided for determination of the connection strength. Chewning and Collin ( 6) have presented the results of some connection strength testing and have proposed the following criteria:
• Serviceability: limit the movement in the connection between the geogrid and modular block to 1.91 cm (0.75 in.).
•Limit strength: establish a factor of safety of 2.0 between the allowable connection strength and the peak connection strength measured in the testing.
Department of Civil Engineering, University of Wisconsin-Platteville, One University Plaza, Platteville, Wis. 53818.
Laboratory testing of the connection strength for five retaining wall systems was conducted recently at the University of Wisconsin-Platteville. Individual systems were tested under separate contracts and were sponsored by the manufacturers of the respective systems. Testing was conducted over 2 years, and the procedures evolved somewhat with experience. At the time of testing no standard test procedures were available, so comparing test results for different wall systems is not advisable. Results related to peak or maximum strength have been published (7,8), and results related to the serviceability criterion are presented in this paper.
RETAINING WALL SYSTEMS TESTED
Segmental Concrete Units
Five types of segmental concrete unit were used in the test program. The systems all employ some type of interlocking mechanism between units including pins, clips, and lips as shown in Figure 1. The geogrid, which is positioned between the units, is held in place by the action of the ii;iterlocking mechanism and friction. Some of the units have hollow cores filled with crushed stone, which provides stability and also contributes to the strength of the connection between the units and the geogrid.
Geogrid Reinforcement
Test results for two geogrids are reported in this paper. One is a stiff uniaxial geogrid formed of extruded polypropylene. The other is a flexible woven geogrid composed of polyester yarns. Geogrid properties are described in their respective design manuals (3,4). The configuration of the flexible geogrid has been modified since the tests reported in this paper were conducted.
Test Program
Test results are presented for the systems presented in Table 1. The combinations of segmental concrete units and geogrid reinforcements were those request~d by the program sponsors. A series of tests was conducted on each system to determine the connection strength over a range of normal loads. Three replicate tests were conducted at each normal load.
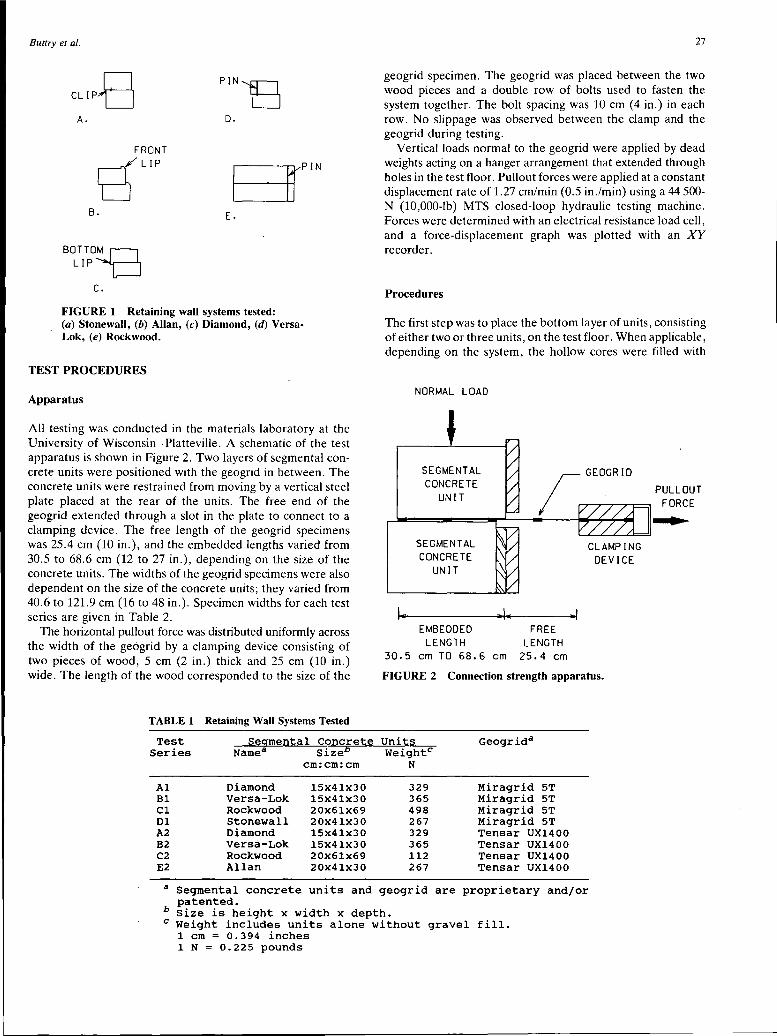
Buttry et al.
CLIP8 A.
FRONT
BLIP B.
BOTTO~
LIP l-J c.
PIN'B D.
E.
FIGURE 1 Retaining wall systems tested: (a) Stonewall, (b) Allan, (c) Diamond, (d) VersaLok, (e) Rockwood.
TEST PROCEDURES
Apparatus
All testing was conducted in the materials laboratory at the University of Wisconsin-Platteville. A schematic of the test apparatus is shown in Figure 2. Two layers of segmental concrete units were positioned with the geogrid in between. The concrete units were restrained from moving by a vertical steel plate placed at the rear of the units. The free end of the geogrid extended through a slot in the plate to connect to a clamping device. The free length of the geogrid specimens was 25.4 cm (10 in.), and the embedded lengths varied from 30.5 to 68.6 cm (12 to 27 in.), depending on the size of the concrete units. The widths of the geogrid specimens were also dependent on the size of the concrete units; they varied from 40.6 to 121.9 cm (16 to 48 in.). Specimen widths for each test series are given in Table 2.
The horizontal pullout force was distributed uniformly across the width of the geogrid by a clamping device consisting of two pieces of wood, 5 cm (2 in.) thick and 25 cm (10 in.) wide. The length of the wood corresponded to the size of the
TABLE 1 Retaining Wall Systems Tested
Test Segmental Concrete Series Namea sizeh
cm: cm: cm
Al Diamond 15X41X30 Bl Versa-Lok 15x4lx30 Cl Rockwood 20X61X69 Dl Stonewall 20x4lx30 A2 Diamond 15X41X30 B2 Versa-Lok 15X41X30 C2 Rockwood 20x6lx69 E2 Allan 20x4lx30
27
geogrid specimen. The geogrid was placed between the two wood pieces and a double row of bolts used to fasten the system together. The bolt spacing was 10 cm ( 4 in.) in each row. No slippage was observed between the clamp and the geogrid during testing.
Vertical loads normal to the geogrid were applied by dead weights acting on a hanger arrangement that extended through holes in the test floor. Pullout forces were applied at a constant displacement rate of 1.27 cm/min (0.5 in./min) using a 44 500-N (10,000-lb) MTS closed-loop hydraulic testing machine. Forces were determined with an electrical resistance load cell, and a force-displacement graph was plotted with an XY recorder.
Procedures
The first step was to place the bottom layer of units, consisting of either two or three units, on the test floor. When applicable, depending on the system, the hollow cores were filled with
NORMAL LOAD
SEGMENTAL CONCRETE
UNIT
SEGMENTAL CONCRETE
UNIT
EMBEDDED LENGTH
30.5 cm TO 68.6 cm
FREE LENGTH
25.4 cm
,.,
FIGURE 2 Connection strength apparatus.
Units Geogrida Weightc
N
329 Miragrid 5T 365 Miragrid 5T 498 Miragrid 5T 267 Miragrid 5T 329 Tensar UX1400 365 Tensar UX1400 112 Tensar UX1400 267 Tensar UX1400
PULLOUT FORCE ....
a Segmental concrete units and geogrid are proprietary and/or patented.
b Size is height x width x depth. c Weight includes units alone without gravel fill.
1 cm= 0.394 inches 1 N = 0.225 pounds
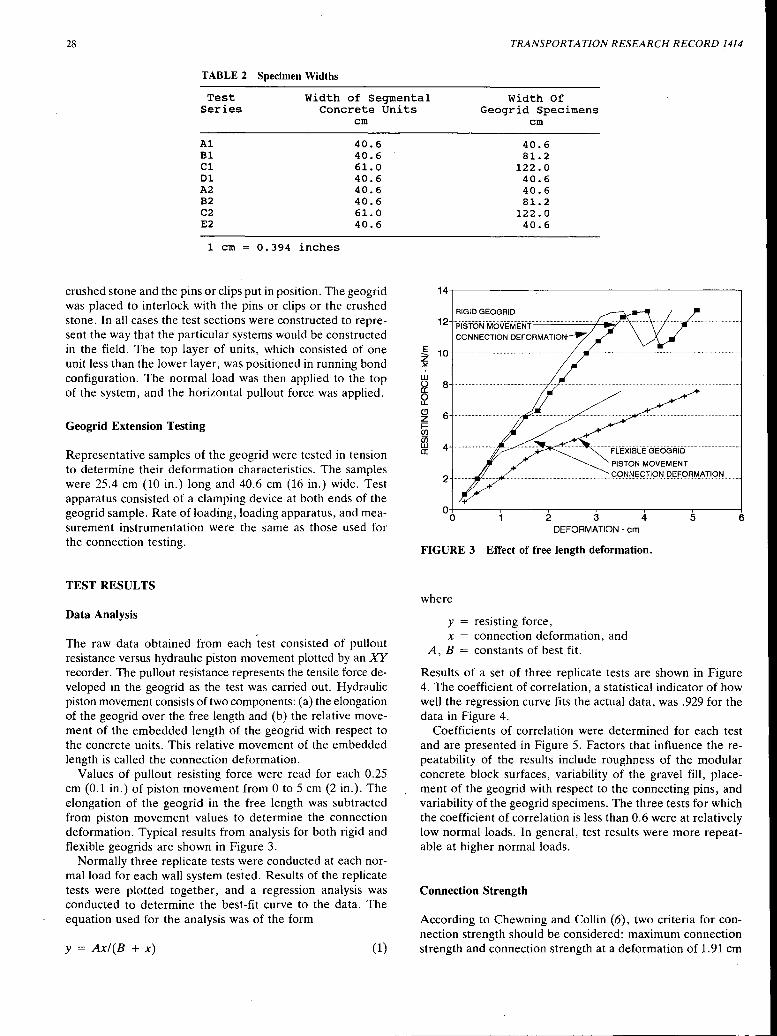
28 TRANSPORTATION RESEARCH RECORD 1414
TABLE 2 Specimen Widths
Test Series
Width of Segmental Concrete Units
cm
Width Of Geogrid Specimens
cm
Al Bl Cl Dl A2 B2 C2 E2
1 cm 0.394 inches
40.6 40.6 61.0 40.6 40.6 40.6 61. 0 40.6
crushed stone and the pins or clips put in position. The geogrid was placed to interlock with the pins or clips or the crushed stone. In all cases the test sections were constructed to represent the way that the particular systems would be constructed in the field. The top layer of units, which consisted of one unit less than the lower layer, was positioned in running bond configuration. The normal load was then applied to the top of the system, and the horizontal pullout force was applied.
Geogrid Extension Testing
Representative samples of the geogrid were tested in tension to determine their deformation characteristics. The samples were 25.4 cm (10 in.) long and 40.6 cm (16 in.) wide. Test apparatus consisted of a clamping device at both ends of the geogrid sample. Rate of loading, loading apparatus, and measurement instrumentation were the same as those used for the connection testing.
TEST RESULTS
Data Analysis
The raw data obtained from each test consisted of pullout resistance versus hydraulic piston movement plotted by an XY recorder. The pullout resistance represents the tensile force developed in the geogrid as the test was carried out. Hydraulic piston movement consists of two components: (a) the elongation of the geogrid over the free length and (b) the relative movement of the embedded length of the geogrid with respect to the concrete units. This relative movement of the embedded length is called the connection deformation.
Values of pullout resisting force were read for each 0.25 cm (0.1 in.) of piston movement from 0 to 5 cm (2 in.). The elongation of the geogrid in the free length was subtracted from piston movement values to determine the connection deformation. Typical results from analysis for both rigid and flexible geogrids are shown in Figure 3.
Normally three replicate tests were conducted at each normal load for each wall system tested. Results of the replicate tests were plotted together, and a regression analysis was conducted to determine the best-fit curve to the data. The equation used for the analysis was of the form
y = Axl(B + x) (1)
RIGID GEOGRID
40.6 81.2
122.0 40.6 40.6 81. 2
122.0 40.6
12 ··f>1s'T6'i.;.fM'OVEMENf-····----+-1.,, CONNECTION DEFORMATIO~
~ 10 ..... . .:;,(.
w ~ 0 u_
(!) z i= (/)
ffi a:
8
6·
4·
2·
.... ···········~··F'LExi'8LE.GE6GRi6····· PISTON MOVEMENT
......... 9QNN.1;9J.1.QN .. P..l::.F..Qf.lM.A..T.19t:-! ..... .
0-1---~---~--~---~---~---l
0 2 3 4 5 6 DEFORMATION - cm
FIGURE 3 Effect of free length deformation.
where
y resisting force, x connection deformation, and
A, B constants of best fit.
Results of a set of three replicate tests are shown in Figure 4. The coefficient of correlation, a statistical indicator of how well the regression curve fits the actual data, was .929 for the data in Figure 4.
Coefficients of correlation were determined for each test and are presented in Figure 5. Factors that influence the repeatability of the results include roughness of the modular concrete block surfaces, variability of the gravel fill, placement of the geogrid with respect to the connecting pins, and variability of the geogrid specimens. The three tests for which the coefficient of correlation is less than 0.6 were at relatively low normal loads. In general, test results were more repeatable at higher normal loads.
Connection Strength
According to Chewning and Collin ( 6), two criteria for connection strength should be considered: maximum connection strength and connection strength at a deformation of 1. 91 cm
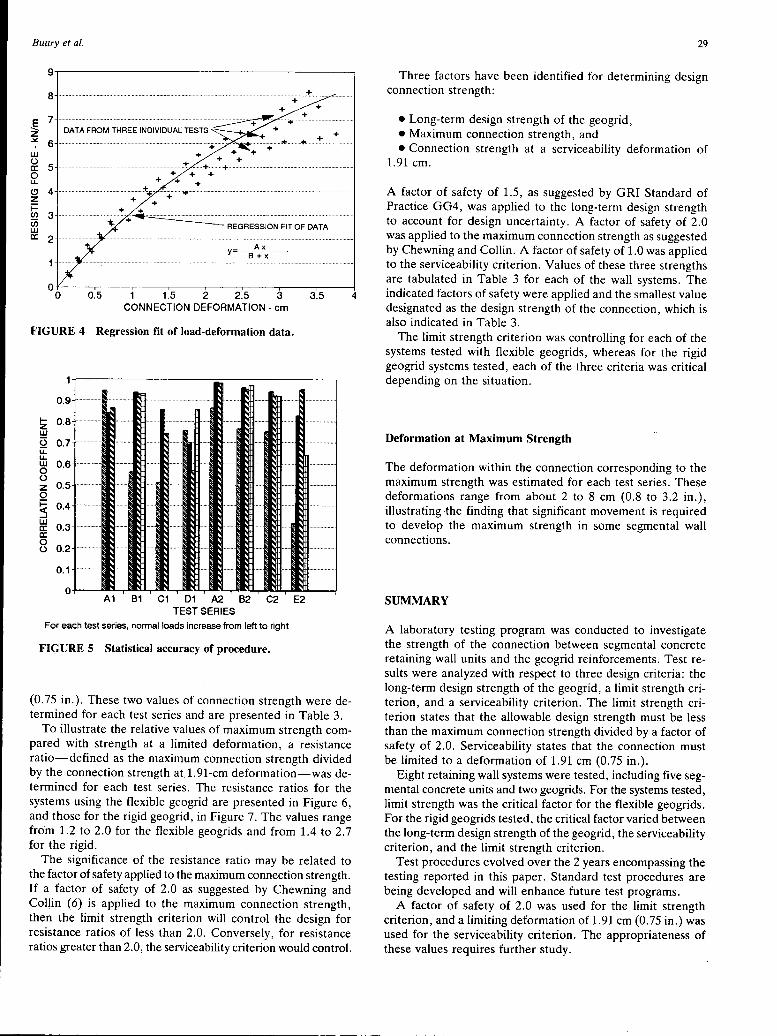
Buttry et al.
.E. 7 z .::.:. 6. w () c::: 0 u. ~ z
5 ....
4 ..
........ + ..... +
+ + ................... ± ........ +·······+······································································
+ + + + + +
........... +.+·· ·+······· ... ···· + +
+
~ Ci)
3 ........................................... '.':: .. ~ ................................................................................................................................... . ._, + __,,,---- REGRESSION FIT OF DATA w
c::: 2.
y- B~\
0.5 1 1.5 2 2.5 3 3.5 CONNECTION DEFORMATION - cm
FIGURE 4 Regression fit of load-deformation data.
0.9
f- 0.8 z w 0 0.7 u::: u. w 0.6 0 ()
z 0.5 0
~ 0.4
w 0.3 c:::
c::: 0
0.2 ()
0.1
0 A1 81 C1 01 A2 82 C2 E2
TEST SERIES
For each test series, normal loads increase from left to right
FIGURE 5 Statistical accuracy of procedure.
(0.75 in.). These two values of connection strength were determined for each test series and are presented in Table 3.
To illustrate the relative values of maximum strength compared with strength at a limited deformation, a resistance ratio-defined as the maximum connection strength divided by the connection strength at 1.91-cm deformation-was determined for each test series. The resistance ratios for the systems using the flexible geogrid are presented in Figure 6, and those for the rigid geogrid, in Figure 7. The values range from 1.2 to 2.0 for the flexible geogrids and from 1.4 to 2. 7 for the rigid.
The significance of the resistance ratio may be related to the factor of safety applied to the maximum connection strength. If a factor of safety of 2.0 as suggested by Chewning and Collin (6) is applied to the maximum connection strength, then the limit strength criterion will control the design for resistance ratios of less than 2.0. Conversely, for resistance ratios greater than 2.0, the serviceability criterion would control.
4
29
Three factors have been identified for determining design connection strength:
•Long-term design strength of the geogrid, •Maximum connection strength, and • Connection strength at a serviceability deformation of
1.91 cm.
A factor of safety of 1.5, as suggested by GRI Standard of Practice GG4, was applied to the long-term design strength to account for design uncertainty. A factor of safety of 2.0 was applied to the maximum connection strength as suggested by Chewning and Collin. A factor of safety of 1.0 was applied to the serviceability criterion. Values of these three strengths are tabulated in Table 3 for each of the wall systems. The indicated factors of safety were applied and the smallest value designated as the design strength of the connection, which is also indicated in Table 3.
The limit strength criterion was controlling for each of the systems tested with flexible geogrids, whereas for the rigid geogrid systems tested, each of the three criteria was critical depending on the situation.
Deformation at Maximum Strength
The deformation within the connection corresponding to the maximum strength was estimated for each test series. These deformations range from about 2 to 8 cm (0.8 to 3.2 in.), illustrating -the finding that significant movement is required to develop the maximum strength in some segmental wall connections.
SUMMARY
A laboratory testing program was conducted to investigate the strength of the connection between segmental concrete retaining wall units and the geogrid reinforcements. Test results were analyzed with respect to three design criteria: the long-term design strength of the geogrid, a limit strength criterion, and a serviceability criterion. The limit strength criterion states that the allowable design strength must be less than the maximum connection strength divided by a factor of safety of 2.0. Serviceability states that the connection must be limited to a deformation of 1.91 cm (0.75 in.).
Eight retaining wall systems were tested, including five segmental concrete units and two geogrids. For the systems tested, limit strength was the critical factor.for the flexible geogrids. For the rigid geogrids tested, the critical factor varied between the long-term design strength of the geogrid, the serviceability criterion, and the limit strength criterion.
Test procedures evolved over the 2 years encompassing the testing reported in this paper. Standard test procedures are being developed and will enhance future test programs.
A factor of safety of 2.0 was used for the limit strength criterion, and a limiting deformation of 1.91 cm (0.75 in.) was used for the serviceability criterion. The appropriateness of these values requires further study.
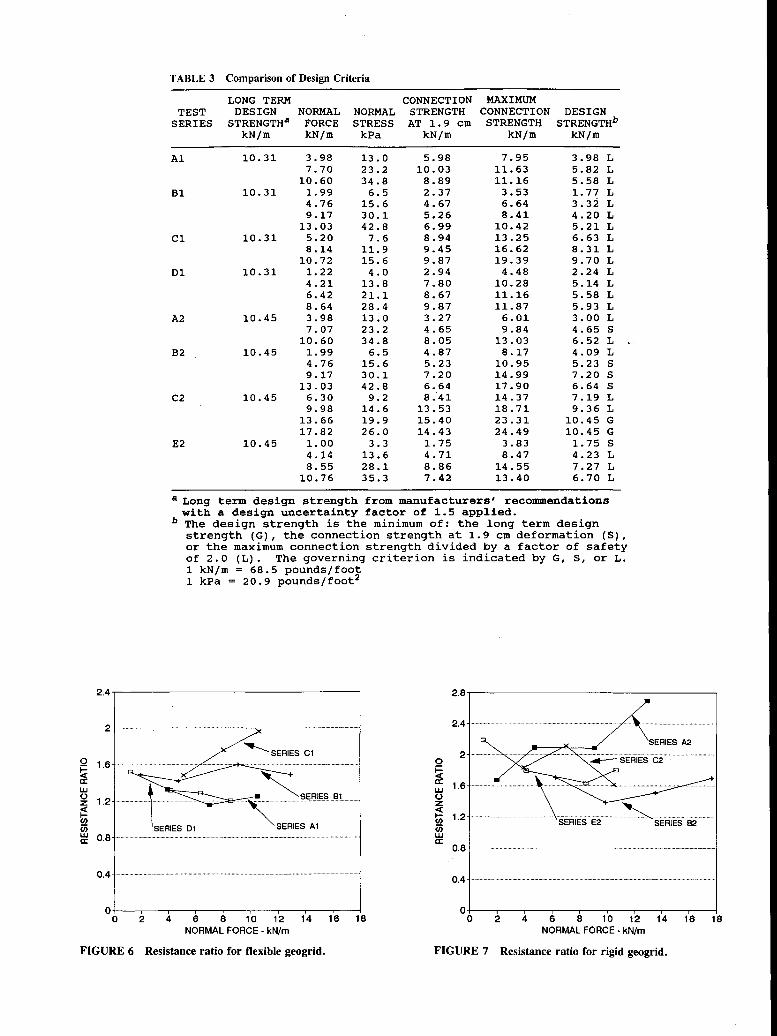
0
~ UJ 0 z ~ (/') Ci) UJ a:
2.4
2
1.6 ..
1.2
0.8.
0.4 ..
TABLE 3 Comparison of Design Criteria
TEST SERIES
Al
Bl
Cl
Dl
A2
B2
C2
E2
LONG TERM DESIGN
STRENGTHa kN/m
10.31
10. 31
10.31
10.31
10.45
10.45
10.45
10.45
NORMAL FORCE kN/m
3.98 7.70
10.60 1.99 4.76 9.17
13.03 5.20 8.14
10.72 1. 22 4.21 6.42 8.64 3.98 7.07
10.60 1.99 4.76 9.17
13.03 6.30 9.98
13.66 17.82 1. 00 4 .14 8.55
10.76
NORMAL STRESS
kPa
13.0 23.2 34.8 6.5
15.6 30.l 42.8 7.6
11. 9 15.6 4.0
13.8 21.1 28.4 13.0 23.2 34.8
6.5 15.6 30.1 42.8 9.2
14.6 19.9 26.0
3.3 13.6 28.1 35.3
CONNECTION STRENGTH AT 1.9 cm
kN/m
5.98 10.03 8.89 2.37 4.67 5.26 6.99 8.94 9.45 9.87 2.94 7.80 8.67 9.87 3.27 4.65 8.05 4.87 5.23 7.20 6.64 8.41
13.53 15.40 14.43 1. 75 4.71 8.86 7.42
MAXIMUM CONNECTION
STRENGTH kN/m
7.95 11. 63 11.16
3.53 6.64 8.41
10.42 13.25 16.62 19.39 4.48
10.28 11.16 11.87
6.01 9.84
13.03 8.17
10.95 14.99 17.90 14.37 18.71 23.31 24.49
3.83 8.47
14.55 13.40
DESIGN STRENGTHb
kN/m
3.98 L 5.82 L 5.58 L 1. 77 L 3.32 L 4.20 L 5.21 L 6.63 L 8. 31 L 9.70 L 2.24 L 5.14 L 5.58 L 5.93 L 3.00 L 4.65 s 6.52 L 4.09 L 5.23 s 7.20 s 6.64 s 7.19 L 9.36 L
10.45 G 10.45 G
1. 75 s 4.23 L 7.27 L 6.70 L
a Long term design strength from manufacturers• recommendations with a design uncertainty factor of 1.5 applied.
b The design strength is the minimum of: the long term design strength (G), the connection strength at 1.9 cm deformation (S), or the maximum connection strength divided by a factor of safety of 2.0 (L). The governing criterion is indicated by G, s, or L. 1 kN/m = 68.5 pounds/foot 1 kPa = 20.9 pounds/foot2
2.8
2.4.
0 2 ······-
~ 1.6 UJ 0 z ~ (/') 1.2 Ci) UJ a:
0.8 ..
0.4 ······················· ···················-······ ........ ···························-··
0+-~.--~.-~.-~-.-~.,.-~-r--~--,---~-.-~--1 O+-~~~~~~~-.-~----.-~----.-~----.-~~~--l
0 2 4 6 8 10 12 14 16 18 0 2 4 6 8 10 12 14 16 18 NORMAL FORCE - kN/m NORMAL FORCE - kN/m
FIGURE 6 Resistance ratio for flexible geogrid. FIGURE 7 Resistance ratio for rigid geogrid.
Buttry et al.
ACKNOWLEDGMENTS
The authors wish to acknowledge and thank the corporate sponsors of this applied research program, which include Allan Block Inc., Block Systems Inc., Mirafi Inc., Rockwood Retaining Wall Systems, Stonewall Landscape Systems, Tensar Corporation, and Versa-Lok Retaining Wall Systems. The University of Wisconsin-Platteville also provided funding for the program.
REFERENCES
1. Berg, R. R. The Technique of Building Highway Retaining Walls. Geotechnical Fabrics Report, Vol. 9, No. 5, July-Aug. 1991, pp. 38-43.
2. Christopher, B. R., S. A. Gill, J.-P. Giroud, I. Juran, J. K. Mitchell, F. Schlosser, and J. Dunnicliff. Design and Construction Guidelines for Reinforced Soil Structures, Vol. 1. Report FHWARD-89-043 .. FHWA, U.S. Department of Transportation, 1989.
3. Simac, M. R. Design Methodology for Miragrid Reinforced Soil Retaining Walls. Mirafi Inc., Charlotte, N .C., 1990.
31
4. Design Guidelines for Tensar Geogrid Reinforced Soil Walls with Modular Concrete Facing Units. TensarTechnical Note TTN:RWl.1. Tensar Corp., Morrow, Ga., Aug. 1990.
5. Design Guidelines for Use of Extensible Reinforcements (Geosynthetics) for Mechanically Stabilized Earth Walls in Permanent Applications. Task Force 27, AASHTO-AGC-ARTBA Committee on Materials, AASHTO, Washington, D.C., 1989.
6. Chewning, R. J., and J. G. Collin. Evaluation of Geogrid to Wall Facing Connections for Modular Block Earth Retaining Wall Systems. Design and Construction with Geosynthetics: Proc., 12th Ohio River Valley Soils Seminar, Lexington, Ky., Oct. 1991, pp. 5-1-5-13.
7. Kliethermes, J.C., K. Buttry, E. McCullough, and R. Wetzel. Modular Concrete Retaining Wall and Geogrid Reinforcement Performance and Laboratory Modeling. Proc., Geosynthetics '91 Conference, Vol. 2, Atlanta, Ga., Feb. 1991, pp. 951-964.
8. Buttry, K., E. McCullough, and R. Wetzel. Pullout Testing for Modular Concrete Retaining Walls Reinforced with Geogrid. Design and Construction with Geosynthetics: Proc., 12th Ohio River Valley Soils Seminar, Lexington, Ky., Oct. 1991, pp. 2-1-2-6.
Publication of this paper sponsored by Committee on Geosynthetics.
32 TRANSPORTATION RESEARCH RECORD 1414
Connection Strength Criteria for Mechanically Stabilized Earth Walls
}AMES G. COLLIN AND RYAN R. BERG
A rational design approach for determining the c~~nection stre~gth for geosynthetic-reinforced, mechanically stab1hze~ earth. h1~hway walls is presented. This procedure draws hea~lly on similar procedures established within guidelines for determmmg the longterm allowable strength of the geosynthetic reinforcement .for transportation applications. Test procedures and results of a limited testing program are presented, and use of the proposed design methodology is demonstrated.
During the past decade, polymer-reinforced soil retaining walls have gained wide acceptance as an economical alternative to both conventional cast-in-place concrete retaining walls and mechanically stabilized earth (MSE) walls using metallic reinforcements. The state-of-practice methodology used to analyze polymer-reinforced soil walls has been advanced by Mitchell and Villet (1), Christopher et al. (2), and AASHTOAssociated General Contractors (AGC)-American Road and Transportation Builders Association (ARTBA) Task F~~ce 27 (3). Procedures for both the internal and external stab1hty analyses of reinforced soil walls and for the determination of allowable design tensile loads on geosynthetics are presented in these documents.
However, the connection between the reinforcement and the wall facing is not comprehensively addressed in these guidelines. Task Force 27 (3), which specifically addresses highway wall applications, established the following general criteria for the connection strength of MSE walls using geosynthetic reinforcements:
• Extensible reinforcement connections to the wall face should be designed to carry 100 percent of the maximum design load at all levels within the wall.
•A representative section of the connection type (e.g., segmental concrete unit and geogrid reinforcement) should be load tested in order to determine the actual allowable working load for the connection system.
• The allowable design strength of the reinforcement cannot exceed that of the measured connection strength of the facing system.
• The allowable design strength of the connection should be determined at the in-ground service temperature. If no information is provided, the assumed temperature shall be taken as 37 .8°C.
J. G. Collin, Tensar Earth Technologies, Inc., 5775B Glenridge Drive, Suite 450, Atlanta, Ga. 30328. R. R. Berg, 2190 Leyland Alcove, Woodbury, Minn. 55125.
Application of these general criteria to design of a wall structure is subject to interpretation by the design engineer and by the contracting agency.
Tensile strength computations (3-5) for polymer soil reinforcement elements account for creep, damage during installation, biological degradation, and chemical degradation. Intuitively, the connection of reinforcement to wall facing elements should also consider these potential effects. The effects may vary, as interaction mechanisms, placement techniques, and environment may differ between reinforcement placed in a soil and reinforcement placed in a retaining wall face unit. The Task Force 27 guidelines and AASHTO bridge manual ( 6) do not specifically state that the factors affecting strength should be addressed separately for the connection areas. Hence, the current state of practice for the design of highway MSE structures varies with interpretations of the designer or regulatory agency and whether the long-term performance of the connection is considered. Short-term connection tests are routinely used to predict long-term performance.
An expanded connection strength design procedure, consistent with existing design guidelines for computing allowable tensile strength, has been developed and is presented. The proposed procedure addresses the long-term performance of the connection between the geosynthetic reinforcement and wall face elements. A laboratory testing program has also been conducted to determine the long-term mechanical performance of some wall connections (durability was not within the scope of this test program). Geogrid soil reinforcement elements and concrete segmental retaining wall (SRW) facing units were specifically examined at ambient (23°C) temperatures. The results of the testing program and an example calculation with the proposed procedure are presented.
ALLOWABLE TENSILE STRENGTH COMPUTATION PROCEDURES
The Task Force 27 guidelines, which are also incorporated into the AASHTO bridge manual, established a procedure for determining the long-term allowable strength (Ta) of geosynthetic soil reinforcement for MSE highway wall structures. The criteria used in that procedure, with some modifications, appear to be appropriate for the evaluation of the connection strength between the reinforcement and wall facing elements, for transportation-related projects.
One design consideration is serviceability. At the design load, how much movement might the wall experience during the life of the structure? This movement will be a function of
Collin and Berg
the polymer reinforcement elongation (material and product structure creep) and possibly of creep associated with the soilreinforcement interaction. After construction of a geosynthetic MSE wall, the total creep of the reinforcement should be limited so that the wall face does not move significantly (i.e., structure remains serviceable) and stays aesthetically pleasing. Thus, per Task Force 27 guidelines (without connection strength and geogrid junction strength criteria shown), the long-term allowable strength must be less than or equal to the following:
Tas = Tj(FD x FC) (1)
where
T as = long-term geosynthetic tension based on a serviceability state criterion,
T w = tension level at which total strain does not exceed 5 percent within desired lifetime at design temperature,
FD = factor for chemical and biological durability, and FC = factor for construction damage.
The Task Force 27 guidelines further establish that the longterm allowable strength of the geosynthetic must also be evaluated at the limit state and that failure by rupture of the reinforcement must be prevented. The equation for this evaluation is given as
Tai = T/(FD x FC x FS) (2)
where
Tai = long-term geosynthetic tension based on a limit state criterion,
T1 = highest tension level at which accumulated creep strain rate continues to decrease with log-time within required design lifetime at design temperature, and
FS = factor of safety for general uncertainties.
The limit state criterion evaluates the allowable strength of the reinforcement by considering creep of the geosynthetic (i.e., from 10,000-hr creep tests on actual samples of the reinforcement and extrapolation to the design life), the effects of installation damage, and durability. Finally, the strength is reduced by a factor of safety for general uncertainties associated with material properties, design, and construction. A minimum factor of safety of 1.5 is required in the Task Force 27 guidelines and is used with full (i.e., unfactored) peak soil shear strength values.
Guidance for quantifying installation damage and durability factors have been provided by the Geosynthetic Research Institute (GRI) Standards of Practice GG4 and GT7 and Task Force 27. After determining serviceability and limit state tension values and the appropriate reduction factors, the Ta of the geosynthetic reinforcement is established as the minimum of T as or Ta1, per Equations 1 and 2, respectively. Ta, however, must also consider, and may be limited by, the connection strength between reinforcement and wall face.
Additionally, determination of the coefficient of interaction (Ci) between the reinforcement and soil as determined from pullout tests is limited by a serviceability requirement in the Task Force 27 guidelines. The ultimate pullout capacity of a
33
reinforcement may occur at displacements of 50 to 100 mm. This magnitude of movement could be unacceptable with regard to the alignment of a retaining wall face. Therefore, for embedment in soil, the maximum allowable pullout force used to determine Ci was established at a 20-mm limit on pullout. Wall movement associated with tensile loading of the reinforcement within the soil mass is limited both by the 5 percent serviceability creep strain limit and the 20-mm limit on pullout.
PROPOSED CONNECTION STRENGTH DESIGN PROCEDURE
The design of the connection between the reinforcement and wall face for a geosynthetic-reinforced MSE wall used in transportation applications should consider the same generalized criteria established by Task Force 27 for evaluating the longterm allowable strength of the soil reinforcement. Both a serviceability and a limit state analysis should be used.
Just as strain of the reinforcement and pullout of the reinforcement within the soil mass are limited in determining the Ta of the geosynthetic, the allowable deformation of the geosynthetic at the wall face connection should be limited. The movement of the wall face over the design life may be restricted by limiting the deformation at the connection. Although Task Force 27 guidelines do not specifically address the maximum elongation between reinforcement and wall face, they do limit the amount of overall elongation of the reinforcement embedded in soil during pullout to less than 20 mm. This deformation is as measured with a quick (e.g., displacement rate of 1 mm/min) pullout test. Therefore, for consistency, a 20-mm deformation, as determined with a quick connection strength test, is established in this document as the maximum allowable movement at the connection. The allowable serviceability connection strength is then determined as follows:
(3)
where Tes is the long-term allowable connection strength based on a serviceability criterion and T wconn is the connection strength at 20-mm displacement at design temperature.
The results of a quick connection test between a geosynthetic reinforcement (geogrid of singular manufacture construction) and a concrete SRW unit that uses a pinned type of connection are shown in Figure 1. The ultimate connection strength, Tuio is equal to 47 .5 kN/m for this test and occurs at a total deformation of 90 mm. However, for serviceability requirements (i.e., the connection strength at 20-mm displacement), Twconn is equal to 25.4 kN/m.
The allowable connection strength, at a limited displacement, can be calculated with Equation 3. This criteria is intended as a guideline such that postconstruction movement of the wall face, if any occurs, is limited to an acceptable level.
The ultimate strength of the connection must also be evaluated. The allowable limit state connection strength is determined as follows:
Tel = (T1conn x Ro)l(FD x FS) (4)
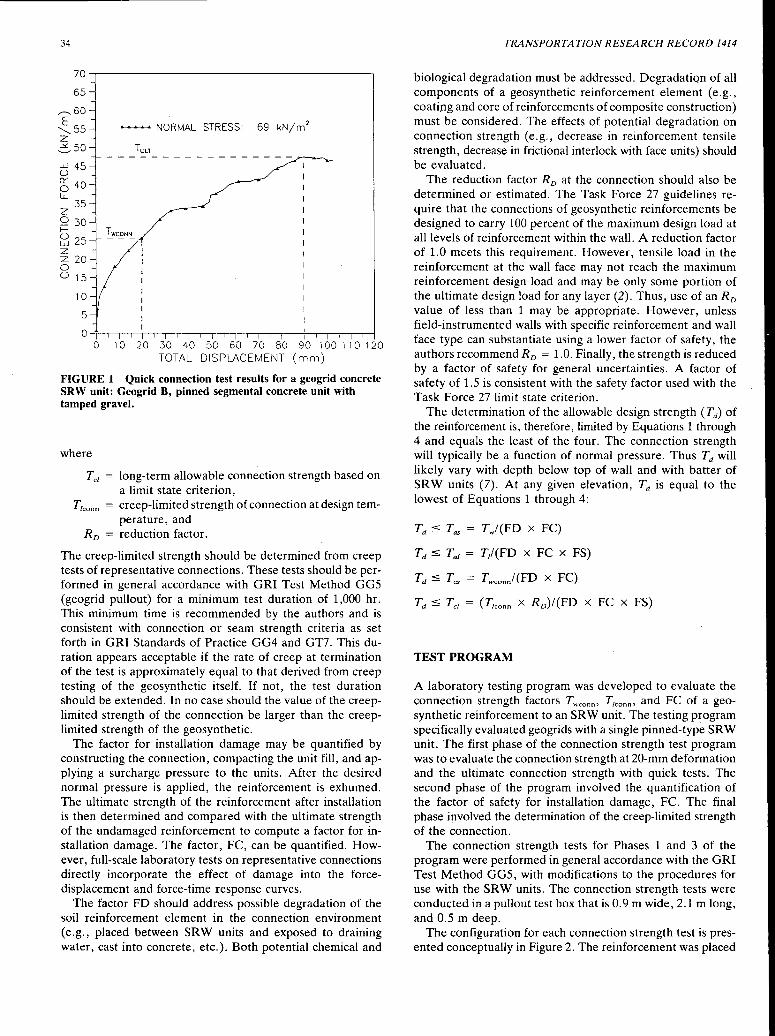
34
70--.--~~~~~~~~~~~~~~~~~~~--,
65
,,--...60
~55 z ,:::,so w 45 u gs 40 u..
35 z Q 30 I-
~ 25 z z 20 0 u 15
10
5
............... NORMAL STRESS: 69 kN/m2
10 20 30 40 50 60 70 80 90 100 110 120 TOTAL DISPLACEMENT (mm)
FIGURE 1 Quick connection test results for a geogrid concrete SRW unit: Geogrid B, pinned segmental concrete unit with tamped gravel.
where
Tc1 = long-term allowable connection strength based on a limit state criterion,
Ticonn = creep-limited strength of connection at design temperature, and
RD = reduction factor.
The creep-limited strength should be determined from creep tests of representative connections. These tests should be performed in general accordance with GRI Test Method GG5 (geogrid pullout) for a minimum test duration of 1,000 hr. This minimum time is recommended by the authors and is consistent with connection or seam strength criteria as set forth in GRI Standards of Practice GG4 and GT7. This duration appears acceptable if the rate of creep at termination of the test is approximately equal to that derived from creep testing of the geosynthetic itself. If not, the test duration should be extended. In no case should the value of the creeplimited strength of the connection be larger than the creeplimited strength of the geosynthetic.
The factor for installation damage may be quantified by constructing the connection, compacting the unit fill, and applying a surcharge pressure to the units. After the desired normal pressure is applied, the reinforcement is exhumed. The ultimate strength of the reinforcement after installation is then determined and compared with the ultimate strength of the undamaged reinforcement to compute a factor for installation damage. The factor, FC, can be quantified. However, full-scale laboratory tests on representative connections directly incorporate the effect of damage into the forcedisplacement and force-time response curves.
The factor FD should address possible degradation of the soil reinforcement element in the connection environment (e.g., placed between SRW units and exposed to draining water, cast into concrete, etc.). Both potential chemical and
TRANSPORTATION RESEARCH RECORD 1414
biological degradation must be addressed. Degradation of all components of a geosynthetic reinforcement element (e.g., coating and core of reinforcements of composite construction) must be considered. The effects of potential degradation on connection strength (e.g., decrease in reinforcement tensile strength, decrease in frictional interlock with face units) should be evaluated.
The reduction factor RD at the connection should also be determined or estimated. The Task Force 27 guidelines require that the connections of geosynthetic reinforcements be designed to carry 100 percent of the maximum design load at all levels of reinforcement within the wall. A reduction factor of 1.0 meets this requirement. However, tensile load in the reinforcement at the wall face may not reach the maximum reinforcement design load and may be only some portion of the ultimate design load for any layer (2). Thus, use of an RD value of less than 1 may be appropriate. However, unless field-instrumented walls with specific reinforcement and wall face type can substantiate using a lower factor of safety, the authors recommend RD = 1.0. Finally, the strength is reduced by a factor of safety for general uncertainties. A factor of safety of 1.5 is consistent with the safety factor used with the Task Force 27 limit state criterion.
The determination of the allowable design strength (Td) of the reinforcement is, therefore, limited by Equations 1 through 4 and equals the least of the four. The connection strength will typically be a function of normal pressure. Thus Td will likely vary with depth below top of wall and with batter of SRW units (7). At any given elevation, Td is equal to the lowest of Equations 1 through 4:
Td $ Tas = Twl(FD x FC)
Td::; T01 = T/(FD x FC x FS)
Td $ Tes = Twconn/(FD X FC)
Td $ Tc1 = (T1conn x RD)!(FD x FC x FS)
TEST PROGRAM
A laboratory testing program was developed to evaluate the connection strength factors Twconn, T1c0 ""' and FC of a geosynthetic reinforcement to an SRW unit. The testing program specifically evaluated geogrids with a single pinned-type SRW unit. The first phase of the connection strength test program was to evaluate the connection strength at 20-mm deformation and the ultimate connection strength with quick tests. The second phase of the program involved the quantification of the factor of safety for installation damage, FC. The final phase involved the determination of the creep-limited strength of the connection.
The connection strength tests for Phases 1 and 3 of the program were performed in general accordance with the GRI Test Method GG5, with modifications to the procedures for use with the SRW units. The connection strength tests were conducted in a pullout test box that is 0.9 m wide, 2.1 m long, and 0.5 m deep.
The configuration for each connection strength test is presented conceptually in Figure 2. The reinforcement was placed
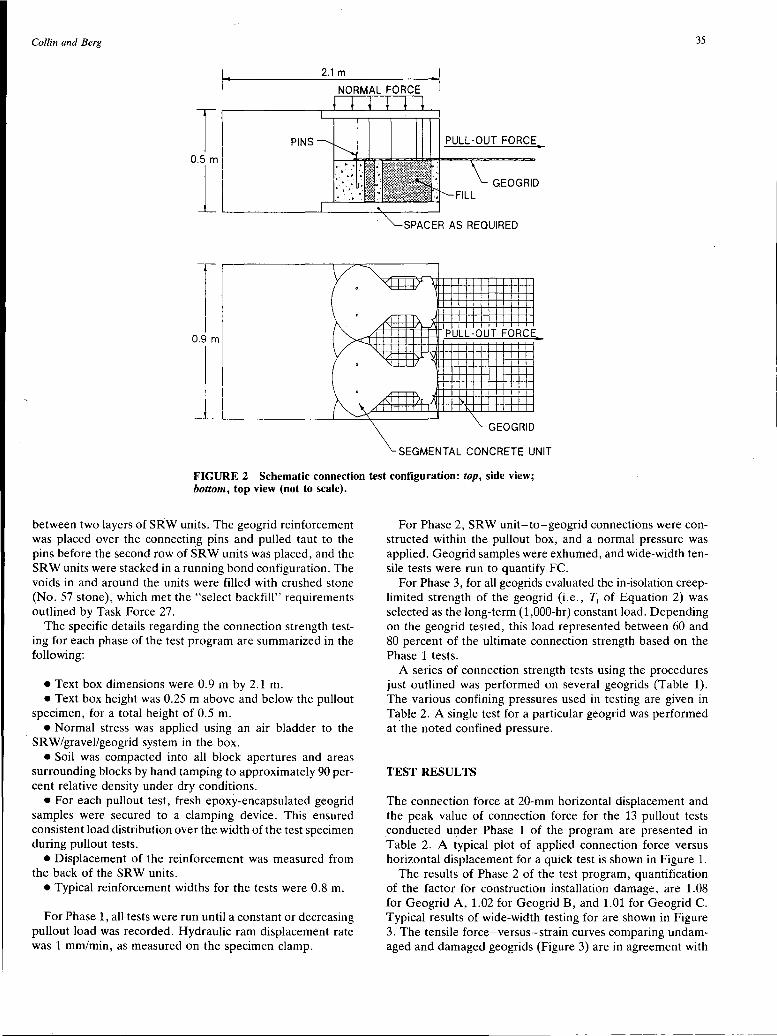
Collin and Berg 35
I· 2.1 m I
T PINS PULL-OUT FORCE
0.5 m
GEOG RID l ...... ~~···.:.·.·._
T I I
0.9 m
I
J_
0
0
0
-"<.!::l:::l::! } I
i /---f\ <'.
/ l/~ I I ./I I PULL-OUT FORCE J I I
'\J I
' \,
' ..._.__I
I I '' ~ I I I I
A'..I I Ir /\ ~ I I I A II I l I
\._GEOGRID \_ SEGMENTAL CONCRETE UNIT
FIGURE 2 Schematic connection test configuration: top, side view; bottom, top view (not to scale).
between two layers of SRW units. The geogrid reinforcement was placed over the connecting pins and pulled taut to the pins before the second row of SRW units was placed, and the SRW units were stacked in a running bond configuration. The voids in and around the units were filled with crushed stone (No. 57 stone), which met the "select backfill" requirements outlined by Task Force 27.
The specific details regarding the connection strength testing for each phase of the test program are summarized in the following:
•Text box dimensions were 0.9 m by 2.1 m. •Text box height was 0.25 m above and below the pullout
specimen, for a total height of 0.5 m. •Normal stress was applied using an air bladder to the
SRW/gravel/geogrid system in the box. • Soil was compacted into all block apertures and areas
surrounding blocks by hand tamping to approximately 90 percent relative density under dry conditions.
• For each pullout test, fresh epoxy-encapsulated geogrid samples were secured to a clamping device. This ensured consistent load distribution over the width of the test specimen during pullout tests.
• Displacement of the reinforcement was measured from the back of the SRW units.
•Typical reinforcement widths for the tests were 0.8 m.
For Phase 1, all tests were run until a constant or decreasing pullout load was recorded. Hydraulic ram displacement rate was 1 mm/min, as measured on the specimen clamp.
For Phase 2, SRW unit-to-geogrid connections were constructed within the pullout box, and a normal pressure was applied. Geogrid samples were exhumed, and wide-width tensile tests were run to quantify FC.
For Phase 3, for all geogrids evaluated the in-isolation creeplimited strength of the geogrid (i.e., T1 of Equation 2) was selected as the long-term (1,000-hr) constant load. Depending on the geogrid tested, this load represented between 60 and 80 percent of the ultimate connection strength based on the Phase 1 tests.
A series of connection strength tests using the procedures just outlined was performed on several geogrids (Table 1). The various confining pressures used in testing are given in Table 2. A single test for a particular geogrid was performed at the noted confined pressure.
TEST RESULTS
The connection force at 20-mm horizontal displacement and the peak value of connection force for the 13 pullout tests conducted under Phase 1 of the program are presented in Table 2. A typical plot of applied connection force versus horizontal displa~ement for a quick test is shown in Figure 1.
The results of Phase 2 of the test program, quantification of the factor for construction installation damage, are 1.08 for Geogrid A, 1.02 for Geogrid B, and 1.01 for Geogrid C. Typical results of wide-width testing for are shown in Figure 3. The tensile force-versus-strain curves comparing undamaged and damaged geogrids (Figure 3) are in agreement with
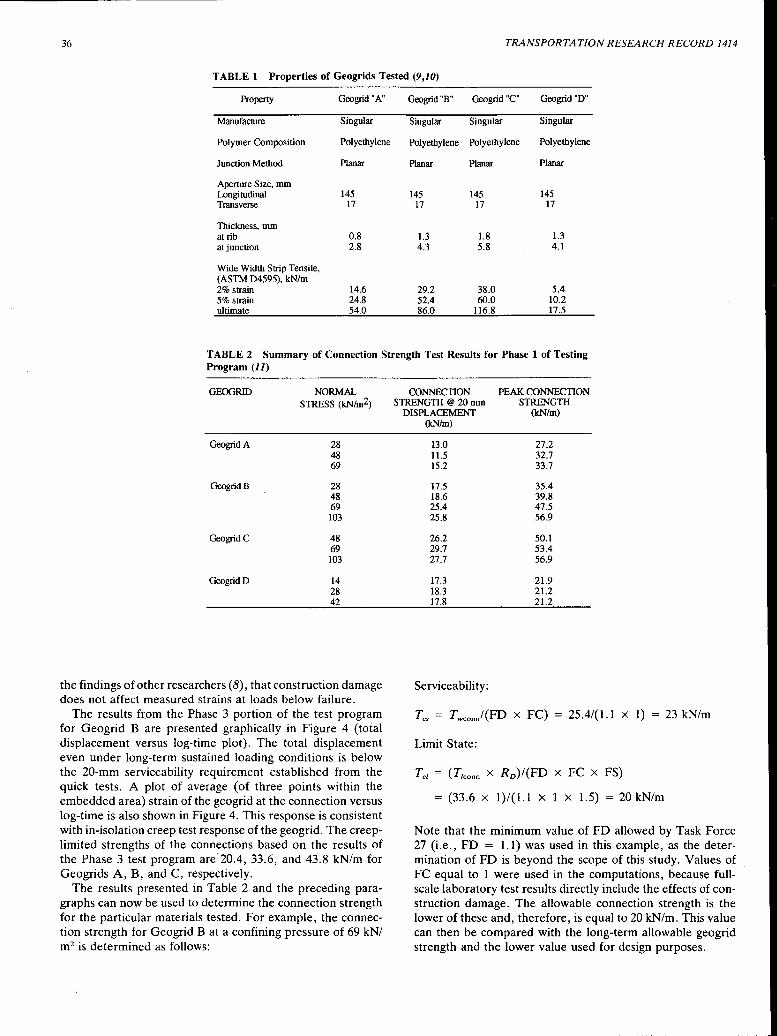
36 TRANSPORTATION RESEARCH RECORD 1414
TABLE 1 Properties of Geogrids Tested (9,10)
Property Geogrid "A" Geogrid "B" Geogrid "C" Geogrid "D"
Manufacture Singular Singular Singular Singular
Polymer Composition Polyethylene Polyethylene Polyethylene Polyethylene
Junction Method Planar Planar Planar Planar
Aperture Size, mm Longitudinal 145 145 145 145 Transverse 17 17 17 17
Thickness, mm at rib 0.8 1.3 1.8 1.3 at junction 2.8 4.3 5.8 4.1
Wide Width Strip Tensile, (ASTM D4595), kN/m 2% strain 14.6 29.2 38.0 5.4 5% strain 24.8 52.4 60.0 10.2 ultimate 54.0 86.0 116.8 17.5
TABLE 2 Summary of Connection Strength Test Results for Phase 1 of Testing Program (11)
GEOG RID NORMAL STRESS (kN/m2)
GeogridA 28 48 69
GeogridB 28 48 69 103
GeogridC 48 69 103
GeogridD 14 28 42
the findings of other researchers (8), that construction damage does not affect measured strains at loads below failure.
The results fr_om the Phase 3 portion of the test program for Geogrid B are presented graphically in Figure 4 (total displacement versus log-time plot). The total displacement even under long-term sustained loading conditions is below the 20-mm serviceability requirement established from the quick tests. A plot of average (of three points within the embedded area) strain of the geogrid at the connection versus log-time is also shown in Figure 4. This response is consistent with in-isolation creep test response of the geogrid. The creeplimited strengths of the connections based on the results of the Phase 3 test program are 20.4, 33.6, and 43.8 kN/m for Geogrids A, B, and C, respectively.
The results presented in Table 2 and the preceding paragraphs can now be used to determine the conriection strength for the particular materials tested. For example, the connection strength for Geogrid B at a confining pressure of 69 kN/ m2 is determined as follows:
CONNECTION PEAK CONNECTION STRENGTH @ 20 mm STRENGTH
DISPLACEMENT (kN/m) (kN/m)
13.0 27.2 11.5 32.7 15.2 33.7
17.5 35.4 18.6 39.8 25.4 47.5 25.8 56.9
26.2 50.1 29.7 53.4 27.7 56.9
17.3 21.9 18.3 21.2 17.8 21.2
Serviceability:
25.4/(1.1 x 1) 23 kN/m
Limit State:
Tc1 = (T1conn x Rv)l(FD x FC x FS)
(33.6 x 1)/(1.1 x 1 x 1.5) = 20 kN/m
Note that the minimum value of FD allowed by Task Force 27 (i.e., FD = 1.1) was used in this example, as the determination of FD is beyond the scope of this study. Values of FC equal to 1 were used in the computations, because fullscale laboratory test results directly include the effects of construction damage. The allowable connection strength is the lower of these and, therefore, is equal to 20 kN/m. This value can then be compared with the long-term allowable geogrid strength and the lower value used for design purposes.
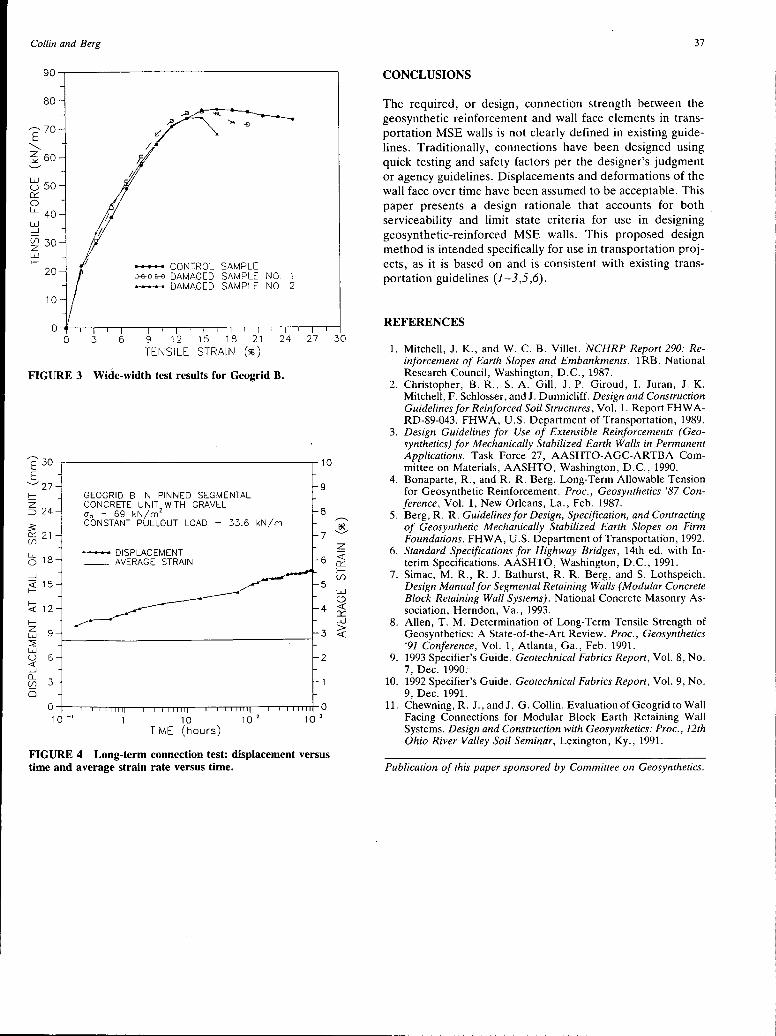
Collin and Berg
80
,,.-.... 70 E
""' ~ 60 ...._,,
t3 50 n::: 0 LL 40 w _J
tn 30 z w f-
20
10
,0~ -~ ~ -
/•
............... CONTROL SAMPLE o-e-o B-€l DAMAGED SAMPLE NO. 1 _...__ DAMAGED SAMPLE NO. 2
o----~-..---..--~~~~~,-,...--,.---,--.--,--....,...-~,~\--,,-,-.----1
0 3 6 9 12 15 18 21 24 27 30 TEl\JSILE STRAIN (%)
FIGURE 3 Wide-width test results for Geogrid B.
E'3o E
'--" 27 t::: z :J 24
:s: et: 21 (./)
LL 18 0
_J
<( 15 f-
f-12 <(
f-z 9 w 2 w (_) 6 <( _J
0... 3 (./)
0 0 --t----,--,--.-,."TT"T.,,..--~-r--r-r-~-,----...,.---.-T""T"i""TTTr--r-.---r--r-rTTTt-0 10 _, 10 10 2 10 J
TIME (hours)
FIGURE 4 Long-term connection test: displacement versus time and average strain rate versus time.
37
CONCLUSIONS
The required, or design, connection strength between the geosynthetic reinforcement and wall face elements in transportation MSE walls is not clearly defined in existing guidelines. Traditionally, connections have been designed using quick testing and safety factors per the designer's judgment or agency guidelines. Displacements and deformations of the wall face over time have been assumed to be acceptable. This paper presents a design rationale that accounts for both serviceability and limit state criteria for use in designing geosynthetic-reinforce.d MSE walls. This proposed design method is intended specifically for use in transportation projects, as it is based on and is consistent with existing transportation guidelines (1-3 ,5 ,6).
REFERENCES
1. Mitchell, J. K., and W. C. B. Villet. NCHRP Report 290: Reinforcement of Earth Slopes and Embankments. TRB, National Research Council, Washington, D.C., 1987.
2. Christopher, B. R., S. A. Gill, J. P. Giroud, I. Juran, J. K. Mitchell, F. Schlosser, and J. Dunnicliff. Design and Construction Guidelines for Reinforced Soil Structures, Vol. 1. Report FHWARD-89-043. FHWA, U.S. Department of Transportation, 1989.
3. Design Guidelines for Use of Extensible Reinforcements (Geosynthetics) for Mechanically Stabilized Earth Walls in Permanent Applications. Task Force 27, AASHTO-AGC-ARTBA Committee on Materials, AASHTO, Washington, D.C., 1990.
4. Bonaparte, R., and R. R. Berg. Long-Term Allowable Tension for Geosynthetic Reinforcement. Proc., Geosynthetics '87 Conference, Vol. 1, New Orleans, La., Feb. 1987.
5. Berg, R. R. Guidelines for Design, Specification, and Contracting of Geosynthetic Mechanically Stabilized Earth Slopes on Firm Foundations. FHWA, U.S. Department of TransportatiOn, 1992.
6. Standard Specifications for Highway Bridges, 14th ed. with Interim Specifications. AASHTO, Washington, D.C., 1991.
7. Simac, M. R., R. J. Bathurst, R. R. Berg, and S. Lothspeich. Design Manual for Segmental Retaining Walls (Modular Concrete Block Retaining Wall Systems). National Concrete Masonry Association, Herndon, Va., 1993.
8. Allen, T. M. Determination of Long-Term Tensile Strength of Geosynthetics: A State-of-the-Art Review. Proc., Geosynthetics '91 Conference, Vol. 1, Atlanta, Ga., Feb. 1991.
9. 1993 Specifier's Guide. Geotechnical Fabrics Report, Vol. 8, No. 7, Dec. 1990.
10. 1992 Specifier's Guide. Geotechnical Fabrics Report, Vol. 9, No. 9, Dec. 1991.
11. Chewning, R. J., andJ. G. Collin. EvaluationofGeogrid to Wall Facing Connections for Modular Block Earth Retaining Wall Systems. Design and Construction with Geosynthetics: Proc., 12th Ohio River Valley Soil Seminar, Lexington, Ky., 1991.
Publication of this paper sponsored by Committee on Geosynthetics.
38 TRANSPORTATION RESEARCH RECORD 1414
Internal Stability of Reinforced Soil Retaining Structures with Cohesive Backfills
Y. H. WANG AND M. C. WANG
Reinforced soil retaining structures typically are constructed with cohesionless backfills. It is not uncommon, however, that for economic reasons or because the desired cohesionless backfills are unavailable, locally available cohesive soils are used to construct retaining structures. Little information on the performance of reinforced cohesive soil retaining structures is available. Thus, the performance data of some field and model tests and the results of analysis concerning the internal stability of the structures reinforced with polypropylene strips are presented. The in situ testing was conducted for three retaining structures in China, and the model tests were performed in the laboratory of the Changsha Railway Institute. Data analyzed include lateral earth pressure, vertical pressure, tensile strip force, rupture surface, and lateral facing deformation. The results of analysis show that the lateral earth pressure along the back side of the facing decreases with depth from at-rest pressure.at the top to less-than-active pressure at depth. The vertical pressure distribution along the base of backfill is not uniform; the shape of distribution appears to vary with the stiffness of the soil-reinforcing system. Along reinforcing strips, the strip tensile force exhibits a peak formation, and the peak location is closer to the facing at the bottom than at the top of the backfill. The potential sliding surface cuts the top of the backfill at a distance of about 28 percent of the facing height in cohesive backfills rather than 30 percent, which is generally taken for cohesionless backfills. The available data reveal that structures built with more plastic cohesive backfills may exhibit greater timedependent performance. It is concluded that reinforced soil retaining structures can be constructed satisfactorily using low to siightly medjum plastic cohesive backfills if an adequate drainage system is provided. However, more field data are needed to investigate the long-term stability of reinforced soil retaining structures constructed with more plastic cohesive backfills.
In reinforced soil, the primary function of reinforcing strips is to provide the soil with tensile strength. The magnitude of tensile strength that can be mobilized inside the structure depends on the reinforcing material and bonding between the reinforcing strip and the surrounding soil, among other characteristics. For a given reinforcing material, the greater the bond, the higher the tensile strength. The bond strength increases with increasing friction between the reinforcing strip and the soil. Thus, the backfill material must have high frictional resistance and also must be free draining so that little excess pore water pressure will develop during construction, causing a decrease in strip-soil interface bond. In addition, the backfill material must be noncorrosive with low compressibility and exhibit little time-dependent behavior. For
Department of Civil and Environmental Engineering, Pennsylvania State University, University Park, Pa. 16802.
these reasons, cohesionless soils are commonly used as backfill materials for construction of reinforced soil retaining structures. Meanwhile, geotechnical criteria including gradation, soundness, and plasticity characteristics have been specified (e.g., the FHWA specification for metallic reinforcement) (J-4). The FHWA specifications have also been recommended for geosynthetics reinforcement (5).
Depending on the project location and environmental condition, it is not uncommon that, for economical reasons, local soils are used as the backfill material (5 ,6). The local soils may be cohesive, less permeable, and more compressible than the ideal cohesionless material. These undesirable material properties may harm the stability of the reinforced earth retaining structure.
Two key elements to be considered in the design of reinforced soil retaining structures are the internal stability and the external stability of the structure. For external stability, the structure should be analyzed for safety against sliding, overturning, excessive settlement, bearing capacity failure, and rotational slide through the supporting foundation. Internal stability is concerned with failure within the structure involving breakage or slippage of reinforcing strips, excessive lateral displacement of the facing elements, among others. Currently, very little data are available concerning the internal stability of cohesive soils reinforced with polypropylene strips. To investigate possible adverse effects of undesirable soils on the internal stability, analyses are made for lateral earth pressure, forces in reinforcing strips, lateral displacement of the facing element, and internal failure surface of several polypropylene strip-reinforced soil retaining structures constructed with different types of backfill material. This paper presents the results of the analyses and discusses the effect of soil type on internal stability as well as the engineering significance of the research findings.
INSTRUMENTED REINFORCED SOIL STRUCTURES
Three reinforced soil structures were instrumented to monitor their performance, and a large-scale model test was conducted in the laboratory to investigate the behavior of the model reinforced earth retaining structure under various loading conditions. The field structures and laboratory experiment are described in the following.
Wang and Wang
Hengyang Retaining Structure
The Hengyang retaining structure is located at both sides of the east approach to the Hengyang-Xiangjiang Highway Bridge in Hunan Province, China. Along the curved approach, the structure on the exterior side (exterior wall) is about 260 m long, and the interior wall is approximately 190 m. The wall height varies from 3.12 to 6.83 m, and the height of instrumented section is 4.5 m. The reinforcing strips are polypropylene strips, each 15 mm wide, 1 mm thick, and 5 m long. Their tensile strength, tensile modulus, and rupture strain are 2.34 kN/strip, 2000 MPa, and 8.0 percent, respectively. The vertical spacing is 50 cm, and the center-to-center horizontal spacing varies between 4 and 7 cm. The backfill material is a silty clay with a liquid limit (LL) of 22.1 percent, plasticity index (PI) of 5.8, internal friction angle (<t>) of 31.4 degrees, and cohesion (c) of 22.0 kPa. Under the standard Proctor compaction, the maximum dry unit weight ('ydmax) and optimum water content (W0 P1) are 17.3 kN/m3 and 19.4 percent, respectively. Each reinforcing strip is surrounded by a thin layer (about 5 cm thick) of a sandy soil; this technique was also used by Sridharan et al. (7). The facing was made of plain concrete blocks, each 60 cm long, 40 cm high, and 5 cm thick. The soil was compacted to 95 percent of the maximum based on the standard Proctor compactive effort. The construction started in October 1988 and was completed in June 1989. Field measurements included lateral earth pressure distribution along the back of the facing elements, lateral earth pressure distribution along the back side of the reinforced zone, and tensile force distribution along the reinforcing strip. Details on construction and testing program for the project are available elsewhere ( 8).
Pingshi Retaining Structure
The Pingshi retaining structure supports the platform and building of the Pingshi railroad station in northern Guangdong Province, China. The structure is 50 m long and was originally 7 .25 m high, but it was increased to 10 m high 2 years after construction. The reinforcement is provided by polypropylene strips. Each strip is 22.0 mm wide and 1.4 mm thick, having a tensile strength, tensile modulus, and rupture strain of 6.48 kN, 1,910 MPa, and 11.0 percent, respectively. The vertical spacing is 50 cm, and the horizontal center-to-center spacing varies from 5 to 8 cm. There are three strip lengths: 10, 8, and 6 min the upper, middle, and lower levels, respectively. The details can be found in a research report by Hua et al. (9).
The backfill material is a miscellaneous fill, which is a mixture of local cohesive soil with construction debris, with LL = 28.8 percent, PI = 10.1, <t> = 32.8 degrees, c = 6.5 kPa, 'Ydmax = 18.7 kN/m3, and W0 p 1 = 15.5 percent. The soil was compacted to 85 percent standard Proctor compaction. The construction began in June 1990 and was completed in October 1990. Field measurements include lateral earth pressure distribution along the back of the facing elements, vertical pressure distribution along the reinforcement layers, tensile force in the reinforcement, vertical and lateral displacements of the facing, and others.
39
Yueyang Retaining Structure
The third retaining structure is at the Yueyang Municipal Weather Observatory Station. It is 75 m long and 18 m high (maximum) and reinforced with polypropylene strips. Each strip is 14.5 mm wide and 0.87 mm thick; tensile strength, tensile modulus, and rupture strain are 1.85 kN, 1650 MPa, and 10.0 percent, respectively. According to Wang et al. (10), the length of reinforcing strips equals 20 m in the upper 4 m of the facing, 12 m in the next 4 m, 9 m in the following 4 m, and 7 min the bottom 6 m of the facing. The backfill material is a cohesive soil with LL = 34.5 percent, PI = 9.2, <t> = 28.5 degrees, c = 31.0 kPa, 'Ydmax = 17.4 kN/m3
, and W0 P1 = 18.5 percent. Field measurements include reinforcing strip force and lateral and vertical displacements of the facing elements.
Laboratory Model Test
The laboratory model reinforced soil retaining structures are constructed on a concrete floor; each is 2.0 m high, 1.8 m wide, and 3.1 m long. The reinforcing strips are made of polypropylene. Seven tests were performed: a fine sand was used as the backfill material in five tests, and a silty clay was used in two tests. The fine sand backfill has <t> = 35.0 degrees, 'Ydmax = 17.2 kN/m3 , and W0 P1 = 9.5 percent; the silty clay backfill has LL = 30.6 percent, PI = 10.4, <t> = 26.1 degrees, c = 16.0 kPa, 'Ydmax = 17.9 kN/m3
, and W0 P1 = 16.5 percent. Measurements taken were tensile force in the reinforcing strips, vertical pressure distribution along the reinforcement, lateral pressure distribution along the facing, lateral deformation of the facing, and others. Detailed descriptions of the test model and measurement program are documented by Wang et al. (11).
LATERAL EARTH PRESSURE
The lateral earth pressure along the back side of the facing obtained from the Hengyang and Pingshi test sites and laboratory model testing are shown in Figure 1. Note that no lateral pressure data are available from the Yueyang project and that the data obtained from the Yoajian project by Wang et al. (12) and from the Yinshanzhen project by Wu (13) are also included in the figure for comparison.
As would be expected, the data points in Figure 1 are scattered because of testing errors, instrumentation problems, and possibly other mistakes. For instance, the negative lateral pressure shown in the Hengyang project is probably a result of malfunction of the pressure gauge. Also, the much greater fluctuation of the data points at the bottom of the facing in the Yinshanzhen project (13) probably resulted from a lessthan-perfect gauge performance. Despite these irregularities, a trend is clear that except for two cases, the lateral pressure increases with depth at a decreasing rate. One case is the laboratory model test, with a cohesive backfill for which the lateral pressure is almost zero throughout the entire facing. The other case is the Yaojian project (12), in which the lateral
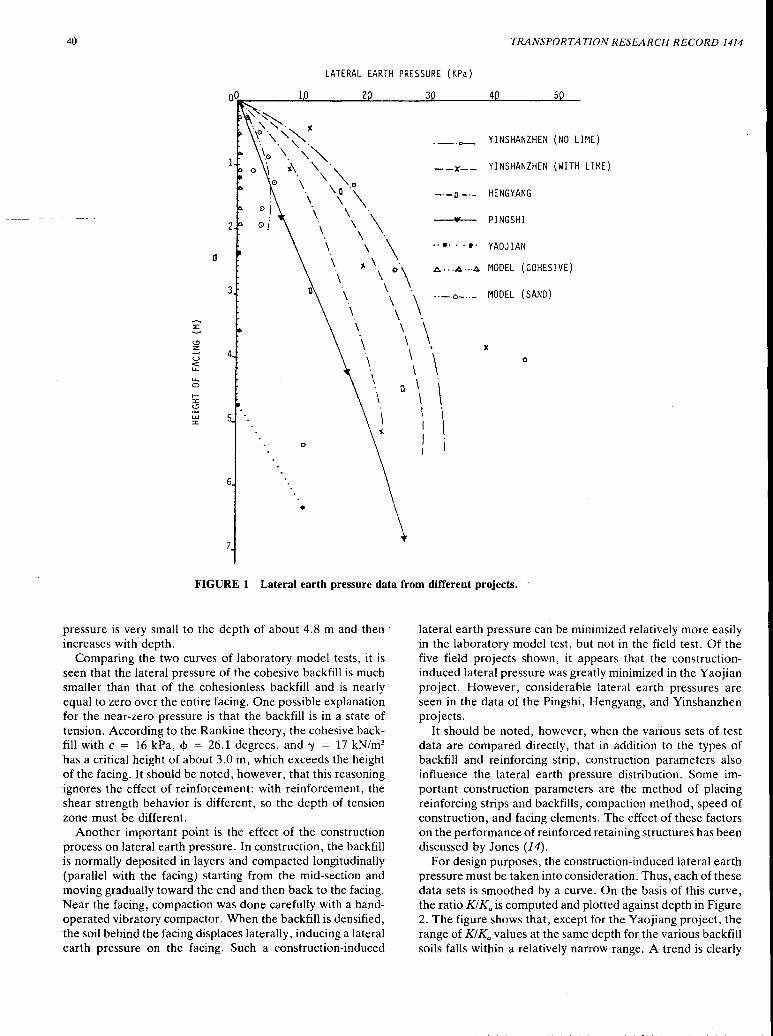
40 TRANSPORTATION RESEARCH RECORD 1414
LATERAL EARTH PRESSURE (KPa)
<.!l z: u c:::: LL.
LL. 0
t:::c (.,!;
Ll.J :::c
a
2
3
4
5
0
6
•
YINSHANZHEN (NO LIME)
--X'-- YINSHANZHEN (WITH LIME)
-·-a·-·- HENGYANG
PINGSHI
.. •· .. •· YAOJIAN
~ ••• .e,. ••. ~ MODEL (COHESIVE)
MODEL (SAND)
x 0
FIGURE 1 Lateral earth pressure data from different projects.
pressure is very small to the depth of about 4.8 m and then· increases with depth.
Comparing the two curves of laboratory model tests, it is seen that the lateral pressure of the cohesive backfill is much smaller than that of the cohesionless backfill and is nearly equal to zero over the entire facing. One possible explanation for the near-zero pressure is that the backfill is in a state of tension. According to the Rankine theory, the cohesive backfill with c = 16 kPa, <f> = 26.1 degrees, and "Y = 17 kNlm3
has a critical height of about 3.0 m, which exceeds the height of the facing. It should be noted, however, that this reasoning ignores the effect of reinforcement: with reinforcement, the shear strength behavior is different, so the depth of tension zone must be different.
Another important point is the effect of the construction process on lateral earth pressure. In construction, the backfill is normally deposited in layers and compacted longitudinally (parallel with the facing) starting from the mid-section and moving gradually toward the end and then back to the facing. Near the facing, compaction was done carefully with a handoperated vibratory compactor. When the backfill is densified, the soil behind the facing displaces laterally, inducing a lateral earth pressure on the facing. Such a construction-induced
lateral earth pressure can be minimized relatively more easily in the laboratory model test, but not in the field test. Of the five field projects shown, it appears that the constructioninduced lateral pressure was greatly minimized in the Yaojian project. However, considerable lateral earth pressures are seen in the data of the Pingshi, Hengyang, and Yinshanzhen projects.
It should be noted, however, when the various sets of test data are compared directly, that in addition to the types of backfill and reinforcing strip, construction parameters also influence the lateral earth pressure distribution. Some important construction parameters are the method of placing reinforcing strips and backfills, compaction method, speed of construction, and facing elements. The effect of these factors on the performance of reinforced retaining structures has been discussed by Jones (14).
For design purposes, the construction-induced lateral earth pressure must be taken into consideration. Thus, each of these data sets is smoothed by a curve. On the basis of this curve, the ratio Kl Ka is computed and plotted against depth in Figure 2. The figure shows that, except for the Yaojiang project, the range of Kl Ka values at the same depth for the various backfill soils falls within a relatively narrow range. A trend is clearly
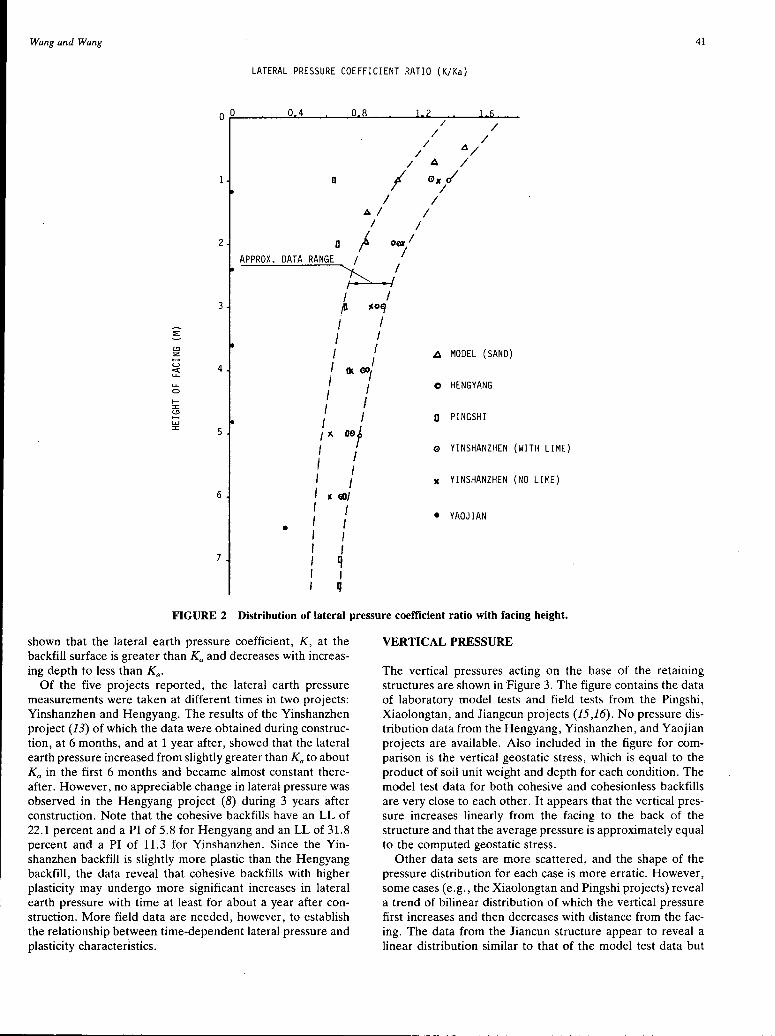
Wang and Wang 41
LATERAL PRESSURE COEFFICIENT RATIO {K/Ka)
o~O~__,~__,.O:.a...:..4~-....~~0<.&.:;;:.8~_._~..-..-..~._~ ........ .__~
t.!:l z
2
3
D
a
/
/ /
/ / A/
/ A / ex cl I /
I I A/ I
I I } oerl
/
APPROX. DATA RANGE I I
~ ./ I I
(J 1-0'f
I I I I
I I ~ MODEL (SAND)
I ~ 4 LL..
I Ill (11), I LL..
0
1-:::x::: t.!:l
LU :::x::: 5
6
• 7
I I I I I I I ic. oaf I I I I I I I ll GO/ I I I I I I I I I q I I I q
O HENGYANG
D PINGSHI
0 YINSHANZHEN (WITH LIME)
x YINSHANZHEN (NO LIME)
• YAOJIAN
FIGURE 2 Distribution of lateral pressure coefficient ratio with facing height.
shown that the lateral earth pressure coefficient, K, at the backfill surface is greater than Ka and decreases with increasing depth to less than Ka.
Of the five projects reported, the lateral earth pressure measurements were taken at different times in two projects: Yinshanzhen and Hengyang. The results of the Yinshanzhen project (13) of which the data were obtained during construction, at 6 months, and at 1 year after, showed that the lateral earth pressure increased from slightly greater than Ka to about K 0 in the first 6 months and became almost constant thereafter. However, no appreciable change in lateral pressure was observed in the Hengyang project (8) during 3 years after construction. Note that the cohesive backfills have an LL of 22.1 percent and a PI of 5.8 for Hengyang and an LL of 31.8 percent and a PI of 11.3 for Yinshanzhen. Since the Yinshanzhen backfill is slightly more plastic than the Hengyang backfill, the data reveal that cohesive backfills with higher plasticity may undergo more significant increases in lateral earth pressure with time at least for about a year after construction. More field data are needed, however, to establish the relationship between time-dependent lateral pressure and plasticity characteristics.
VERTICAL PRESSURE
The vertical pressures acting on the base of the retaining structures are shown in Figure 3. The figure contains the data of laboratory model tests and field tests from the Pingshi, Xiaolongtan, and Jiangcun projects (15 ,16). No pressure distribution data from the Hengyang, Yinshanzhen, and Yaojian projects are available. Also included in the figure for comparison is the vertical geostatic stress, which is equal to the product of soil unit weight and depth for each condition. The model test data for both cohesive and cohesionless backfills are very close to each other. It appears that the vertical pressure increases linearly from the facing to the back of the structure and that the average pressure is approximately equal to the computed geostatic stress.
Other data sets are more scattered, and the shape of the pressure distribution for each case is more erratic. However, some cases (e.g., the Xiaolongtan and Pingshi projects) reveal a trend of bilinear distribution of which the vertical pressure first increases and then decreases with distance from the facing. The data from the Jiancun structure appear to reveal a linear distribution similar to that of the model test data but
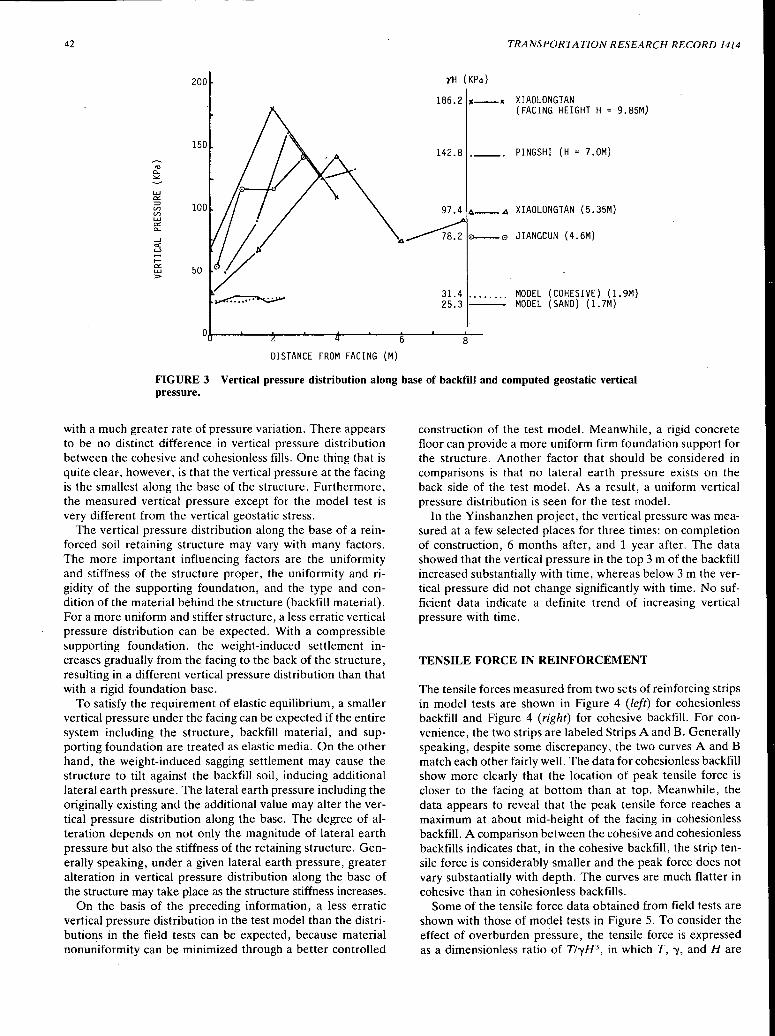
42
LU 0::: ;::)
VJ VJ LU 0::: a...
_J c::( u
t-
200
150
100
E::i 50 >
TRANSPORTATION RESEARCH RECORD 1414
yH (KPa)
186.2 JC--)( XIAOLONGTAN (FACING HEIGHT H = 9.85M)
142.8 ·--· PINGSHI (H = 7 .OM)
97 .4 t.-- 4 XIAOLONGTAN (5.35M)
"4~ 0--0 JIANGCUN (4.6M)
31.4 25.3
MODEL (COHESIVE) (l.9M} MODEL (SAND) (l.7M)
o,.,_ __ ....._ __ _,,,,__ __ ..._---+--------~6,__--....._ __ _._8~
DISTANCE FROM FACING (M)
FIGURE 3 Vertical pressure distribution along base of backfill and computed geostatic vertical pressure.
with a much greater rate of pressure variation. There appears to be no distinct difference in vertical pressure distribution between the cohesive and cohesionless fills. One thing that is quite clear, however, is that the vertical pressure at the facing is the smallest along the base of the structure. Furthermore, the measured vertical pressure except for the model test is very different from the vertical geostatic stress.
The vertical pressure distribution along the base of a reinforced soil retaining structure may vary with many factors. The more important influencing factors are the uniformity and stiffness of the structure proper, the uniformity and rigidity of the supporting foundation, and the type and condition of the material behind the structure (backfill material). For a more uniform and stiffer structure, a less erratic vertical pressure distribution can be expected. With a compressible supporting foundation, the weight-induced settlement increases gradually from the facing to the back of the structure, resulting in a different vertical pressure distribution than that with a rigid foundation base.
To satisfy the requirement of elastic equilibrium, a smaller vertical pressure under the facing can be expected if the entire system including the structure, backfill material, and supporting foundation are treated as elastic media. On the other hand, the weight-induced sagging settlement may cause the structure to tilt against the backfill soil, inducing additional lateral earth pressure. The lateral earth pressure including the originally existing and the additional value may alter the vertical pressure distribution along the base. The degree of alteration depends on not only the magnitude of lateral earth pressure but also the stiffness of the retaining structure. Generally speaking, under a given lateral earth pressure, greater alteration in vertical pressure distribution along the base of the structure may take place as the structure stiffness increases.
On the basis of the preceding information, a less erratic vertical pressure distribution in the test model than the distributions in the field tests can be expected, because material nonuniformity can be minimized through a better controlled
construction of the test model. Meanwhile, a rigid concrete floor can provide a more uniform firm foundation support for the structure. Another factor that should be considered in comparisons is that no lateral earth pressure exists on the back side of the test model. As a result, a uniform vertical pressure distribution is seen for the test model.
In the Yinshanzhen project, the vertical pressure was measured at a few selected places for three times: on completion of construction, 6 months after, and 1 year after. The data showed that the vertical pressure in the top 3 m of the backfill increased substantially with time, whereas below 3 m the vertical pressure did not change significantly with time. No sufficient data indicate a definite trend of increasing vertical pressure with time.
TENSILE FORCE IN REINFORCEMENT
The tensile forces measured from two sets of reinforcing strips in model tests are shown in Figure 4 (left) for cohesionless backfill and Figure 4 (right) for cohesive backfill. For convenience, the two strips are labeled Strips A and B. Generally speaking, despite some discrepancy, the two curves A and B match each other fairly well. The data for cohesionless backfill show more clearly that the location of peak tensile force is closer to the facing at bottom than at top. Meanwhile, the data appears to reveal that the peak tensile force reaches a maximum at about mid-height of the facing in cohesionless backfill. A comparison between the cohesive and cohesionless backfills indicates that, in the cohesive backfill, the strip tensile force is considerably smaller and the peak force does not vary substantially with depth. The curves are much flatter in cohesive than in cohesionless backfills.
Some of the tensile force data obtained from field tests are shown with those of model tests in Figure 5. To consider the effect of overburden pressure, the tensile force is expressed as a dimensionless ratio of Tl-yH3 , in which T, -y, and Hare
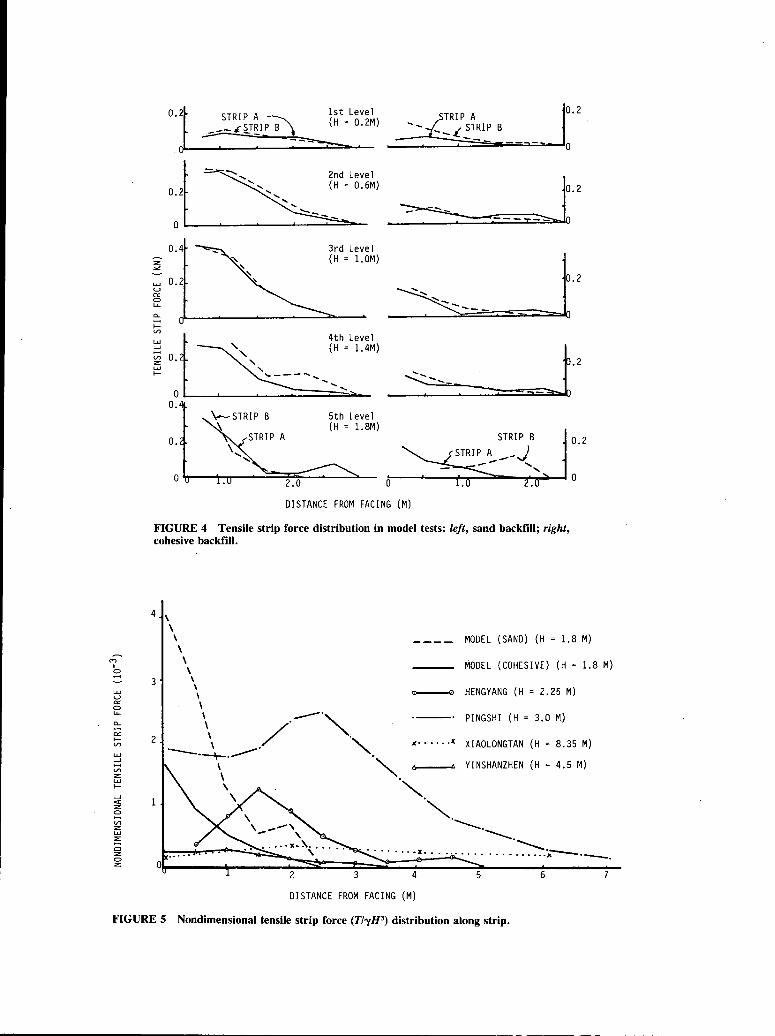
LLI u a:: 0 LL.
c.. ;x IV)
LLI _J
V)
z LLI I-
_J
ct: z 0
V)
z LLI :E:
8 z 0 z
0.2 STRIP A ~ 1st Level STRIP A r ---~~T~IP B (H = 0.2M) --:1:-.i. STRIP B -- ---- - =--I 0
---...... 2nd Level
l0.2 ......
' ...... (H = 0.6M) 0.2 ......
...... ...... .....
0 ~-- - --=::=:i-o
0.4 3rd Level
J-2 ~ (H = 1. OM) :::.<:
LLI 0.2 u
~ a:: 0 LL. __:_::---c.. ::.. j:: 0 V)
4th Level LLI _J (H = 1.4M)
J-2 ;;; o. z LLI s---I-
' ....... 0 .,
o. \..--.-STRIP B 5th Level ~ (H = 1.8M)
0. 0.2
0 0 0
DISTANCE FROM FACING (M)
FIGURE 4 Tensile strip force distribution in model tests: left, sand backfill; right, cohesive backfill.
4 \ \ \ \
3
\ \ \ \ \ \
\ ---·" MODEL {SAND) (H = 1.8 M)
MODEL (COHESIVE) (H = 1.8 M)
(l)sCll--~0 HENGYANG (H = 2.25 M)
PINGSHI (H = 3.0 M)
2 \ /. . \ ' JC····· .JC XIAOLONGTAN (H = 8.35 M) ·-- ---· ' "--\--· .
~ A • YINSHANZHEN (H = 4.5 M) ."' ·"'· '---. ...___ o o 0 Io o 0 0 0 -~· 0 0 OoO 0 0 o 0 I 0 o .·.~'.it--·--.
4
DISTANCE FROM FACING (M)
5 6 7
FIGURE 5 Nondimensional tensile strip force (T/yH3) distribution along strip.
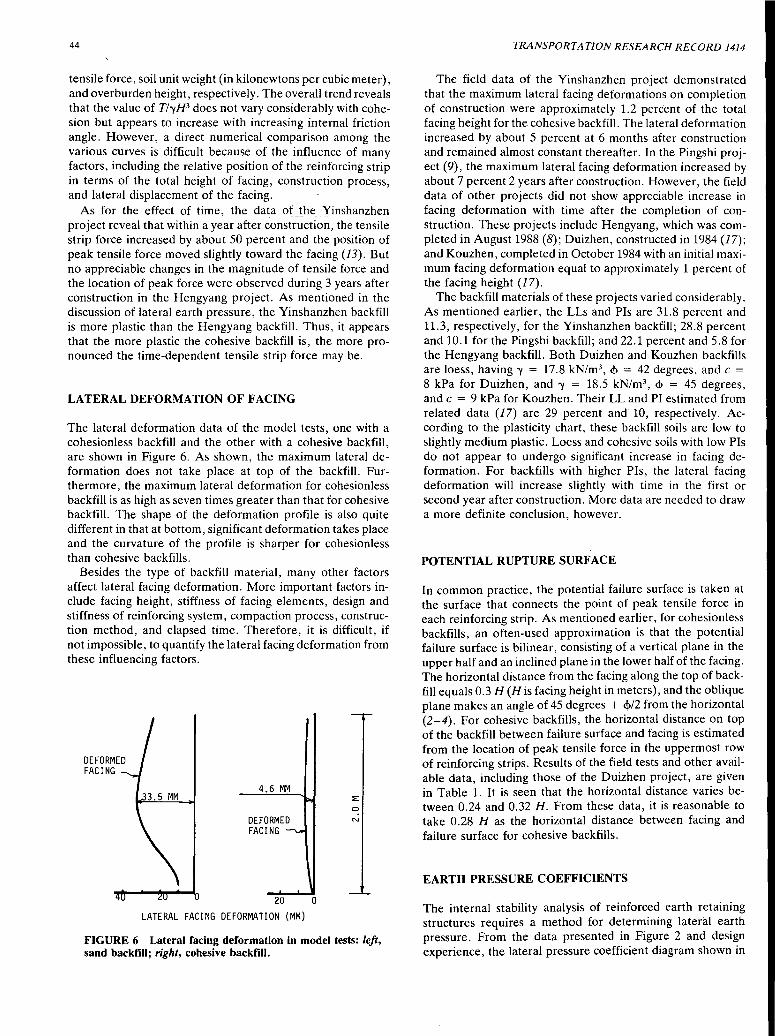
44
tensile force, soil unit weight (in kilo newtons per cubic meter), and overburden height, respectively. The overall trend reveals that the value of Tl-yH3 does not vary considerably with cohesion but appears to increase with increasing internal friction angle. However, a direct numerical comparison among the various curves is difficult because of the influence of many factors, including the relative position of the reinforcing strip in terms of the total height of facing, construction process, and lateral displacement of the facing.
As for the effect of time, the da!a __ ()L!ll.e_):'inshanzhen project reveal that within a year after construction, the tensile strip force increased by about 50 percent and the position of peak tensile force moved slightly toward the facing (13). But no appreciable changes in the magnitude of tensile force and the location of peak force were observed during 3 years after construction in the Hengyang project. As mentioned in the discussion of lateral earth pressure, the Yinshanzhen backfill is more plastic than the Hengyang backfill. Thus, it appears that the more plastic the cohesive backfill is, the more pronounced the time-dependent tensile strip force may be.
LATERAL DEFORMATION OF FACING
The lateral deformation data of the model tests, one with a cohesionless backfill and the other with a cohesive backfill, are shown in Figure 6. As shown, the maximum lateral deformation does not take place at top of the backfill. Furthermore, the maximum lateral deformation for cohesionless backfill is as high as seven times greater than that for cohesive backfill. The shape of the deformation profile is also quite different in that at bottom, significant deformation takes place and the curvature of the profile is sharper for cohesionless than cohesive backfills.
Besides the type of backfill material, many other factors affect lateral facing deformation. More important factors include facing height, stiffness of facing elements, design and stiffness of reinforcing system, compaction process, construction method, and elapsed time. Therefore, it is difficult, if not impossible, to quantify the lateral facing deformation from these influencing factors.
0
4.6 MM
DEFORMED FACING
20
LATERAL FACING DEFORMATION (MM) 0
FIGURE 6 Lateral facing deformation in model tests: left, sand backfill; right, cohesive backfill.
TRANSPORTATION RESEARCH RECORD 1414
The field data of the Yinshanzhen project demonstrated that the maximum lateral facing deformations on completion of construction were approximately 1.2 percent of the total facing height for the cohesive backfill. The lateral deformation increased by about 5 percent at 6 months after construction and remained almost constant thereafter. In the Pingshi project (9), the maximum lateral facing deformation increased by about 7 percent 2 years after construction. However, the field data of other projects did not show appreciable increase in facing deformation with time after the completion of construction. These projects include Hengyang, which was completed in August 1988 (8); Duizhen, constructed in 1984 (17); and Kouzhen, completed in October 1984 with an initial maximum facing deformation equal to approximately 1 percent of the facing height (17).
The backfill materials of these projects varied considerably. As mentioned earlier, the LLs and Pis are 31.8 percent and 11.3, respectively, for the Yinshanzhen backfill; 28.8 percent and 10.1 for the Pingshi backfill; and 22.1 percent and 5.8 for the Hengyang backfill. Both Duizhen and Kouzhen backfills are loess, having -y = 17.8 kN/m3
, <!> = 42 degrees, and c = 8 kPa for Duizhen, and -y = 18.5 kN/m3
, <!> = 45 degrees, and c = 9 kPa for Kouzhen. Their LL and PI estimated from related data (17) are 29 percent and 10, respectively. According to the plasticity chart, these backfill soils are low to slightly medium plastic. Loess and cohesive soils with low Pis do not appear to undergo significant increase in facing deformation. For backfills with higher Pis, the lateral facing deformation will increase slightly with time in the first or second year after construction. More data are needed to draw a more definite conclusion, however.
POTENTIAL RUPTURE SURFACE
In common practice, the potential failure surface is taken at the surface that connects the point of peak tensile force in each reinforcing strip. As mentioned earlier, for cohesionless backfills, an often-used approximation is that the potential failure surface is bilinear, consisting of a vertical plane in the upper half and an inclined plane in the lower half of the facing. The horizontal distance from the facing along the top of backfill equals 0.3 H (His facing height in meters), and the oblique plane makes an angle of 45 degrees + <!>12 from the horizontal (2-4). For cohesive backfills, the horizontal distance on top of the backfill between failure surface and facing is estimated from the location of peak tensile force in the uppermost row of reinforcing strips. Results of the field tests and other available data, including those of the Duizhen project, are given in Table 1. It is seen that the horizontal distance varies between 0.24 and 0.32 H. From these data, it is reasonable to take 0.28 H as the horizontal distance between facing and failure surface for cohesive backfills.
EARTH PRESSURE COEFFICIENTS
The internal stability analysis of reinforced earth retaining structures requires a method for determining lateral earth pressure. From the data presented in Figure 2 and design experience, the lateral pressure coefficient diagram shown in
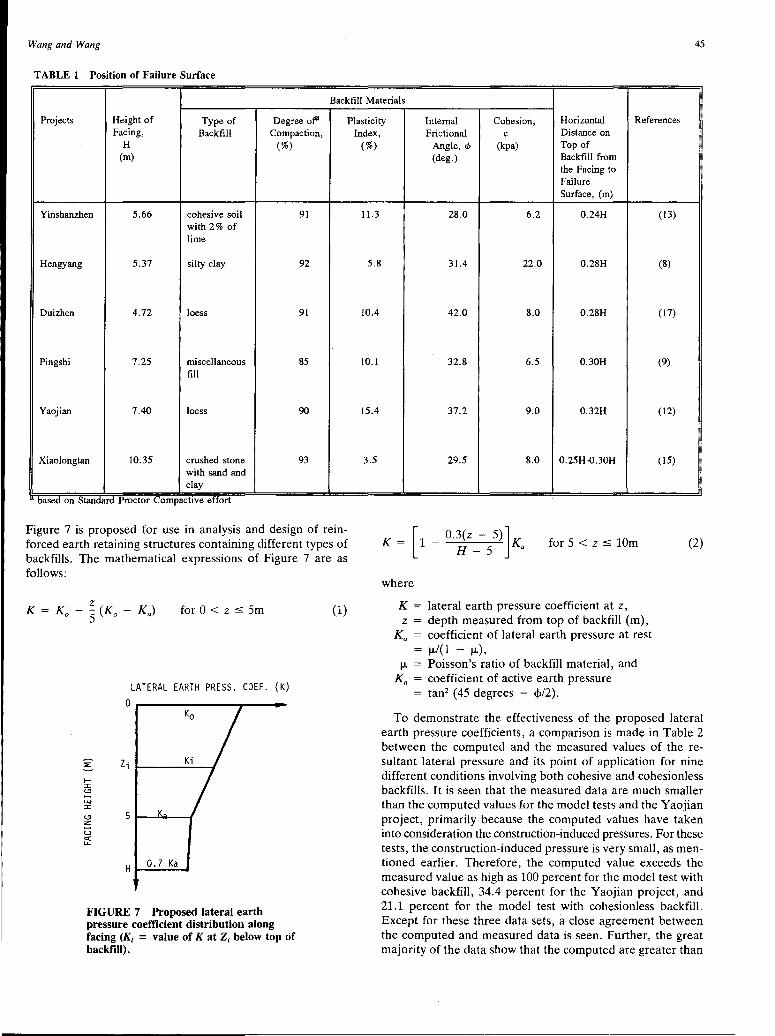
Wang and Wang 45
TABLE 1 Position of Failure Surface
Backfill Materials
Projects Height of Type of Degree of-8 Plasticity Internal Cohesion, Horizontal References Facing, Backfill Compaction,
H (%) (m)
Yinshanzhen 5.66 cohesive soil 91 with 2% of lime
Hengyang 5.37 silty clay 92
Duizhen 4.72 loess 91
Pings hi 7.25 miscellaneous 85 fill
Yaojian 7.40 loess 90
Xiaolongtan 10.35 crushed stone 93 with sand and clay
based on Standard Proctor Compachve effort
Figure 7 is proposed for use in analysis and design of reinforced earth retaining structures containing different types of backfills. The mathematical expressions of Figure 7 are as follows:
1-::i::: (.!)
LU ::i:::
for 0 < z :5 5m
LATERAL EARTH PRESS. COEF. (K) 0 .-~~~~~~~--~---t--
Ki
(.!) 5 _ __... __ -#
z u ~ u..
H 0. 7 Ka
FIGURE 7 Proposed lateral earth pressure coefficient distribution along facing (K; = value of Kat Z; below top of backfill).
(1)
Index, (%)
11.3
5.8
10.4
10.1
15.4
3.5
Frictional c Distance on Angle,</> (kpa) Top of (deg.) Backfill from
the Facing to Failure Surface, (m)
28.0 6.2 0.24H
31.4 22.0 0.28H
42.0 8.0 0.28H
32.8 6.5 0.30H
37.2 9.0 0.32H
29.5 8.0 0.25H-0.30H
K = [l _ 0.3(z - 5)]K H - 5 a
for 5 < z :s lOm
where
K = lateral earth pressure coefficient at z, z = depth measured from top of backfill (m),
K 0 coefficient of lateral earth pressure at rest µ/(1 - µ),
µ Poisson's ratio of backfill material, and Ka coefficient of active earth pressure
tan2 (45 degrees - <f>/2).
(13)
(8)
(17)
(9)
(12)
(15)
(2)
To demonstrate the effectiveness of the proposed lateral earth pressure coefficients, a comparison is made in Table 2 between the computed and the measured values of the resultant lateral pressure and its point of application for nine different conditions involving both cohesive and cohesionless backfills. It is seen that the measured data are much smaller than the computed values for the model tests and the Y aojian project, primarily because the computed values have taken into consideration the construction-induced pressures. For these tests, the construction-induced pressure is very small, as mentioned earlier. Therefore, the computed value exceeds the measured value as high as 100 percent for the model test with cohesive backfill, 34.4 percent for the Yaojian project, and 21.1 percent for the model test with cohesionless backfill. Except for these three data sets, a close agreement between the computed and measured data is seen. Further, the great majority of the data show that the computed are greater than
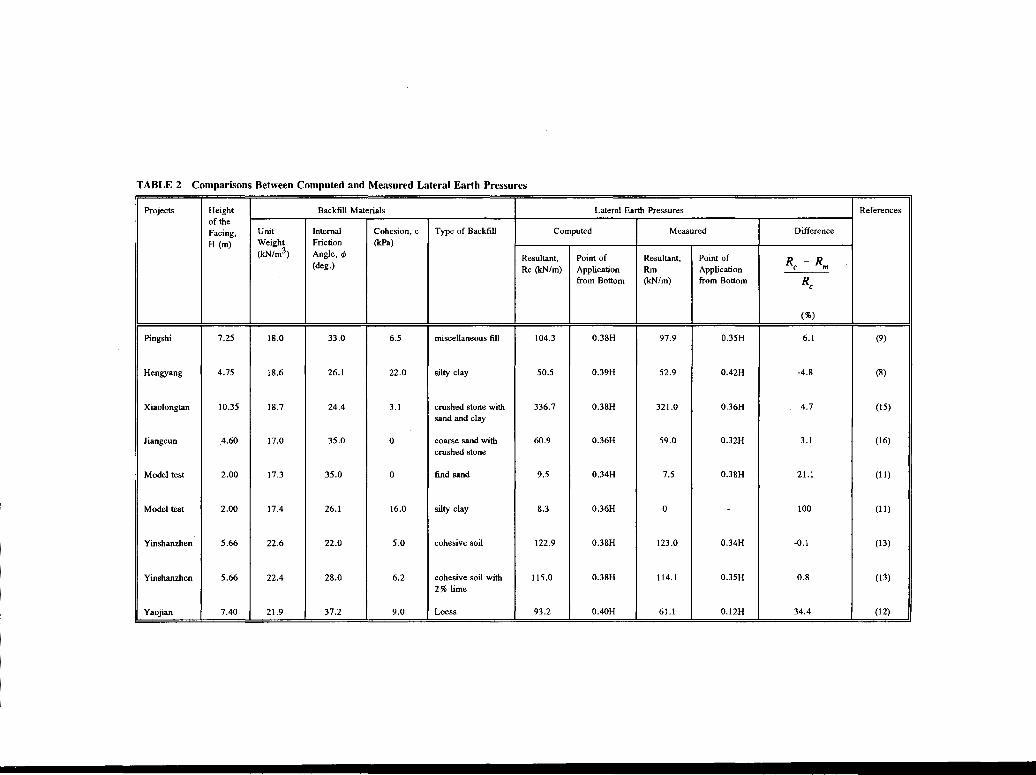
TABLE 2 Comparisons Between Computed and Measured Lateral Earth Pressures
Projects Height Backfill Materials Lateral Earth Pressures References of the Facing, Unit Internal Cohesion, c Type of Backfill Computed Measured Difference
H (m) Weight Friction (kPa) (kN/m3) Angle,</> Resultant, Point of Resultant, Point of RC - Rm (deg.) Re (kN/m) Application Rm Application
from Bottom (kN/m) from Bottom RC
(%)
Pingshi 7.25 18.0 33.0 6.5 miscellaneous fill 104.3 0.38H 97.9 0.35H 6.1 (9)
Hengyang 4.75 18.6 26.1 22.0 silty clay 50.5 0.39H 52.9 0.42H -4.8 (8)
Xiaolongtan 10.35 18.7 24.4 3.1 crushed stone with 336.7 0.38H 321.0 0.36H 4.7 (15) sand and clay
Jiangcun 4.60 17.0 35.0 0 coarse sand with 60.9 0.36H 59.0 0.32H 3.1 (16) crushed stone
Model test 2.00 17.3 35.0 0 find sand 9.5 0.34H 7.5 0.38H 21.1 (11)
Model test 2.00 17.4 26.1 16.0 silty clay 8.3 0.36H 0 - 100 (11)
;
Yinshanzhen 5.66 22.6 22.0 5.0 cohesive soil 122.9 0.38H 123.0 0.34H -0.1 (13)
Yinshanzhen 5.66 22.4 28.0 6.2 cohesive soil with 115.0 0.38H 114.1 0.35H 0.8 (13) 2% lime
Yaojian 7.40 21.9 37.2 9.0 Loess 93.2 0.40H 61.1 0.12H 34.4 (12)
Wang and Wang
the measured values. Thus, use of the proposed lateral earth pressure coefficients may provide some degree of conservativeness in the designed structures.
REMARKS
The lateral earth pressure on the facing depends not only on backfill properties· but also on the construction process. Normal construction induces considerable lateral pressures that should be considered in the analysis and design of reinforcedearth retaining structures. The proposed lateral earth pressure coefficients have considered such a pressure component, and therefore should be able to provide more reliable lateral earth pressures. It should be pointed out that the proposed lateral earth pressure coefficients differ from Schlosser's coefficients (18) in that at depths the lateral pressures computed from Schlosser's coefficients are substantially greater than those computed from the proposed coefficients. Experience has shown that the lateral pressure obtained from Schlosser's coefficients often yielded excessive reinforcement, resulting in unreasonably narrow strip spacings at the lower portion of the backfill.
The vertical pressure distribution along the base of the backfill differs from that of the con;ventional gravity retaining structure. The available data suggest that factors such as backfill type, design and construction of the reinforcing system, and stiffness of the supporting foundation are important in controlling the shape of pressure distribution. More field data are required to determine the relationship between vertical pressure distribution and the influencing factors. The shape of the tensile strip force distribution has no considerable difference between cohesive and cohesionless backfills. However, the magnitude of tensile force is substantially smaller in cohesive than in cohesionless backfills. Further, the location of the potential rupture surface is slightly closer to the facing for cohesive than cohesionless backfills. These suggest that in cohesive backfills, the reinforcing strips can be shorter and also more widely spaced than in cohesionless backfills.
From the available field data, an increase with time in lateral earth pressure, tensile strip force, and lateral facing deformation has been observed in some structures constructed with cohesive backfills. However, no adverse effect has resulted from such a behavior. So far, all retaining structures have performed satisfactorily. It should be pointed out, however, that adequate surface and subsurface drainage systems are needed to maintain the as-constructed backfill property. Since the backfills investigated range from low to slightly medium plastic soils, further study is needed to investigate the long-term stability of reinforced earth retaining structures built with more plastic cohesive backfills.
SUMMARY AND CONCLUSIONS
To investigate the effectiveness of using cohesive backfills for construction of polypropylene strip-reinforced soil retaining structures, laboratory model tests and in situ field tests were performed. Four cohesive soils and one cohesionless soil were studied. Performance measurements included the lateral and vertical pressures, tensile strip force, and lateral deformation of the facing. In addition to the test data, available information was also used in the analysis and evaluation.
47
Test data show that the lateral earth pressure coefficient along the back side of the facing decreases with depth from a maximum at the top of backfill. At the top, the maximum pressure is approximately equal to the at-rest pressure, and at greater depths the pressure becomes less than the active pressure. The vertical pressure along the base of backfill is not uniformly distributed; however, no conclusive data indicate a definite pattern of pressure distribution. The tensile force in reinforcing strips increases with distance from the facing to a maximum, then decreases. The tensile strip force is smaller in cohesive than in cohesionless backfills. The shape of the potential rupture surface in cohesive backfills is a little closer to the facing than that in cohesionless backfills. The available data reveal that the structure with more-plastic cohesive backfills may exhibit more pronounced time-dependent performance.
From the results of this study, it may be concluded that low to slightly medium plastic cohesive soils can be used to construct satisfactory reinforced soil retaining structures, if adequate surface and subsurface drainage systems are provided. However, more field test data are required to determine possible long-term effects of the time-dependent behavior of more-plastic cohesive backfill on the stability of the retaining structures.
ACKNOWLEDGMENT
The manuscript was painstakingly typed by Karen M. Detwiler, for which the authors are appreciative.
REFERENCES
1. Christopher, B. R., S. A. Gill, J.-P. Giroud, I. Juran, J. K. Mitchell, F. Schlosser, and J. Dunnicliff. Design and Construction Guidelines for Reinforced Soil Structures, Vol. 1. Report FHWARD-89-043. FHWA, U.S. Department of Transportation, 1989.
2. Mitchell, J. K., and W. C. B. Villet. NCHRP Report 290: Reinforcement of Earth Slopes and Embankments. TRB, National Research Council, Washington, D.C., June 1987.
3. Jones, C. J. F. P., Earth Reinforcement and Soil Structures. Butterworth, London, England, 1985.
4. Yamanouchi, T., N. Miura, and H. Ochiai. Theory and Practice of Earth Reinforcement. Balkema, Rotterdam, The Netherlands, 1988.
5. Zomberg, J. G., and J. K. Mitchell. Poorly Draining Backfills for Reinforced Soil Structures-A State of the Art Review. Geotechnical Engineering Report UCB/GT/92-10. Department of Civil Engineering, University of California, Berkeley, Oct. 1992.
6. Temporal, J., A.H. Craig, D. H. Harris, and K. C. Brady. The Use of Locally Available Fills for Reinforced and Anchored Earth. Proc., 12th International Conference on Soil Mechanics and Foundation Engineering, Vol. 2, Rio de Janeiro, Brazil, Aug. 1989, pp. 1315-1320.
7. Sridharan, A., B. R. S. Murthy, Bindumadhava, and K. Revanasiddappa. Technique for Using Fine-Grained Soil in Reinforced Earth. Journal of Geotechnical Engineering, ASCE, Vol. 117, No. 8, Aug. 1991, pp. 1174-1190.
8. Wang, Y. H. Testing and Research of !he Reinforced Earth Wall. Journal of Changsha Railway Institute (in Chinese). Vol. 7, No. 4, Dec. 1989, pp. 87-98.
9. Hua, Z. K., Y. H. Wang, and Q. F. Liu. Testing and Studies of the Reinforced Earth Retaining Wall on Heng-Guang DoubleRailline. Proc., 6th Chinese Conference on Soil Mechanics and Foundation Engineering (in Chinese). Shanghai, June 1991, pp. 487-490.
48
10. Wang, Y. H., Z. K. Hua, and Q. F. Liu. The Interpretation of Design Code Clauses for Reinforced Earth Retaining Structures (in Chinese). Aug. 1991.
11. Wang, Y. H., Z. K. Hua, and Q. F. Liu. Testing Report of the Laboratory Model for Reinforced Earth Retaining Structures (in Chinese). 1991.
12. Wang, Z. S., C. C. Li, Y. Yen, and D. L. Yao. Prototype Scale Design and Test of Reinforced Earth Retaining Wall with Cohesive Backfill. Proc., 3rd National Symposium on Reinforced Earth Engineering (in Chinese). Oct. 1990, pp. 38-59.
13. Wu, W. L. In-Situ Test and Analysis of the Reinforced Earth Retaining Wall on Cheng-Yu Highway at Yinshanzhen. Proc., 3rd National Symposium-on Reinforced Earth Engineering (in Chinese), Oct. 1990, pp. 67-108.
14. Jones, C. J. F. P. Construction Influences on the Performance of Reinforced Soil Structures in Performance of Reinforced Soil Structures. Proc., International Reinforced Soil Conference, (A. McGown, K. Yeo, and K. Z. Andrawes, eds.), Thomas Telford, London, England, 1991, pp. 98-116.
TRANSPORTATION RESEARCH RECORD 1414
15. Science Research Department of the 4th Railway Designing Institute (China). The Report of Testing Analysis for Reinforced Earth Retaining Wall at Xiaolongtan of Yunnan Province. Sub grade Engineering (in Chinese), Vol. 8, No. 1, 1986, pp. 40-52.
16. Science Research Department of the 4th Railway Designing Institute (China). The Report of Prototype Scale Design, Construction and In-Situ Test for Reinforced Earth Retaining Wall at Jiangcun. Proc., 3rd National Symposium on Reinforced Earth Engineering (in Chinese), Oct. 1990, pp. 125-141.
17. J. T. E, Y. L. Xu, and Y. Y. Wu. Report of Prototype Scale Test for Reinforced Earth Retaining Wall at Duizhen. Proc., 3rd National Symposium on Reinforced Earth Engineering (in Chinese), Oct. 1990, pp. 62-66.
18. F. Schlosser. History, Current and Future Development of Reinforced Earth. Presented at the Symposium on Soil Reinforcing and Stabilizing Techniques, New South Wales Institute of Technology, Sydney, Australia, Oct. 1978.
Publication of this paper sponsored by Committee on Geosynthetics.
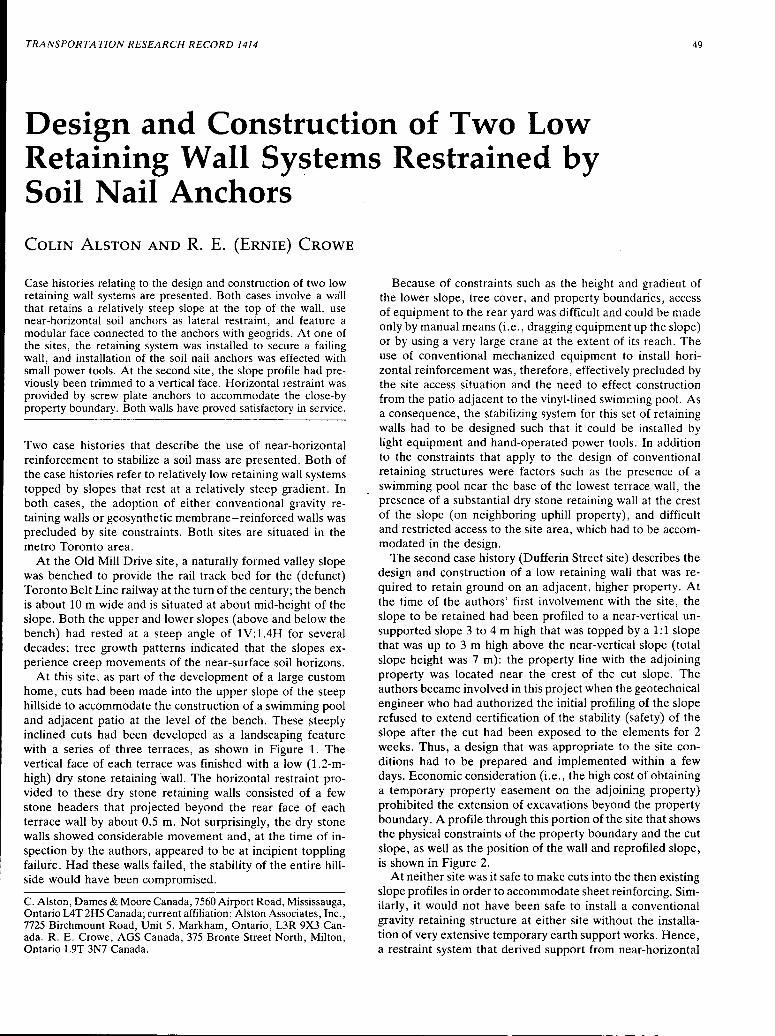
TRANSPORTATION RESEARCH RECORD 1414 49
Design and Construction of Two Low Retaining Wall Systems Restrained by Soil Nail Anchors
COLIN ALSTON AND R. E. (ERNIE) CROWE
Case histories relating to the design and construction of two low retaining wall systems are presented. Both cases involve a wall that retains a relatively steep slope at the top of the wall, use near-horizontal soil anchors as lateral restraint, and feature a modular face connected to the anchors with geogrids. At one of the sites, the retaining system was installed to secure a failing wall, and installation of the soil nail anchors was effected with small power tools. At the second site, the slope profile had previously been .trimmed to a vertical face. Horizontal restraint was provided by screw plate anchors to accommodate the close-by property boundary. Both walls have proved satisfactory in service.
Two case histories that describe the use of near-horizontal reinforcement to stabilize a soil mass are presented. Both of the case histories refer to relatively low retaining wall systems topped by slopes that rest at a relatively steep gradient. In both cases, the adoption of either conventional gravity retaining walls or geosynthetic membrane-reinforced walls was precluded by site constraints. Both sites are situated in the metro Toronto area.
At the Old Mill Drive site, a naturally formed valley slope was benched to provide the rail track bed for the (defunct) Toronto Belt Line railway at the turn of the century; the bench is about 10 m wide and is situated at about mid-height of the slope. Both the upper and lower slopes (above and below the bench) had rested at a steep angle of 1 V:l.4H for several decades; tree growth patterns indicated that the slopes experience creep movements of the near-surface soil horizons.
At this site, as part of the development of a large custom home, cuts had been made into the upper slope of the steep hillside to accommodate the construction of a swimming pool and adjacent patio at the level of the bench. These ~teeply inclined cuts had been developed as a landscaping feature with a series of three terraces, as shown in Figure 1. The vertical face of each terrace was finished with a low (1.2-mhigh) dry stone retaining ·wall. The horizontal restraint provided to these dry stone retaining walls consisted of a few stone headers that projected beyond the rear face of each terrace wall by about 0.5 m. Not surprisingly, the dry stone walls showed considerable movement and, at the time of inspection by the authors, appeared to be at incipient toppling failure. Had these walls failed, the stability of the entire hillside would have been compromised.
C. Alston, Dames & Moore Canada, 7560 Airport Road, Mississauga, Ontario L4T 2H5 Canada; current affiliation: Alston Associates, Inc., 7725 Birchmount Road, Unit 5, Markham, Ontario, L3R 9X3 Canada. R. E. Crowe, AGS Canada, 375 Bronte Street North, Milton, Ontario L9T 3N7 Canada.
Because of constraints such as the height and gradient of the lower slope, tree cover, and property boundaries, access of equipment to the rear yard was difficult and could be made only by manual means (i.e., dragging equipment up the slope) or by using a very large crane at the extent of its reach. The use of conventional mechanized equipment to install horizontal reinforcement was, therefore, effectively precluded by the site access situation and the need to effect construction from the patio adjacent to the vinyl-lined swimming pool. As a consequence, the stabilizing system for this set of retaining walls had to be designed such that it could be installed by light equipment and hand-operated power tools. In addition to the constraints that apply to the design of conventional retaining structures were factors such as the presence of a swimming pool near the base of the lowest terrace wall, the presence of a substantial dry stone retaining wall at the crest of the slope (on neighboring uphill property), and difficult and restricted access to the site area, which had to be accommodated in the design.
The second case history (Dufferin Street site) describes the design and construction of a low retaining wall that was required to retain ground on an adjacent, higher property. At the time of the authors' first involvement with the site, the slope to be retained had been profiled to a near-vertical unsupported slope 3 to 4 m high that was topped by a 1: 1 slope that was up to 3 m high above the near-vertical slope (total slope height was 7 m): the property line with the adjoining property was located near the crest of the cut slope. The authors became involved in this project when the geotechnical engineer who had authorized the initial profiling of the slope refused to extend certification of the stability (safety) of the slope after the cut had been exposed to the elements for 2 weeks. Thus, a design that was appropriate to the site conditions had to be prepared and implemented within a few days. Economic consideration (i.e., the high cost of obtaining a temporary property easement on the adjoining property) prohibited the extension of excavations beyond the property boundary. A profile through this portion of the site that shows the physical constraints of the property boundary and the cut slope, as well as the position of the wall and reprofiled slope, is shown in Figure 2.
At neither site was it safe to make cuts into the then existing slope profiles in order to accommodate sheet reinforcing. Similarly, it would not have been safe to install a conventional gravity retaining structure at either site without the installation of very extensive temporary earth support works. Hence, a restraint system that derived support from near-horizontal
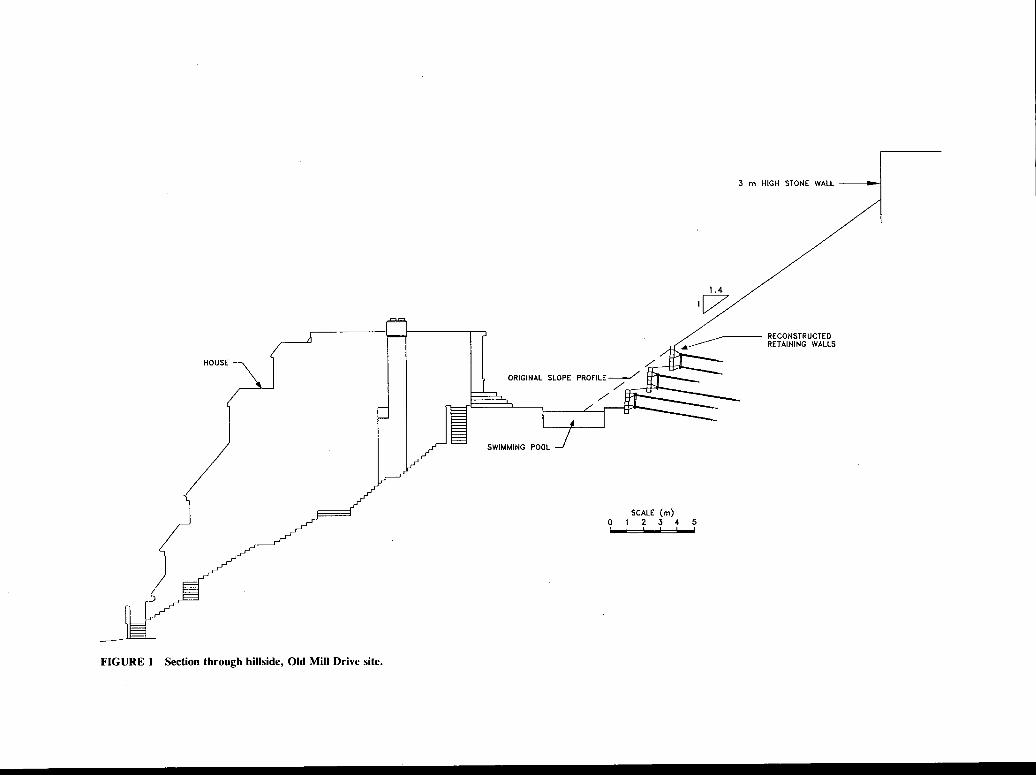
FIGURE 1 Section through hillside, Old Mill Drive site.
ORIGINAL SLOPE PROFILE____/ /_--MC""""'-~.
/
SCALE {m) 0 I 2 3 4 5 '---' '---' '--'
1.4
1~
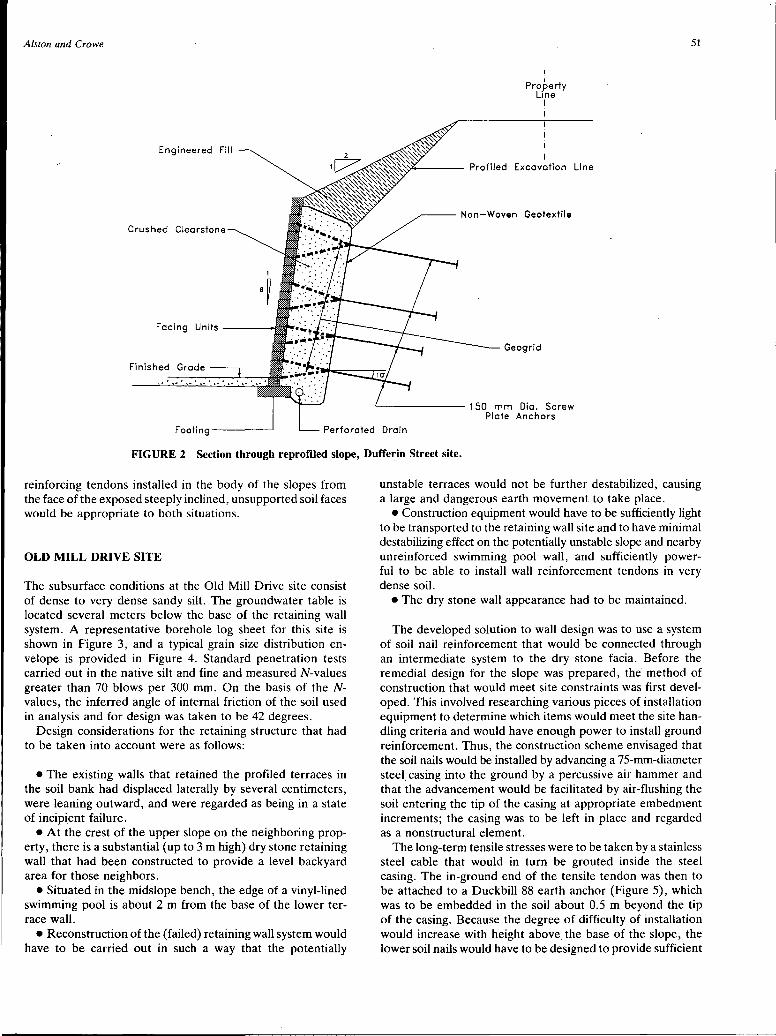
Alston and Crowe
Engineered Fill
1
B ~
Facing Units-----
Finished Grade
'Property Line
I
Geog rid
~------ 150 mm Dia. Screw Plate Anchors
51
Footing-----' Perforated Drain
FIGURE 2 Section through reprofiled slope, Dufferin Street site.
reinforcing tendons installed in the body of the slopes from the face of the exposed steeply inclined, unsupported soil faces would be appropriate to both situations.
OLD MILL DRIVE SITE
The subsurface conditions at the Old Mill Drive site consist of dense to very dense sandy silt. The groundwater table is located several meters below the base of the retaining wall system. A representative borehole log sheet for this site is shown in Figure 3, and a typical grain size distribution envelope is provided in Figure 4. Standard penetration tests carried out in the native silt and fine and measured N-values greater than 70 blows per 300 mm. On the basis of the Nvalues, the inferred angle of internal friction of the soil used in analysis and for design was taken to be 42 degrees.
Design considerations for the retaining structure that had to be taken into account were as follows:
• The existing walls that retained the profiled terraces in the soil bank had displaced laterally by several centimeters, were leaning outward, and were regarded as being in a state of incipi_ent failure.
• At the crest of the upper slope on the neighboring property, there is a substantial (up to 3 m high) dry stone retaining wall that had been constructed to provide a level backyard area for those neighbors.
•Situated in the midslope bench, the edge of a vinyl-lined swimming pool is about 2 m from the base of the lower terrace wall.
• Reconstruction of the (failed) retaining wall system would have to be carried out in such a way that the potentially
unstable terraces would not be further destabilized, causing a large and dangerous earth movement to take place.
• Construction equipment would have to be sufficiently light to be transported to the retaining wall site and to have minimal destabilizing effect on the potentially unstable slope and nearby unreinforced swimming pool wall, and sufficiently powerful to be able to install wall reinforcement tendons in very dense soil.
• The dry stone wall appearance had to be maintained.
The developed solution to wall design was to use a system of soil nail reinforcement that would be connected through an intermediate system to the dry stone facia. Before the remedial design for the slope was prepared, the method of construction that would meet site constraints was first developed. This involved researching various pieces of installation equipment to determine which items would meet the site handling criteria and would have enough power to install ground reinforcement. Thus, the construction scheme envisaged that the soil nails would be installed by advancing a 75-mm-diameter steel casing into the ground by a percussive air hammer and that the advancement would be facilitated by air-flushing the soil entering the tip of the casing at appropriate embedment increments; the casing was to be left in place and regarded as a nonstructural element.
The long-term tensile stresses were to be taken by a stainless steel cable that would in tum be grouted inside the steel casing. The in-ground end of the tensile tendon was then to be attached to a Duckbill 88 earth anchor (Figure 5), which was to be embedded in the soil about 0.5 m beyond the tip of the casing. Because the degree of difficulty of installation would increase with height above the base of the slope, the lower soil nails would have to be designed to provide sufficient
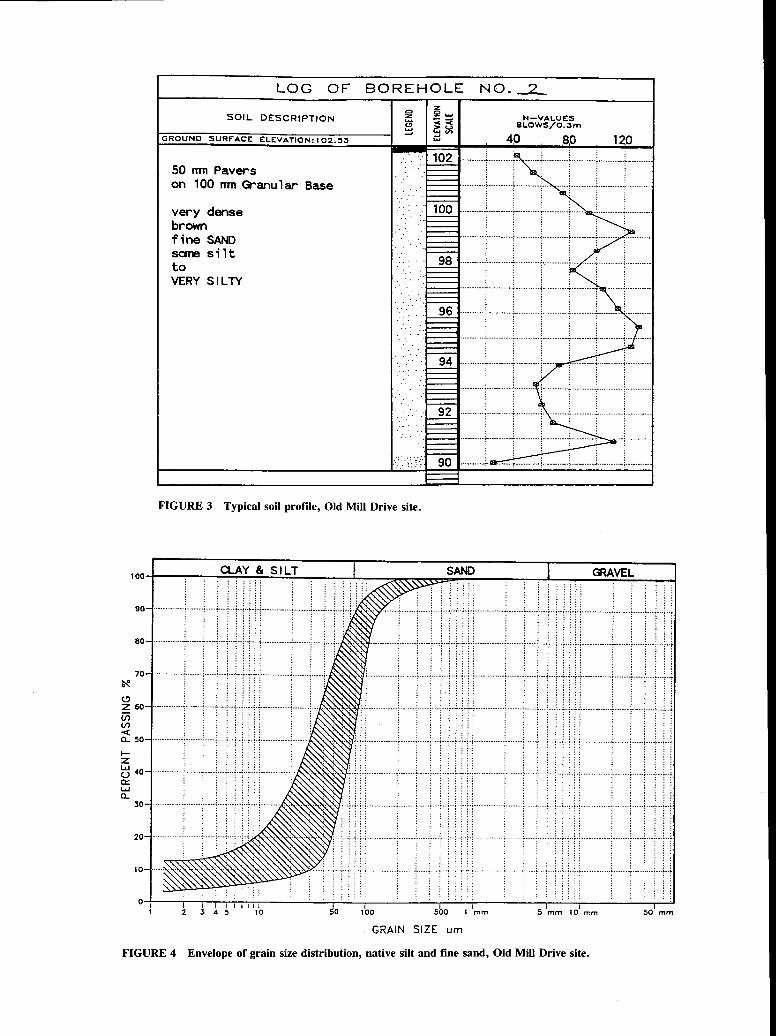
LOG OF BOREHOLE N0._2_
SOIL DESCRIPTION
GROUND SURFACE ELEVATION: 1 02.53
50 mn Pavers on 100 nm Granular Base
very dense brown fine SAND sane silt to VERY SILTY
FIGURE 3 Typical soil profile, Old Mill Drive site.
N-VALUES 8LOWS/0.3m
40 80 , 0
1 oo-+----;---;-~CLA-;-r~Y"7'77&_S~IL~T--;---:-~~i~--:~~~~S~AND~:,..._--~~-'-~~~~:.::::.VE!!:!:L~---J I [!~-~--
90,---···--·······-·:··--····:·······~·····:····r···:··~··r··::···········-·····t··········t·······;····+·+··i·~~~~'Y-········!·········!·······!····+··+·+·;·-H···················i·-··-···-~·-···+····i···+·-~··H··!··········-·······; .......... ; ....... ; ..... ~ ... ; ... d
80-t·······-·······-~··········,····-o;·-···:···.,···•··~-~-;, ... _ ............. ; .......... ; ........ : ..... : ... J>..f ..:~···· · ........... ···:··········•·····-:-···:i····::-··:-·"··"·:··················:··········i-·····+····•····i···i-··=·-:·+···········-···+········+······'·····'····'-··'-1
~ 70-t··················~········-;·····••!•••••!••••!•••!··,··'-"'···-·············; .......... ; ....... ; .. "11:1o...~:'<t:~! ......... ·········!·······•••!•••••••!••••••!••••!•••!•••!""!""!·--············•••!••····-··!·······•··-·!····•···'-··•··•··•···--··········-'··········i·······i·-···i-·-·'-··+l
r· ' :50-t··················•··········>-······'-···"'·····•··"'··•··; .. ; •................... ; ......... ~;~~-~.~~~-·; ••!••!•··················•·········"······•!•••••!••••!•··~··!••!••!•··············••••!•••·····-<·······<-····•········•··•···•·-'···················•··········i·-····-<; ..... ; .... ; ...••
~ .. a"-:··"/:·:·· .... ; .. : ................... ;---·-····7···--·:·-···:--·-:-·-:·· .. ··:--:--·····-·-····----;------·---:--····-:--···-:····'---;.·"··'··'··------------····"···---·--:-·-···-:---··'···-:-·H
30 ··~:
20-+················'··········:·-······=·····•···.,~·-·i··,.K·oA'-.· .... , ... ;-~"'-'""9''··'fr··· .: ... , ..•.. : .. : ................... : ........... : ....... : ..... : .... , ... , ... , .. "., ................... : ........... : ....... : ..... : ........ ;. . .,..,.., .................. : .......... ;. ....... ;. .... : ... .: ... ;.. ~ ........... ~~- -~~: : . ~
10- ····--~~'®.~. . . ... ,·'\:Y". :· ·····•·····•····•···•······•···•··················•··········•·······•·····•····•···O-··•··•··•·····························•·······•·····•·····•···<-··'-·'··'-···························-'··············•····•··-<·l
~~,;:: :: 0 I I I I I I II II
2 3 4 5 10 •o I 100
I I 500 1 mm
GRAIN SIZE um
5 1mm 10
1 mm
FIGURE 4 Envelope of grain size distribution, native silt and fine sand, Old Mill Drive site.
50 mm
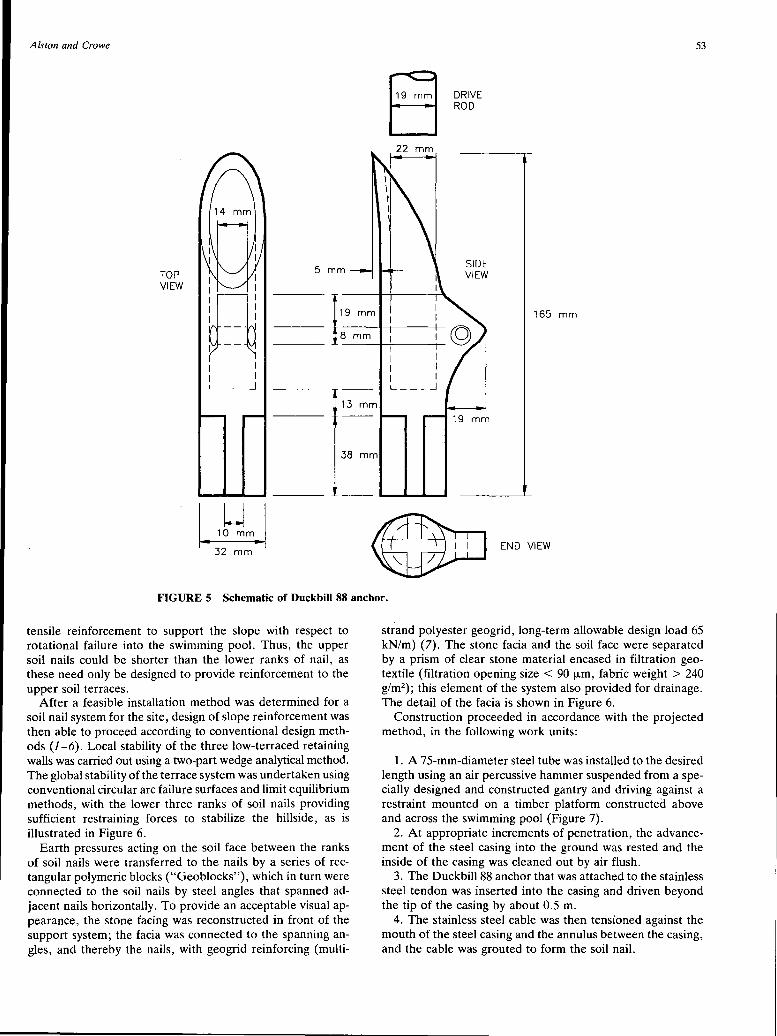
Alston and Crowe
5 TOP I I VIEW
n I I I I I I I L ___ _j
LW 32 mm
22 mm
mm
119 mm
8 mm
13 mm
38 mm
DRIVE ROD
SIDE VIEW
19 mm
53
165 mm
END VIEW
FIGURE 5 Schematic of Duckbill 88 anchor.
tensile reinforcement to support the slope with respect to rotational failure into the swimming pool. Thus, the upper soil nails could be shorter than the lower ranks of nail, as these need only be designed to provide reinforcement to the upper soil terraces.
After a feasible installation method was determined for a soil nail system for the site, design of slope reinforcement was then able to proceed according to conventional design methods (1-6). Local stability of the three low-terraced retaining walls was carried out using a two-part wedge analytical method. The global stability of the terrace system was undertaken using conventional circular arc failure surfaces and limit equilibrium methods, with the lower three ranks of soil nails providing sufficient restraining forces to stabilize the hillside, as is illustrated in Figure 6.
Earth pressures acting on the soil face between the ranks of soil nails were transferred to the nails by a series of rectangular polymeric blocks ("Geoblocks"), which in turn were connected to the soil nails by steel angles that spanned adjacent nails horizontally. To provide an acceptable visual appearance, the stone facing was reconstructed in front of the support system; the facia was connected to the spanning angles, and thereby the nails, with geogrid reinforcing (multi-
strand polyester geogrid, long-term allowable design load 65 kN/m) (7). The stone facia and the soil face were separated by a prism of clear stone material encased in filtration geotextile (filtration opening size < 90 µm, fabric weight > 240 g/m2
); this element of the system also provided for drainage. The detail of the facia is shown in Figure 6.
Construction proceeded in accordance with the projected method, in the following work units:
1. A 75-mm-diameter steel tube was installed to the desired length using an air percussive hammer suspended from a specially designed and constructed gantry and driving against a restraint mounted on a timber platform constructed above and across the swimming pool (Figure 7).
2. At appropriate increments of penetration, the advancement of the steel casing into the ground was rested and the inside of the casing was cleaned out by air flush.
3. The Duckbill 88 anchor that was attached to the stainless steel tendon was inserted into the casing and driven beyond the tip of the casing by about 0.5 m.
4. The stainless steel cable was then tensioned against the mouth of the steel casing and the annulus between the casing, and the cable was grouted to form the soil nail.
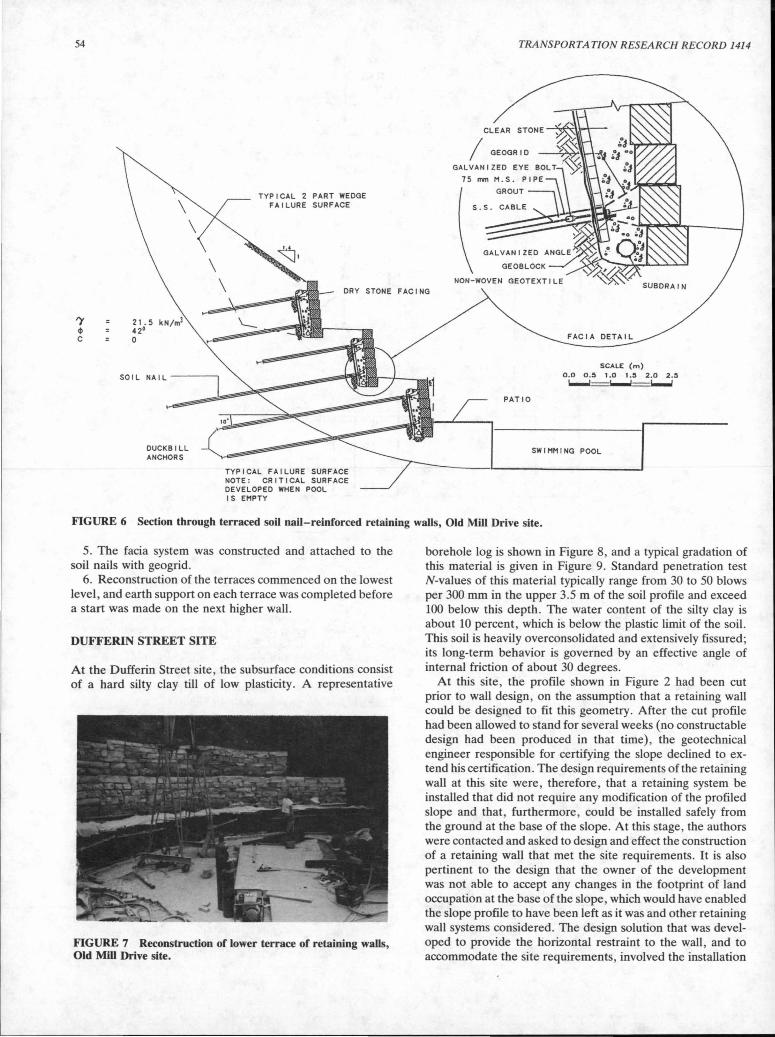
54
')' 21.5 4> 42° c 0
DUCKBILL ANCHORS
TYPICAL 2 PART WEDGE FAILURE SURFACE
-- DRY STONE FACING
TYPICAL FAILURE SURFACE NOTE: CRITICAL SURFACE DEVELOPED WHEN POOL IS EMPTY
TRANSPORTATION RESEARCH RECORD 1414
SCALE (m) 0 . 0 0.5 1.0 1.5 2.0 2.5
1.....1 I I I I
PATIO
SWIMMING POOL
FIGURE 6 Section through terraced soil nail-reinforced retaining walls, Old Mill Drive site.
5. The facia system was constructed and attached to the soil nails with geogrid.
6. Reconstruction of the terraces commenced on the lowest level, and earth support on each terrace was completed before a start was made on the next higher wall.
DUFFERIN STREET SITE
At the Dufferin Street site, the subsurface conditions consist of a hard silty clay till of low plasticity. A representative
FIGURE 7 Reconstruction of lower terrace of retaining walls, Old Mill Drive site.
borehole log is shown in Figure 8, and a typical gradation of this material is given in Figure 9. Standard penetration test N-values of this material typically range from 30 to 50 blows per 300 mm in the upper 3.5 m of the soil profile and exceed 100 below this depth. The water content of the silty clay is about 10 percent, which is below the plastic limit of the soil. This soil is heavily overconsolidated and extensively fissured; its long-term behavior is governed by an effective angle of internal friction of about 30 degrees.
At this site, the profile shown in Figure 2 had been cut prior to wall design, on the assumption that a retaining wall could be designed to fit this geometry. After the cut profile had been allowed to stand for several weeks (no constructable design had been produced in that time), the geotechnical engineer responsible for certifying the slope declined to extend his certification. The design requirements of the retaining wall at this site were, therefore, that a retaining system be installed that did not require any modification of the profiled slope and that, furthermore, could be installed safely from the ground at the base of the slope. At this stage, the authors were contacted and asked to design and effect the construction of a retaining wall that met the site requirements. It is also pertinent to the design that the owner of the development was not able to accept any changes in the footprint of land occupation at the base of the slope, which would have enabled the slope profile to have been left as it was and other retaining wall systems considered. The design solution that was developed to provide the horizontal restraint to the wall, and to accommodate the site requirements, involved the installation
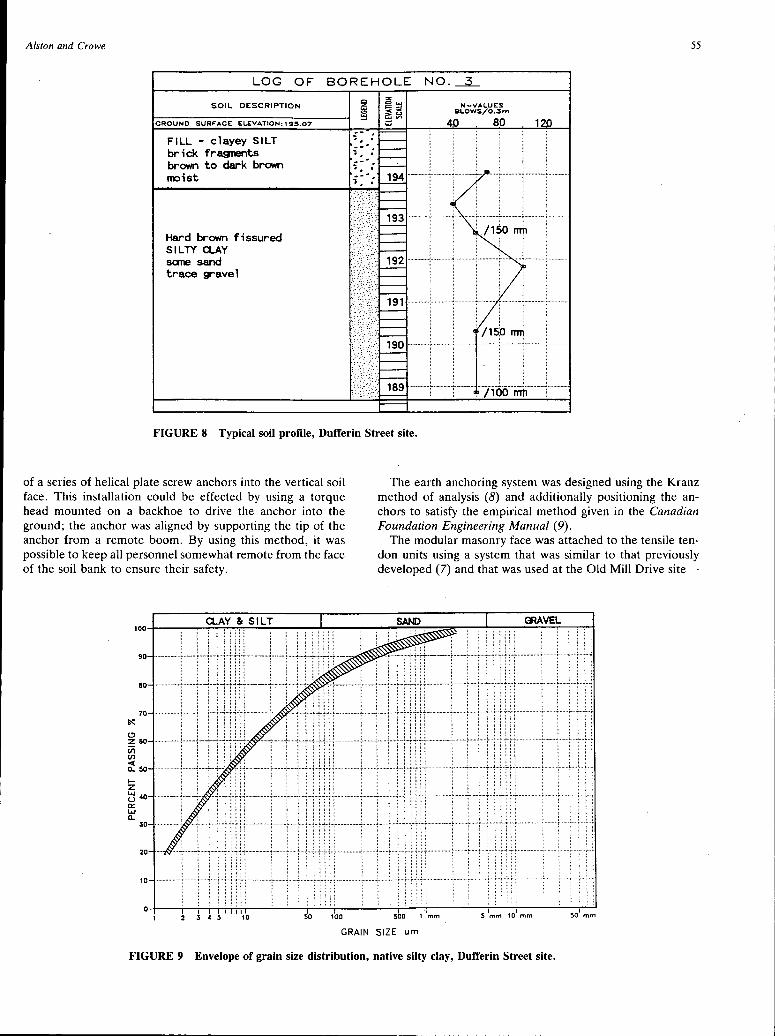
Alston and Crowe 55
LOG OF BOREHOLE NO.~
SOIL DESCRIPTION
GROUNO SURF"ACE ELEVATION: 19.5.07
FILL - clayey SILT br;ck fragnents brown to dark brown rro;st
Hard brown fissured SILTY QAY sane sand trace gravel
N-VALUES BLOWS/0.3m
40 80 1 0
: : :
t···--····-+-··-·········~·-········-··t-··-·········"····-······-~···-······-·-i·········-····
FIGURE 8 Typical soil profile, Dufferin Street site.
of a series of helical plate screw anchors into the vertical soil face. This installation could be effected by using a torque head mounted on a backhoe to drive the anchor into the ground; the anchor was aligned by supporting the tip of the anchor from a remote boom. By using this method, it was possible to keep all personnel somewhat remote from the face of the soil bank to ensure their safety.
100
90
80
70 ~
0 z 60 v; U')
-< 0... 50
..... z
QAY & SILT
~~
A ~ ~
f~)' ~-40 a::: ..... 0... ~~
30
20
)~ 1-······,v
10
' I I I 11111 I 2 3
' 5 10
-~ ~ ~>
l
' ': !O 1bo
:~ ..
r-
i ! ;
The earth anchoring system was designed using the Kranz method of analysis (8) and additionally positioning the anchors to satisfy the empirical method given in the Canadian Foundation Engineering Manual (9).
The modular masonry face was attached to the tensile tendon units using a system that was similar to that previously developed (7) and that was used at the Old Mill Drive site-
SANO ~VEL ::~'"
I ,"'-x·.......-
I . ' ; :
·1 5
1mm
I 50
1 mm 500 1 mm 10 mm
GRAIN SIZE um
FIGURE 9 Envelope of grain size distribution, native silty clay, Dufferin Street site.
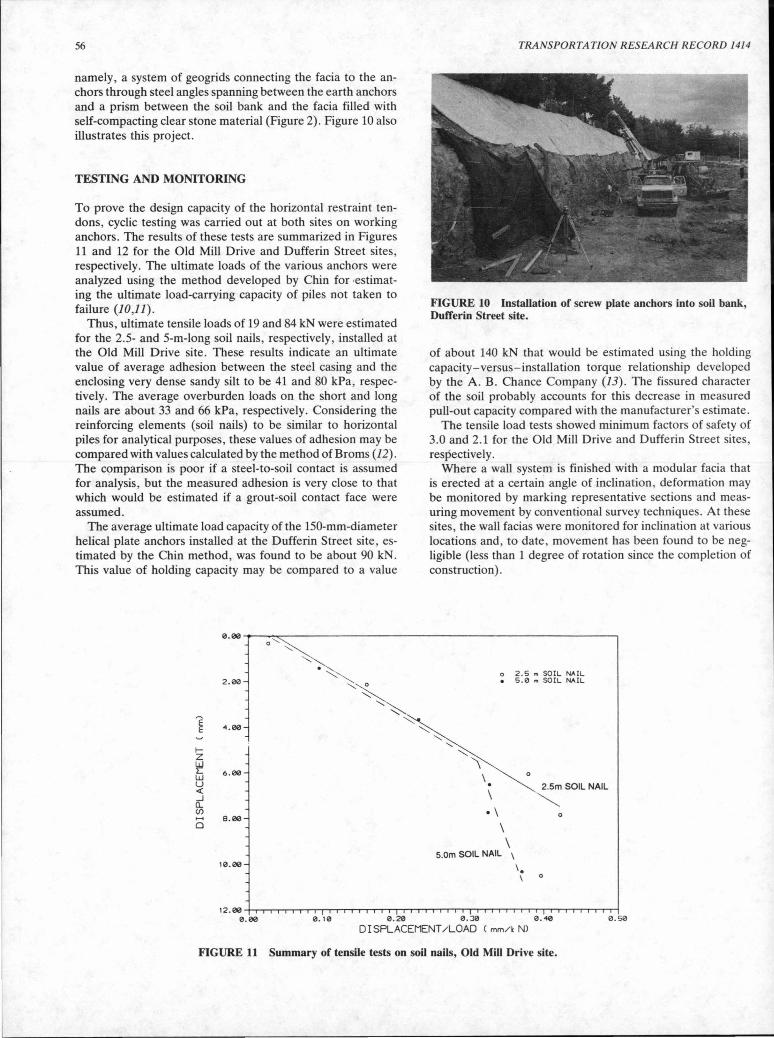
56
namely, a system of geogrids connecting the facia to the anchors through steel angles spanning between the earth anchors and a prism between the soil bank and the facia filled with self-compacting clear stone material (Figure 2). Figure 10 also illustrates this project.
TESTING AND MONITORING
To prove the design capacity of the horizontal restraint tendons, cyclic testing was carried out at both sites on working anchors. The results of these tests are summarized in Figures 11 and 12 for the Old Mill Drive and Dufferin Street sites, respectively. The ultimate loads of the various anchors were analyzed using the method developed by Chin for ·estimating the ultimate load-carrying capacity of piles not taken to failure (10,11).
Thus, ultimate tensile loads of 19 and 84 kN were estimated for the 2.5- and 5-m-long soil nails, respectively, installed at the Old Mill Drive site. These results indicate an ultimate value of average adhesion between the steel casing and the enclosing very dense sandy silt to be 41 and 80 kPa, respectively. The average overburden loads on the short and long nails are about 33 and 66 kPa, respectively. Considering the reinforcing elements (soil nails) to be similar to horizontal piles for analytical purposes, these values of adhesion may be compared with values calculated by the method of Broms (12). The c9mparison is poor if a steel-to-soil contact is assumed for analysis, but the measured adhesion is very close to that which would be estimated if a grout-soil contact face were assumed.
The average ultimate load capacity of the 150-mm-diameter helical plate anchors installed at the Dufferin Street site, estimated by the Chin method, was found to be about 90 kN. This value of holding capacity may be compared to a value
0.00
2.00
'E 4.00 E
I-z w I: 6.00 w u < _J a.. (/) ~ 8.00 0
10.00
12.00
TRANSPORTATION RESEARCH RECORD 1414
FIGURE 10 Installation of screw plate anchors into soil bank, Dufferin Street site.
of about 140 kN that would be estimated using the holding capacity-versus-installation torque relationship developed by the A. B. Chance Company (13). The fissured character of the soil probably accounts for this decrease in measured pull-out capacity compared with the manufacturer's estimate.
The tensile load tests showed minimum factors of safety of 3.0 and 2.1 for the Old Mill Drive and Dufferin Street sites, respectively.
Where a wall system is finished with a modular facia that is erected at a certain angle of inclination, deformation may be monitored by marking representative sections and measuring movement by conventional survey techniques. At these sites, the wall facias were monitored for inclination at various locations and, to date, movement has been found to be negligible (less than 1 degree of rotation since the completion of construction).
'· \ . \
o 2.5 m SOIL NAIL • 5.0 m SOIL NAIL
\ \
0
2.Sm SOIL NAIL
~ 0
5.0m SOIL NAIL
'· \ 0
0.00 0. 10 0.20 0.30 0.40 0.50
DISPLACEMENT/LOAD Cmm/kN)
FIGURE 11 Summary of tensile tests on soil nails, Old Mill Drive site.
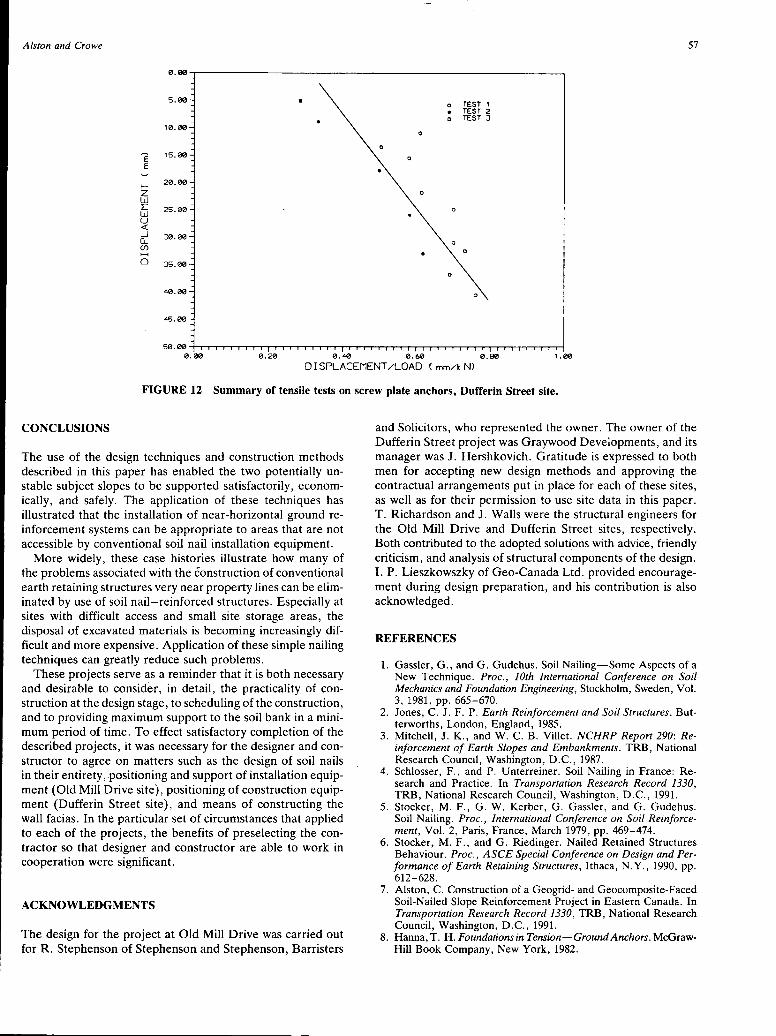
Alston and Crowe
'E E
I-z w L: w u <( _J CL (/) ....... 0
0.00
5.00
10.00
15.00
20.00
25.00
30.00
35.00
40.00
45.00
50.00
0
0
o TEST 1 TEST 2 TEST 3
57
0.00 0.20 0.40 0.60 0.80 1.00
DISPLACEMENT/LOAD Cmm/kN)
FIGURE 12 Summary of tensile tests on screw plate anchors, Dufferin Street site.
CONCLUSIONS
The use of the design techniques and construction methods described in this paper has enabled the two potentially unstable subject slopes to be supported satisfactorily,. economically, and safely. The application of these techniques has illustrated that the installation of near-horizontal ground reinforcement systems can be appropriate to areas that are not accessible by conventional soil nail installation equipment.
More widely, these case histories illustrate how many of the problems associated with the eonstruction of conventional earth retaining structures very near property lines can be eliminated by use of soil nail-reinforced structures. Especially at sites with difficult access and small site storage areas, the disposal of excavated materials is becoming increasingly difficult and more expensive. Application of these simple nailing techniques can greatly reduce such problems.
These projects serve as a reminder that it is both necessary and desirable to consider, in detail, the practicality of construction at the design stage, to scheduling of the construction, and to providing maximum support to the soil bank in a minimum period of time. To effect satisfactory completion of the described projects, it was necessary for the designer and constructor to agree on matters such as the design of soil nails in their entirety, positioning and support of installation equipment (Old Mill Drive site), positioning of construction equipment (Dufferin Street site), and means of constructing the wall facias. In the particular set of circumstances that applied to each of the projects, the benefits of preselecting the contractor so that designer and constructor are able to work in cooperation were significant.
ACKNOWLEDGMENTS
The design for the project at Old Mill Drive was carried out for R. Stephenson of Stephenson and Stephenson, Barristers
and Solicitors, who represented the owner. The owner of the Dufferin Street project was Graywood Developments, and its manager was J. Hershkovich. Gratitude is expressed to both men for accepting new design methods and approving the contractual arrangements put in place for each of these sites, as well as for their permission to use site data in this paper. T. Richardson and J. Walls were the structural engineers for the Old Mill Drive and Dufferin Street sites, respectively. Both contributed to the adopted solutions with advice, friendly criticism, and analysis of structural components of the design. I. P. Lieszkowszky of Geo-Canada Ltd. provided encouragement during design preparation, and his contribution is also acknowledged.
REFERENCES
1. Gassler, G., and G. Gudehus. Soil Nailing-Some Aspects of a New Technique. Proc., 10th International Conference on Soil Mechanics and Foundation Engineering, Stockholm, Sweden, Vol. 3, 1981, pp. 665-670.
2. Jones, C. J. F. P. Earth Reinforcement and Soil Structures. Butterworths, London, England, 1985.
3. Mitchell, J. K., and W. C. B. Villet. NCHRP Report 290: Reinforcement of Earth Slopes and Embankments. TRB, National Research Council, Washington, D.C., 1987.
4. Schlosser, F., and P. Unterreiner. Soil Nailing in France: Research and Practice. In Transportation Research Record 1330, TRB, National Research Council, Washington, D.C., 1991.
5. Stocker, M. F., G. W. Kerber, G. Gassler, and G. Gudehus. Soil Nailing. Proc., International Conference on Soil Reinforcement, Vol. 2, Paris, France, March 1979, pp. 469-474.
6. Stocker, M. F., and G. Riedinger. Nailed Retained Structures Behaviour. Proc., ASCE Special Conference on Design and Performance of Earth Retaining Structures, Ithaca, N.Y., 1990, pp. 612-628.
7. Alston, C. Construction of a Geogrid- and Geocomposite-Faced Soil-Nailed Slope Reinforcement Project in Eastern Canada. In Transportation Research Record 1330, TRB, National Research Council, Washington, D.C., 1991.
8. Hanna, T. H. Foundations in Tension-GroundAnchors. McGrawHill Book Company, New York, 1982.
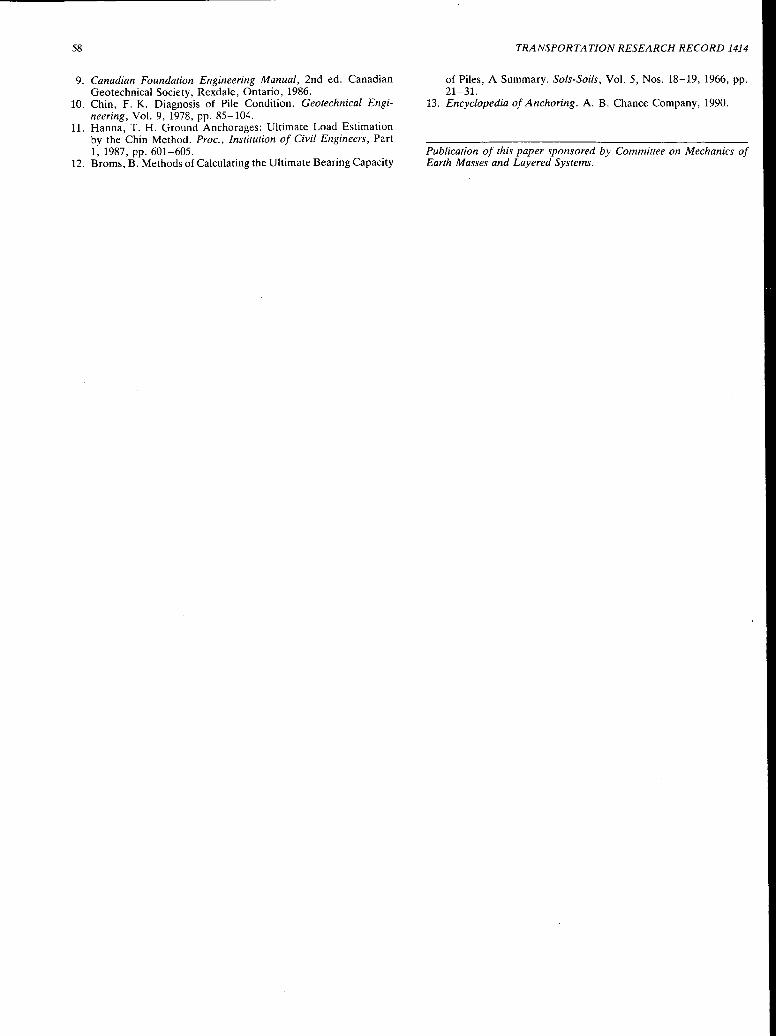
58
9. Canadian Foundation Engineering Manual, 2nd ed. Canadian Geotechnical Society, Rexdale, Ontario, 1986.
10. Chin, F. K. Diagnosis of Pile Condition. Geotechnical Engineering, Vol. 9, 1978, pp. 85-104.
11. Hanna, T. H. Ground Anchorages: Ultimate Load Estimation by the Chin Method. Proc., Institution of Civil Engineers, Part 1, 1987, pp. 601-605.
12. Broms, B. Methods of Calculating the Ultimate Bearing Capacity
TRANSPORTATION RESEARCH RECORD 1414
of Piles, A Summary. Sols-Soils, Vol. 5, Nos. 18-19, 1966, pp. 21-31.
13. Encyclopedia of Anchoring. A. B. Chance Company, 1990.
Publication of this paper sponsored by Committee on Mechanics of Earth Masses and Layered Systems.
TRANSPORTATION RESEARCH RECORD 1414 59
Shallow Foundations on Geogrid-Reinforced Sand
MAHER T. OMAR, BRAJA M. DAS, VIJAY K. PURI,
SHING-CHuNG YEN, AND EcHoL E. CooK
Laboratory model test results for the bearing capacity of strip and square foundations supported by sand reinforced with layers of geogrid are presented. On the basis of the present model test results, the bearing capacity ratios with respect to the ultimate bearing capacity (and at levels of limited settlement of the foundation) were determined. For practical design purposes, it appears that for strip foundations the bearing capacity ratio calculated on the basis of the ultimate bearing capacity is 1. 7 times the bearing capacity ratio at limited levels of settlement. Similarly, for square foundations, the bearing capacity ratio with respect to the ultimate bearing capacity is about 1.45 times the bearing capacity ratio at limited levels of settlement.
Results are available for several laboratory studies that evaluate the beneficial effects of soil reinforcement for improving the ultimate bearing capacity of shallow strip and square foundations supported by granular soil. Most of the references can be found in the paper of Guido et al. (J). The materials for soil reinforcement used in the existing studies were thin metal strips, wire mesh, aluminum foil, rope fibers, geotextiles, and geogrids. The cited studies have evaluated the optimum values of the following parameters for deriving the maximum benefit from the soil reinforcement (Figure 1):
1. Extent of reinforcement, d; 2. Location of first layer of reinforcement with respect to
the bottom of the foundation, u; and 3. Width of reinforcement layers, b.
The increase in the ultimate bearing capacity has generally been expressed in a nondimensional form, called bearing capacity ratio (BCRJ, which may be defined as
(1)
where qu(R) is the ultimate bearing capacity with the reinforcement in soil and qu is the ultimate bearing capacity in unreinforced soil.
It has also been observed that with the inclusion of soil reinforcement, the ultimate bearing capacity as well as the settlement of the foundation at ultimate load increases in comparison with that in unreinforced soil. In most cases, shallow foundations are designed for limited settlement(s) levels and, hence, the magnitude of BCRu becomes meaningless. For that reason it is necessary to determine the BCR at various levels of settlement to aid in the design process of a foun-
Department of Civil Engineering and Mechanics, Southern Illinois University, Carbondale, Ill. 62901.
dation. The BCR with respect to settlement, BCRs, may be defined as
(2)
where qR and q are the loads per unit area of the foundation at a settlement level s with and without y reinforcement in the supporting soil, respectively.
This paper presents some laboratory model test results on a strip and a square foundation supported by sand reinforced with layers of geogrid. From the model test results, the variations of BCRu and BCRs at various levels of s/ B (B = width of foundation), and the ratio of BCRjBCRs with d/B, b/B, and u/B were determined.
LABORATORY MODEL TESTS
Laboratory bearing capacity tests were conducted using two model foundations made of aluminum plates. The square model foundation measured 76.2 x 76.2 mm (B x B), and the strip foundation measured 76.2 mm (B) 304.8 mm. The bases of the model foundations were made rough by cementing a thin layer of sand to them with epoxy glue.
A fine silica sand was used for all model tests. The sand had 100 percent passing No. 20 (U.S.) sieve (0.85-mm opening), 26 percent passing No. 40 sieve (0.425-mm opening), and 0 percent passing No. 60 sieve (0.25-mm opening). A biaxial geogrid was used for soil reinforcement. The physical properties of the geogrid are given as follows:
•Structure: punched sheet drawn, •Polymer: PP/HDPE copolymer, • Junction method: unitized, •Aperture size: 25.4 33.02 mm, •Nominal rib thickness: 0.762 mm, and • Nominal junction thickness: 2.286 mm.
Laboratory model tests on the strip foundation were conducted in a box 304.8 mm wide, 1.1 m long, and 914 mm high. Model tests on the square foundation were conducted in a box measuring 760 x 760 x 760 mm.
In conducting the tests, sand was poured into the test boxes in a layer 25.4 mm thick using a raining technique. During placement of sand, the geogrid layers were positioned at desired values of u/B and h/B. At the end of sand placement, the model foundation was placed on the surface of the sand layer. Load to the model foundation was applied with a hy-
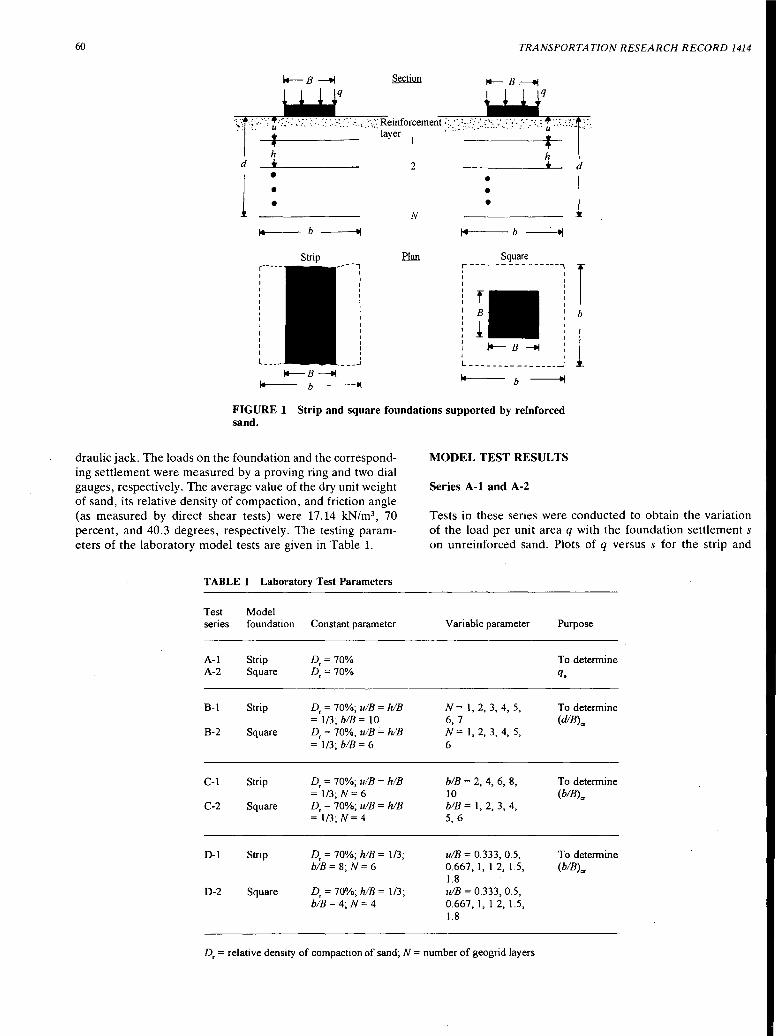
60 TRANSPORTATION RESEARCH RECORD 1414
i.-14--- b -----tf
FIGURE 1 Strip and square foundations supported by reinforced sand.
draulic jack. The loads on the foundation and the corresponding settlement were measured by a proving ring and two dial gauges, respectively. The average value of the dry unit weight of sand, its relative density of compaction, and friction angle (as measured by direct shear tests) were 17.14 kN/m3
, 70 percent, and 40.3 degrees, respectively. The testing parameters of the laboratory model tests are given in Table 1.
TABLE 1 Laboratory Test Parameters
Test Model series foundation Constant parameter
A-1 Strip D.= 70% A-2 Square D. = 70%
B-1 Strip D. = 70%; u/B = h!B = 1 /3; b/B = 10 .
B-2 Square D. = 70%; u!B ;, h/B = 1/3; b/B = 6
C-1 Strip D. = 70%; u/B = h 1B = 1/3; N = 6
C-2 Square D. = 70%; u/B = h!B = 1/3; N= 4
D-1 Strip D. = 70%; h!B = 1 /3; b!B= 8; N= 6
D-2 Square D. = 70%; h!B = 1/3; b/B= 4; N= 4
MODEL TEST RESULTS
Series A-1 and A-2
Tests in these series were conducted to obtain the variation of the load per unit area q with the foundation settlements on unreinforced sand. Plots of q versus s for the strip and
Variable parameter
N = 1, 2, 3, 4, 5, 6, 7 N = 1, 2, 3, 4, 5, 6
b/B = 2, 4, 6, 8, 10 b/B = 1, 2, 3, 4, 5, 6
u!B = 0.333, 0.5, 0.667, 1, 1.2, 1.5, 1.8 u/B = 0.333, 0.5, 0.667, 1, 1.2, 1.5, 1.8
Purpose
To determine qu
To determine (dlB)a
To determine (b!B)a
To determine (b/B)a
D. = relative density of compaction of sand; N = number of geogrid layers
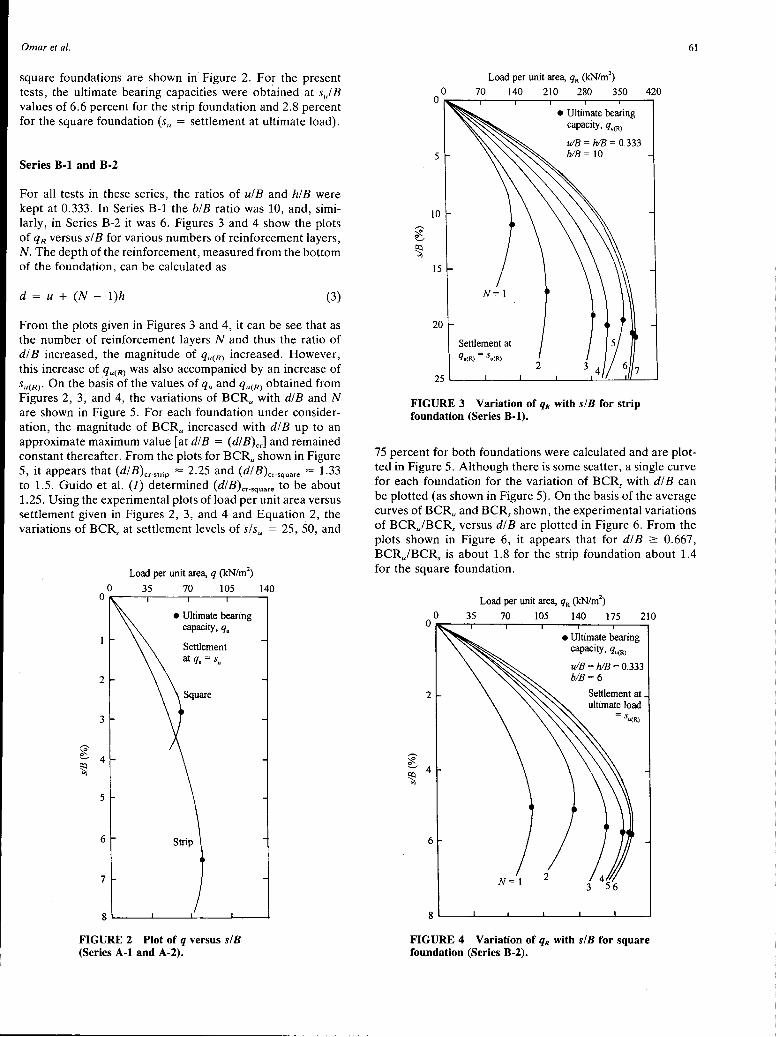
Omar et al.
square foundations are shown in Figure 2. For the present tests, the ultimate bearing capacities were obtained at s) B values of 6.6 percent for the strip foundation and 2.8 percent for the square foundation (su = settlement at ultimate load).
Series B-1 and B-2
For all tests in these series, the ratios of u! B and hi B were kept at 0.333. In Series B-1 the b!B ratio was 10, and, similarly, in Series B-2 it was 6. Figures 3 and 4 show the plots of qR versus sf B for various numbers of reinforcement layers, N. The depth of the reinforcement, measured from the bottom of the foundation, can be calculated as
d = u + (N - l)h (3)
From the plots given in Figures 3 and 4, it can be see that as the number of reinforcement layers N and thus the ratio of di B increased' the magnitude of q u(R) increased. However, this increase of q u(R) was. also accompanied by an increase of su(R)· On the basis of the values of qu and qu(R) obtained from Figures 2, 3, and 4, the variations of BCRu with d!B and N are shown in Figure 5. For each foundation under consideration, the magnitude of BCRu increased with di B up to an approximate maximum value [at d!B = (d!B)cr] and remained constant thereafter. From the plots for BCRu shown in Figure 5, it appears that (di B)cr-scrip = 2.25 and (di B)cr-square = 1.33 to 1.5. Guido et al. (1) determined (d/B)cr-square to be about 1.25. Using the experimental plots of load per unit area versus settlement given in Figures 2, 3, and 4 and Equation 2, the variations of BCRs at settlement levels of s/su = 25, 50, and
Load per unit area, q (kN/m2)
0 35 70 105 140 Oc---.-----r----r---~
2
3
5
6
7
• Ultimate bearing capacity, q"
Settlement at qu =Su
Strip
8 ...__ __ .__ _ __Jc__ _ __J.___.......,
FIGURE 2 Plot of q versus s/B (Series A-1 and A-2).
0 0
5
IO
15
20
Load per unit area, qR (kN/m2)
70 140 210 280 350 420
N= 1
Settlement at qu(R) = Su(R)
• Ultimate bearing capacity, qu(RJ
u!B = h!B = 0.333 b/B = 10
FIGURE 3 Variation of qR with s/B for strip foundation (Series B-1).
61
75 percent for both foundations were calculated and are plotted in Figure 5. Although there is some scatter, a single curve for each foundation for the variation of BCRs with di B can be plotted (as shown in Figure 5). On the basis of the average curves of BCRu and BCRs shown, the experimental variations of BCR)BCRs versus di B are plotted in Figure 6. From the plots shown in Figure 6, it appears that for di B ~ 0.667, BCR)BCRs is about 1.8 for the strip foundation about 1.4 for the square foundation.
Load per unit area, qR (kN/m2)
0 35 70 105 140 175 210 o~--r---.-----..-----.---~-~
2
6
N= I
• Ultimate bearing capacity, qu<R>
u!B = h!B = 0.333 b/B= 6
Settlement at ultimate load
= Su(R)
3
8 '----J..--.J_---1----'----'----'
FIGURE 4 Variation of qR with s/B for square foundation (Series B-2).
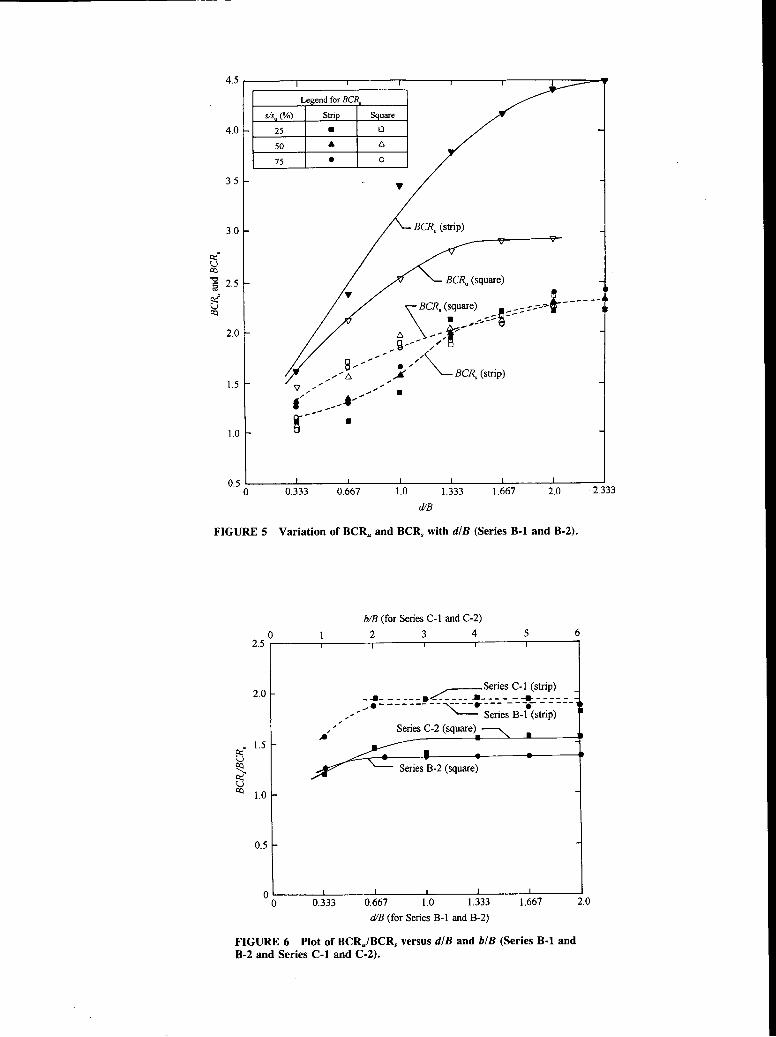
Legend for BCR
sis .. (%) Strip Square
25 • 0
50 • t:,.
75 • 0
3.5
3.0
2.0
1.5
1.0
0.5 .__ __ __._ ___ __._ ___ _._ ___ ..J.._ ___ ..__ __ ____. ___ ~
2.333 0 0.333 0.667 1.0 1.333 1.667 2.0
d/B
FIGURES Variation of BCR" and BCR. with d/B (Series B-1 and B-2).
b!B (for Series C-1 and C-2)
0 2 3 4 5 6 2.5 ~--~---~----r-----.----,-----,
2.0
0.5
Series C-1 (strip) ----------~---- --------,.,..---------~--- ---.------
/.... Series B-1 (strip)
Series C-2 (square)
OL------L---~----'-----L-----'---~ 0 0.333 0.667 1.0 1.333 1.667 2.0
d/B (for Series B-1 and B-2)
FIGURE 6 Plot of BCR)BCR. versus d/B and b/B (Series B-1 and B-2 and Series C-1 and C-2).
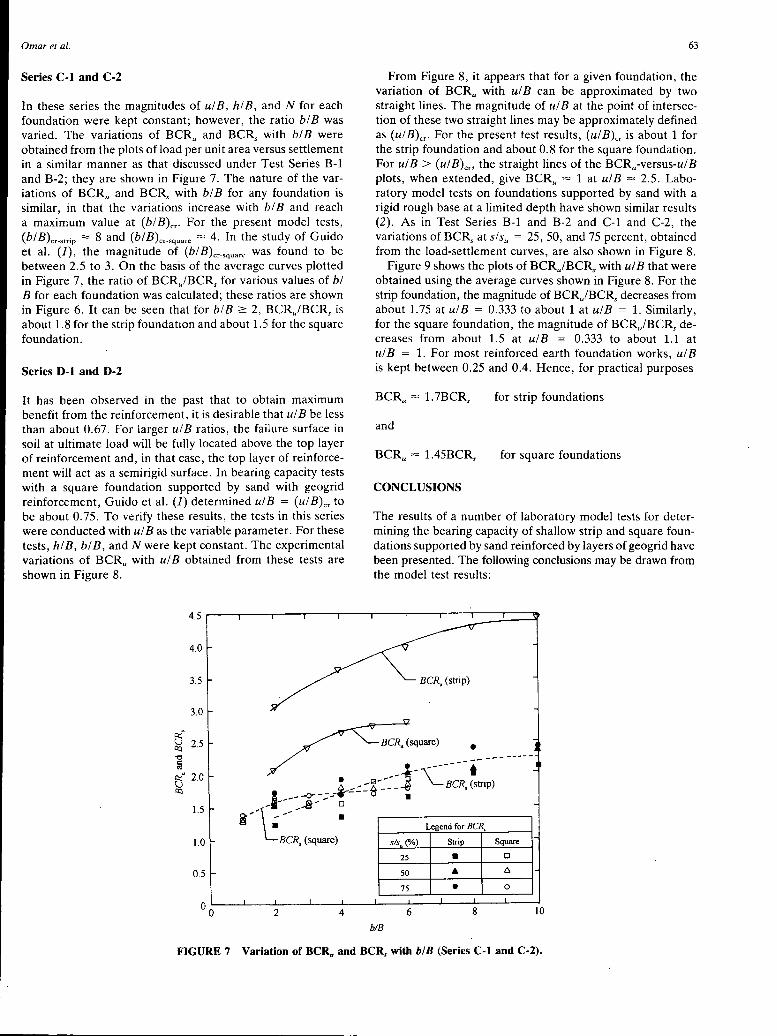
Omar et al.
Series C-1 and C-2
In these series the magnitudes of ul B, hi B, and N for each foundation were kept constant; however, the ratio bl B was varied. The variations of BCRu and BCRs with bl B were obtained from the plots of load per unit area versus settlement in a similar manner as that discussed under Test Series B-1 and B-2; they are shown in Figure 7. The nature of the variations of BCRu and BCRs with bl B for any foundation is similar, in that the variations increase with bl B and reach a maximum value at (bl B)cr· For the present model tests, (bl B)cr-strip = 8 and (bl B)cr-square = 4. In the study of Guido et al. (J), the magnitude of (blB)cr-square was found to be between 2.5 to 3. On the basis of the average curves plotted in Figure 7, the ratio of BCR)BCRs for various values of bl B for each foundation was calculated; these ratios are shown in Figure 6. It can be seen that for bl B 2: 2, BCR)BCRs is about 1.8 for the strip foundation and about 1.5 for the square foundation.
Series D-1 and D-2
It has been observed in the past that to obtain maximum benefit from the reinforcement, it is desirable that ul B be less than about 0.67. For larger ul B ratios, the failure surface in soil at ultimate load will be fully located above the top layer of reinforcement and, in that case, the top layer of reinforcement will act as a semirigid surface. In bearing capacity tests with a square foundation supported by sand with geogrid reinforcement, Guido et al. (J) determined ul B = (ul B)cr to be about 0.75. To verify these results, the tests in this series were conducted with ul B as the variable parameter. For these tests, hi B, bl B, and N were kept constant. The experimental variations of BCRu with ul B obtained from these tests are shown in Figure 8.
ef ~ 2.5 "'O
a
63
From Figure 8, it appears that for a given foundation, the variation of BCRu with ul B can be approximated by two straight lines. The magnitude of ul B at the point of intersection of these two straight lines may be approximately defined as (ul B)cr· For the present test results, (ul B)cr is about 1 for the strip foundation and about 0.8 for the square foundation. For ul B > (ul B)cn the straight lines of the BCRu-versus-ul B plots, when extended, give BCRu = 1 at ul B = 2.5. Laboratory model tests on foundations supported by sand with a rigid rough base at a limited depth have shown similar results (2). As in Test Series B-1 and B-2 and C-1 and C-2, the variations of BCRs at slsu = 25, 50, and 75 percent, obtained from the load-settlement curves, are also shown in Figure 8.
Figure 9 shows the plots of BCR)BCRs with ul B that were obtained using the average curves shown in Figure 8. For the strip foundation, the magnitude of BCR)BCRs decreases from about 1. 75 at ul B = 0.333 to about 1 at ul B = 1. Similarly, for the square foundation, the magnitude of BCR)BCRs decreases from about 1.5 at ul B = 0.333 to about 1.1 at ul B = 1. For most reinforced earth foundation works, ul B is kept between 0.25 and 0.4. Hence, for practical purposes
for strip foundations
and
for square foundations
CONCLUSIONS
The results of a number of laboratory model tests for determining the bearing capacity of shallow strip and square foundations supported by sand reinforced by layers of geogrid have been presented. The following conclusions may be drawn from the model test results:
• -- --.:.-\_------ -. -- ~.::-.::~r--:~~ BCR, (strip)
.. 1----1>· -0 •
~ 2.0
a--~--- • • BCR, (square)
1.5
1.0
Legend for BCR,
sis (%) Strip Square
25 • 0
0.5 50
75 • 0
2 4 6 8 IO
b/B
FIGURE 7 Variation of BCRu and BCR. with blB (Series C-1 and C-2).
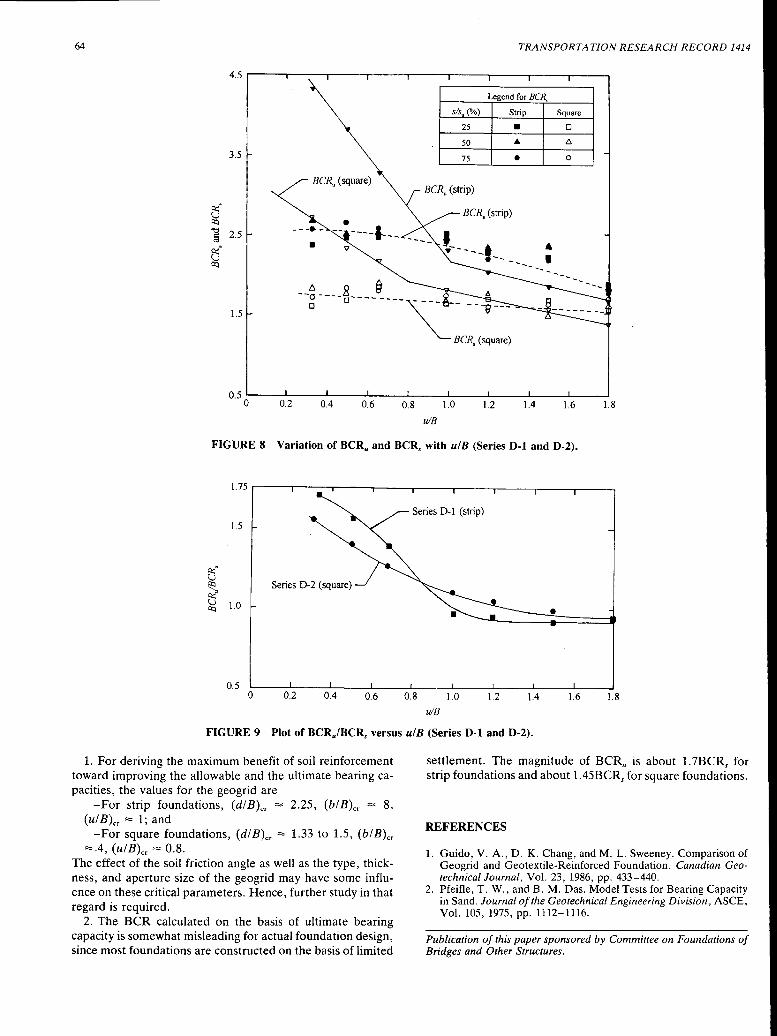
64
sis.(%)
25
50
3.5 75
BCR., (strip)
1.5
TRANSPORTATION RESEARCH RECORD 1414
Legend for BCR,
Strip
• .A
•
• I
Square
0
6
0
0.5'----L---L----'-----'----.L---.L---.L---.L..----1 0 0.2 0.4 0.6 0.8 1.0 1.2 1.4 1.6 1.8
u!B
FIGURE 8 Variation of BCR" and BCR. with ulB (Series D-1 and D-2).
1.75 r-----.---.---.,...----,.---y----y----.-----.---~
1.5
Series D-2 (square)
1.0
0.5 0 0.2 0.4 0.6 0.8 1.0 1.2 1.4 1.6 1.8
u!B
FIGURE 9 Plot of BCR)BCR. versus ulB (Series D-1 and D-2).
1. For deriving the maximum benefit of soil reinforcement toward improving the allowable and the ultimate bearing capacities, the values for the geogrid are
-For strip foundations, (di B)cr = 2.25, (bl B)cr = 8, (ulB)cr = 1; and
-For square foundations, (di B)cr = 1.33 to 1.5, (bl B)cr =.4, (ulB)cr = 0.8.
The effect of the soil friction angle as well as the type, thickness, and aperture size of the geogrid may have some influence on these critical parameters. Hence, further study in that regard is required.
2. The BCR calculated on the basis of ultimate bearing capacity is somewhat misleading for actual foundation design, since most foundations are constructed on the basis of limited
settlement. The magnitude of BCRu is about 1. 7BCRs for strip foundations and about 1.45BCRs for square foundations.
REFERENCES
1. Guido, V. A., D. K. Chang, and M. L. Sweeney. Comparison of Geogrid and Geotextile-Reinforced Foundation. Canadian Geotechnical Journal, Vol. 23, 1986, pp. 433-440.
2. Pfeifle, T. W., and B. M. Das. Model Tests for Bearing Capacity in Sand. Journal of the Geotechnical Engineering Division, ASCE, Vol. 105, 1975, pp. 1112-1116.
Publication of this paper sponsored by Committee on Foundations of Bridges and Other Structures.
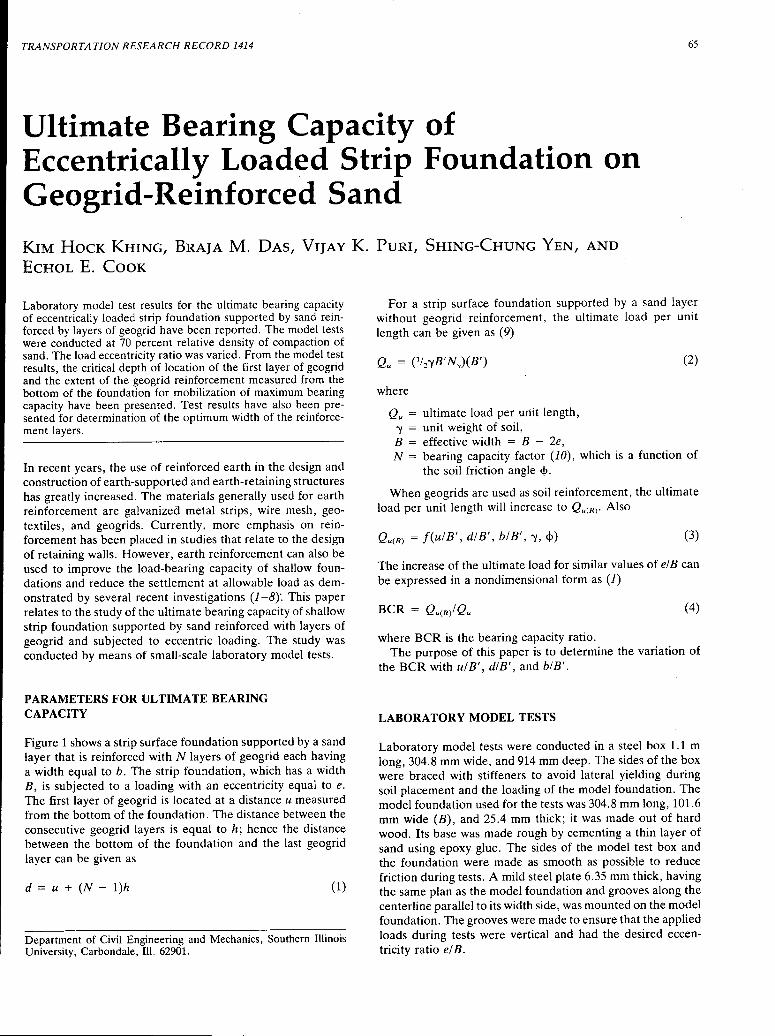
TRANSPORTATION RESEARCH RECORD 1414 65
Ultimate Bearing Capacity of Eccentrically Loaded Strip Foundation on Geogrid-Reinforced Sand
KIM HOCK KHING, BRAJA M. DAS, VIJAY K. PURI, SHING-CHUNG YEN, AND
EcttoL E. CooK
Laboratory model test results for the ultimate bearing capacity of eccentrically loaded strip foundation supported by sand reinforced by layers of geogrid have been reported. The model tests were conducted at 70 percent relative density of compaction of sand. The load eccentricity ratio was varied. From the model test results, the critical depth of location of the first layer of geogrid and the extent of the geogrid reinforcement measured from the bottom of the foundation for mobilization of maximum bearing capacity have been presented. Test results have also been presented for determination of the optimum width of the reinforcement layers.
In recent years, the use of reinforced earth in the design and construction of earth-supported and earth-retaining structures has greatly increased. The materials generally used for earth reinforcement are galvanized metal strips, wire mesh, geotextiles, and geogrids. Currently, more emphasis on reinforcement has been placed in studies that relate to the design of retaining walls. However, earth reinforcement can also be used to improve the load-bearing capacity of shallow foundations and reduce the settlement at allowable load as dem- . onstrated by several recent investigations (1-8)". This paper relates to the study of the ultimate bearing capacity of shallow strip foundation supported by sand reinforced with layers of geogrid and subjected to eccentric loading. The study was conducted by means of small-scale laboratory model tests.
PARAMETERS FOR ULTIMATE BEARING CAPACITY
Figure 1 shows a strip surface foundation supported by a sand layer that is reinforced with N layers of geogrid each having a width equal to b. The strip foundation, which has a width B, is subjected to a loading with an eccentricity equal to e. The first layer of geogrid is located at a distance u measured from the bottom of the foundation. The distance between the consecutive geogrid layers is equal to h; hence the distance between the bottom of the foundation and the last geogrid layer can be given as
d = u + (N - l)h (1)
Department of Civil Engineering and Mechanics, Southern Illinois University', Carbondale, Ill. 62901.
For a strip surface foundation supported by a sand layer without geogrid reinforcement, the ultimate load per unit length can be given as (9)
(2)
where
Qu ultimate load per unit length, -y unit weight of soil, B effective width = B - 2e, N = bearing capacity factor (10), which is a function of
the soil friction angle <1>.
When geogrids are used as soil reinforcement, the ultimate load per unit length will increase to Qu(R)· Also
Qu(R) = f(ulB', dlB', blB', -y, <!>) (3)
The increase of the ultimate load for similar values of el B can be expressed in a nondimensional form as (J)
(4)
where BCR is the bearing capacity ratio. The purpose of this paper is to determine the variation of
the BCR with ul B', dlB', and blB'.
LABORATORY MODEL TESTS
Laboratory model tests were conducted in a steel box 1.1 m long, 304.8 mm wide, and 914 mm deep. The sides of the box were braced with stiffeners to avoid lateral yielding during soil placement and the loading of the model foundation. The model foundation used for the tests was 304.8 mm long, 101.6 mm wide (B), and 25.4 mm thick; it was made out of hard wood. Its base was made rough by cementing a thin layer of sand using epoxy glue. The sides of the model test box and the foundation were made as smooth as possible to reduce friction during tests. A mild steel plate 6.35 mm thick, having the same plan as the model foundation and grooves along the centerline parallel to its width side, was mounted on the model foundation. The grooves were made to ensure that the applied loads during tests were vertical and had the desired eccentricity ratio el B.
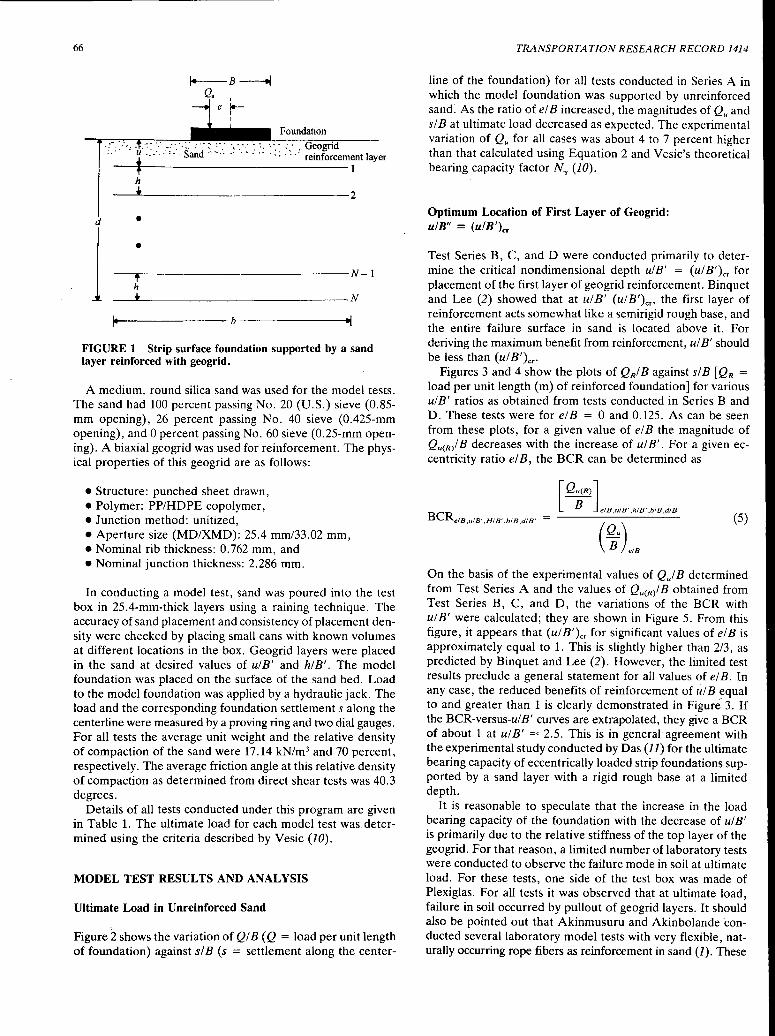
66
d
l
!+--B---.j QU I
e i.---1 I
Foundation · ._:-, · .~: ·.' __ :·:.:.- ·: ··:: :·: ·, ·.·: · :. ,. · : · Geogrid · · * ·· · · · · ' · ·· Sand ·· ·· · · · · · · : · · · : : · : ·: reinforcem~nt layer
h
• •
----ii:-----------------N- I h
---"----------------N
----------b --------
FIGURE 1 Strip surface foundation supported by a sand layer reinforced with geogrid.
A medium, round silica sand was used for the model tests. The sand had 100 percent passing No. 20 (U.S.) sieve (0.85-mm opening), 26 percent passing No. 40 sieve (0.425-mm opening), and 0 percent passing No. 60 sieve (0.25-mm opening). A biaxial geogrid was used for reinforcement. The physical properties of this geogrid are as follows:
• Structure: punched sheet drawn, •Polymer: PP/HDPE copolymer, • Junction method: unitized, •Aperture size (MD/XMD): 25.4 mm/33.02 mm, • Nominal rib thickness: 0. 762 mm, and •Nominal junction thickness: 2.286 mm.
In conducting a model test, sand was poured into the test box in 25.4-mm-thick layers using a raining technique. The accuracy of sand placement and consistency of placement density were checked by placing small cans with known volumes at different locations in the box. Geogrid layers were placed in the sand at desired values of u/ B' and hi B'. The model foundation was placed on the surface of the sand bed. Load to the model foundation was applied by a hydraulic jack. The load and the corresponding foundation settlement s along the centerline were measured by a proving ring and two dial gauges. For all tests the average unit weight and the relative density of compaction of the sand were 17.14 kN/m3 and 70 percent, respectively. The average friction angle at this relative density of compaction as determined from direct shear tests was 40.3 degrees.
Details of all tests conducted under this program are given in Table 1. The ultimate load for each model test was. determined using the criteria described by Vesic (10).
MODEL TEST RESULTS AND ANALYSIS
ffitimate Load in Unreinforced Sand
Figure 2 shows the variation of QI B (Q = load per unit length of foundation) against sf B (s = settlement along the center-
TRANSPORTATION RESEARCH RECORD 1414
line of the foundation) for all tests conducted in Series A in which the model foundation was supported by unreinforced sand: As the ratio of el B increased, the magnitudes of Qu and sf B at ultimate load decreased as expected. The experimental variation of Qu for all cases was about 4 to 7 percent higher than that calculated using Equation 2 and Vesic's theoretical bearing capacity factor N-v (10).
Optimum Location of First Layer of Geogrid: u/B" = (u/B')cr
Test Series B, C, and D were conducted primarily to determine the critical nondimensional depth u/B' = (u/ B')cr for placement of the first layer of geogrid reinforcement. Binquet and Lee (2) showed that at u/ B' (u/ B')cn the first layer of reinforcement acts somewhat like a semirigid rough base, and the entire failure surface in sand is located above it. For deriving the maximum benefit from reinforcement, u/ B' should be less than (u/ B')cr·
Figures 3 and 4 show the plots of QR/ B against sf B [QR = load per unit length (m) of reinforced foundation] for various u/B' ratios as obtained from tests conducted in Series B and D. These tests were for el B = 0 and 0.125. As can be seen from these plots, for a given value of el B the magnitude of Qu(R/ B decreases with the increase of u/ B'. For a given eccentricity ratio el B, the BCR can be determined as
BCRe!B,u!B' ,HIB',b!B,d!B'
[Qu(R)]
B e!B,u!B',h!B',b!B,d!B'
(5)
On the basis of the experimental values of Q) B determined from Test Series A and the values of Qu(R/ B obtained from Test Series B, C, and D, the variations of the BCR with u/ B' were calculated; they are shown in Figure 5. From this figure, it appears that (u/ B')cr for significant values of el B is approximately equal to 1. This is slightly higher than 2/3, as predicted by Binquet and Lee (2). However, the limited test results preclude a general statement for all values of el B. In any case, the reduced benefits of reinforcement of u/ B equal to and greater than 1 is clearly demonstrated in Figure 3. If the BCR-versus-u/B' curves are extrapolated, they give a BCR of about 1 at u/ B' = 2.5. This is in general agreement with the experimental study conducted by Das (11) for the ultimate bearing capacity of eccentrically loaded strip foundations supported by a sand layer with a rigid rough base at a limited depth.
It is reasonable to speculate that the increase in the load bearing capacity of the foundation with the decrease of u/ B' is primarily due to the relative stiffness of the top layer of the geogrid. For that reason, a limited number of laboratory tests were conducted to observe the failure mode in soil at ultimate load. For these tests, one side of the test box was made of Plexiglas. For all tests it was observed that at ultimate load failure in soil occurred by pullout of geogrid layers. It should also be pointed out that Akinmusuru and Akinbolande 'conducted several laboratory model tests with very flexible, naturally occurring rope fibers as reinforcement in sand (J). These
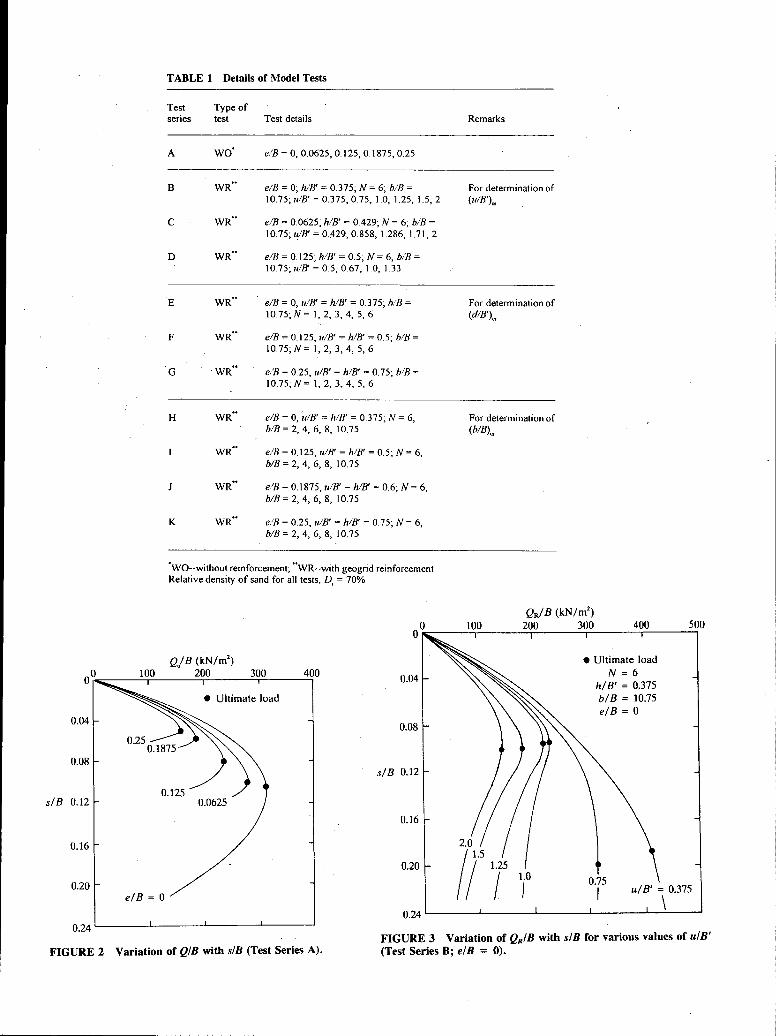
TABLE 1 Details of Model Tests
Test · Type of series
A
B
c
D
E
·F
G
H
J
K
test
wo·
.. WR
WR ..
WR ..
WR ..
WR ..
.. WR
Test details
e/B = 0, 0.0625, 0.125, 0.1875, 0.25
e/B = O; h/B' = 0.375; N = 6; b/B = 10.75; 11/B' = 0.375, 0.75, 1.0, 1.25, 1.5, 2
e/B = 0.0625~ h/B' = 0.429; N = 6; b/B = 10.75; 11/B' = 0.429, 0.858, 1.286, 1.71, 2
e/B = 0. 125; h/B' = 0.5; N = 6, b!B = 10.75; 11/B' = 0.5, 0.67, 1.0, 1 .33
e/B = Q, 11/B' = h/B' = 0.375; h/B = 10.75;N= 1, 2, 3, 4, 5, 6
e!B = 0.125, 11/B' = h/B' = 0.5; b/B = 10.15;N= 1, 2, 3, 4, 5, 6
e/B = 0.25, 11/B' = h!B' = 0.75; blB = 10.75; N = 1, 2, 3, 4, 5, 6
e/B = 0, '11/B' = h!B' = 0.375; N = 6, b/B = 2, 4, 6, 8, 10.75
WR.. e/B = 0. 125, 11/B' = h/B' = 0.5; N = 6, b!B = 2, 4, 6, 8, 10.75
e/B = 0. 1875, 11/B' = h/B' = 0.6; N = 6, b/B = 2, 4, 6, 8, 10.75
e/B = 0.25, 11/B' = h'B' = 0.75; N = 6, b/B = 2, 4, 6, 8, 10.75
·wo--without reinforcement; .. WR--with geogrid reinforcement Relative density of sand for all tests, D, = 70%
Q/B (kN/m2)
00.~~~-10~0~~~2,00~~~3,o_o~~-4,oo 0.04
• Ultimate load
0.04 0.08
0.08 s/B 0.12
s/B 0.12
0.16
0.16
0.20
0.20 e/B = 0
Remarks
For determination of (11/B')cr
For determination of (d/B')cr
For determination of (b/B)cr
QR/ B (kN/m2) 100 200 300 400
• Ultimate load N=6
h/B' = 0.375 b/B = 10.75 e/B = 0
500
0.75
I u/B' = 0.375
\ 0.24 L-----~----L----.J..------'-----
0.24 i__ ___ .J__ ___ ....__ ___ ......_ ___ ~
FIGURE 2 Variation of Q/B with s/B (Test Series A). FIGURE 3 Variation of QR/B with s/B for various values of u/B' (Test Series B; e/B = 0).
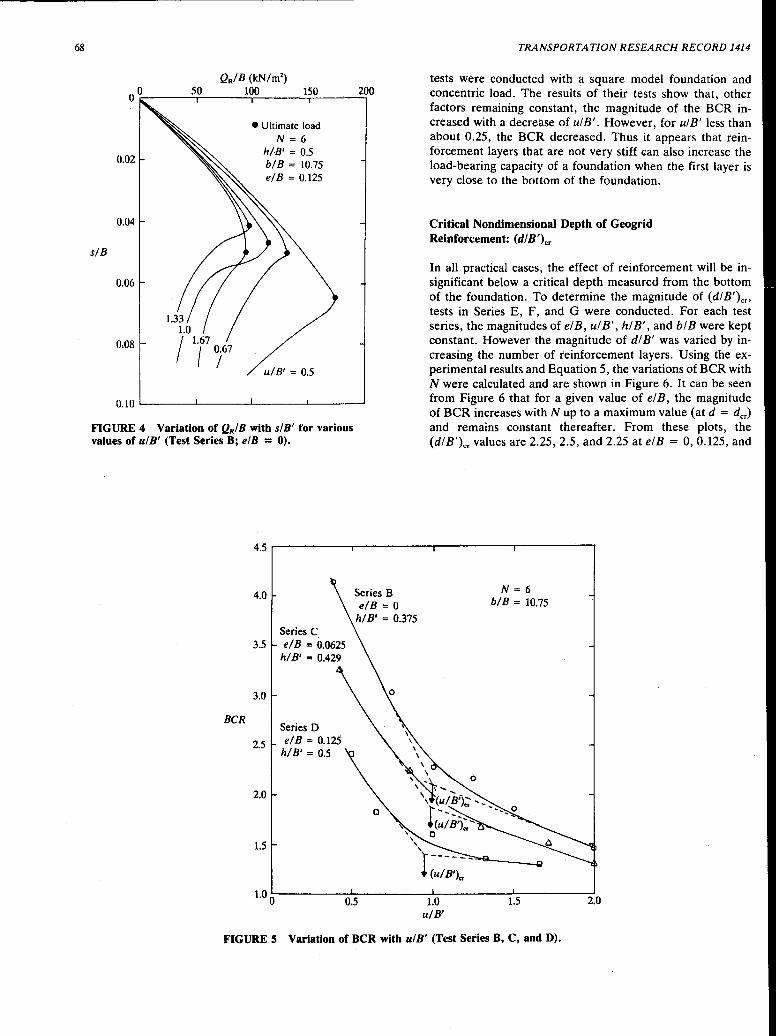
68
s/B
QR/ B (kN/m2)
0 0....-~~--.so __ ~ ___ 10~0~-----~15~0 ______ 200
0.02
0.04
0.06
0.08
1.33 1.0
/
1.67
I 167
•Ultimate load N=6
h/13' = 0.5 b/B = 10.75 e/B = 0.125
u/B' = 0.5
0.10 ,___ ___ ...___ ___ ..__ ___ ..__ __ _
FIGURE 4 Variation of QRIB with slB' for various values of ulB' (Test Series B; elB = 0).
TRANSPORTATION RESEARCH RECORD 1414
tests were conducted with a square model foundation and concentric load. The results of their tests show that, other factors remaining constant, the magnitude of the BCR increased with a decrease of ul B'. However, for ul B' less than about 0.25, the BCR decreased. Thus it appears that reinforcement layers that are not very stiff can also increase the load-bearing capacity of a foundation when the first layer is very close to the bottom of the foundation.
Critical Nondimensional Depth of Geogrid Reinforcement: (d/B')cr
In all practical cases, the effect of reinforcement will be insignificant below a critical depth measured from the bottom of the foundation. To determine the magnitude of (di B')cn tests in Series E, F, and G were conducted. For each test series, the magnitudes of el B, ul B', hi B', and bl B were kept constant. However the magnitude of di B' was varied by increasing the number of reinforcement layers. Using the experimental results and Equation 5, the variations of BCR with N were calculated and are shown in Figure 6. It can be seen from Figure 6 that for a given value of el B, the magnitude of BCR increases with N up to a maximum value (at d = dcr) and remains constant thereafter. From these plots, the (di B')cr values are 2.25, 2.5, and 2.25 at el B = 0, 0.125, and
4.5--------------------------..-------------.
4.0
3.5
3.0
BCR
2.5
2.0
1.5
1.0 0
Series D el B = 0.125
h/B' = 0.5
0.5
'iii
' ' ' ' r~~~~:-
1.0 u/B'
N = 6 b/B = 10.75
1.5
FIGURES Variation of BCR with ulB' (Test Series B, C, and D).
2.0
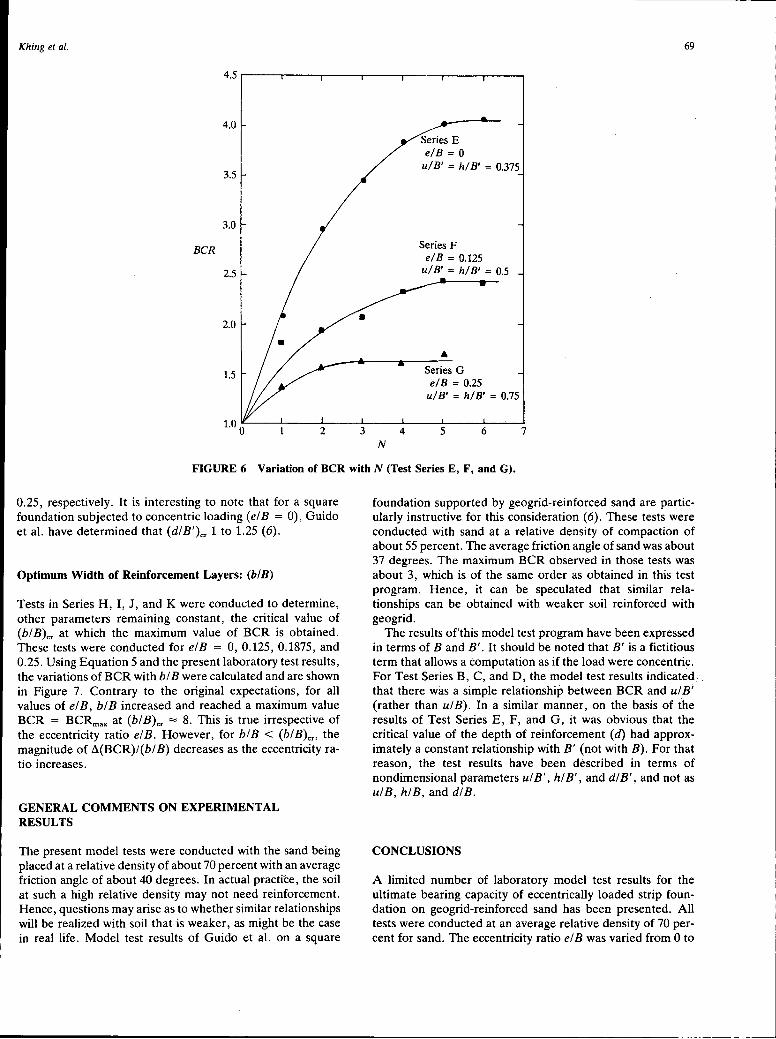
Khing et al.
4.0
3.5
3.0
BCR
2.5
2.0
1.5
1.0 0 2 3 4 N
Series E e/B = 0 u/ B' = Ji/ B' = 0.375
• Series G e/B = 0.25
u/B' = h/B' = 0.75
5 6
69
7
FIGURE 6 Variation of BCR with N (Test Series E, F, and G).
0.25, respectively. It is interesting to note that for a square foundation subjected to concentric loading (elB = 0), Guido et al. have determined that (di B')cr 1 to 1.25 ( 6).
Optimum Width of Reinforcement Layers: (bl B)
Tests in Series H, I, J, and K were conducted to determine, other parameters remaining constant, the critical value of (bl B)cr at which the maximum value of BCR is obtained. These tests were conducted for elB = 0, 0.125, 0.1875, and 0.25. Using Equation 5 and the present laboratory test results, the variations of BCR with bl B were calculated and are shown in Figure 7. Contrary to the original expectations, for all values of elB, blB increased and reached a maximum value BCR = BCRmax at (blB)cr = 8. This is true irrespective of the eccentricity ratio elB. However, for blB < (blB)c,, the magnitude of ll(BCR)l(bl B) decreases as the eccentricity ratio increases.
GENERAL COMMENTS ON EXPERIMENTAL RESULTS
The present model tests were conducted with the sand being placed at a relative density of about 70 percent with an average friction angle of about 40 degrees. In actual practice, the soil at such a high relative density may not need reinforcement. Hence, questions may arise as to whether similar relationships will be realized with soil that is weaker, as might be the case in real life. Model test results of Guido et al. on a square
foundation supported by geogrid-reinforced sand are particularly instructive for this consideration (6). These tests were conducted with sand at a relative density of compaction of about 55 percent. The average friction angle of sand was about 37 degrees. The maximum BCR observed in those tests was about 3, which is of the same order as obtained in this test program. Hence, it can be speculated that similar relationships can be obtained with weaker soil reinforced with geogrid.
The results of'this model test program have been expressed in terms of Band B'. It should be noted that B' is a fictitious term that allows a computation as if the load were concentric. For Test Series B, C, and D, the model test results indicated_. that there was a simple relationship between BCR and ul B; (rather than ulB). In a similar manner, on the basis ofthe results of Test Series E, F, and G, it was obvious that the critical value of the depth of reinforcement (d) had approximately a constant relationship with B' (not with B). For that reason, the test results have been described in terms of nondimensional parameters ul B', hi B', and di B', and not as ulB, hlB, and dlB.
CONCLUSIONS
A limited number of laboratory model test results for the ultimate bearing capacity of eccentrically loaded strip foundation on geogrid-reinforced sand has been presented. All tests were conducted at an average relative density of 70 percent for sand. The eccentricity ratio el B was varied from 0 to
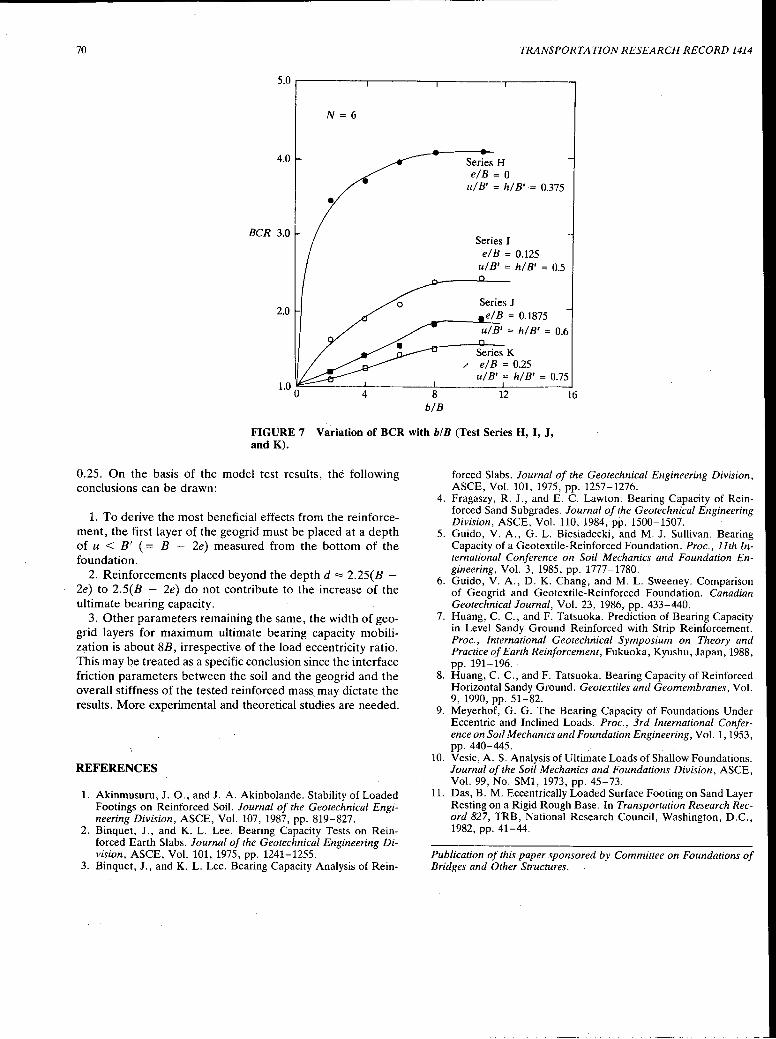
70 TRANSPORTATION RESEARCH RECORD 1414
5.0 ...------.----"--T-------r-------.
N = 6
4.0
BCR 3.0
2.0
4
Series H elB = 0
ul B' = hi B' = 0.375
Series I el B = 0.125
ulB' = hlB' = 0.5
Series J el B = 0.1875 ------
8 b/B
ulB1 = hlB' = 0.6
Series K ,, e/B=0.25
u/B' = hlB' = 0.75
12 16
FIGURE 7 Variation of BCR with b/B (Test Series H, I, J, and K).
0.25. On the basis of the model test results, the following conclusions can be drawn:
1. To derive the most beneficial effects from the reinforcement, the first layer of the geogrid must be placed at a depth of it < B' (= B - 2e) measured from the bottom of the foundation.
2. Reinforcements placed beyond the depth d = 2.25(B -2e) to 2.5(B - 2e) do not contribute to the increase of the ultimate bearing capacity.
3. Other parameters remaining the same, the width of geogrid layers for maximum ultimate bearing capacity mobiliz;;ttion is about 8B, irrespective of the load eccentricity ratio. This may be treated as a specific conclusion since the interface friction parameters between the soil and the geogrid and the overall stiffness of the tested reinforced mass. may dictate the results. More experimental and theoretical studies are needed.
REFERENCES
1. Akinmusuru, J. 0., and J. A. Akinbolande. Stability of Loaded Footings on Reinforced Soil. Journal of the Geotechnical Engineering Division, ASCE, Vol. 107, 1987, pp. 819-827.
2. Binquet, J., and K. L. Lee. Bearing Capacity Tests on Reinforced Earth Slabs. Journal of the Geotechnical Engineering Division, ASCE, Vol. 101, 1975, pp. 1241-1255.
3. Binquet, J., and K. L. Lee. Bearing Capacity Analysis of Rein-
forced Slabs. Journal of the Geotechnical Engineering Division, ASCE, Vol. 101, 1975, pp. 1257-1276.
4. Fragaszy, R. J., and E. C. Lawton. Bearing Capacity of Reinforced Sand Subgrades. Journal of the Geotechnical Engineering Division, ASCE, Vol. 110, 1984, pp. 1500-1507.
5. Guido, V. A., G. L. Biesiadecki, and M. J. Sullivan. Bearing Capacity of a Geotextile-Reinforced Foundation. Proc., 11th International Conference on Soil Mechanics and Foundation Engineering, Vol. 3, 1985, pp. 1777-1780.
6. Guido, V. A., D. K. Chang, and M. L. Sweeney. Comparison of Geogrid and Geotextile-Reinforced Foundation. Canadian Geotechnical Journal, Vol. 23, 1986, pp. 433-440.
7. Huang, C. C., and F. Tatsuoka. Prediction of Bearing Capacity in Level Sandy Ground Reinforced with Strip Reinforcement. Proc., International Geotechnical Symposium on Theory and Practice of Earth Reinforcement, Fukuoka, Kyushu, Japan, 1988, pp. 191-196.
8. Huang, C. C., and F. Tatsuoka. Bearing Capacity of Reinforced Horizontal Sandy Ground. Geotextiles and Geomembranes, Vol. 9, 1990, pp. 51-82.
9. Meyerhof, G. G. The Bearing Capacity of Foundations Under Eccentric and Inclined Loads. Proc., 3rd International Conference on Soil Mechanics and Foundation Engineering, Vol. 1, 1953, pp. 440-445.
10. Vesic, A. S. Analysis of Ultimate Loads of Shallow Foundations. Journal of the Soil Mechanics and Foundations Division, ASCE, Vol. 99, No. SMl, 1973, pp. 45-73.
11. Das, B. M. Eccentrically Loaded Surface Footing on Sand Layer Resting on a Rigid Rough Base. In Transportation Research Record 827, TRB, National Research Council, Washington, D.C., 1982, pp. 41-44.
Publication of this paper sponsored by Committee on Foundations of Bridges and Other Structures.