Embed Size (px)
Citation preview
Soil detritivore functioning in heterogeneously contaminated soils
Diane A. Heemsbergen
Soil detritivore functioning in heterogeneously contaminated soils
Diane A. Heemsbergen
ALTERRA SCIEN
TIFIC C
ON
TRIBUTION
S 33
ALTE
RRA
SCIE
NTI
FIC
CO
NTR
IBUT
ION
S 3
3
Omslag Scientific 33 Diane Heemsbergen.indd 1 16-10-2009 11:15:49


1
Soil detritivore functioning in heterogeneously contaminated soils
MISSION: Alterra is the main centre of expertise on rural areas and water management in the Netherlands. It was founded 1 January 2000. Alterra combines a huge range of expertise on rural areas and their sustainable use, including aspects such as water, wildlife, forests, the environment, soils, landscape, climate and recreation, as well as various other aspects relevant to the development and management of the environment we live in. Alterra engages in strategic and applied research to support design processes, policymaking and management at the local, national and international level. This includes not only innovative, interdisciplinary research on complex problems relating to rural areas, but also the production of readily applicable knowledge and expertise enabling rapid and adequate solutions to practical problems. The many themes of Alterra's research effort include relations between cities and their surrounding countryside, multiple use of rural areas, economy and ecology, integrated water management, sustainable agricultural systems, planning for the future, expert systems and modelling, biodiversity, landscape planning and landscape perception, integrated forest management, geo-information and remote sensing, spatial planning of leisure activities, habitat creation in marine and estuarine waters, green belt development and ecological webs, and pollution risk assessment. Alterra is part of Wageningen University Research Centre (Wageningen UR) and includes two research sites, one in Wageningen and one on the island of Texel.
Contents
3
Soil detritivore functioning in heterogeneously contaminated soils
Diane Alida Heemsbergen
ALTERRA SCIENTIFIC CONTRIBUTIONS 33
ALTERRA WAGENINGEN UR 2009
Is tevens verschenen als Thesis 2009-03 of the Department of Ecological Science, VU University Amsterdam, The Netherlands Cover illustration: Antoine van Brussel, Deventer The research presented in this was conducted at Alterra in Wageningen and VU University Amsterdam, The Netherlands, ISBN: 978-90-327-0382-0
Contents
5
“In wilderness I sense the miracle of life, and behind it our scientific accomplishments fade to trivia.” ~Charles A. Lindbergh

Contents
7
Contents
Samenvatting 1
Summary 5
Framework 7
1 General Introduction 9
2 Soil fauna distribution in heterogeneous soils 25
3 The effect of vertically heterogeneous contamination on the detritivore annelid community in a river floodplain soil 41
4 Soil detritivores mitigate negative effects of contaminants on microorganisms 61
5 Biodiversity effects on soil processes explained by interspecific functional dissimilarity 85
6 Functional identity of soil detritivores explains both community diversity effects and species interactions 97
7 General discussion 117
References 135
Dankwoord 153
Curriculum vitae 155

Samenvatting
1
Samenvatting
De bodem is een van de meest heterogene ecosystemen op aarde, met een hoge biodiversiteit. Deze diversiteit aan bodemfauna en de relatie met het functioneren van het bodemecosysteem krijgt vandaag de dag veel aandacht vanwege het verlies van biodiversiteit door menselijke invloeden. Een van deze menselijke invloeden is de emissie van contaminanten in het milieu, die een directe negatieve invloed kunnen hebben op het functioneren en het gedrag van dieren waardoor zij het functioneren van ecosystemen beïnvloeden. Het effect van contaminanten op bodemfauna is onder andere afhankelijk van de biobeschikbaarheid van de contaminant in de bodem. De heterogeniteit van de bodem en de bodemcomponenten kunnen deze biobeschikbaarheid beïnvloeden. Daarnaast zijn de contaminanten vaak heterogeen verspreid in de bodem waardoor verschillende bodemorganismen worden blootgesteld afhankelijk van de distributie van de vervuiling en de bodemkarakteristieken. Soorten kunnen door de heterogeniteit van de vervuiling de zwaarder vervuilde locaties ontwijken, maar hierdoor kunnen belangrijke ecologische interacties tussen soorten worden verstoord. Daarom worden in dit proefschrift de hypotheses getest dat blootstelling van bodemfauna aan contaminanten leidt tot (i) een verandering in verticale stratificatie van bodemfauna, (ii) verandering in soortensamenstelling in de soortengemeenschap in bodems (iii) verstoring van de interacties tussen bodemfauna en microbiële gemeenschap en dat daarbij snelheden van bodemprocessen kunnen veranderen. De hypotheses werden getest in de uiterwaarden waar de aanwezigheid van grote hoeveelheden contaminanten een potentieel risico vormt voor het functioneren van bodemecosystemen. De vervuiling in de bodem is heterogeen verspreid door historische verschillen in emissies van vervuiling in de rivierensedimentatie en erosiesnelheden en door grondverzet. Veldonderzoek in de Afferdense en Deestse Waarden werd gedaan om de horizontale heterogeniteit van de bodemeigenschappen en van de contaminatie te bepalen en het effect van deze heterogeniteit op de aanwezige bodemfauna te meten. De uiterwaard vertoonde verhoogde metaalconcentraties in de bodem die de Nederlandse interventiewaarden op verschillende locaties overschreden. Zinkconcentraties vertoonden een vrij homogeen patroon in horizontale richting in het noordelijk deel van het onderzoeksveld terwijl het zuidelijk deel een grotere mate van heterogeniteit vertoonde (Hoofdstuk 2). Directe effecten
Samenvatting
2
van de vervuiling op de distributie van de fauna werden niet gevonden. Vegetatie en bodemvocht verklaarden de meeste variatie in de ruimtelijke verspreiding van de bodemfauna. Een tweede veldonderzoek in de Afferdense en Deestse Waarden werd uitgevoerd waarbij het effect van verticale heterogene vervuiling op bodemfauna en bodemeigenschappen centraal stond (Hoofdstuk 3). Vier locaties met verschillende profielen in vervuiling werden gedurende 3 jaar bemonsterd op aanwezige detritivoren en hun locatie in het bodemprofiel. De regenworm Aporrectodea caliginosa had een hoge biomassa in schone locaties terwijl de regenworm Allolobophora chlorotica een hoge biomassa had in vochtiger, meer vervuilde locaties. Deze laatste waarneming was waarschijnlijk met name toe te schrijven aan het hogere vochtgehalte in de bodem aangezien Allolobophora chlorotica een vochtminnende soort is. De verdeling van de enchytraeën en de regenwormen over het bodemprofiel varieerde per seizoen maar veranderde niet door de aanwezigheid van een vervuilde laag. Het feit dat er geen direct effect van vervuiling op de biomassa van regenwormen is gevonden komt waarschijnlijk door de lage biobeschikbaarheid van de vervuiling. Laboratorium experimenten werden uitgevoerd om specifieke hypotheses te toetsen over verticale heterogeniteit en biodiversiteit onder gecontroleerde omstandigheden. Een laboratorium experiment onderzocht het effect van verticale heterogene vervuiling op verticale gedragspatronen en interacties tussen bodemfauna en micro-organismen (Hoofdstuk 4). Het verticale vervuilingspatroon zoals aangetroffen in de uiterwaarden werd met deze proef nagebootst door middel van bodemkolommen gemaakt van uiterwaardengrond. Veranderd graafgedrag door regenwormen in de vervuilde laag werd niet waargenomen en er waren dus geen indicaties voor ontwijkingsgedrag door regenwormen. Het organisch stofgehalte van de bodem en de hoeveelheid ingecorporeerd bladmateriaal vertoonde ook geen verandering als gevolg van vervuiling. De vervuiling had wel een direct effect op het functioneren van micro-organismen en resulteerde in een lagere bodemademhaling. Deze verlaging werd echter gecompenseerd door de stimulerende werking van regenwormen op de activiteit van microorganismen. Een tweede laboratorium experiment onderzocht het effect van de soortenrijkdom van detritivoren (regenwormen, miljoenpoten en pissebedden) op bodemprocessen (Hoofdstuk 5 en 6). Bodemprocessen als strooiselfragmentatie, bodemademhaling, totaal NO3 productie en afname in
Samenvatting
3
bladstrooiselmassa vertoonden een asymptotische relatie met soortenrijkdom en waren ook gerelateerd aan biomassa en metabolische activiteit van de detritivoren. Om interacties tussen soorten te beoordelen werd een netto “diversiteitseffect” berekend op basis van individuele effecten van de soorten. Het netto diversiteitseffect benadrukt het belang van de functionele identiteit van de soorten. Gelijkwaardige soorten vertoonden geen of negatieve interacties met elkaar. Sterk verschillende soorten, daarentegen vertoonden positieve interacties. Hierdoor was het netto diversiteitseffect van bodemademhaling en verlies in bladstrooiselmassa positief gerelateerd aan de mate van functionele verschillen tussen soorten. De worm Lumbricus rubellus werd als functioneel sleutelsoort geïdentificeerd binnen de soorten die waren gebruikt, waarbij zijn functioneren verder werd gestimuleerd door interacties met andere bodemsoorten.

Summary
5
Summary
The soil is a dynamic and heterogeneous environment with a great diversity of soil dwelling fauna. The diversity of soil species and the relationship to soil processes has become a major area of research as global species diversity is declining by human influences. One of these human influences is soil contamination which can have a direct negative effect on the functioning and behaviour of soil organisms and, by consequence, affect the functioning of soil ecosystems. The effect of a contaminant on organisms depends, among other things, on its bioavailability in the soil. The heterogeneous nature of the physico-chemical constituents of soils affects the bioavailability directly. Furthermore, the contamination can be heterogeneously situated in the soil profile and thereby affect different groups of soil dwelling species. Vertical heterogeneous contamination can affect different species as species are known to prefer specific soil depths for their habitat. The heterogeneous contamination creates the potential for species to avoid contaminated patches and might thereby disrupt important ecological interactions between species. Therefore in this thesis, the central hypotheses tested are ‘that exposure to contaminants affects (i) vertical stratification of detritivore annelids, (ii) species composition of the detritivore community and, (iii) facilitative interactions of soil detritivore species and microorganisms, thereby affecting soil process rates’. The study was situated in a river floodplain, the Afferdense and Deestse Waarden, of the Dutch river Waal (contributory of the river Rhine). Dutch river floodplains show high spatial heterogeneity in contamination and are therefore very suitable to test these hypotheses. The river floodplain soil showed high zinc concentrations which exceeded the Dutch risk assessment level 4, which stands for high ecological risk (Chapter 2 and 3). Zinc concentration showed a rather homogeneous pattern on a horizontal scale in the northern half of the field, while the southern part was more heterogeneous. Zinc concentrations did not show any correlations with soil fauna distribution. Vegetation and soil moisture content explained most of the variation found in the distribution of soil fauna. Vertical heterogeneity of contamination was also observed in the river floodplain. A field monitoring study assessed the effect of vertically heterogeneous soil contamination on soil fauna and soil functioning in which
Summary
6
four locations with four distinct contamination profiles in the field were monitored for three years (Chapter 3). The results showed that the earthworm species Aporrectodea caliginosa had higher biomass in clean locations, whereas Allolobophora chlorotica showed higher biomass in more humid and more contaminated soils. It is more likely that the higher biomass of Aporrectodea chlorotica at the higher contaminated soils were due to the high humidity of the soil as the species prefers humid conditions. Therefore, no effects of contamination on soil fauna were found which was probably due to the low availability of the contamination. In addition, laboratory tests were performed to address specific hypotheses of this thesis in a more controlled environment. One microcosm experiment studied the effect of vertically heterogeneous contamination on detritivore behaviour and their interactions with microbes (Chapter 4). The soil columns in the microcosms were constructed using floodplain soils and reflected the vertical heterogeneity of contamination found in the river floodplain. Burrowing intensity and soil organic matter content changes indicated that the behaviour of earthworms was not affected and therefore the earthworms did not seem to avoid the contaminated layer. Contamination did affect the microbial functioning itself as soil respiration was low in the contaminated soil. However, direct negative effects of soil contaminations on microbial functioning were indirectly compensated for by soil fauna stimulating the microorganisms. Therefore, these results show the importance of soil fauna in stimulating microbes in contaminated soils.
The second microcosm experiment studied the effect of detritivore species diversity on soil process rates (Chapter 5 and 6). Soil processes (litter fragmentation, soil respiration, gross NO3
- production and litter mass loss) showed an asymptotic relationship with species diversity, which indicates that there is functional redundancy within the group of detritivores. To assess if interactions between species were occurring, a net diversity effect was calculated based on individual effects of the species. Net diversity effects showed the importance of the functional identity of the species. Species which were similar showed neutral and negative interactions. However, net diversity effect of soil respiration and litter mass loss increased with functional dissimilarity of species. Litter mass loss had a key species, the earthworm Lumbricus rubellus, whose performance was facilitated by other macrodetritivore species.
Framework
7
Framework
This project was part of the stimulation program system oriented ecotoxicology (SSEO) coordinated by the Netherlands Organisation for Scientific Research (NWO). This program is financed by the Dutch Ministry of Agriculture, Nature Management and Fisheries (LNV, currently named Dutch Ministry of Agriculture, Nature and Food Quality), the Ministry of Housing, Spatial Planning and the Environment (VROM), Ministry of Education, Culture and Science (OCW), Ministry of Transport, Public Works and Water Management and NWO. The aim of the stimulation program was to promote scientific understanding of the way ecosystems react to chemical contamination of a chronic and diffuse nature, and to make use of fundamental and relevant knowledge to assist in formulating and implementing policy with respect to the ecological risks of chronic and diffuse contamination of the environment resulting from a combination of substances. The study was additionally financed by LNV programs ‘Multiple stress research, constraints for nature management’, ‘Abiotic conditions for Ecological Main structure (project ‘Functional diversity of soil fauna in contaminated soils’, BO-02-004-001), and ‘Soil’ (project ‘Functional biodiversity soil fauna’, BO-01-002-204). These programs aimed to assess soil quality restraints for effective nature management in the Netherlands, and to establish the relationship between soil biodiversity and ecosystem functioning.


Chapter 1
9
1 General Introduction

Chapter 1
11
1 General Introduction
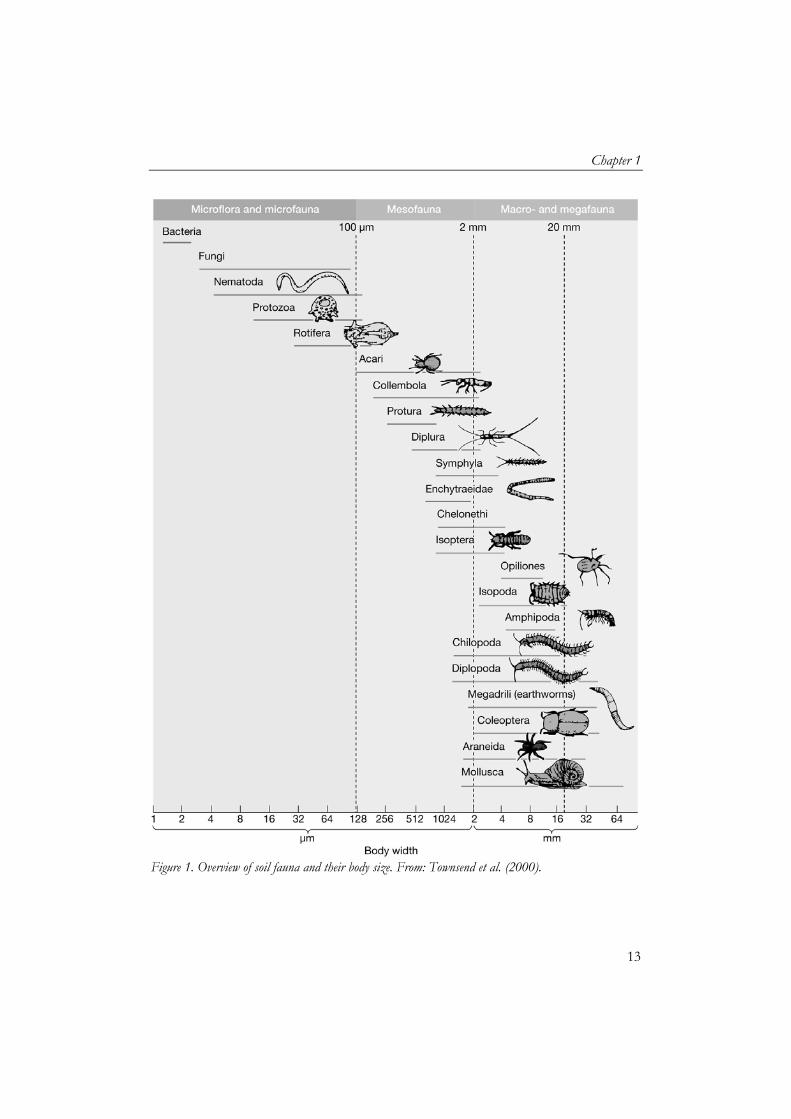
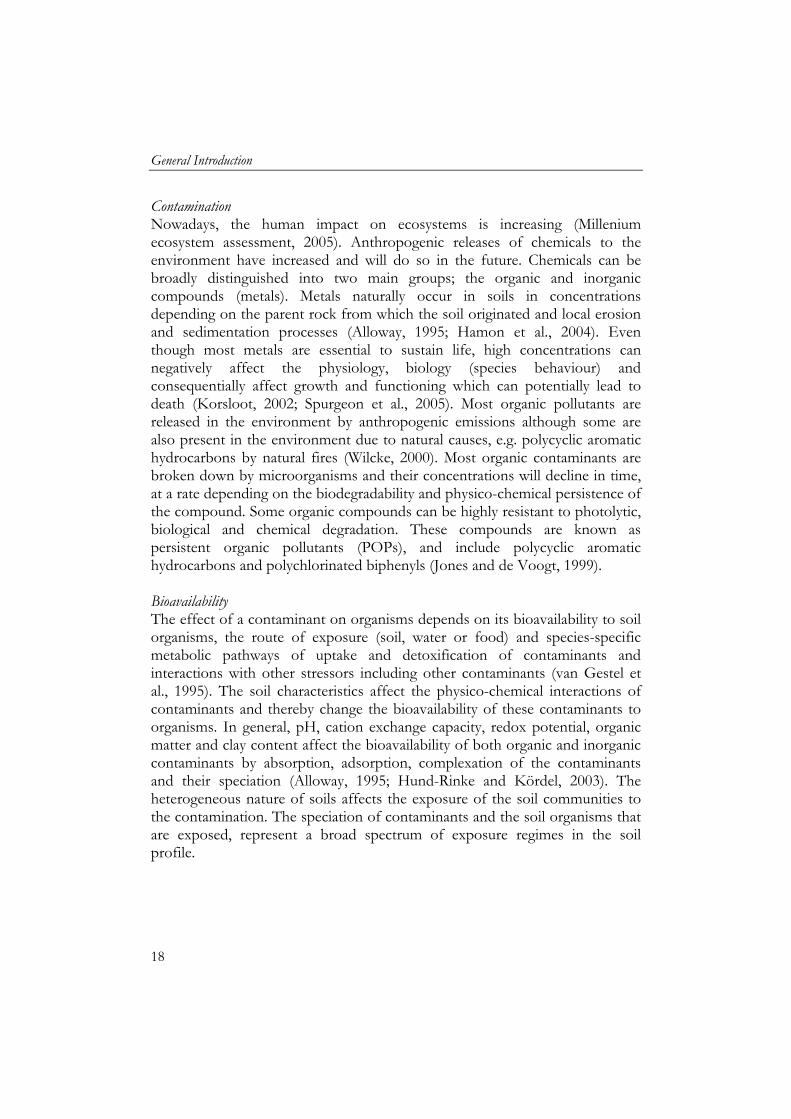
Soil heterogeneity and species diversity The soil is a dynamic and heterogeneous environment with a great diversity of soil dwelling fauna. In a handful of rich organic soil there can be millions of organisms representing hundreds of different species, including bacteria, fungi, protozoa, algae, nematodes, annelids and arthropods (Anderson, 1988; Giller, 1996). One can divide them in three groups, based on their size; microfauna, mesofauna and macro/mega fauna (Figure 1). Although the evolution and ecology causing the coexistence of the many species in soils is not fully understood, most soil ecological theories include the temporal and spatial heterogeneity of the physico-chemical soil environment as one of its main factors (Ettema and Wardle, 2002; Bardgett, 2005; Crawford et al., 2005). In these theories, the heterogeneity in climatic and environmental characteristics creates a high diversity of environmental microsites suitable to support the many different niches of soil organisms. Species diversity and soil ecosystem functioning The diversity of soil organisms and the relationship to soil functioning has become a major area of research as global species diversity is declining, due to land use change, habitat fragmentation, intensification of agricultural cultivation and soil contamination (Chapin et al., 2000; Loreau et al., 2002). Several theories have been proposed for the importance of soil biodiversity for soil ecosystem functions (Bardgett et al., 2005). Some hypotheses suggest that all species are important and consequently, little or no redundancy occurs (Loreau et al., 2002), as coexistence of species in natural systems is caused by the differences between species regarding exploitation of different resources and habitats with different environmental tolerance ranges. Furthermore, the high heterogeneity of the soils itself not only supports many species, but the species are also a necessity for optimal soil ecosystem functioning (Ekschmitt et al., 1998, 2001; Tylianakis et al., 2008). Ekschmitt et al. (1998, 2001) hypothesize that a species–poor guild will perform its ecological function in a fluctuating and heterogeneous environment less efficiently than will a species-rich guild, because a higher proportion of colonization gaps and partial refuges is likely to be left unexploited. It is therefore suggested that the saturation of guilds indicates that functional redundancy might be occurring (Srivastava, 2002). Tylianakis et al. (2008) showed that the effect of diversity on pollination, net plant productivity and parasitism infection increased in environments that
General Introduction
12
showed high spatial heterogeneity in its limiting resources. This indicates that biodiversity may have a larger impact on the functioning of heterogeneous ecosystems (Tylianakis et al., 2008). However, compensation mechanisms do exist in soils which can counterbalance species loss. These mechanisms include the presence of generalist species which might be able to take over other species’ roles. As generalism is widespread in soil organisms, functional redundancy is likely to occur within soil communities (Andrèn et al., 1995; Mikola et al., 1998). Therefore, the heterogeneous nature of soils supports many soil organisms but due to generalist species, functional redundancy is likely to occur in soils. Most empirical data on species diversity and ecosystem functioning show that functional redundancy in soil communities is occurring and seems to be the rule rather than the exception (Mikola et al., 1997; Bardgett et al., 2005). Saturation of ecosystem process rates has been observed at low species diversity (Faber and Verhoef, 1991; Setälä et al., 1997; Liiri et al., 2002; Bardgett et al., 2005). However, most studies showing redundancy are studies which have not optimally included field heterogeneity; some studies make use of homogenized soils or homogenized litter bags or are in preset climatic conditions in the laboratory. Furthermore, only a limited number of soil processes are studied and a limited range in species diversity is tested (Bardgett, 2005). Several biodiversity studies show covarying factors that can hamper the interpretation of the results. These factors include increased biomass at higher species level and the selection probability effect (a.k.a. the sampling effect) where at higher species diversity level, the chance of selecting a species with a high impact on the soil process measured increases (Huston, 1997; Mikola et al., 1998; Allison, 1999). The predictability of the occurrence of redundancy has become more complicated by species interactions, including facilitative interactions which enhance ecosystem functioning (Cardinale et al., 2002; Wardle, 2006; Brooker et al., 2008). For example, facilitative interactions between earthworm and isopod species can enhance decomposition processes (Hättenschwiler et al., 2005; Zimmer et al., 2005). These facilitative interactions between species imply that seemingly redundant species are non-redundant as they interact with non-redundant species (Wolters, 2001).
Chapter 1
13
Figure 1. Overview of soil fauna and their body size. From: Townsend et al. (2000).
General Introduction
14
Therefore, recent studies are focusing on the functions species have in an ecosystem and the quantification of species’ functional domains and the measurement of differences between species’ functional domains and their interactions (Bengtsson, 1998; Jones and Bradford, 2001; Petchey and Gaston, 2006). Species diversity is the simplest way to measure community diversity but when it comes to ecosystem functioning, species differ in their impact on soil processes. From a systems ecology viewpoint therefore, species diversity is assessed by species number within a functional group, the number of functional groups present and the identification of key species for specific functions. This may give more information on how an ecosystem will react on disturbances or to the loss of certain species (Beare et al., 1995; Bengtsson, 1998). To this aim, different measures have been developed to quantify functional diversity of soil communities, including numerical distances (Heemsbergen et al., 2004), Euclidian distances (Walker et al., 1999), dendograms (Petchey and Gaston, 2006 and 2007), Rao’s quadratic entropy (Botta-Dukát, 2005) or n dimensional distance analyses (Petchey et al., 2006). Each measure can be a useful tool for specific questions regarding biodiversity and ecosystem functioning. However, data to assess their consistency between communities and ecosystems is scarce. Decomposition One of the important processes occurring in soils is decomposition; the degradation of dead organic matter and the consequent release of nutrients for plants is a crucial step in nutrient cycling in ecosystems. Nutrient mineralisation is largely performed by primary decomposers, i.e. bacteria and fungi, and the rate of decay is influenced by the biochemical composition and physical structure of organic matter, the physico-chemical soil environment, the structure and activity of the decomposer community and trophic interactions with other soil organisms (Swift et al., 1979; Curry, 1994; Brown, 1995; Cadisch and Giller, 1997; Lavelle, 2002). Soil moisture content and temperatures are dominant variables that determine decomposition rates. Furthermore, soil pH is of central importance for many soil processes, largely by the balance between H ion and cations as Al, Ca, K and Mg. Organic matter has an important influence on pH since the products of degradation are acidic and tend to depress pH unless counteracted by bases (Swift et al., 1979; Cadisch and Giller, 1997). The effect on decomposition rates of these controlling factors depends on scale. On a global scale, soil moisture and temperatures will dominate decomposition rates (Berg, 2000). At a local scale with similar climatic conditions, soil environmental conditions like pH, clay content and nutrient status of the soil become dominant (Lavelle et al., 1993;
Chapter 1
15
Cadisch and Giller, 1997). If soil environmental conditions are similar, the litter quality and the composition of the soil community and their interactions become the main drivers of decomposition processes.
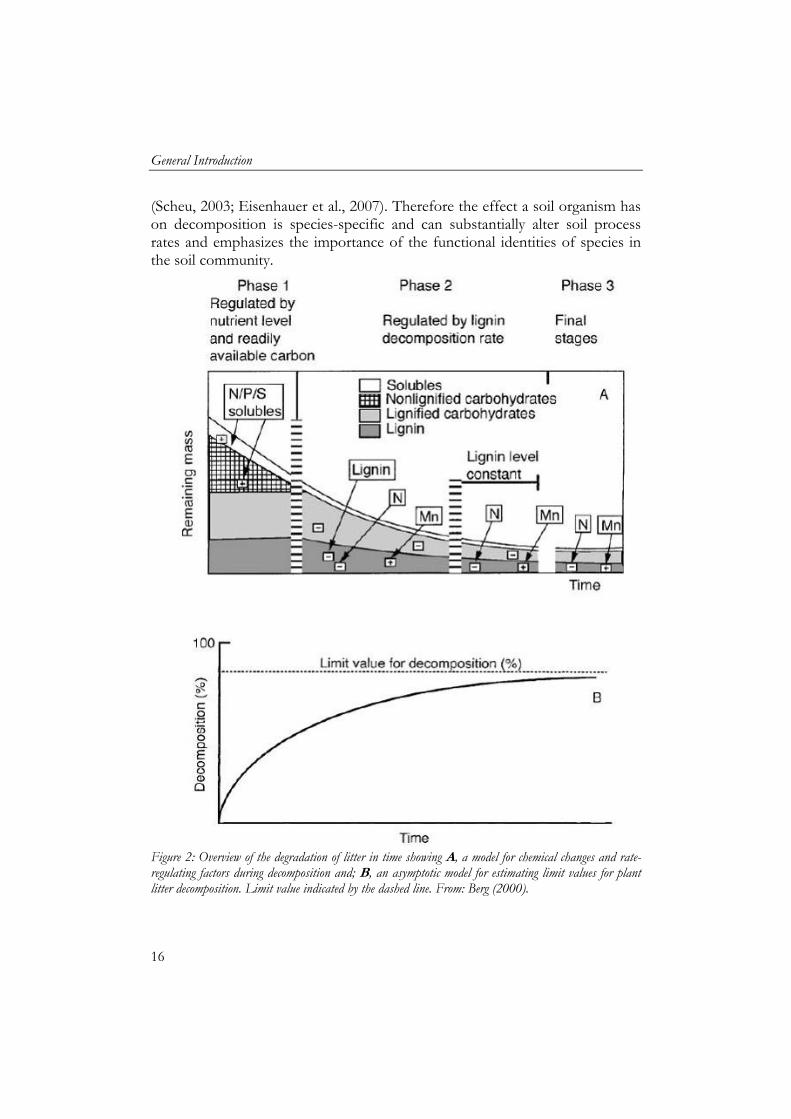
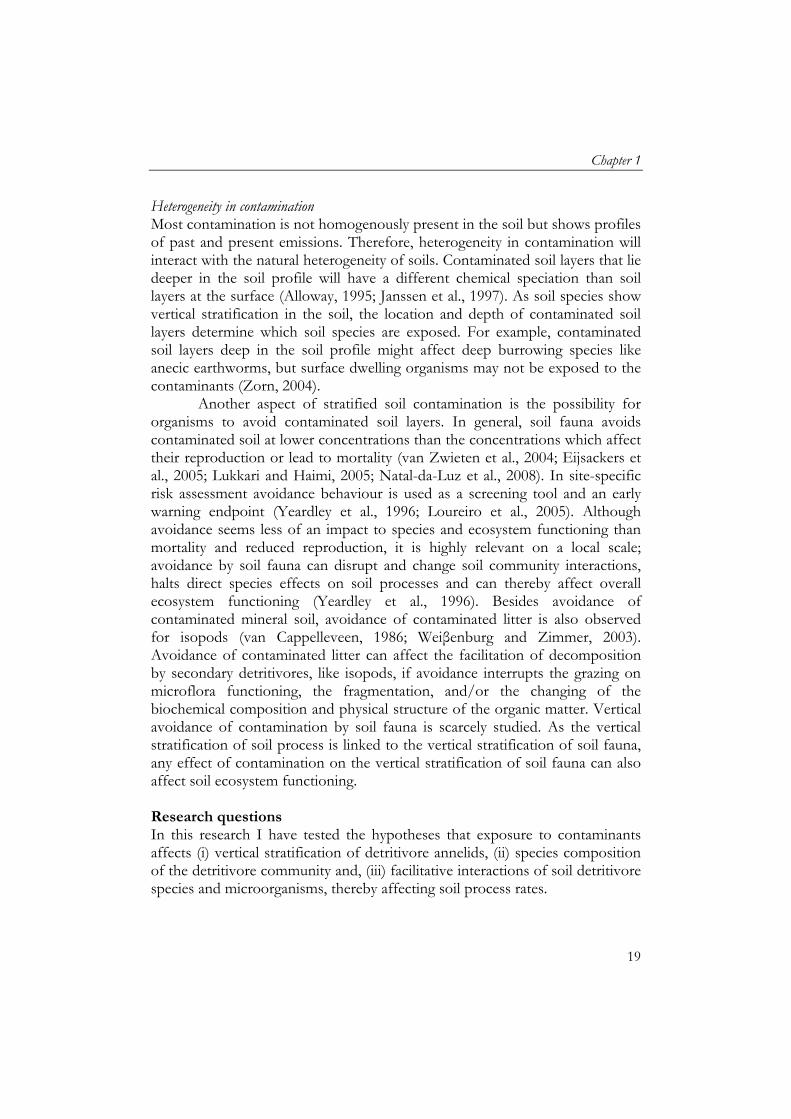
Degradation rates of litter typically show an exponential trend with three phases (Figure 2). The first phase is the solubilisation of the sugars, ions and amino acids and the degradation rate is dominated by degradation of non lignified carbohydrates, like cellulose and hemi-cellulose. The second phase is the slowest because the degradation rate is dominated by the degradation of lignin and lignified compounds. These compounds are complex and recalcitrant and therefore degradation rates are slow. The third and final phase is also dominated by degradation of lignified compost but lignin levels in litter remain constant. A specific group of soil animals, the detritivores, feed on dead organic matter thereby directly affecting decomposition of litter through assimilation and consumption. This group includes among others earthworms, enchytraeids, oribatid mites, isopods and millipedes (Swift et al., 1979; Curry, 1994; Bardgett et al., 2005). Soil fauna facilitates decomposition indirectly by grazing on microflora and by fragmentation of litter particles, incorporation of litter into the soil compartment, bioturbation and thereby changing the biochemical composition and physical structure of the organic matter. For example, fragmentation increases the surface area of the litter which then is more accessible for microorganisms. Grazing on microorganisms by soil fauna results in higher activity, respiration and turnover rate of microbial communities (Anderson, 1988; Mikola and Setälä, 1998). Gut passage is known to substantially increase soil microbe numbers in the ingested organic matter as assessed by the casts (Brown, 1995; Drake and Horn, 2007).
The facilitation by soil fauna can become a driving factor for degradation rates of organic matter at a local scale where climatic conditions and litter quality are constant. The facilitative interactions can substantially increase soil processes and increase nutrient release but the mechanism behind the interactions and the extent of the interactions differ per species. Certain species can furthermore significantly affect overall soil communities by their impact on the soil physico chemical properties and their potential to create or modify (micro) habitats for other organisms in the ecosystem. These species are known as ecosystem engineers, including earthworms, ants and termites, as they create biogenic structures (e.g. burrows, mounds), affect soil aggregation and /or incorporate organic matter into the soil profile (Jones et al,. 1994; Lavelle et al., 1997; Jouquet et al., 2006). Their absence or presence can significantly affect terrestrial ecosystems including above-ground vegetation
General Introduction
16
(Scheu, 2003; Eisenhauer et al., 2007). Therefore the effect a soil organism has on decomposition is species-specific and can substantially alter soil process rates and emphasizes the importance of the functional identities of species in the soil community.
Figure 2: Overview of the degradation of litter in time showing A, a model for chemical changes and rate-regulating factors during decomposition and; B, an asymptotic model for estimating limit values for plant litter decomposition. Limit value indicated by the dashed line. From: Berg (2000).
Chapter 1
17
Soil heterogeneity and species distribution Spatial distribution of soil organisms is not random, but highly aggregated and mainly controlled by temperature, pH, soil type, water content and food (Curry, 1994; Ettema and Wardle, 2002). On a vertical spatial scale, species distribution along the soil profile is also linked to these factors, and distinct patterns can be observed (Faber and Joosse, 1993; Berg et al., 1998; Berg and Bengtsson, 2007). This vertical stratification coincides with changes in the quantity and quality of soil organic matter with soil depth, and with strong gradients in soil temperature and humidity over a relatively small vertical spatial scale (Berg and Bengtsson, 2007). Furthermore, soil processes also show vertical heterogeneity as these result from biotic interactions. Litter decomposition, nutrient mineralisation, and humus formation e.g. can all be characterised by sequential steps typically staged at various depths in the soil (Swift et al., 1979; Faber and Verhoef, 1991; Berg et al., 1998). Therefore, both presence and location of the species are important for optimal functioning of soils. Stress biology and contamination The functioning of soil organisms and, by consequence, the functioning of soil ecosystems can be hampered by natural and anthropogenic disturbances. Natural occurrences of periods of drought, frost and flooding of areas can hinder their cellular metabolism, and consequentially their functioning, survival and reproduction by which populations, communities and ecosystems can be affected. Stress factors can also be biotic which include predation, competition and disease or parasitism (Stachowicz, 2001). Anthropogenic disturbances affecting species functioning include habitat loss, soil management practices, and the release of chemicals into the environment. Each stressor to an organism, either natural or anthropogenic, does not stand on its own but is embedded by the overall circumstances of the species and should therefore also be assessed in relation to the other stressors species are confronted with (van Straalen, 2003). Studies have shown that contaminants have a more drastic effect on organisms if the organisms are also under climatic and food stress (Abdel-Lateif et al., 1998; Hendriks et al., 2005; Heugens et al., 2006). Stress interactions are also of importance on effect studies on population, community and ecosystem level. Ecosystem processes are performed by multiple species and contaminants can disrupt their individual functioning or species interactions (van Straalen, 2002). Species interactions can be interrupted if the functioning of one of the species is repressed by a stressor or if species show avoidance of stress-affected microhabitats and consequently, species interactions are hindered.
General Introduction
18
Contamination Nowadays, the human impact on ecosystems is increasing (Millenium ecosystem assessment, 2005). Anthropogenic releases of chemicals to the environment have increased and will do so in the future. Chemicals can be broadly distinguished into two main groups; the organic and inorganic compounds (metals). Metals naturally occur in soils in concentrations depending on the parent rock from which the soil originated and local erosion and sedimentation processes (Alloway, 1995; Hamon et al., 2004). Even though most metals are essential to sustain life, high concentrations can negatively affect the physiology, biology (species behaviour) and consequentially affect growth and functioning which can potentially lead to death (Korsloot, 2002; Spurgeon et al., 2005). Most organic pollutants are released in the environment by anthropogenic emissions although some are also present in the environment due to natural causes, e.g. polycyclic aromatic hydrocarbons by natural fires (Wilcke, 2000). Most organic contaminants are broken down by microorganisms and their concentrations will decline in time, at a rate depending on the biodegradability and physico-chemical persistence of the compound. Some organic compounds can be highly resistant to photolytic, biological and chemical degradation. These compounds are known as persistent organic pollutants (POPs), and include polycyclic aromatic hydrocarbons and polychlorinated biphenyls (Jones and de Voogt, 1999). Bioavailability The effect of a contaminant on organisms depends on its bioavailability to soil organisms, the route of exposure (soil, water or food) and species-specific metabolic pathways of uptake and detoxification of contaminants and interactions with other stressors including other contaminants (van Gestel et al., 1995). The soil characteristics affect the physico-chemical interactions of contaminants and thereby change the bioavailability of these contaminants to organisms. In general, pH, cation exchange capacity, redox potential, organic matter and clay content affect the bioavailability of both organic and inorganic contaminants by absorption, adsorption, complexation of the contaminants and their speciation (Alloway, 1995; Hund-Rinke and Kördel, 2003). The heterogeneous nature of soils affects the exposure of the soil communities to the contamination. The speciation of contaminants and the soil organisms that are exposed, represent a broad spectrum of exposure regimes in the soil profile.
Chapter 1
19
Heterogeneity in contamination Most contamination is not homogenously present in the soil but shows profiles of past and present emissions. Therefore, heterogeneity in contamination will interact with the natural heterogeneity of soils. Contaminated soil layers that lie deeper in the soil profile will have a different chemical speciation than soil layers at the surface (Alloway, 1995; Janssen et al., 1997). As soil species show vertical stratification in the soil, the location and depth of contaminated soil layers determine which soil species are exposed. For example, contaminated soil layers deep in the soil profile might affect deep burrowing species like anecic earthworms, but surface dwelling organisms may not be exposed to the contaminants (Zorn, 2004).
Another aspect of stratified soil contamination is the possibility for organisms to avoid contaminated soil layers. In general, soil fauna avoids contaminated soil at lower concentrations than the concentrations which affect their reproduction or lead to mortality (van Zwieten et al., 2004; Eijsackers et al., 2005; Lukkari and Haimi, 2005; Natal-da-Luz et al., 2008). In site-specific risk assessment avoidance behaviour is used as a screening tool and an early warning endpoint (Yeardley et al., 1996; Loureiro et al., 2005). Although avoidance seems less of an impact to species and ecosystem functioning than mortality and reduced reproduction, it is highly relevant on a local scale; avoidance by soil fauna can disrupt and change soil community interactions, halts direct species effects on soil processes and can thereby affect overall ecosystem functioning (Yeardley et al., 1996). Besides avoidance of contaminated mineral soil, avoidance of contaminated litter is also observed for isopods (van Cappelleveen, 1986; Weiβenburg and Zimmer, 2003). Avoidance of contaminated litter can affect the facilitation of decomposition by secondary detritivores, like isopods, if avoidance interrupts the grazing on microflora functioning, the fragmentation, and/or the changing of the biochemical composition and physical structure of the organic matter. Vertical avoidance of contamination by soil fauna is scarcely studied. As the vertical stratification of soil process is linked to the vertical stratification of soil fauna, any effect of contamination on the vertical stratification of soil fauna can also affect soil ecosystem functioning. Research questions In this research I have tested the hypotheses that exposure to contaminants affects (i) vertical stratification of detritivore annelids, (ii) species composition of the detritivore community and, (iii) facilitative interactions of soil detritivore species and microorganisms, thereby affecting soil process rates.
General Introduction
20
To test these central hypotheses, four specific sub-hypotheses were tested in this study:
1. Heterogeneous contamination affects soil fauna community. Contamination can lead to an effective species loss on a local scale through direct toxicity or by avoidance of soil contaminants by species on a horizontal scale. I tested in the field if horizontally and vertically heterogeneous contamination affects the soil community on a local scale.
2. Vertically heterogeneous contamination affects the vertical distribution of species.
Soil fauna can avoid contaminated soil layers in a heterogeneous contaminated soil profile. I have assessed the effect of different contamination scenarios on the vertical stratification of soil fauna.
3. Vertically heterogeneous contamination affects interactions between soil fauna and microbial processes. Avoidance of contaminated soil layers by detritivores can affect their functioning and interactions between soil fauna and microorganisms. I have assessed the effect of different contamination scenarios on soil fauna interactions with microorganisms.
4. Compositional changes in the soil macrodetritivore community affect soil process rates. In the laboratory, I tested the hypothesis that soil fauna community composition affects soil process rates. I quantified the individual effects of species and experimental communities on soil processes to assess species redundancy and soil fauna interactions on microbial processes.
River floodplains as study area River floodplains are good model ecosystems to test the hypotheses 1, 2 and 3 due to their heterogeneously contaminated soils. In the Netherlands the floodplains of the river Rhine are severely contaminated. From the industrial revolution until the late 1970s, the rivers were used as a main deposit for wastes and waste water and as a consequence the river floodplains got contaminated with both organic and inorganic contaminants through deposition of sediments during winter flooding (Middelkoop, 1997). After the 1970s the sediment bound inorganic contaminant levels decreased, although organic contaminant deposits remained high. Undisturbed soil profiles still reflect these past emission rates, and the highest inorganic contaminated soil layers are now found approximately at 10–35 cm depths (Middelkoop, 1997).
Chapter 1
21
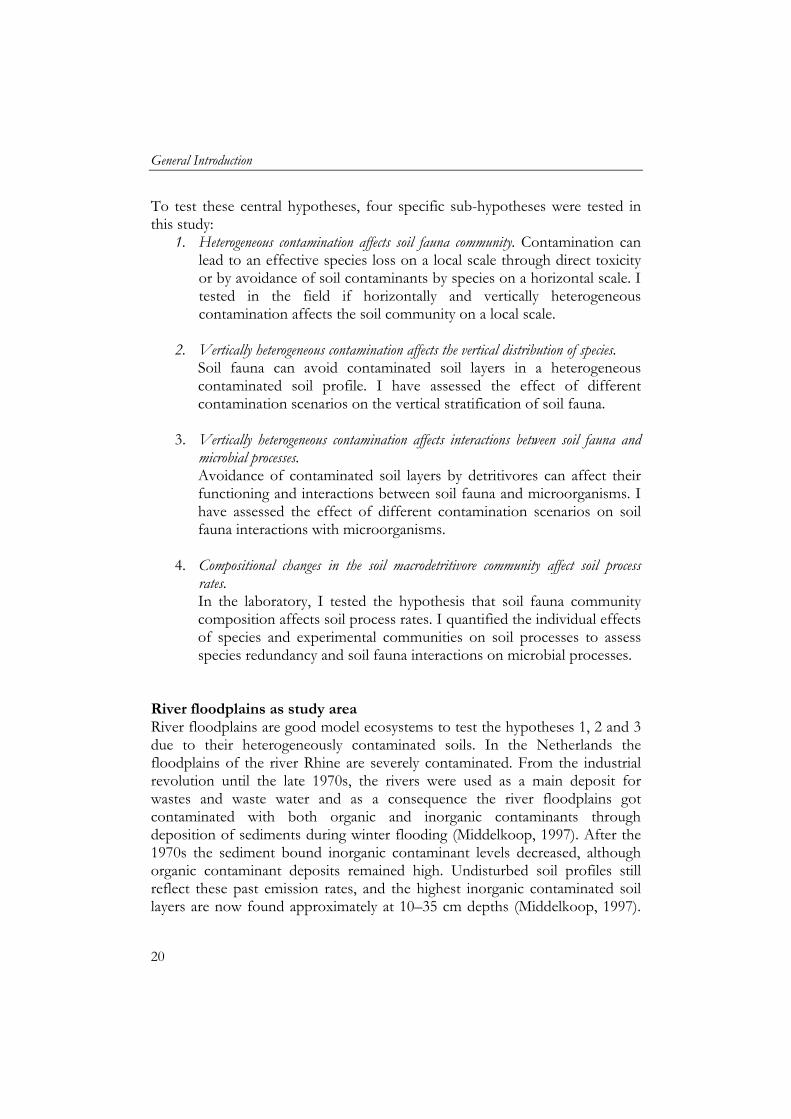
The exact location and thickness of this highly contaminated zone depends on the present and historical sedimentation and erosion rates (Thonon, 2006). Anthropogenic disturbances of the soil have led to alterations of the positioning of the contaminated soil layer. These factors have resulted in a high heterogeneity of the contamination, both vertically and horizontally. Afferdense and Deestse Waarden The river floodplain Afferdense and Deestse Waarden (ADW) is located next to the river Waal, a contributory of the river Rhine (longitude 51˚54'N, latitude 5˚39'E, elevation 10.1 m above sea level) (Figure 3). Although currently it has commercial, residential and agricultural purposes, the entire floodplain will become a nature reserve area as part of the project ‘Ruimte voor de rivier’ (van der Perk, 1996). The existing heterogeneous contamination together with massive soil movement can lead to altering exposure to soil organisms and is a possible threat for soil food webs and soil processes.
Inundation is a known stress factor for soil fauna in river floodplains (e.g. Zorn, 2004; Plum and Filser, 2005). The ADW is flooded annually for approximately two months in late winter or early spring due to melt water from the Alps. Inundation periods are prolonged by minor embankments of the river preventing most of the water to flow back to the river, but to evaporate and infiltrate into the soil instead. The grassland site chosen for research is in the centre of the floodplain and is part of the present nature reserve area (Figure 3). The grassland is extensively grazed by horses and cattle throughout the year, except during high water in the river. It is enclosed by an abandoned side channel of the river (south and west) (Schoor, 1994) and an elevated road on the north and woodlands (east). The soil varies from heavy clay loam to sand, and the area geologically makes part of the Betuwe formation. The soil profile is a cambisol, reflecting the new deposits of sediment each year. Outline of thesis Chapter 2 describes the study in which I tested the hypothesis that “horizontally heterogeneous soil characteristics and contamination affects the distribution of macrofauna”. Therefore, I first quantified the scale of heterogeneity in the floodplain Afferdense and Deestse Waarden and then tested if the heterogeneous soil characteristics affected the horizontal distribution of macrofauna.
General Introduction
22
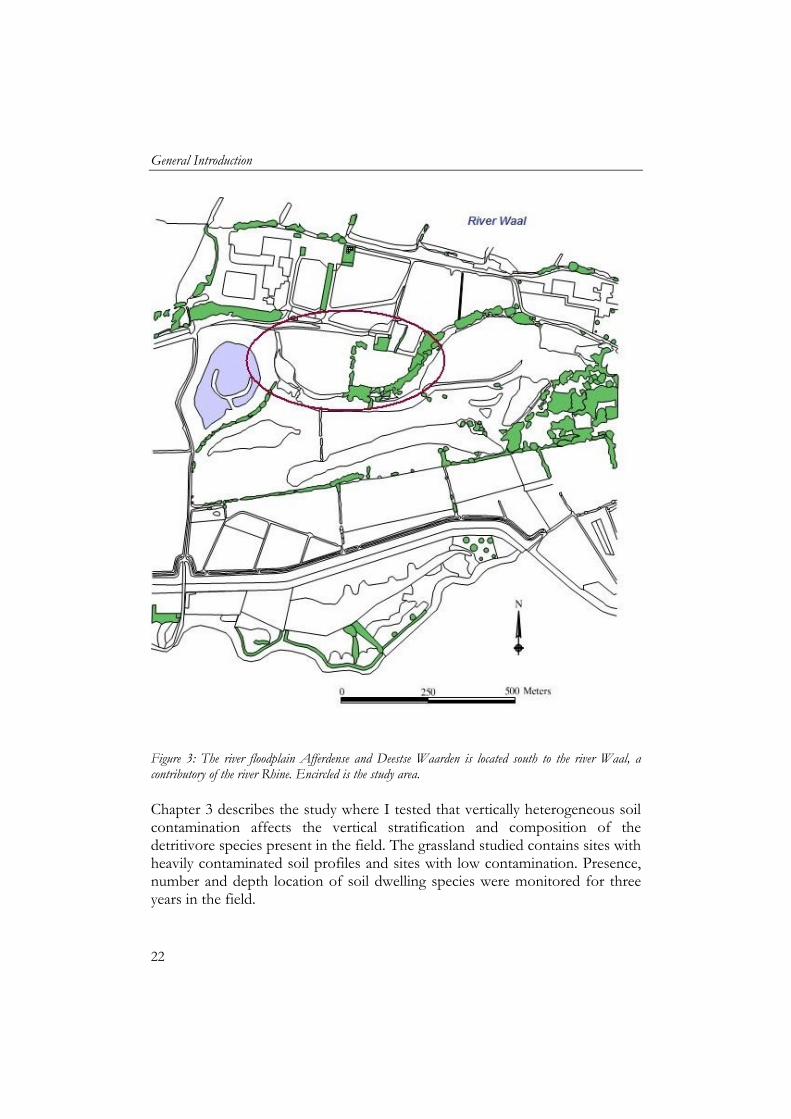
Figure 3: The river floodplain Afferdense and Deestse Waarden is located south to the river Waal, a contributory of the river Rhine. Encircled is the study area. Chapter 3 describes the study where I tested that vertically heterogeneous soil contamination affects the vertical stratification and composition of the detritivore species present in the field. The grassland studied contains sites with heavily contaminated soil profiles and sites with low contamination. Presence, number and depth location of soil dwelling species were monitored for three years in the field.
Chapter 1
23
Chapter 4 describes a laboratory study where I tested the hypothesis that vertically heterogeneous contamination affects facilitative interactions between soil fauna and microbial processes. Three detritivore species with different habitat preferences and feeding modes were used; a surface dwelling isopod, an epigeic and an endogeic earthworm. Self-constructed soil columns mimicked the vertical heterogeneity in contamination in river floodplains. Soil process rates were measured to quantify the effect of the stratified contamination on the facilitative interactions between soil fauna and microorganisms.
Chapter 5 and 6 describe a laboratory study where I tested the main hypotheses that compositional changes in the soil macrodetritivore community affect soil process rates. In this study I quantified the effects of individual species and species assemblages on soil processes using eight macrodetritivore species commonly found in river floodplains and other ecosystems in the Netherlands. Furthermore, facilitative interactions between soil fauna and microbial processes were quantified and their predictability was assessed using functional and ecological measures.
Chapter 7 discusses the central hypotheses of this thesis that exposure to contaminants affects (i) vertical stratification of detritivore annelids, (ii) species composition of the detritivore community and, (iii) facilitative interactions of soil detritivore species and microorganisms, thereby affecting soil process rates.

Chapter 2
25
2 Soil fauna distribution in heterogeneous soils

Chapter 2
27
2 Soil fauna distribution in heterogeneous soils
D.A. Heemsbergenab, W. Dimmersa, J.H. Faber a, M.P. Bergb and H.A. Verhoefb a Alterra: Wageningen University and Research Centre, P.O. Box 47 NL-
6700 AA Wageningen, The Netherlands b VU University, Amsterdam, De Boelelaan 1085, 1081 HV Amsterdam,
The Netherlands Abstract Spatial heterogeneity in abiotic and biotic factors is an important habitat feature of ecosystems as it facilitates potential refuges for less favourable conditions. Heterogeneously contaminated soils can affect specific groups of organisms and their functioning, both directly by toxic effects and by avoidance of contaminated micro-sites. We tested the hypothesis that horizontally heterogeneous soil characteristics affect macrofauna distribution in a river floodplain. The horizontal pattern of zinc content showed a gradual increase in concentration in eastern direction and a high heterogeneity in the southern part of the grassland. Correspondence analyses showed that vegetation and soil moisture content explained most of the variation found between different sites. Abundances of species and vegetation were not affected by contamination which was most probably due to the low bioavailability of the contaminants. The temporal dynamics showed that to have a proper assessment of species’ presence and abundances, one has to sample for consecutive weeks to ensure optimal capturing of the species present due to climatic fluctuations. Keywords: soil characteristics, spatial heterogeneity, river floodplain, soil fauna, soil contamination Introduction Spatial heterogeneity in abiotic and biotic factors is an important habitat feature of ecosystems. It is a facilitating condition for the coexistence of species as it creates a variety of microhabitats. In this mosaic of microsites, different temporal and spatial competition occurs per microsite and competitors can be spatially and temporally separated (Ettema and Wardle, 2002; Hartly and Shorrocks, 2002; Hampton, 2004). Furthermore, spatial
Soil fauna distribution in heterogeneous soils
28
heterogeneity creates potential refuges from unfavourable conditions from which species can recolonise sites from which they were driven to extinction. Therefore, spatial heterogeneity affects the coexistence of species. Different scales of heterogeneity, from microsites to larger landscape level, give different environmental factors affecting species distribution (Nichols et al., 1998; Chust et al., 2003). On a local scale, abundances of organisms depend mostly on local climate and weather, structure and composition of the sward and its nutritional quality and the quantity and quality of litter returned to the soil, and soil physical and chemical characteristics (Curry, 1994).
Heterogeneity in contamination can affect specific groups of organisms and their functioning, both directly by toxic effects and by avoidance of contaminated microsites. Avoidance of contamination has been observed in earthworms (Slimak, 1997; van Zwieten et al., 2004; Eijsackers et al., 2005; Natal da Luz et al., 2008) and springtails (Natal da Luz et al., 2008) and avoidance of contaminated litter by isopods (van Cappelleveen, 1986; Weiβenburg and Zimmer, 2003). Furthermore, variation in soil characteristics leads to variation in bioavailability of the already heterogeneous contamination (Bourg and Loch, 1995; Ritchie and Sposito, 1995).
The Dutch river floodplains show a high heterogeneity in soil characteristics, including contamination. As the contamination load of the river Rhine varied through the years, the floodplains are diffusely contaminated with different contaminants, mainly metals, PAHs, mineral oils and PCBs. The highest concentrations of contaminants have been deposited in the years 1950–1970 and are mostly found at a depth of 10–35 cm (Middelkoop, 1997). Spatial differences in sedimentation rates and anthropogenic disturbances have caused the contamination to be variably positioned within the soil profile. Therefore, the floodplains show heterogeneity in contamination on a vertical and horizontal scale. We tested the hypothesis that horizontally heterogeneous soil characteristics affect macrofauna distribution in a river floodplain. Furthermore, we wanted to assess the scale at which heterogeneity in soil characteristics occurs in the floodplain. Soil characteristics measured included clay, water, soil organic matter and zinc content. Macrofauna were captured for 4 weeks using pitfall traps and determined on order level except for the millipedes and isopods which were determined on species level.
Chapter 2
29
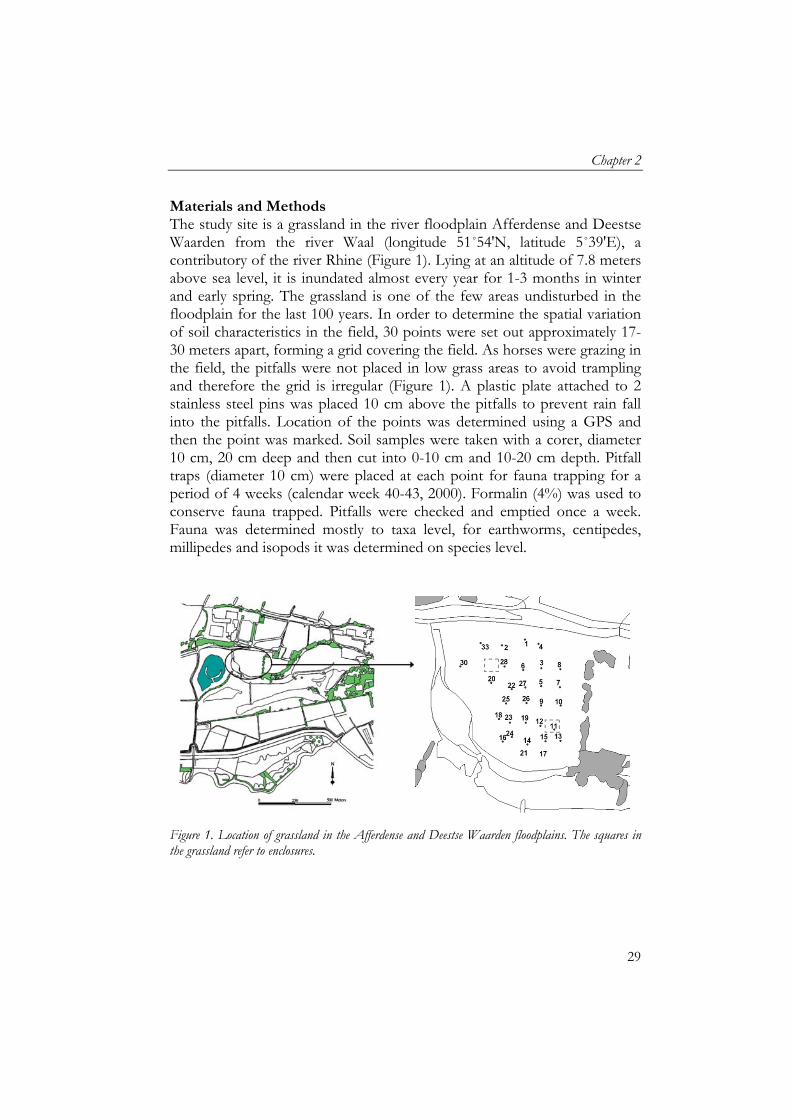
Materials and Methods The study site is a grassland in the river floodplain Afferdense and Deestse Waarden from the river Waal (longitude 51˚54'N, latitude 5˚39'E), a contributory of the river Rhine (Figure 1). Lying at an altitude of 7.8 meters above sea level, it is inundated almost every year for 1-3 months in winter and early spring. The grassland is one of the few areas undisturbed in the floodplain for the last 100 years. In order to determine the spatial variation of soil characteristics in the field, 30 points were set out approximately 17-30 meters apart, forming a grid covering the field. As horses were grazing in the field, the pitfalls were not placed in low grass areas to avoid trampling and therefore the grid is irregular (Figure 1). A plastic plate attached to 2 stainless steel pins was placed 10 cm above the pitfalls to prevent rain fall into the pitfalls. Location of the points was determined using a GPS and then the point was marked. Soil samples were taken with a corer, diameter 10 cm, 20 cm deep and then cut into 0-10 cm and 10-20 cm depth. Pitfall traps (diameter 10 cm) were placed at each point for fauna trapping for a period of 4 weeks (calendar week 40-43, 2000). Formalin (4%) was used to conserve fauna trapped. Pitfalls were checked and emptied once a week. Fauna was determined mostly to taxa level, for earthworms, centipedes, millipedes and isopods it was determined on species level.
Figure 1. Location of grassland in the Afferdense and Deestse Waarden floodplains. The squares in the grassland refer to enclosures.
Soil fauna distribution in heterogeneous soils
30
Soil analyses Soil samples were dried at 40 °C for 48 hours after being homogenised and milled (using a mortar). Soil samples were analysed for water content, heavy metal contents and texture. Moisture content (w/w) was determined by drying moist soil for 24 hours at 55 ºC. Total metal concentrations were determined by digesting 1 g dry soil in a mixture of H2O, concentrated HNO3 (65%) and HCl (37%) at a volume ratio of 1:1:4 using a MARS5 microwave (Bongers, 2007). Quality control was maintained by digesting reference samples (SETOC), of which the measured Zn concentrations did not deviate more than 10% from the certified reference value. All zinc extracts were analysed using flame Atomic Absorption Spectrometry (Perkin Elmer 1100B AAS). Soil samples for soil particle size analyses were pre-treated to remove organic matter (using H2O2) and carbonates (using HCl) to obtain only mineral soil particles (Konert and van den Berghe, 1997). Clay content of the soil was determined using laser diffraction size analysis (Konert and van den Berghe, 1997). Spatial mapping and statistics The spatial data on soil characteristics was interpolated using the GIS program ArcView 3.2a (ESRI) using a triangular irregular network. The scale of spatial heterogeneity of the soil characteristics was determined by making a semi-variogram of the 30 points (Genstat 7.0). For analysis, sample points were classified for vegetation in 10 classes, based on the percentage of high/medium/low vegetation surrounding the sample points with a radius of 5 meter. Fauna trapped in pitfalls were summed over four weeks and analysed per taxa. A canonical correspondence analyses was done to analyse relations between environmental and fauna variables using CANOCO (version 4.5 for Windows). Pearson correlation was used for correlation analyses between variables. Results Vegetation in the grassland consisted mainly of grass species and herbs. High vegetation was dominated by the species Potentilla reptans L., Potentilla anserina L., Urtica dioica L., Rumex crispus L., Lolium perenne L., Agrostis stolonifera L.and Cirsium arvense L.and low vegetation was dominated by Bellis perennis L., Trifolium repens L., Lolium perenne L. and Agrostis stolonifera L. The edges of the grassland showed short vegetation, while the centre of the grassland showed high vegetation cover. In the centre of the grassland, horse grazing created short vegetation corridors through the high vegetation cover.
Chapter 2
31
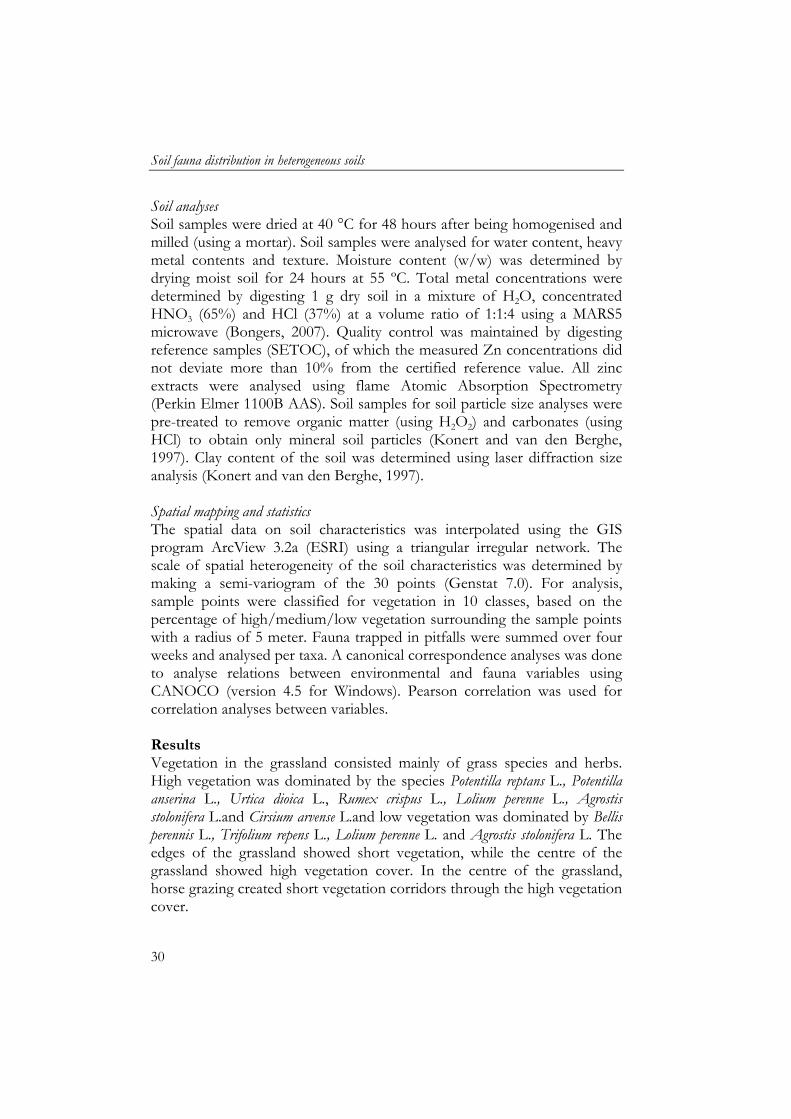
The distribution of zinc concentrations in the top 10 cm of the soil showed a different pattern than at 10–20 cm (Figure 2a and b). Total zinc concentrations varied between 170 and 1050 mg/kg dry soil. Zinc content showed a rather homogeneous pattern in the northern part of the grassland. In the southern part of the grassland both high and low zinc concentrations were located close together, which was most profoundly in the zinc concentration at 10-20 cm depth (Figure 2b). The metal concentrations (copper, lead, cadmium and zinc) showed strong positive correlations. Furthermore, calcium, copper, lead and zinc concentrations were positively correlated with clay content.
Legend. Zinc concentration (mg/kg DW):
Figure 2. Total zinc concentration (mg/kg DW) at a, 0-10 cm and b, 10-20 cm in the soil profile of the Afferdense and Deestse Waarden.
Semi-variogram of zinc concentrations at 0-10 cm in soil profile.
Soil fauna distribution in heterogeneous soils
32
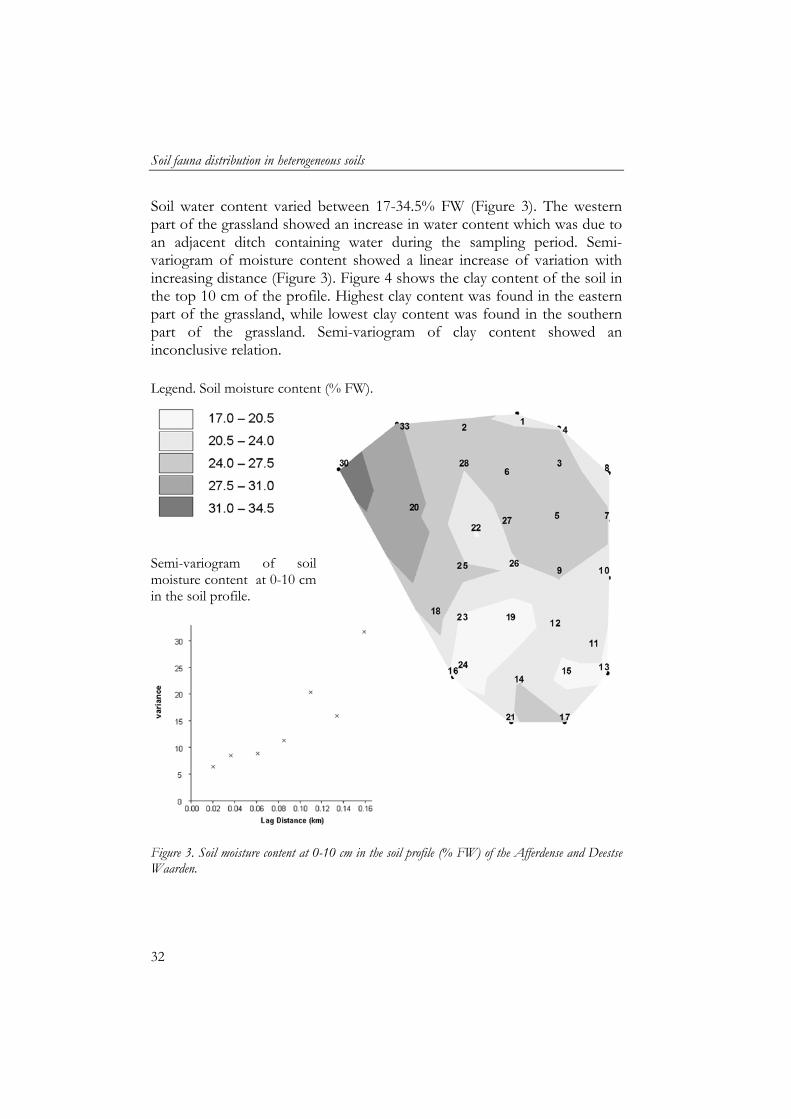
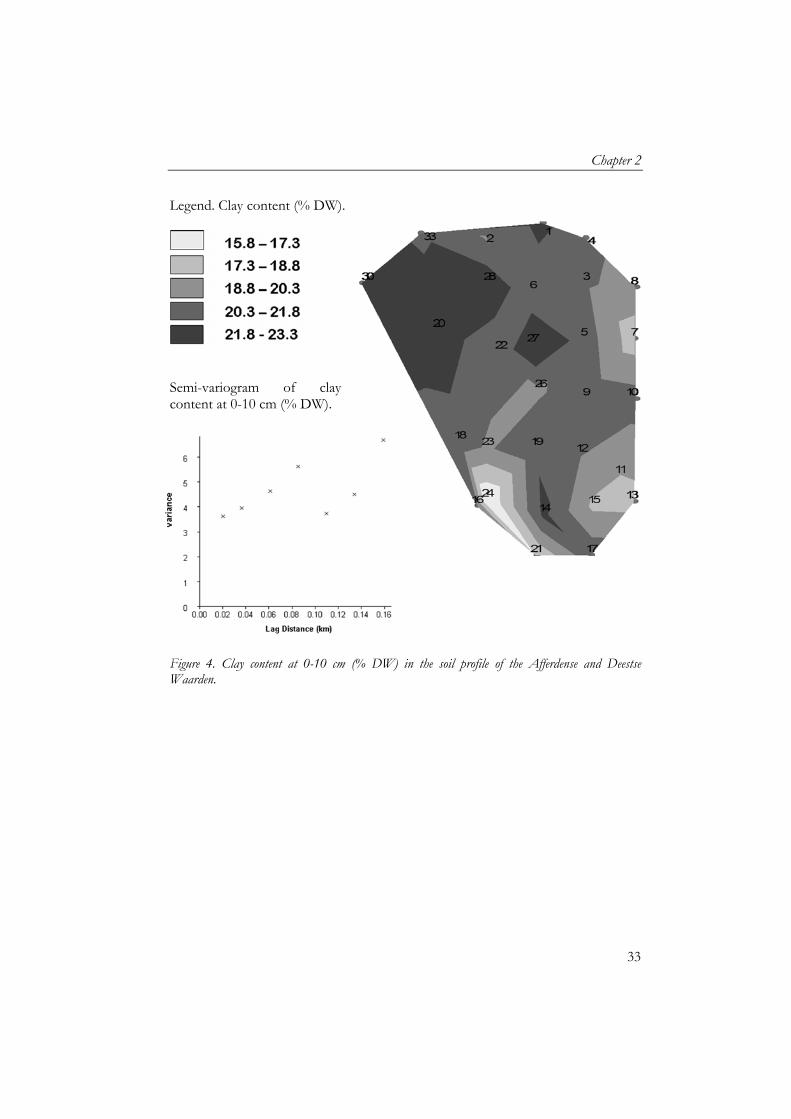
Soil water content varied between 17-34.5% FW (Figure 3). The western part of the grassland showed an increase in water content which was due to an adjacent ditch containing water during the sampling period. Semi-variogram of moisture content showed a linear increase of variation with increasing distance (Figure 3). Figure 4 shows the clay content of the soil in the top 10 cm of the profile. Highest clay content was found in the eastern part of the grassland, while lowest clay content was found in the southern part of the grassland. Semi-variogram of clay content showed an inconclusive relation. Legend. Soil moisture content (% FW).
Semi-variogram of soil moisture content at 0-10 cm in the soil profile.
Figure 3. Soil moisture content at 0-10 cm in the soil profile (% FW) of the Afferdense and Deestse Waarden.
Chapter 2
33
Legend. Clay content (% DW).
Semi-variogram of clay content at 0-10 cm (% DW).
Figure 4. Clay content at 0-10 cm (% DW) in the soil profile of the Afferdense and Deestse Waarden.
Soil fauna distribution in heterogeneous soils
34
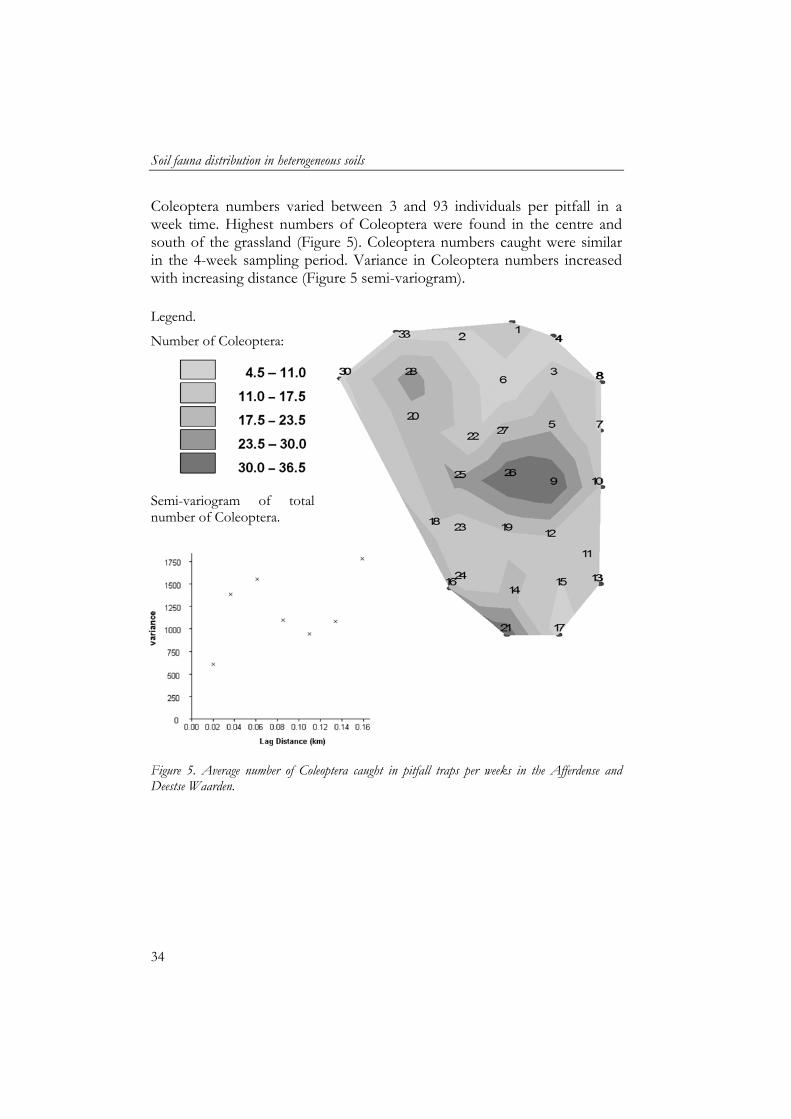
Coleoptera numbers varied between 3 and 93 individuals per pitfall in a week time. Highest numbers of Coleoptera were found in the centre and south of the grassland (Figure 5). Coleoptera numbers caught were similar in the 4-week sampling period. Variance in Coleoptera numbers increased with increasing distance (Figure 5 semi-variogram). Legend.
Number of Coleoptera:
Semi-variogram of total number of Coleoptera.
Figure 5. Average number of Coleoptera caught in pitfall traps per weeks in the Afferdense and Deestse Waarden.
Chapter 2
35
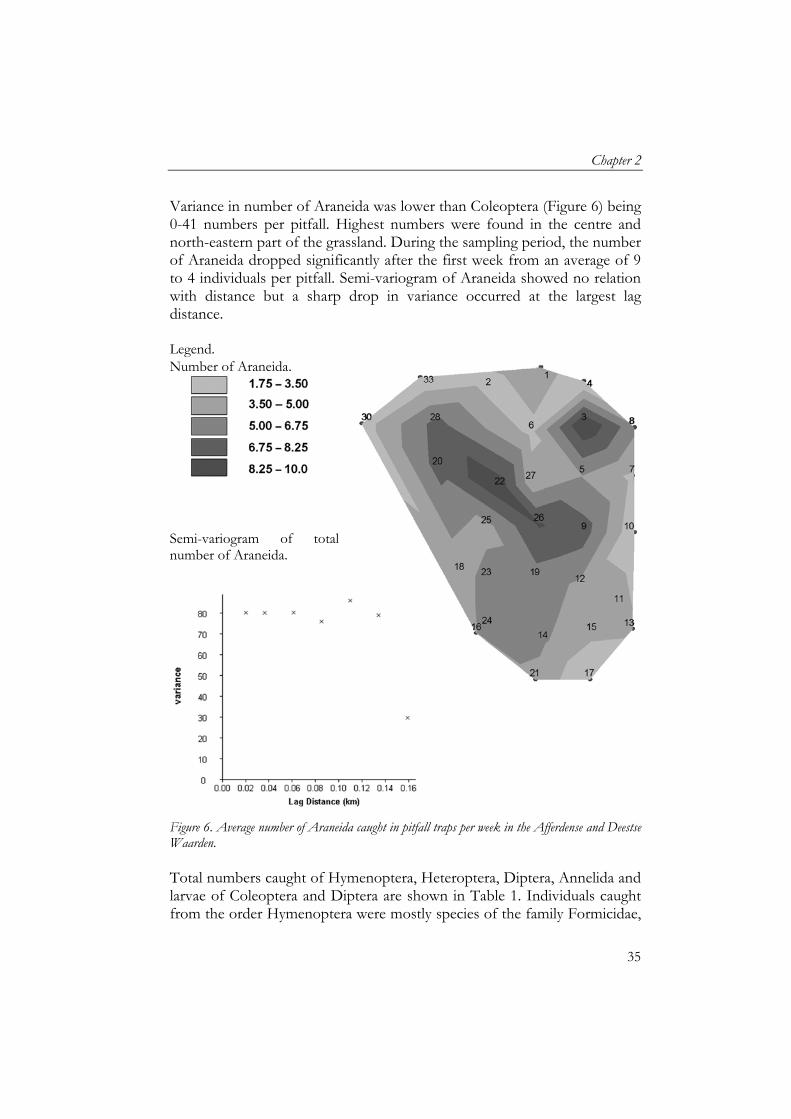
Variance in number of Araneida was lower than Coleoptera (Figure 6) being 0-41 numbers per pitfall. Highest numbers were found in the centre and north-eastern part of the grassland. During the sampling period, the number of Araneida dropped significantly after the first week from an average of 9 to 4 individuals per pitfall. Semi-variogram of Araneida showed no relation with distance but a sharp drop in variance occurred at the largest lag distance. Legend. Number of Araneida.
Semi-variogram of total number of Araneida.
Figure 6. Average number of Araneida caught in pitfall traps per week in the Afferdense and Deestse Waarden. Total numbers caught of Hymenoptera, Heteroptera, Diptera, Annelida and larvae of Coleoptera and Diptera are shown in Table 1. Individuals caught from the order Hymenoptera were mostly species of the family Formicidae,
Soil fauna distribution in heterogeneous soils
36
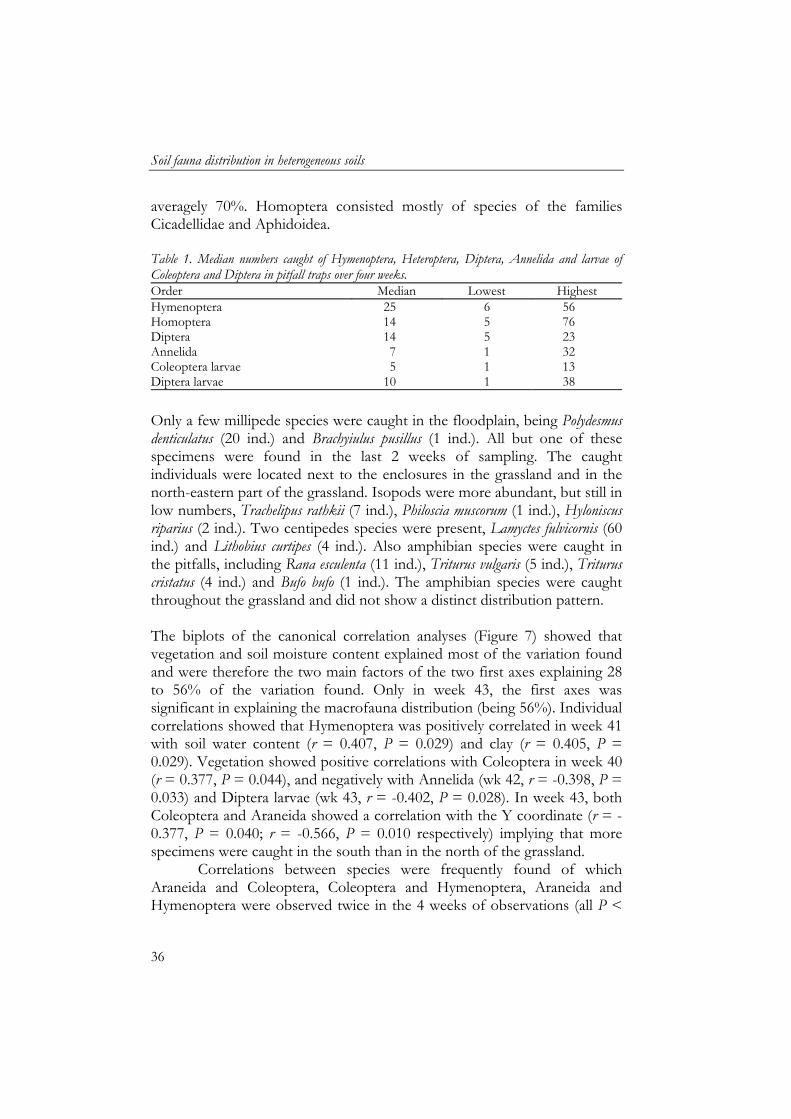
averagely 70%. Homoptera consisted mostly of species of the families Cicadellidae and Aphidoidea. Table 1. Median numbers caught of Hymenoptera, Heteroptera, Diptera, Annelida and larvae of Coleoptera and Diptera in pitfall traps over four weeks. Order Median Lowest Highest Hymenoptera 25 6 56 Homoptera 14 5 76 Diptera 14 5 23 Annelida 7 1 32 Coleoptera larvae 5 1 13 Diptera larvae 10 1 38
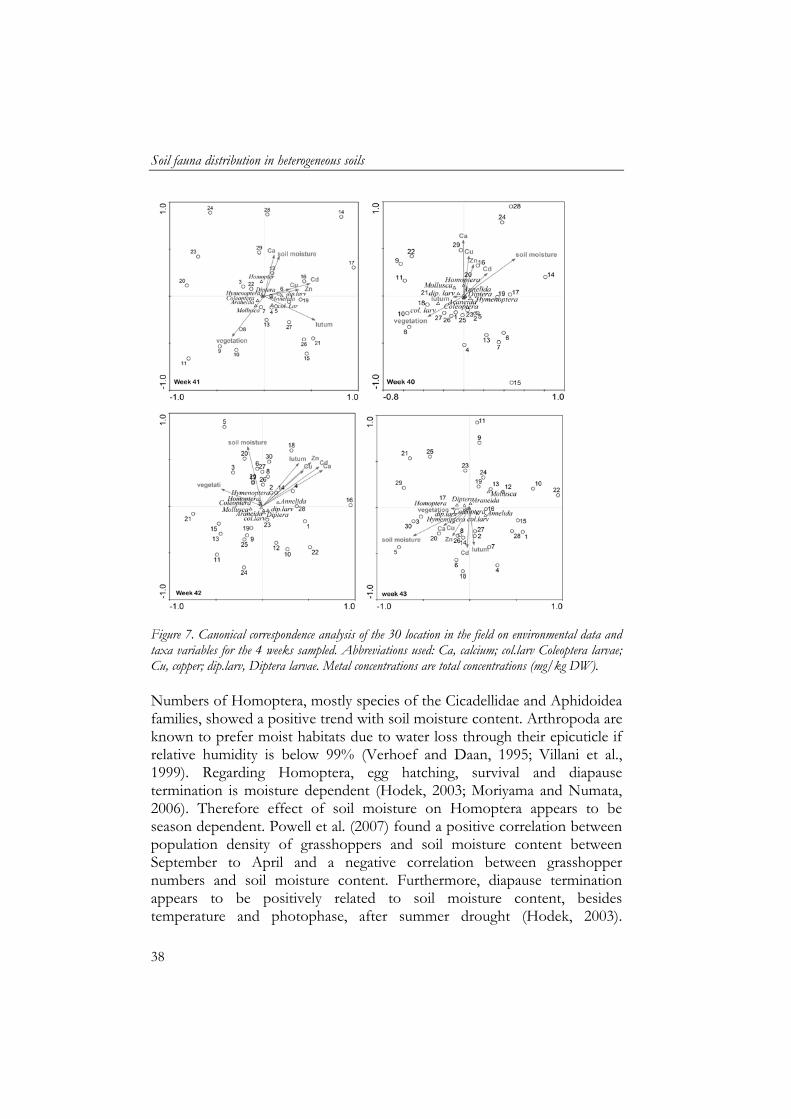
Only a few millipede species were caught in the floodplain, being Polydesmus denticulatus (20 ind.) and Brachyiulus pusillus (1 ind.). All but one of these specimens were found in the last 2 weeks of sampling. The caught individuals were located next to the enclosures in the grassland and in the north-eastern part of the grassland. Isopods were more abundant, but still in low numbers, Trachelipus rathkii (7 ind.), Philoscia muscorum (1 ind.), Hyloniscus riparius (2 ind.). Two centipedes species were present, Lamyctes fulvicornis (60 ind.) and Lithobius curtipes (4 ind.). Also amphibian species were caught in the pitfalls, including Rana esculenta (11 ind.), Triturus vulgaris (5 ind.), Triturus cristatus (4 ind.) and Bufo bufo (1 ind.). The amphibian species were caught throughout the grassland and did not show a distinct distribution pattern. The biplots of the canonical correlation analyses (Figure 7) showed that vegetation and soil moisture content explained most of the variation found and were therefore the two main factors of the two first axes explaining 28 to 56% of the variation found. Only in week 43, the first axes was significant in explaining the macrofauna distribution (being 56%). Individual correlations showed that Hymenoptera was positively correlated in week 41 with soil water content (r = 0.407, P = 0.029) and clay (r = 0.405, P = 0.029). Vegetation showed positive correlations with Coleoptera in week 40 (r = 0.377, P = 0.044), and negatively with Annelida (wk 42, r = -0.398, P = 0.033) and Diptera larvae (wk 43, r = -0.402, P = 0.028). In week 43, both Coleoptera and Araneida showed a correlation with the Y coordinate (r = -0.377, P = 0.040; r = -0.566, P = 0.010 respectively) implying that more specimens were caught in the south than in the north of the grassland.
Correlations between species were frequently found of which Araneida and Coleoptera, Coleoptera and Hymenoptera, Araneida and Hymenoptera were observed twice in the 4 weeks of observations (all P <
Chapter 2
37
0.05). Annelida and Coleoptera larvae both showed negative correlations with Hymenoptera and Homoptera, although being it in different weeks (42 and 43 respectively). Discussion The river floodplain grassland contains locations where zinc concentrations exceed the Dutch risk assessment level 4, which stands for high ecological risk (VROM, 2000). Zinc concentrations were positively correlated with other heavy metal concentrations. This is in accordance with results of Middelkoop (1997) who found strong correlations between metal concentrations, and clay content and metal concentrations. Furthermore, this author found a strong negative relationship between field height and metal concentrations. This was not observed in our field, as the low southern part of the field showed low metal concentrations. These low concentrations are due to the geomorphological differences of the soil, as the south part of the grassland used to be a bank of the river side channel (Schoor, 1994). The soil characteristics of the old side channel bank showed a higher content in sand and contain therefore lower metal concentrations. This resulted in relatively high heterogeneity in the south part of the grassland and therefore the geomorphological history of floodplain grassland should be taken into account with sampling strategy on soil characteristics to prevent a potential underestimation of heterogeneity in soil characteristics. In general, the numbers of invertebrates caught were similar to other temperate grasslands that were subject to grazing (Curry, 1994). Correlation analyses showed that Diptera larvae and Annelida were negatively correlated with vegetation. As horses grazed in the grassland there were no pitfall traps placed in completely low vegetation to prevent trampling. Therefore, most Diptera larvae and Annelida were caught at locations with low-medium height in vegetation where horses grazed more intensely compared to the high vegetation. In general, Diptera larvae and Annelida are found to be positively related to soil moisture content and input of dead organic matter (Frouz, 1999; De Bruyn et al., 2001). It could well be that extra input of dead organic matter was caused due to horses dropping grass while grazing and input of horse manure. We must note that Diptera larvae and Annelids are soil dwellers and the pitfall capture method is not optimal for capturing soil dwelling fauna (Krebs, 1989).
Soil fauna distribution in heterogeneous soils
38
Figure 7. Canonical correspondence analysis of the 30 location in the field on environmental data and taxa variables for the 4 weeks sampled. Abbreviations used: Ca, calcium; col.larv Coleoptera larvae; Cu, copper; dip.larv, Diptera larvae. Metal concentrations are total concentrations (mg/kg DW). Numbers of Homoptera, mostly species of the Cicadellidae and Aphidoidea families, showed a positive trend with soil moisture content. Arthropoda are known to prefer moist habitats due to water loss through their epicuticle if relative humidity is below 99% (Verhoef and Daan, 1995; Villani et al., 1999). Regarding Homoptera, egg hatching, survival and diapause termination is moisture dependent (Hodek, 2003; Moriyama and Numata, 2006). Therefore effect of soil moisture on Homoptera appears to be season dependent. Powell et al. (2007) found a positive correlation between population density of grasshoppers and soil moisture content between September to April and a negative correlation between grasshopper numbers and soil moisture content. Furthermore, diapause termination appears to be positively related to soil moisture content, besides temperature and photophase, after summer drought (Hodek, 2003).
Chapter 2
39
Therefore the higher numbers of Homoptera found in this study are likely due to the high soil moisture content in October. Numbers of Araneida did not show any correlations with soil characteristics and vegetation. Highest numbers were found in high vegetation areas in the centre of the grassland. Lower numbers were caught at the edge of the field, which was reflected in the remarked drop in variation at large distance in the semi-variogram. Other studies show that the Araneida numbers caught in the centre of the field were within normal range of temperate grasslands (Curry, 1994). Coleoptera had a similar distribution to Araneida but a second hotspot was in the southern part of the field. Abundances of species and vegetation did not seem to be affected by contamination. Although the total concentrations of the contaminants were high, results from other studies in the river floodplains of the river Waal indicated low bioavailability of the contamination. Hobbelen et al. (2004) found total metal concentration of 1140 mg/kg zinc, but the CaCl2 extractable fraction of zinc was only 0.81 mg/kg. Measurements of Zorn (2004) in the same grassland as this study showed CaCl2 extractable fraction of 10-66 μg/kg at locations with a total Zn concentration of 500 mg/kg. This low availability of the contamination is probably due to the ageing of the contamination in the soil and the high pH, clay and organic matter content of the soil (Ritchie and Sposito, 1995; Middelkoop, 1997). Overall, soil water content and vegetation explained most of the variation in soil fauna between sites. Although vegetation showed a distinct pattern in the field it was not correlated to abiotic characteristics, as the grazing of the horses was mostly affecting the vegetation pattern. Grazing alters floral composition and vegetation height leading to structurally heterogeneous sward and a change in micro-climate and all these factors are known to affect invertebrate distribution in the field (Curry, 1994; Dennis et al., 1998). Therefore, any potential effect of contamination on soil fauna distribution was most likely out-scaled by the natural effects of grazing on soil fauna and vegetation cover and their interactions. Temporal dynamics Over the four week, Coleoptera numbers caught remained similar. However, for Diptera, Homoptera, Hymenoptera and Araneida, the number of specimens caught were decreasing with time. This was most probably due to the decreasing temperatures in October 2000 (KNMI,
Soil fauna distribution in heterogeneous soils
40
2000), and hence the decrease in activity of these species. In contrast, the millipede Polydesmus denticulatus was mostly caught in the last 2 weeks of the sampling period. This could be due to the relative wet conditions in the grassland after considerable amount of rain had fallen in the first 2 weeks (44 mm, KNMI, 2000). In the last week of sampling, Coleoptera and Araneida moved southwards in the field, probably due to the wet conditions in the north of the field. October had 61 mm rain during the 4 weeks of monitoring (KNMI, 2000) and the average evaporation of grasslands in October is 17 mm per month in the Netherlands (Massop et al., 2005). Therefore the soil in the northern part was highly saturated with water, while in the southern part there seemed less water saturation probably due to the lower clay content in the soil, and therefore a higher infiltration rate. Conclusions Vegetation and soil water content were the two main factors explaining part of the variation found in macrofauna. Abundances of species and vegetation were not affected by contamination which was most probably due to the low bioavailability of the contamination. Any potential effect of contamination on soil fauna was most likely out-scaled by the natural effects of grazing, vegetation cover and soil water content. The temporal dynamics showed that to have a proper assessment of species’ presence and abundances, one has to sample for consecutive weeks to ensure optimal capturing of the species present due to climatic fluctuations. Acknowledgements We thank Martin Konert for his support on the soil particles size analyses. The investigations were supported by the Research Council for Earth and Life Sciences (ALW) with financial aid from the Netherlands Organisation for Scientific Research (NWO) and the Dutch Ministry of Agriculture, Nature and Food Quality (BO-01-002-204). Matty P. Berg was financially supported by the Royal Dutch Academy of Arts and Sciences (KNAW).

Chapter 3
41
3 The effect of vertically heterogeneous contamination on the detritivore annelid community in a river floodplain soil

Chapter 3
43
3 The effect of vertically heterogeneous contamination on the detritivore annelid community in a river floodplain soil
D.A. Heemsbergenab, J.R. van Halab, J.H. Faber a, M.P. Bergb, N.M. van Straalenb and H.A. Verhoefb
a Alterra, Wageningen University and Research Centre, P.O. Box 47, 6700 AA Wageningen, The Netherlands
b VU University, Amsterdam, De Boelelaan 1085, 1081 HV Amsterdam, The Netherlands
Abstract The distribution of soil organisms, such as earthworms and enchytraeids, is affected by variation in soil characteristics, both spatially and temporally. Soil contamination can negatively influence the quality of microhabitats, and consequentially may affect the vertical distribution of soil organisms. The aim of this study was to test the hypotheses that vertically heterogeneous soil contamination affects (i) the vertical stratification of detritivore annelids, (ii) earthworm species composition and (iii) the relative abundances of earthworms. We tested these hypotheses using a field study in a grassland floodplain soil which showed four distinct patterns in vertical profiles in soil contamination. The selected sites were a relatively uncontaminated profile, a site with a contaminated soil layer at 15-40 cm depth, a site with a contaminated soil layer at 5-20cm and a completely contaminated soil profile.
Over three years of monitoring at the four sites with different contamination profiles, differences in vertical stratification of earthworms and enchytraeids were observed, but this was linked to season and not to vertical stratification of contamination. Total earthworm biomass was similar but species-specific differences in biomass between contamination profiles did occur. Aporrectodea caliginosa showed higher biomass in less contaminated sites. Allolobophora chlorotica had higher biomass in more contaminated sites which was most likely due to more optimal soil water content. Soil organic matter content in top soil layers was higher at the fully contaminated site than the reference site but did not result in higher earthworm biomass at the fully contaminated site. The lack of effect of high contamination on the detritivore annelids could be explained by the low
The effect of vertically heterogeneous contamination
44
bioavailability of the contaminants. Power analyses showed that biomass of A. caliginosa, A. chlorotica and total biomass of earthworm species in autumn were more robust than biomass of Lumbricus rubellus and therefore less replication is needed for these species to detect significant differences. Keywords: spatial heterogeneity, river floodplain, earthworms, enchytraeids, detritivores, soil contamination, bioavailability Introduction The soil is a heterogeneous environment. Many soil characteristics vary significantly both spatially and temporally. On a local scale, it is this variation in abiotic and biotic factors that will affect spatial patterning of soil organisms (Ettema and Wardle, 2002; Bardgett et al., 2005). In many studies, a significant vertical structure in soil fauna abundance, biomass and species composition is observed in soils (Faber and Joosse, 1993; Berg et al., 1998; Sadaka and Ponge, 2003; Berg and Bengtsson, 2007). This vertical stratification coincides with changes in the quantity and quality of soil organic matter with soil depth, and with strong gradients in soil temperature and humidity over a relatively small spatial scale (Berg and Bengtsson, 2007). Furthermore, soil processes also show vertical heterogeneity as they result from biotic interactions. Litter decomposition, nutrient mineralisation, and humus formation e.g. can all be characterised by sequential steps typically staged at various depths in the soil (Faber and Verhoef, 1991; Berg et al., 1998). Therefore, environmental variables affecting vertical stratification of species can also lead to changes in soil ecosystem functioning.
Soil organisms can avoid certain locations in the soil profile if conditions do not match their habitat requirements, either in terms of resource availability or ecophysiological conditions. Therefore avoidance can lead to locally different soil community compositions. Besides food, soil characteristics, like pH, organic matter content, calcium availability and microclimatic conditions, the vertical spatial distribution of soil organisms can also be affected by the presence of contaminants. These contaminants may occur at a specific depth in the soil, for instance when a period of sedimentation of contaminated material is followed by a period of sedimentation of relatively uncontaminated material. Soil characteristics and contaminants can interact, for instance clay content or organic matter content have a strong effect on bioavailability and chemical speciation of contaminants. This interaction may lead to a locally different exposure regime to organisms in the soil profile (Marinussen and van der Zee, 1996;
Chapter 3
45
Janssen et al., 1997; Kooistra et al., 2003), and may lead to altered vertical stratification patterns of specific species. Surface dwelling species, such as larger beetles, snails and epigeic earthworms may not be affected by contamination that occurs deeper in the soil profile, whereas burrowing and deep-living species (anecic and endogeic earthworms, and enchytraeids) could be at risk due to exposure to high levels of contaminants.
Floodplain soils show a large environmental heterogeneity in contamination. Contaminated sediments have been deposited in the course of decades and consist of heavy metals, PAHs, mineral oils and PCBs in concentrations often exceeding Dutch intervention values (Middelkoop, 1997; Thonon, 2006). The highest concentrations of contaminants have been deposited during 1930–1970s and are at present mostly located at a depth of 10–35 cm. Due to spatial differences in sedimentation and erosion rates, this contaminated layer can be absent or variably positioned in the top soil and in the subsoil thereby creating strong heterogeneity in microhabitat quality at small horizontal and vertical scales. However, the effect of the heterogeneity in microhabitat quality on soil dwelling fauna species in floodplain soils is not known.
In this study, we have tested the hypotheses that vertically heterogeneous soil contamination affects (i) the vertical stratification of detritivore annelids, (ii) earthworm species composition and (iii) the relative abundances of earthworms. We have assessed changes in the vertical distribution of species composition of earthworms and relative abundances of earthworms and enchytraeids using a field monitoring study situated in a river floodplain which showed four distinct profiles in the vertical stratification of contaminants. Materials and Methods The study location was a grassland in the river floodplain Afferdense and Deestse Waarden (51˚54'N, 5˚39'E) of the river Waal, a contributory of the river Rhine. At an altitude of 8 m above sea level, the floodplain inundates almost every year up to three months in winter and/or spring. In a prior study on heterogeneity in contamination, four sites with different contamination profiles were identified. The selected sites had: a relatively uncontaminated profile (referred to as Reference), a contaminated soil layer at 15-40 cm depth (referred to as Cont. bottom), a contaminated soil layer at 5-20 cm (referred to as Cont. top) and a completely contaminated soil profile (referred to as Full cont.). These four different sites are located 40-120 meters apart, in a rather homogeneous floodplain area regarding plant community and altitude. The relatively uncontaminated site was considered
The effect of vertically heterogeneous contamination
46
a reference situation for this type of floodplain grassland as its level of contamination, being on average 305 mg/kg Zn (Figure 1a), is relatively low for floodplains soils, widespread and will not be remediated as concentrations are below intervention values (VROM, 2000). Dutch target values for these soils range from 120-144 mg/kg zinc, while intervention values at which 50% of the species present are considered to be exposed above their NOEC are 598-728 mg/kg. Furthermore, this reference site had similar sub-climatic conditions, plant community and inundation periods to the other sites as it was on a similar altitude and embankment. Soil measurements Soil physico-chemical characteristics measured were pH, soil moisture, organic matter, clay and metal content, and were sampled every 5 cm till a depth of 40 cm. Clay content was measured once in 2001 as an earlier study showed low variation in clay content on a horizontal scale. Acidity was measured once in 2001 to ensure all sites were not acidic as this could affect earthworm biomass. Metal content was measured in 2001 and 2003. Moisture and water content were measured each season except for May 2002.
Moisture content (w/w) was determined by drying moist soil for 24 hours at 60 ºC. Soil organic matter content was measured by ash furnacing of 20 g dry soil at 550 ˚C for three hours. The pH (H2O) was measured in a mixture of 5 g dry soil in 25 mL demineralised water. Total soil metal concentrations were determined by digesting 1 g dry soil in a mixture of H2O, concentrated HNO3 (65%) and HCl (37%) at a volume ratio of 1:1:4 using a MARS5 microwave (Bongers, 2007). Quality control was maintained by digesting reference samples (SETOC, Wepal). The measured zinc concentrations did not deviate more than 10% from the certified reference value. All zinc extracts were analysed using flame Atomic Absorption Spectrometry (Perkin Elmer 1100B AAS). Soil samples of 0-10 cm were analysed for organic and inorganic contaminants, including polychlorinated biphenyls (PCB) and polycyclic aromatic hydrocarbon (PAH), by Eurofins-analytico Milieu BV, Barneveld, the Netherlands. Eurofins-analytico uses their own protocols with quality assurance certifications (including ISO 9001 and Sterlab). Polycyclic aromatic hydrocarbons were extracted using acetone and analysed using HPLC with UV fluorescent detection. Polychlorinated biphenyls were detected using GCMS. Metals were analysed using aqua region digestion and analysed on ICP-AES and ICP-MS.
Chapter 3
47
Soil samples for soil particle size analyses were pre-treated to remove organic matter (using H2O2) and carbonates (using HCl) to obtain only mineral soil particles and then analysed for size fractions using laser diffraction (Konert and van den Berghe, 1997). Mats of artificial grass were used as sedimentation traps (25x25 cm) to collect deposited sediment during inundation (Thonon, 2006). Mats were placed in duplicate, 5 m apart, in January 2002 at all four sites before inundation. After inundation, mats were transported to the laboratory where they were air-dried, sediment was washed off and air-dried after which organic matter content of sediment was measured by ash furnacing of 5 g at 550 ˚C for three hours (Thonon, 2006). Earthworm and enchytraeid sampling Sampling of earthworms and enchytraeids took place in May/June (week 21-23) and October (week 41-43) for three consecutive years. We measured temporal variation in detritivore fauna community composition and abundance to include the effect of fluctuating inundation periods, hence, temporal food deprivation combined with toxicological stress. The grassland is enclosed by dikes and a substantial amount of water remains after flooding, which has to evaporate or infiltrate into the soil. Therefore each sampling period was at least one month after inundation. Earthworms were sampled by hand-sorting of soil cores (25x25 cm) at 3 depths: 0–5, 5–15 and 15-40 cm and determined to species level (van Rhee, 1970). Enchytraeids were sampled by Baerman wet funnel extraction of soil cores (100 cm3) at 0–5, 5–10, 10–15 and 15–20 cm depth (Didden et al., 1994). Statistics As each soil profile only occurred once in the grassland, there was no replication of contamination profiles. Each profile was monitored for enchytraeids and earthworms in spring and autumn for 3 consecutive years. Biomass data of earthworms and enchytraeids were analysed using GLM ANOVA for each variable separately, with year and season as covariates. The effect of vertical stratification of contamination on depth distribution of earthworm biomass, soil organic matter content and moisture content were analysed using general linear models repeated measurements (GLM RM) for each variable separately, whereby depth was the within-subject factor, the years used as replicates and year and season were covariates. Soil water content was also analysed per season separately using GLM RM with years as replicates. Differences between sedimentation variables were analysed using the Student’s t test. Correlations between variables were
The effect of vertically heterogeneous contamination
48
analysed using Pearson correlation analyses. To assess the robustness of the biological variables and therefore their suitability for biological monitoring, power and sample size analyses were performed using the data of the reference site. Settings for power analyses were P = 0.05 for type I and power = 0.80. The sample size calculation is based on a normal distribution, equal variance and equal sample size for control and the treatment group. All statistical analyses were done in SPSS v. 16.0, while the power analyses were done using Excel. Results Soil characteristics The reference site showed a zinc concentration of 305 ± 120 mg/kg (average of soil profile, Figure 1a). The site with contamination throughout the soil profile had a more than doubled concentration for zinc of 675 ± 335 mg/kg compared to the reference site (Figure 1d). The soil profiles of the reference site, the fully contaminated site and the site with the contamination at the top showed little variation regarding zinc concentrations between the two samplings in 2001 and 2003. The top of the contaminated layer was varying in depth between 10 and 20 cm at the site where the contamination is situated deep in the soil profile (Figure 1b). The variance in depth of this layer resulted in a larger difference in total concentrations zinc at 10-15 and 15-20 cm depth. Other metals and the sum of PAH contaminants present in the 0-10 cm of the soil profile have much lower concentrations in the reference site than in the fully contaminated site (Table 1). Clay contents of the soil ranged from 8.5-24% and showed no distinctive pattern over the soil profile (Figure 2a). Clay contents were slightly lower in the reference site as to the other sites at 0-20 cm depth. The acidity of the soils (Figure 2b) was neutral to basic due to the buffering capacity of the soil; calcium contents were 5.9–23 g/kg.
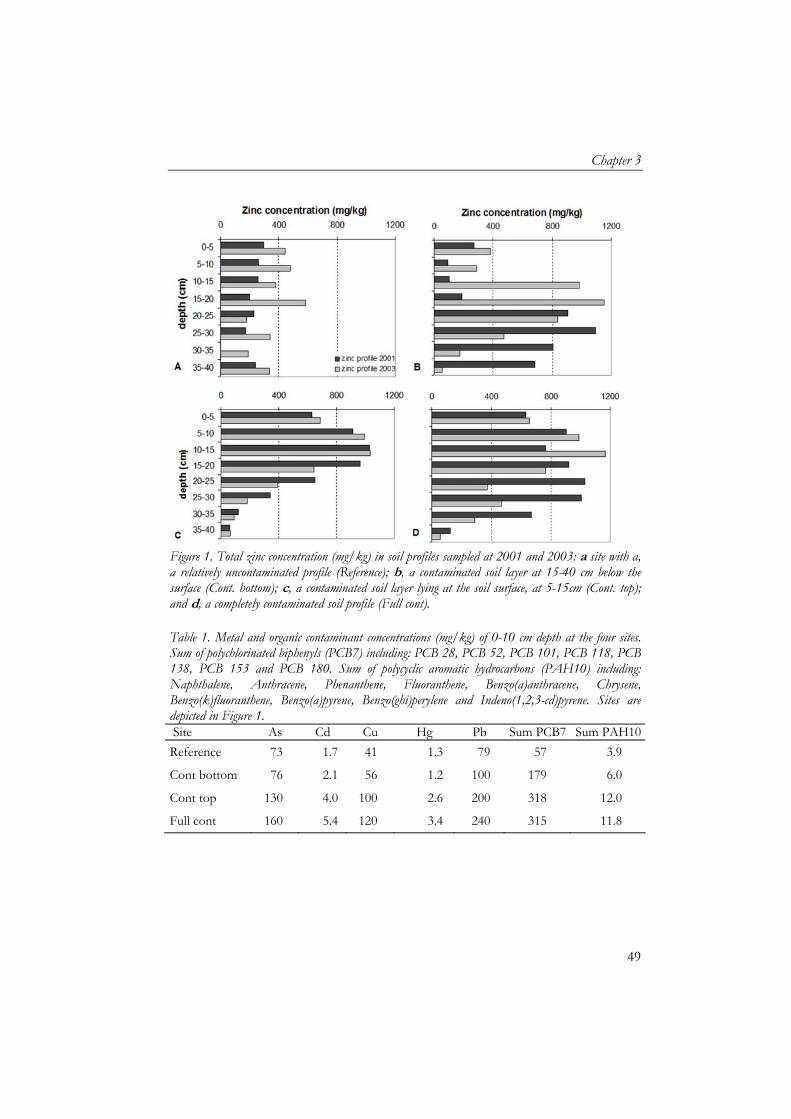
Chapter 3
49
Figure 1. Total zinc concentration (mg/kg) in soil profiles sampled at 2001 and 2003: a site with a, a relatively uncontaminated profile (Reference); b, a contaminated soil layer at 15-40 cm below the surface (Cont. bottom); c, a contaminated soil layer lying at the soil surface, at 5-15cm (Cont. top); and d, a completely contaminated soil profile (Full cont). Table 1. Metal and organic contaminant concentrations (mg/kg) of 0-10 cm depth at the four sites. Sum of polychlorinated biphenyls (PCB7) including: PCB 28, PCB 52, PCB 101, PCB 118, PCB 138, PCB 153 and PCB 180. Sum of polycyclic aromatic hydrocarbons (PAH10) including: Naphthalene, Anthracene, Phenanthene, Fluoranthene, Benzo(a)anthracene, Chrysene, Benzo(k)fluoranthene, Benzo(a)pyrene, Benzo(ghi)perylene and Indeno(1,2,3-cd)pyrene. Sites are depicted in Figure 1.
Site As Cd Cu Hg Pb Sum PCB7 Sum PAH10
Reference 73 1.7 41 1.3 79 57 3.9
Cont bottom 76 2.1 56 1.2 100 179 6.0
Cont top 130 4.0 100 2.6 200 318 12.0
Full cont 160 5.4 120 3.4 240 315 11.8
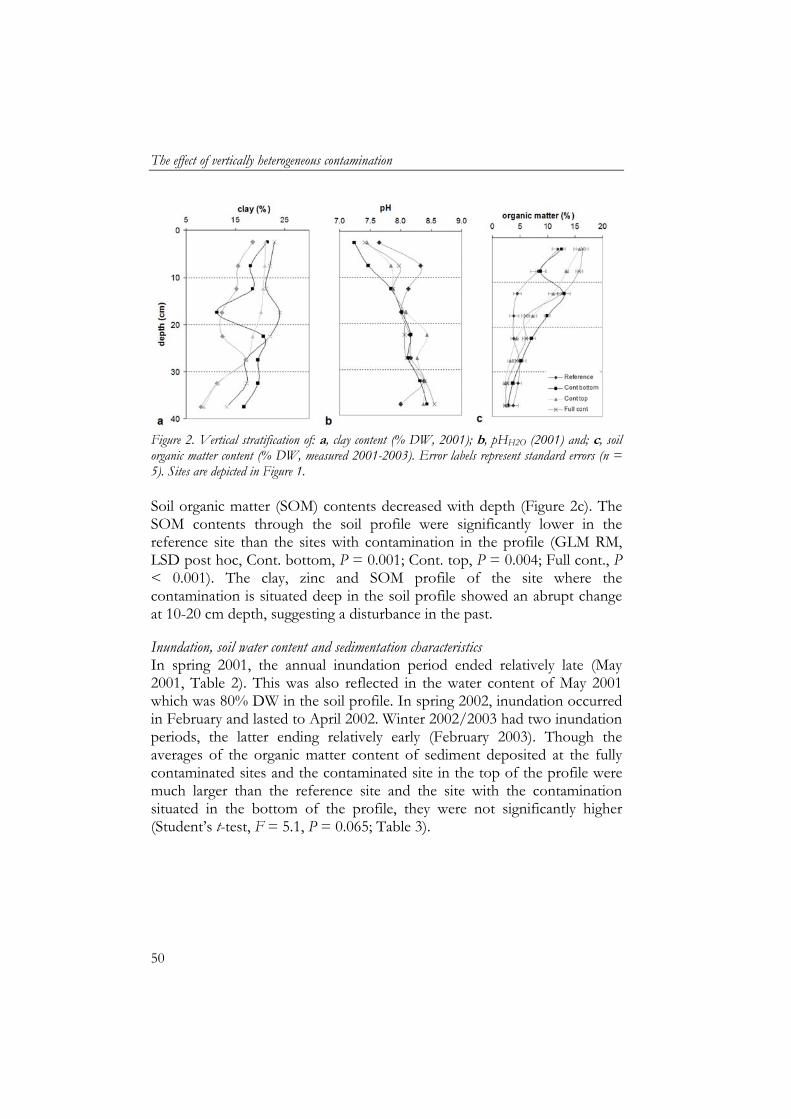
The effect of vertically heterogeneous contamination
50
Figure 2. Vertical stratification of: a, clay content (% DW, 2001); b, pHH2O (2001) and; c, soil organic matter content (% DW, measured 2001-2003). Error labels represent standard errors (n = 5). Sites are depicted in Figure 1. Soil organic matter (SOM) contents decreased with depth (Figure 2c). The SOM contents through the soil profile were significantly lower in the reference site than the sites with contamination in the profile (GLM RM, LSD post hoc, Cont. bottom, P = 0.001; Cont. top, P = 0.004; Full cont., P < 0.001). The clay, zinc and SOM profile of the site where the contamination is situated deep in the soil profile showed an abrupt change at 10-20 cm depth, suggesting a disturbance in the past. Inundation, soil water content and sedimentation characteristics In spring 2001, the annual inundation period ended relatively late (May 2001, Table 2). This was also reflected in the water content of May 2001 which was 80% DW in the soil profile. In spring 2002, inundation occurred in February and lasted to April 2002. Winter 2002/2003 had two inundation periods, the latter ending relatively early (February 2003). Though the averages of the organic matter content of sediment deposited at the fully contaminated sites and the contaminated site in the top of the profile were much larger than the reference site and the site with the contamination situated in the bottom of the profile, they were not significantly higher (Student’s t-test, F = 5.1, P = 0.065; Table 3).
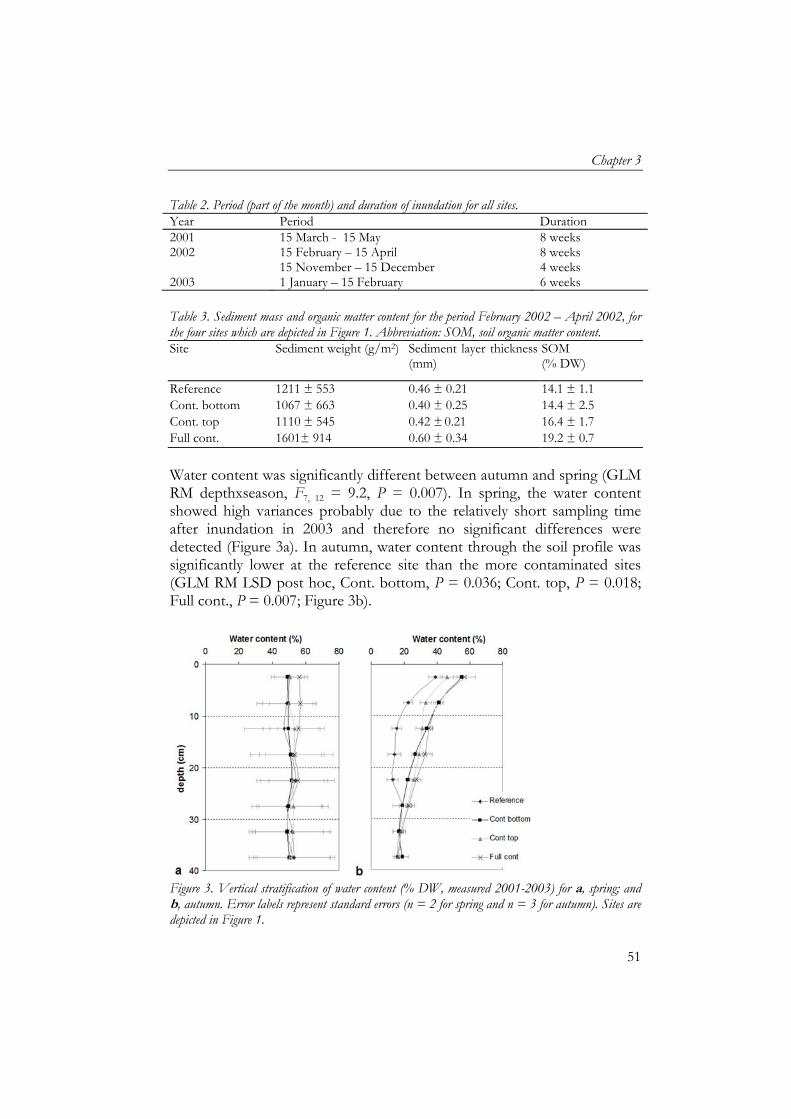
Chapter 3
51
Table 2. Period (part of the month) and duration of inundation for all sites. Year Period Duration 2001 15 March - 15 May 8 weeks 2002 15 February – 15 April 8 weeks 15 November – 15 December 4 weeks 2003 1 January – 15 February 6 weeks Table 3. Sediment mass and organic matter content for the period February 2002 – April 2002, for the four sites which are depicted in Figure 1. Abbreviation: SOM, soil organic matter content. Site Sediment weight (g/m2) Sediment layer thickness
(mm) SOM (% DW)
Reference 1211 ± 553 0.46 ± 0.21 14.1 ± 1.1 Cont. bottom 1067 ± 663 0.40 ± 0.25 14.4 ± 2.5 Cont. top 1110 ± 545 0.42 ± 0.21 16.4 ± 1.7 Full cont. 1601± 914 0.60 ± 0.34 19.2 ± 0.7
Water content was significantly different between autumn and spring (GLM RM depthxseason, F7, 12 = 9.2, P = 0.007). In spring, the water content showed high variances probably due to the relatively short sampling time after inundation in 2003 and therefore no significant differences were detected (Figure 3a). In autumn, water content through the soil profile was significantly lower at the reference site than the more contaminated sites (GLM RM LSD post hoc, Cont. bottom, P = 0.036; Cont. top, P = 0.018; Full cont., P = 0.007; Figure 3b).
Figure 3. Vertical stratification of water content (% DW, measured 2001-2003) for a, spring; and b, autumn. Error labels represent standard errors (n = 2 for spring and n = 3 for autumn). Sites are depicted in Figure 1.
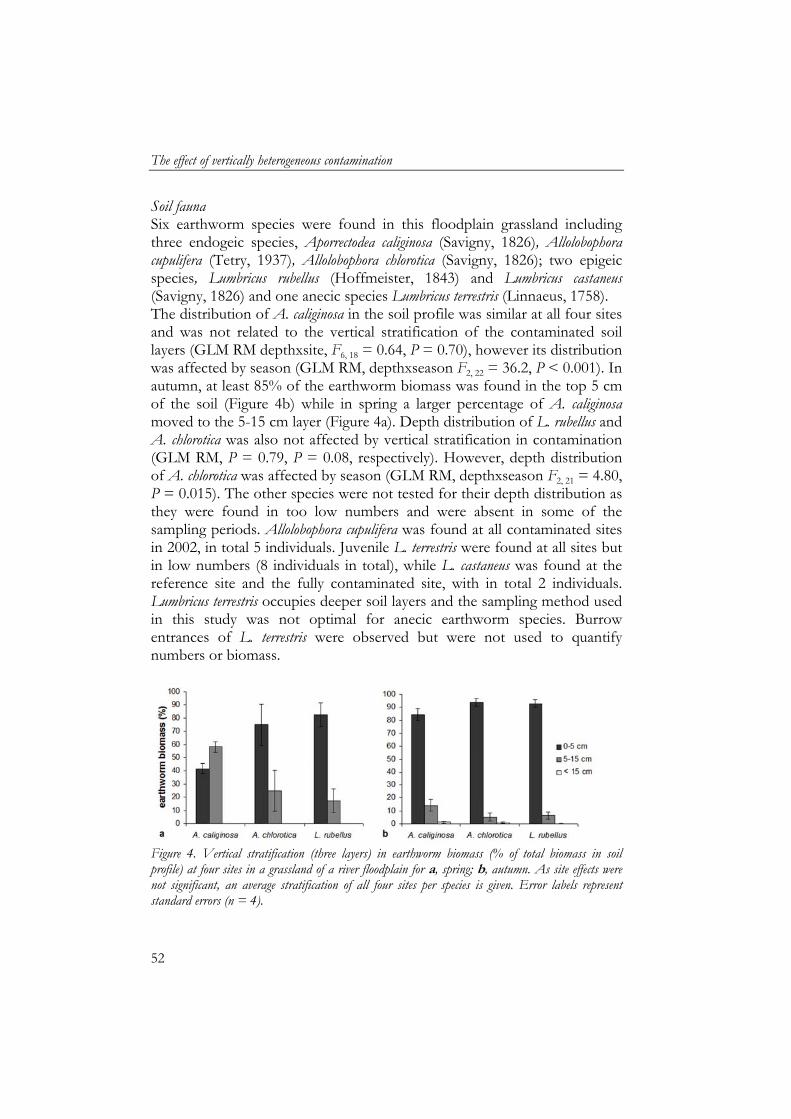
The effect of vertically heterogeneous contamination
52
Soil fauna Six earthworm species were found in this floodplain grassland including three endogeic species, Aporrectodea caliginosa (Savigny, 1826), Allolobophora cupulifera (Tetry, 1937), Allolobophora chlorotica (Savigny, 1826); two epigeic species, Lumbricus rubellus (Hoffmeister, 1843) and Lumbricus castaneus (Savigny, 1826) and one anecic species Lumbricus terrestris (Linnaeus, 1758). The distribution of A. caliginosa in the soil profile was similar at all four sites and was not related to the vertical stratification of the contaminated soil layers (GLM RM depthxsite, F6, 18 = 0.64, P = 0.70), however its distribution was affected by season (GLM RM, depthxseason F2, 22 = 36.2, P < 0.001). In autumn, at least 85% of the earthworm biomass was found in the top 5 cm of the soil (Figure 4b) while in spring a larger percentage of A. caliginosa moved to the 5-15 cm layer (Figure 4a). Depth distribution of L. rubellus and A. chlorotica was also not affected by vertical stratification in contamination (GLM RM, P = 0.79, P = 0.08, respectively). However, depth distribution of A. chlorotica was affected by season (GLM RM, depthxseason F2, 21 = 4.80, P = 0.015). The other species were not tested for their depth distribution as they were found in too low numbers and were absent in some of the sampling periods. Allolobophora cupulifera was found at all contaminated sites in 2002, in total 5 individuals. Juvenile L. terrestris were found at all sites but in low numbers (8 individuals in total), while L. castaneus was found at the reference site and the fully contaminated site, with in total 2 individuals. Lumbricus terrestris occupies deeper soil layers and the sampling method used in this study was not optimal for anecic earthworm species. Burrow entrances of L. terrestris were observed but were not used to quantify numbers or biomass.
Figure 4. Vertical stratification (three layers) in earthworm biomass (% of total biomass in soil profile) at four sites in a grassland of a river floodplain for a, spring; b, autumn. As site effects were not significant, an average stratification of all four sites per species is given. Error labels represent standard errors (n = 4).
Chapter 3
53
There were large differences in earthworm biomass observed between years in spring and autumn. Highest earthworm biomasses were found in October 2001, ranging from 155–175 g/m2, comparable for all four locations. Aporrectodea caliginosa showed higher biomass at the reference site than the three contaminated sites (GLM ANOVA, LSD pair-wise comparison, Cont. bottom, P = 0.041; Cont. top, P = 0.011; Full cont., P = 0.002; Figure 5a). Reduction in A. caliginosa biomass between autumn and spring the following year was similar at all four sites (GLM, F = 0.58, P = 0.66). Allolobophora chlorotica showed significantly higher biomass at the completely contaminated site than the other sites (GLM ANOVA, LSD pair-wise comparison, Reference, P < 0.001; Cont. bottom, P = 0.001; Cont. top, P = 0.029; Figure 5b). Lumbricus rubellus did not show any significant difference between sites (GLM ANOVA, F3, 20 = 0.58, P = 0.64, Figure 5c). Total earthworm biomass was also not affected by vertical stratification of contamination (GLM ANOVA, F3, 20 = 0.83, P = 0.49, Figure 5d). Reduction of earthworm biomass between autumn and spring the following year was similar at all four sites (GLM, F = 0.25, P = 0.86) and was also similar for species-specific biomass reductions (GLM, all P > 0.6). The vertical stratification of enchytraeids was not affected by the vertical stratification of contamination (GLM RM depthxsite, F9, 10 = 0.29, P = 0.97) but their stratification was significantly different between seasons (GLM RM depthxseason, F3,15 = 5.2, P = 0.004, Figure 6). In spring, a higher percentage of the enchytraeids was found in the top 5 cm of the soil profile than in autumn. The observed distribution is the inverse of the distribution of earthworms. Numbers of enchytraeids were highly variable between years with lowest numbers observed in May 2003 (Figure 7). However, vertical stratification of contamination did not affect total enchytraeid numbers (GLM, F3, 16 = 0.85, P = 0.49).
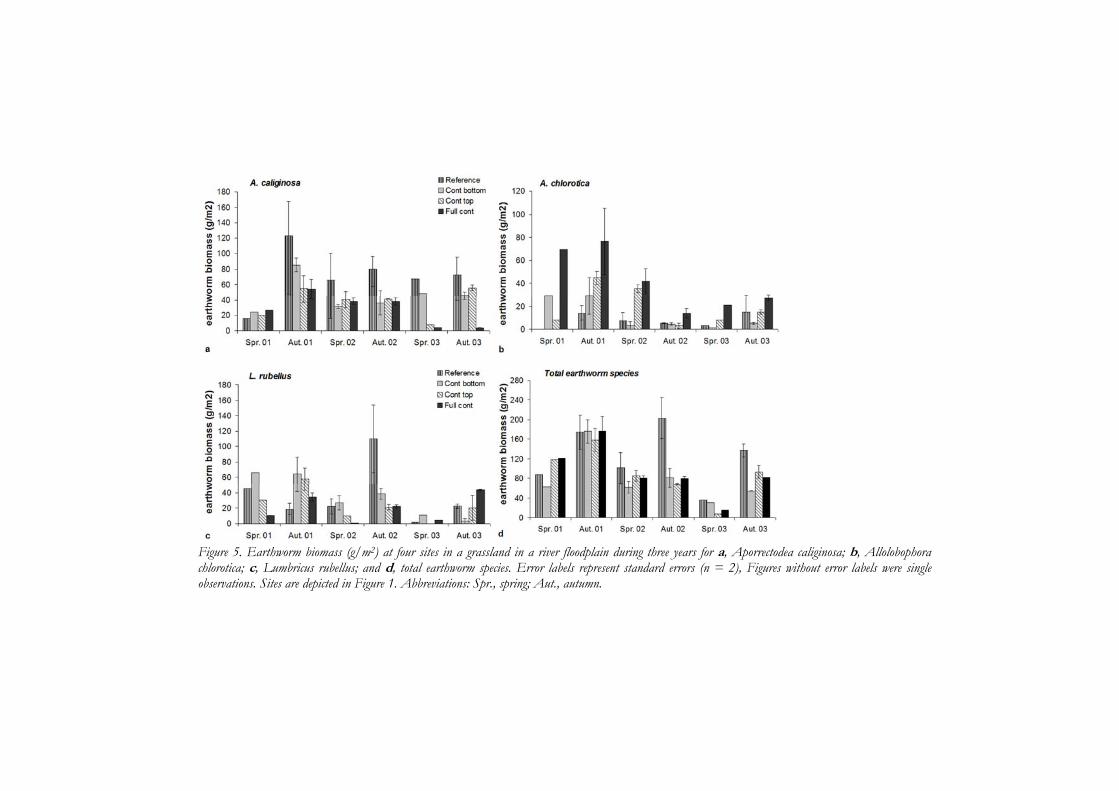
The effect of vertically heterogeneous contamination
54
Figure 5. Earthworm biomass (g/m2) at four sites in a grassland in a river floodplain during three years for a, Aporrectodea caliginosa; b, Allolobophora chlorotica; c, Lumbricus rubellus; and d, total earthworm species. Error labels represent standard errors (n = 2), Figures without error labels were single observations. Sites are depicted in Figure 1. Abbreviations: Spr., spring; Aut., autumn.
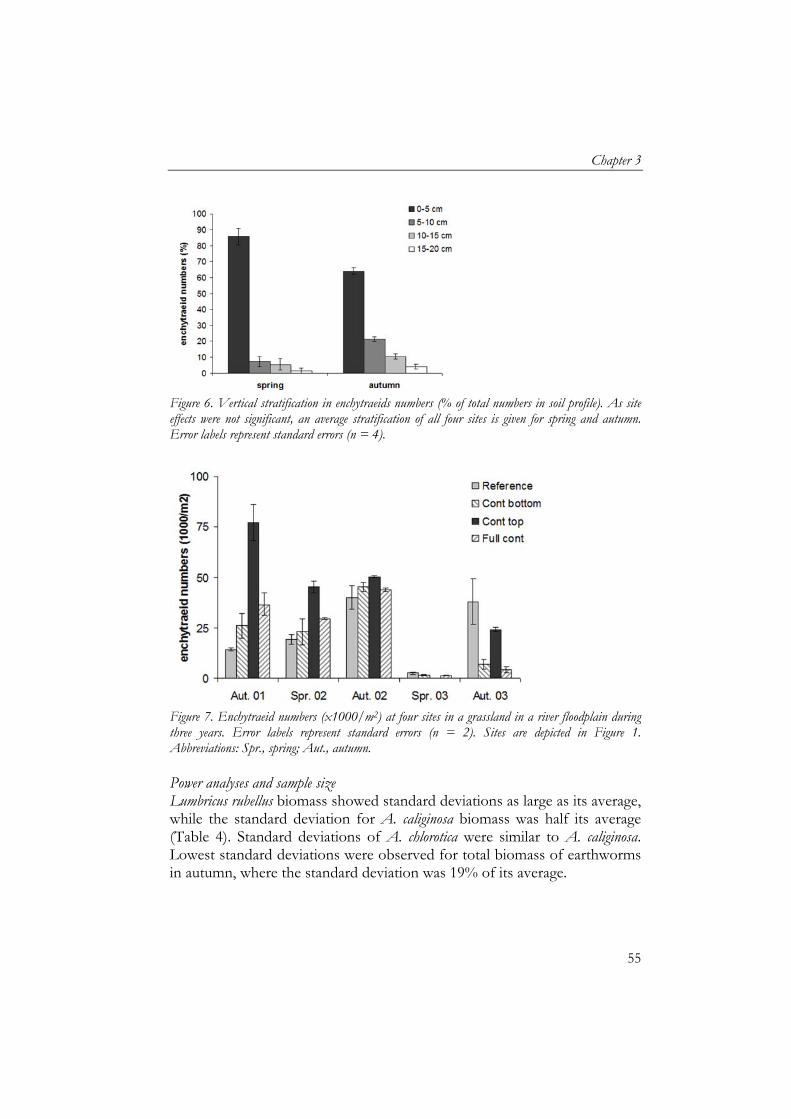
Chapter 3
55
Figure 6. Vertical stratification in enchytraeids numbers (% of total numbers in soil profile). As site effects were not significant, an average stratification of all four sites is given for spring and autumn. Error labels represent standard errors (n = 4).
Figure 7. Enchytraeid numbers (x1000/m2) at four sites in a grassland in a river floodplain during three years. Error labels represent standard errors (n = 2). Sites are depicted in Figure 1. Abbreviations: Spr., spring; Aut., autumn. Power analyses and sample size Lumbricus rubellus biomass showed standard deviations as large as its average, while the standard deviation for A. caliginosa biomass was half its average (Table 4). Standard deviations of A. chlorotica were similar to A. caliginosa. Lowest standard deviations were observed for total biomass of earthworms in autumn, where the standard deviation was 19% of its average.
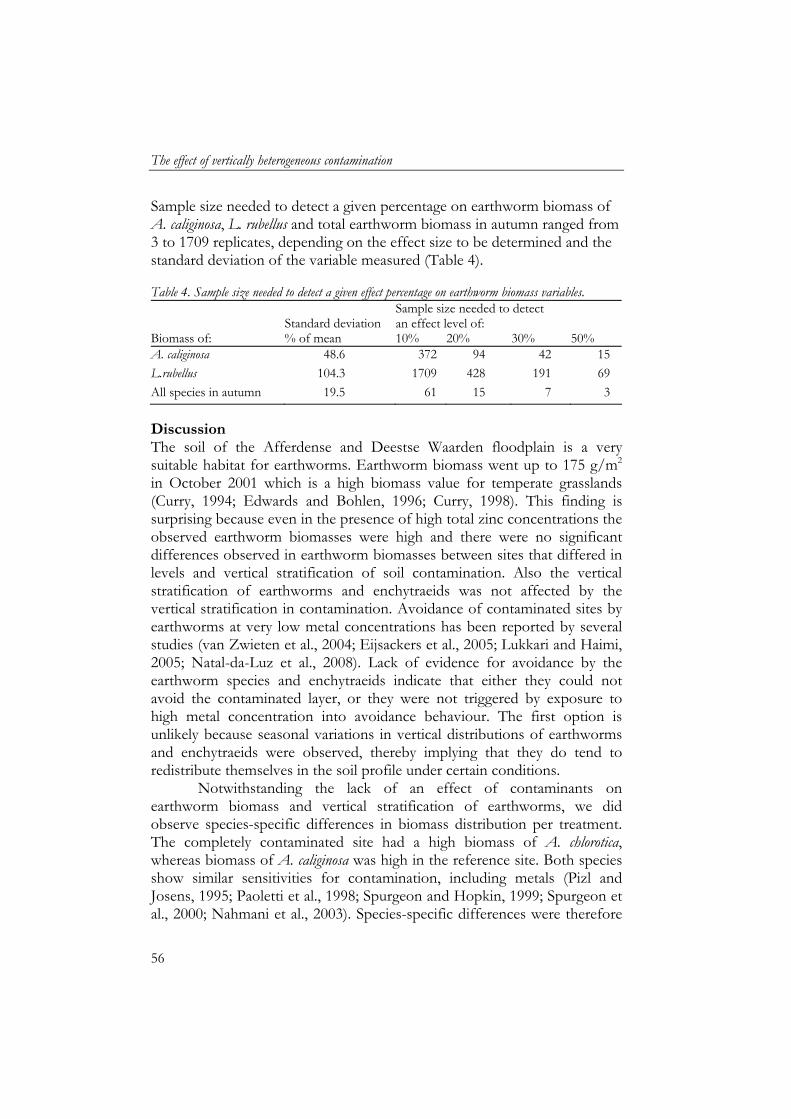
The effect of vertically heterogeneous contamination
56
Sample size needed to detect a given percentage on earthworm biomass of A. caliginosa, L. rubellus and total earthworm biomass in autumn ranged from 3 to 1709 replicates, depending on the effect size to be determined and the standard deviation of the variable measured (Table 4). Table 4. Sample size needed to detect a given effect percentage on earthworm biomass variables.
Standard deviation Sample size needed to detect an effect level of:
Biomass of: % of mean 10% 20% 30% 50% A. caliginosa 48.6 372 94 42 15
L.rubellus 104.3 1709 428 191 69
All species in autumn 19.5 61 15 7 3
Discussion The soil of the Afferdense and Deestse Waarden floodplain is a very suitable habitat for earthworms. Earthworm biomass went up to 175 g/m2
in October 2001 which is a high biomass value for temperate grasslands (Curry, 1994; Edwards and Bohlen, 1996; Curry, 1998). This finding is surprising because even in the presence of high total zinc concentrations the observed earthworm biomasses were high and there were no significant differences observed in earthworm biomasses between sites that differed in levels and vertical stratification of soil contamination. Also the vertical stratification of earthworms and enchytraeids was not affected by the vertical stratification in contamination. Avoidance of contaminated sites by earthworms at very low metal concentrations has been reported by several studies (van Zwieten et al., 2004; Eijsackers et al., 2005; Lukkari and Haimi, 2005; Natal-da-Luz et al., 2008). Lack of evidence for avoidance by the earthworm species and enchytraeids indicate that either they could not avoid the contaminated layer, or they were not triggered by exposure to high metal concentration into avoidance behaviour. The first option is unlikely because seasonal variations in vertical distributions of earthworms and enchytraeids were observed, thereby implying that they do tend to redistribute themselves in the soil profile under certain conditions.
Notwithstanding the lack of an effect of contaminants on earthworm biomass and vertical stratification of earthworms, we did observe species-specific differences in biomass distribution per treatment. The completely contaminated site had a high biomass of A. chlorotica, whereas biomass of A. caliginosa was high in the reference site. Both species show similar sensitivities for contamination, including metals (Pizl and Josens, 1995; Paoletti et al., 1998; Spurgeon and Hopkin, 1999; Spurgeon et al., 2000; Nahmani et al., 2003). Species-specific differences were therefore
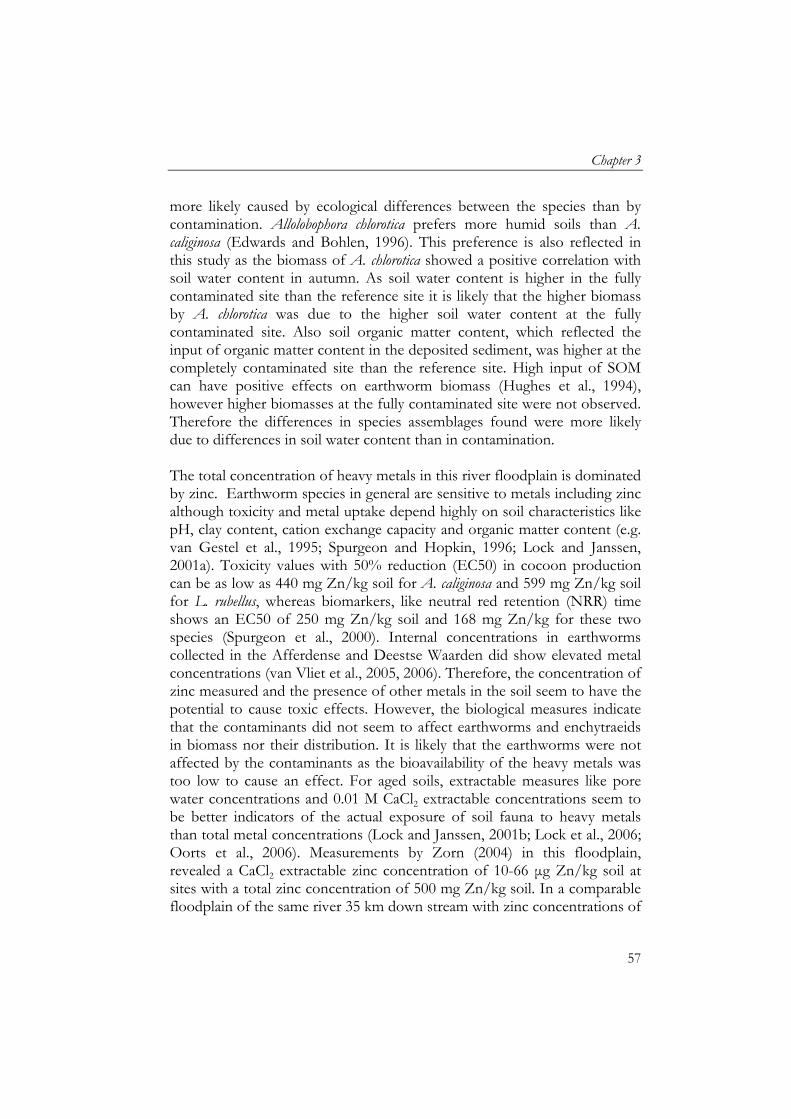
Chapter 3
57
more likely caused by ecological differences between the species than by contamination. Allolobophora chlorotica prefers more humid soils than A. caliginosa (Edwards and Bohlen, 1996). This preference is also reflected in this study as the biomass of A. chlorotica showed a positive correlation with soil water content in autumn. As soil water content is higher in the fully contaminated site than the reference site it is likely that the higher biomass by A. chlorotica was due to the higher soil water content at the fully contaminated site. Also soil organic matter content, which reflected the input of organic matter content in the deposited sediment, was higher at the completely contaminated site than the reference site. High input of SOM can have positive effects on earthworm biomass (Hughes et al., 1994), however higher biomasses at the fully contaminated site were not observed. Therefore the differences in species assemblages found were more likely due to differences in soil water content than in contamination. The total concentration of heavy metals in this river floodplain is dominated by zinc. Earthworm species in general are sensitive to metals including zinc although toxicity and metal uptake depend highly on soil characteristics like pH, clay content, cation exchange capacity and organic matter content (e.g. van Gestel et al., 1995; Spurgeon and Hopkin, 1996; Lock and Janssen, 2001a). Toxicity values with 50% reduction (EC50) in cocoon production can be as low as 440 mg Zn/kg soil for A. caliginosa and 599 mg Zn/kg soil for L. rubellus, whereas biomarkers, like neutral red retention (NRR) time shows an EC50 of 250 mg Zn/kg soil and 168 mg Zn/kg for these two species (Spurgeon et al., 2000). Internal concentrations in earthworms collected in the Afferdense and Deestse Waarden did show elevated metal concentrations (van Vliet et al., 2005, 2006). Therefore, the concentration of zinc measured and the presence of other metals in the soil seem to have the potential to cause toxic effects. However, the biological measures indicate that the contaminants did not seem to affect earthworms and enchytraeids in biomass nor their distribution. It is likely that the earthworms were not affected by the contaminants as the bioavailability of the heavy metals was too low to cause an effect. For aged soils, extractable measures like pore water concentrations and 0.01 M CaCl2 extractable concentrations seem to be better indicators of the actual exposure of soil fauna to heavy metals than total metal concentrations (Lock and Janssen, 2001b; Lock et al., 2006; Oorts et al., 2006). Measurements by Zorn (2004) in this floodplain, revealed a CaCl2 extractable zinc concentration of 10-66 μg Zn/kg soil at sites with a total zinc concentration of 500 mg Zn/kg soil. In a comparable floodplain of the same river 35 km down stream with zinc concentrations of
The effect of vertically heterogeneous contamination
58
1140 mg Zn/kg soil, Hobbelen et al. (2004) reported CaCl2 extractable concentrations only 0.81 mg Zn/kg soil, while pore water concentration was 97 μg/L. The CaCl2 extractable metal concentrations found by these studies are relatively low and the pore water concentrations reported are within the range of pore water concentrations found in relatively uncontaminated soils in The Netherlands (van Gestel et al., 1992). Robustness/sensitivity of biological variables Overall, ecological factors, like inundation or drought, had a strong effect on the biological variables measured and this is reflected in the strong variations in earthworm biomass between years. Years and seasons were taken therefore as covariates into the statistical analyses and frequently showed significant interactions with the variable measured. Biomass of earthworms in spring 2003 was relatively low. Low biomasses were not directly linked to inundation, however it was the coldest winter of the 3 years measured (KNMI, 2004). It has been reported that biomass of L. rubellus (Plum and Filser, 2005) and A. caliginosa (Ausden et al., 2001; Zorn, 2004) decrease during inundation. The study by Zorn (2004) was also situated in the Afferdense and Deestse Waarden floodplain in the same grassland and the same years. The difference in observations between our study and hers is probably due to the time of sampling as she sampled as close as possible before and after an inundation period, while our study includes full winter and thereby all season related stressors between sampling.
The strong effect of ecological factors could potentially obscure the effect of the contamination. Therefore we calculated the robustness of the biological variables to assess their effectiveness for biological monitoring. The preferred biological variable for field monitoring is sensitive to contaminants but also robust regarding other ecological variables and is therefore capable to detect differences and enables concrete comparisons between soils (Broos et al., 2005; Dawson et al., 2007). The biomass of the species L. rubellus was so variable between years that one has to question its robustness and therefore its effectiveness which is reflected in the high replicates necessary to detect differences between sites (Table 4). Species like A. caliginosa and A. chlorotica were more robust in this study, and indeed, differences between the reference site and the contaminated site for these species were detected. However, as described above, the effects found were subscribed to the difference in soil water content at the reference and contaminated site. Furthermore, differences in vertical stratification were also detected but were not caused by contamination but seasonal variation.
Chapter 3
59
Therefore the experimental setup had the strength to detect differences between sites and seasons but the effects were ecological and not due to contamination. The inhibiting effects of ecological factors like cold or drought on earthworm and enchytraeid biomass is a naturally occurring stressor. The presence of contamination therefore acts as a second stressor and may affect biomass during summer and winter extremes or affect recovery afterwards. Studies have shown that a stressed population is more vulnerable to contamination than a non-stressed population (Tobor-Kapłon et al., 2005; van der Wurff et al., 2007; Kools et al., 2008). However, even under such multiple stress situations in the winter months with cold and inundation, the contamination did not show an effect on earthworm biomass in spring. Therefore this study did not show negative effects of contamination, as a single or secondary stressor, on earthworm and enchytraeid biomass and behaviour. Conclusions Relatively sensitive species like A. caliginosa and A. chlorotica were present at highly contaminated sites in the river floodplain. However, differences in earthworm abundances were most likely due to variability in soil water content and not due to differences in soil contamination. Even an additional stressor, inundation, did not reveal contamination effects in a stress-on-stress situation. Earthworms did not avoid heavily contaminated sites, nor contaminated soil layers, but their vertical stratification was affected by seasonal variation. The absence of effects by the contaminants is most probably due to the low bioavailability of the contaminants. Acknowledgements We thank Martin Konert for his support on the soil particles size analyses, Ivo Thonon for his data on sedimentation rates, Gerard Driessen for statistical support and Annemariet van der Hout and Jos Bodt for assisting in determining the earthworm species. The investigations were supported by the Research Council for Earth and Life Sciences (ALW) with financial aid from the Netherlands Organisation for Scientific Research (NWO) and the Dutch Ministry of Agriculture, Nature and Food Quality (BO-01-002-204). Matty P. Berg was financially supported by the Royal Dutch Academy of Arts and Sciences (KNAW).

Chapter 4
61
4 Soil detritivores mitigate negative effects of contaminants on microorganisms

Soil detritivores mitigate negative effects of contaminants
62
Chapter 4
63
4 Soil detritivores mitigate negative effects of contaminants on microorganisms
D.A. Heemsbergena,b, J.R. van Hala,b, J.H. Faber a, M.P. Bergb and H.A. Verhoef b a Alterra, Wageningen University and Research Centre, P.O. Box 47, 6700
AA Wageningen, The Netherlands b VU University Amsterdam, De Boelelaan 1085, 1081 HV Amsterdam,
The Netherlands Abstract Soil processes, like C mineralisation, can be affected by soil contamination through disturbance of ecological interactions between soil fauna and microorganisms. In this study we have tested the hypotheses that vertically heterogeneous contamination affects soil fauna and microbial interactions and thereby soil process rates. The study consisted of a laboratory microcosm experiment with an epigeic and endogeic earthworm and an isopod species. Vertical heterogeneity in contamination did not affect behaviour of species which differed in their life history traits. Furthermore, interactions between macrofauna and microorganisms did not seem to be affected. Results indicated that microorganisms were more sensitive to the contaminants than soil fauna. The adverse effects of the contaminants on microbial activity were mitigated by soil fauna stimulating microbial activity. Keywords: Heavy metals, soil processes, soil ecosystem functioning, soil fauna, microorganisms Introduction As soil is a very heterogeneous environment, it creates a great variety of microsites with specific environmental conditions along horizontal and vertical scales providing favourable conditions for many species (Faber and Joosse, 1993; Berg et al., 1998; Sadaka and Ponge, 2003; Berg and Bengtsson, 2007). Soil animals and microflora specifically interact at various depths with respective differentiation in the resulting direction and magnitude of organic matter and nutrient fluxes (Faber, 1991; Berg et al., 2001). These interactions include microbial grazing by soil animals, incorporation of leaf litter at certain depths in the soil profile, bioturbation
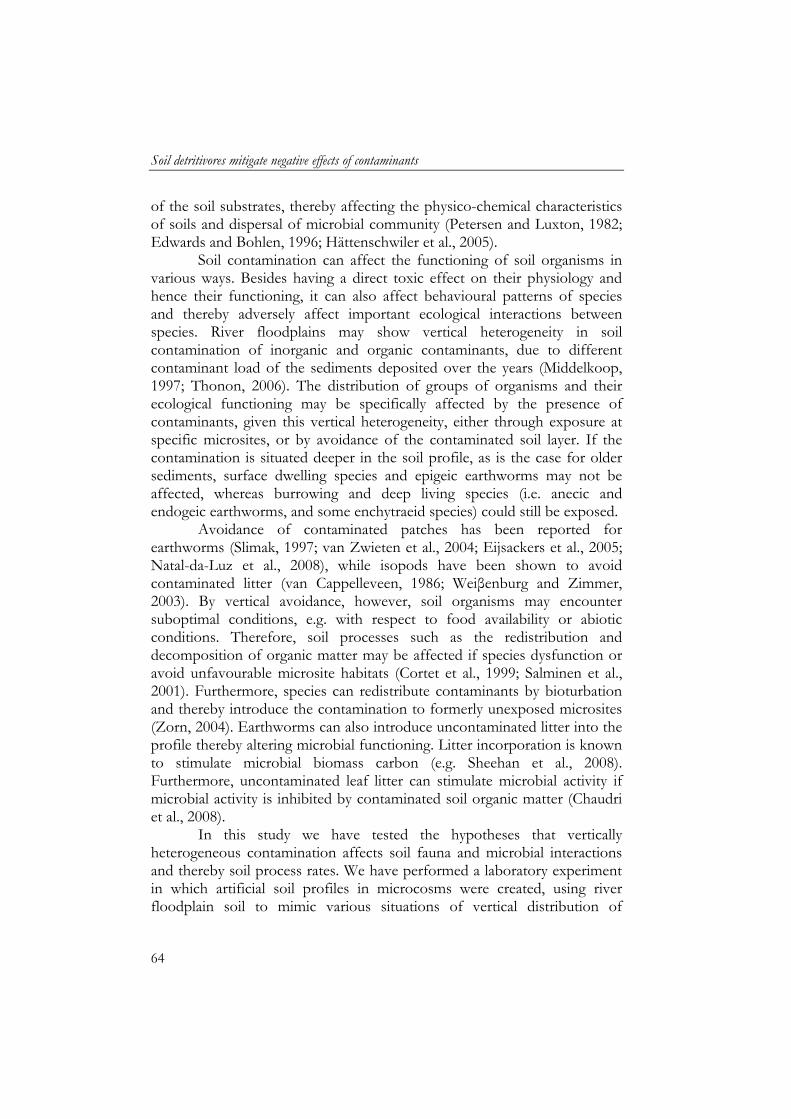
Soil detritivores mitigate negative effects of contaminants
64
of the soil substrates, thereby affecting the physico-chemical characteristics of soils and dispersal of microbial community (Petersen and Luxton, 1982; Edwards and Bohlen, 1996; Hättenschwiler et al., 2005).
Soil contamination can affect the functioning of soil organisms in various ways. Besides having a direct toxic effect on their physiology and hence their functioning, it can also affect behavioural patterns of species and thereby adversely affect important ecological interactions between species. River floodplains may show vertical heterogeneity in soil contamination of inorganic and organic contaminants, due to different contaminant load of the sediments deposited over the years (Middelkoop, 1997; Thonon, 2006). The distribution of groups of organisms and their ecological functioning may be specifically affected by the presence of contaminants, given this vertical heterogeneity, either through exposure at specific microsites, or by avoidance of the contaminated soil layer. If the contamination is situated deeper in the soil profile, as is the case for older sediments, surface dwelling species and epigeic earthworms may not be affected, whereas burrowing and deep living species (i.e. anecic and endogeic earthworms, and some enchytraeid species) could still be exposed.
Avoidance of contaminated patches has been reported for earthworms (Slimak, 1997; van Zwieten et al., 2004; Eijsackers et al., 2005; Natal-da-Luz et al., 2008), while isopods have been shown to avoid contaminated litter (van Cappelleveen, 1986; Weiβenburg and Zimmer, 2003). By vertical avoidance, however, soil organisms may encounter suboptimal conditions, e.g. with respect to food availability or abiotic conditions. Therefore, soil processes such as the redistribution and decomposition of organic matter may be affected if species dysfunction or avoid unfavourable microsite habitats (Cortet et al., 1999; Salminen et al., 2001). Furthermore, species can redistribute contaminants by bioturbation and thereby introduce the contamination to formerly unexposed microsites (Zorn, 2004). Earthworms can also introduce uncontaminated litter into the profile thereby altering microbial functioning. Litter incorporation is known to stimulate microbial biomass carbon (e.g. Sheehan et al., 2008). Furthermore, uncontaminated leaf litter can stimulate microbial activity if microbial activity is inhibited by contaminated soil organic matter (Chaudri et al., 2008).
In this study we have tested the hypotheses that vertically heterogeneous contamination affects soil fauna and microbial interactions and thereby soil process rates. We have performed a laboratory experiment in which artificial soil profiles in microcosms were created, using river floodplain soil to mimic various situations of vertical distribution of
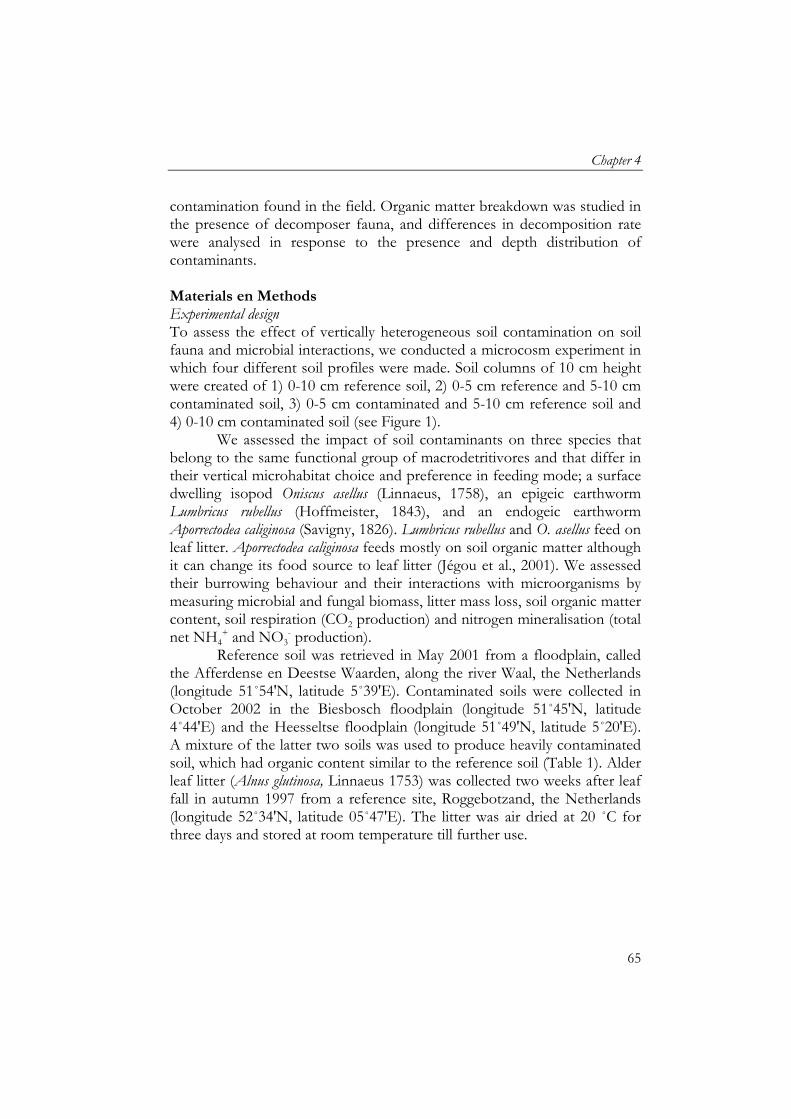
Chapter 4
65
contamination found in the field. Organic matter breakdown was studied in the presence of decomposer fauna, and differences in decomposition rate were analysed in response to the presence and depth distribution of contaminants. Materials en Methods Experimental design To assess the effect of vertically heterogeneous soil contamination on soil fauna and microbial interactions, we conducted a microcosm experiment in which four different soil profiles were made. Soil columns of 10 cm height were created of 1) 0-10 cm reference soil, 2) 0-5 cm reference and 5-10 cm contaminated soil, 3) 0-5 cm contaminated and 5-10 cm reference soil and 4) 0-10 cm contaminated soil (see Figure 1).
We assessed the impact of soil contaminants on three species that belong to the same functional group of macrodetritivores and that differ in their vertical microhabitat choice and preference in feeding mode; a surface dwelling isopod Oniscus asellus (Linnaeus, 1758), an epigeic earthworm Lumbricus rubellus (Hoffmeister, 1843), and an endogeic earthworm Aporrectodea caliginosa (Savigny, 1826). Lumbricus rubellus and O. asellus feed on leaf litter. Aporrectodea caliginosa feeds mostly on soil organic matter although it can change its food source to leaf litter (Jégou et al., 2001). We assessed their burrowing behaviour and their interactions with microorganisms by measuring microbial and fungal biomass, litter mass loss, soil organic matter content, soil respiration (CO2 production) and nitrogen mineralisation (total net NH4
+ and NO3- production).
Reference soil was retrieved in May 2001 from a floodplain, called the Afferdense en Deestse Waarden, along the river Waal, the Netherlands (longitude 51˚54'N, latitude 5˚39'E). Contaminated soils were collected in October 2002 in the Biesbosch floodplain (longitude 51˚45'N, latitude 4˚44'E) and the Heesseltse floodplain (longitude 51˚49'N, latitude 5˚20'E). A mixture of the latter two soils was used to produce heavily contaminated soil, which had organic content similar to the reference soil (Table 1). Alder leaf litter (Alnus glutinosa, Linnaeus 1753) was collected two weeks after leaf fall in autumn 1997 from a reference site, Roggebotzand, the Netherlands (longitude 52˚34'N, latitude 05˚47'E). The litter was air dried at 20 ˚C for three days and stored at room temperature till further use.
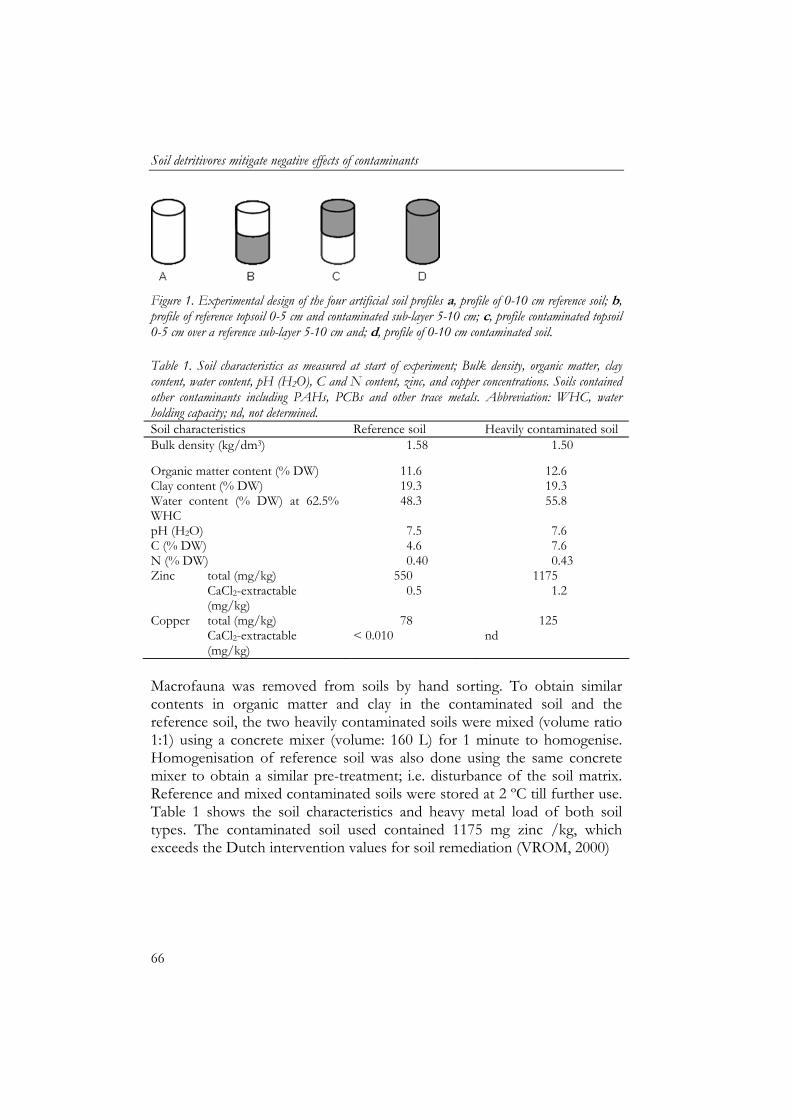
Soil detritivores mitigate negative effects of contaminants
66
Figure 1. Experimental design of the four artificial soil profiles a, profile of 0-10 cm reference soil; b, profile of reference topsoil 0-5 cm and contaminated sub-layer 5-10 cm; c, profile contaminated topsoil 0-5 cm over a reference sub-layer 5-10 cm and; d, profile of 0-10 cm contaminated soil. Table 1. Soil characteristics as measured at start of experiment; Bulk density, organic matter, clay content, water content, pH (H2O), C and N content, zinc, and copper concentrations. Soils contained other contaminants including PAHs, PCBs and other trace metals. Abbreviation: WHC, water holding capacity; nd, not determined. Soil characteristics Reference soil Heavily contaminated soil Bulk density (kg/dm3) 1.58 1.50
Organic matter content (% DW) 11.6 12.6 Clay content (% DW) 19.3 19.3 Water content (% DW) at 62.5% WHC
48.3 55.8
pH (H2O) 7.5 7.6 C (% DW) 4.6 7.6 N (% DW) 0.40 0.43 Zinc total (mg/kg) 550 1175 CaCl2-extractable (mg/kg)
0.5 1.2
Copper total (mg/kg) 78 125 CaCl2-extractable (mg/kg)
< 0.010 nd
Macrofauna was removed from soils by hand sorting. To obtain similar contents in organic matter and clay in the contaminated soil and the reference soil, the two heavily contaminated soils were mixed (volume ratio 1:1) using a concrete mixer (volume: 160 L) for 1 minute to homogenise. Homogenisation of reference soil was also done using the same concrete mixer to obtain a similar pre-treatment; i.e. disturbance of the soil matrix. Reference and mixed contaminated soils were stored at 2 ºC till further use. Table 1 shows the soil characteristics and heavy metal load of both soil types. The contaminated soil used contained 1175 mg zinc /kg, which exceeds the Dutch intervention values for soil remediation (VROM, 2000)
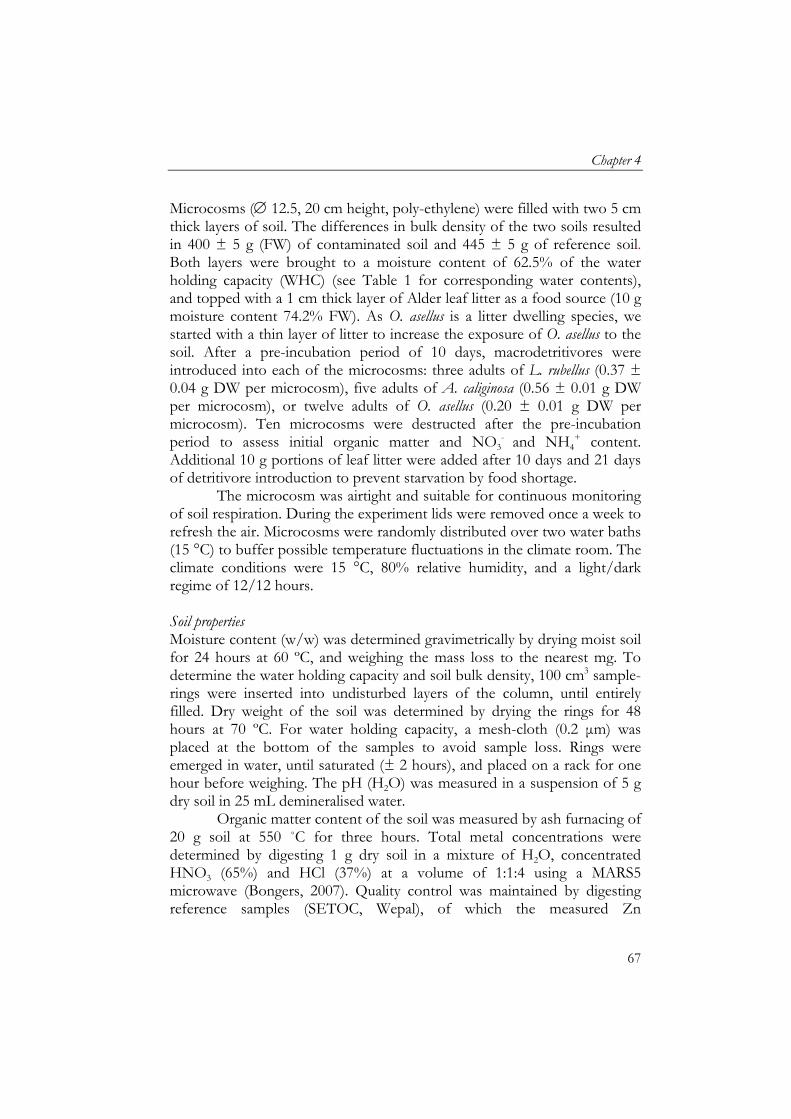
Chapter 4
67
Microcosms ( 12.5, 20 cm height, poly-ethylene) were filled with two 5 cm thick layers of soil. The differences in bulk density of the two soils resulted in 400 ± 5 g (FW) of contaminated soil and 445 ± 5 g of reference soil. Both layers were brought to a moisture content of 62.5% of the water holding capacity (WHC) (see Table 1 for corresponding water contents), and topped with a 1 cm thick layer of Alder leaf litter as a food source (10 g moisture content 74.2% FW). As O. asellus is a litter dwelling species, we started with a thin layer of litter to increase the exposure of O. asellus to the soil. After a pre-incubation period of 10 days, macrodetritivores were introduced into each of the microcosms: three adults of L. rubellus (0.37 ± 0.04 g DW per microcosm), five adults of A. caliginosa (0.56 ± 0.01 g DW per microcosm), or twelve adults of O. asellus (0.20 ± 0.01 g DW per microcosm). Ten microcosms were destructed after the pre-incubation period to assess initial organic matter and NO3
- and NH4+ content.
Additional 10 g portions of leaf litter were added after 10 days and 21 days of detritivore introduction to prevent starvation by food shortage.
The microcosm was airtight and suitable for continuous monitoring of soil respiration. During the experiment lids were removed once a week to refresh the air. Microcosms were randomly distributed over two water baths (15 °C) to buffer possible temperature fluctuations in the climate room. The climate conditions were 15 °C, 80% relative humidity, and a light/dark regime of 12/12 hours. Soil properties Moisture content (w/w) was determined gravimetrically by drying moist soil for 24 hours at 60 ºC, and weighing the mass loss to the nearest mg. To determine the water holding capacity and soil bulk density, 100 cm3 sample-rings were inserted into undisturbed layers of the column, until entirely filled. Dry weight of the soil was determined by drying the rings for 48 hours at 70 ºC. For water holding capacity, a mesh-cloth (0.2 μm) was placed at the bottom of the samples to avoid sample loss. Rings were emerged in water, until saturated (± 2 hours), and placed on a rack for one hour before weighing. The pH (H2O) was measured in a suspension of 5 g dry soil in 25 mL demineralised water.
Organic matter content of the soil was measured by ash furnacing of 20 g soil at 550 ˚C for three hours. Total metal concentrations were determined by digesting 1 g dry soil in a mixture of H2O, concentrated HNO3 (65%) and HCl (37%) at a volume of 1:1:4 using a MARS5 microwave (Bongers, 2007). Quality control was maintained by digesting reference samples (SETOC, Wepal), of which the measured Zn
Soil detritivores mitigate negative effects of contaminants
68
concentrations did not deviate more than 10% from the certified reference value. Extractable concentrations were determined by shaking 5 g soil in 25 mL 0.01 M CaCl2 solution for 4 hours. Tubes were centrifuged at 1300 g for 20 minutes and the supernatant passed through a 0.45 μm filter. Samples were stored at 4 ºC until analysed. All metal extracts were analysed using flame Atomic Absorption Spectrometry (Perkin Elmer 1100B AAS). Soil samples for soil particle size analyses were pre-treated to remove organic matter and carbonates to obtain only mineral soil particles (Konert and van den Berghe 1997). Clay fraction of the soil was determined using laser diffraction size analysis (Konert and van den Berghe, 1997). Carbon and nitrogen content of soils (dried at 50 ºC for 12 hours and milled using a mortar) were analysed using an element analyser (Carlo Erba Strumentazione elemental analyser, model 1106). Soil organisms and processes Soil processes measured were litter mass loss, nitrogen mineralisation (total NH4
+ and NO3- production), and soil respiration (CO2 production). After
five weeks all the remaining microcosms were destructively sampled. Animal numbers and biomass were determined. Animal survival during the experiment was assessed visually, every week without disturbing the litter. If dead animals were observed in the microcosm, they were not replaced, nor removed.
Before the soil columns were destructively sampled, the number of earthworm burrows was counted against the side wall of the microcosms. By using a 5x5 cm grid, divided in 1x1 cm sections, we quantified the number of burrows crossing the section lines, at both 0-5 cm depth and 5-10 cm depth, with two replicates per depth (Giovannetti and Mosse, 1980). Soil columns were then destructively sampled. Samples were taken at three layers; the litter layer, and the two soil layers (0–5 cm and 5–10 cm). Samples were stored at 2 °C and individually processed.
Extraction of NO3- and NH4
+ was done by shaking 20 g soil in 200 mL 1 M KCl solution for 12 hours. The suspension was centrifuged (10 min at 3000 rpm) and analysed on an auto-analyser (Skalar SA 40). Organic matter content of the soil was measured by ash furnacing of 20 g soil at 550 ˚C for three hours. Leaf litter fragment size distribution was measured by sieving leaf litter after air-drying of leaves. Sieve mesh sizes were 16, 8, 4, and 2 mm, respectively. Soil respiration in the microcosms was measured every two hours using conductrometry (respirometer filled with 0.5 M KOH) after Doelman and Haanstra (1979). A reference cell was included to measure CO2 leaching during opening of microcosms.
Chapter 4
69
Suspensions for bacterial and fungal analyses were made by blending 20 g soil with 190 mL demiwater for one min. Directly after blending, a 9 mL sample was taken and 1 mL formalin (40%) was added to the suspension for fixation. Suspensions were stored at 2 ºC. Bacteria were stained using vital-staining method of DTAF (Bloem et al., 1995). Bacteria counts were done using confocal laser scanning microscopy (image analyses by computer, Bloem et al., 1995). Fungi were differential fluorescent stained using fluorescein diacetate and differential fluorescent stain, a vital stain method that differentiates between active and inactive mycelia (Morris et al., 1997). Active, inactive and total fungi mycelia were counted under a microscope, using an intersection method (100x10 grid cells, UV-light). Data analyses Survival and changes in biomass of soil fauna were analysed using ANOVA. To assess net NO3
- production, the NO3- content at the start of the
experiment was subtracted from the final NO3-. Ammonium production
was calculated in the same fashion as net NO3- production. NO3
- and NH4+
production were expressed per g N in the soil, to correct for differences in soil moisture and organic matter content between the reference soil and contaminated soil. Soil respiration data was summed to a cumulative value over five weeks. To correct for differences in organic C content in the soil, CO2 values were expressed as mg CO2 per g soil C. Changes in litter fragment size distributions were analysed with the Bray-Curtis index of similarity (Legendre and Legendre, 1998). The reference distribution in litter fragment sizes was expressed in a reference Bray-Curtis value using the litter fragment sizes of the reference soil with no soil macrofauna present. Because we sampled at 0-5 cm and 5-10 cm depth, we tested the effect of contamination on species distribution and soil process rates using a three factor general linear model with species, location of contaminant and depth in soil profile as factors. Because these analyses showed interactions between the 3 factors, we ran two-factor general linear model (GLM) with species and location of contaminant treatment as factors on the individual depth sampling layers (0-5 and 5-10 cm separately). If the interaction between contaminant and species was significant, one way ANOVAs were used for detailed analyses. Correlations between soil processes and soil characteristics were analysed using Pearson’s two-tailed correlation. All statistical analyses were done using SPSS v16.0.
Soil detritivores mitigate negative effects of contaminants
70
Results Survival and reproduction Survival of A. caliginosa and L. rubellus was higher than 95%. Both species increased in weight during the experiment, being 19-46% for L. rubellus and 49-61% for A. caliginosa. Increases in earthworm biomass were similar in all treatments (ANOVA, L. rubellus F3, 16 = 1.18, P = 0.35, A. caliginosa F3, 16 = 0.185, P = 0.18). Survival of O. asellus in microcosms ranged from 0-100%, averaging 50%. Mortality occurred mainly after three weeks. Collembola and Nematoda were observed in low numbers. Microorganism activity and biomass In general, reference soil showed a higher CO2 production than treatments containing contaminated soil (Tukey HSD post hoc, P < 0.001), both in the presence and absence of soil animals (Figure 2a). As the dry weight of the macrofauna species varied, the net effect of species (to the control) is shown per g dry weight species (Figure 2b). Lumbricus rubellus and A. caliginosa induced a significant increase in CO2 production in all treatments compared to the control (Tukey HSD, P < 0.001). Increase in respiration rates in treatments containing A. caliginosa (compared to microcosms without animals) was significantly higher in the completely contaminated profile than the reference soil (ANOVA Tukey HSD post hoc, P = 0.035) being 57% increase in the contaminated profile, while the reference profile was increased by 17%. Mixture soil treatments showed intermediate values with a 29-31% increase in CO2 production. Relative increase in CO2 production for L. rubellus was similar for all soil treatments (ANOVA, F3,16 = 1.1, P = 0.388). O. asellus did not induce significant increases in CO2 production (Tukey HSD, P = 0.526).
Bacterial biomass varied between 10 and 37 μg C/g soil, irrespective of soil fauna presence, and did not differ between treatments (all P > 0.05, Table 2). Fungal hyphal length varied between 27 and 89 m/g soil, of which on average 47% was metabolically active. No significant differences in active hyphal length were observed between neither species treatments nor soil treatments (all P > 0.05, Table 2).
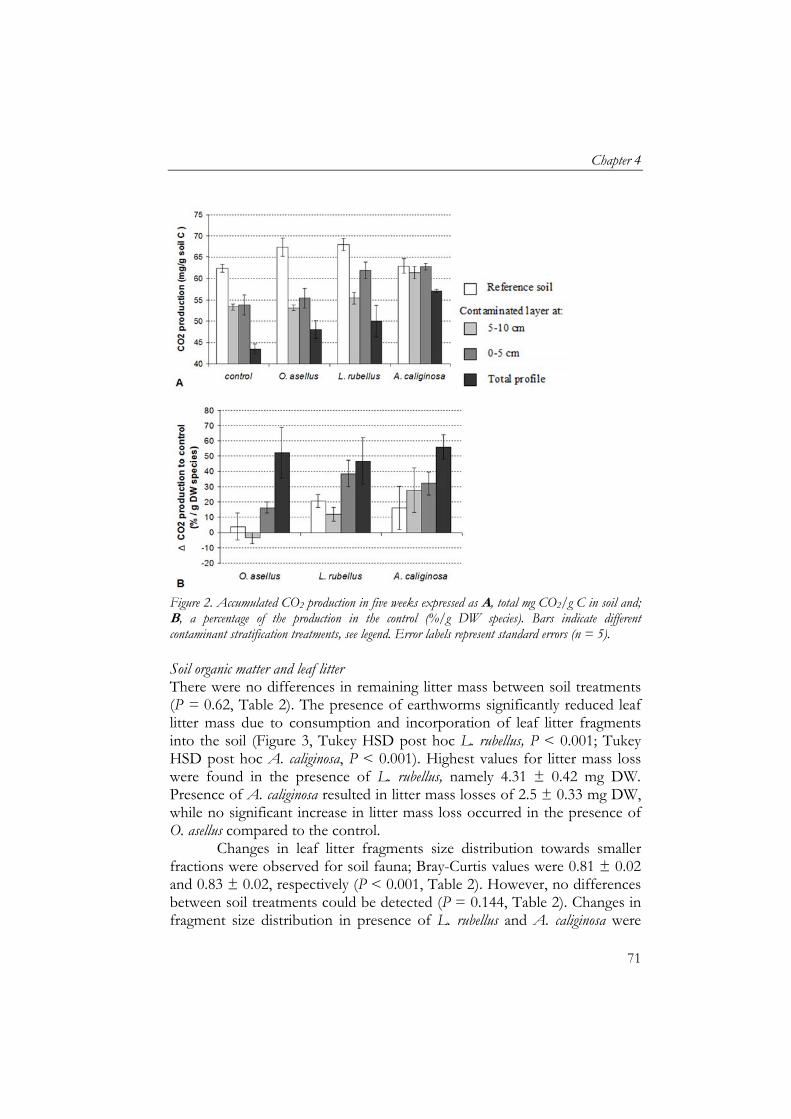
Chapter 4
71
Figure 2. Accumulated CO2 production in five weeks expressed as A, total mg CO2/g C in soil and; B, a percentage of the production in the control (%/g DW species). Bars indicate different contaminant stratification treatments, see legend. Error labels represent standard errors (n = 5). Soil organic matter and leaf litter There were no differences in remaining litter mass between soil treatments (P = 0.62, Table 2). The presence of earthworms significantly reduced leaf litter mass due to consumption and incorporation of leaf litter fragments into the soil (Figure 3, Tukey HSD post hoc L. rubellus, P < 0.001; Tukey HSD post hoc A. caliginosa, P < 0.001). Highest values for litter mass loss were found in the presence of L. rubellus, namely 4.31 ± 0.42 mg DW. Presence of A. caliginosa resulted in litter mass losses of 2.5 ± 0.33 mg DW, while no significant increase in litter mass loss occurred in the presence of O. asellus compared to the control.
Changes in leaf litter fragments size distribution towards smaller fractions were observed for soil fauna; Bray-Curtis values were 0.81 ± 0.02 and 0.83 ± 0.02, respectively (P < 0.001, Table 2). However, no differences between soil treatments could be detected (P = 0.144, Table 2). Changes in fragment size distribution in presence of L. rubellus and A. caliginosa were
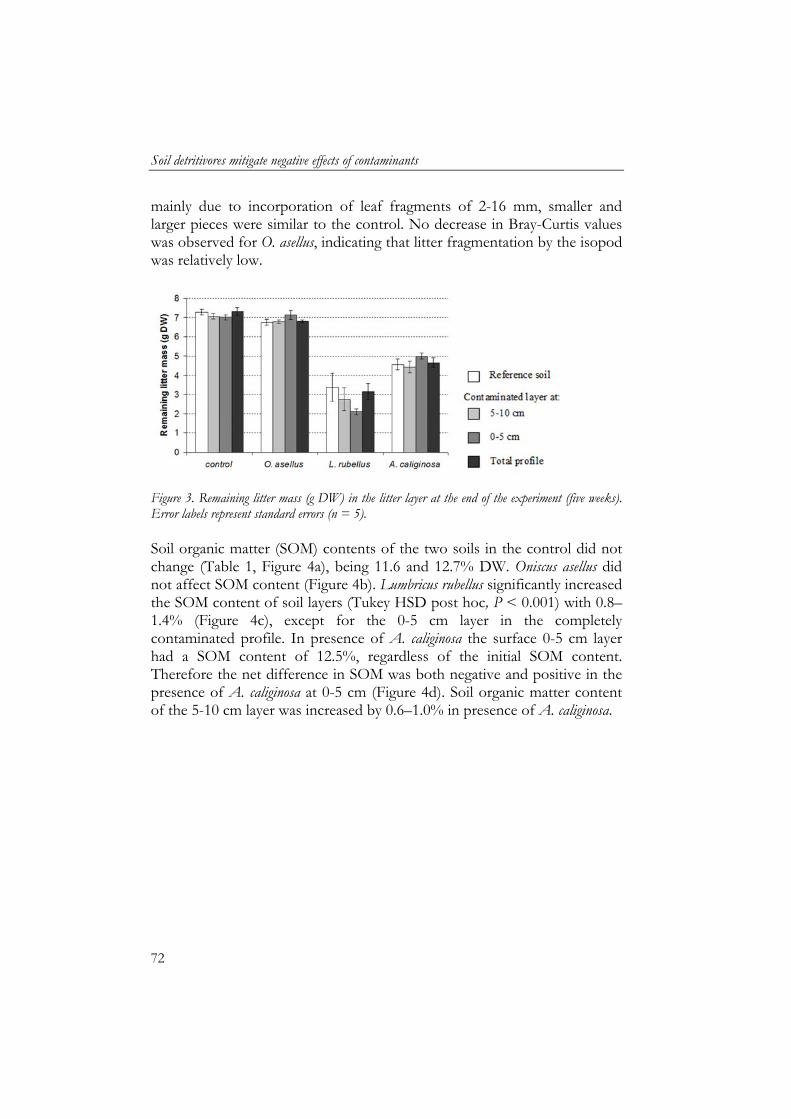
Soil detritivores mitigate negative effects of contaminants
72
mainly due to incorporation of leaf fragments of 2-16 mm, smaller and larger pieces were similar to the control. No decrease in Bray-Curtis values was observed for O. asellus, indicating that litter fragmentation by the isopod was relatively low.
Figure 3. Remaining litter mass (g DW) in the litter layer at the end of the experiment (five weeks). Error labels represent standard errors (n = 5). Soil organic matter (SOM) contents of the two soils in the control did not change (Table 1, Figure 4a), being 11.6 and 12.7% DW. Oniscus asellus did not affect SOM content (Figure 4b). Lumbricus rubellus significantly increased the SOM content of soil layers (Tukey HSD post hoc, P < 0.001) with 0.8–1.4% (Figure 4c), except for the 0-5 cm layer in the completely contaminated profile. In presence of A. caliginosa the surface 0-5 cm layer had a SOM content of 12.5%, regardless of the initial SOM content. Therefore the net difference in SOM was both negative and positive in the presence of A. caliginosa at 0-5 cm (Figure 4d). Soil organic matter content of the 5-10 cm layer was increased by 0.6–1.0% in presence of A. caliginosa.
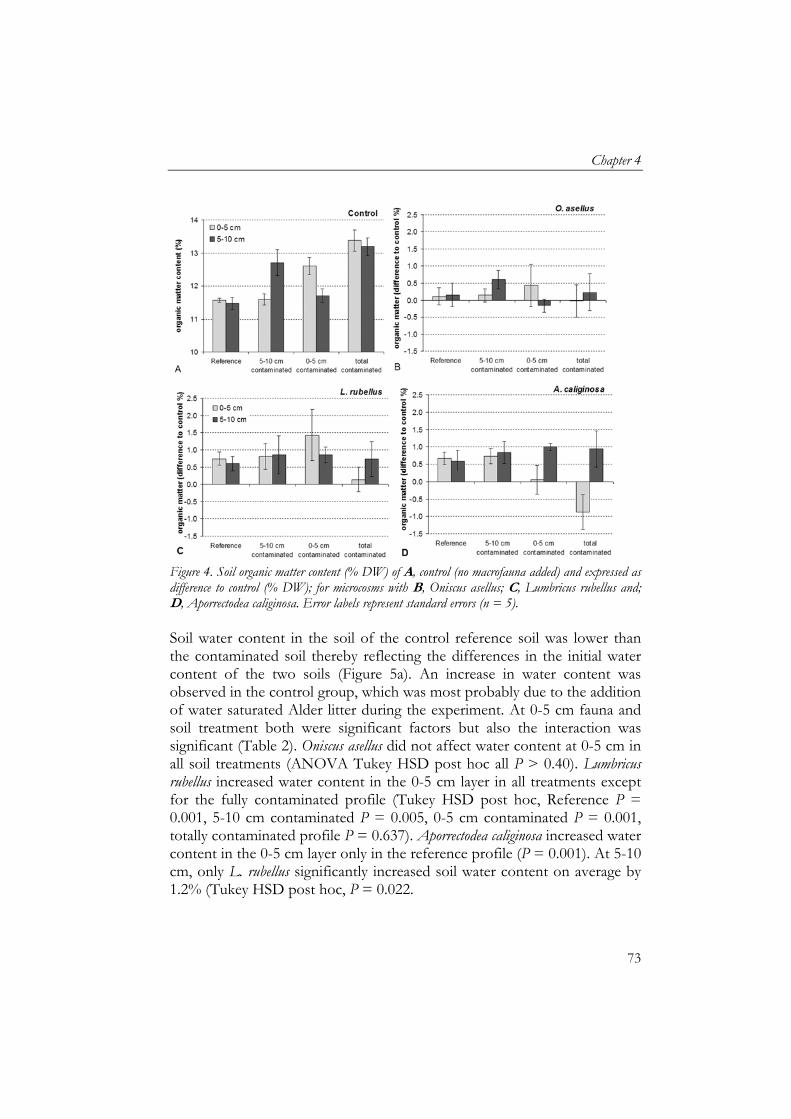
Chapter 4
73
Figure 4. Soil organic matter content (% DW) of A, control (no macrofauna added) and expressed as difference to control (% DW); for microcosms with B, Oniscus asellus; C, Lumbricus rubellus and; D, Aporrectodea caliginosa. Error labels represent standard errors (n = 5). Soil water content in the soil of the control reference soil was lower than the contaminated soil thereby reflecting the differences in the initial water content of the two soils (Figure 5a). An increase in water content was observed in the control group, which was most probably due to the addition of water saturated Alder litter during the experiment. At 0-5 cm fauna and soil treatment both were significant factors but also the interaction was significant (Table 2). Oniscus asellus did not affect water content at 0-5 cm in all soil treatments (ANOVA Tukey HSD post hoc all P > 0.40). Lumbricus rubellus increased water content in the 0-5 cm layer in all treatments except for the fully contaminated profile (Tukey HSD post hoc, Reference P = 0.001, 5-10 cm contaminated P = 0.005, 0-5 cm contaminated P = 0.001, totally contaminated profile P = 0.637). Aporrectodea caliginosa increased water content in the 0-5 cm layer only in the reference profile (P = 0.001). At 5-10 cm, only L. rubellus significantly increased soil water content on average by 1.2% (Tukey HSD post hoc, P = 0.022.
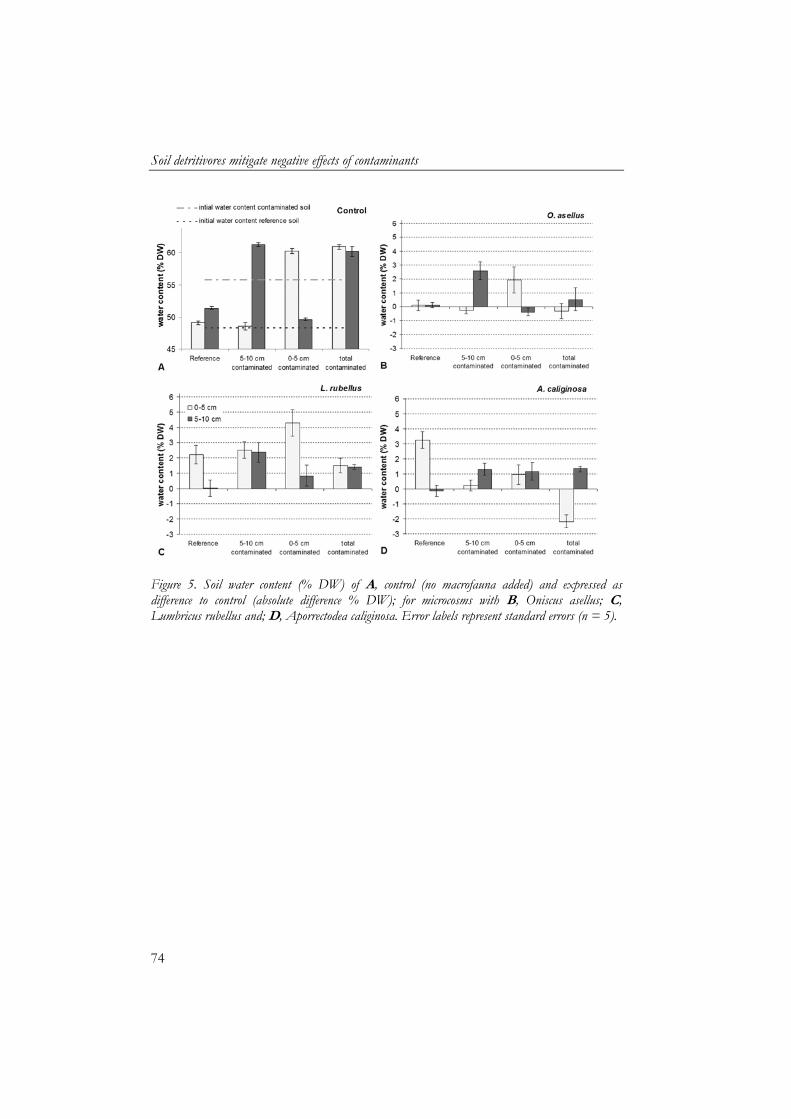
Soil detritivores mitigate negative effects of contaminants
74
Figure 5. Soil water content (% DW) of A, control (no macrofauna added) and expressed as difference to control (absolute difference % DW); for microcosms with B, Oniscus asellus; C, Lumbricus rubellus and; D, Aporrectodea caliginosa. Error labels represent standard errors (n = 5).
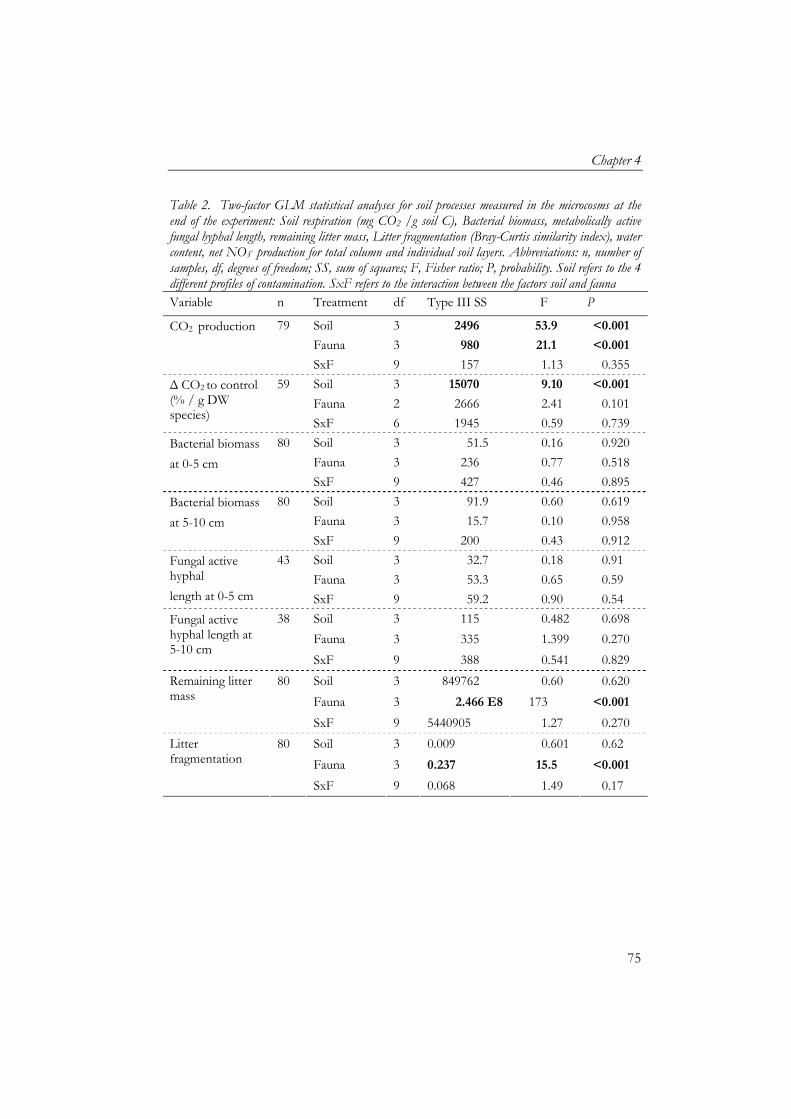
Chapter 4
75
Table 2. Two-factor GLM statistical analyses for soil processes measured in the microcosms at the end of the experiment: Soil respiration (mg CO2 /g soil C), Bacterial biomass, metabolically active fungal hyphal length, remaining litter mass, Litter fragmentation (Bray-Curtis similarity index), water content, net NO3- production for total column and individual soil layers. Abbreviations: n, number of samples, df, degrees of freedom; SS, sum of squares; F, Fisher ratio; P, probability. Soil refers to the 4 different profiles of contamination. SxF refers to the interaction between the factors soil and fauna Variable n Treatment df Type III SS F P
79 Soil 3 2496 53.9 <0.001
Fauna 3 980 21.1 <0.001
CO2 production
SxF 9 157 1.13 0.355
59 Soil 3 15070 9.10 <0.001
Fauna 2 2666 2.41 0.101
Δ CO2 to control (% / g DW species)
SxF 6 1945 0.59 0.739
80 Soil 3 51.5 0.16 0.920
Fauna 3 236 0.77 0.518
Bacterial biomass
at 0-5 cm SxF 9 427 0.46 0.895
80 Soil 3 91.9 0.60 0.619
Fauna 3 15.7 0.10 0.958
Bacterial biomass
at 5-10 cm SxF 9 200 0.43 0.912
43 Soil 3 32.7 0.18 0.91
Fauna 3 53.3 0.65 0.59
Fungal active hyphal
length at 0-5 cm SxF 9 59.2 0.90 0.54
38 Soil 3 115 0.482 0.698
Fauna 3 335 1.399 0.270
Fungal active hyphal length at 5-10 cm
SxF 9 388 0.541 0.829
80 Soil 3 849762 0.60 0.620
Fauna 3 2.466 E8 173 <0.001
Remaining litter mass
SxF 9 5440905 1.27 0.270
80 Soil 3 0.009 0.601 0.62
Fauna 3 0.237 15.5 <0.001
Litter fragmentation
SxF 9 0.068 1.49 0.17
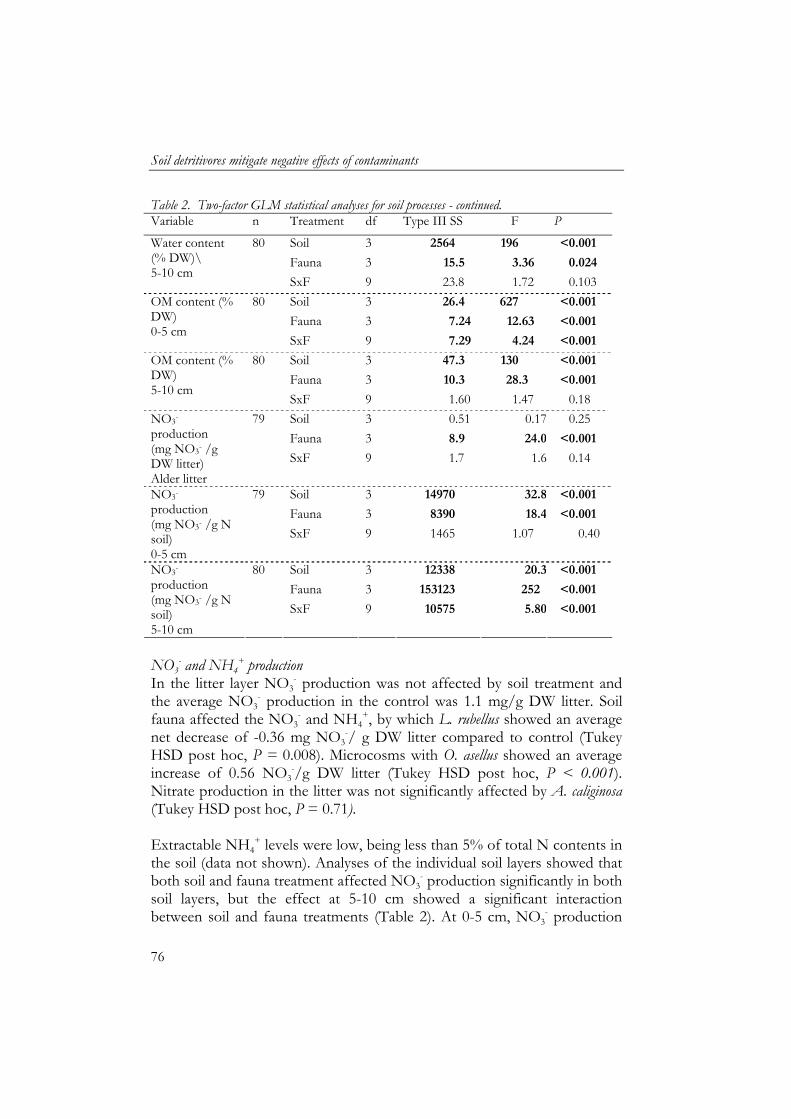
Soil detritivores mitigate negative effects of contaminants
76
Table 2. Two-factor GLM statistical analyses for soil processes - continued. Variable n Treatment df Type III SS F P
80 Soil 3 2564 196 <0.001
Fauna 3 15.5 3.36 0.024
Water content (% DW)\ 5-10 cm
SxF 9 23.8 1.72 0.103
80 Soil 3 26.4 627 <0.001
Fauna 3 7.24 12.63 <0.001
OM content (% DW) 0-5 cm
SxF 9 7.29 4.24 <0.001
80 Soil 3 47.3 130 <0.001
Fauna 3 10.3 28.3 <0.001
OM content (% DW) 5-10 cm
SxF 9 1.60 1.47 0.18
79 Soil 3 0.51 0.17 0.25
Fauna 3 8.9 24.0 <0.001
NO3- production (mg NO3- /g DW litter) Alder litter
SxF 9 1.7 1.6 0.14
79 Soil 3 14970 32.8 <0.001
Fauna 3 8390 18.4 <0.001
NO3- production (mg NO3- /g N soil) 0-5 cm
SxF 9 1465 1.07 0.40
80 Soil 3 12338 20.3 <0.001
Fauna 3 153123 252 <0.001
NO3- production (mg NO3- /g N soil) 5-10 cm
SxF 9 10575 5.80 <0.001
NO3
- and NH4+ production
In the litter layer NO3- production was not affected by soil treatment and
the average NO3- production in the control was 1.1 mg/g DW litter. Soil
fauna affected the NO3- and NH4
+, by which L. rubellus showed an average net decrease of -0.36 mg NO3
-/ g DW litter compared to control (Tukey HSD post hoc, P = 0.008). Microcosms with O. asellus showed an average increase of 0.56 NO3
-/g DW litter (Tukey HSD post hoc, P < 0.001). Nitrate production in the litter was not significantly affected by A. caliginosa (Tukey HSD post hoc, P = 0.71). Extractable NH4
+ levels were low, being less than 5% of total N contents in the soil (data not shown). Analyses of the individual soil layers showed that both soil and fauna treatment affected NO3
- production significantly in both soil layers, but the effect at 5-10 cm showed a significant interaction between soil and fauna treatments (Table 2). At 0-5 cm, NO3
- production
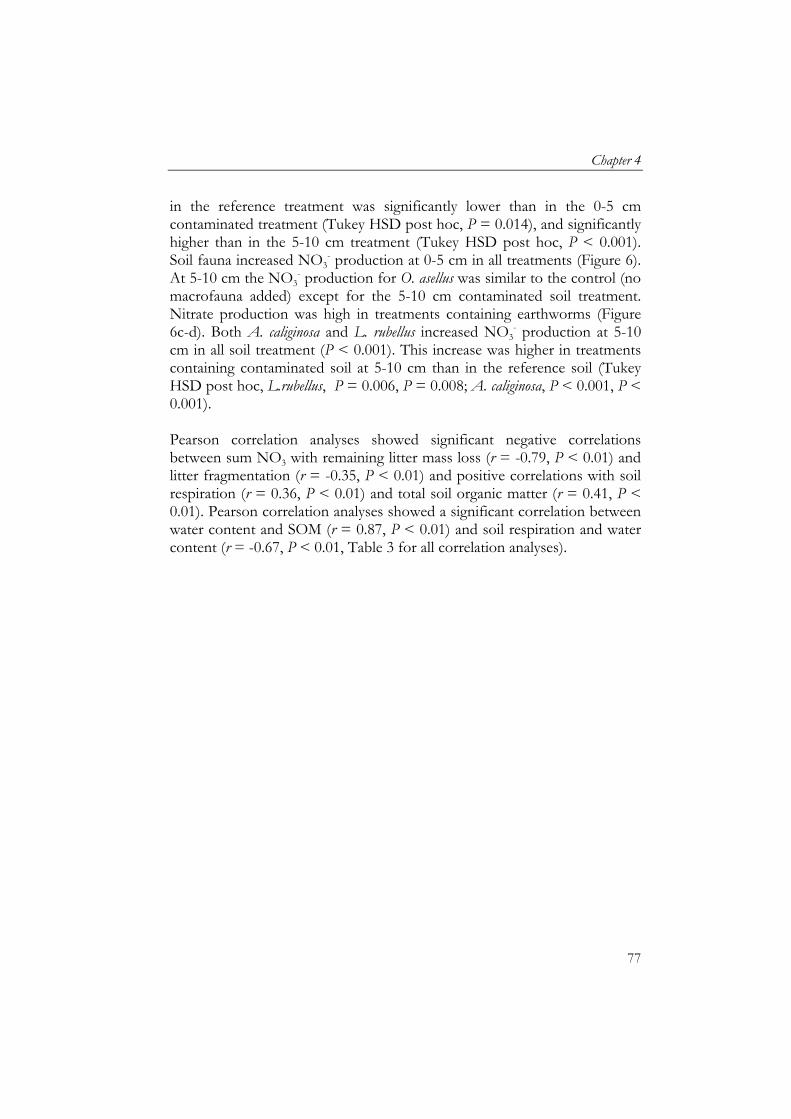
Chapter 4
77
in the reference treatment was significantly lower than in the 0-5 cm contaminated treatment (Tukey HSD post hoc, P = 0.014), and significantly higher than in the 5-10 cm treatment (Tukey HSD post hoc, P < 0.001). Soil fauna increased NO3
- production at 0-5 cm in all treatments (Figure 6). At 5-10 cm the NO3
- production for O. asellus was similar to the control (no macrofauna added) except for the 5-10 cm contaminated soil treatment. Nitrate production was high in treatments containing earthworms (Figure 6c-d). Both A. caliginosa and L. rubellus increased NO3
- production at 5-10 cm in all soil treatment (P < 0.001). This increase was higher in treatments containing contaminated soil at 5-10 cm than in the reference soil (Tukey HSD post hoc, L.rubellus, P = 0.006, P = 0.008; A. caliginosa, P < 0.001, P < 0.001). Pearson correlation analyses showed significant negative correlations between sum NO3 with remaining litter mass loss (r = -0.79, P < 0.01) and litter fragmentation (r = -0.35, P < 0.01) and positive correlations with soil respiration (r = 0.36, P < 0.01) and total soil organic matter (r = 0.41, P < 0.01). Pearson correlation analyses showed a significant correlation between water content and SOM (r = 0.87, P < 0.01) and soil respiration and water content (r = -0.67, P < 0.01, Table 3 for all correlation analyses).
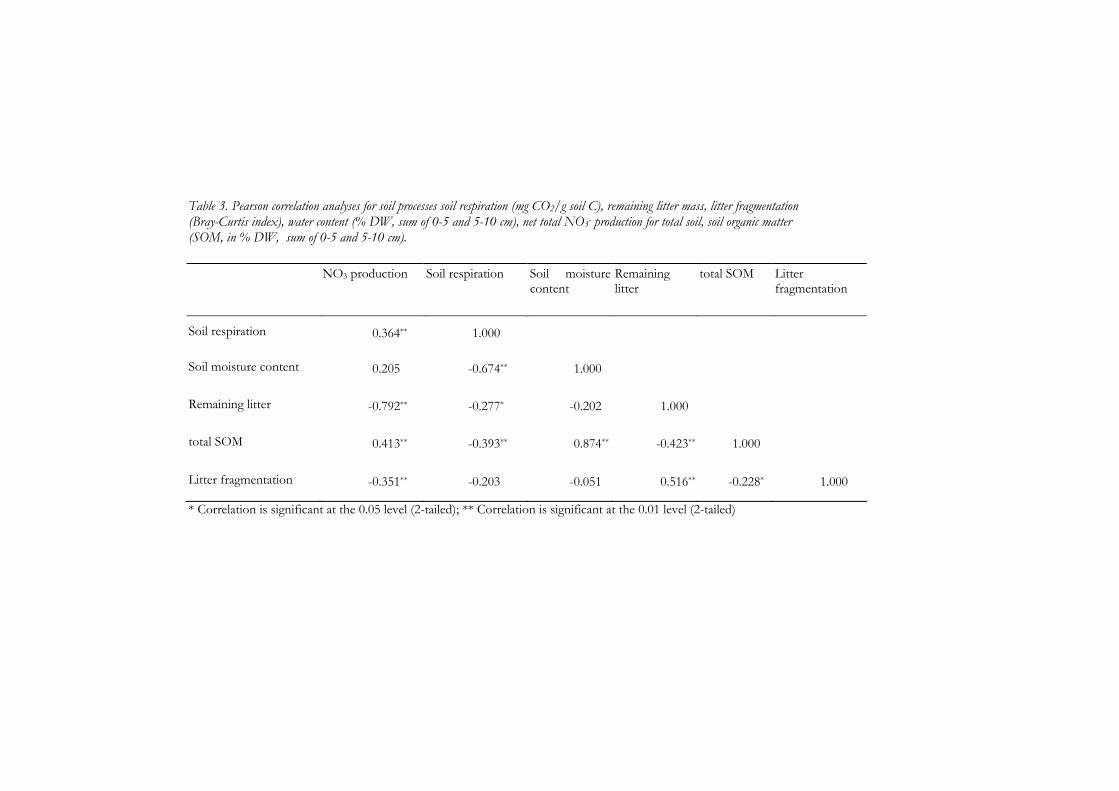
Soil detritivores mitigate negative effects of contaminants
78
Table 3. Pearson correlation analyses for soil processes soil respiration (mg CO2/g soil C), remaining litter mass, litter fragmentation (Bray-Curtis index), water content (% DW, sum of 0-5 and 5-10 cm), net total NO3- production for total soil, soil organic matter (SOM, in % DW, sum of 0-5 and 5-10 cm). NO3 production Soil respiration Soil moisture
content Remaining litter
total SOM
Litter fragmentation
Soil respiration 0.364** 1.000
Soil moisture content 0.205 -0.674** 1.000
Remaining litter -0.792** -0.277* -0.202 1.000
total SOM 0.413** -0.393** 0.874** -0.423** 1.000
Litter fragmentation -0.351** -0.203 -0.051 0.516** -0.228* 1.000
* Correlation is significant at the 0.05 level (2-tailed); ** Correlation is significant at the 0.01 level (2-tailed)
Chapter 4
79
Figure 6. Total NO3- (mg NO3- /g N in soil) in soils measured at two depths 0-5 and 5-10 cm of A, control; presence of B, Oniscus asellus; C, Lumbricus rubellus and; D, Aporrectodea caliginosa. Error labels represent standard errors (n = 5). Bioturbation Burrows were observed along the transparent microcosm wall, indicating active bioturbation by earthworms. Burrow length of both earthworm species did not differ between treatments but burrow length of A. caliginosa was longer than L. rubellus (2-factor GLM: 0-5 cm contamination P = 0.67, fauna P = 0.003, soilxfauna P = 0.90; 5-10 cm, contamination P = 0.85, fauna P < 0.001; soilxfauna P = 0.97) (Figure 7). Lumbricus rubellus made permanent burrows, while A. caliginosa showed active re-burrowing through the soil which is reflected in the burrow length measured in treatments containing A. caliginosa. Lumbricus rubellus showed higher bioturbation in 0-5 cm than for 5-10 cm while A. caliginosa had similar burrow lengths for both layers (Figure 7).
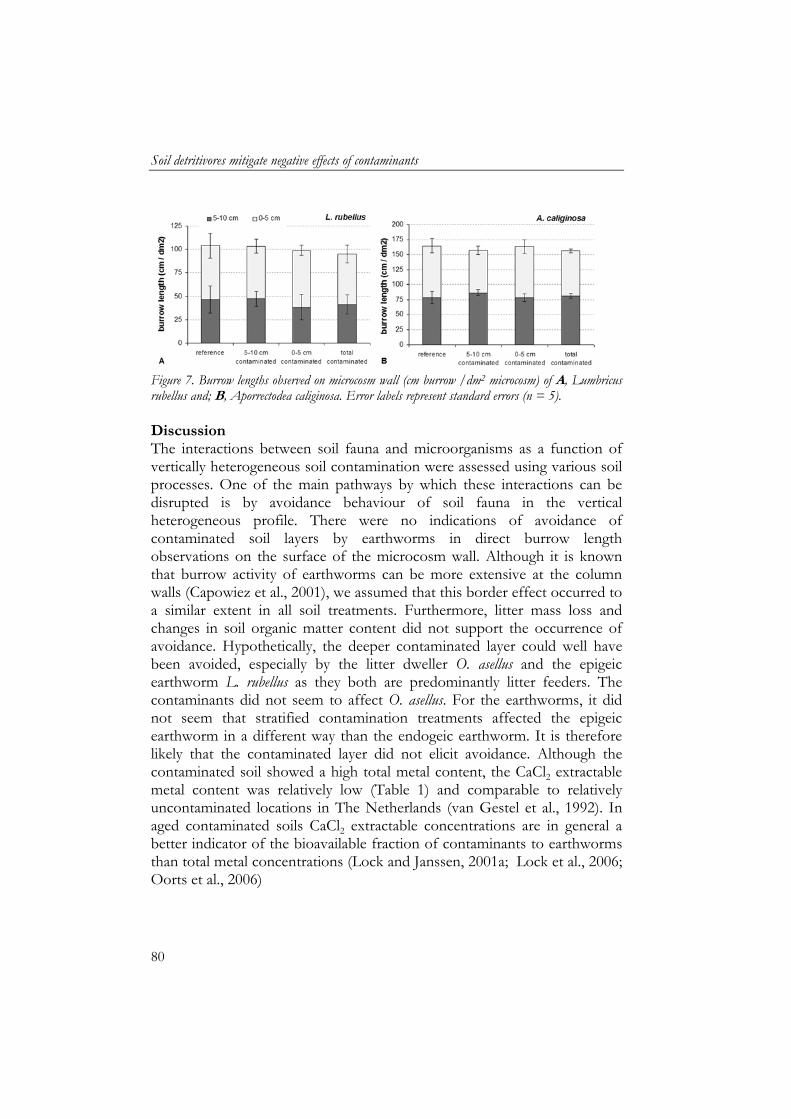
Soil detritivores mitigate negative effects of contaminants
80
Figure 7. Burrow lengths observed on microcosm wall (cm burrow /dm2 microcosm) of A, Lumbricus rubellus and; B, Aporrectodea caliginosa. Error labels represent standard errors (n = 5). Discussion The interactions between soil fauna and microorganisms as a function of vertically heterogeneous soil contamination were assessed using various soil processes. One of the main pathways by which these interactions can be disrupted is by avoidance behaviour of soil fauna in the vertical heterogeneous profile. There were no indications of avoidance of contaminated soil layers by earthworms in direct burrow length observations on the surface of the microcosm wall. Although it is known that burrow activity of earthworms can be more extensive at the column walls (Capowiez et al., 2001), we assumed that this border effect occurred to a similar extent in all soil treatments. Furthermore, litter mass loss and changes in soil organic matter content did not support the occurrence of avoidance. Hypothetically, the deeper contaminated layer could well have been avoided, especially by the litter dweller O. asellus and the epigeic earthworm L. rubellus as they both are predominantly litter feeders. The contaminants did not seem to affect O. asellus. For the earthworms, it did not seem that stratified contamination treatments affected the epigeic earthworm in a different way than the endogeic earthworm. It is therefore likely that the contaminated layer did not elicit avoidance. Although the contaminated soil showed a high total metal content, the CaCl2 extractable metal content was relatively low (Table 1) and comparable to relatively uncontaminated locations in The Netherlands (van Gestel et al., 1992). In aged contaminated soils CaCl2 extractable concentrations are in general a better indicator of the bioavailable fraction of contaminants to earthworms than total metal concentrations (Lock and Janssen, 2001a; Lock et al., 2006; Oorts et al., 2006)
Chapter 4
81
In the absence of macrofauna, lower soil respiration rates were observed in the completely contaminated profile compared to the reference (Figure 2), which may indicate that contamination had a direct negative effect on the activity of microbes. The presence of macrofauna increased soil respiration rates, although no increases in microbial biomass and metabolically active hyphal length were observed. Positive effects of earthworms on microbial activity have been observed in contaminated soils (Cortet et al., 1999; Lukkari et al., 2005; Lahr et al., 2008). Whilst the microbial biomass may remain similar, earthworms increase the turnover or basal activity of the microbial community in the soil (Aira et al., 2008; Sen and Chandra, 2009). Interestingly, in contaminated profiles the stimulation of microbial activity by earthworms was relatively higher than in reference soil layers, especially in the presence of A. caliginosa, though rates remained below reference soil level. This large increase in respiration rates in contaminated soil layers by earthworms suggests that microbial activity was restricted by some limiting factor, and that particularly in the contaminated soil earthworm mediation was enhanced, either by microbial grazing or by affecting physico-chemical characteristics of soil and litter through bioturbation, or incorporation of leaf litter in the soil profile (Petersen and Luxton, 1982; Brown, 1995, Edwards and Lofty, 1972). If bioturbation was similar in all treatments, one can assume that grazing on microorganisms and the effects on the physico-chemical structure of the soil were similar in all treatments and therefore were an unlikely cause for the increased CO2 production. There were no indications that the behaviour and activity of O. asellus was affected by the soil treatments, as fragmentation of leaf litter was similar in all different soil types (Figure 3). This was expected because even though a thin litter layer was created, the isopod is a soil surface dweller clinging to the litter (Paoletti and Hassall, 1999), thus escaping exposure. The two earthworm species incorporated similar amounts of leaf litter into the soil profile in all soil treatments. Therefore litter incorporation is the most likely factor for the relatively high microbial stimulation. The incorporated litter might have increased the water content of the soil as well. However, correlation analyses showed that the CO2 production was negatively correlated to water content; thus, additional soil moisture was not likely to be the mechanism to enhance C mineralisation
Soil detritivores mitigate negative effects of contaminants
82
Soils, sediments and biosolids may show high concentrations of metals through complexation of metals to soil organic matter and clay minerals (Alloway, 1995; McBride et al., 1997; Chaudri et al., 2008). The breakdown of SOM will mobilize heavy metals in time and thereby potentially increase bioavailability. Chaudri et al. (2008) showed that SOM associated metals in biosolids had a larger impact on rhizobia counts than their soluble salts due to association with SOM. The scale at which the SOM with high concentrations of contamination occur is crucial for a realistic assessment of microbial exposure due to their strong association with SOM (Chaudri et al. 2008). Larger soil fauna will be exposed through a larger surface, thereby integrating exposure over heterogeneous microsites. Because of this scale effect soil microorganisms may tend to be more sensitive to metals than soil fauna or plants, as established e.g. by Giller et al. (1998) and Broos et al. (2005). If contaminated soil organic matter is suppressing microbial activity, the incorporation of fresh uncontaminated litter into the soil profile offers an alternative substrate and can stimulate the microbial community. Bioturbation of earthworms can thereby dilute contaminated SOM by mixing the SOM with fresh leaf litter of better quality. This effect will be larger in the contaminated soil than in the reference soil, thereby leading to a relative larger microbial stimulation in the contaminated soil than in the reference soil. Alternatively, the gut passage in the earthworms stimulating microbial activity (Brown, 1995; Drake and Horn, 2007) might be more important for less vital microbial communities like those in contaminated soils.
While contaminated soil and reference soil differed in microstructure and C:N-ratio, this is insufficient as an alternative explanation for the difference in CO2 production in the control soil as this does not account for the disproportional increase of CO2 production by the addition of earthworms. Therefore, we believe that N-content of the soils did not limit C-mineralisation, but that earthworms were the prime factor of mediation for microbial mineralisation of C and N. NO3
- production is the resultant of organic matter assimilation followed by N excretion by earthworms and the ammonification and nitrification by microorganisms. Especially earthworm casts are relatively rich in NH4
+ (Edwards and Bohlen, 1996; Aira et al., 2003; Haynes et al., 2003). Therefore, data on NO3
-production are less conclusive as it is affected by earthworm behaviour (cast deposition) and leaf litter degradation.
Chapter 4
83
Furthermore, the NO3- production data of specific soil layers were affected
by leaching of water through the soil profile; leachates may have flushed nitrate from the litter layer, into the soil and downwards. However, the results of NH4
+ and NO3- production show that NH4
+ was less than 5% of the mineral N, thereby indicating that nitrification was not affected by the contamination. Conclusions Vertically heterogeneous contamination did not affect behaviour of species which differed in their life history traits. Furthermore, interactions between macrofauna and microorganisms were not affected. The results of this research indicate that soil macrofauna can mitigate negative effects of soil contaminants on soil microbes. In soils rich in clay and organic matter showing a high total metal concentration, the negative effects of soil contaminants to microbial activity were compensated for by soil fauna stimulating microbial activity. Acknowledgements We thank An Vos, Meint Veninga and Jaap Bloem (Alterra) for their support in microbiological analyses and stimulating discussions. The investigations were supported by the Research Council for Earth and Life Sciences (ALW) with financial aid from the Netherlands Organisation for Scientific Research (NWO) and the Dutch Ministry of Agriculture, Nature and Food Quality (BO-01-002-204). Matty P. Berg was financially supported by the Royal Dutch Academy of Arts and Sciences (KNAW).

Chapter 5
85
5 Biodiversity effects on soil processes explained by interspecific functional dissimilarity

Chapter 5
87
5 Biodiversity effects on soil processes explained by interspecific functional dissimilarity
D. A. Heemsbergen,1,2 M. P. Berg,1 M. Loreau,3 J. R. van Hal,2 J. H. Faber,2 H. A. Verhoef1 1 VU University, Institute of Ecological Science, Department of Animal
Ecology, de Boelelaan 1085, 1081 HV Amsterdam, the Netherlands. 2 Alterra, Wageningen University and Research Centre, P.O. Box 47, 6700
AA Wageningen, the Netherlands. 3 Laboratoire d'Ecologie, Ecole Normale Supérieure, 46 rue d'Ulm, 75230
Paris Cedex 05, France. Abstract The loss of biodiversity can have significant impacts on ecosystem functioning, but the mechanisms involved lack empirical confirmation. Using soil microcosms, we show experimentally that functional dissimilarity among detritivorous species, not species number, drives community compositional effects on leaf litter mass loss and soil respiration, two key soil ecosystem processes. These experiments confirm theoretical predictions that biodiversity
effects on ecosystem functioning can be predicted by the degree of functional differences among species. Published in: Science (2004) 306:1019-1020 Introduction Functional redundancy of species is assumed to be a common feature in soils (Faber and Verhoef, 1991; Andrèn and Balandreau, 1999; Laakso and Setälä, 1999; Bradford et al., 2002) and experimental studies that manipulate species number often show an asymptotic response of soil processes, in which the asymptote is reached at low levels of species number (Wardle et al., 1997; Mikola et al., 2002). Even though species number per se does not appear to be important, the functional diversity of the soil community (that is, the range of species traits that determine their functional role) may affect ecosystem processes (Wardle et al., 1997; Mikola et al., 2002; Tilman et al., 2002). Functional differences may result in a variety of interactions among species.
Because of the diverse and complex nature of these interactions, it may often be difficult to predict changes in ecosystem functioning when species are lost
Biodiversity effects on soil processes
88
from or introduced into the community. The central question examined in this paper is whether we can predict the effects of changes in species composition on soil ecosystem processes if the functional dissimilarity of species in the community is known.
Soil macrofauna plays a critical role in the decomposition of dead organic matter. It is known that species differ in their effects on soil processes (Coleman and Crossley, 1996). For example, each species has a specific mode of affecting litter fragmentation or nitrification, due to contrasting functional attributes. Moreover, the effects of different species on a particular process often differ in strength. These differences may lead to interspecific interactions
that result in species mixtures performing better (facilitative interactions) or worse (inhibitory interactions) than would be expected on the basis of the mere additive effects of single species. The nature (inhibitory, neutral, or facilitative) of these interactions might be related to the degree in which species differ in their impact on soil processes. We hypothesized that species mixtures that contain species with different effects on ecosystem processes (species that are functionally dissimilar as to these processes) show facilitative interactions, irrespective of the number of species or taxonomic groups involved. Functional dissimilarity was assessed in terms of the effects of the various species on four ecosystem process variables: leaf litter mass loss, leaf litter fragmentation, soil respiration, and nitrification, all of which are related to the process of decomposition. Thus, instead of focusing on ecological attributes of species that are associated with their functional impact (Walker et al., 1999), we directly measured their effect on ecosystem processes. Material and Methods We manipulated species composition in soil microcosms (Supporting online material) with an increasing number of macrodetritivores: zero, one, two, four, and eight species per microcosm (Table S1). Species were selected from the grassland macrofauna community of a river floodplain (Supporting online material). Single-species treatments of all eight species were included in the experimental design to quantify their per-capita effects on soil process rates, and these were used to quantify functional dissimilarity among species. To discriminate the effect of species number from other compositional effects on
process rates, different two- and four-species combinations were included in the design (Table S1). Each species was assigned randomly to multispecies treatments with the following constraints: (i) species were equally represented, and (ii) both two- and four-species combinations contained taxonomic group diversity [one versus two taxonomic groups and two versus three taxonomic
groups, respectively (Table S1)]. Total earthworm biomass and total arthropod
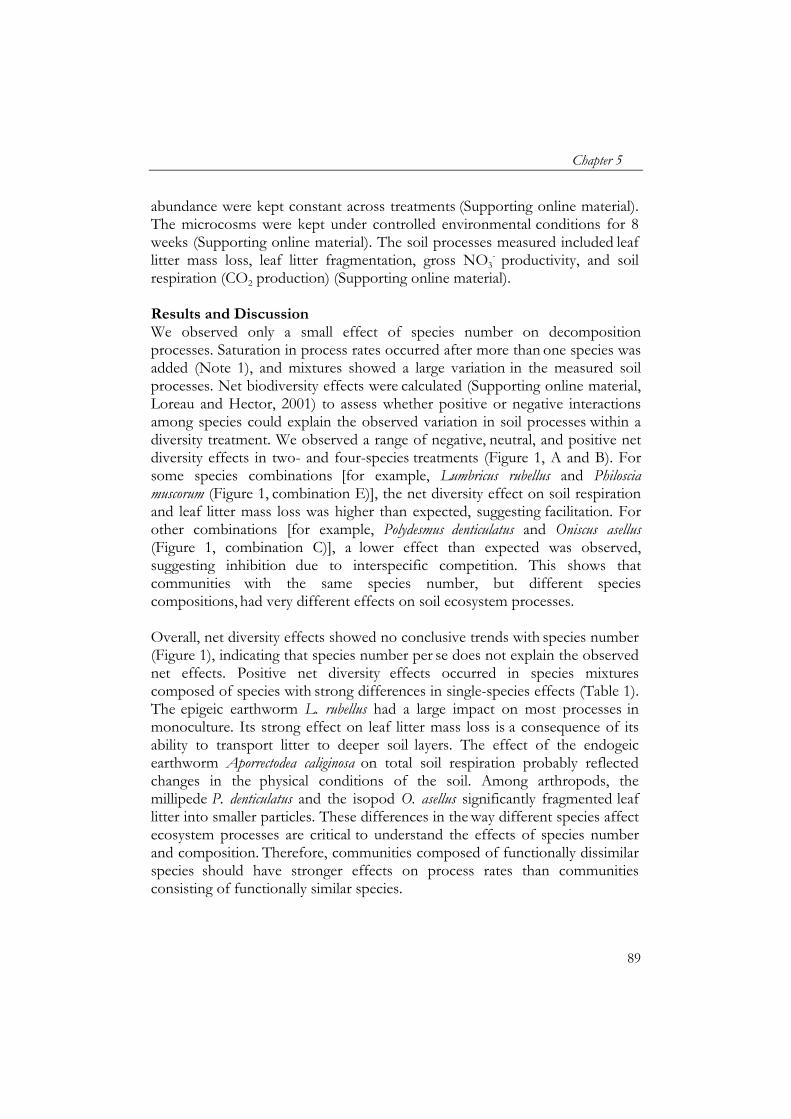
Chapter 5
89
abundance were kept constant across treatments (Supporting online material). The microcosms were kept under controlled environmental conditions for 8 weeks (Supporting online material). The soil processes measured included leaf litter mass loss, leaf litter fragmentation, gross NO3
- productivity, and soil respiration (CO2 production) (Supporting online material). Results and Discussion We observed only a small effect of species number on decomposition
processes. Saturation in process rates occurred after more than one species was added (Note 1), and mixtures showed a large variation in the measured soil processes. Net biodiversity effects were calculated (Supporting online material, Loreau and Hector, 2001) to assess whether positive or negative interactions
among species could explain the observed variation in soil processes within a diversity treatment. We observed a range of negative, neutral, and positive net diversity effects in two- and four-species treatments (Figure 1, A and B). For some species combinations [for example, Lumbricus rubellus and Philoscia muscorum (Figure 1, combination E)], the net diversity effect on soil respiration
and leaf litter mass loss was higher than expected, suggesting facilitation. For other combinations [for example, Polydesmus denticulatus and Oniscus asellus (Figure 1, combination C)], a lower effect than expected was observed, suggesting inhibition due to interspecific competition. This shows that communities with the same species number, but different species compositions, had very different effects on soil ecosystem processes. Overall, net diversity effects showed no conclusive trends with species number (Figure 1), indicating that species number per se does not explain the observed net effects. Positive net diversity effects occurred in species mixtures composed of species with strong differences in single-species effects (Table 1). The epigeic earthworm L. rubellus had a large impact on most processes in monoculture. Its strong effect on leaf litter mass loss is a consequence of its ability to transport litter to deeper soil layers. The effect of the endogeic earthworm Aporrectodea caliginosa on total soil respiration probably reflected changes in the physical conditions of the soil. Among arthropods, the millipede P. denticulatus and the isopod O. asellus significantly fragmented leaf litter into smaller particles. These differences in the way different species affect ecosystem processes are critical to understand the effects of species number and composition. Therefore, communities composed of functionally dissimilar species should have stronger effects on process rates than communities
consisting of functionally similar species.
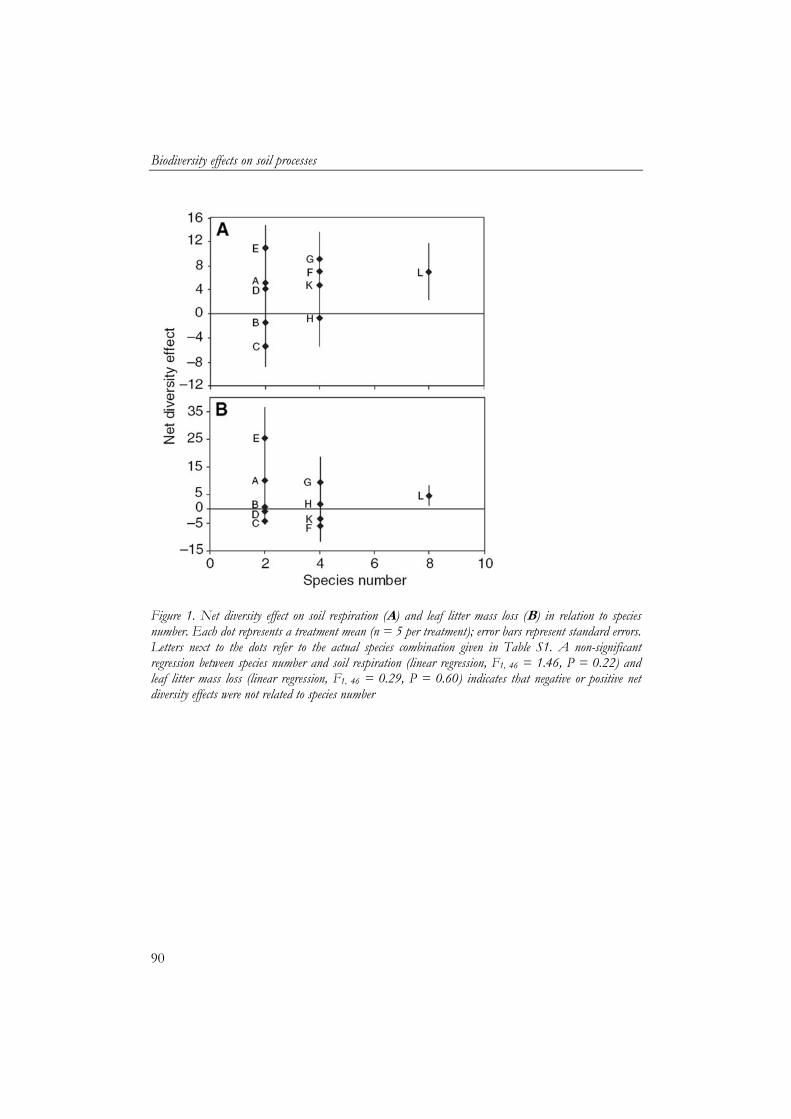
Biodiversity effects on soil processes
90
Figure 1. Net diversity effect on soil respiration (A) and leaf litter mass loss (B) in relation to species number. Each dot represents a treatment mean (n = 5 per treatment); error bars represent standard errors. Letters next to the dots refer to the actual species combination given in Table S1. A non-significant regression between species number and soil respiration (linear regression, F1, 46 = 1.46, P = 0.22) and leaf litter mass loss (linear regression, F1, 46 = 0.29, P = 0.60) indicates that negative or positive net diversity effects were not related to species number
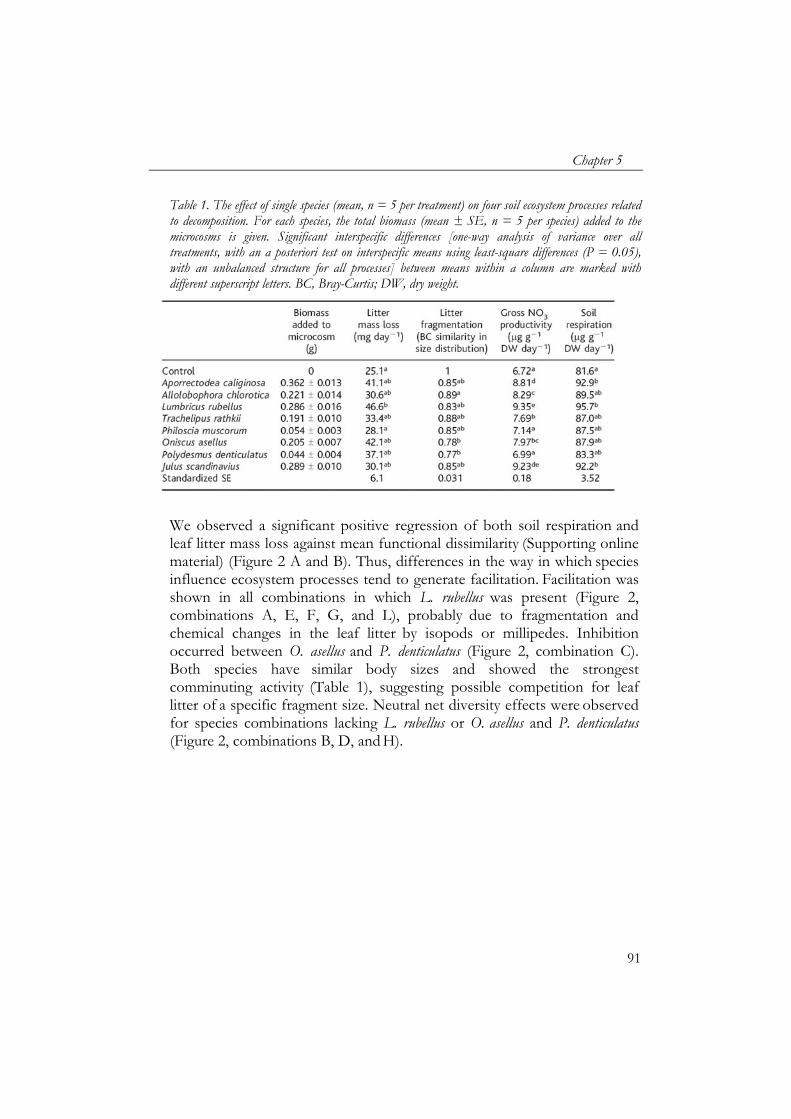
Chapter 5
91
Table 1. The effect of single species (mean, n = 5 per treatment) on four soil ecosystem processes related to decomposition. For each species, the total biomass (mean ± SE, n = 5 per species) added to the microcosms is given. Significant interspecific differences [one-way analysis of variance over all treatments, with an a posteriori test on interspecific means using least-square differences (P = 0.05), with an unbalanced structure for all processes] between means within a column are marked with different superscript letters. BC, Bray-Curtis; DW, dry weight.
We observed a significant positive regression of both soil respiration and leaf litter mass loss against mean functional dissimilarity (Supporting online material) (Figure 2 A and B). Thus, differences in the way in which species influence ecosystem processes tend to generate facilitation. Facilitation was shown in all combinations in which L. rubellus was present (Figure 2, combinations A, E, F, G, and L), probably due to fragmentation and chemical changes in the leaf litter by isopods or millipedes. Inhibition occurred between O. asellus and P. denticulatus (Figure 2, combination C). Both species have similar body sizes and showed the strongest comminuting activity (Table 1), suggesting possible competition for leaf litter of a specific fragment size. Neutral net diversity effects were observed for species combinations lacking L. rubellus or O. asellus and P. denticulatus (Figure 2, combinations B, D, and H).
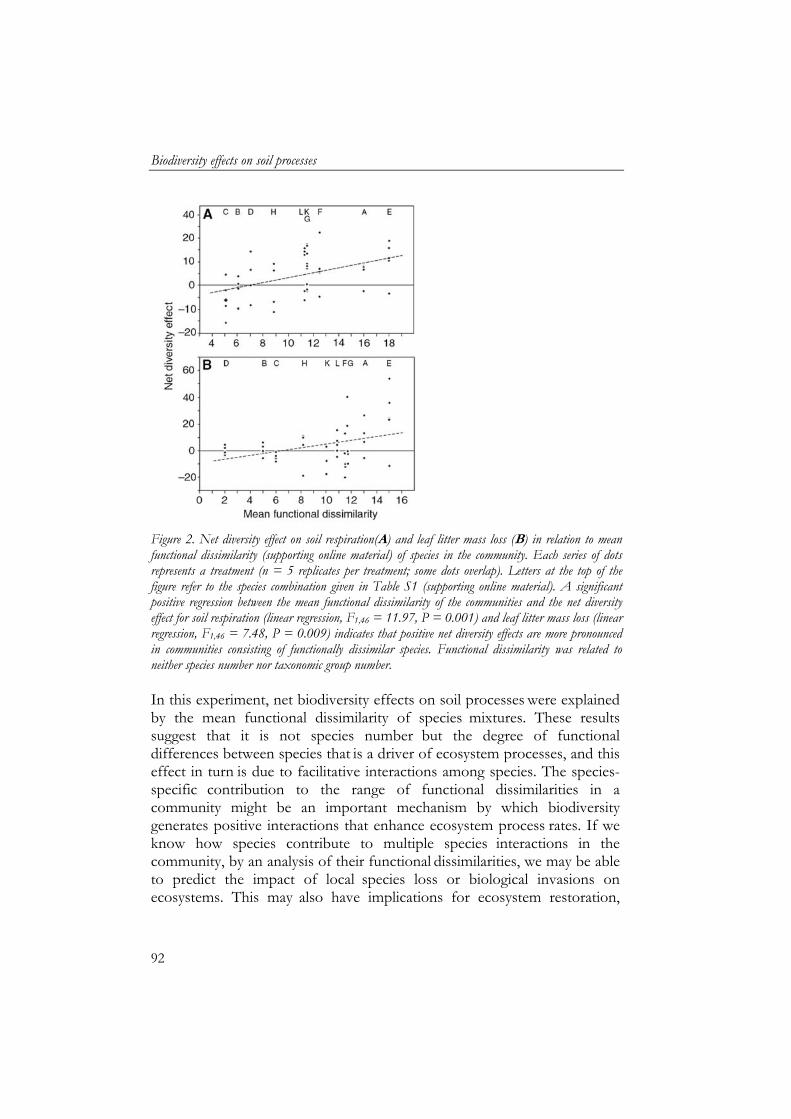
Biodiversity effects on soil processes
92
Figure 2. Net diversity effect on soil respiration(A) and leaf litter mass loss (B) in relation to mean functional dissimilarity (supporting online material) of species in the community. Each series of dots represents a treatment (n = 5 replicates per treatment; some dots overlap). Letters at the top of the figure refer to the species combination given in Table S1 (supporting online material). A significant positive regression between the mean functional dissimilarity of the communities and the net diversity effect for soil respiration (linear regression, F1,46 = 11.97, P = 0.001) and leaf litter mass loss (linear regression, F1,46 = 7.48, P = 0.009) indicates that positive net diversity effects are more pronounced in communities consisting of functionally dissimilar species. Functional dissimilarity was related to neither species number nor taxonomic group number. In this experiment, net biodiversity effects on soil processes were explained by the mean functional dissimilarity of species mixtures. These results suggest that it is not species number but the degree of functional differences between species that is a driver of ecosystem processes, and this effect in turn is due to facilitative interactions among species. The species-specific contribution to the range of functional dissimilarities in a
community might be an important mechanism by which biodiversity
generates positive interactions that enhance ecosystem process rates. If we know how species contribute to multiple species interactions in the community, by an analysis of their functional dissimilarities, we may be able to predict the impact of local species loss or biological invasions on ecosystems. This may also have implications for ecosystem restoration,
Chapter 5
93
which may require the introduction of particular functionally dissimilar
species or species combinations into impoverished ecosystems. Acknowledgements We thank D. Wardle for the stimulating discussions. M.P.B. was financially supported by an academy fellowship of the Royal Netherlands Academy of Science. The investigation was supported by the Arts and Sciences Research Council for Earth and Life Sciences (ALW), with financial aid from the Netherlands Organization for Scientific Research (NWO) and from the Dutch Ministry of Agriculture, Nature and Food Quality through DWK program 384. Notes Note 1. The relations between species number and soil process rates were
best explained by exponential regression (curve fits of linear regression and exponential regression were compared using their residual sum of squares). Leaf mass loss: exponential regression, F2,89 = 4.52, P = 0.013, saturation of process rate after one species; leaf fragmentation: F2,89 = 3.81, P = 0.026, saturation of process rate at one species; gross nitrate productivity: F2, 89 = 11.21, P < 0.001, saturation of process rate after one species; soil respiration: F2, 87 = 10.15, P < 0.001, saturation after wo species.
Supporting online material Microcosm design The experiment was performed using transparent poly-ethylene microcosms (Ø12.5 cm, 20 cm height). Each microcosm contained a 7 cm thick layer of non-sterilized field soil (750 g clay soil, moisture content 32.4%, OM content 10%, pHH2O = 7.4) from which only macrodetritivores were removed by hand sorting. Other major soil organisms groups were present. The layer of field soil was covered with a layer of alder leaves (Alnus glutinosa) as organic matter resource. Alder leaves were collected from the ground, one month after leaf fall. After an acclimation period of ten days the animals were added to the microcosms, which were randomly placed in a climate room. The experiment lasted for seven weeks.
Biodiversity effects on soil processes
94
Species selection We selected eight out of the nine species of macrodetritivores from a river floodplain (Afferdense en Deestse floodplain of the river Waal, the Netherlands). The species selected were very common and belonged to three taxonomic groups, i.e. Annelida: Aporrectodea caliginosa, Allolobophora chlorotica, and Lumbricus rubellus, Isopoda: Philoscia muscorum, Oniscus asellus and Trachelipus rathkii; and Diplopoda: Polydesmus denticulatus and Julus scandinavius. The earthworm Lumbricus terrestris was not selected, as we know from earlier laboratory experiments that this species does not thrive in the used microcosms. Earthworm biomass and macro-arthropod abundance added to the microcosms were based on field observations (Persson and Lohm, 1977). Equality of animal biomass and abundance Our original intention was to keep the total biomass of all treatments equal. However, given the much higher individual body mass of earthworms compared with arthropods, this would have resulted in unnaturally high arthropod abundances in some treatments. Therefore, the total biomass of earthworms was kept constant (0.290 mg) in all treatments, while for arthropods total abundance (12 individuals) was kept constant. The measured soil process rates, however, were not correlated with either total biomass or total abundance in the treatments. Microcosm climate Microcosms were placed in a climate room at 15 °C, a relative humidity of 80% and a light/dark regime of 12/12 hours. Microcosms were randomly distributed over two water baths, used to buffer possible temperature fluctuations in the climate room. Estimation of leaf litter mass loss, leaf litter fragmentation, gross nitrate productivity and soil respiration Leaf litter mass loss (mg /day) was measured as the difference in dry weight before and after incubation. Air-dried leaf litter was sieved over 16, 8, 4, and 2 mm sieves to obtain five leaf litter fractions. The average size distribution of the control at the start of the experiment was set to 1. Leaf litter fragmentation was expressed as the change in the litter fragment size distribution after incubation, using Bray-Curtis similarity index. Gross NO3- productivity (μg NO3
- /g DW /day) was measured after shaking 20 g of soil in 200 mL 1M KCl solution for 12 hours. Soil respiration (μg CO2 g
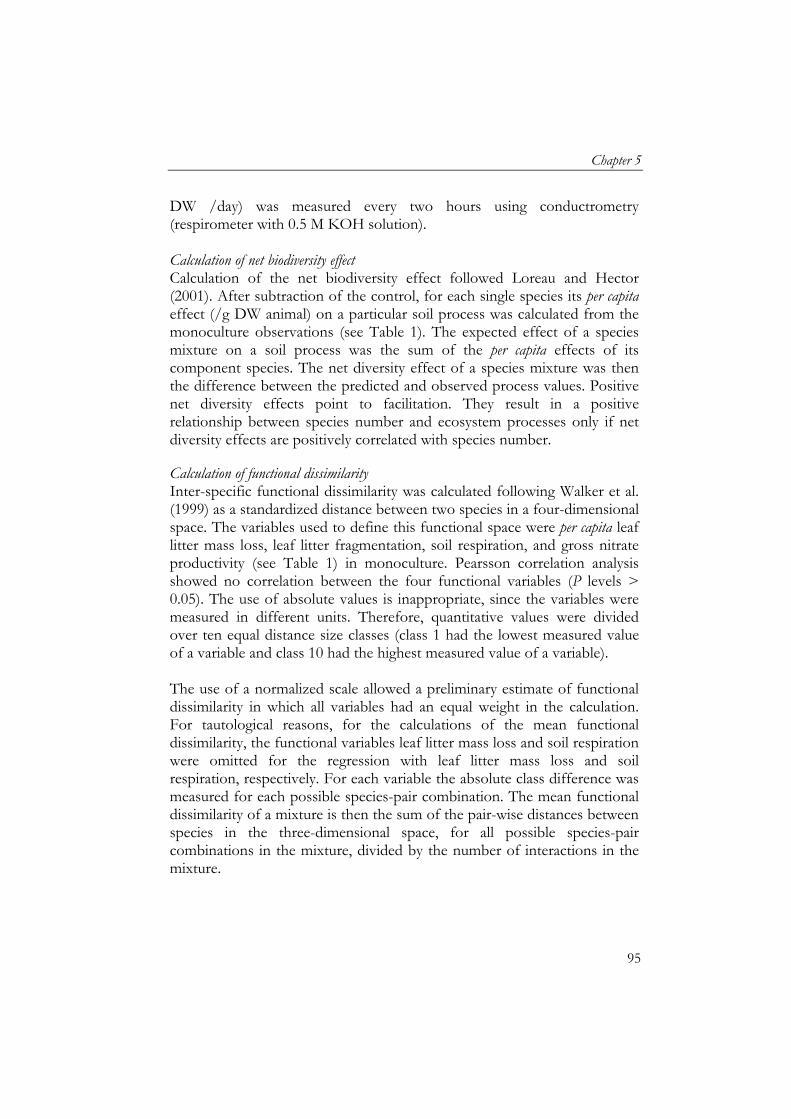
Chapter 5
95
DW /day) was measured every two hours using conductrometry (respirometer with 0.5 M KOH solution). Calculation of net biodiversity effect Calculation of the net biodiversity effect followed Loreau and Hector (2001). After subtraction of the control, for each single species its per capita effect (/g DW animal) on a particular soil process was calculated from the monoculture observations (see Table 1). The expected effect of a species mixture on a soil process was the sum of the per capita effects of its component species. The net diversity effect of a species mixture was then the difference between the predicted and observed process values. Positive net diversity effects point to facilitation. They result in a positive relationship between species number and ecosystem processes only if net diversity effects are positively correlated with species number. Calculation of functional dissimilarity Inter-specific functional dissimilarity was calculated following Walker et al. (1999) as a standardized distance between two species in a four-dimensional space. The variables used to define this functional space were per capita leaf litter mass loss, leaf litter fragmentation, soil respiration, and gross nitrate productivity (see Table 1) in monoculture. Pearsson correlation analysis showed no correlation between the four functional variables (P levels > 0.05). The use of absolute values is inappropriate, since the variables were measured in different units. Therefore, quantitative values were divided over ten equal distance size classes (class 1 had the lowest measured value of a variable and class 10 had the highest measured value of a variable). The use of a normalized scale allowed a preliminary estimate of functional dissimilarity in which all variables had an equal weight in the calculation. For tautological reasons, for the calculations of the mean functional dissimilarity, the functional variables leaf litter mass loss and soil respiration were omitted for the regression with leaf litter mass loss and soil respiration, respectively. For each variable the absolute class difference was measured for each possible species-pair combination. The mean functional dissimilarity of a mixture is then the sum of the pair-wise distances between species in the three-dimensional space, for all possible species-pair combinations in the mixture, divided by the number of interactions in the mixture.
Biodiversity effects on soil processes
96
Table S1. Species combinations and number of individuals added to the various microcosms. For each species the number of individuals added is given between brackets. Care was taken to add a similar amount of biomass per treatment to each microcosm. If this was not possible, due to large differences in body size, then a similar amount of individuals was added. Three detritivore taxa were included in the design, with two or three species per taxon, i.e. Annelida: Aporrectodea caliginosa (CAL), Allolobophora chlorotica (CHL), and Lumbricus rubellus (RUB); Isopoda: Trachelipus rathkii (RAT), Philoscia muscorum (MUS), and Oniscus asellus (ASE); Diplopoda: Polydesmus denticulatus (DEN) and Julus scandinavius (SCA). Each treatment was replicated five times.
Chapter 6
97
6 Functional identity of soil detritivores explains both community diversity effects and species interactions

Chapter 6
99
6 Functional identity of soil detritivores explains both community diversity effects and species interactions
D.A. Heemsbergenab, J.R. van Hala, J.H. Faber a, H.A. Verhoefb and M.P. Bergb, a Alterra, Wageningen University and Research Centre, P.O. Box 47, 6700
AA Wageningen, The Netherlands b VU University, Amsterdam, De Boelelaan 1085, 1081 HV Amsterdam,
The Netherlands Abstract Global biodiversity is currently undergoing dramatic changes in distribution and abundance, and the possible consequences of these changes for ecosystem processes have been the subject of increasing attention. In this study the balance between species diversity, species identity and interactions among species of macrodetritivores on four key soil processes, i.e. leaf litter mass loss, leaf litter fragmentation, soil respiration, and nitrification was assessed using microcosms with increasing diversity of detritivores. All four soil processes showed an asymptotic relationship with species diversity. This was probably due to the sampling selection effect as the earthworm Lumbricus rubellus was identified as a key species. However, there were significant species compositional effects in the different combinations with the same diversity. Species compositional effects were explained by the functional differences between species. The amount of functional differences between species determined the presence of facilitative or inhibitory interactions. The importance of a specific species or species combination differed between soil processes, suggesting that different mechanisms operate for different soil processes. This confirms that theories of how species diversity affects ecosystem processes cannot be easily generalised. Keywords: functional biodiversity, soil fauna, decomposition, ecosystem functioning, redundancy
Functional identity of soil detritivores
100
Introduction Global biodiversity is currently undergoing dramatic changes and the possible consequences of these changes for ecosystem processes have been the subject of increasing attention (Chapin et al., 2000; Loreau et al., 2002; Millennium Ecosystem Assessment, 2005). Early studies on the relationship between diversity and ecosystem functioning were mainly focussing on whether single-species selection effects driven by dominant species are sufficient to explain changes in process rates. Recent experimental data have failed to support this hypothesis for plant biomass production in grassland ecosystems, thereby providing some evidence for functional complementarity among species (Tilman et al., 2001; van Ruijven and Berendse, 2005; Kahmen et al., 2006). However, there is increasing recognition that complementarity and selection effects are generated by species interactions and occur in combination (Loreau et al., 2001; Fox, 2005). There is, therefore, a need for a new type of experiments which focus on interactions and functional dissimilarities among species (Nijs and Roy, 2001; Schmid et al., 2002; Petchey and Gaston, 2006).
Although the outcome of studies on soil biodiversity and ecosystem functioning remain ambiguous (Mikola et al., 2002; Bardgett et al., 2005), often an asymptotic response is found between soil processes rates and species number, saturating at relatively low levels of species richness (Faber and Verhoef, 1991; Wardle et al., 1997; Laakso and Setälä, 1999, Bradford et al., 2002). These findings suggest a high level of functional redundancy and in current theories on how soil biodiversity affects ecosystem process rates, the focus is, therefore, on the diversity in functional groups (Bengtsson, 1998; Jones and Bradford, 2001; Srivastava, 2002). This shift of emphasis from species to functional traits within a community does imply that one has to know the functional identity of the species in a community.
Species-specific differences in mode and strength of their effect on soil processes may lead to interspecific interactions which result in species mixtures with a higher impact (facilitation) or a lower impact (inhibition) on soil processes than expected from their individual influence. Predicting the outcome of these interactions is hard due to the diverse and complex nature of the species and the ecosystem processes involved. In this study the balance between species number, species identity and interactions among species of macrodetritivores was assessed on four key soil processes, i.e. leaf litter mass loss, leaf litter fragmentation, soil respiration, and nitrification. A microcosm study was established in which we manipulated the number and composition of macrodetritivores. Macrodetritivores have a direct (as they feed on organic matter) and indirect (interactions with microorganisms)
Chapter 6
101
impact on these decomposition processes (Petersen and Luxton, 1982; Coleman and Crossley, 1996). The main hypothesis was that compositional changes in the soil macrodetritivore community affect soil process rates. We hypothesized that (i) soil process rates saturate at low levels of species number, (ii) species composition explains process rates better than species number and (iii) that species compositional effects can be explained by functional dissimilarity between species. Functional dissimilarities of species were assessed in terms of the effects species had on four ecosystem process variables. Furthermore, we analysed how the functional attributes of species were related to their ecological attributes that are associated with their functional impact. Materials and methods Species Eight dominant macrodetritivores of a river floodplain were selected; i.e. three Annelida, Aporrectodea caliginosa (Savigny, 1826), Allolobophora chlorotica (Savigny, 1826), and Lumbricus rubellus (Hoffmeister, 1843), three Isopoda, Philoscia muscorum (Scopoli, 1763), Oniscus asellus (Linnaeus, 1758), and Trachelipus rathkii (Brandt, 1833) and two Diplopoda, Polydesmus denticulatus (CL Koch, 1847) and Julus scandinavius (Latzel, 1884). Species were acclimated minimally one month on floodplain soil to which alder leaves were added as resource. Either sub adults or adults were sampled, based on clitellum presence or development (Annelida) or body size (Isopoda and Diplopoda). Species characteristics are given in Table 1. Experimental design Four levels of species number were created: one, two, four and eight species per microcosm (Table 2). Monocultures were used to quantify the per-capita effect of a species on soil process rates. This enabled to predict the contribution of a species in the multi-species treatment, to assess if net-diversity effects of multi-species treatments occur (see below), and to assess if a species has a disproportionate effect on a process, i.e. the selection probability effect (Huston, 1997; Allison, 1999). Five different 2-species treatments and four different 4-species treatments were created to differentiate between effect of species composition, species richness and taxon richness (Table 2). Species were assigned randomly with constraints to a multi-species treatment to decrease type I errors that can occur when identity of species interacts with species richness (Hector et al., 1999; Benedetti-Cecchi, 2004). The constrictions were that i) each species should
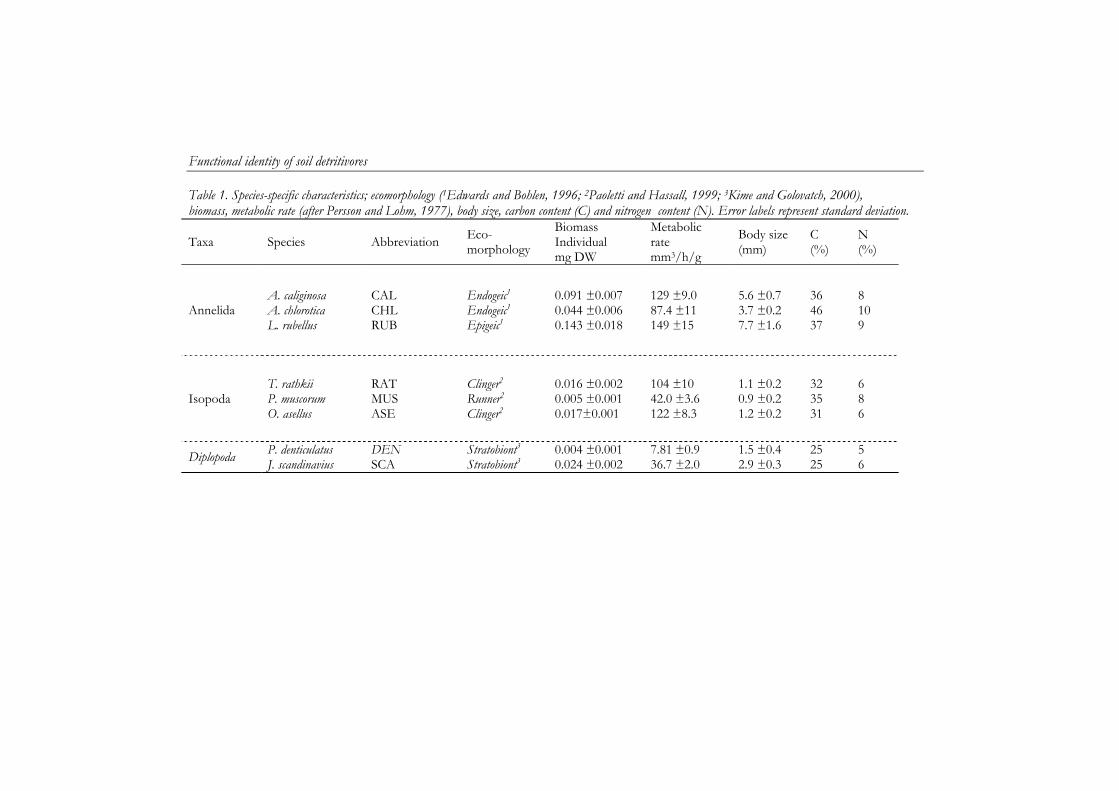
Functional identity of soil detritivores
102
Table 1. Species-specific characteristics; ecomorphology (1Edwards and Bohlen, 1996; 2Paoletti and Hassall, 1999; 3Kime and Golovatch, 2000), biomass, metabolic rate (after Persson and Lohm, 1977), body size, carbon content (C) and nitrogen content (N). Error labels represent standard deviation.
Taxa Species Abbreviation Eco-morphology
Biomass Individual mg DW
Metabolic rate mm3/h/g
Body size (mm)
C (%)
N (%)
Annelida A. caliginosa A. chlorotica L. rubellus
CAL CHL RUB
Endogeic1
Endogeic1
Epigeic1
0.091 ±0.007 0.044 ±0.006 0.143 ±0.018
129 ±9.0 87.4 ±11 149 ±15
5.6 ±0.7 3.7 ±0.2 7.7 ±1.6
36 46 37
8 10 9
Isopoda T. rathkii P. muscorum O. asellus
RAT MUS ASE
Clinger2 Runner2 Clinger2
0.016 ±0.002 0.005 ±0.001 0.017±0.001
104 ±10 42.0 ±3.6 122 ±8.3
1.1 ±0.2 0.9 ±0.2 1.2 ±0.2
32 35 31
6 8 6
Diplopoda P. denticulatus J. scandinavius
DEN SCA
Stratobiont3 Stratobiont3
0.004 ±0.001 0.024 ±0.002
7.81 ±0.9 36.7 ±2.0
1.5 ±0.4 2.9 ±0.3
25 25
5 6
Chapter 6
103
be equally represented at each level of species richness, and ii) the 2-species and 4-species treatment contained combinations of species originating from one or two taxa or two or three taxa, respectively. In microcosms without detritivores the effect of detritivore addition on soil processes was assessed. The experimental design consisted of 19 treatments (n = 5 each). The experiment was conducted in spring 2002 and lasted 65 days (including 10 days of acclimation), when in some treatments about 75% of the alder leaf litter had disappeared. Treatments were standardized to account for possible impact of increased species richness on abundance, biomass or metabolic rate. Earthworm abundances were based on field observations. The biomass could not be kept constant as that would cause over-crowding and thereby a potential artefact. Therefore the number of arthropod individuals was kept constant between treatments (12 individuals per microcosm, based on density data by Persson and Lohm, 1977), with the exception of the 2-species treatment A. caliginosa and J. scandinavius (6 individuals). Due to equality of the number of arthropods biomasses varied a factor 1-15 between arthropod treatments and a factor 1-20 with earthworm biomasses. Because the biomass could not be kept constant in the treatments, we calculated the metabolic rate of the species. Metabolic rate indicates the potential use of litter by the species with the advantage over biomass that it includes species activity. Metabolic rate (Q) of individuals (O2 consumption in mm3/hour/g FW) was calculated with the equation;
Q = y · FW x (1) Parameters x and y are species specific, A. chlorotica and A. caliginosa, y = 78, x = 0.91; L. rubellus, y = 93, x = 0.84; millipedes, y = 36.5, x = 0.73 and isopods, y = 176.1, x = 0.84 (Persson and Lohm, 1977).
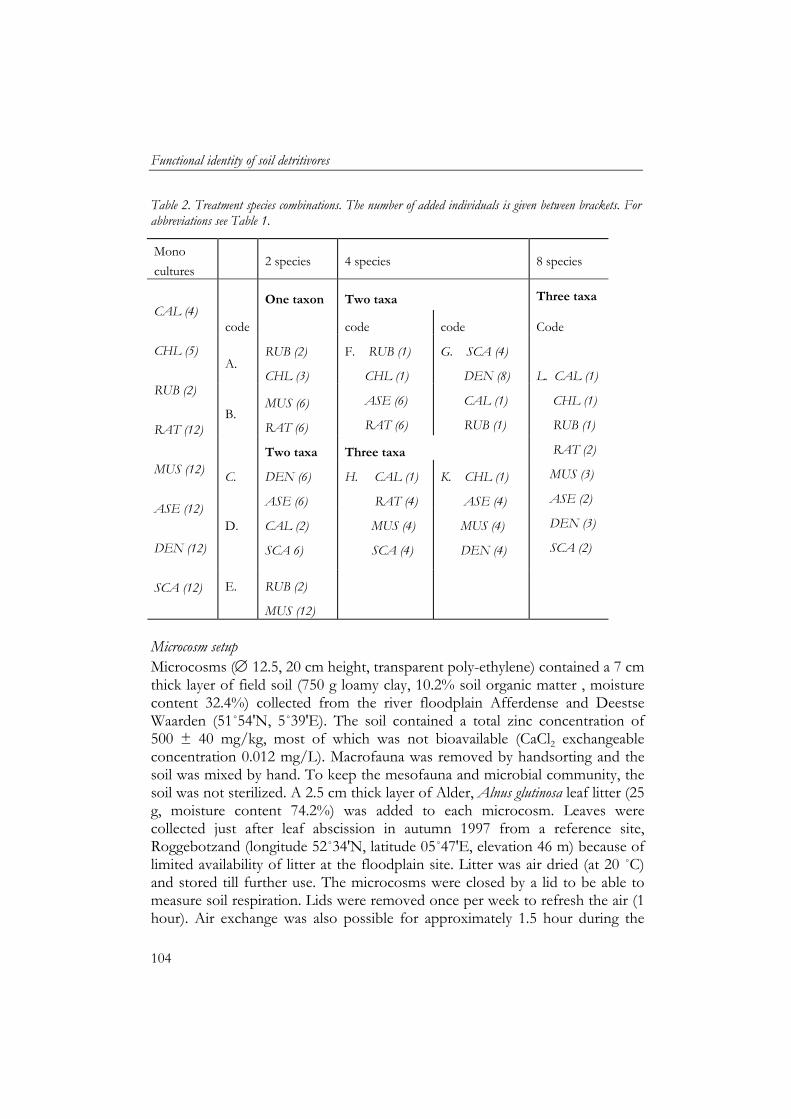
Functional identity of soil detritivores
104
Table 2. Treatment species combinations. The number of added individuals is given between brackets. For abbreviations see Table 1.
Microcosm setup Microcosms ( 12.5, 20 cm height, transparent poly-ethylene) contained a 7 cm thick layer of field soil (750 g loamy clay, 10.2% soil organic matter , moisture content 32.4%) collected from the river floodplain Afferdense and Deestse Waarden (51˚54'N, 5˚39'E). The soil contained a total zinc concentration of 500 ± 40 mg/kg, most of which was not bioavailable (CaCl2 exchangeable concentration 0.012 mg/L). Macrofauna was removed by handsorting and the soil was mixed by hand. To keep the mesofauna and microbial community, the soil was not sterilized. A 2.5 cm thick layer of Alder, Alnus glutinosa leaf litter (25 g, moisture content 74.2%) was added to each microcosm. Leaves were collected just after leaf abscission in autumn 1997 from a reference site, Roggebotzand (longitude 52˚34'N, latitude 05˚47'E, elevation 46 m) because of limited availability of litter at the floodplain site. Litter was air dried (at 20 ˚C) and stored till further use. The microcosms were closed by a lid to be able to measure soil respiration. Lids were removed once per week to refresh the air (1 hour). Air exchange was also possible for approximately 1.5 hour during the
Mono
cultures
2 species 4 species 8 species
One taxon Two taxa Three taxa
code code code Code
A. RUB (2)
CHL (3)
B. MUS (6)
RAT (6)
F. RUB (1)
CHL (1)
ASE (6)
RAT (6)
G. SCA (4)
DEN (8)
CAL (1)
RUB (1)
Two taxa Three taxa
C. DEN (6)
ASE (6)
D. CAL (2)
SCA 6)
CAL (4)
CHL (5)
RUB (2)
RAT (12)
MUS (12)
ASE (12)
DEN (12)
SCA (12) E. RUB (2)
MUS (12)
H. CAL (1)
RAT (4)
MUS (4)
SCA (4)
K. CHL (1)
ASE (4)
MUS (4)
DEN (4)
L. CAL (1)
CHL (1)
RUB (1)
RAT (2)
MUS (3)
ASE (2)
DEN (3)
SCA (2)
Chapter 6
105
refreshing of the KOH solution (see CO2 measurements), which occurred every 1-3 days.
Microcosms were placed in a climate room with climate settings similar to autumn (15 °C, 80% RH, light/dark regime 12/12 hours). Microcosms were randomly distributed over two water baths to buffer possible temperature fluctuations. After an acclimation period of 10 days, to let excess water evaporate and to activate the microbial community, macrodetritivores were introduced into the microcosms. Measurements Animal survival was estimated by weekly visual observations, without disturbing the litter. Dead animals in the microcosm were not replaced, with the exception of dead animals found in the KOH container (for CO2 measurement, see below).
After eight weeks of incubation the microcosms were destructively sampled. Soil columns were divided into a litter layer and two soil layers (0–3.5 cm and 3.5–7 cm). Animals were counted and their body mass was measured gravimetrically to the nearest 0.01 mg. Soil layers were homogenised and stored at 2 °C. NO3
- and NH4+ were extracted by shaking 20 g soil or 4 g litter in 200
mL 1 M KCl solution for 12 hours. The suspension was centrifuged (10 minutes at 3000 rpm) and analysed on an auto-analyser (Skalar SA 40). Soil organic matter content was measured by ash furnacing of 20 g soil at 550 ˚C for three hours. Litter fragment size distributions was measured after air-drying of leaves, sieved over sieves with mesh sizes of 16, 8, 4, and 2 mm after which the size fractions were weighed. Soil respiration in the microcosms was measured every two hours using conductrometry (0.5 M KOH, respirometer) adapted from Doelman and Haanstra (1979). A reference cell was included to measure CO2 leaching during opening of microcosms.
Suspensions for bacterial and fungal analyses were made by mixing 20 g soil with 190 mL or 2 g leaves with 95 mL demiwater for one minute using a blender. After mixing, a 9 mL sample was taken and 1 mL formalin (40%) was added for fixation. Suspensions were stored at 2 ºC. Bacteria were stained using the vital-staining method of DTAF (Bloem et al., 1999) and counted using confocal laser scanning microscopy (image analyses by computer, Bloem et al., 1999). Fungi were differential fluorescent stained, a vital stain method that differentiates between active and inactive mycelia (Morris et al., 1997) and counted under a fluorescence microscope (100x10, UV-light).
Functional identity of soil detritivores
106
Carbon and nitrogen content of dried (40 ºC, 12 hours) and milled animals were analysed using an element analyser (Carlo Erba Strumentazione elemental analyser, model 1106). Species identity and the net species effect in multiple species treatment A net diversity effect indicates if the impact of multiple-species treatments on soil processes is more than just the sum of its constituent species (after Loreau and Hector, 2001). The per-capita effect (effect per g initial DW animal) on a particular soil process (Si) was calculated from monoculture observations, assuming a linear correlation between biomass added and effect on soil processes:
Si = (Pmono - Pc) / DWi (2) of which Pmono denotes the observed process value in the monoculture, Pc the observed process value in the control without detritivores, and DWi the total dry biomass of species i in the monoculture. The expected effect of species i in a species mixture is then its per-capita process effect (Si) multiplied with the added total dry biomass of species i. The species identity effect is then the predicted effect of the species mixture on a soil process by taking the sum of the individual expected species effects:
The net diversity effect (Δ Pnet), the net resultant of interactions among species, was calculated by subtracting the species identity effect (PEj) from the observed value (Pmulti) minus the control value (Pc). Values higher than zero indicate a positive interaction (e.g. facilitation or complementarity) between the species, while values below zero indicate a negative interaction (e.g. competition, inhibition) between the species. Calculations and statistical methods Nitrate production in litter and soil was summed to a total gross NO3
- production and soil respiration was expressed as a cumulative value. Changes in litter fragment size distributions were analysed with the Bray-Curtis index of similarity (Legendre and Legendre, 1998).
As we lost some microcosms due to KOH poisoning, an ANOVA with unbalanced treatment structure was used (Krebs, 1999) to assess if individual treatments were different from the control. Skewed data were log-transformed.
n
PEj = Σi Pij (3) j=1
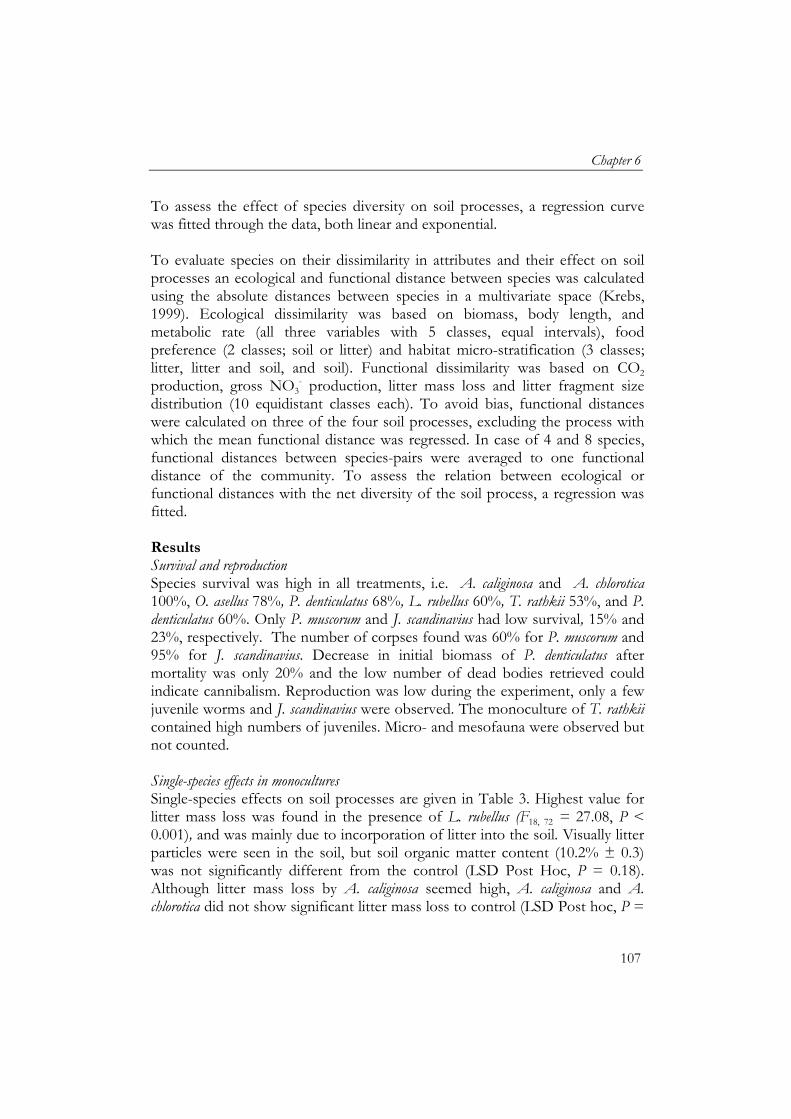
Chapter 6
107
To assess the effect of species diversity on soil processes, a regression curve was fitted through the data, both linear and exponential. To evaluate species on their dissimilarity in attributes and their effect on soil processes an ecological and functional distance between species was calculated using the absolute distances between species in a multivariate space (Krebs, 1999). Ecological dissimilarity was based on biomass, body length, and metabolic rate (all three variables with 5 classes, equal intervals), food preference (2 classes; soil or litter) and habitat micro-stratification (3 classes; litter, litter and soil, and soil). Functional dissimilarity was based on CO2 production, gross NO3
- production, litter mass loss and litter fragment size distribution (10 equidistant classes each). To avoid bias, functional distances were calculated on three of the four soil processes, excluding the process with which the mean functional distance was regressed. In case of 4 and 8 species, functional distances between species-pairs were averaged to one functional distance of the community. To assess the relation between ecological or functional distances with the net diversity of the soil process, a regression was fitted. Results Survival and reproduction Species survival was high in all treatments, i.e. A. caliginosa and A. chlorotica 100%, O. asellus 78%, P. denticulatus 68%, L. rubellus 60%, T. rathkii 53%, and P. denticulatus 60%. Only P. muscorum and J. scandinavius had low survival, 15% and 23%, respectively. The number of corpses found was 60% for P. muscorum and 95% for J. scandinavius. Decrease in initial biomass of P. denticulatus after mortality was only 20% and the low number of dead bodies retrieved could indicate cannibalism. Reproduction was low during the experiment, only a few juvenile worms and J. scandinavius were observed. The monoculture of T. rathkii contained high numbers of juveniles. Micro- and mesofauna were observed but not counted. Single-species effects in monocultures Single-species effects on soil processes are given in Table 3. Highest value for litter mass loss was found in the presence of L. rubellus (F18, 72 = 27.08, P < 0.001), and was mainly due to incorporation of litter into the soil. Visually litter particles were seen in the soil, but soil organic matter content (10.2% ± 0.3) was not significantly different from the control (LSD Post Hoc, P = 0.18). Although litter mass loss by A. caliginosa seemed high, A. caliginosa and A. chlorotica did not show significant litter mass loss to control (LSD Post hoc, P =
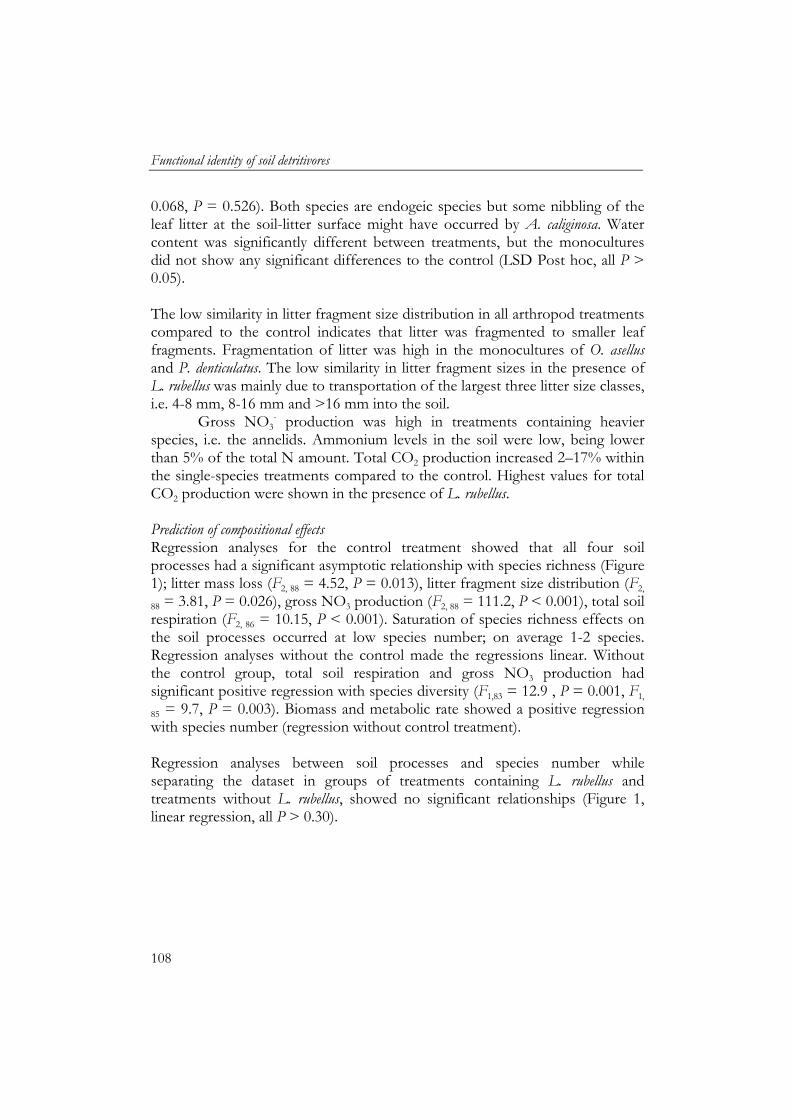
Functional identity of soil detritivores
108
0.068, P = 0.526). Both species are endogeic species but some nibbling of the leaf litter at the soil-litter surface might have occurred by A. caliginosa. Water content was significantly different between treatments, but the monocultures did not show any significant differences to the control (LSD Post hoc, all P > 0.05). The low similarity in litter fragment size distribution in all arthropod treatments compared to the control indicates that litter was fragmented to smaller leaf fragments. Fragmentation of litter was high in the monocultures of O. asellus and P. denticulatus. The low similarity in litter fragment sizes in the presence of L. rubellus was mainly due to transportation of the largest three litter size classes, i.e. 4-8 mm, 8-16 mm and >16 mm into the soil.
Gross NO3- production was high in treatments containing heavier
species, i.e. the annelids. Ammonium levels in the soil were low, being lower than 5% of the total N amount. Total CO2 production increased 2–17% within the single-species treatments compared to the control. Highest values for total CO2 production were shown in the presence of L. rubellus. Prediction of compositional effects Regression analyses for the control treatment showed that all four soil processes had a significant asymptotic relationship with species richness (Figure 1); litter mass loss (F2, 88 = 4.52, P = 0.013), litter fragment size distribution (F2,
88 = 3.81, P = 0.026), gross NO3 production (F2, 88 = 111.2, P < 0.001), total soil respiration (F2, 86 = 10.15, P < 0.001). Saturation of species richness effects on the soil processes occurred at low species number; on average 1-2 species. Regression analyses without the control made the regressions linear. Without the control group, total soil respiration and gross NO3 production had significant positive regression with species diversity (F1,83 = 12.9 , P = 0.001, F1,
85 = 9.7, P = 0.003). Biomass and metabolic rate showed a positive regression with species number (regression without control treatment). Regression analyses between soil processes and species number while separating the dataset in groups of treatments containing L. rubellus and treatments without L. rubellus, showed no significant relationships (Figure 1, linear regression, all P > 0.30).
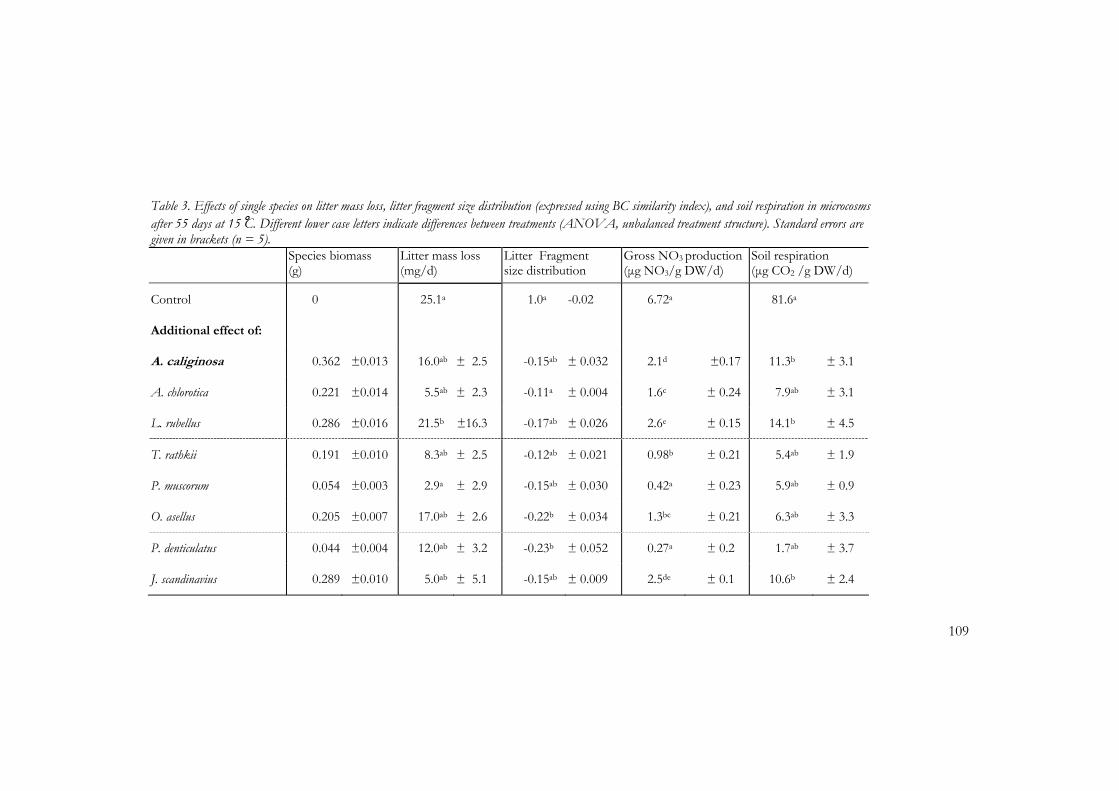
Chapter 6
109
Table 3. Effects of single species on litter mass loss, litter fragment size distribution (expressed using BC similarity index), and soil respiration in microcosms after 55 days at 15 ̊C. Different lower case letters indicate differences between treatments (ANOVA, unbalanced treatment structure). Standard errors are given in brackets (n = 5). Species biomass
(g) Litter mass loss (mg/d)
Litter Fragment size distribution
Gross NO3 production (μg NO3/g DW/d)
Soil respiration (μg CO2 /g DW/d)
Control 0 25.1a 1.0a -0.02 6.72a 81.6a
Additional effect of:
A. caliginosa 0.362 ±0.013 16.0ab ± 2.5 -0.15ab ± 0.032 2.1d ±0.17 11.3b ± 3.1
A. chlorotica 0.221 ±0.014 5.5ab ± 2.3 -0.11a ± 0.004 1.6c ± 0.24 7.9ab ± 3.1
L. rubellus 0.286 ±0.016 21.5b ±16.3 -0.17ab ± 0.026 2.6e ± 0.15 14.1b ± 4.5
T. rathkii 0.191 ±0.010 8.3ab ± 2.5 -0.12ab ± 0.021 0.98b ± 0.21 5.4ab ± 1.9
P. muscorum 0.054 ±0.003 2.9a ± 2.9 -0.15ab ± 0.030 0.42a ± 0.23 5.9ab ± 0.9
O. asellus 0.205 ±0.007 17.0ab ± 2.6 -0.22b ± 0.034 1.3bc ± 0.21 6.3ab ± 3.3
P. denticulatus 0.044 ±0.004 12.0ab ± 3.2 -0.23b ± 0.052 0.27a ± 0.2 1.7ab ± 3.7
J. scandinavius 0.289 ±0.010 5.0ab ± 5.1 -0.15ab ± 0.009 2.5de ± 0.1 10.6b ± 2.4
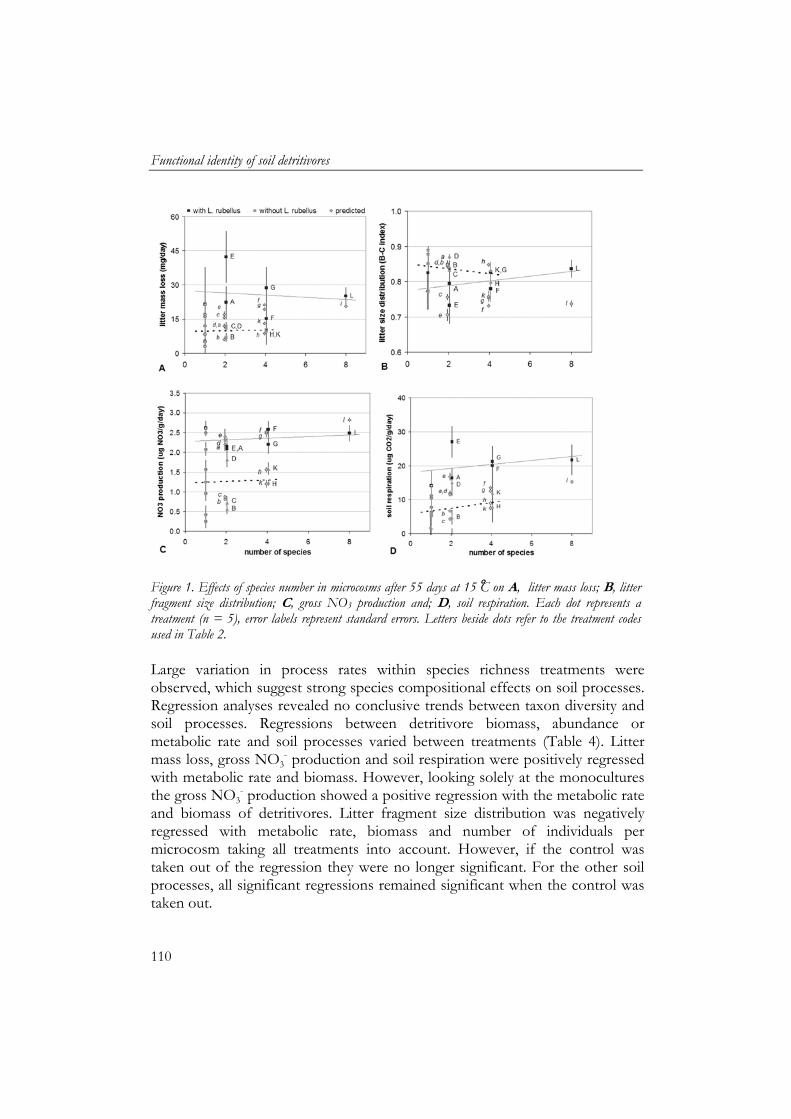
Functional identity of soil detritivores
110
Figure 1. Effects of species number in microcosms after 55 days at 15 ̊C on A, litter mass loss; B, litter fragment size distribution; C, gross NO3 production and; D, soil respiration. Each dot represents a treatment (n = 5), error labels represent standard errors. Letters beside dots refer to the treatment codes used in Table 2. Large variation in process rates within species richness treatments were observed, which suggest strong species compositional effects on soil processes. Regression analyses revealed no conclusive trends between taxon diversity and soil processes. Regressions between detritivore biomass, abundance or metabolic rate and soil processes varied between treatments (Table 4). Litter mass loss, gross NO3
- production and soil respiration were positively regressed with metabolic rate and biomass. However, looking solely at the monocultures the gross NO3
- production showed a positive regression with the metabolic rate and biomass of detritivores. Litter fragment size distribution was negatively regressed with metabolic rate, biomass and number of individuals per microcosm taking all treatments into account. However, if the control was taken out of the regression they were no longer significant. For the other soil processes, all significant regressions remained significant when the control was taken out.
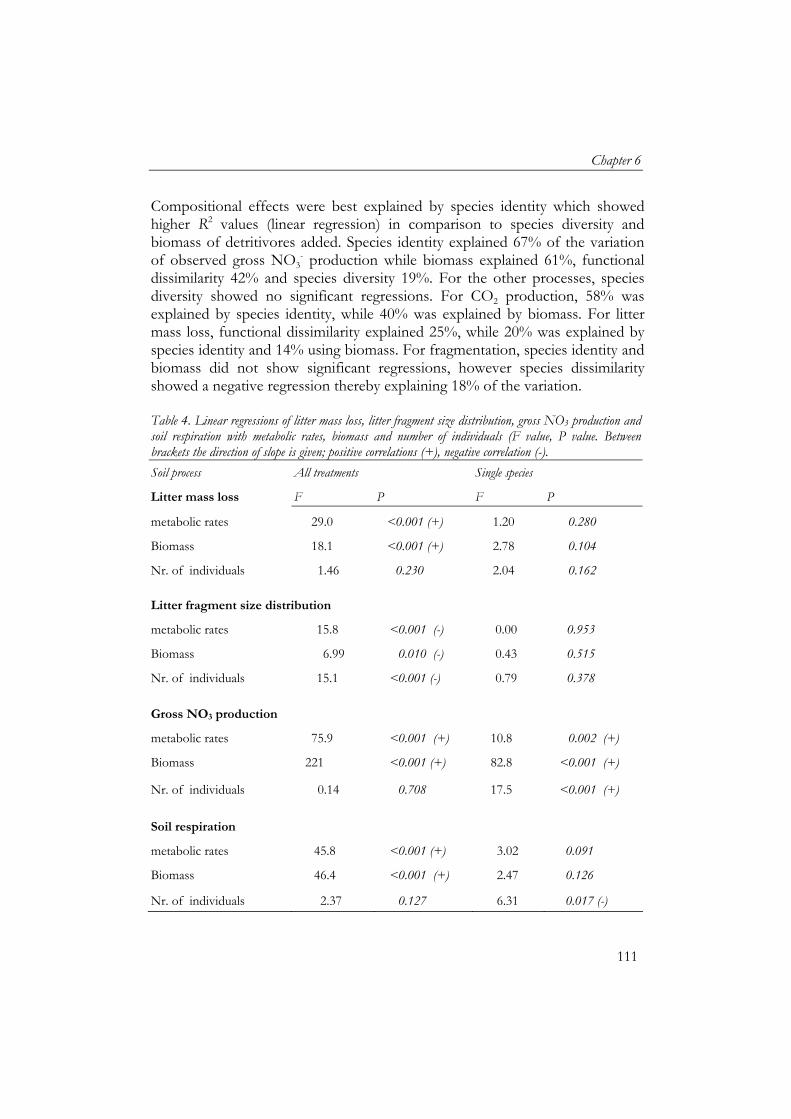
Chapter 6
111
Compositional effects were best explained by species identity which showed higher R2 values (linear regression) in comparison to species diversity and biomass of detritivores added. Species identity explained 67% of the variation of observed gross NO3
- production while biomass explained 61%, functional dissimilarity 42% and species diversity 19%. For the other processes, species diversity showed no significant regressions. For CO2 production, 58% was explained by species identity, while 40% was explained by biomass. For litter mass loss, functional dissimilarity explained 25%, while 20% was explained by species identity and 14% using biomass. For fragmentation, species identity and biomass did not show significant regressions, however species dissimilarity showed a negative regression thereby explaining 18% of the variation. Table 4. Linear regressions of litter mass loss, litter fragment size distribution, gross NO3 production and soil respiration with metabolic rates, biomass and number of individuals (F value, P value. Between brackets the direction of slope is given; positive correlations (+), negative correlation (-).
Soil process All treatments Single species
Litter mass loss F P F P
metabolic rates 29.0 <0.001 (+) 1.20 0.280
Biomass 18.1 <0.001 (+) 2.78 0.104
Nr. of individuals 1.46 0.230 2.04 0.162
Litter fragment size distribution
metabolic rates 15.8 <0.001 (-) 0.00 0.953
Biomass 6.99 0.010 (-) 0.43 0.515
Nr. of individuals 15.1 <0.001 (-) 0.79 0.378
Gross NO3 production
metabolic rates 75.9 <0.001 (+) 10.8 0.002 (+)
Biomass 221 <0.001 (+) 82.8 <0.001 (+)
Nr. of individuals 0.14 0.708 17.5 <0.001 (+)
Soil respiration
metabolic rates 45.8 <0.001 (+) 3.02 0.091
Biomass 46.4 <0.001 (+) 2.47 0.126
Nr. of individuals 2.37 0.127 6.31 0.017 (-)
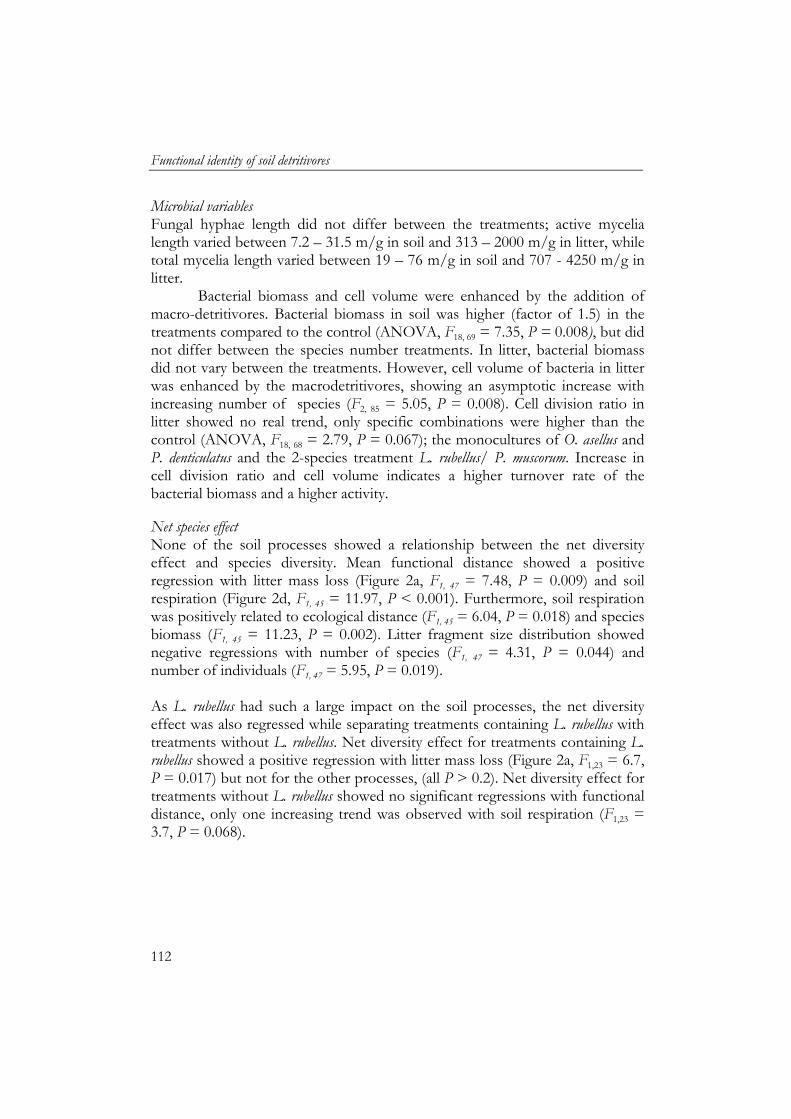
Functional identity of soil detritivores
112
Microbial variables Fungal hyphae length did not differ between the treatments; active mycelia length varied between 7.2 – 31.5 m/g in soil and 313 – 2000 m/g in litter, while total mycelia length varied between 19 – 76 m/g in soil and 707 - 4250 m/g in litter.
Bacterial biomass and cell volume were enhanced by the addition of macro-detritivores. Bacterial biomass in soil was higher (factor of 1.5) in the treatments compared to the control (ANOVA, F18, 69 = 7.35, P = 0.008), but did not differ between the species number treatments. In litter, bacterial biomass did not vary between the treatments. However, cell volume of bacteria in litter was enhanced by the macrodetritivores, showing an asymptotic increase with increasing number of species (F2, 85 = 5.05, P = 0.008). Cell division ratio in litter showed no real trend, only specific combinations were higher than the control (ANOVA, F18, 68 = 2.79, P = 0.067); the monocultures of O. asellus and P. denticulatus and the 2-species treatment L. rubellus/ P. muscorum. Increase in cell division ratio and cell volume indicates a higher turnover rate of the bacterial biomass and a higher activity. Net species effect None of the soil processes showed a relationship between the net diversity effect and species diversity. Mean functional distance showed a positive regression with litter mass loss (Figure 2a, F1, 47 = 7.48, P = 0.009) and soil respiration (Figure 2d, F1, 45 = 11.97, P < 0.001). Furthermore, soil respiration was positively related to ecological distance (F1, 45 = 6.04, P = 0.018) and species biomass (F1, 45 = 11.23, P = 0.002). Litter fragment size distribution showed negative regressions with number of species (F1, 47 = 4.31, P = 0.044) and number of individuals (F1, 47 = 5.95, P = 0.019). As L. rubellus had such a large impact on the soil processes, the net diversity effect was also regressed while separating treatments containing L. rubellus with treatments without L. rubellus. Net diversity effect for treatments containing L. rubellus showed a positive regression with litter mass loss (Figure 2a, F1,23 = 6.7, P = 0.017) but not for the other processes, (all P > 0.2). Net diversity effect for treatments without L. rubellus showed no significant regressions with functional distance, only one increasing trend was observed with soil respiration (F1,23 = 3.7, P = 0.068).
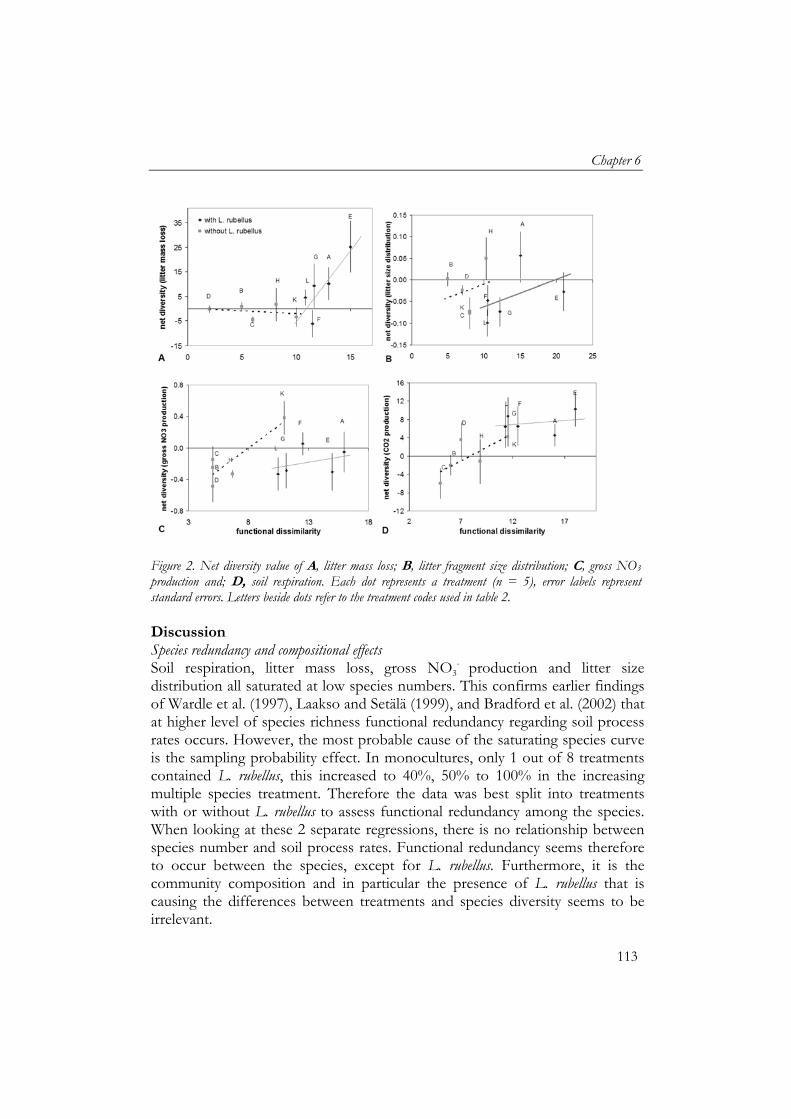
Chapter 6
113
Figure 2. Net diversity value of A, litter mass loss; B, litter fragment size distribution; C, gross NO3 production and; D, soil respiration. Each dot represents a treatment (n = 5), error labels represent standard errors. Letters beside dots refer to the treatment codes used in table 2. Discussion Species redundancy and compositional effects Soil respiration, litter mass loss, gross NO3
- production and litter size distribution all saturated at low species numbers. This confirms earlier findings of Wardle et al. (1997), Laakso and Setälä (1999), and Bradford et al. (2002) that at higher level of species richness functional redundancy regarding soil process rates occurs. However, the most probable cause of the saturating species curve is the sampling probability effect. In monocultures, only 1 out of 8 treatments contained L. rubellus, this increased to 40%, 50% to 100% in the increasing multiple species treatment. Therefore the data was best split into treatments with or without L. rubellus to assess functional redundancy among the species. When looking at these 2 separate regressions, there is no relationship between species number and soil process rates. Functional redundancy seems therefore to occur between the species, except for L. rubellus. Furthermore, it is the community composition and in particular the presence of L. rubellus that is causing the differences between treatments and species diversity seems to be irrelevant.
Functional identity of soil detritivores
114
The functional roles species perform proved to be an accurate tool to explain process rates in multiple species treatments. Functional dissimilar species gave rise to facilitative interactions (sensu Cardinale, 2002) and a raise in the overall effect on the ecosystem processes as observed in soil respiration and litter mass loss. In contrast, functional similar species gave rise to neutral or inhibitive interactions. For litter mass loss, the difference between treatments containing L. rubellus and without L. rubellus showed that the key species has to be present to get this positive relationship with functional dissimilarity. However, for soil respiration the positive relationship was for treatments with and without L. rubellus but a saturation of the increase of net diversity was observed. Although biomass was positively related to net diversity of CO2 production it cannot mechanistically explain the occurrence of inhibitive or facilitative interactions by itself. It could be that this relationship was linked to the heavier species L. rubellus having the highest functional dissimilarity scores. Alternatively, it suggests that biomass indirectly plays a role in explaining CO2 production as biomass is related to the amount of litter being digested and fragmented by the species.
Net diversity values of fragmentation and gross NO3- production did
not show any relation with functional dissimilarity. These findings suggest that both gross NO3
- production and litter fragmentation are not very sensitive to changes in detritivore species composition. Lack of a relationship could be due to the fact that the effect of macrodetritivores on gross NO3
- production, a microbial controlled process, is mainly indirect by excretion of NH4
+ in their faeces (Anderson, 1988). The lack of a regression between litter fragmentation and functional dissimilarity could be the result of the choice of functional variables, i.e. litter mass loss, respiration and NO3
- production, used to calculate functional dissimilarity. Although fragmentation might affect gross NO3
- and CO2 production and most likely litter mass loss, these processes might inversely not affect fragmentation. However, the net diversity data did show that competition between species might be very important for fragmentation as observed in species combinations containing O. ascellus and P. denticulates. These species showed highest fragmentation in the monocultures but all combinations containing either one or both of them showed the highest negative net diversity effects. Process rates of soil respiration and litter mass loss did relate to functional dissimilarity, and the positive interactions seemed to be centred around the process of incorporating litter into the soil compartment. Small litter fragments are readily taken up by the epigeic earthworm L. rubellus, a less efficient fragmenting species, which transported litter to the soil compartment (Edwards
Chapter 6
115
and Bohlen, 1996). The other species themselves did not incorporate leaf litter, but they do facilitate soil processes through interactions with the functional important species L. rubellus. The two endogeic earthworms did not significantly increase leaf litter loss and did not affect soil water content. Therefore these species most likely increased microbial biomass and its activity by the gut passage of soil, thereby grazing on microorganisms in the soil and/or by affecting the soil aggregates. Grazing on microbial community has been shown to increase microbial activity and thus soil respiration (Brown, 1995; Drake and Horn, 2007). Presence of both functional types of earthworms and/ or in combination with efficient fragmenters resulted in facilitative interactions for litter mass loss and respiration, although based on two different modes of action. These facilitative interactions have been reported by several other studies. For example, Zimmer et al. (2005) found facilitation between Porcellio scaber (isopoda) and L. rubellus and Postma-Blaauw et al. (2006) between endogeic, epigeic and anecic earthworms. Process dependency, key species and predictability? Ecological traits, such as body mass and length, metabolic rate, food preference and location in the soil profile, are often easily obtained from the literature, but can they predict a species or community effect on soil processes? The predictive power of species biomass and metabolic rate on soil processes in this study was highly depending on the soil process studied. Gross NO3 production seemed to be well predicted by species biomass in species combination and monocultures. However for the other soil processes, species biomass could only explain 1- 40% and could not predict individual species effects. Furthermore, only species interactions regarding CO2 production were related to species biomass. Overall biomass was not as effective in predicting the effect of species assemblages on soil processes as species functional identity. However, biomass was a better predictor than species diversity for most processes, except for litter fragmentation which showed no relationship with these factors.
Ecological dissimilarities, based on body mass and length, metabolic rate, food preference and location in the soil profile, were used in this study to assess if species ecology is linked to their functioning, which seems to be the case for soil respiration but not for litter mass loss. However, the link between ecological dissimilarity and functional dissimilarity will only work if the selected ecological traits are functionally relevant (Petchey and Gaston, 2002, 2006). Apparently, litter mass loss is influenced by other ecological attributes of species, for instance ingestion rate or assimilation and production efficiency. Alternatively, the most basic derivation of ecological distances was chosen,
Functional identity of soil detritivores
116
giving equal weights to each ecological trait. One could hypothesize that for specific soil processes one should give specific weights to the ecological traits (Petchey and Gaston, 2002). However, for the moment it seems that the functional importance of species has more predictive power than ecological traits that might, or might not, indicate the functional significance of a species. The different mechanisms on how soil fauna affect various soil processes as shown in this study, confirm that theory on species diversity effects on ecosystem processes cannot be generalised, as they are dependent on the functional identity of species and the soil process in question (Bengtsson, 1998). Species like P. denticulatus showed high fragmentation rates but little effect on gross NO3
- production, while A. caliginosa’s effect on these soil processes was the opposite. Although redundancy seems to occur, the results indicate that the interactions between species determine if species loss will affect soil process rates, as species gain functional importance by interacting with non-redundant species (Wolters, 2001). An exception is the occurrence of key species like L. rubellus. In this study L. rubellus was the species that stood apart from the other species. This species links the litter layer with the soil compartment and can therefore interact with both surface and soil dwelling species. This indicates that L. rubellus has unique traits compared to the other species used in this experiment, and that the loss of this species has a significant effect on process rates. This underlines the importance of knowing the functional identity of species in a community, as it is the functional identity of species and the dissimilarity between species that seems to be the best predictor of community functioning. Therefore, functional dissimilarity measures make a promising tool to predict any consequences if species composition changes in a community due to species loss or biological invasions. Acknowledgements We thank An Vos, Meint Veninga and Jaap Bloem (Alterra) for their support in microbiological analyses and stimulating discussions. The investigations were supported by the Research Council for Earth and Life Sciences (ALW) with financial aid from the Netherlands Organisation for Scientific Research (NWO) and the Dutch Ministry of Agriculture, Nature and Food Quality (BO-01-002-204). Matty P. Berg was financially supported by the Royal Dutch Academy of Arts and Sciences (KNAW).
Chapter 7
117
7 General discussion

Chapter 7
119
7 General discussion
In this thesis the effect of heterogeneous soil characteristics and contamination on soil fauna communities and on the interactions between soil fauna and microorganisms is discussed. The central hypotheses are that exposure to contaminants affects (i) vertical stratification of detritivore annelids, (ii) species composition of the detritivore community and, (iii) facilitative interactions of soil detritivore species and microorganisms, thereby affecting soil process rates. The study was situated in the floodplains of the river Waal (NL) which show high heterogeneity in soil contamination and are therefore very suitable to test these hypotheses.
The most common feature of this study is that the high metal concentrations found in the soil appear not to result in clear direct toxic and behavioural effects on soil fauna. Vertical stratification of macrodetritivore species was not affected by contamination nor was there any observed effect on the species composition of macrodetritivore community. Direct effects of contamination on microorganism functioning were found, but the facilitative interactions between soil fauna species and microorganisms were not affected. The absence of an inhibiting effect of the contamination was probably due to the low bioavailability of the contaminants to the soil fauna due to the ageing of the contamination. Although contamination did not affect the species composition of the detritivore community, we did test potential effects of changes in detritivore community on soil processes. Composition of detritivore communities had a significant impact on soil process rates thereby showing the importance of facilitative interactions between soil fauna and microorganisms. Overall, the floodplain showed a soil detritivore community dominated by annelid detritivores, whose facilitative interactions with microorganisms are important for optimal soil ecosystem functioning.
Heterogeneity in Dutch river floodplains Vertical and horizontal heterogeneity in contamination occurs in the studied grassland, showing high variances of soil characteristics and contaminant loads with depth and across the floodplain grassland studied (Chapter 2 and 3). The heterogeneity found in this study is in accordance with other studies performed in river floodplains (Middelkoop 1997; Thonon, 2006). Relatively low contaminated profiles tend to be situated in areas with high sand values as sand is mainly deposited in relatively fast flows during
General discussion
120
inundation and in channel banks, the latter being the case for the reference site used in the field monitoring study (Chapter 2 and 3; Schoor, 1994). Relatively high contaminated profiles and sites show high clay content in the soil and are in general deposited in slow flowing water and areas where water is stagnant as it cannot flow back to the river, the latter being the circumstances in the grassland studied in this thesis. Correlations between clay, water and contamination contents are often observed in floodplains (Middelkoop, 1997; Thonon, 2006) and were also detected in this study thereby implying that these correlations hold also at relatively small local scales. Effects of heterogeneous soil characteristics on soil communities and their functioning Horizontal heterogeneity of soil fauna Soil characteristics are known to have strong effects on soil communities and their spatial distribution (Ettema and Wardle, 2002; Whalen, 2004; Bardgett et al., 2005). On a horizontal spatial scale, heterogeneous soil characteristics can lead to changes in species and their relative abundances in soil communities. Soil macrodetritivore community in the floodplain was dominated by earthworms. Soil water content is known to be the most important factor in earthworm distributions, although certain soil types, low pH and low food availability also can limit their distribution (Curry, 1994; Edwards and Bohlen, 1996). The studied floodplain, a typical floodplain of the river Waal, has a neutral to basic pH, relatively high soil organic matter (SOM) and clay contents, which are good soil conditions for earthworms. It is therefore not surprising that the species-specific differences in soil communities are driven by soil water content (Chapter 3) where Allolobophora chlorotica is more abundant in soils with higher water content. Within the group of annelids, there are species-specific tolerance ranges for soil moisture, of which A. chlorotica is a hydrophilic species (Lee, 1985; Edwards and Bohlen, 1996). Numbers of Homoptera were also positively correlated with soil water content, mostly species of the Cicadellidae and Aphidoidea families. Arthropoda are known to prefer moist habitats due to water loss through their epicuticle if relative humidity is below 99% (Verhoef and Daan, 1995; Villani et al., 1999). Powell et al. (2007) found a positive correlation between population density of grasshoppers and soil moisture content between September to April and a negative correlation between grasshopper numbers and soil moisture content. Furthermore, diapause termination
Chapter 7
121
appeared to be positively related to soil moisture content, besides temperature and photophase, after summer drought (Hodek, 2003). Also vegetation and grazing are in general important factors for soil fauna distribution (Curry, 1994; Bardgett, 2005). In our study only Diptera larvae showed a positive correlation with vegetation although this might be indirectly linked to grazing. On a landscape scale with similar climatic conditions, vegetation and soil physico-chemical characteristics become dominant determinants for species distribution (Curry, 1994; Bardgett, 2005). It is therefore not surprising that in the studied grassland (Chapter 2) where sub-climatic conditions and soil physico-chemical characteristics have a very limited range, vegetation cover, grazing patterns and soil water content are the main factors controlling the distribution of soil fauna. Vertical heterogeneity of soil fauna In many studies, a significant vertical structure in soil fauna abundance, biomass and species composition is observed in soils (Faber and Joosse, 1993; Berg et al., 1998; Sadaka and Ponge, 2003; Berg and Bengtsson, 2007). Our study showed distinct seasonal differences for earthworms and enchytraeids (Chapter 3). A specific soil characteristic causing this difference in stratification could not be determined. However, the vertical stratification of enchytraeids was opposite to the earthworm stratification, suggesting competition between the two groups. Other studies have shown that enchytraeid numbers are declining if earthworms are present in agricultural land (Nowak, 2004), forest (Räty and Huhta, 2003) and grassland (Cole et al., 2006). Some studies propose a resource driven competitive exclusion of enchytraeids by earthworms (Räty and Huhta, 2003), whereas the potential of earthworms changing the pH through bioturbation seems to affect enchytraeid numbers (Cole et al., 2006). However, the soil in the river floodplains is neutral to basic and buffered by the presence of CaCO3 in the soil. Therefore, the most likely explanation is resource driven competition between earthworms and enchytraeids leading to opposite vertical stratification. Effects of spatially heterogeneous soil contamination on soil communities Soil fauna stratification Soil contamination may affect the vertical stratification of species and thereby adversely affect important ecological interactions between species. It has been observed in horizontal avoidance studies that earthworms and enchytraeids avoid contaminated soils at metal concentrations below the
General discussion
122
metal concentrations found in our field and microcosm studies (van Zwieten et al., 2004; Eijsackers et al., 2005; Lukkari and Haimi, 2005; Natal-da-Luz et al., 2008). However, the main observation throughout our laboratory and field studies addressing avoidance and vertical distribution of soil fauna is that soil fauna distribution did not seem to be affected by contamination and avoidance of contaminated soil layers did not occur. Two factors could explain the absence of avoidance; the bioavailable concentrations of the contaminants present in the tested soils were not high enough to trigger avoidance, or the species did not alter their behaviour because of ecological constraints. In the microcosm study using field soil (Chapter 4), differences in vertical stratification of earthworm burrows were not observed. In the field monitoring study (Chapter 3), vertical stratified contamination did not affect vertical stratification of annelid detritivores. However, vertical stratification of earthworms was different between seasons, thereby implying that they do tend to redistribute themselves in the soil profile. Therefore it is likely that the contaminated soils did not trigger avoidance behaviour. Although these field soils show a high total metal concentration, especially zinc, the bioavailable fraction seems to be low. The field soil used in our microcosm studies showed low 0.01 MCaCl2 extracted metal contents. Also other studies using similar floodplains soils show that the 0.01 M CaCl2 extracted metal fractions are relatively low (Hobbelen et al., 2004, Zorn, 2004). The low bioavailability of the contamination is due to the high clay content and calcium carbonate content in the soil which facilitate complexation and adsorption of ions in soils (McLaughlin et al., 2000; Ma et al., 2006). As the highly contaminated soil was deposited mainly in the years 1930-1970 in the floodplain (Middelkoop, 1997), complexation and adsorption have decreased the chemical availability of metals over time (ageing) resulting in low bioavailability of the contamination (Ma et al., 2006). Several studies observed large differences between the toxic effects of contamination from field aged soils and freshly spiked soils in the laboratory when expressed as total soil concentrations (e.g. Lock and Janssen 2001b; Oorts et al., 2006). This has partly been subscribed to the decrease in pH if soils were not leached after spiking with metal salts (Stevens et al., 2003). However, the main part is due to ageing of the contamination in soils thereby reducing bioavailable fractions of the contamination. Measures of availability like soil pore water concentration or 0.01 M CaCl2 extractable concentrations show in general a better correlation with the toxicity responses of aged and freshly spiked soils than total soil
Chapter 7
123
concentrations of metals (Lock and Janssen, 2001b; Lock et al., 2006; Oorts et al., 2006). Soil fauna composition Changes in species composition and biomass due to contamination may occur if species avoid contaminated locations or if contamination severely affects species populations. Species differ in their sensitivity to contaminants (van Gestel, 1995; Spurgeon et al., 2000) and therefore, contaminants can change community composition. Our study showed no effect of the mixed organic and inorganic contamination present on the species composition of earthworm community (Chapter 3). Allolobophora chlorotica, Allobophora cupulifera, Aporrectodea caliginosa, Lumbricus terrestris, Lumbricus castaneus and Lumbricus rubellus were found throughout the river floodplain and their relative biomass did not seem to be affected by contamination. The species observed in the contaminated sites in the grassland included relative sensitive species to contamination like A. caliginosa and A. chlorotica. Several studies report that both are sensitive for metals, showing a similar sensitivity for metals (Pizl and Josens, 1995; Paoletti et al., 1998; Spurgeon and Hopkin, 1999; Nahmani et al., 2003). In all these field studies, A. caliginosa and A. chlorotica were not present in highly contaminated locations. Therefore, these species might be used as possible bioindicators in river floodplains as their presence could indicate that although the metals are present in the soil, they are limitedly bioavailable to earthworms. Facilitative interactions of soil detritivore species and microorganisms Nutrient mineralisation is largely performed by primary decomposers, i.e. bacteria and fungi, and the rate of decay is influenced by the biochemical composition and physical structure of organic matter, the physico-chemical environment for decomposition and trophic interactions with other soil organisms (Curry, 1994; Berg et al., 1998; Lavelle, 2002). Contamination can therefore have a direct effect on soil processes by affecting the functioning of the microbial community. Microbial communities and their functioning are relatively sensitive to contamination and several studies show that they are more sensitive than plant and animal endpoints (Giller, 1998; Broos et al., 2005). This was also observed in this study, as contamination inhibited C mineralisation rate by microorganisms, while soil fauna behaviour nor survival seem to be affected by the contamination. It could very well be that the difference in sensitivity between soil fauna and microorganisms is scale-related. In soils, metals complex with soil organic matter and clay minerals
General discussion
124
(Alloway, 1995; McBride et al., 1997; Chaudri et al., 2008), thereby forming small scale highly concentrated complexes. Metals associated with SOM can be mobilized if the SOM is degraded. The scale at which the SOM with high concentrations of contamination occurs is crucial for a realistic assessment of microbial exposure due to their strong association with SOM (Chaudri et al., 2008). These authors show that SOM associated metals in biosolids have a larger impact on rhizobia counts than their soluble salts due to association with SOM. In contrast, larger soil fauna will be exposed through a larger surface, thereby integrating exposure over heterogeneous microsites. Therefore, this scale effect can be underlying the more sensitive nature of soil microorganisms compared to soil fauna or plants, as observed by other studies (Giller et al., 1998; Broos et al., 2005). Soil fauna facilitates decomposition indirectly by grazing on microflora, fragmentation of litter particles, incorporation of litter into the soil compartment, bioturbation and thereby changing the biochemical composition and physical structure of the organic matter (Swift et al., 1979; Curry, 1994; Bardgett et al., 2005). The importance of the stimulation of soil microbial activity and hence, decomposition rates, was shown in Chapter 4 where direct inhibiting effects of contamination on microbial functioning were compensated for by soil fauna stimulating microbial functioning in the contaminated soil. This stimulation was substantially higher in the contaminated soil than in the reference soil. Several mechanisms could underlie this relatively large increase in microbial activity. Firstly, if contaminated soil organic matter is suppressing microbial activity, the incorporation of fresh uncontaminated litter into the soil profile offers an alternative substrate and can stimulate the microbial community. Bioturbation of earthworms can dilute contaminated SOM by mixing the SOM with fresh leaf litter of better quality. This effect will be larger in the contaminated soil than in the reference soil, thereby leading to a relative larger microbial stimulation in the contaminated soil than in the reference soil. Secondly, the gut passage in the earthworms stimulates microbial activity (Brown, 1995; Drake and Horn, 2007) and this might be more important for less vital microbial communities like those in contaminated soils.
The effect of detritivores on microbial activity is also shown to increase with litter that has a higher C: N ratio. Litter breakdown can be N limited in litter with high C: N ratio and the extra N input by soil fauna excretion stimulates microbial activity. Furthermore, millipedes seem to favour higher C: N litter than the lower C: N litter. In contrast, earthworms
Chapter 7
125
might prefer lower C: N ratio litter (Hättenschwiller and Gasser, 2005). In our study, quality differences of C: N ratio of the soil organic matter were present in the reference soil and the contaminated soil (Chapter 4). However, it was not likely that degradation rates were N limited due to the excess N in the soil. Effects of species diversity on soil processes One of the severest effects of soil contamination is the (permanent) loss of species in a soil community. This loss of species in a community can be due to mortality, but also when soil dwelling species avoid certain contaminated locations which results in an effective loss of species in the community at that specific microhabitat. Species loss in a community can lead to altered soil process rates or even loss of certain processes (Mikola, 2002). One of the main observations of our study is the occurrence of redundancy among the group of soil detritivores studied (Chapter 5 and 6). This is in accordance with a general accepted hypothesis that there is a high amount of redundancy among the soil community (Andrén et al., 1995) and more specifically among soil mesofauna (Mikola and Setälä, 1998; Laakso and Setälä, 1999). One has to consider, however, the mechanisms affecting soil processes to assess if species are redundant. Therefore, functional traits of the species should not only be based on their effect on a soil process but also on the mechanism behind it, e.g. fragmentation or incorporation of leaf litter into the soil. In physiology this is illustrated by two different terminologies; redundancy and degeneracy. Degeneracy is the ability of elements (species) that are structurally different (functionally and ecologically) to yield the same output (soil process rates) (Edelman and Gally, 2001). In contrast, redundancy specifically refers to elements (species) which are not structurally different and yield the same output. Especially concerning soil processes affected indirectly by fauna, just measuring the resulting soil process rates will not discriminate between redundancy and degeneracy. For example, fragmenters and bioturbators can both increase CO2 respiration, and the loss of one group may not affect respiration rates but obviously their mechanism affecting CO2 respiration is different, making them degenerant rather than redundant. In most studies, species combinations and the presence of key species are more important than the number of species (Faber and Verhoef, 1991; Mikola and Setälä, 1998; Laakso and Setälä, 1999). Our study confirmed these studies as we observed that species combinations showed higher impact than other combinations regarding their effect on soil processes,
General discussion
126
which was due to both the functional identity of the species and species interactions. Furthermore, L. rubellus showed a high impact on all soil processes studied, and any species combination including this species consistently had greater impact on soil processes under study than when absent (facilitation). The species can therefore be considered a key species for floodplain grassland. Key species are not only defined by their impact on ecosystem processes, but also on their role in food webs. Lumbricus rubellus wais found in relative high biomasses in our field studies and is a food source for many small mammals and birds. Therefore it can also be considered a key species regarding its abundance and position in the food web.
One of the key findings in the species diversity study was that interactions between species could be predicted by the functional differences between species (Chapter 5 and 6). Functionally similar species tended to show competition or neutral interactions while functionally different species showed complementarity. The calculation of functional or ecological differences between species is a relative new tool in ecology. Numerical distances (used in this study), Euclidian distances (Walker et al., 1999), dendograms (Petchey and Gaston, 2006 and 2007) or n dimensional distance analyses (Petchey and Gaston, 2006) are quantitative measures to assess differences between species. Petchey and Gaston (2006) suggest there are four main requirements for measures of functional diversity: 1, which traits are appropriate for the assessment of functional diversity; 2, which weight one gives to each trait; 3, which statistical measure one uses to quantify functional diversity and; 4, what measure is able to explain and predict variations observed in the ecosystem processes. Furthermore, Petchey and Gaston (2006) give an overview of currently used measures of functional diversity, including our study, and assess how each measure responds with increasing species number. They conclude that the measure in our study can both increase or decrease with increasing species diversity while it is likely that with increasing species number, the functional diversity should remain similar or increase. However, the functional measure used in our study is not a functional diversity measure but a functional dissimilarity measure. Species can be very similar ecologically or functionally, which can lead to competition. They can also be very dissimilar, thereby potentially leading to facilitation. At the lowest interaction level, i.e. interactions between two species, both extremes are more likely to happen, being strong competition or facilitation. However, at higher species numbers, more interactions take place and therefore a balance between competition and facilitation is established, resulting in overall positive or negative effects on
Chapter 7
127
soil process rates. It is therefore not surprising that our study shows a “funnel shape relationship” between interactions and increasing species diversity (Petchey and Gaston, 2006 and Chapter 5). A similar funnel shape has been observed with increasing number of contaminants in water and their interactions on the toxicity of aquatic species as contaminants can have a synergistic, antagonistic or additive (no interaction) effect in their toxicity on species (Warne and Hawker, 1995). At low contamination both extremes were observed, while with more contaminants present, the positive and negative interactions balanced each other out. Effect of species loss in natural communities It is questionable if the relationship between species diversity and ecosystem functioning using artificially built communities, as done in this study, is similar to species loss in a natural community (Srivastava, 2002; Diaz et al., 2003). Although the species used in the biodiversity experiment are all found in the Dutch river floodplains, therefore representing a natural community, we manipulated diversity in a restricted random way (for details on the restriction on randomness see Chapter 5 and 6). From an ecological point of view, random deletion does not occur in the field, but specific stressors will affect specific groups of species (Srivastava, 2002). Therefore, the translation from diversity studies to redundancy hypothesis in the field has to be taken with some consideration (Diaz et al., 2003). The results of our study indicate that the group of macrodetritivores show highed diversity in individual effects on ecosystem functioning, implicating that generalisation and therefore the predictability in this group regarding their role in ecosystem processes is not straightforward (Chapter 5 and 6). Assigning species into functional groups or guilds seems a tool of the past, while measures of functional identity of species, functional domains and overall functional diversity of a community have become more into fashion. One of the main arguments to assess functional domains is that artificial boundaries between groups are dismissed. However, calculating functional domains opens up the pitfall that the mechanisms are not taken into account, only its effect. Therefore, the functional domain should be backed up with mechanistic measures to form a more diagnostic tool in the assessment of functional redundancy in species communities. As ecological traits of species are easily obtainable in the literature, it would be a great advantage if these traits, like body mass, metabolic rate, food preference, could predict the effect of species on soil processes. In our study, the predictive power of the ecological traits body mass and metabolic
General discussion
128
rate on soil processes was highly depending on the soil process studied (Chapter 6). Gross NO3 production seemed to be well predicted by species biomass in species combination and monocultures. However for the other soil processes (litter fragmentation, soil respiration and litter mass loss) species biomass could only explain 1-40% and could not predict individual species effect. Furthermore, only species interactions regarding CO2 production were related to species biomass. Overall biomass was not as effective in predicting the effect of species assemblages on soil processes as species functional identity. However, biomass was a better predictor than species diversity for most processes, except for fragmentation which showed no relationship with these factors. Therefore for the moment it seems that the functional importance of species has more predictive power than ecological traits that might, or might not, indicate the functional significance of a species. Loss of a functionally distant species does not only have a direct decreasing effect on decomposition rates, but our study also shows how it might decrease decomposition rates due to the loss of the facilitative interactions with other species in the community (Chapter 5 and 6). Therefore, key species play a disproportionately important role in communities, and the identification of key species is a prerequisite to understand ecosystem functioning. This is in accordance with several studies that emphasize the importance of knowing the effect and the role a species has in a community and on ecosystem processes to assess functional diversity and potential redundancy regarding ecosystem processes (e.g. Bengtsson, 1998; Loreau et al., 2002; Bardgett, 2005). The role of facilitative species interactions in ecosystem functioning is only partially acknowledged, but recent developments show the push to include facilitative interactions in biodiversity and ecosystem functioning theories (Bruno et al., 2003; Wardle, 2006; Scheffer and van Nes, 2006; Lortie, 2007; Brooker et al,. 2008; Kikvidze and Callaway, 2009). Facilitation is also being implemented in evolutionary theories, like the concept of nursing plants that facilitate other species in their evolution (Bruno et al., 2003; Lortie, 2007; Brooker et al,. 2008; Kikvidze and Callaway, 2009). Nursing plants can also be defined for their effect on soil fauna. Furthermore, an analogy to nursing plants in soil dwelling organisms are the soil engineering species like earthworms, ants and termites (Jones et al., 1994; Lavelle et al., 1997; Lavelle and Spain, 2001. It will therefore be a challenging and interesting concept to include facilitation also in the evolution of soil fauna.
Chapter 7
129
Implications for ecological risk assessment Site-specific ecological risk assessment in river floodplains, The combined studies of the overarching project ‘stimulation programme system oriented ecotoxicology’ (SSEO) form one of the most data rich site-specific risk assessments of river floodplains. Most studies showed no effects of soil contamination on soil fauna and subscribed this to the relatively low bioavailability of the contaminants due to complexation and adsorption processes (see special edition Science of the Total Environment 406, issue 3, 2008). This confirms the findings of our studies regarding soil fauna. However, increased internal metal concentrations were observed for earthworms (Vijver et al., 2007; Hobbelen, 2006; van Vliet et al., 2005, 2006) and enchytraeids (van Vliet et al., 2006). Furthermore, a direct negative effect of contamination on soil respiration was found in our study (Chapter 4) but the presence of earthworms mitigated this negative effect. The SSEO committee advised regarding management practices to minimize the risk of contamination in the river floodplains for metals as follows: soils above pH 5 are considered minimal risk and no action is required but bioturbation and other means of displacement of contaminants should be included in ecological risk assessment (Eijsackers et al., 2008). Therefore, for site-specific ecological risk assessments for floodplains, earthworm species remain an important group to be monitored as they do seem to be exposed to the contamination, have an important role in stimulating (stressed) microbial communities and can relocate contaminants through bioturbation. The heterogeneous nature of the distribution of contamination in river floodplains makes the prediction of accumulation of contaminants through the food web and thereby the exposure of higher predators to contaminants more complicated. Several models on food web bioaccumulation take heterogeneity in contamination into account in risk assessment for top predators (Kooistra et al., 2001, 2005; Linkov, 2002, Loos et al., 2006). Kooistra et al. (2001, 2005) and Loos et al. (2006) use a secondary poisoning model which calculates the exposure of terrestrial species to contaminants in the river floodplains through the food web. It uses geographical exposure modelling which implements spatial heterogeneity in the calculations of the predicted exposure concentrations. The model assumes that both prey and predator do not avoid highly contaminated areas. Our study shows that soil animals did indeed not avoid the contaminated layers in the field nor in the laboratory, thereby supporting this model assumption for earthworms and macroarthropods (Chapter 2 and 3).
General discussion
130
Robustness in ecological risk assessment Large variations in species composition and numbers of individuals in soil communities are observed in time and space. These variations can be ascribed to ecological factors and heterogeneity of these factors in time and space (Faber and Joosse, 1993; Berg et al., 1998; Sadaka and Ponge, 2003; Berg and Bengtsson, 2007). The large variations found in the field can potentially out-scale any effects of the contaminant. Especially for aged contamination, it is very likely that dramatic effects will not occur and therefore it is possible that smaller toxicological effects are not detected due to the large environmental effect. Therefore the possibility of a false negative (a type II error) for an effect of contamination is high. Chapter 3 shows that due to the high standard deviation in the observations high numbers of replicates are necessary to indicate a 10-50% effect of the contamination for the individual earthworm species. A sensitivity analysis should therefore be part of site-specific ecological risk assessment. This gives the possibility to determine what magnitude of effect could be detected, given the sampling effort. One can thereby conclude that the effect of the contamination was less than that given percentage. This enables a risk assessment of the maximum potential impact of the contaminant and an assessment if this is acceptable or if further study is needed. Power analyses of reference data are relevant for planning field monitoring in ecological risk assessment before a full field monitoring program is set up. Such data for power analyses to assess the optimum sampling strategy are not always available beforehand. However, certain biological measures are more robust than others. In general, the ideal biological indicator is sensitive to contaminants but also robust to other environmental factors, to enable concrete comparisons between soils (Broos et al., 2005; Dawson et al., 2007). However, lack of robustness due to large standard deviations in the control group has been reported for several biological variables, e.g. microbial biomass carbon in field soils (Broos et al., 2007) and potential nitrification rate (Smolders et al., 2001; Broos et al., 2005, Dawson et al., 2007). Dawson et al. (2007) report sensitivity/robustness analyses of 21 biological assays using contaminated field soils and show that not all biological variables were robust enough to use in the soil quality assessment of remediation of the contaminated soils. However, preferable biological variables which are both sensitive and robust might not be common as the sensitivity of the biological variables is positively correlated with natural variability (Broos et al. 2005). Therefore it seems there is a trade-off
Chapter 7
131
between sensitivity and robustness; a sensitive endpoint which shows a high variability in the control group might actually have less detection power of a potential effect than a less sensitive endpoint which is robust. In our study, the biomass of the species L. rubellus was so variable between years that one has to question its robustness and therefore effectiveness. Species like A. caliginosa and A. chlorotica were more robust in this study and indeed, differences between the reference site and the contaminated site for these species were detected. The most robust measure was total earthworm biomass in autumn, however no significant differences between the contaminated treatments and the reference site were detected. One could argue that total earthworm biomass might not be sensitive to contamination as it consists of multiple species and reduced biomass of one species may be compensated for by increase of biomass of another earthworm species if there is direct competition between these species. Protection of soil ecosystems in ecological risk assessment Anticipating the EU thematic soil strategy program and conform the soil policy letter (VROM, 2003), Dutch soil policy is heading towards more sustainable land use to prevent exhaustion of soils and the loss of essential soil processes in the future. Most ecological risk assessments are based on the protection of species and assume that if a sufficient level of species is protected, the protection of ecosystem functions is thereby also ensured. However, the general species sensitivity distribution (SSD) approach used in many environmental guideline derivation methodologies gives equal weight to all species regardless their impact on ecosystem functions (Posthuma et al., 2002). For example, nitrifying bacteria are in general sensitive to contamination (Smolders et al., 2001; Broos et al., 2005), and only two genera of microbial species deal with the nitrifying process (Nugroho, 2006). Furthermore, our study shows that the loss of an earthworm species may have a completely different effect on decomposition rates than the loss of an isopod species (Chapter 5 and 6). However, in SSD approaches, nitrification rates, earthworm species and isopod species will be given equal weight. Therefore, although the SSD approach might be an efficient tool to calculate a concentration to protect a certain percentage of individual species, the extrapolation from species level to consequences for ecosystem functioning remains problematic due to the presence of key species, key microbial groups and ecological interactions on population, community and ecosystem levels (De Laender et al., 2008; Filser et al., 2008; Forbes et al., 2008).
General discussion
132
To sustain ecosystem functioning, certain key functions for that ecosystem need to be identified and then sufficiently protected. These key functions are in general linked to nutrient cycling and food web stability (Rutgers et al., 2005, 2007; Kuenen, 2009). These include for example, decomposition processes, nitrification rate, primary production, the number of herbivorous species, prey species of top predators, soil bioturbation and leaf litter incorporation. Secondly, species should be linked to these key functions, thereby creating a network of key functions and species. Therefore, reference databases on species communities in broad types of ecosystems or land uses (grassland on peat, deciduous forests) are needed (Filser et al., 2008; Rutgers et al., 2005). Currently these databases become available, like the biological indicators database in the Netherlands (Rutgers et al., 2005; 2007). These authors also link groups of soil organisms to ecosystem services. However, our study shows that species may have substantial different impact on soil process rates. Therefore, ideally the resolution should be at the species level, with specific weights given to species regarding their effect on ecosystem functions, i.e. their functional identity. Assessing the functional identity of species is a timely and costly exercise, but studies assessing the role species have on ecosystem functioning, like our study (Chapter 5 and 6), are becoming more available in the literature. These studies can be used to link species to ecosystem processes and to identify key species or key groups for food webs and ecosystem processes. The integration of the link between species, food webs and ecosystem processes into existing toxicological tools can facilitate the assessment of how contaminants affect the natural species communities and hence ecosystem processes (Zaldivar et al., 2006) Regulations like REACH (EDG EC, 2007) increase the knowledge on contaminants so we can assess their modes of action, environmental fate modelling using physico-chemical characteristics and exposure routes to organisms. Therefore, one can assess which specific group(s) of species might be more at risk than others using QSARs or QAARs (van Gestel et al., 1991; de Roode et al., 2006). Also traditional toxicity studies, terrestrial model ecosystems (van Straalen, 2002; Knäcker et al., 2003) and species sensitivity distribution approaches can be used to assess which species or taxonomic groups are at risk. Furthermore, methods to assess which species are at risk from an ecological perspective are also available, such as the ecological vulnerability methods (e.g. de Lange et al., 2006). These methods can assess which species or group of species are at risk for a certain contaminant.
Chapter 7
133
By integrating ecological approaches to assess potential effects of species loss on an ecosystem level, key species, like L. rubellus, get more weight in the ecosystem processes analyses as several soil processes would disproportionally be hampered if that species were affected. Furthermore, the extrapolation from species loss to ecosystem effects is useful for site-specific ecological risk assessment regarding monitoring studies as it assesses which ecosystem processes are vulnerable to the contaminant. Furthermore, if the site has been contaminated by a mixture of contaminants, the combined individual contaminant effects on species can be extrapolated to ecosystem level. Integration of different methods to assess stress to species and ecosystem functioning is highly necessary to sustain soil ecosystems as species do not discern between natural and anthropogenic stressors and these stressors can interact (van Straalen, 2003). Similar to contamination, each stressor will affect certain groups of species and therefore a similar methodology as described above can be used for other stressors as well. Especially for ecosystems like river floodplains with different managing practices, hydrological fluctuations and contamination, the weight of each stressor on the species in a community gives a more realistic perspective on how it affects population dynamics and ecosystem functioning, which enables a more realistic ecological risk assessment.

References
135
References
Abdel-Lateif H.M., M.H. Donker & N.M. van Straalen (1998). Interaction between temperature and cadmium toxicity in the isopod Porcellio scaber. Functional Ecology 12: 521-527.
Aira M., L. Sampedro, F. Monroy & J. Dominguez (2008). Detritivorous earthworms directly modify the structure, thus altering the functioning of a microdecomposer food web. Soil Biology and Biochemistry 40: 2511-2516.
Aira M., F. Monroy & J. Dominguez (2003). Effects of two species of earthworms (Allolobophora spp.) on soil systems: a microfaunal and biochemical analysis. Pedobiologia 47: 877-881.
Allison G.W. (1999). The implications of experimental design for biodiversity manipulations. The American Naturalist 153: 26-45.
Alloway B.J. (1995). Heavy Metals in Soils. 2nd ed. Blackie Academic and Professional, London, UK.
Anderson J.M. (1988). Spatiotemporal effects of invertebrates on soil processes. Biology And Fertility of Soils 6: 216-227.
Andrén O. & J. Balandreau (1999). Biodiversity and soil functioning - from black box to can of worms? Applied Soil Ecology 13: 105-108.
Andrén O., J. Bengtsson & M. Clarholm (1995). Biodiversity and species redundancy among litter decomposers. In: The significance and regulation of soil biodiversity. Collins HP, Robertson GP, Klug MJ. (Eds.), Kluwer Academic Publishers, pp.141-151
Ausden M., W.J. Sutherland & R. James (2001). The effects of inundation lowland wet grassland on soil macro invertebrate prey of breeding wading birds. Journal of Applied Ecology 38: 320-338.
Bardgett R.D. (2005). The biology of soils: A community and ecosystem Approach. Oxford University Press.
Bardgett R.D, M.B. Usher & D.W. Hopkins (2005). Biological diversity and function in soils. Cambridge University Press, Cambridge.
Beare M.H., D.C. Coleman, D.A. Crossley, P.F. Hendrix & E.P. Odum (1995). A hierarchical approach to evaluating the significance of soil biodiversity to biogeochemical cycling. Plant and Soil 170: 5-22.
Benedetti-Cecchi L. (2004). Increasing accuracy of causal inference in experimental analyses of biodiversity. Functional Ecology 18: 761-768.
Bengtsson J. (1998). Which species? What kind of diversity? Which ecosystem function? Some problems in studies of relations between biodiversity and ecosystem function. Applied Soil Ecology 315: 1-9.
References
136
Berg B. (2000). Litter decomposition and organic matter turnover in northern forest soils. Forest Ecology and Management 133: 13-22.
Berg M.P. & J. Bengtsson (2007). Temporal and spatial variability in soil food web structure. Oikos 116: 1789-1804.
Berg M., P. de Ruiter, W. Didden, M. Janssen, T. Schouten & H. Verhoef (2001). Community food web, decomposition and nitrogen mineralization in a stratified Scots pine forest soil. Oikos 94: 130-142.
Berg M.P., J.P. Kniese, R. Zoomer & H.A. Verhoef (1998). Long-term decomposition of successive organic strata in a nitrogen saturated Scots pine forest soil. Forest Ecology and Management 107: 159-172.
Bloem J., M. Veninga & J. Shepherd (1995). Fully automatic determination of soil bacterium numbers, cell volumes and frequencies of dividing cells by confocal laser scanning microscopy and image analysis. Applied and Environmental Microbiology 61: 906-936.
Bongers M. (2007). Mixture toxicity of metals to Folsomia candida related to (bio) availability in soil. Ph.D. thesis VU University Amsterdam.
Bourg A.C.M. & J.P.G. Loch (1995). Mobilization of heavy metals as affected by pH and redox conditions. In: Biogeodynamics of pollutants in soils and sediment. Salomons W, Stigliani WM. (Eds.), Springer, New York.
Bradford M.A., T.H. Jones, R.D. Bardgett, H.I.J. Black, B. Boag, M. Bonkowski, R. Cook, T. Eggers, A.C. Gange, S.J. Grayston, E. Kandeler, A.E. McCaig, J.E. Newington, J.I. Prosser, H. Setälä, P.L. Staddon, G.M. Tordoff, D. Tscherko & D.H. Lawton (2002). Impacts of soil faunal community composition on model grassland ecosystems. Science 298: 615-618.
Botta-Dukát Z. (2005). Rao’s quadratic entropy as a measure of functional diversity based on multiple traits. Journal of Vegetation Science 16: 533-540.
Brooker R.W. F.T. Maestre, R.M. Callaway, C.L. Lortie, L.A. Cavieres, G. Kunstler, P. Liancourt, K. Tielbörger, J.M.J. Travis, F. Anthelme, C. Armas, L. Coll, E. Corcket, S. Delzon, E. Forey, Z. Kikvidze, J. Olofsson, F. Pugnaire, C.L. Quiroz, P. Saccone, K. Schiffers, P. Seifan, B. Touzard & R. Michalet (2008). Facilitation in plant communities: the past, the present and the future. Journal of Ecology 96: 18–34.
Broos K., L.M. Macdonald, M.S.J. Warne, D.A. Heemsbergen, M.B. Barnes, M. Bell & M.J. McLaughlin (2007). Limitations of soil microbial biomass carbon as an indicator of soil pollution in the field. Soil Biology and Biochemistry 39: 2693-2695.
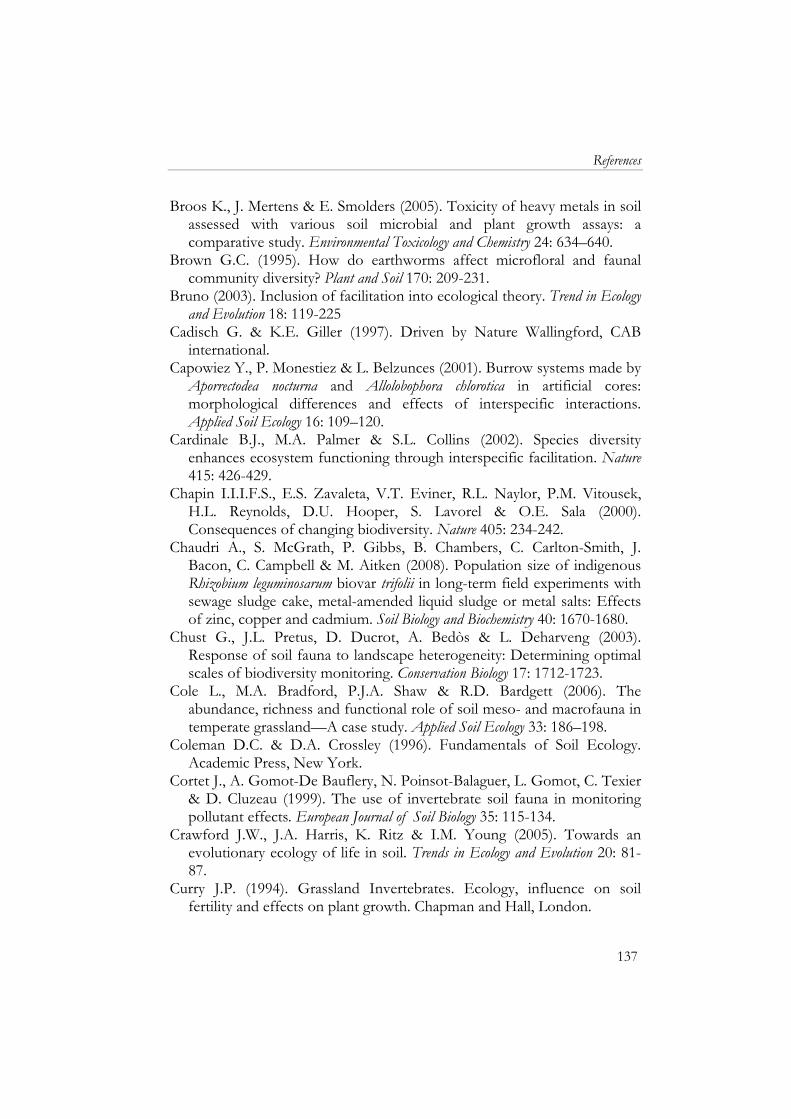
References
137
Broos K., J. Mertens & E. Smolders (2005). Toxicity of heavy metals in soil assessed with various soil microbial and plant growth assays: a comparative study. Environmental Toxicology and Chemistry 24: 634–640.
Brown G.C. (1995). How do earthworms affect microfloral and faunal community diversity? Plant and Soil 170: 209-231.
Bruno (2003). Inclusion of facilitation into ecological theory. Trend in Ecology and Evolution 18: 119-225
Cadisch G. & K.E. Giller (1997). Driven by Nature Wallingford, CAB international.
Capowiez Y., P. Monestiez & L. Belzunces (2001). Burrow systems made by Aporrectodea nocturna and Allolobophora chlorotica in artificial cores: morphological differences and effects of interspecific interactions. Applied Soil Ecology 16: 109–120.
Cardinale B.J., M.A. Palmer & S.L. Collins (2002). Species diversity enhances ecosystem functioning through interspecific facilitation. Nature 415: 426-429.
Chapin I.I.I.F.S., E.S. Zavaleta, V.T. Eviner, R.L. Naylor, P.M. Vitousek, H.L. Reynolds, D.U. Hooper, S. Lavorel & O.E. Sala (2000). Consequences of changing biodiversity. Nature 405: 234-242.
Chaudri A., S. McGrath, P. Gibbs, B. Chambers, C. Carlton-Smith, J. Bacon, C. Campbell & M. Aitken (2008). Population size of indigenous Rhizobium leguminosarum biovar trifolii in long-term field experiments with sewage sludge cake, metal-amended liquid sludge or metal salts: Effects of zinc, copper and cadmium. Soil Biology and Biochemistry 40: 1670-1680.
Chust G., J.L. Pretus, D. Ducrot, A. Bedòs & L. Deharveng (2003). Response of soil fauna to landscape heterogeneity: Determining optimal scales of biodiversity monitoring. Conservation Biology 17: 1712-1723.
Cole L., M.A. Bradford, P.J.A. Shaw & R.D. Bardgett (2006). The abundance, richness and functional role of soil meso- and macrofauna in temperate grassland—A case study. Applied Soil Ecology 33: 186–198.
Coleman D.C. & D.A. Crossley (1996). Fundamentals of Soil Ecology. Academic Press, New York.
Cortet J., A. Gomot-De Bauflery, N. Poinsot-Balaguer, L. Gomot, C. Texier & D. Cluzeau (1999). The use of invertebrate soil fauna in monitoring pollutant effects. European Journal of Soil Biology 35: 115-134.
Crawford J.W., J.A. Harris, K. Ritz & I.M. Young (2005). Towards an evolutionary ecology of life in soil. Trends in Ecology and Evolution 20: 81-87.
Curry J.P. (1994). Grassland Invertebrates. Ecology, influence on soil fertility and effects on plant growth. Chapman and Hall, London.
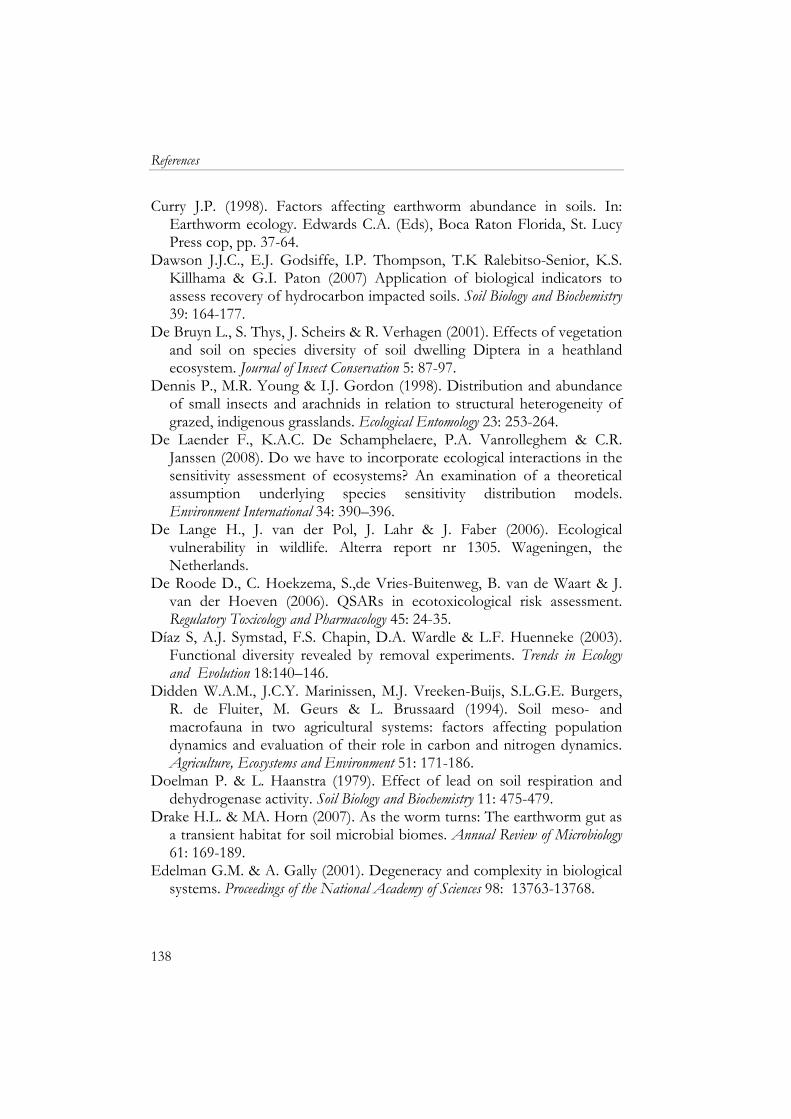
References
138
Curry J.P. (1998). Factors affecting earthworm abundance in soils. In: Earthworm ecology. Edwards C.A. (Eds), Boca Raton Florida, St. Lucy Press cop, pp. 37-64.
Dawson J.J.C., E.J. Godsiffe, I.P. Thompson, T.K Ralebitso-Senior, K.S. Killhama & G.I. Paton (2007) Application of biological indicators to assess recovery of hydrocarbon impacted soils. Soil Biology and Biochemistry 39: 164-177.
De Bruyn L., S. Thys, J. Scheirs & R. Verhagen (2001). Effects of vegetation and soil on species diversity of soil dwelling Diptera in a heathland ecosystem. Journal of Insect Conservation 5: 87-97.
Dennis P., M.R. Young & I.J. Gordon (1998). Distribution and abundance of small insects and arachnids in relation to structural heterogeneity of grazed, indigenous grasslands. Ecological Entomology 23: 253-264.
De Laender F., K.A.C. De Schamphelaere, P.A. Vanrolleghem & C.R. Janssen (2008). Do we have to incorporate ecological interactions in the sensitivity assessment of ecosystems? An examination of a theoretical assumption underlying species sensitivity distribution models. Environment International 34: 390–396.
De Lange H., J. van der Pol, J. Lahr & J. Faber (2006). Ecological vulnerability in wildlife. Alterra report nr 1305. Wageningen, the Netherlands.
De Roode D., C. Hoekzema, S.,de Vries-Buitenweg, B. van de Waart & J. van der Hoeven (2006). QSARs in ecotoxicological risk assessment. Regulatory Toxicology and Pharmacology 45: 24-35.
Díaz S, A.J. Symstad, F.S. Chapin, D.A. Wardle & L.F. Huenneke (2003). Functional diversity revealed by removal experiments. Trends in Ecology and Evolution 18:140–146.
Didden W.A.M., J.C.Y. Marinissen, M.J. Vreeken-Buijs, S.L.G.E. Burgers, R. de Fluiter, M. Geurs & L. Brussaard (1994). Soil meso- and macrofauna in two agricultural systems: factors affecting population dynamics and evaluation of their role in carbon and nitrogen dynamics. Agriculture, Ecosystems and Environment 51: 171-186.
Doelman P. & L. Haanstra (1979). Effect of lead on soil respiration and dehydrogenase activity. Soil Biology and Biochemistry 11: 475-479.
Drake H.L. & MA. Horn (2007). As the worm turns: The earthworm gut as a transient habitat for soil microbial biomes. Annual Review of Microbiology 61: 169-189.
Edelman G.M. & A. Gally (2001). Degeneracy and complexity in biological systems. Proceedings of the National Academy of Sciences 98: 13763-13768.
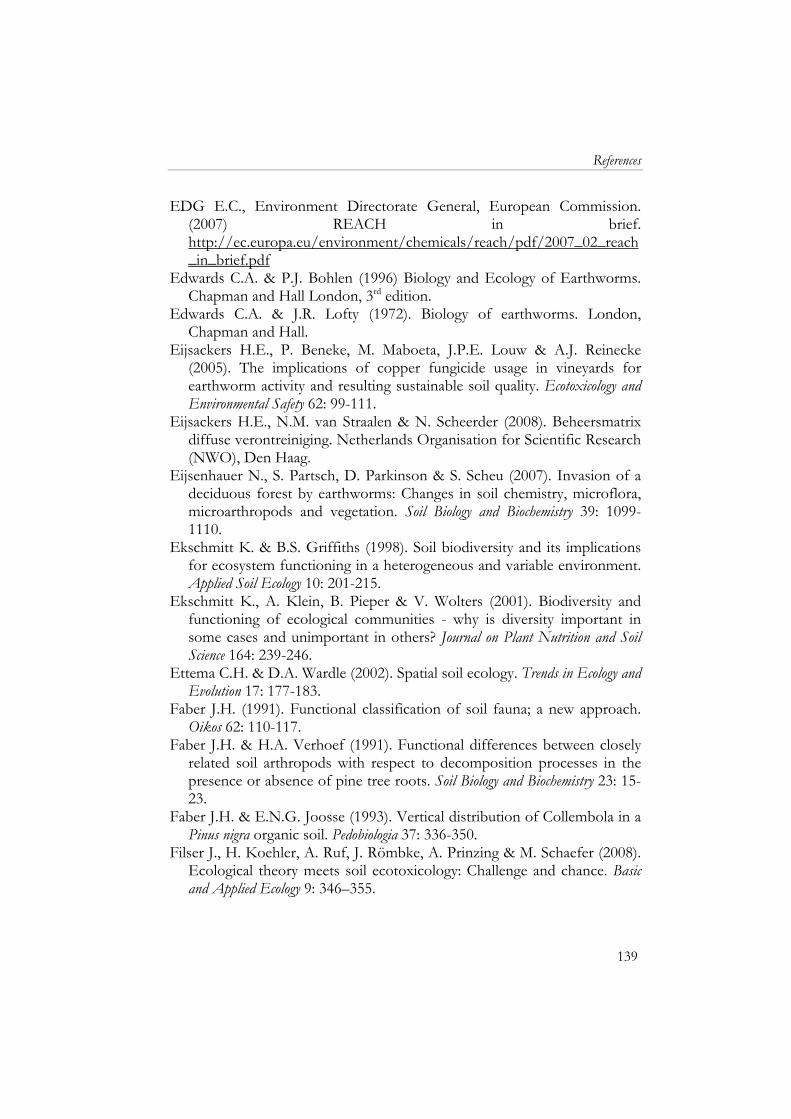
References
139
EDG E.C., Environment Directorate General, European Commission. (2007) REACH in brief. http://ec.europa.eu/environment/chemicals/reach/pdf/2007_02_reach_in_brief.pdf
Edwards C.A. & P.J. Bohlen (1996) Biology and Ecology of Earthworms. Chapman and Hall London, 3rd edition.
Edwards C.A. & J.R. Lofty (1972). Biology of earthworms. London, Chapman and Hall.
Eijsackers H.E., P. Beneke, M. Maboeta, J.P.E. Louw & A.J. Reinecke (2005). The implications of copper fungicide usage in vineyards for earthworm activity and resulting sustainable soil quality. Ecotoxicology and Environmental Safety 62: 99-111.
Eijsackers H.E., N.M. van Straalen & N. Scheerder (2008). Beheersmatrix diffuse verontreiniging. Netherlands Organisation for Scientific Research (NWO), Den Haag.
Eijsenhauer N., S. Partsch, D. Parkinson & S. Scheu (2007). Invasion of a deciduous forest by earthworms: Changes in soil chemistry, microflora, microarthropods and vegetation. Soil Biology and Biochemistry 39: 1099-1110.
Ekschmitt K. & B.S. Griffiths (1998). Soil biodiversity and its implications for ecosystem functioning in a heterogeneous and variable environment. Applied Soil Ecology 10: 201-215.
Ekschmitt K., A. Klein, B. Pieper & V. Wolters (2001). Biodiversity and functioning of ecological communities - why is diversity important in some cases and unimportant in others? Journal on Plant Nutrition and Soil Science 164: 239-246.
Ettema C.H. & D.A. Wardle (2002). Spatial soil ecology. Trends in Ecology and Evolution 17: 177-183.
Faber J.H. (1991). Functional classification of soil fauna; a new approach. Oikos 62: 110-117.
Faber J.H. & H.A. Verhoef (1991). Functional differences between closely related soil arthropods with respect to decomposition processes in the presence or absence of pine tree roots. Soil Biology and Biochemistry 23: 15-23.
Faber J.H. & E.N.G. Joosse (1993). Vertical distribution of Collembola in a Pinus nigra organic soil. Pedobiologia 37: 336-350.
Filser J., H. Koehler, A. Ruf, J. Römbke, A. Prinzing & M. Schaefer (2008). Ecological theory meets soil ecotoxicology: Challenge and chance. Basic and Applied Ecology 9: 346–355.
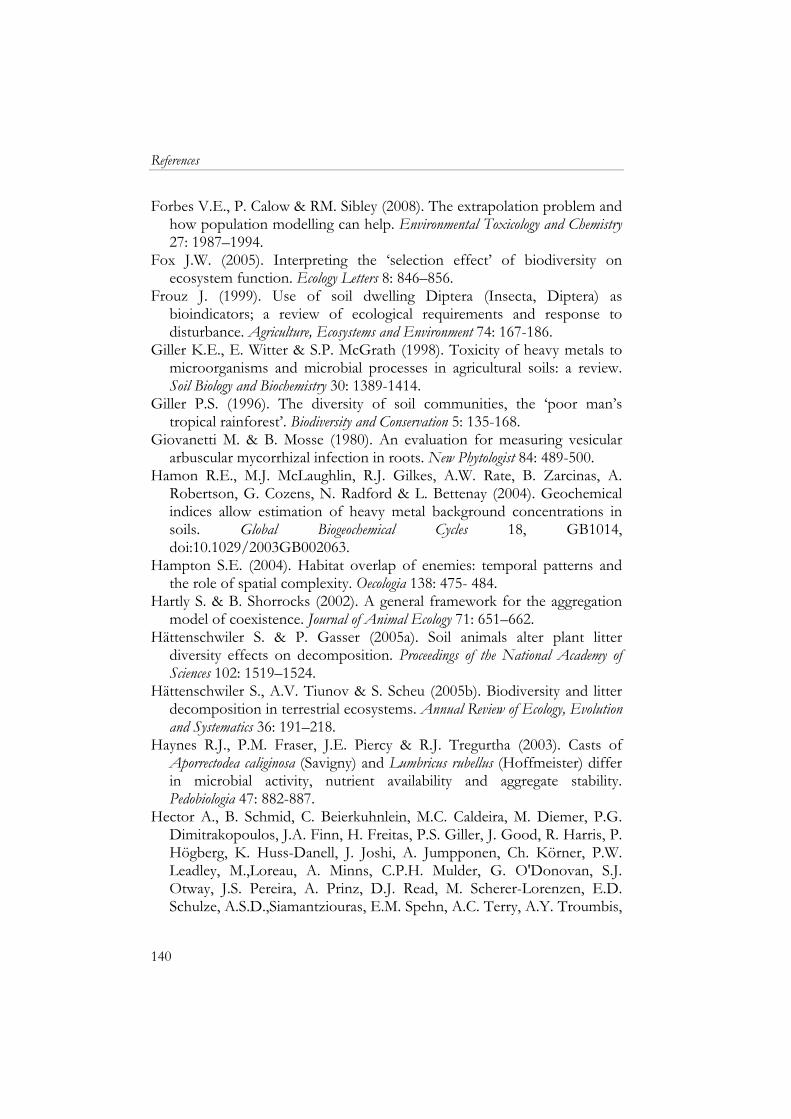
References
140
Forbes V.E., P. Calow & RM. Sibley (2008). The extrapolation problem and how population modelling can help. Environmental Toxicology and Chemistry 27: 1987–1994.
Fox J.W. (2005). Interpreting the ‘selection effect’ of biodiversity on ecosystem function. Ecology Letters 8: 846–856.
Frouz J. (1999). Use of soil dwelling Diptera (Insecta, Diptera) as bioindicators; a review of ecological requirements and response to disturbance. Agriculture, Ecosystems and Environment 74: 167-186.
Giller K.E., E. Witter & S.P. McGrath (1998). Toxicity of heavy metals to microorganisms and microbial processes in agricultural soils: a review. Soil Biology and Biochemistry 30: 1389-1414.
Giller P.S. (1996). The diversity of soil communities, the ‘poor man’s tropical rainforest’. Biodiversity and Conservation 5: 135-168.
Giovanetti M. & B. Mosse (1980). An evaluation for measuring vesicular arbuscular mycorrhizal infection in roots. New Phytologist 84: 489-500.
Hamon R.E., M.J. McLaughlin, R.J. Gilkes, A.W. Rate, B. Zarcinas, A. Robertson, G. Cozens, N. Radford & L. Bettenay (2004). Geochemical indices allow estimation of heavy metal background concentrations in soils. Global Biogeochemical Cycles 18, GB1014, doi:10.1029/2003GB002063.
Hampton S.E. (2004). Habitat overlap of enemies: temporal patterns and the role of spatial complexity. Oecologia 138: 475- 484.
Hartly S. & B. Shorrocks (2002). A general framework for the aggregation model of coexistence. Journal of Animal Ecology 71: 651–662.
Hättenschwiler S. & P. Gasser (2005a). Soil animals alter plant litter diversity effects on decomposition. Proceedings of the National Academy of Sciences 102: 1519–1524.
Hättenschwiler S., A.V. Tiunov & S. Scheu (2005b). Biodiversity and litter decomposition in terrestrial ecosystems. Annual Review of Ecology, Evolution and Systematics 36: 191–218.
Haynes R.J., P.M. Fraser, J.E. Piercy & R.J. Tregurtha (2003). Casts of Aporrectodea caliginosa (Savigny) and Lumbricus rubellus (Hoffmeister) differ in microbial activity, nutrient availability and aggregate stability. Pedobiologia 47: 882-887.
Hector A., B. Schmid, C. Beierkuhnlein, M.C. Caldeira, M. Diemer, P.G. Dimitrakopoulos, J.A. Finn, H. Freitas, P.S. Giller, J. Good, R. Harris, P. Högberg, K. Huss-Danell, J. Joshi, A. Jumpponen, Ch. Körner, P.W. Leadley, M.,Loreau, A. Minns, C.P.H. Mulder, G. O'Donovan, S.J. Otway, J.S. Pereira, A. Prinz, D.J. Read, M. Scherer-Lorenzen, E.D. Schulze, A.S.D.,Siamantziouras, E.M. Spehn, A.C. Terry, A.Y. Troumbis,
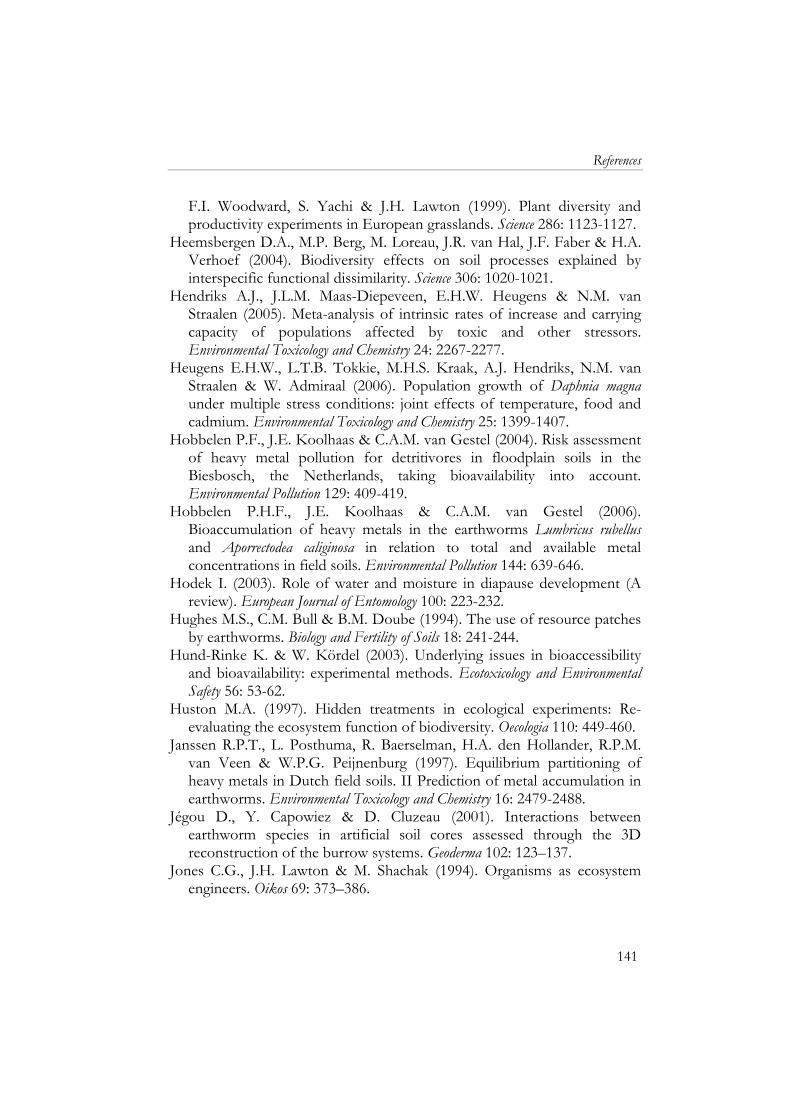
References
141
F.I. Woodward, S. Yachi & J.H. Lawton (1999). Plant diversity and productivity experiments in European grasslands. Science 286: 1123-1127.
Heemsbergen D.A., M.P. Berg, M. Loreau, J.R. van Hal, J.F. Faber & H.A. Verhoef (2004). Biodiversity effects on soil processes explained by interspecific functional dissimilarity. Science 306: 1020-1021.
Hendriks A.J., J.L.M. Maas-Diepeveen, E.H.W. Heugens & N.M. van Straalen (2005). Meta-analysis of intrinsic rates of increase and carrying capacity of populations affected by toxic and other stressors. Environmental Toxicology and Chemistry 24: 2267-2277.
Heugens E.H.W., L.T.B. Tokkie, M.H.S. Kraak, A.J. Hendriks, N.M. van Straalen & W. Admiraal (2006). Population growth of Daphnia magna under multiple stress conditions: joint effects of temperature, food and cadmium. Environmental Toxicology and Chemistry 25: 1399-1407.
Hobbelen P.F., J.E. Koolhaas & C.A.M. van Gestel (2004). Risk assessment of heavy metal pollution for detritivores in floodplain soils in the Biesbosch, the Netherlands, taking bioavailability into account. Environmental Pollution 129: 409-419.
Hobbelen P.H.F., J.E. Koolhaas & C.A.M. van Gestel (2006). Bioaccumulation of heavy metals in the earthworms Lumbricus rubellus and Aporrectodea caliginosa in relation to total and available metal concentrations in field soils. Environmental Pollution 144: 639-646.
Hodek I. (2003). Role of water and moisture in diapause development (A review). European Journal of Entomology 100: 223-232.
Hughes M.S., C.M. Bull & B.M. Doube (1994). The use of resource patches by earthworms. Biology and Fertility of Soils 18: 241-244.
Hund-Rinke K. & W. Kördel (2003). Underlying issues in bioaccessibility and bioavailability: experimental methods. Ecotoxicology and Environmental Safety 56: 53-62.
Huston M.A. (1997). Hidden treatments in ecological experiments: Re-evaluating the ecosystem function of biodiversity. Oecologia 110: 449-460.
Janssen R.P.T., L. Posthuma, R. Baerselman, H.A. den Hollander, R.P.M. van Veen & W.P.G. Peijnenburg (1997). Equilibrium partitioning of heavy metals in Dutch field soils. II Prediction of metal accumulation in earthworms. Environmental Toxicology and Chemistry 16: 2479-2488.
Jégou D., Y. Capowiez & D. Cluzeau (2001). Interactions between earthworm species in artificial soil cores assessed through the 3D reconstruction of the burrow systems. Geoderma 102: 123–137.
Jones C.G., J.H. Lawton & M. Shachak (1994). Organisms as ecosystem engineers. Oikos 69: 373–386.
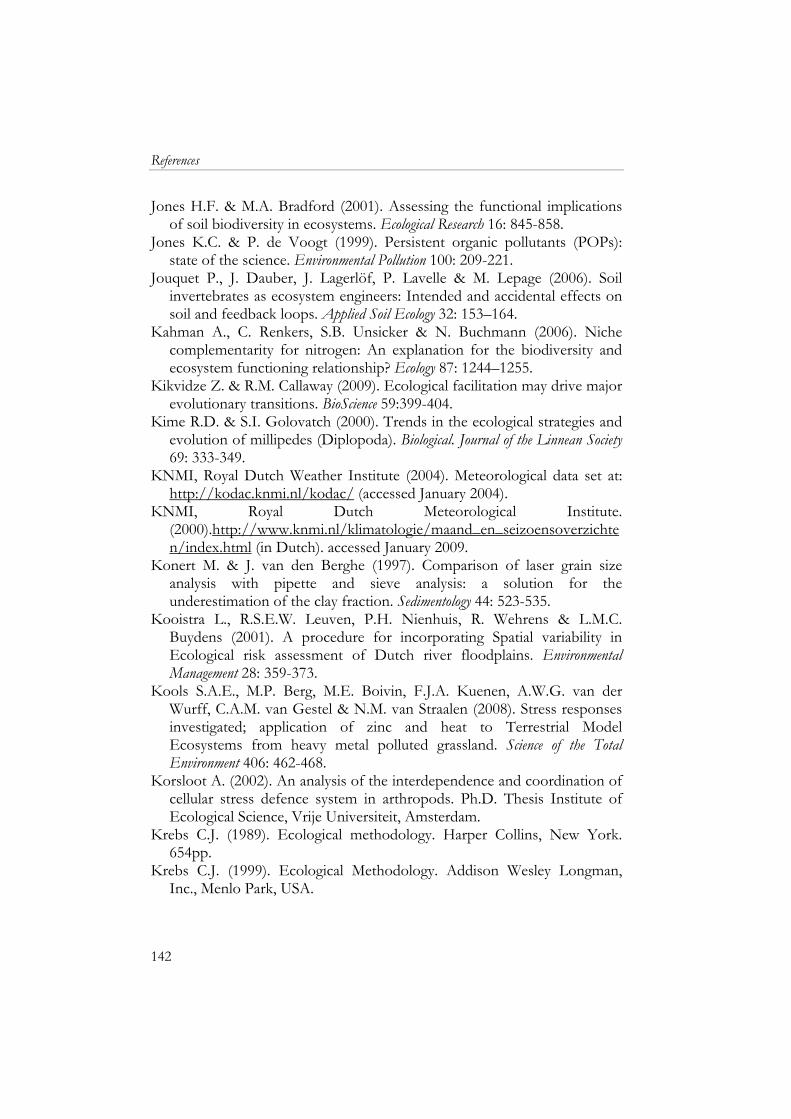
References
142
Jones H.F. & M.A. Bradford (2001). Assessing the functional implications of soil biodiversity in ecosystems. Ecological Research 16: 845-858.
Jones K.C. & P. de Voogt (1999). Persistent organic pollutants (POPs): state of the science. Environmental Pollution 100: 209-221.
Jouquet P., J. Dauber, J. Lagerlöf, P. Lavelle & M. Lepage (2006). Soil invertebrates as ecosystem engineers: Intended and accidental effects on soil and feedback loops. Applied Soil Ecology 32: 153–164.
Kahman A., C. Renkers, S.B. Unsicker & N. Buchmann (2006). Niche complementarity for nitrogen: An explanation for the biodiversity and ecosystem functioning relationship? Ecology 87: 1244–1255.
Kikvidze Z. & R.M. Callaway (2009). Ecological facilitation may drive major evolutionary transitions. BioScience 59:399-404.
Kime R.D. & S.I. Golovatch (2000). Trends in the ecological strategies and evolution of millipedes (Diplopoda). Biological. Journal of the Linnean Society 69: 333-349.
KNMI, Royal Dutch Weather Institute (2004). Meteorological data set at: http://kodac.knmi.nl/kodac/ (accessed January 2004).
KNMI, Royal Dutch Meteorological Institute. (2000).http://www.knmi.nl/klimatologie/maand_en_seizoensoverzichten/index.html (in Dutch). accessed January 2009.
Konert M. & J. van den Berghe (1997). Comparison of laser grain size analysis with pipette and sieve analysis: a solution for the underestimation of the clay fraction. Sedimentology 44: 523-535.
Kooistra L., R.S.E.W. Leuven, P.H. Nienhuis, R. Wehrens & L.M.C. Buydens (2001). A procedure for incorporating Spatial variability in Ecological risk assessment of Dutch river floodplains. Environmental Management 28: 359-373.
Kools S.A.E., M.P. Berg, M.E. Boivin, F.J.A. Kuenen, A.W.G. van der Wurff, C.A.M. van Gestel & N.M. van Straalen (2008). Stress responses investigated; application of zinc and heat to Terrestrial Model Ecosystems from heavy metal polluted grassland. Science of the Total Environment 406: 462-468.
Korsloot A. (2002). An analysis of the interdependence and coordination of cellular stress defence system in arthropods. Ph.D. Thesis Institute of Ecological Science, Vrije Universiteit, Amsterdam.
Krebs C.J. (1989). Ecological methodology. Harper Collins, New York. 654pp.
Krebs C.J. (1999). Ecological Methodology. Addison Wesley Longman, Inc., Menlo Park, USA.
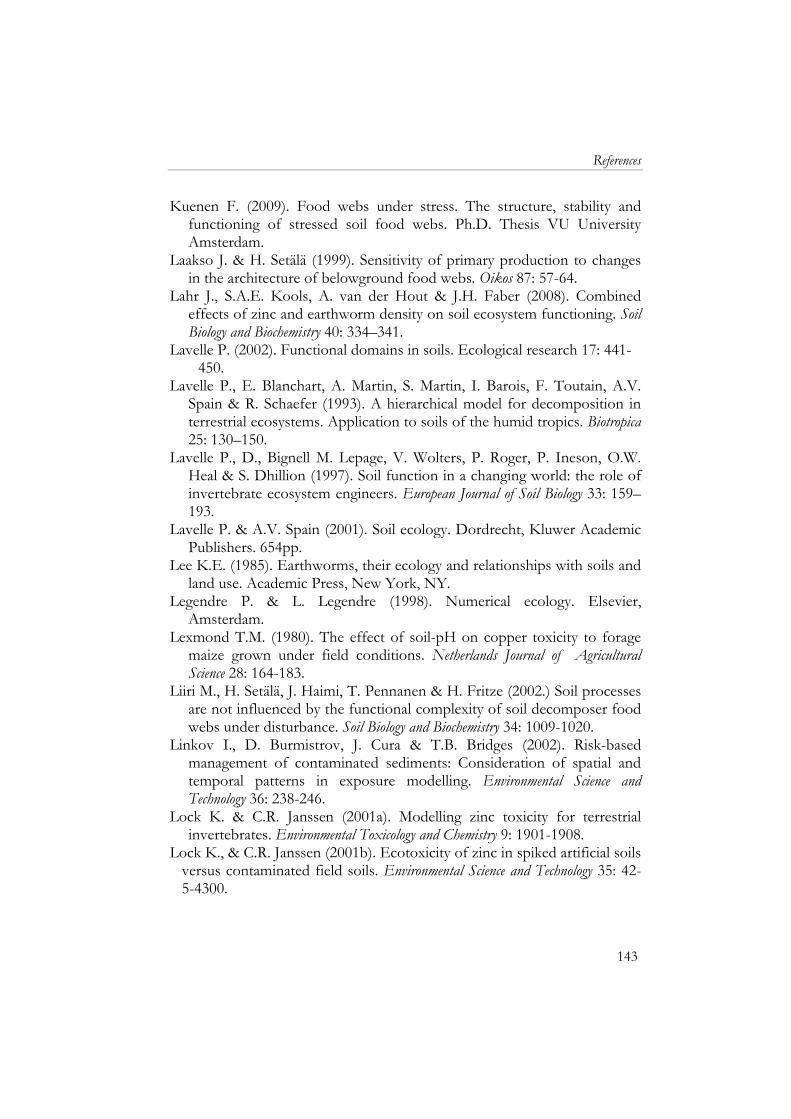
References
143
Kuenen F. (2009). Food webs under stress. The structure, stability and functioning of stressed soil food webs. Ph.D. Thesis VU University Amsterdam.
Laakso J. & H. Setälä (1999). Sensitivity of primary production to changes in the architecture of belowground food webs. Oikos 87: 57-64.
Lahr J., S.A.E. Kools, A. van der Hout & J.H. Faber (2008). Combined effects of zinc and earthworm density on soil ecosystem functioning. Soil Biology and Biochemistry 40: 334–341.
Lavelle P. (2002). Functional domains in soils. Ecological research 17: 441-450.
Lavelle P., E. Blanchart, A. Martin, S. Martin, I. Barois, F. Toutain, A.V. Spain & R. Schaefer (1993). A hierarchical model for decomposition in terrestrial ecosystems. Application to soils of the humid tropics. Biotropica 25: 130–150.
Lavelle P., D., Bignell M. Lepage, V. Wolters, P. Roger, P. Ineson, O.W. Heal & S. Dhillion (1997). Soil function in a changing world: the role of invertebrate ecosystem engineers. European Journal of Soil Biology 33: 159–193.
Lavelle P. & A.V. Spain (2001). Soil ecology. Dordrecht, Kluwer Academic Publishers. 654pp.
Lee K.E. (1985). Earthworms, their ecology and relationships with soils and land use. Academic Press, New York, NY.
Legendre P. & L. Legendre (1998). Numerical ecology. Elsevier, Amsterdam.
Lexmond T.M. (1980). The effect of soil-pH on copper toxicity to forage maize grown under field conditions. Netherlands Journal of Agricultural Science 28: 164-183.
Liiri M., H. Setälä, J. Haimi, T. Pennanen & H. Fritze (2002.) Soil processes are not influenced by the functional complexity of soil decomposer food webs under disturbance. Soil Biology and Biochemistry 34: 1009-1020.
Linkov I., D. Burmistrov, J. Cura & T.B. Bridges (2002). Risk-based management of contaminated sediments: Consideration of spatial and temporal patterns in exposure modelling. Environmental Science and Technology 36: 238-246.
Lock K. & C.R. Janssen (2001a). Modelling zinc toxicity for terrestrial invertebrates. Environmental Toxicology and Chemistry 9: 1901-1908.
Lock K., & C.R. Janssen (2001b). Ecotoxicity of zinc in spiked artificial soils versus contaminated field soils. Environmental Science and Technology 35: 42-5-4300.
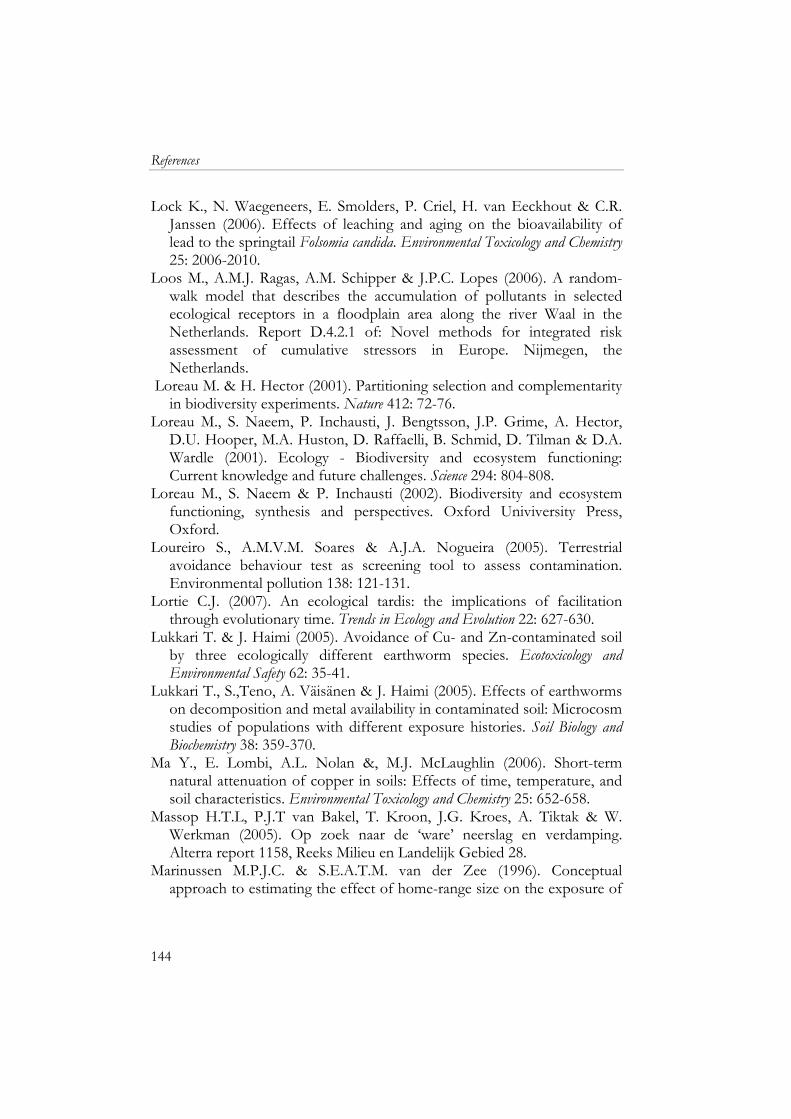
References
144
Lock K., N. Waegeneers, E. Smolders, P. Criel, H. van Eeckhout & C.R. Janssen (2006). Effects of leaching and aging on the bioavailability of lead to the springtail Folsomia candida. Environmental Toxicology and Chemistry 25: 2006-2010.
Loos M., A.M.J. Ragas, A.M. Schipper & J.P.C. Lopes (2006). A random-walk model that describes the accumulation of pollutants in selected ecological receptors in a floodplain area along the river Waal in the Netherlands. Report D.4.2.1 of: Novel methods for integrated risk assessment of cumulative stressors in Europe. Nijmegen, the Netherlands.
Loreau M. & H. Hector (2001). Partitioning selection and complementarity in biodiversity experiments. Nature 412: 72-76.
Loreau M., S. Naeem, P. Inchausti, J. Bengtsson, J.P. Grime, A. Hector, D.U. Hooper, M.A. Huston, D. Raffaelli, B. Schmid, D. Tilman & D.A. Wardle (2001). Ecology - Biodiversity and ecosystem functioning: Current knowledge and future challenges. Science 294: 804-808.
Loreau M., S. Naeem & P. Inchausti (2002). Biodiversity and ecosystem functioning, synthesis and perspectives. Oxford Univiversity Press, Oxford.
Loureiro S., A.M.V.M. Soares & A.J.A. Nogueira (2005). Terrestrial avoidance behaviour test as screening tool to assess contamination. Environmental pollution 138: 121-131.
Lortie C.J. (2007). An ecological tardis: the implications of facilitation through evolutionary time. Trends in Ecology and Evolution 22: 627-630.
Lukkari T. & J. Haimi (2005). Avoidance of Cu- and Zn-contaminated soil by three ecologically different earthworm species. Ecotoxicology and Environmental Safety 62: 35-41.
Lukkari T., S.,Teno, A. Väisänen & J. Haimi (2005). Effects of earthworms on decomposition and metal availability in contaminated soil: Microcosm studies of populations with different exposure histories. Soil Biology and Biochemistry 38: 359-370.
Ma Y., E. Lombi, A.L. Nolan &, M.J. McLaughlin (2006). Short-term natural attenuation of copper in soils: Effects of time, temperature, and soil characteristics. Environmental Toxicology and Chemistry 25: 652-658.
Massop H.T.L, P.J.T van Bakel, T. Kroon, J.G. Kroes, A. Tiktak & W. Werkman (2005). Op zoek naar de ‘ware’ neerslag en verdamping. Alterra report 1158, Reeks Milieu en Landelijk Gebied 28.
Marinussen M.P.J.C. & S.E.A.T.M. van der Zee (1996). Conceptual approach to estimating the effect of home-range size on the exposure of
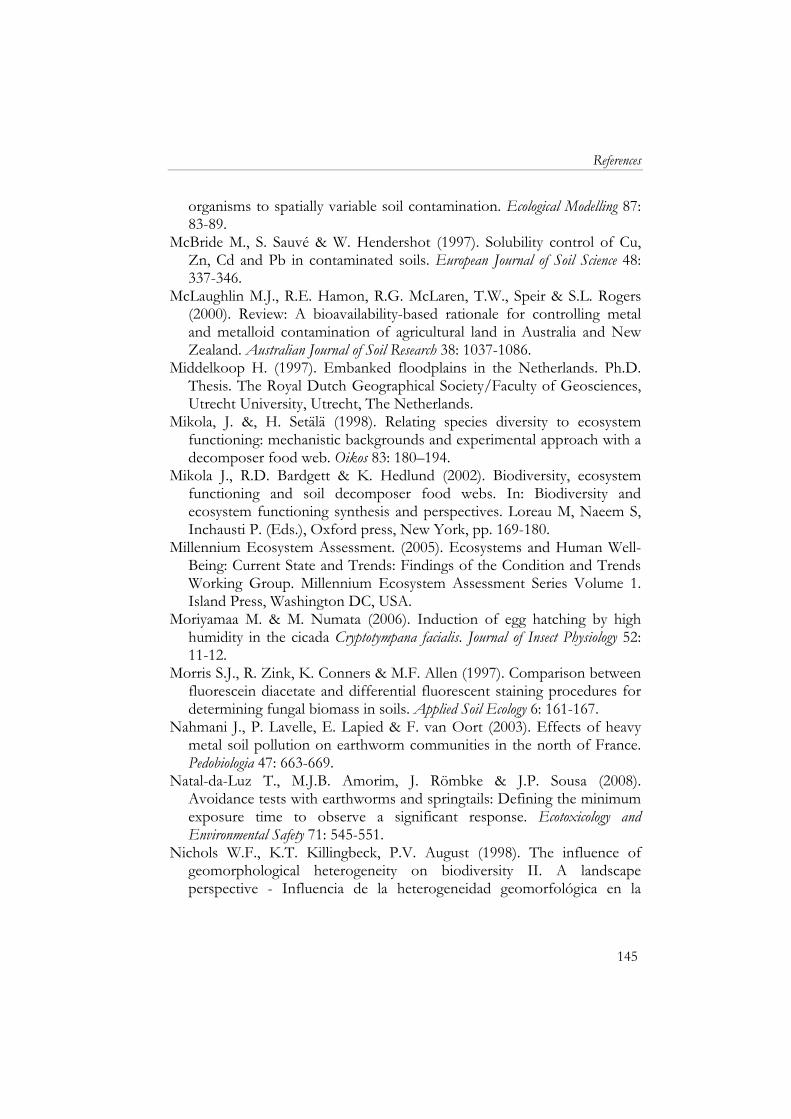
References
145
organisms to spatially variable soil contamination. Ecological Modelling 87: 83-89.
McBride M., S. Sauvé & W. Hendershot (1997). Solubility control of Cu, Zn, Cd and Pb in contaminated soils. European Journal of Soil Science 48: 337-346.
McLaughlin M.J., R.E. Hamon, R.G. McLaren, T.W., Speir & S.L. Rogers (2000). Review: A bioavailability-based rationale for controlling metal and metalloid contamination of agricultural land in Australia and New Zealand. Australian Journal of Soil Research 38: 1037-1086.
Middelkoop H. (1997). Embanked floodplains in the Netherlands. Ph.D. Thesis. The Royal Dutch Geographical Society/Faculty of Geosciences, Utrecht University, Utrecht, The Netherlands.
Mikola, J. &, H. Setälä (1998). Relating species diversity to ecosystem functioning: mechanistic backgrounds and experimental approach with a decomposer food web. Oikos 83: 180–194.
Mikola J., R.D. Bardgett & K. Hedlund (2002). Biodiversity, ecosystem functioning and soil decomposer food webs. In: Biodiversity and ecosystem functioning synthesis and perspectives. Loreau M, Naeem S, Inchausti P. (Eds.), Oxford press, New York, pp. 169-180.
Millennium Ecosystem Assessment. (2005). Ecosystems and Human Well-Being: Current State and Trends: Findings of the Condition and Trends Working Group. Millennium Ecosystem Assessment Series Volume 1. Island Press, Washington DC, USA.
Moriyamaa M. & M. Numata (2006). Induction of egg hatching by high humidity in the cicada Cryptotympana facialis. Journal of Insect Physiology 52: 11-12.
Morris S.J., R. Zink, K. Conners & M.F. Allen (1997). Comparison between fluorescein diacetate and differential fluorescent staining procedures for determining fungal biomass in soils. Applied Soil Ecology 6: 161-167.
Nahmani J., P. Lavelle, E. Lapied & F. van Oort (2003). Effects of heavy metal soil pollution on earthworm communities in the north of France. Pedobiologia 47: 663-669.
Natal-da-Luz T., M.J.B. Amorim, J. Römbke & J.P. Sousa (2008). Avoidance tests with earthworms and springtails: Defining the minimum exposure time to observe a significant response. Ecotoxicology and Environmental Safety 71: 545-551.
Nichols W.F., K.T. Killingbeck, P.V. August (1998). The influence of geomorphological heterogeneity on biodiversity II. A landscape perspective - Influencia de la heterogeneidad geomorfológica en la
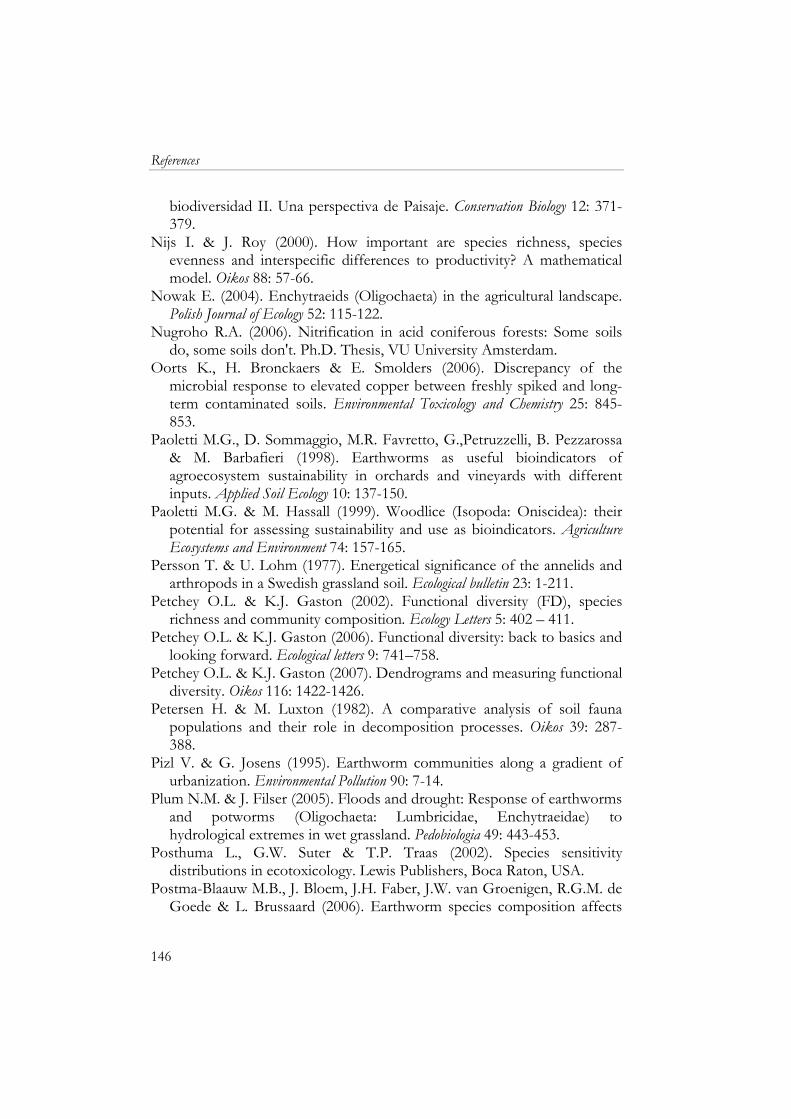
References
146
biodiversidad II. Una perspectiva de Paisaje. Conservation Biology 12: 371-379.
Nijs I. & J. Roy (2000). How important are species richness, species evenness and interspecific differences to productivity? A mathematical model. Oikos 88: 57-66.
Nowak E. (2004). Enchytraeids (Oligochaeta) in the agricultural landscape. Polish Journal of Ecology 52: 115-122.
Nugroho R.A. (2006). Nitrification in acid coniferous forests: Some soils do, some soils don't. Ph.D. Thesis, VU University Amsterdam.
Oorts K., H. Bronckaers & E. Smolders (2006). Discrepancy of the microbial response to elevated copper between freshly spiked and long-term contaminated soils. Environmental Toxicology and Chemistry 25: 845-853.
Paoletti M.G., D. Sommaggio, M.R. Favretto, G.,Petruzzelli, B. Pezzarossa & M. Barbafieri (1998). Earthworms as useful bioindicators of agroecosystem sustainability in orchards and vineyards with different inputs. Applied Soil Ecology 10: 137-150.
Paoletti M.G. & M. Hassall (1999). Woodlice (Isopoda: Oniscidea): their potential for assessing sustainability and use as bioindicators. Agriculture Ecosystems and Environment 74: 157-165.
Persson T. & U. Lohm (1977). Energetical significance of the annelids and arthropods in a Swedish grassland soil. Ecological bulletin 23: 1-211.
Petchey O.L. & K.J. Gaston (2002). Functional diversity (FD), species richness and community composition. Ecology Letters 5: 402 – 411.
Petchey O.L. & K.J. Gaston (2006). Functional diversity: back to basics and looking forward. Ecological letters 9: 741–758.
Petchey O.L. & K.J. Gaston (2007). Dendrograms and measuring functional diversity. Oikos 116: 1422-1426.
Petersen H. & M. Luxton (1982). A comparative analysis of soil fauna populations and their role in decomposition processes. Oikos 39: 287-388.
Pizl V. & G. Josens (1995). Earthworm communities along a gradient of urbanization. Environmental Pollution 90: 7-14.
Plum N.M. & J. Filser (2005). Floods and drought: Response of earthworms and potworms (Oligochaeta: Lumbricidae, Enchytraeidae) to hydrological extremes in wet grassland. Pedobiologia 49: 443-453.
Posthuma L., G.W. Suter & T.P. Traas (2002). Species sensitivity distributions in ecotoxicology. Lewis Publishers, Boca Raton, USA.
Postma-Blaauw M.B., J. Bloem, J.H. Faber, J.W. van Groenigen, R.G.M. de Goede & L. Brussaard (2006). Earthworm species composition affects
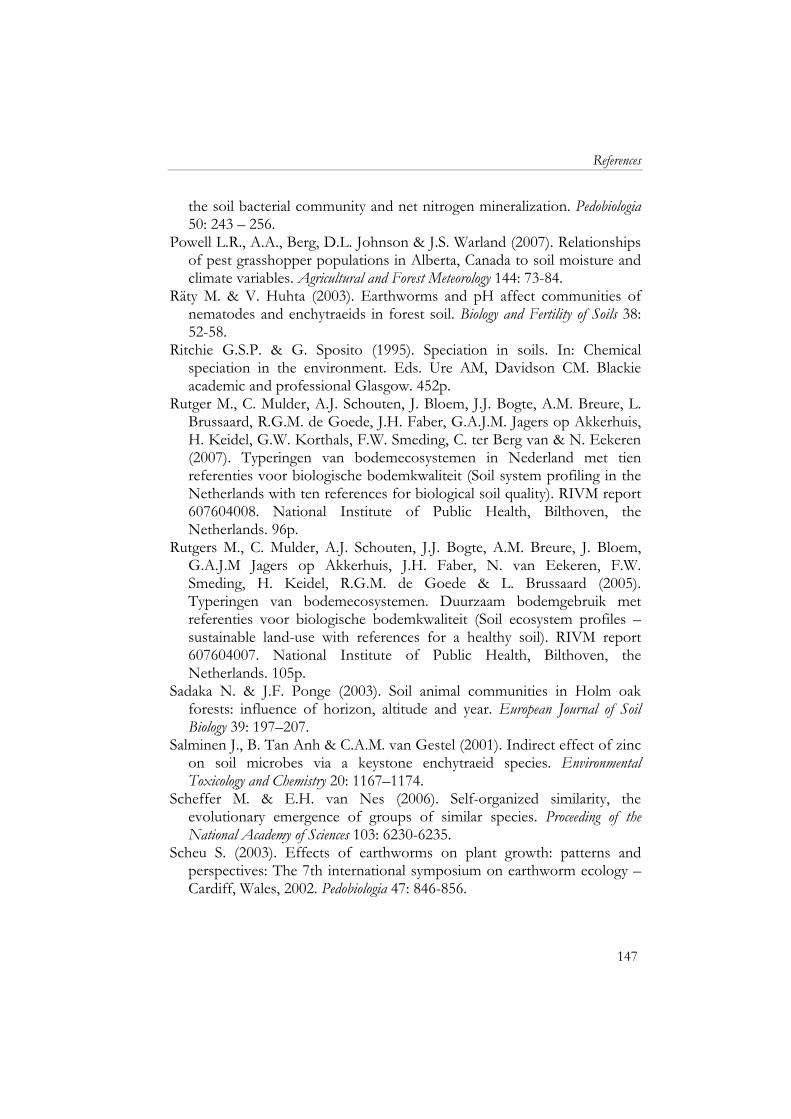
References
147
the soil bacterial community and net nitrogen mineralization. Pedobiologia 50: 243 – 256.
Powell L.R., A.A., Berg, D.L. Johnson & J.S. Warland (2007). Relationships of pest grasshopper populations in Alberta, Canada to soil moisture and climate variables. Agricultural and Forest Meteorology 144: 73-84.
Räty M. & V. Huhta (2003). Earthworms and pH affect communities of nematodes and enchytraeids in forest soil. Biology and Fertility of Soils 38: 52-58.
Ritchie G.S.P. & G. Sposito (1995). Speciation in soils. In: Chemical speciation in the environment. Eds. Ure AM, Davidson CM. Blackie academic and professional Glasgow. 452p.
Rutger M., C. Mulder, A.J. Schouten, J. Bloem, J.J. Bogte, A.M. Breure, L. Brussaard, R.G.M. de Goede, J.H. Faber, G.A.J.M. Jagers op Akkerhuis, H. Keidel, G.W. Korthals, F.W. Smeding, C. ter Berg van & N. Eekeren (2007). Typeringen van bodemecosystemen in Nederland met tien referenties voor biologische bodemkwaliteit (Soil system profiling in the Netherlands with ten references for biological soil quality). RIVM report 607604008. National Institute of Public Health, Bilthoven, the Netherlands. 96p.
Rutgers M., C. Mulder, A.J. Schouten, J.J. Bogte, A.M. Breure, J. Bloem, G.A.J.M Jagers op Akkerhuis, J.H. Faber, N. van Eekeren, F.W. Smeding, H. Keidel, R.G.M. de Goede & L. Brussaard (2005). Typeringen van bodemecosystemen. Duurzaam bodemgebruik met referenties voor biologische bodemkwaliteit (Soil ecosystem profiles – sustainable land-use with references for a healthy soil). RIVM report 607604007. National Institute of Public Health, Bilthoven, the Netherlands. 105p.
Sadaka N. & J.F. Ponge (2003). Soil animal communities in Holm oak forests: influence of horizon, altitude and year. European Journal of Soil Biology 39: 197–207.
Salminen J., B. Tan Anh & C.A.M. van Gestel (2001). Indirect effect of zinc on soil microbes via a keystone enchytraeid species. Environmental Toxicology and Chemistry 20: 1167–1174.
Scheffer M. & E.H. van Nes (2006). Self-organized similarity, the evolutionary emergence of groups of similar species. Proceeding of the National Academy of Sciences 103: 6230-6235.
Scheu S. (2003). Effects of earthworms on plant growth: patterns and perspectives: The 7th international symposium on earthworm ecology – Cardiff, Wales, 2002. Pedobiologia 47: 846-856.
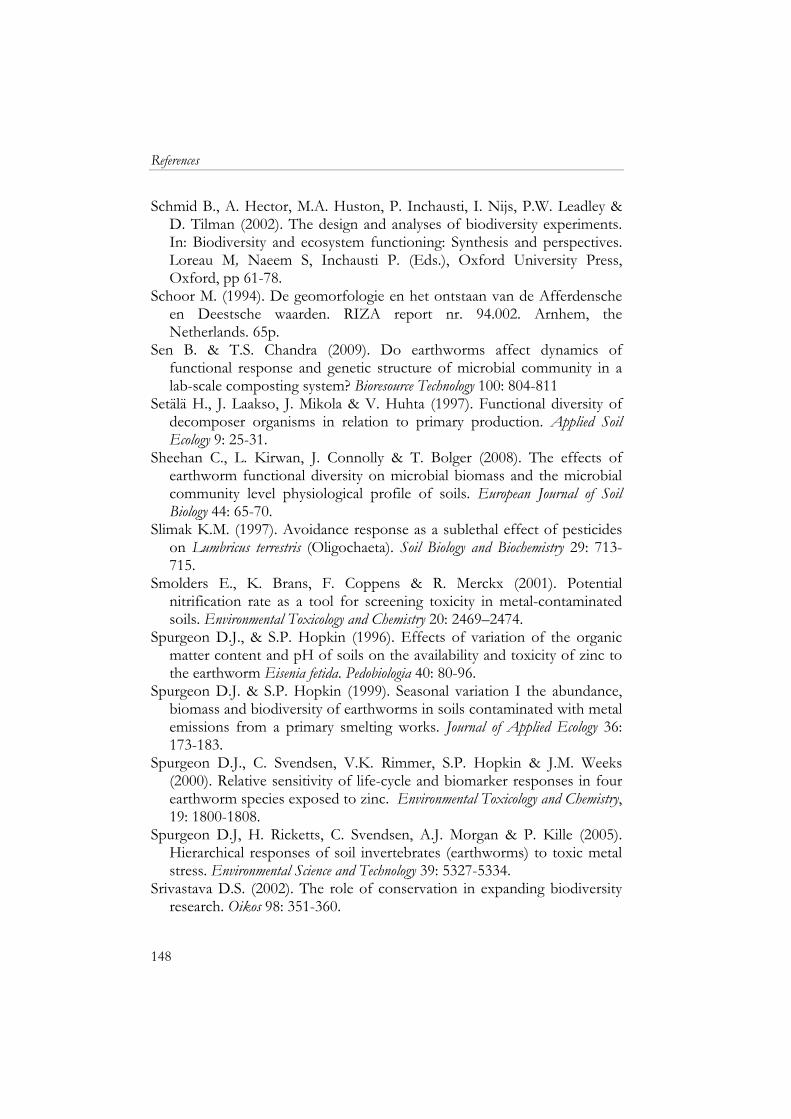
References
148
Schmid B., A. Hector, M.A. Huston, P. Inchausti, I. Nijs, P.W. Leadley & D. Tilman (2002). The design and analyses of biodiversity experiments. In: Biodiversity and ecosystem functioning: Synthesis and perspectives. Loreau M, Naeem S, Inchausti P. (Eds.), Oxford University Press, Oxford, pp 61-78.
Schoor M. (1994). De geomorfologie en het ontstaan van de Afferdensche en Deestsche waarden. RIZA report nr. 94.002. Arnhem, the Netherlands. 65p.
Sen B. & T.S. Chandra (2009). Do earthworms affect dynamics of functional response and genetic structure of microbial community in a lab-scale composting system? Bioresource Technology 100: 804-811
Setälä H., J. Laakso, J. Mikola & V. Huhta (1997). Functional diversity of decomposer organisms in relation to primary production. Applied Soil Ecology 9: 25-31.
Sheehan C., L. Kirwan, J. Connolly & T. Bolger (2008). The effects of earthworm functional diversity on microbial biomass and the microbial community level physiological profile of soils. European Journal of Soil Biology 44: 65-70.
Slimak K.M. (1997). Avoidance response as a sublethal effect of pesticides on Lumbricus terrestris (Oligochaeta). Soil Biology and Biochemistry 29: 713-715.
Smolders E., K. Brans, F. Coppens & R. Merckx (2001). Potential nitrification rate as a tool for screening toxicity in metal-contaminated soils. Environmental Toxicology and Chemistry 20: 2469–2474.
Spurgeon D.J., & S.P. Hopkin (1996). Effects of variation of the organic matter content and pH of soils on the availability and toxicity of zinc to the earthworm Eisenia fetida. Pedobiologia 40: 80-96.
Spurgeon D.J. & S.P. Hopkin (1999). Seasonal variation I the abundance, biomass and biodiversity of earthworms in soils contaminated with metal emissions from a primary smelting works. Journal of Applied Ecology 36: 173-183.
Spurgeon D.J., C. Svendsen, V.K. Rimmer, S.P. Hopkin & J.M. Weeks (2000). Relative sensitivity of life-cycle and biomarker responses in four earthworm species exposed to zinc. Environmental Toxicology and Chemistry, 19: 1800-1808.
Spurgeon D.J, H. Ricketts, C. Svendsen, A.J. Morgan & P. Kille (2005). Hierarchical responses of soil invertebrates (earthworms) to toxic metal stress. Environmental Science and Technology 39: 5327-5334.
Srivastava D.S. (2002). The role of conservation in expanding biodiversity research. Oikos 98: 351-360.
References
149
Stachowicz J.J. (2001). Mutualism, facilitation, and the structure of ecological communities. Bioscience 51: 235-246.
Stevens D.P., M.J. McLaughlin & T. Heinrich (2003). Determining toxicity of lead and zinc runoff in soils: salinity effects on metal partitioning and on phytotoxicity. Environmental Toxicology Chemistry 22: 3017-3024.
Sulkava P. & V. Huhta (1998). Habitat patchiness affects decomposition and faunal diversity: a microcosm experiment on forest floor. Oecologia 116: 390-396.
Swift M.J., O.W. Heal & J.M. Anderson (1979). Decomposition in Terrestrial Ecosystems. Blackwell Scientific Publications, London.
Thonon I. (2006). Deposition of sediment and associated heavy metals on floodplains. Ph.D. Thesis. The Royal Dutch Geographical Society/Faculty of Geosciences, Utrecht University, Utrecht, The Netherlands.
Tilman D., P.B. Reich, J. Knops, D. Wedin, T. Mielke & C. Lehman (2001). Diversity and productivity in a long-term grassland experiment. Science 294: 843-845.
Tilman D., J. Knops, D. Wedin & P. Reich (2002). Plant diversity and composition: effects on productivity and nutrient dynamics of experimental grasslands. In: Biodiversity and Ecosystem Functioning, Synthesis and Perspectives. Loreau M, Naeem S, Inchausti P. (Eds.), Oxford University Press, Oxford, pp. 21–35.
Tobor-Kapłon M.A., J. Bloem, P.F.A.M. Römkens & P.C. de Ruiter (2005). Functional stability of microbial communities in contaminated soils. Oikos 111: 119 – 129.
Townsend C.R., J.L. Harper & M. Begon (2000). Essentials in Ecology. 1st edition. Blackwell Publishing, Oxford, England.
Tylianakis T.M., T.A. Rand, A. Kahmen, A.M. Klein, N. Buchmann, J. Perner & T. Tscharntke (2008). Resource heterogeneity moderates the biodiversity-function relationship in real world ecosystems. Public Library of Science Biology 6: 947-956.
Van Capelleveen H.E., N.M. van Straalen, E. van Wachem & M. van de Berg (1986) Avoidance as a mechanism of tolerance for lead in terrestrial arthropods. In: Proc. 3rd European Congress of Entomology. (H.H.W. Velthuis, ed. NEV Amsterdam, 251-254.
Van der Perk J.C. (1996). Afferdensche en Deestsche Waarden. Inrichtingsplan RIZA nota nr. 96.054, Lelystad.
Van der Wurff A.W.G., S.A.E. Kools, M.E.Y. Boivin, P.J. van den Brink, H.H.M. van Megen, J.A.G. Riksen, A. Doroszuk & J.E. Kammenga
References
150
(2007). Type of disturbance and ecological history determine structural stability. Ecological Applications 17: 190-202.
Van Gestel C.A.M., E.M. Dirven-van Breemen & J.W. Kamerman (1992). Beoordeling van gereinigde grond. IV. Toepassing van bioassays met planten en regenwormen op referentiegronden. National Institute of Public Health and Environmental Protection. RIVM Report 216402004, Bilthoven.
Van Gestel C.A.M., W.C. Ma & Smit C.E. (1991). Development of QSARs in terrestrial ecotoxicology: earthworm toxicity and soil sorption of cholorophenols, chlorobenzenes and dichloroaniline. Science of the Total Environment 109-110: 589-604.
Van Gestel C.A.M., M.C.J. Rademaker & van Straalen N.M. (1995). Capacity controlling parameters and their impact on metal toxicity in soil invertebrates. In: Biogeodynamics of Pollutants in Soils and Sediments. Salomons W, Stigliani WM. (Eds.), Springer. New York.
Van Rhee J.A. (1970). Regenwormen van Nederland. – Wetenschappelijke Mededeling KNNV 84: 1-24.
Van Ruijven J. & F. Berendse (2005). Diversity–productivity relationships: Initial effects, long-term patterns, and underlying mechanisms. Proceedings of the National Academy of Sciences 102: 695-700.
Van Straalen N.M. (2002). Assessment of soil contamination – a functional perspective. Biodegradation 13: 41 – 52.
Van Straalen N.M. (2003). Ecotoxicology becomes stress ecology. Environmental Science and Technology 37: 324A – 330A.
Van Straalen N.M. & C.A.J. Denneman (1989). Ecotoxicological evaluation of soil quality criteria. Ecotoxicology Environmental Safety 18: 241251.
Van Vliet P.C.J., D.C. Coleman & P.F. Hendrix (1997). Population dynamics of Enchytraeidae (Oligochaeta) in different agricultural systems. Biology and Fertility of Soils 25:123–129.
Van Vliet P.CJ, S.E.A.T.M. van der Zee & W.C. Ma (2005). Heavy metal concentrations in soil and earthworms in a floodplain grassland. Environmental Pollution 138: 505-516.
Van Vliet P.C.J., W.A.M. Didden, S.E.A.T.M. van der Zee & W.J.G.M. Peijnenburg (2006). Accumulation of heavy metals by enchytraeids and earthworms in a floodplain. European Journal of Soil Biology 42: S117 - S126.
Van Zwieten L., J. Rust, T. Kingston, G. Merrington & S. Morris (2004). Influence of copper fungicide residues on occurrence of earthworms in avocado orchard soils. Science of the Total Environment 329: 29-41.
References
151
Verhoef H.A. & S. Daan (1995). Oecofysiologie van Dieren. In: Oecologie. Bakker K, Cappenberg ThE, Croin Michielsen N, Freijsen AHJ, Nienhuis PH, Woldendorp JW, Zijlstra JJ. (Eds.) Bohn, Scheltema and Holkema, Utrecht. The Netherlands (in Dutch).
Vijver M.G., J.P. Vink, C.J. Miermans & C.A.M. van Gestel (2007). Metal accumulation in earthworms inhabiting floodplain soils. Environmental Pollution 148: 132-140.
Villiani M.G., L.L. Allee, A. Diaz & P.S. Robbins (1999). Adaptive strategies of edaphic arthropods. Annual Review Entomology 44: 233-256.
VROM, Ministry of Housing & Spatial Planning and Environment. (2000). Circular on target values and intervention values for soil remediation. Reference DBO/1999226863. Ministry of Housing, Spatial Planning and the Environment. Den Haag, the Netherlands. 61p.
VROM, Ministry of Housing & Spatial Planning and Environment. (2003). Beleidsbrief Bodem. Reference BWL/2003 096250, Ministry of Housing, Spatial Planning and the Environment, Den Haag, the Netherlands.
Walker B., A. Kinzig & J. Langridge (1999). Plant attribute diversity, resilience, and ecosystem function: The nature and significance of dominant and minor species. Ecosystems 2: 95-113.
Wardle D.A. (2006). The influence of biotic interactions on soil biodiversity. Ecological letters 9: 870–886.
Wardle D.A., O. Zackrisson, G. Hörnberg & C. Gallet (1997). The influence of island area on ecosystem properties. Science 277: 1296-1299.
Warne M.S.J. & D.W. Hawker (1995). The number of components in a mixture determines whether synergistic and antagonistic or additive toxicity predominate: The funnel hypothesis. Ecotoxicology and Environmental Safety 31: 23-28.
Weiβenburg M. & M. Zimmer (2003). Balancing nutritional requirements for copper in the common woodlouse, Porcellio scaber (Isopoda: Oniscidea). Applied Soil Ecology 23: 1–11.
Whalen J.K. (2004). Spatial and temporal distribution of earthworm patches in corn field, hayfield and forest systems of south-western Quebec, Canada. Applied Soil Ecology 27: 143-151.
Wilcke W. (2000). Polycyclic aromatic hydrocarbons (PAHs) in soils – a review. Journal of Plant Nutrition and Soil Science 163: 229-248.
Wolters V. (2001). Biodiversity of soil animals and its function. European Journal Soil Biology 37: 221-227.
Yeardley R.B., J.M. Lazorchak & L.C. Gast (1996). The potential of an earthworm avoidance test for evaluation of hazardous waste sites. Environmental Chemistry and Toxicology 9: 1532-1537.
References
152
Zaldívar J., L. Håkanson, N. Berrojalbiz, S. Dueri, R. Carafa, D. Marinov, E. Jurado & J. Dachs (2006). The use of models for ecological risk assessment in ecosystems: Threshold point of view. Institute for Environment and Sustainability, EU-JRC. Office for Official Publications of the European Communities, Luxembourg. Report EUR 22269 EN.
Zimmer M, G Kautz & W. Topp (2005). Do woodlice and earthworms interact synergistically in leaf litter decomposition? Functional Ecology 19: 7-16.
Zorn M.I. (2004). The floodplain upside down. Interactions between earthworm bioturbation, flooding and pollution. Ph.D. thesis VU University Amsterdam.
Dankwoord
153
Dankwoord
De laatste loodjes, de laatste woorden. Save the best for last, want ik heb veel mensen te bedanken voor hun hulp tijdens mijn promotietijd. Deze alinea’s zijn er dan ook voor hen die onmisbaar waren. Op de eerst plaats dank ik het gouden trio, mijn (co) promotoren, Jack Faber, Matty Berg en Herman Verhoef. Wat ik het meest in jullie waardeer is het vertrouwen die jullie me gaven tijdens dit onderzoek, ook al duurde het langer dan gepland. Groen als ik was heb ik nooit het gevoel gehad dat jullie mij het onderzoek uit handen namen. Integendeel, jullie coachten en lieten de keuzes aan mij. De meest waardevolle kennis en inzicht kwam van jullie en niet van boeken. Ook wil ik hier mijn voormalig promotor Nico van Straalen bedanken voor zijn begeleiding in de eerste 1,5 jaar van mijn promotie onderzoek. Het ga jullie allen goed! I would like to thank the reading committee, Juliane Filser, Katarina Hedlund, Jan Hendriks, Petra van Vliet en Kees van Gestel for reviewing the thesis. En dan is er natuurlijk Jurgen van Hal, zonder jou was ik omgekomen in chaos. Al het werk dat je me uit handen hebt genomen, je handige ideeën, het gezamenlijk verwerken van de eindeloze monsters en het opsporen van vermiste. De respirometer in de klimaatkamer draait perfect dankzij jouw inzet in het opsporen van kinderziektes. Ook Annemariet van der Hout, Jos Bodt en Wim Dimmers wil ik bedanken voor hun hulp in het lab en het veld. De tips, adviezen en ervaring die jullie met mij hebben gedeeld waren onmisbaar voor het slagen van menig proef. Daarnaast wil ik An Vos, Jaap Bloem en Meint Veninga bedanken voor hun hulp bij de schimmel en bacteriën analyses. En dan de luitjes van de VU. Jullie zagen me niet veel en als ik er was hield ik jullie vaak van het werk. Het werken op twee locaties was niet altijd even makkelijk en praktisch, maar het was goed binnenlopen bij de VU. Diana Slijkerman, je zat in hetzelfde schuitje en je morele ondersteuning was onmisbaar. Het was reuze gezellig bij alle cursussen! Met Mathilde Zorn was het goed samenwerking en discussiëren. Samen hebben we de veldproef dan toch van (beter gezegd: in) de grond gekregen en ik ben blij dat die inzet
Dankwoord
154
niet tevergeefs was. Ook wil ik Rik Zoomer, Rudo Verweij en Kees Verhoef bedanken voor hun praktische hulp en tips bij het opzetten en uitvoeren van diverse proeven. Aangezien dit proefschrift toch iets langer duurde dan gepland zit het lijstje er nog niet op. Ten eerste wil ik Delinah Molen bedanken voor de steun toen het ergst AiO dal voorbijkwam. Daarnaast dank ik Kris Broos voor de mentale steun in Australië onder het motto ´het is maar een thesis hoor’. En die is er dan nu: een thesis. Feestje!! “I'm glad I did it, partly because it was worth it, but mostly because I shall never have to do it again” – Mark Twain
Curriculum vitae
155
Curriculum vitae
Diane Heemsbergen was born in Andijk on September 16, 1976. She studied Biology-Environmental Sciences at the VU University, Amsterdam with two graduate projects: aquatic ecotoxicology at Universitas Soegijoprenata in Indonesia and plant-soil interactions at Ohio State University. After completing her Master’s degree in 2000, she did a PhD study on functional ecotoxicology funded by the stimulation programme on system oriented ecotoxicological research of the Netherlands Organization for Scientific Research. This project investigated the effect of heterogeneity in contamination on soil fauna functioning in river floodplains. From November 2004 till January 2009, she was working as a research scientist on soil ecotoxicology and ecological risk assessment at the scientific research organisation CSIRO, Australia. She was involved in the risk assessment of the reuse of biosolids on agricultural soils and the development of an Australian methodology to derive soil quality guidelines for contaminated soils. Publications Heemsbergen D., Warne M.S.J., McLaughlin M.J., Whatmuff M., Barry G.,
Bell M., Nash D., Pritchard D. & Penney N. (2009). Application of phytotoxicity data to a new Australian soil quality guideline framework for biosolids. Science of the Total Environment 407: 2546-2556.
Heemsbergen D.A., Berg M.P., Loreau M., van Hal J.R., Faber J.H. & Verhoef HA. (2004). Biodiversity effects on soil processes explained by interspecific functional dissimilarity. Science 306: 1019-1020.
Heemsbergen D., Warne M.S.J., McLaughlin M.J., Whatmuff M., Barry G., Bell M., Nash D., Pritchard D. & Penney N. (In press). Bioavailability of zinc and copper in biosolids compared to their soluble salts. Environmental Pollution
Warne M.S.J., Heemsbergen D., Stevens D., McLaughlin M., Cozens G., Whatmuff M., Broos K., Barry G., Bell M., Nash D., Pritchard D. & Penney N. (2008) Modelling the toxicity of Cu and Zn salts to wheat in fourteen soils. Environmental Toxicology and Chemistry 27: 786-792.
Warne M.S.J., Heemsbergen D., McLaughlin M.J., Bell M., Broos K., Whatmuff M., Barry G., Nash D., Pritchard D. &.Penney N. (2008). Models for the field-based toxicity of Cu and Zn salts to wheat in eleven
Curriculum vitae
156
Australian soils and comparison to laboratory-based models. Environmental Pollution 156: 707-714.
Donner E., Broos K., Heemsbergen D., Warne M.S.J., McLaughlin M.J., Hodson M.E. & Nortcliff S. (In press). Biological and chemical assessment of zinc ageing in field soils. Environmental Pollution.
Broos K., Warne M.SJ., Heemsbergen D.A., Stevens D., Barnes M.B., Correll R.L. & McLaughlin M.J. (2007). Soil factors controlling the toxicity of Cu and Zn to microbial processes in Australian soils. Environmental Toxicology and Chemistry 26: 583-590.
Broos K., McDonald L.M., Warne M.S.J., Heemsbergen D.A., Barnes M.B., Bell M., McLaughlin M.J. (2007). Limitations of soil microbial biomass carbon as an indicator of soil pollution in the field. Soil Biology and Biochemistry 39: 2693-2695.
McLaughlin M., Whatmuff M., Warne M., Heemsbergen D., Barry G., Bell M., Nash D., Pritchard D. (2006). A field investigation of solubility and food chain accumulation of biosolid-cadmium across diverse soil types. Environmental Chemistry 3: 428-432.