Embed Size (px)
Citation preview
Methusalem M2dcR2 Advisory board meeting, Ghent, 19/06/2012
Oxidative Coupling of Methane : a heterogeneously catalysed gas phase reactionVaios I. Alexiadis*, Panagiotis N. Kechagiopoulos*, Joris W. Thybaut* and Guy B. Marin*
http://www.lct.UGent.be E-mail : [email protected]
*Laboratory for Chemical TechnologyKrijgslaan 281 (S5), 9000 Ghent, Belgium
Acknowledgement : This work was supported bythe Long Term Structural Methusalem Funding by the Flemish Government.
European Research Institute of Catalysis
� Oxidative Coupling of Methane (OCM) is one of the most attractive methods to utilize natural gas as chemical feedstock for the production of higher hydrocarbons.
� OCM process occurs through a mechanism in which catalytic reactions interact with gas phase reactions.
� CH3● radicals, produced on the catalyst surface, either couple in the gas phase to produce the desired C2
hydrocarbons or are oxidized forming undesired carbon oxides.
� CH3● radicals are highly reactive. In order to account for the irreducible mass transport limitations, an one-dimensional heterogeneous reactor model is employed (coordinate z), which distinguishes between a solid-intraparticle phase (coordinate ξ) and a fluid-interstitial phase (coordinate r).
7.00
8.00
9.00
10.00
11.00
12.00
13.00
14.00
15.00
16.00
7.00 9.00 11.00 13.00 15.00 17.00
SIM_CH4
EXP_CH4
0.00
0.05
0.10
0.15
0.20
0.25
0.30
0.35
0.40
0.45
0.50
0.00 0.05 0.10 0.15 0.20 0.25 0.30 0.35
SIM_C2H6
EXP_C2H6
0.00
0.10
0.20
0.30
0.40
0.50
0.60
0.70
0.00 0.10 0.20 0.30 0.40 0.50 0.60 0.70
SIM_C2
EXP_C2
0.20
0.40
0.60
0.80
1.00
1.20
1.40
0.20 0.40 0.60 0.80 1.00 1.20 1.40
SIM_CO
EXP_CO
0.00
0.50
1.00
1.50
2.00
2.50
3.00
0.00 0.50 1.00 1.50 2.00 2.50 3.00
SIM_CO2
EXP_CO2
Figure 1. Parity diagrams for CH4, C2H6, C2H4, CO, CO2 and lumped C2 products. The depicted results are in molar fractions, %. Experimental results derived from RUB.
0.00
0.05
0.10
0.15
0.20
0.25
0.30
0.35
0.40
0.45
0.00 0.05 0.10 0.15 0.20 0.25 0.30 0.35
SIM_C2H4
EXP_C2H4
Figure 2. Reactants conversion and products selectivity vs. space time at different temperatures. Experimental results derived from RUB.Experimental conditions : P =190 KPa, CH4/O2, feed = 4 and 80 % N2 dilution.
C1. ∗⇔∗+ OO 222
C2. ∗+•⇔∗+ OHCHOCH 34
C3. ∗+•⇔∗+ OHHCOHC 3242
C4. ∗+•⇔∗+ OHHCOHC 5262
C5. ∗+∗⇔∗ OOHOH 22
C6. ∗+⇔∗ OHOH 22
C7. ∗⇔∗+• OCHOCH 33
C8. ∗+∗⇔∗+∗ OHOCHOOCH 23
C9. ∗+∗⇔∗+∗ OHCHOOOCH 2
C10. ∗+∗⇔∗+∗ OHCOOCHO
C11. ∗+∗⇔∗+∗ 2COOCO
C12. ∗⇔∗+ COCO
C13. ∗⇔∗+ 22 COCO
C14. ∗⇔∗+ OHCOHC 4242
C15. ∗+∗⇔∗+∗ OHOHCOOHC 3242
C16. ∗+∗⇔∗+∗ CHOOCHOOHC 232
C17. ∗+⇔∗+• OHHCOHC 4252
C17. ∗+⇔∗+• OHOCHOOCH 23
C19. ∗+•⇔∗+ OHCHOOOCH 2
C20. ∗+⇔∗+• OHCOOCHO
C21. ∗+•⇔∗+ OHHOH 2
C22. ∗+•⇔∗+ OHHOOOH 222
C23. ∗+⇔∗+• OHOOHO 22
C24. ∗+•⇔+∗• OOHHO2
C25. ∗+•⇔∗+ OHOHOOH 2
C26. ∗+•⇔∗+• OHOOOH
Pressure (kPa) 190.0
Temperature (K) 980.0 – 1180.0
CH4/O2, feed (molCH4 molO2-1) 2.0 – 4.0
W/Ftot (mg s nml-1) 2.0 – 11.0
Ftot (nml s-1) 7.0
N2 dilution (%) 80.0 – 90.0
Radius of catalyst pellet (m) 1.0 10-4
Length of catalyst bed (m) 1.5 10-2
Catalyst 1%Sr/La2O3
Surface area (m2 kg-1) 2000.0
Porosity (mg3 mc
-3) 0.27
Density (kg m-3) 2300.0
SiC dilution weight (kg) 1.0 10-3
� The microkinetic model contains 39 reversible gas phase reactions (adopted from Chen et al.) and 26 reversible catalytic reactions; 24 gas phase and 11 surface species are involved.
� Gas phase reactions couple with the catalytic reactions via the reactor model equations.
� 25 catalyst descriptors are incorporated in the microkinetic model.
Catalytic reactions networkSimulated reaction conditions and catalyst
properties derived from RUB experiments
0
0,1
0,2
0,3
0,4
0,5
0,6
2 3 4 5 6 7 8
Co
nve
rsio
n, S
ele
ctiv
ity
CH4 / O2, feed
W / Ftot = 2 mg s nml-1
O2 conversion
CH4 conversion
C2H4 selectivity
C2H6 selectivity
C2 selectivity
C2 yield
0
0,2
0,4
0,6
0,8
2 3 4 5 6 7 8
Co
nve
rsio
n, S
ele
ctiv
ity
CH4 / O2 , feed
W / Ftot= 5.5 mg s nml-1
0
0,2
0,4
0,6
0,8
1
2 3 4 5 6 7 8
Co
nve
rsio
n, S
ele
ctiv
ity
CH4 / O2 , feed
W / Ftot = 9 mg s nml-1
Figure 3. Reactants conversion, C2 selectivity and yield vs. CH4 / O2, feed at different space times. Operating conditions : P =190 KPa, T = 1065 K and 80 % N2 dilution.
80
106
120
136
144
180
0
2
4
6
8
10
4849
5161
0-2 2-4 4-6C2 Yield (%)
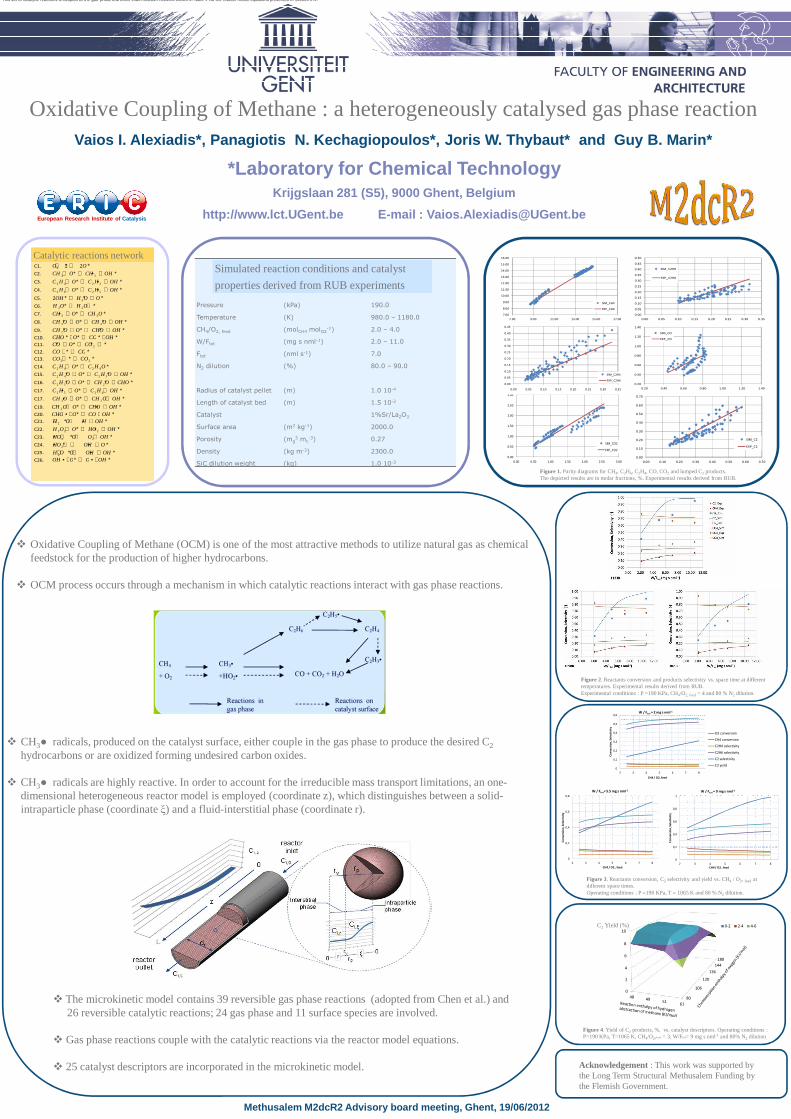
Figure 4. Yield of C2 products, %, vs. catalyst descriptors. Operating conditions : P=190 KPa, T=1065 K, CH4/O2,feed = 3, W/Ftot= 9 mg s nml-1 and 80% N2 dilution.
This set of catalytic reactions is coupled to the gas-phase branched-chain reaction network shown in Table 1 via the reactor model equations presented in Section 2.1. This set of catalytic reactions is coupled to the gas-phase branched-chain reaction network shown in Table 1 via the reactor model equations presented in Section 2.1.